
Synchrotron-Based Structural Analysis of Nanosized Gd2(Ti1−xZrx)2O7 for Radioactive Waste Management
 , , , , ,
  and
and
Abstract

1. Introduction
2. Materials and Methods
2.1. Complex Metal Oxide Synthesis
2.2. In-House Characterization
2.3. HR-XRPD and PDF Analysis
2.4. EXAFS Analysis
3. Results and Discussion
3.1. In-House Characterization of Complex Metal Oxides
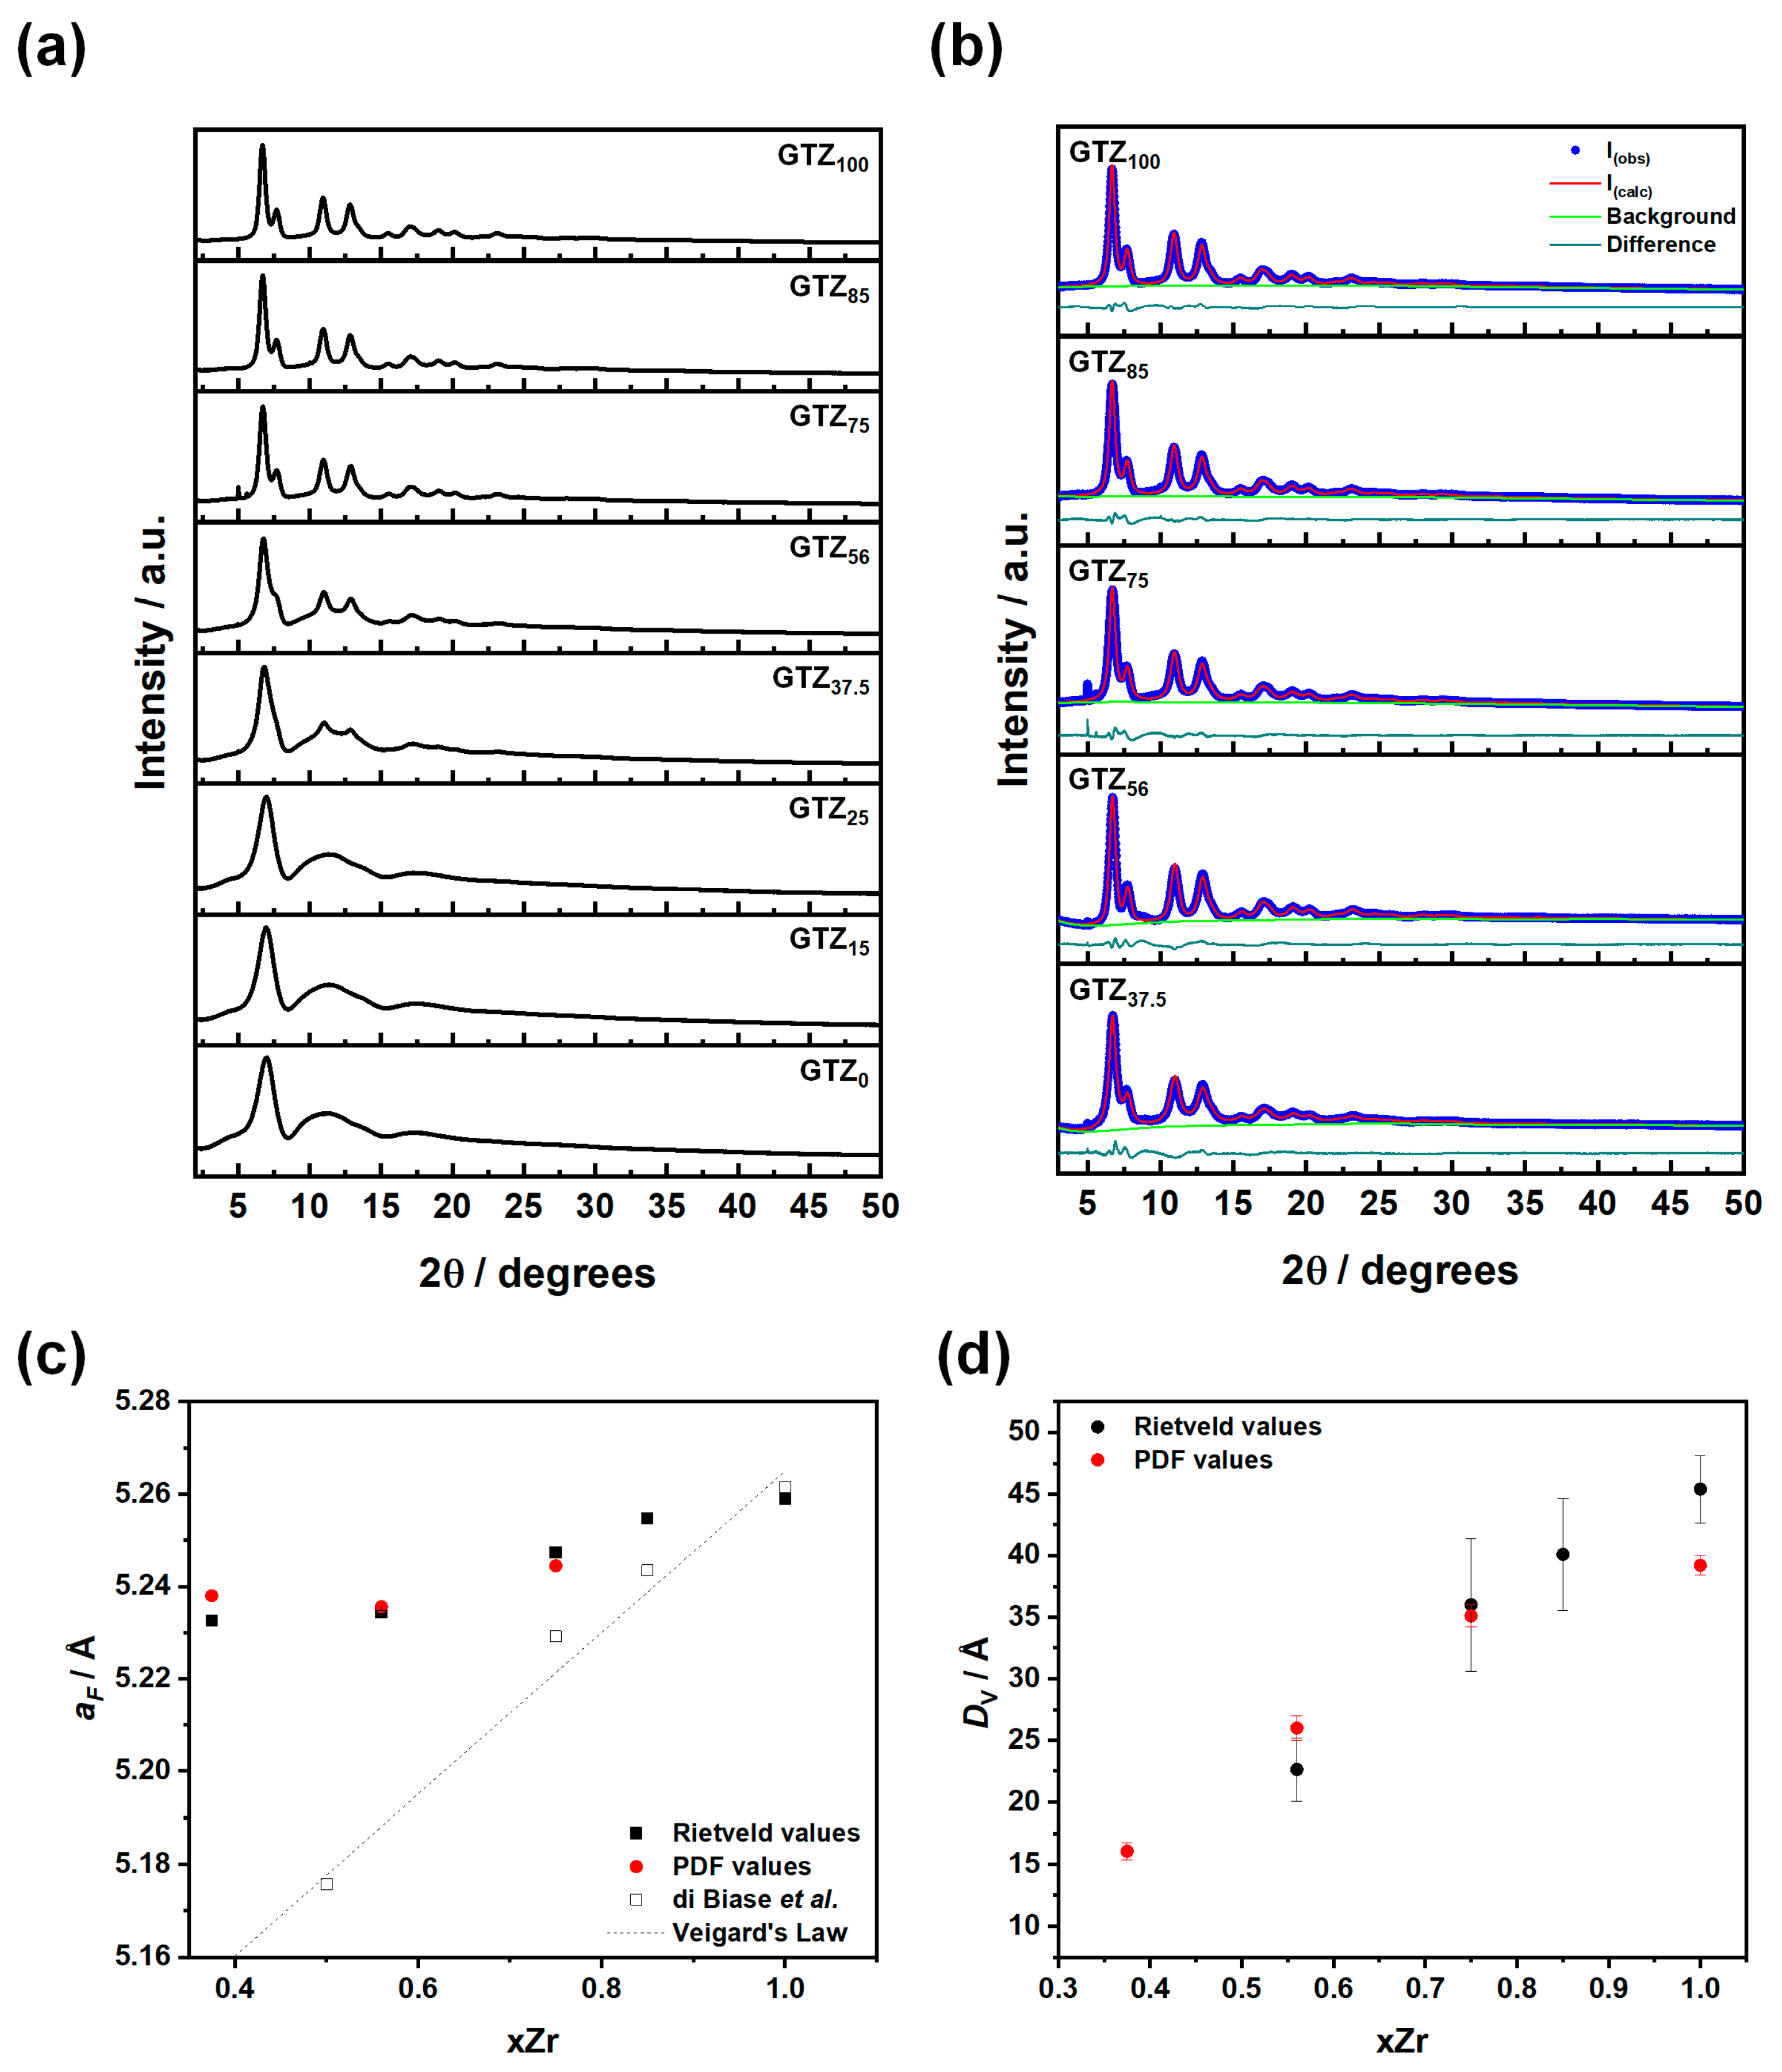
3.2. Average Structure
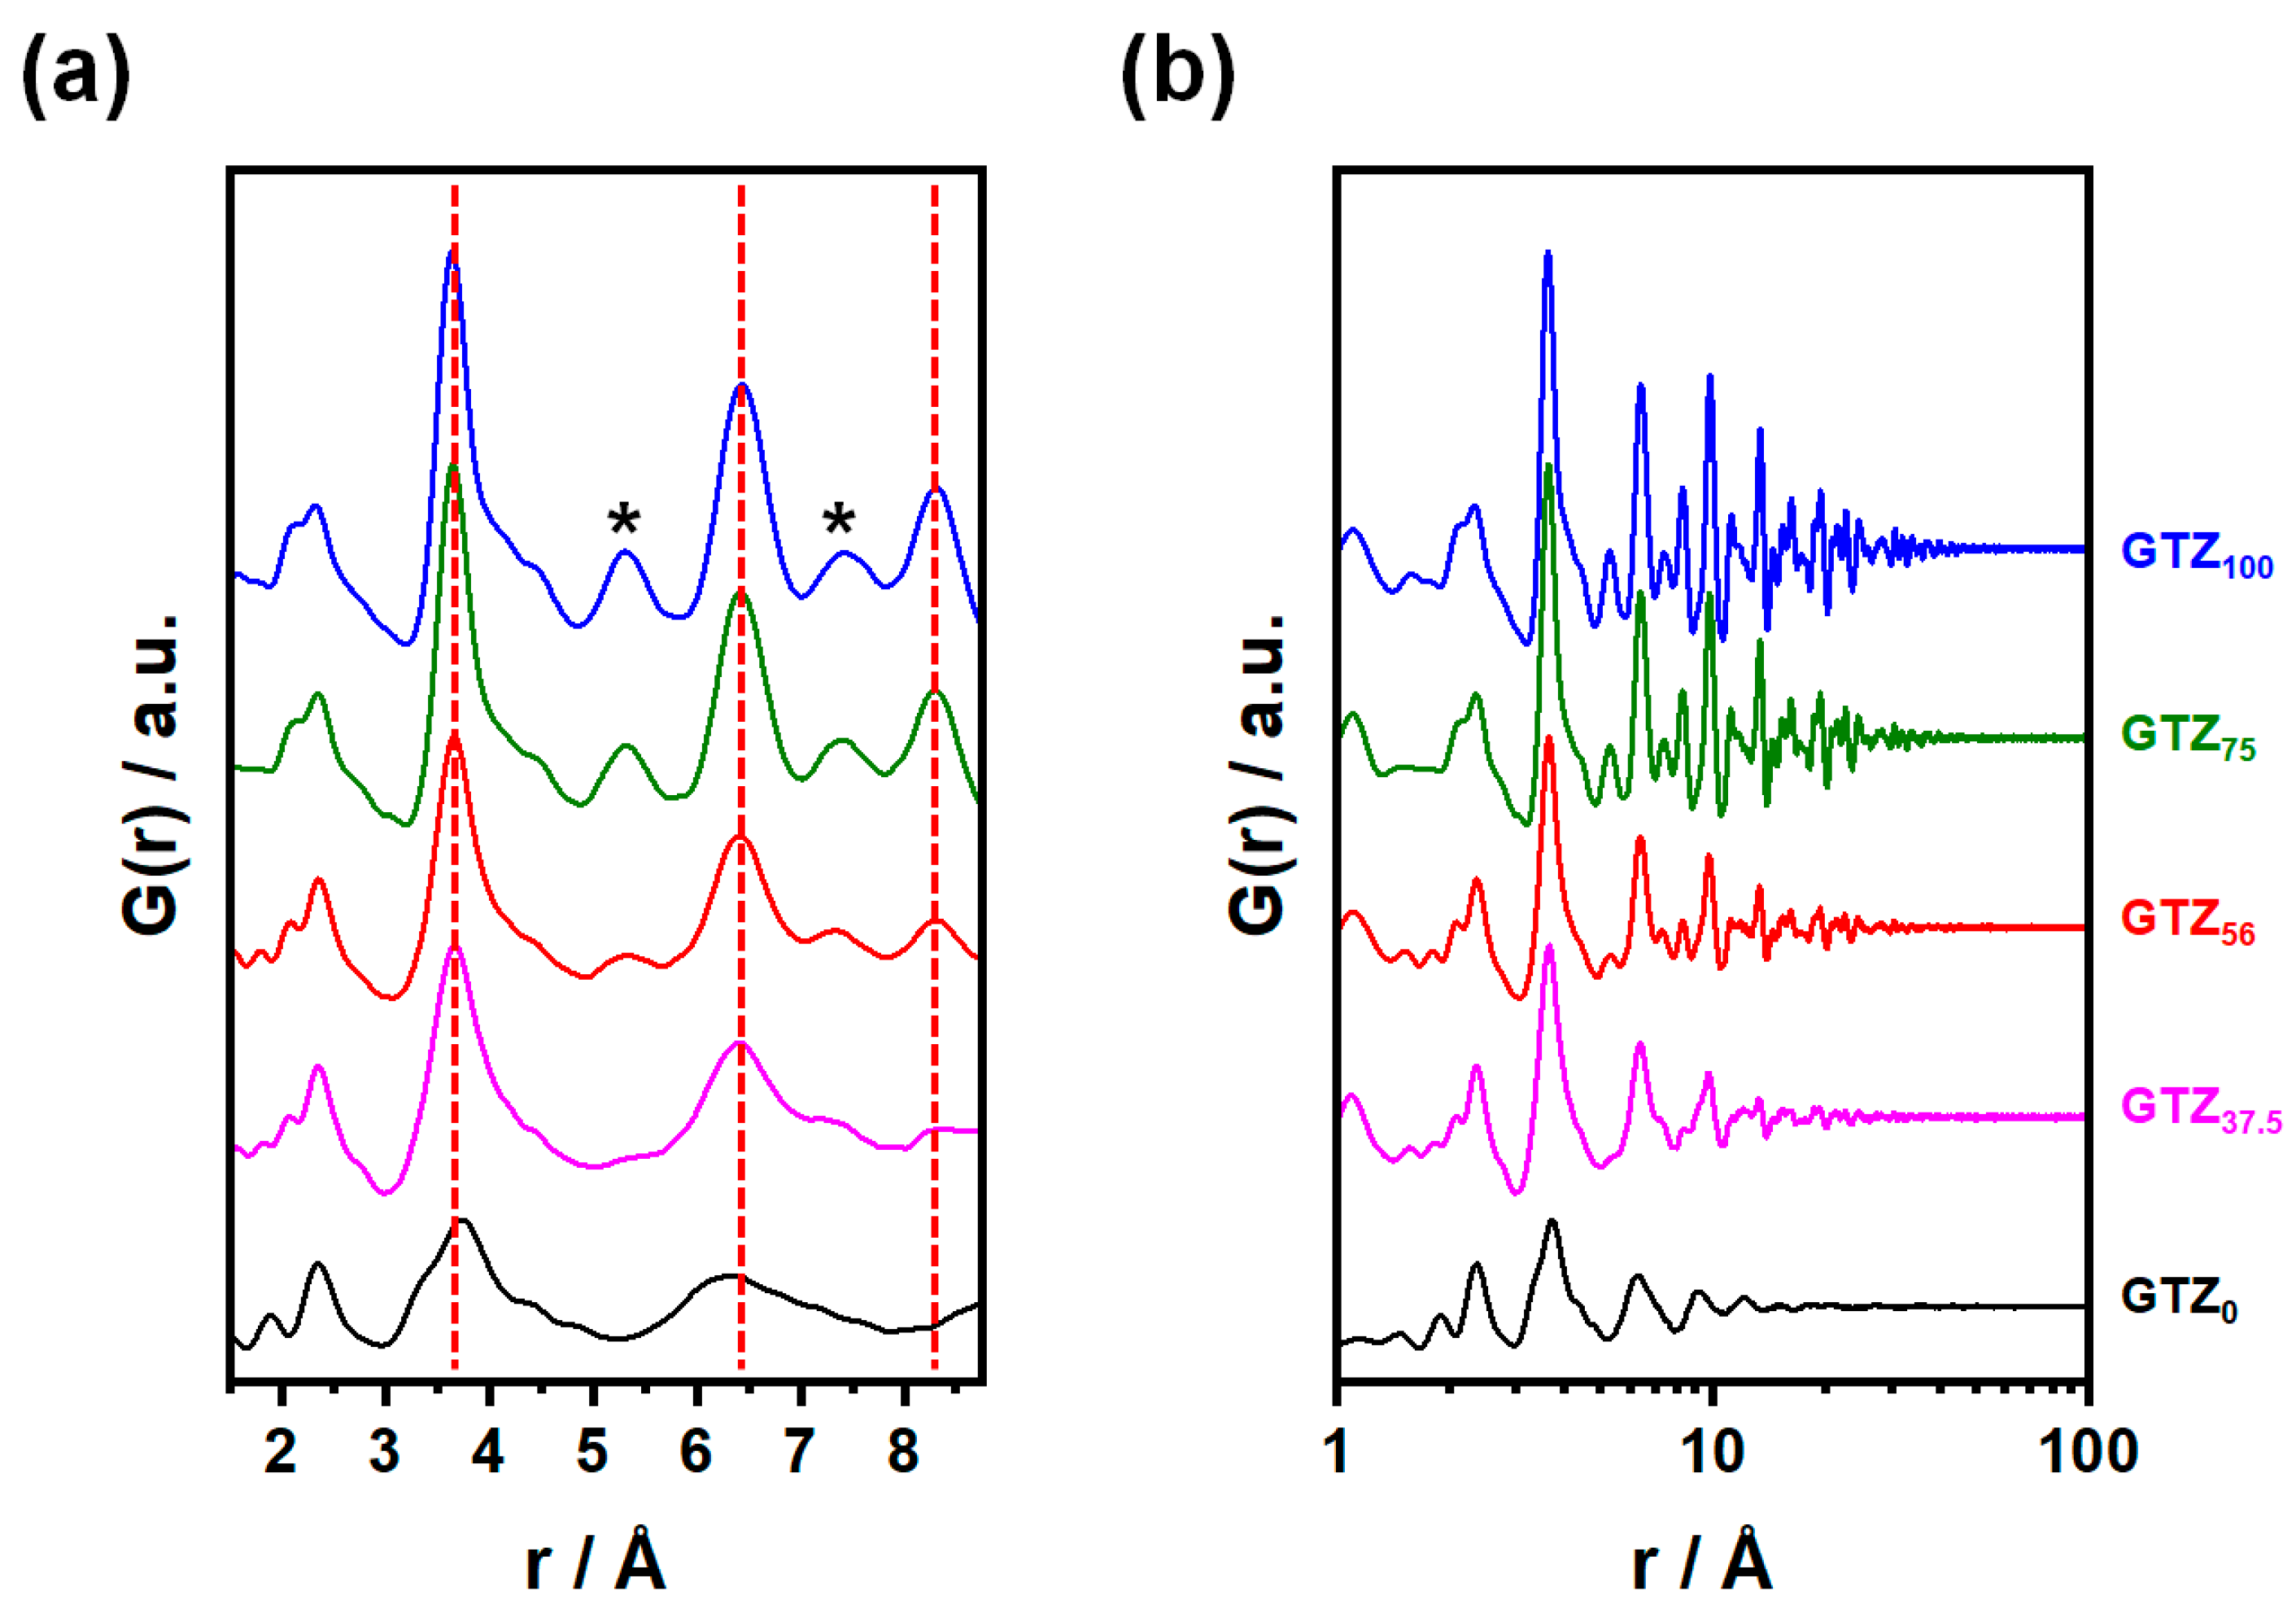
3.3. Local Structure
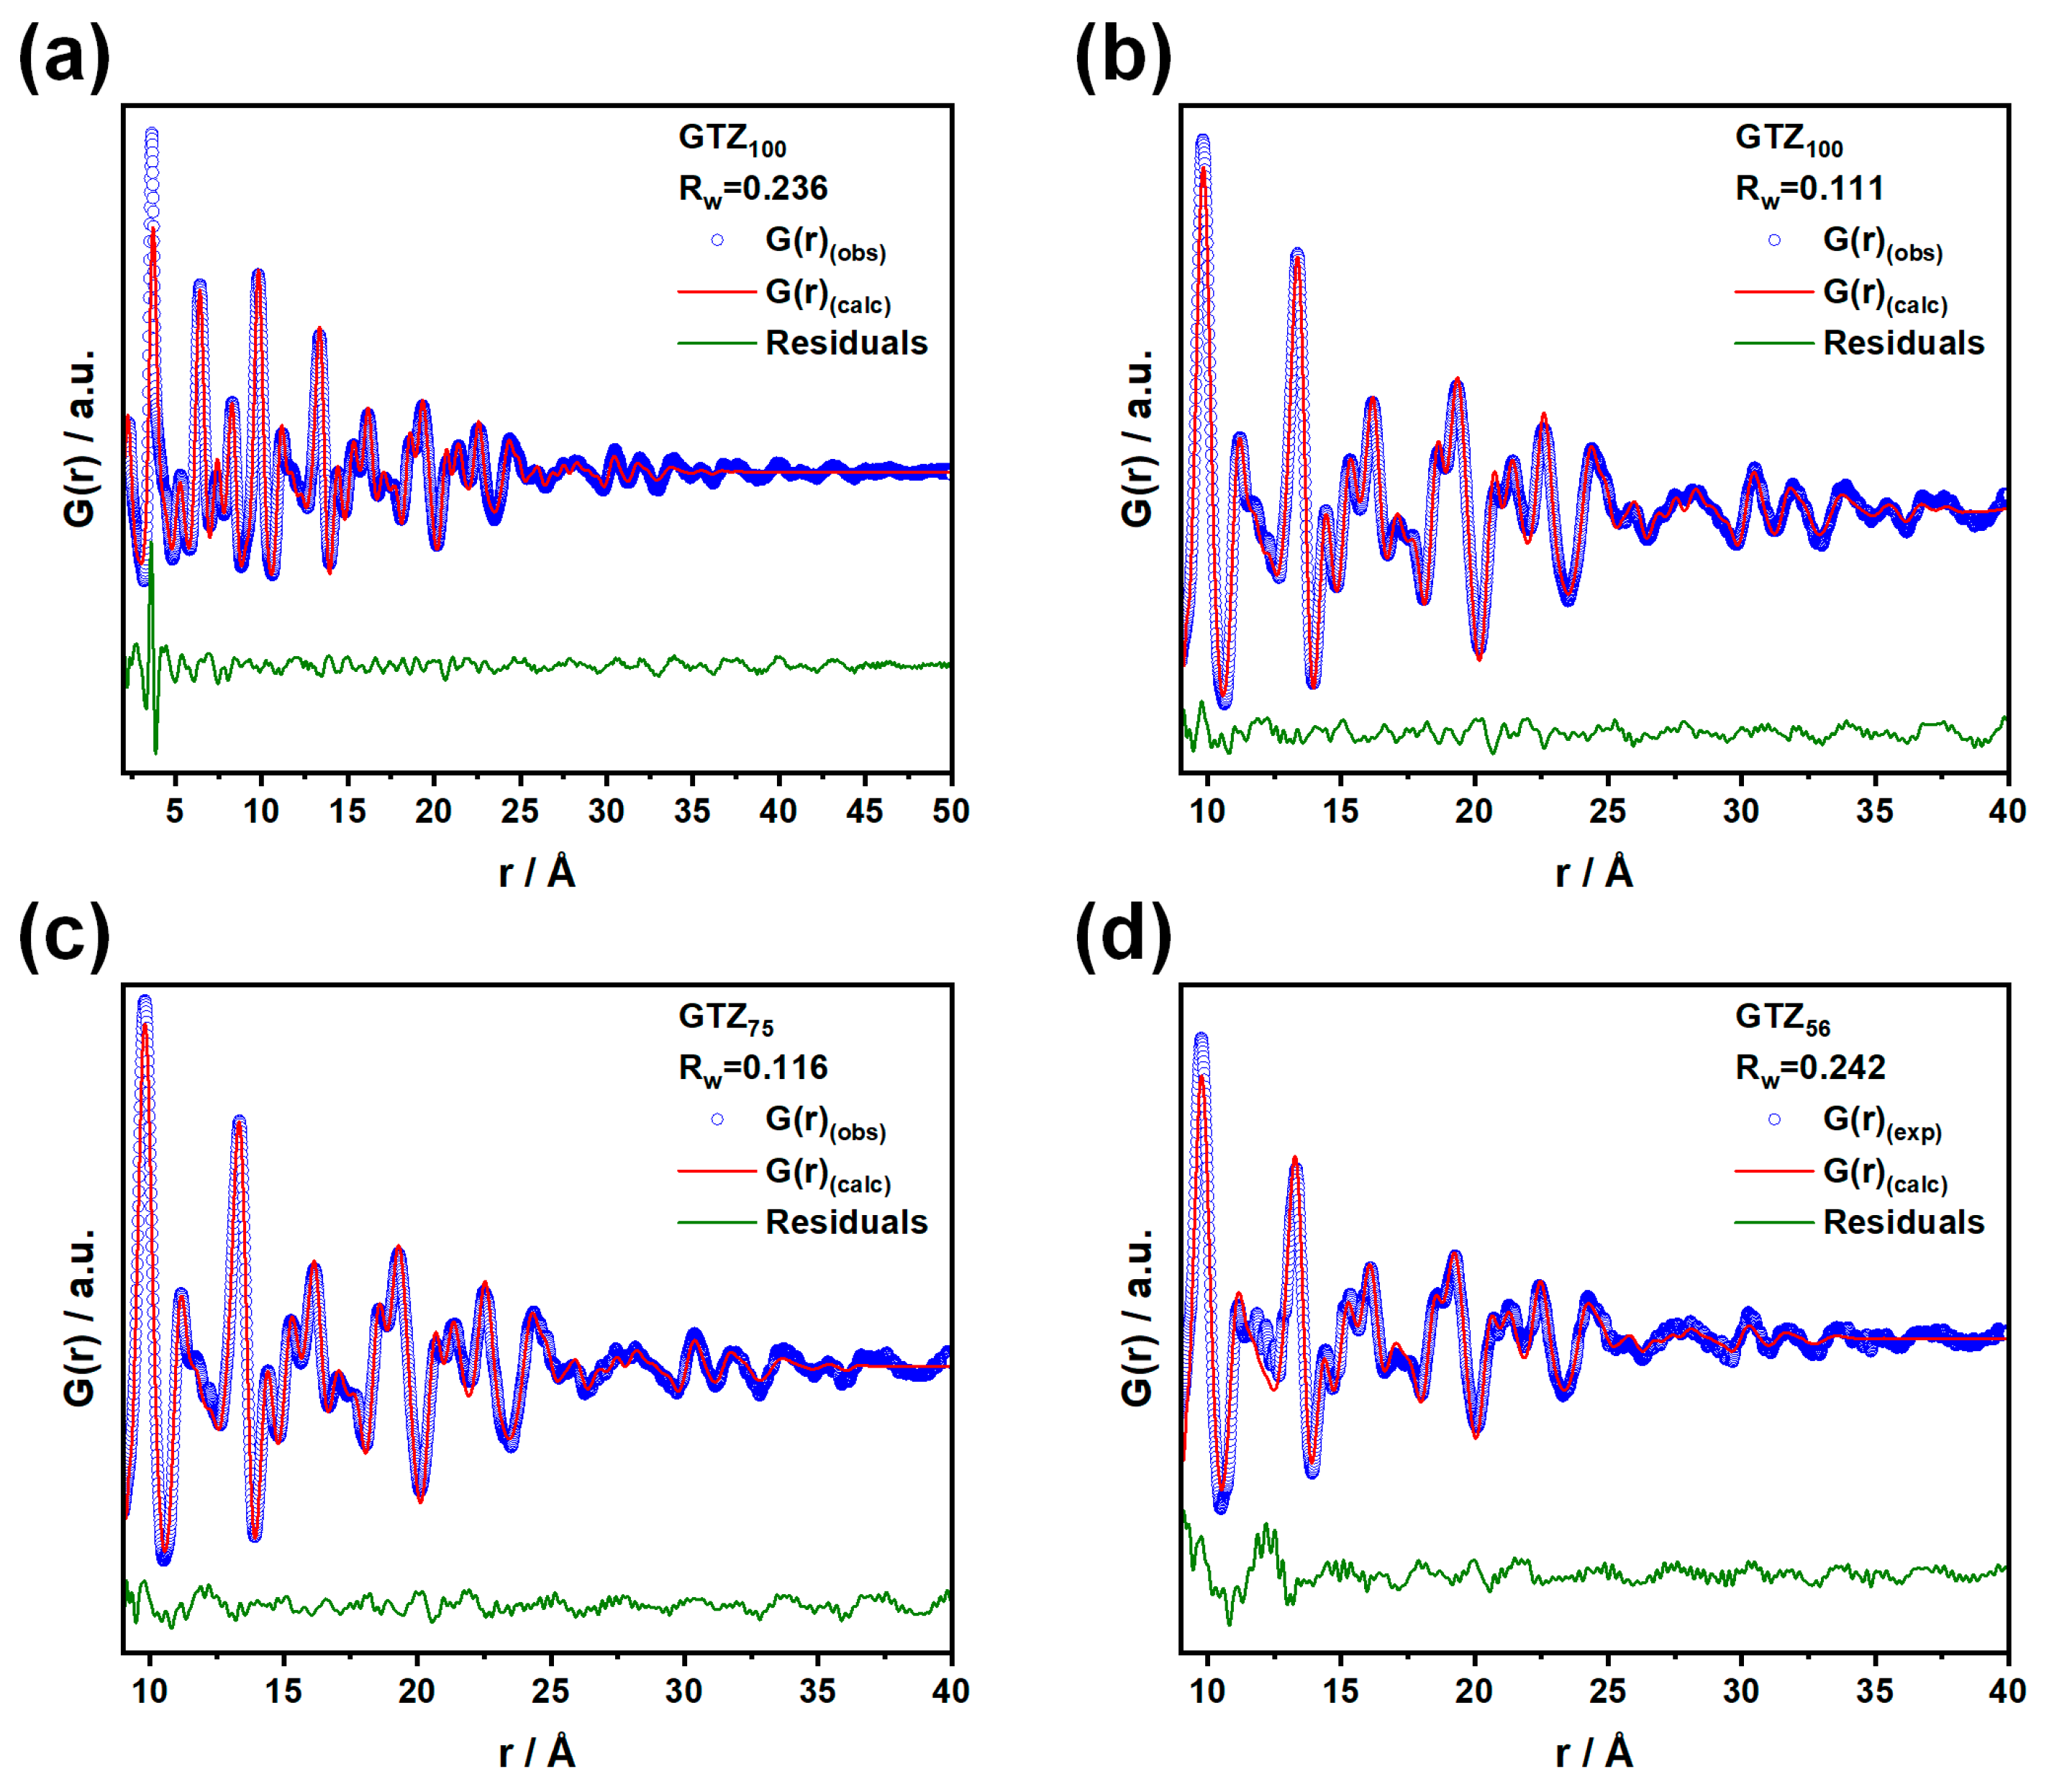
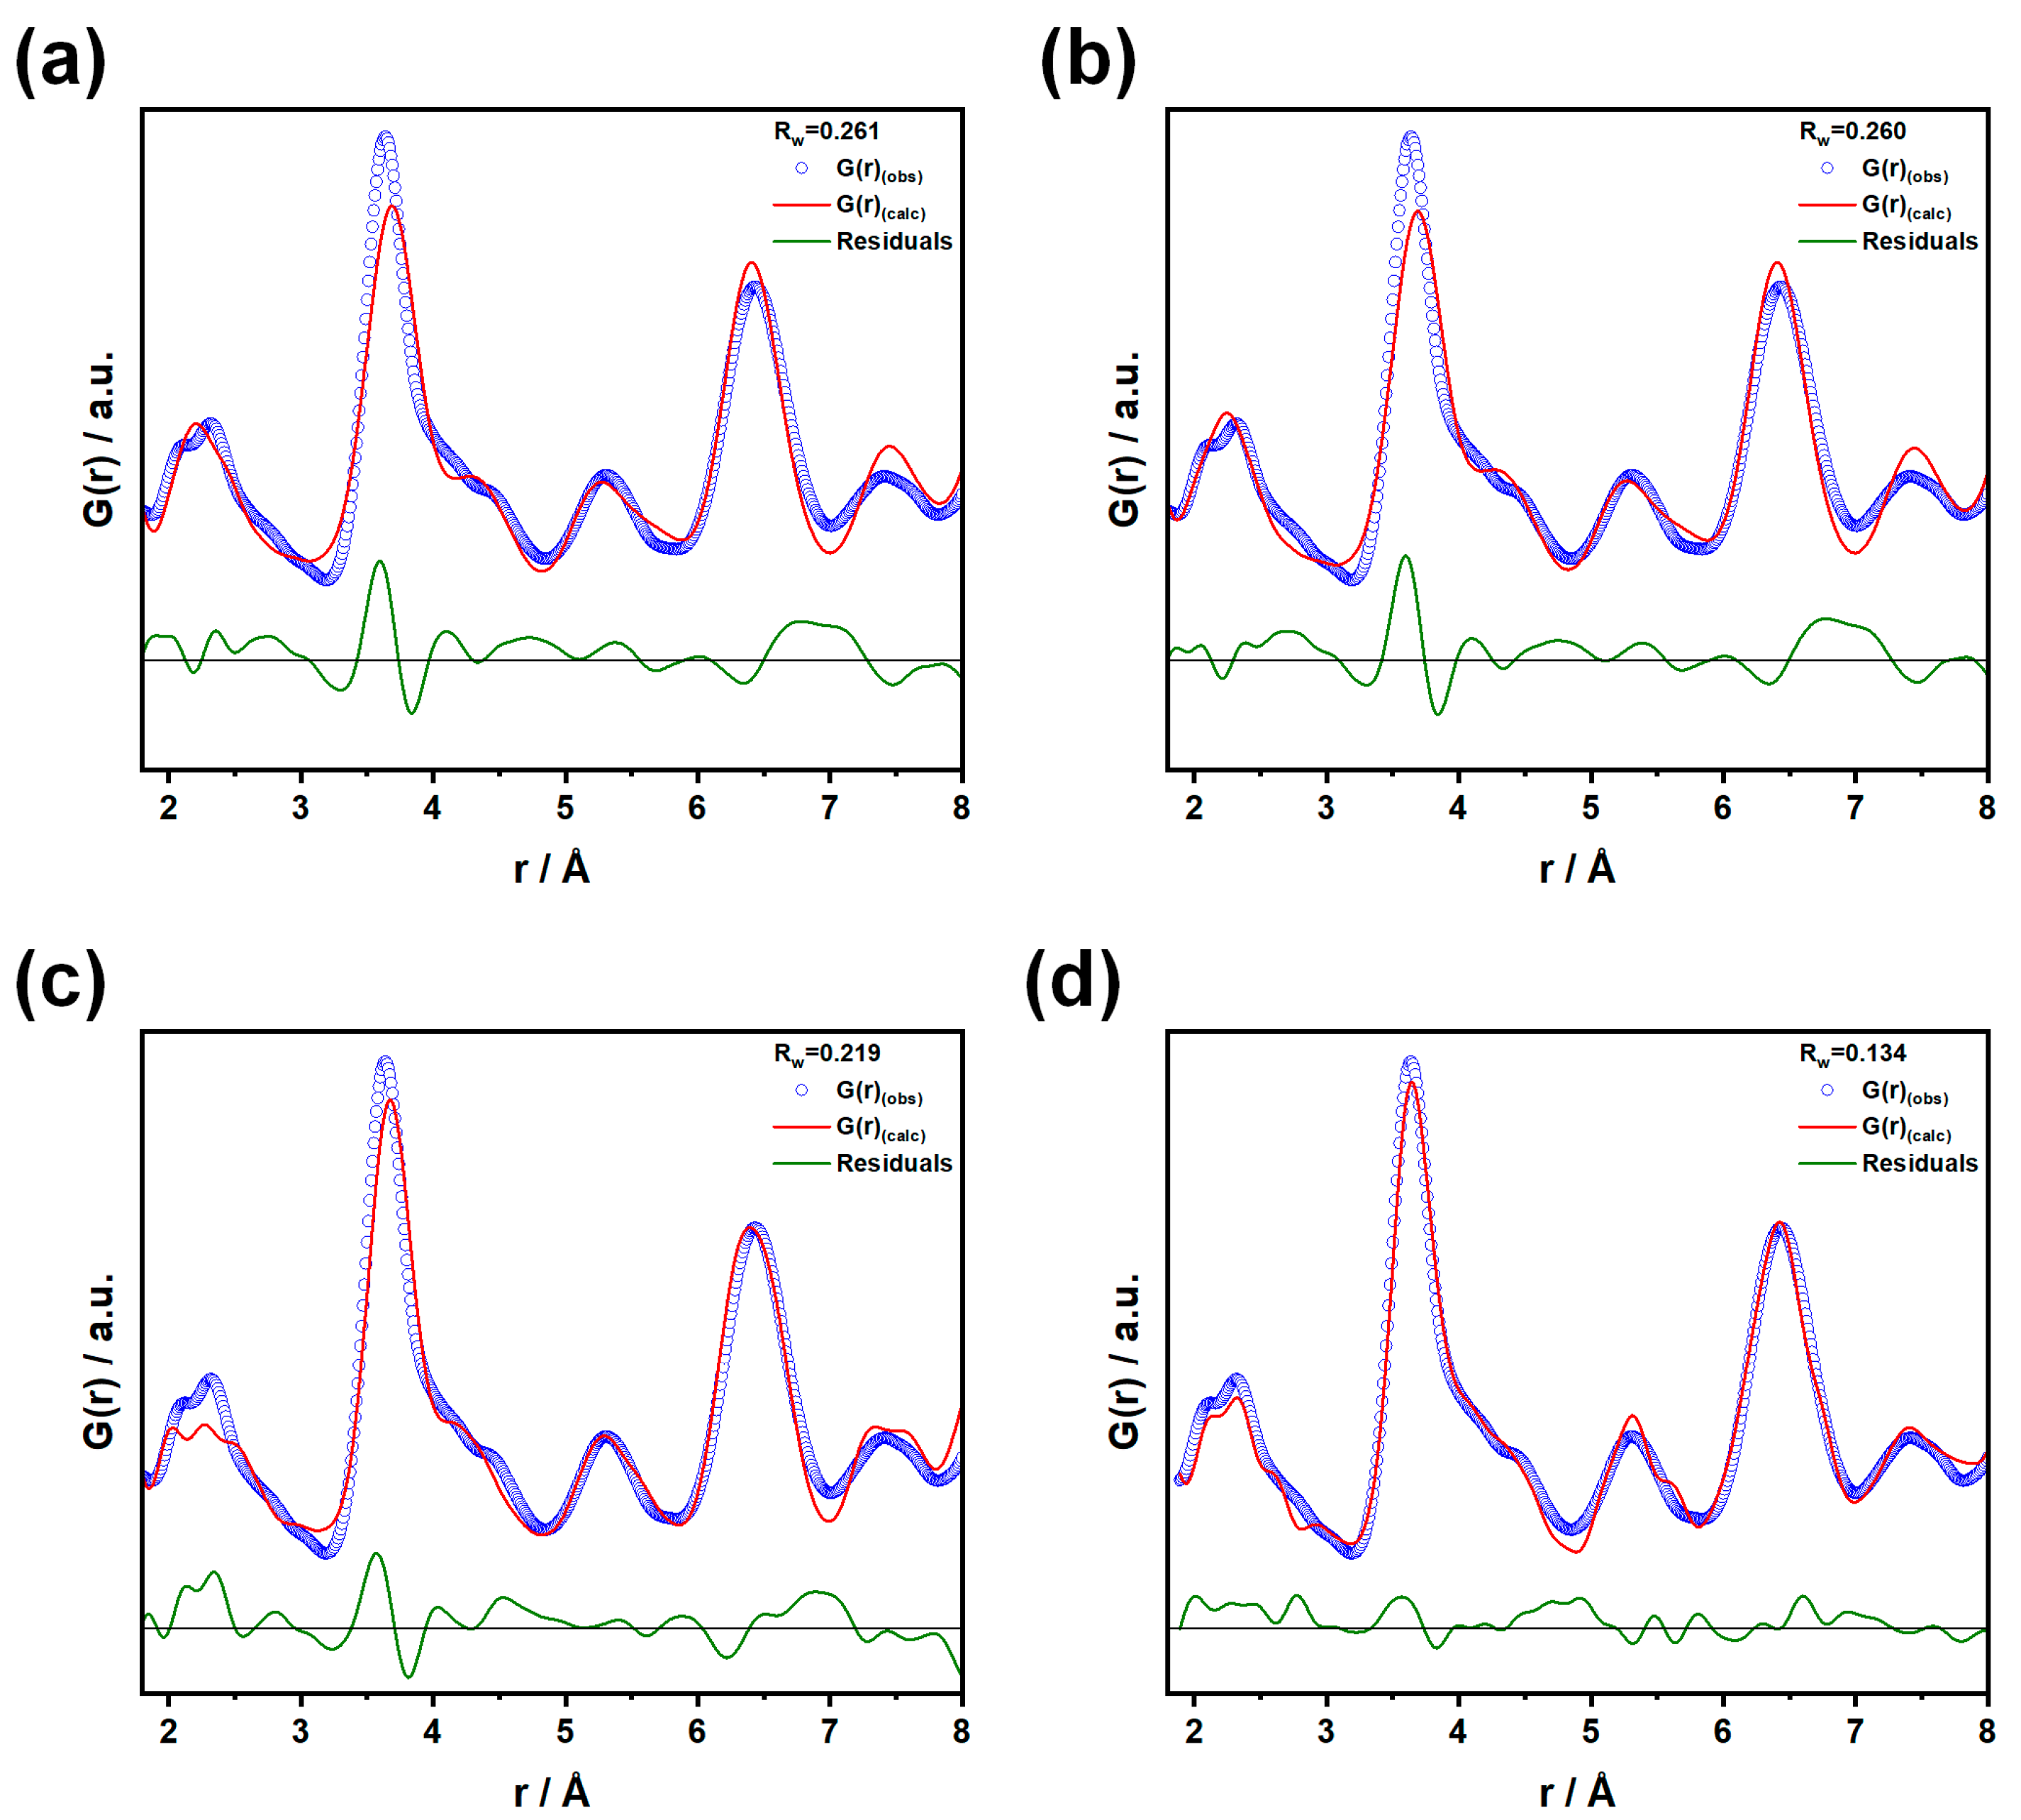
3.3.1. PDF Results
3.3.2. EXAFS Results
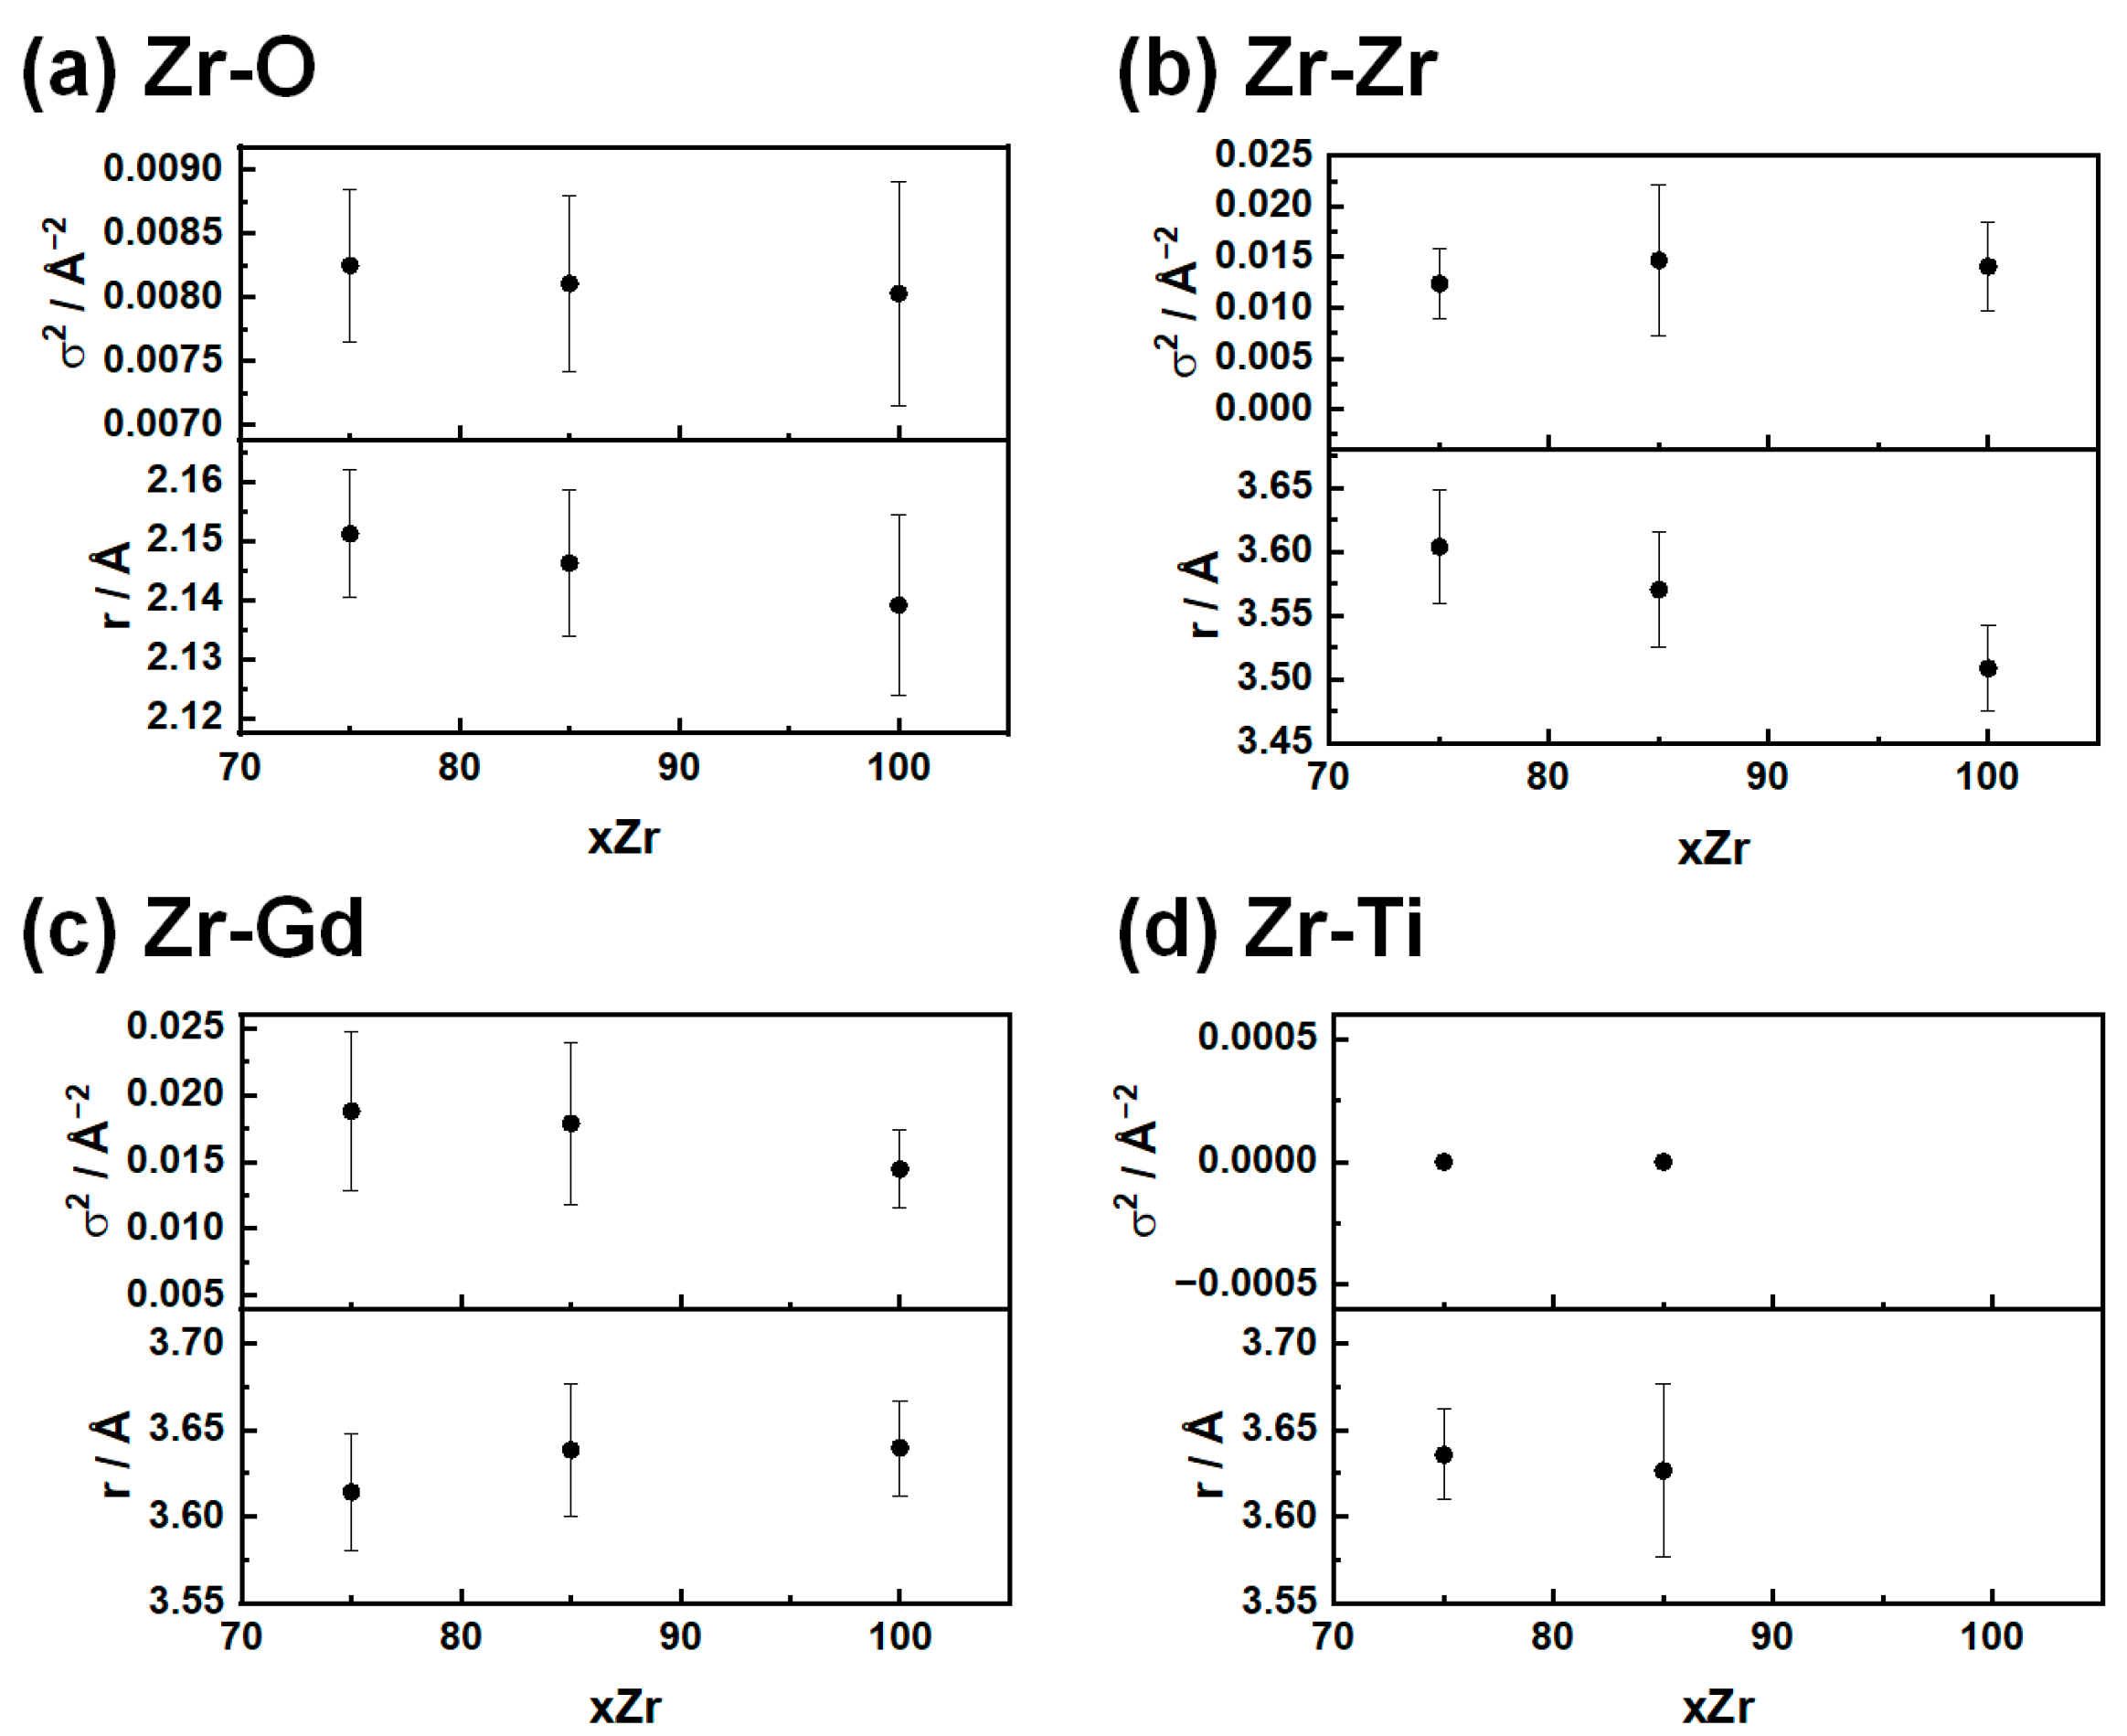
Zr K-Edge
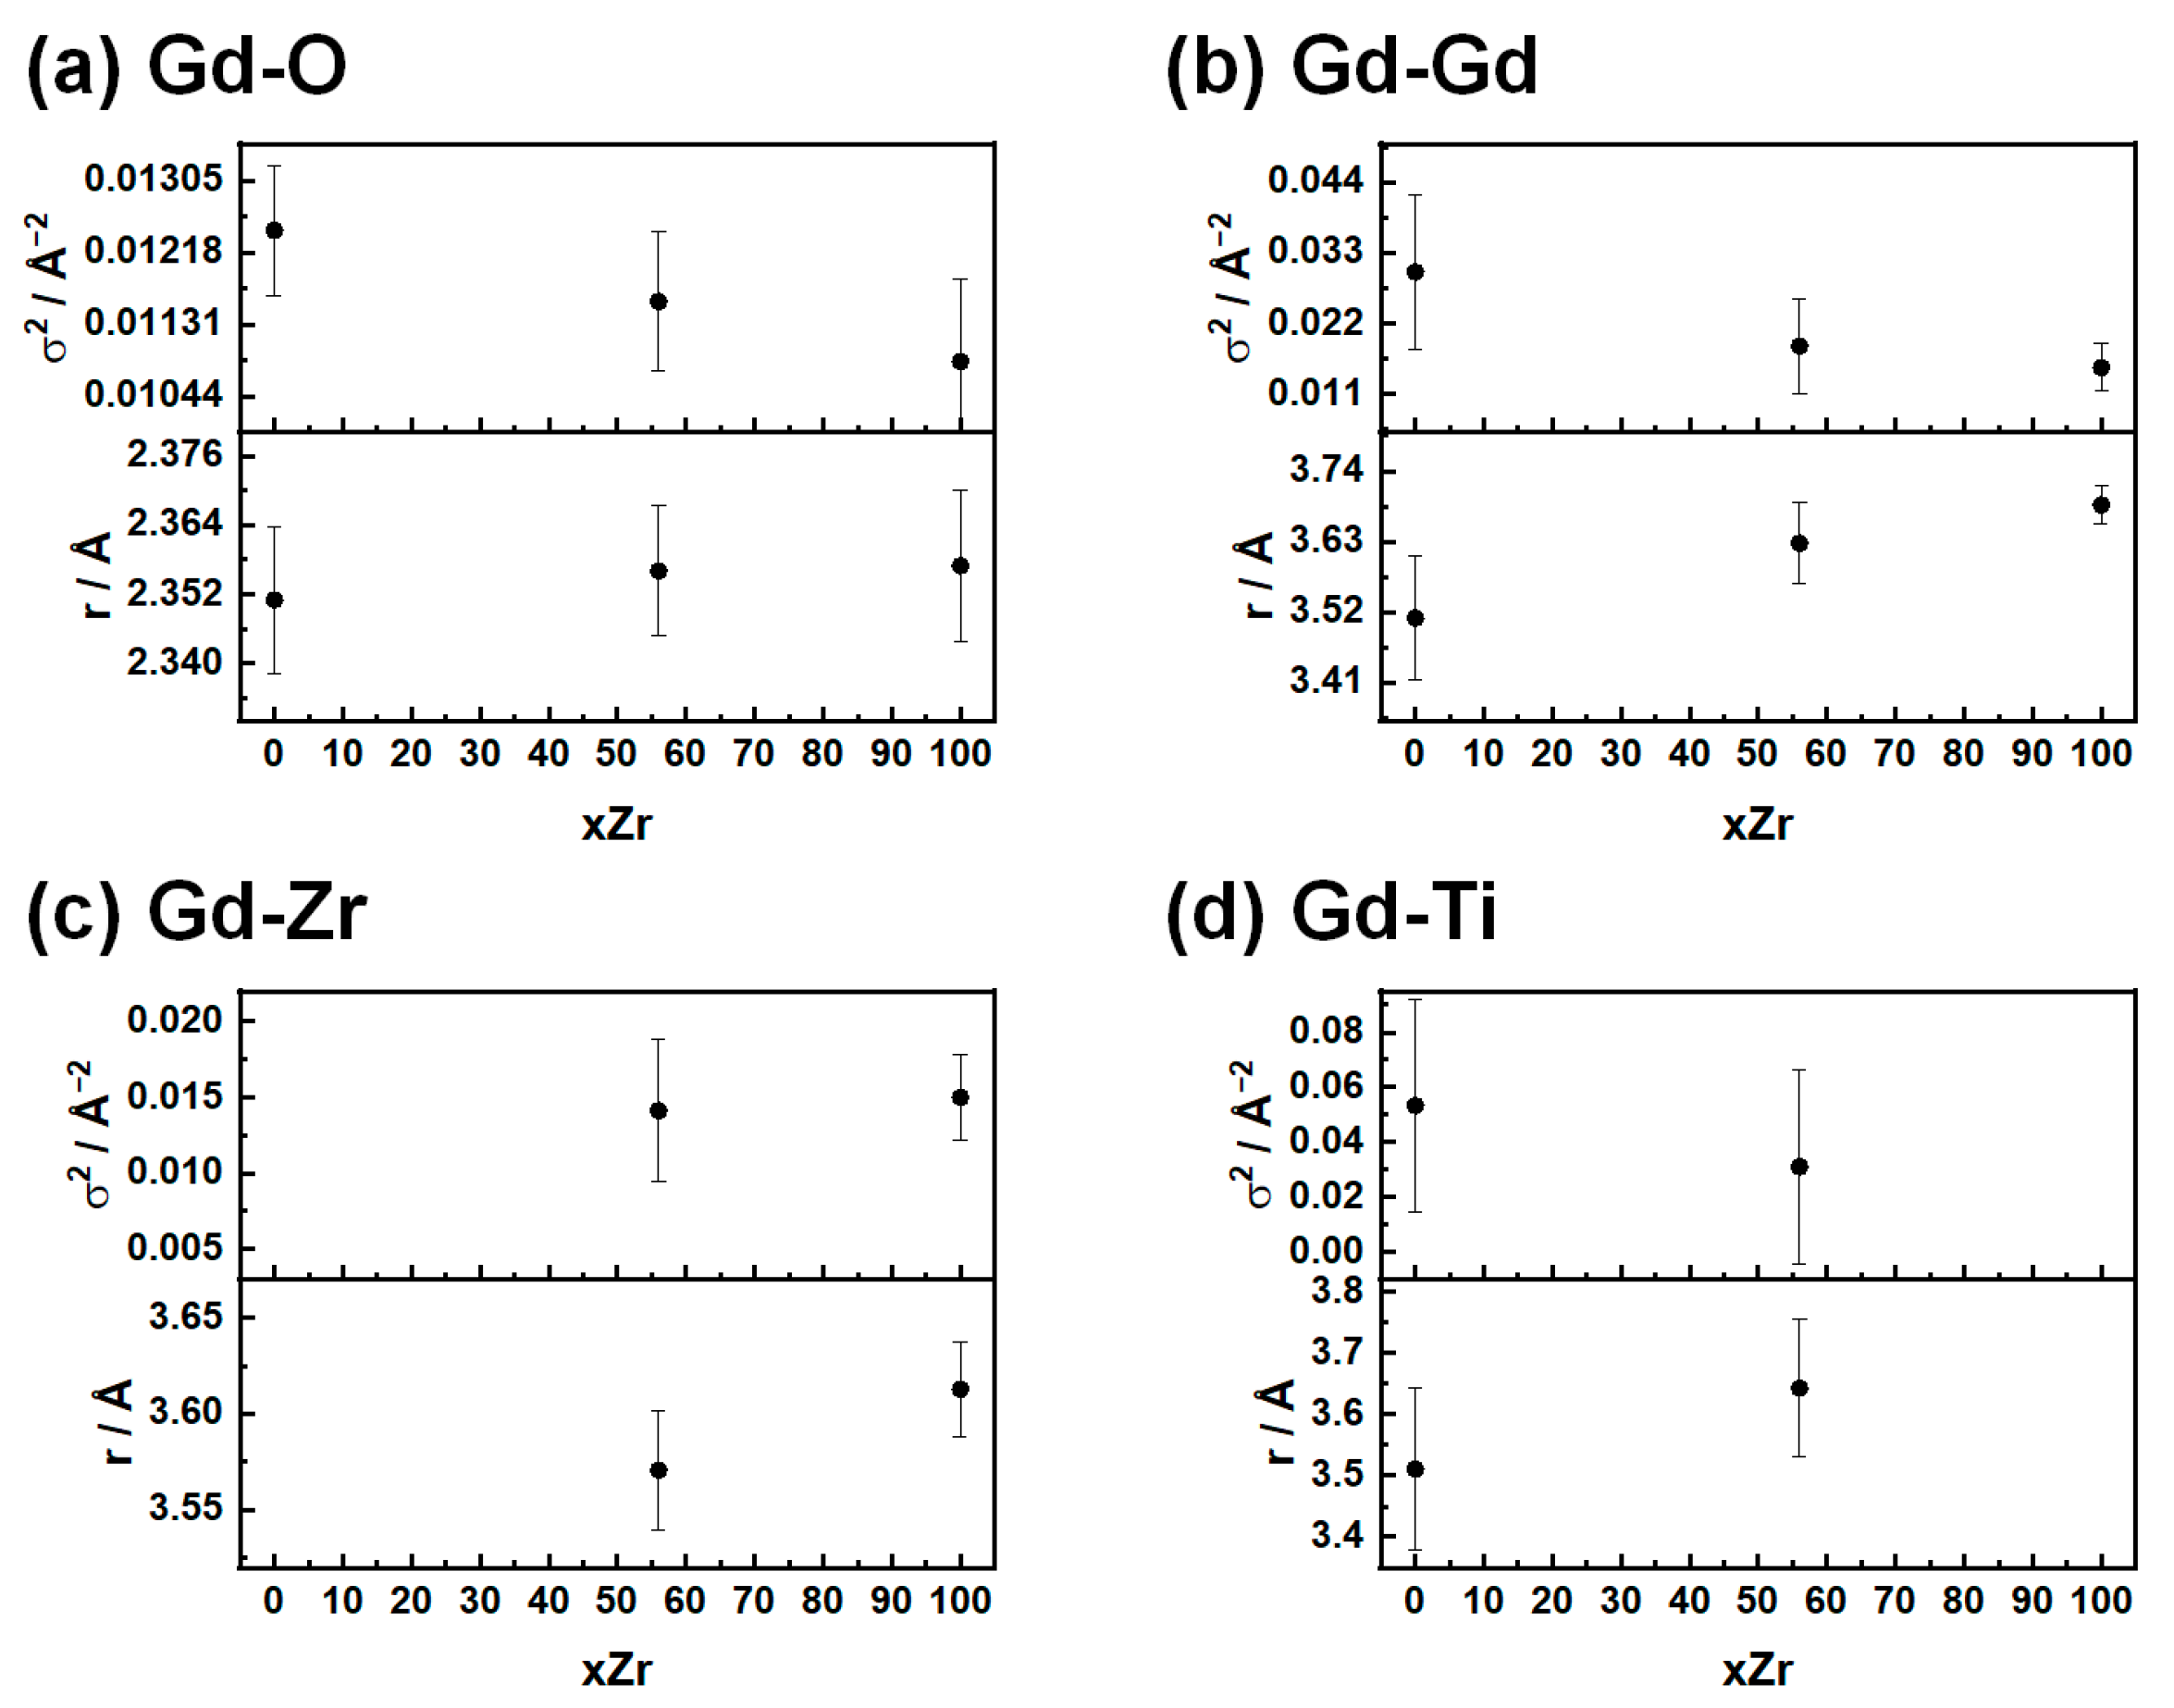
Gd L3-Edge
3.4. General Discussion
4. Conclusions
Supplementary Materials
Author Contributions
Funding
Data Availability Statement
Acknowledgments
Conflicts of Interest
Abbreviations
| HR-XRPD | High-Resolution X-ray Powder Diffraction |
| Pair Distribution Function | |
| DFT | Density Functional Theory |
| EXAFS | Extended X-ray Absorption Fine Structure |
| XANES | X-ray Near Edge Absorption Spectroscopy |
| XAS | X-ray Absorption Spectroscopy |
| ESRF | European Synchrotron Radiation Facility |
| SEM | Scanning Electron Microscopy |
| EDX | Energy Dispersive X-ray Spectroscopy |
| W.H. | Williamson–Hall |
References
- Xu, J.; Xi, R.; Xu, X.; Zhang, Y.; Feng, X.; Fang, X.; Wang, X. A2B2O7 Pyrochlore Compounds: A Category of Potential Materials for Clean Energy and Environment Protection Catalysis. J. Rare Earths 2020, 38, 840–849. [Google Scholar] [CrossRef]
- Anantharaman, A.P.; Dasari, H.P. Potential of Pyrochlore Structure Materials in Solid Oxide Fuel Cell Applications. Ceram. Int. 2021, 47, 4367–4388. [Google Scholar] [CrossRef]
- McMaster, S.A.; Ram, R.; Faris, N.; Pownceby, M.I. Radionuclide Disposal Using the Pyrochlore Supergroup of Minerals as a Host Matrix—A Review. J. Hazard. Mater. 2018, 360, 257–269. [Google Scholar] [CrossRef] [PubMed]
- Wang, Y.; Jing, C.; Ding, Z.-Y.; Zhang, Y.-Z.; Wei, T.; Ouyang, J.-H.; Liu, Z.-G.; Wang, Y.-J.; Wang, Y.-M. The Structure, Property, and Ion Irradiation Effects of Pyrochlores: A Comprehensive Review. Crystals 2023, 13, 143. [Google Scholar] [CrossRef]
- Ewing, R.C.; Weber, W.J.; Lian, J. Nuclear Waste Disposal—Pyrochlore (A2B2O7): Nuclear Waste Form for the Immobilization of Plutonium and “Minor” Actinides. J. Appl. Phys. 2004, 95, 5949–5971. [Google Scholar] [CrossRef]
- Ringwood, A.E.; Kesson, S.E.; Ware, N.G.; Hibberson, W.; Major, A. Immobilisation of High Level Nuclear Reactor Wastes in SYNROC. Nature 1979, 278, 219–223. [Google Scholar] [CrossRef]
- Wang, S.; Begg, B.; Wang, L.; Ewing, R.; Weber, W.; Govidan Kutty, K.; Gd, Z. Radiation Stability of Gadolinium Zirconate: A Waste Form for Plutonium Disposition. J. Mater. Res. 1999, 14, 4470–4473. [Google Scholar] [CrossRef]
- Begg, B.D.; Hess, N.J.; McCready, D.E.; Thevuthasan, S.; Weber, W.J. Heavy-Ion Irradiation Effects in Gd2(Ti2−xZrx)O7 Pyrochlores. J. Nucl. Mater. 2001, 289, 188–193. [Google Scholar] [CrossRef]
- Lang, M.; Lian, J.; Zhang, J.; Zhang, F.; Weber, W.J.; Trautmann, C.; Ewing, R.C. Single-Ion Tracks in Gd2Zr2−xTixO7 Pyrochlores Irradiated with Swift Heavy Ions. Phys. Rev. B 2009, 79, 224105. [Google Scholar] [CrossRef]
- Lang, M.; Zhang, F.X.; Ewing, R.C.; Lian, J.; Trautmann, C.; Wang, Z. Structural Modifications of Gd2Zr2−xTixO7 Pyrochlore Induced by Swift Heavy Ions: Disordering and Amorphization. J. Mater. Res. 2009, 24, 1322–1334. [Google Scholar] [CrossRef]
- di Biase, A.; Castellano, C.; Confalonieri, G.; Fumagalli, P.; Tumiati, S.; Ceresoli, D.; Scavini, M. Emerging Disorder in Gd2(Ti1−xZrx)2O7 Pyrochlores Matrices for Radioactive Waste Disposal: Symmetry Lowering versus Defect Clustering. J. Mater. Chem. A 2023, 11, 24203–24218. [Google Scholar] [CrossRef]
- Wuensch, B.J.; Eberman, K.W.; Heremans, C.; Ku, E.M.; Onnerud, P.; Yeo, E.M.E.; Haile, S.M.; Stalick, J.K.; Jorgensen, J.D. Connection between Oxygen-Ion Conductivity of Pyrochlore Fuel-Cell Materials and Structural Change with Composition and Temperature. Solid. State Ion. 2000, 129, 111–133. [Google Scholar] [CrossRef]
- Heremans, C.; Wuensch, B.J.; Stalick, J.K.; Prince, E. Fast-Ion Conducting Y2(ZryTi1−y)2O7 Pyrochlores: Neutron Rietveld Analysis of Disorder Induced by Zr Substitution. J. Solid. State Chem. 1995, 117, 108–121. [Google Scholar] [CrossRef]
- Hess, N.J.; Begg, B.D.; Conradson, S.D.; McCready, D.E.; Gassman, P.L.; Weber, W.J. Spectroscopic Investigations of the Structural Phase Transition in Gd2(Ti1−yZry)2O7 Pyrochlores. J. Phys. Chem. B 2002, 106, 4663–4677. [Google Scholar] [CrossRef]
- O’Quinn, E.C.; Drey, D.L.; Lang, M.K. Defining the Structural Stability Field of Disordered Fluorite Oxides. Front. Chem. 2021, 9, 733718. [Google Scholar] [CrossRef] [PubMed]
- Fuentes, A.F.; Montemayor, S.M.; Maczka, M.; Lang, M.; Ewing, R.C.; Amador, U. A Critical Review of Existing Criteria for the Prediction of Pyrochlore Formation and Stability. Inorg. Chem. 2018, 57, 12093–12105. [Google Scholar] [CrossRef] [PubMed]
- Subramanian, M.A.; Aravamudan, G.; Subba Rao, G.V. Oxide Pyrochlores—A Review. Prog. Solid. State Chem. 1983, 15, 55–143. [Google Scholar] [CrossRef]
- Herrera, G.; Jiménez-Mier, J.; Chavira, E. Layered-Structural Monoclinic–Orthorhombic Perovskite La2Ti2O7 to Orthorhombic LaTiO3 Phase Transition and Their Microstructure Characterization. Mater. Charact. 2014, 89, 13–22. [Google Scholar] [CrossRef]
- Harvey, E.J.; Ashbrook, S.E.; Lumpkin, G.R.; Redfern, S.A.T. Characterisation of the (Y1−XLax)2Ti2O7 System by Powder Diffraction and Nuclear Magnetic Resonance Methods. J. Mater. Chem. 2006, 16, 4665–4674. [Google Scholar] [CrossRef]
- Wang, Z.; Kong, L.; Karatchevtseva, I.; D’Angelo, A.M.; Zhang, Y. Unravelling Composition-Regulated Phase Transitions in Gadolinium Zirconate Solid Solutions by Synchrotron X-Ray Diffraction and Raman Spectroscopy. Mater. Chem. Phys. 2025, 344, 131168. [Google Scholar] [CrossRef]
- Shamblin, J.; Feygenson, M.; Neuefeind, J.; Tracy, C.L.; Zhang, F.; Finkeldei, S.; Bosbach, D.; Zhou, H.; Ewing, R.C.; Lang, M. Probing Disorder in Isometric Pyrochlore and Related Complex Oxides. Nat. Mater. 2016, 15, 507–511. [Google Scholar] [CrossRef] [PubMed]
- Jiang, C.; Stanek, C.R.; Sickafus, K.E.; Uberuaga, B.P. First-Principles Prediction of Disordering Tendencies in Pyrochlore Oxides. Phys. Rev. B Condens. Matter Mater. Phys. 2009, 79, 104203. [Google Scholar] [CrossRef]
- Popov, V.V.; Zubavichus, Y.V.; Menushenkov, A.P.; Yaroslavtsev, A.A.; Kulik, E.S.; Petrunin, V.F.; Korovin, S.A.; Trofimova, N.N. Short- and Long-Range Order Balance in Nanocrystalline Gd2Zr2O7 Powders with a Fluorite-Pyrochlore Structure. Russ. J. Inorg. Chem. 2014, 59, 279–285. [Google Scholar] [CrossRef]
- Popov, V.V.; Menushenkov, A.P.; Ivanov, A.A.; Gaynanov, B.R.; Yastrebtsev, A.A.; d’Acapito, F.; Puri, A.; Castro, G.R.; Shchetinin, I.V.; Zheleznyi, M.V.; et al. Comparative Analysis of Long- and Short-Range Structures Features in Titanates Ln2Ti2O7 and Zirconates Ln2Zr2O7 (Ln = Gd, Tb, Dy) upon the Crystallization Process. J. Phys. Chem. Solids 2019, 130, 144–153. [Google Scholar] [CrossRef]
- Aluri, E.R.; Grosvenor, A.P. An Investigation of the Electronic Structure and Structural Stability of RE2Ti2O7 by Glancing Angle and Total Electron Yield XANES. J. Alloys Compd. 2014, 616, 516–526. [Google Scholar] [CrossRef]
- Popov, V.V.; Menushenkov, A.P.; Pisarev, A.A.; Berdnikova, M.M.; Zubavichus, Y.V.; Svetogorov, R.D.; Shchetinin, I.V.; Zheleznyi, M.V.; Tsarenko, N.A.; Arzhatkina, L.A.; et al. Influence of Synthesis Conditions on the Crystal and Local Structures of WO3 Powders. J. Phys. Conf. Ser. 2019, 1238, 012009. [Google Scholar]
- Fitch, A.; Dejoie, C.; Covacci, E.; Confalonieri, G.; Grendal, O.; Claustre, L.; Guillou, P.; Kieffer, J.; De Nolf, W.; Petitdemange, S.; et al. ID22-the High-Resolution Powder-Diffraction Beamline at ESRF. J. Synchrotron Radiat. 2023, 30, 1003–1012. [Google Scholar] [CrossRef] [PubMed]
- Toby, B.H. EXPGUI, a Graphical User Interface for GSAS. J. Appl. Crystallogr. 2001, 34, 210–213. [Google Scholar] [CrossRef]
- Larson, A.C.; Von Dreele, R.B. General Structure Analysis System (GSAS). In Report LAUR; Los Alamos National Laboratory Report, 86-748; Los Alamos National Laboratory: Los Alamos, NM, USA, 2000. [Google Scholar]
- Williamson, G.K.; Hall, W.H. X-Ray Line Broadening from Filed Aluminium and Wolfram. Acta Metall. 1953, 1, 22–31. [Google Scholar] [CrossRef]
- Egami, T.; Billinge, S.J.L. Underneath the Bragg Peaks. Mater. Today 2003, 6, 57. [Google Scholar] [CrossRef]
- Juhás, P.; Davis, T.; Farrow, C.L.; Billinge, S.J.L. PDFgetX3: A Rapid and Highly Automatable Program for Processing Powder Diffraction Data into Total Scattering Pair Distribution Functions. J. Appl. Crystallogr. 2013, 46, 560–566. [Google Scholar] [CrossRef]
- Farrow, C.L.; Juhas, P.; Liu, J.W.; Bryndin, D.; Boin, E.S.; Bloch, J.; Proffen, T.; Billinge, S.J.L. PDFfit2 and PDFgui: Computer Programs for Studying Nanostructure in Crystals. J. Phys. Condens. Matter 2007, 19, 335219. [Google Scholar] [CrossRef] [PubMed]
- d’Acapito, F.; Lepore, G.O.; Puri, A.; Laloni, A.; La Manna, F.; Dettona, E.; De Luisa, A.; Martin, A. The LISA Beamline at ESRF. J. Synchrotron Radiat. 2019, 26, 551–558. [Google Scholar] [CrossRef] [PubMed]
- Klementiev, K.; Chernikov, R. XAFSmass: A Program for Calculating the Optimal Mass of XAFS Samples. J. Phys. Conf. Ser. 2016, 712, 012008. [Google Scholar] [CrossRef]
- Ravel, B.; Newville, M. Athena, Artemis, Hephaestus: Data Analysis for X-Ray Absorption Spectroscopy Using IFEFFIT. J. Synchrotron Radiat. 2005, 12, 537–541. [Google Scholar] [CrossRef]
- Rehr, J.J.; Kas, J.J.; Vila, F.D.; Prange, M.P.; Jorissen, K. Parameter-Free Calculations of X-Ray Spectra with FEFF9. Phys. Chem. Chem. Phys. 2010, 12, 5503. [Google Scholar] [CrossRef] [PubMed]
- Jain, A.; Ong, S.P.; Hautier, G.; Chen, W.; Richards, W.D.; Dacek, S.; Cholia, S.; Gunter, D.; Skinner, D.; Ceder, G.; et al. Commentary: The Materials Project: A Materials Genome Approach to Accelerating Materials Innovation. APL Mater. 2013, 1, 011002. [Google Scholar] [CrossRef]
- Materials Data on ZrO2 by Materials Project. Mater. Explor. 2020. [CrossRef]
- Materials Data on GdO by Materials Project. Mater. Explor 2020. [CrossRef]
- Elliott, S.R. The Origin of the First Sharp Diffraction Peak in the Structure Factor of Covalent Glasses and Liquids. J. Phys. Condens. Matter 1992, 4, 7661. [Google Scholar] [CrossRef]
- Shannon, R.D. Revised Effective Ionic Radii and Systematic Studies of Interatomic Distances in Halides and Chalcogenides. Acta Crystallogr. Sect. A 1976, 32, 751–767. [Google Scholar] [CrossRef]
- Zhao, Y.; Xing, W.; Meng, F.; Sha, H.; Yu, Y.; Ma, X.; Yu, R. Metastable Ce-Terminated (1 1 1) Surface of Ceria. Appl. Surf. Sci. 2021, 546, 148972. [Google Scholar] [CrossRef]
- Scavini, M.; Bertolotti, F.; Mlloja, J.; Umbri, F.; Bosc, A.; Cappelli, S.; Checchia, S.; Oliva, C.; Fumagalli, P.; Ceresoli, D.; et al. Structure and Surface Relaxation of CeO2 Nanoparticles Unveiled by Combining Real and Reciprocal Space Total Scattering Analysis. Nanomaterials 2022, 12, 3385. [Google Scholar] [CrossRef] [PubMed]
- Kimmel, G.; Sahartov, A.; Sadia, Y.; Porat, Z.; Zabicky, J.; Dvir, E. Non-Monotonic Lattice Parameters Variation with Crystal Size in Nanocrystalline CeO2. J. Mater. Res. Technol. 2021, 12, 87–99. [Google Scholar] [CrossRef]
- Hassanzadeh-Tabrizi, S.A. Precise Calculation of Crystallite Size of Nanomaterials: A Review. J. Alloys Compd. 2023, 968, 171914. [Google Scholar] [CrossRef]
- Zhang, S.; Xu, J.; Lu, C.; Ouyang, R.; Ma, J.; Zhong, X.; Fang, X.; Xu, X.; Wang, X. Preparation Method Investigation and Structure Identification by XRD and Raman Techniques for A2B2O7 Composite Oxides. J. Am. Ceram. Soc. 2024, 107, 3475–3496. [Google Scholar] [CrossRef]
- Popov, V.V.; Menushenkov, A.P.; Gaynanov, B.R.; Zubavichus, Y.V.; Svetogorov, R.D.; Yastrebtsev, A.A.; Pisarev, A.A.; Arzhatkina, L.A.; Ponkratov, K.V. Features of Formation and Evolution of Crystal and Local Structures in Nanocrystalline Ln2Zr2O7 (Ln = La − Tb). J. Phys. Conf. Ser. 2017, 941, 012079. [Google Scholar] [CrossRef]
- Drey, D.L.; O’Quinn, E.C.; Subramani, T.; Lilova, K.; Baldinozzi, G.; Gussev, I.M.; Fuentes, A.F.; Neuefeind, J.C.; Everett, M.; Sprouster, D.; et al. Disorder in Ho2Ti2−xZrxO7: Pyrochlore to Defect Fluorite Solid Solution Series. RSC Adv. 2020, 10, 34632–34650. [Google Scholar] [CrossRef] [PubMed]
- Stern, E.A. Number of Relevant Independent Points in X-Ray-Absorption Fine-Structure Spectra. Phys. Rev. B 1993, 48, 9825. [Google Scholar] [CrossRef] [PubMed]


| Sample | Nominal Zr % | Exp. Zr % | Nominal Ti % | Exp. Ti % |
|---|---|---|---|---|
| GTZ15 | 15 | 15.6 ± 1.3 | 85 | 87.8 ± 1.2 |
| GTZ25 | 25 | 24.0 ± 0.4 | 75 | 81.1 ± 2.9 |
| GTZ37.5 | 37.5 | 38.9 ± 1.6 | 62.5 | 59.8± |
| GTZ56 | 56 | 55.8 ± 1.6 | 44 | 44.1 ± 1.6 |
| GTZ75 | 75 | 76.4 ± 2.4 | 25 | 23.5 ± 2.5 |
| GTZ85 | 85 | 86.6 ± 0.7 | 15 | 13.4 ± 0.8 |
| Sample | GTZ100 | GTZ85 | GTZ75 | GTZ56 | GTZ37.5 |
|---|---|---|---|---|---|
| xZr | 1 | 0.85 | 0.75 | 0.56 | 0.35 |
| aF (Å) | 5.2590 (4) | 5.2547 (4) | 5.2473 (5) | 5.2344 (4) | 5.2326 (8) |
| Uave/Å2 | 0.0139 (3) | 0.0129 (4) | 0.0155 (4) | 0.0099 (4) | 0.0128 (8) |
| Rp | 0.0342 | 0.0362 | 0.0346 | 0.0219 | 0.0553 |
| R(F2) | 0.0410 | 0.0339 | 0.0274 | 0.0562 | 0.0540 |
| DV/Å | 45 (3) | 40 (4) | 36 (5) | 23 (3) | |
| ε | 0.015 (1) | 0.014 (2) | 0.014 (3) | 0.004 (3) |
Disclaimer/Publisher’s Note: The statements, opinions and data contained in all publications are solely those of the individual author(s) and contributor(s) and not of MDPI and/or the editor(s). MDPI and/or the editor(s) disclaim responsibility for any injury to people or property resulting from any ideas, methods, instructions or products referred to in the content. |
© 2025 by the authors. Licensee MDPI, Basel, Switzerland. This article is an open access article distributed under the terms and conditions of the Creative Commons Attribution (CC BY) license (https://creativecommons.org/licenses/by/4.0/).
Share and Cite
Pinna, M.; Trapletti, A.; Minelli, C.; di Biase, A.; Bianconi, F.; Clemente, M.; Minguzzi, A.; Castellano, C.; Scavini, M. Synchrotron-Based Structural Analysis of Nanosized Gd2(Ti1−xZrx)2O7 for Radioactive Waste Management. Nanomaterials 2025, 15, 1134. https://doi.org/10.3390/nano15141134
Pinna M, Trapletti A, Minelli C, di Biase A, Bianconi F, Clemente M, Minguzzi A, Castellano C, Scavini M. Synchrotron-Based Structural Analysis of Nanosized Gd2(Ti1−xZrx)2O7 for Radioactive Waste Management. Nanomaterials. 2025; 15(14):1134. https://doi.org/10.3390/nano15141134
Chicago/Turabian StylePinna, Marco, Andrea Trapletti, Claudio Minelli, Armando di Biase, Federico Bianconi, Michele Clemente, Alessandro Minguzzi, Carlo Castellano, and Marco Scavini. 2025. "Synchrotron-Based Structural Analysis of Nanosized Gd2(Ti1−xZrx)2O7 for Radioactive Waste Management" Nanomaterials 15, no. 14: 1134. https://doi.org/10.3390/nano15141134
APA StylePinna, M., Trapletti, A., Minelli, C., di Biase, A., Bianconi, F., Clemente, M., Minguzzi, A., Castellano, C., & Scavini, M. (2025). Synchrotron-Based Structural Analysis of Nanosized Gd2(Ti1−xZrx)2O7 for Radioactive Waste Management. Nanomaterials, 15(14), 1134. https://doi.org/10.3390/nano15141134