1. Introduction
White light-emitting diodes (W-LEDs) have replaced conventional incandescent and fluorescent lamps for general illumination. Historically, artificial lighting is energy-intensive, with incandescent lamps exhibiting a luminous efficiency of only 2% and quartz halogen and fluorescent lamps reaching 4% and 15%, respectively, with most of the energy input converted to waste heat. In contrast, solid-state lighting based on W-LEDs currently attains ∼32% luminous efficiency. W-LEDs are a novel high-efficiency lighting system and fourth-generation illumination source with many advantages, including a long lifetime, high rendering index, high luminosity efficiency, low energy consumption, chemical stability, thermal stability, and eco-friendliness [
1,
2,
3]. W-LEDs have superior luminescence characteristics relative to other lighting sources [
4]. W-LEDs have many applications in various domains, such as lighting [
5], biomedicine [
6], communication [
7], liquid crystal displays (as backlight sources) [
8], and architecture [
9]. However, there are several important luminescence parameters that characterize and determine the quality of W-LEDs, including luminous efficacy (LE), color rendering index (CRI), and correlated color temperature (CCT) [
10,
11].
Two main methods are currently used for producing W-LEDs. The first and most commonly adopted method involves producing W-LEDs by using a blue light-emitting diode chip and yellow light-emitting YAG: Ce
3+ phosphor; however, the W-LEDs produced using this method have low CRI values (70 to 80) and a CCT value of 7750 K, because the light produced by them does not contain a red component [
12,
13]. The low CRI value of W-LEDs at a low color temperature limits their possible applications; however, many efforts have been made to overcome this disadvantage. W-LEDs produced using the second method of red (R), blue (B), and green (G) phosphors emit “warm” white light with a high CRI. Phosphor materials that can be effectively excited by ultraviolet or blue light to emit strong R, G, and B light have attracted considerable research attention [
14,
15,
16].
M
3MgSi
2O
8 (M = Ca, Sr, Ba) phosphors were first reported in 1957 [
17]. Alkali earth silicates are crucial hosts for rare-earth-doped phosphors because of the inherent advantages of these silicates, such as excellent chemical and thermal stability as well as the low price of high-purity silicate [
18]. Klasensetal investigated the photoluminescence (PL) properties of Pb
2+-, Mn
2+-, Tl
+-, and Sb
3+-activated M
3MgSi
2O
8 (ternary silicates). In addition to the Pb
2+-activated M
3MgSi
2O
8, none of the other silicates could emit light efficiently. Moreover, Klasensetal found that a substantial amount of Ca
2+ in Ca
3MgSi
2O
8 can be replaced by Ba
2+, whereas only a slight amount of Ba
2+ in Ba
3MgSi
2O
8 can be replaced by Ca
2+ [
17].
Europium oxide
(Eu
2O
3) is a highly useful doping material. When added to host materials as an activator, Eu
2O
3 has different ionic states and causes synthesized phosphors to produce different emission colors. Most Eu
2O
3-doped materials synthesized in the atmosphere behave as Eu
3+-activated phosphors and emit red [
19,
20,
21] or near-infrared [
22] radiation. When Eu
2O
3-doped materials are synthesized in a reducing atmosphere, Eu
3+ ions are reduced to Eu
2+ ions, which results in the formation of Eu
2+-activated phosphors that emit blue light [
23,
24] or green light [
25]. Many Eu
2+-activated materials and relevant synthesis methods have been developed to investigate highly efficient blue or green phosphors. A study that examined mixtures of Eu
2+-activated Ba
3MgSi
2O
8 and Ca
3MgSi
2O
8 found that Ba
3MgSi
2O
8 has a higher PL emission intensity and shorter peak emission wavelength (437 nm) than does Ca
3MgSi
2O
8 (peak emission wavelength of 475 nm).
In the present study, we synthesized Eu2O3-doped Sr3MgSi2O8 phosphors by using the solid-state reaction method at high temperatures, and investigated the crystal structure and PL properties of these phosphors. The effects of the synthesis temperature and time on Eu2O3-doped Sr3MgSi2O8 phosphors were investigated. When Eu2O3-doped Sr3MgSi2O8 was synthesized in a reducing atmosphere, Eu3+ ions were reduced to Eu2+ ions, and the synthesized phosphors emitted strong blue light. [Sr1−xEux]3MgSi2O8 might be a promising blue phosphor for RGB-W-LEDs.
3. Results and Discussion
The XRD patterns of the prepared [Sr
0.99Eu
0.01]
3MgSi
2O
8 phosphors were obtained to verify their crystal structures.
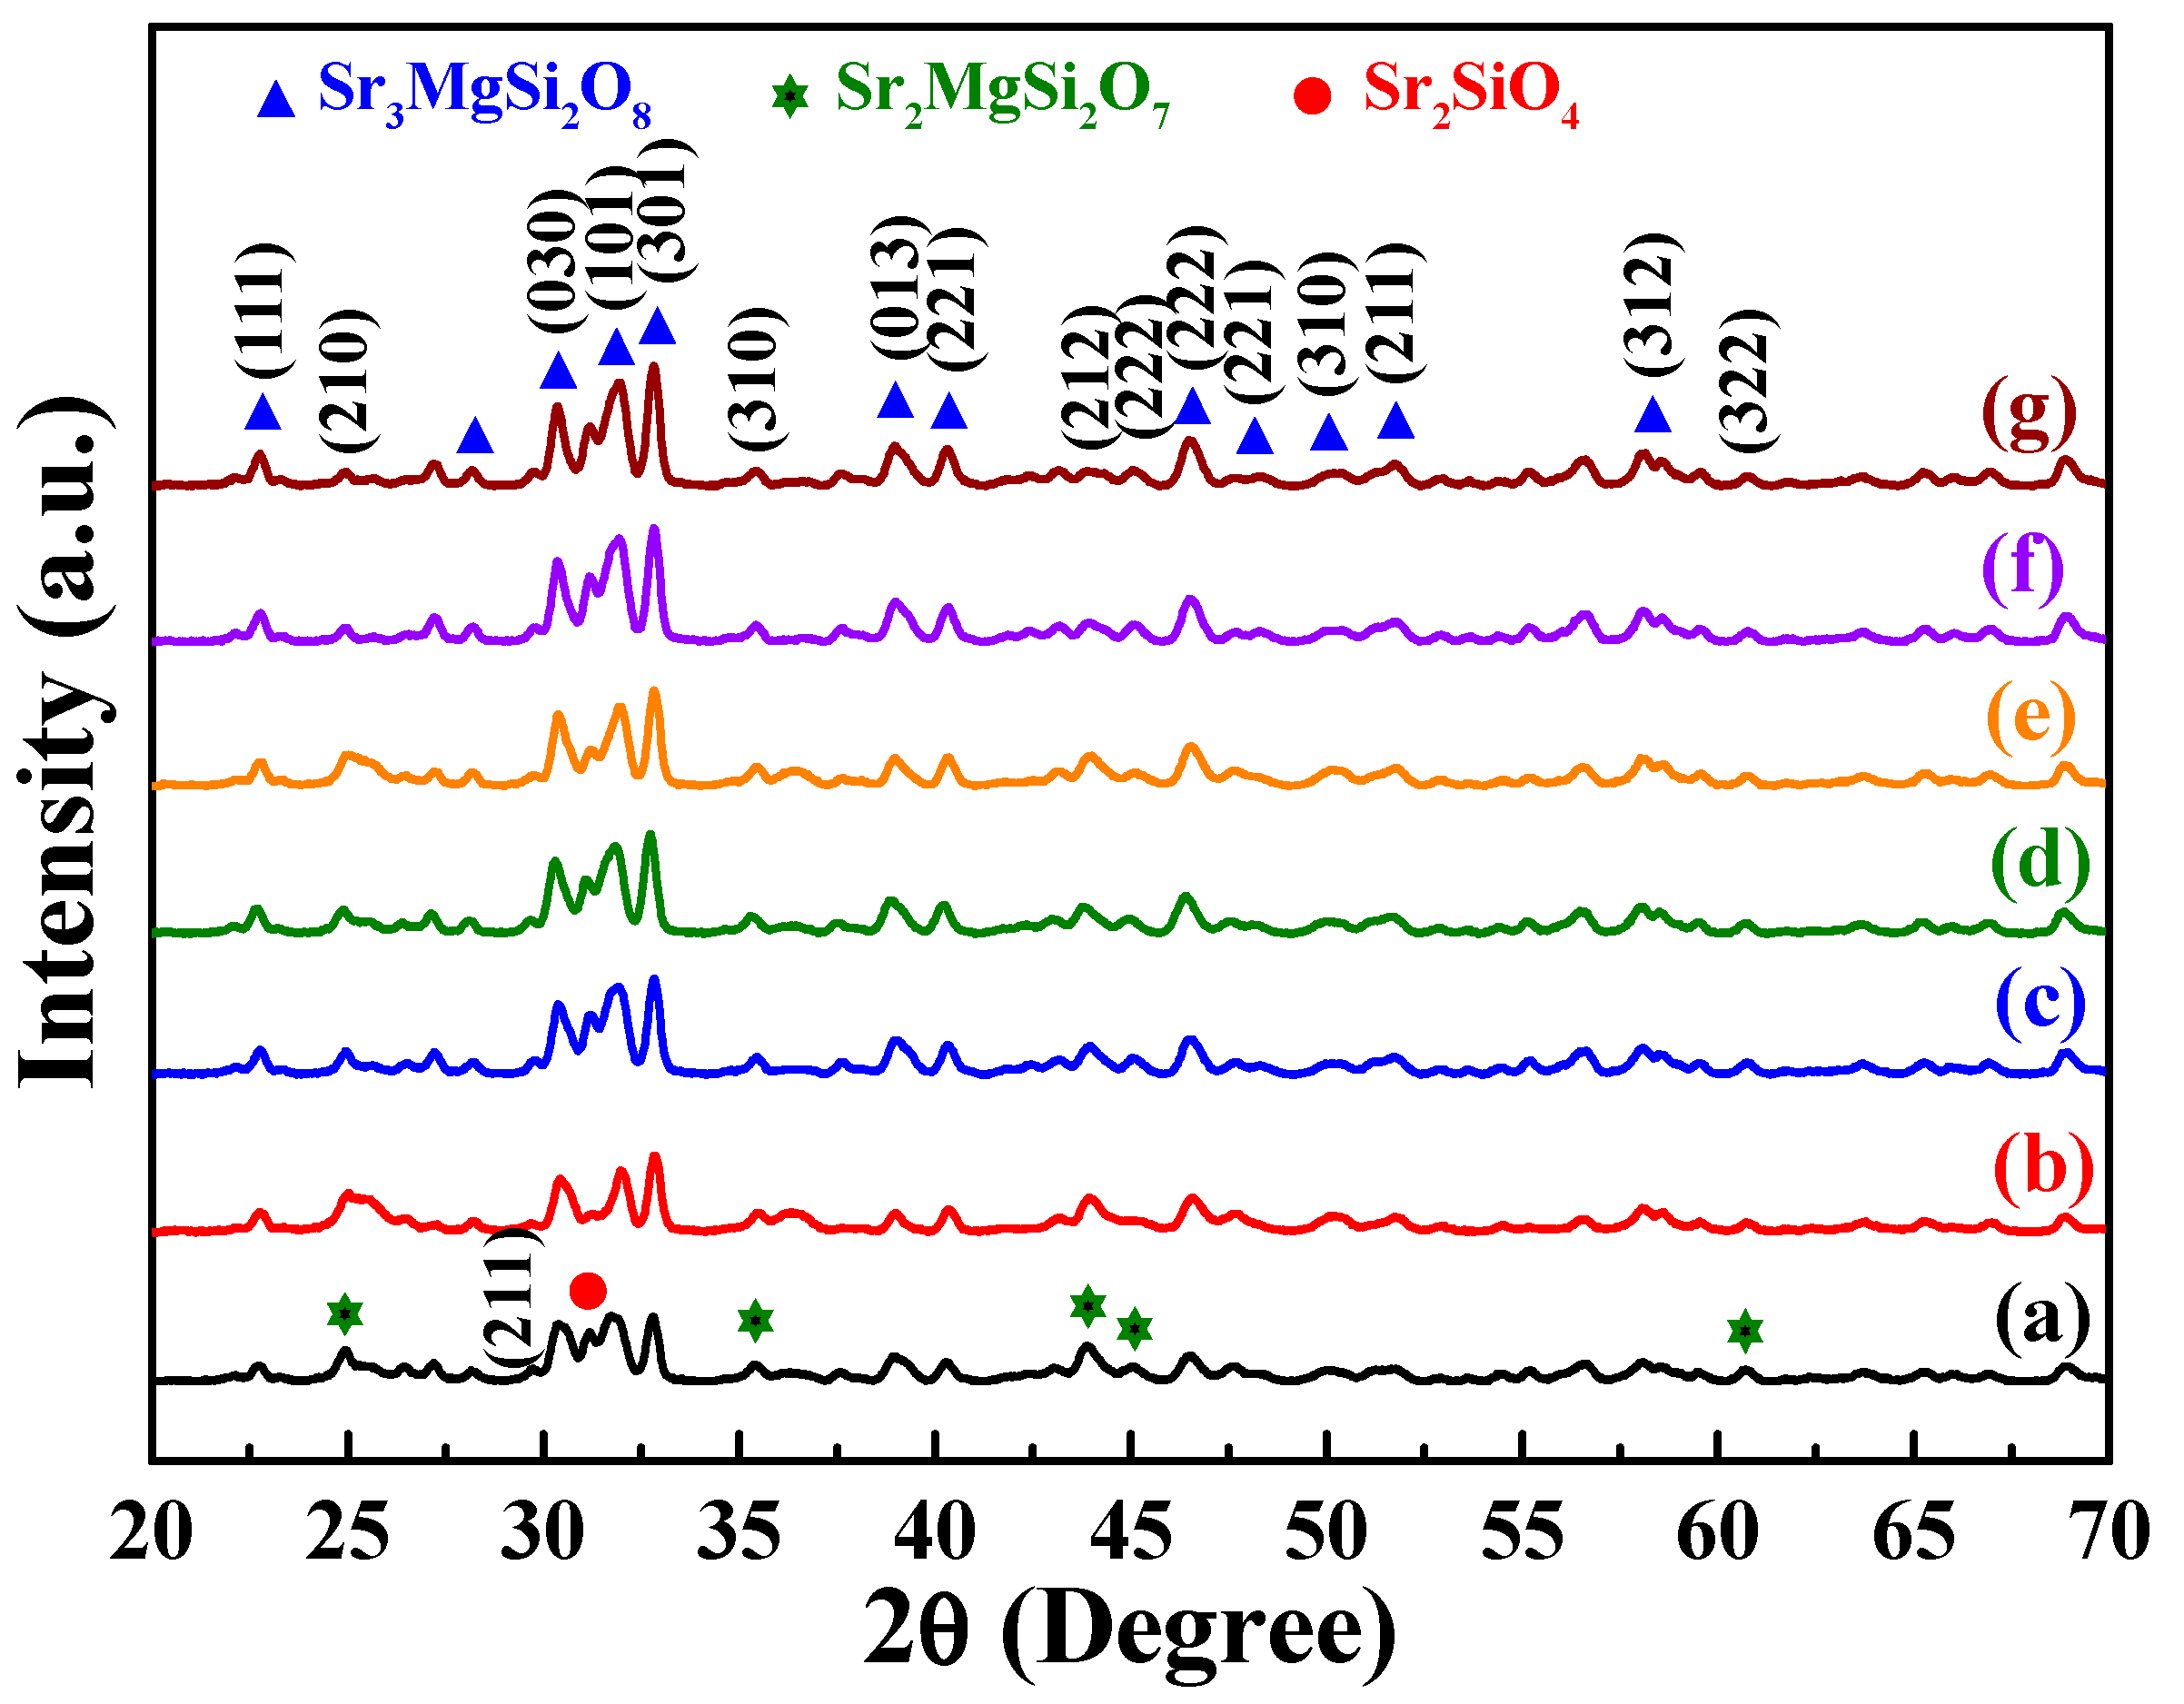
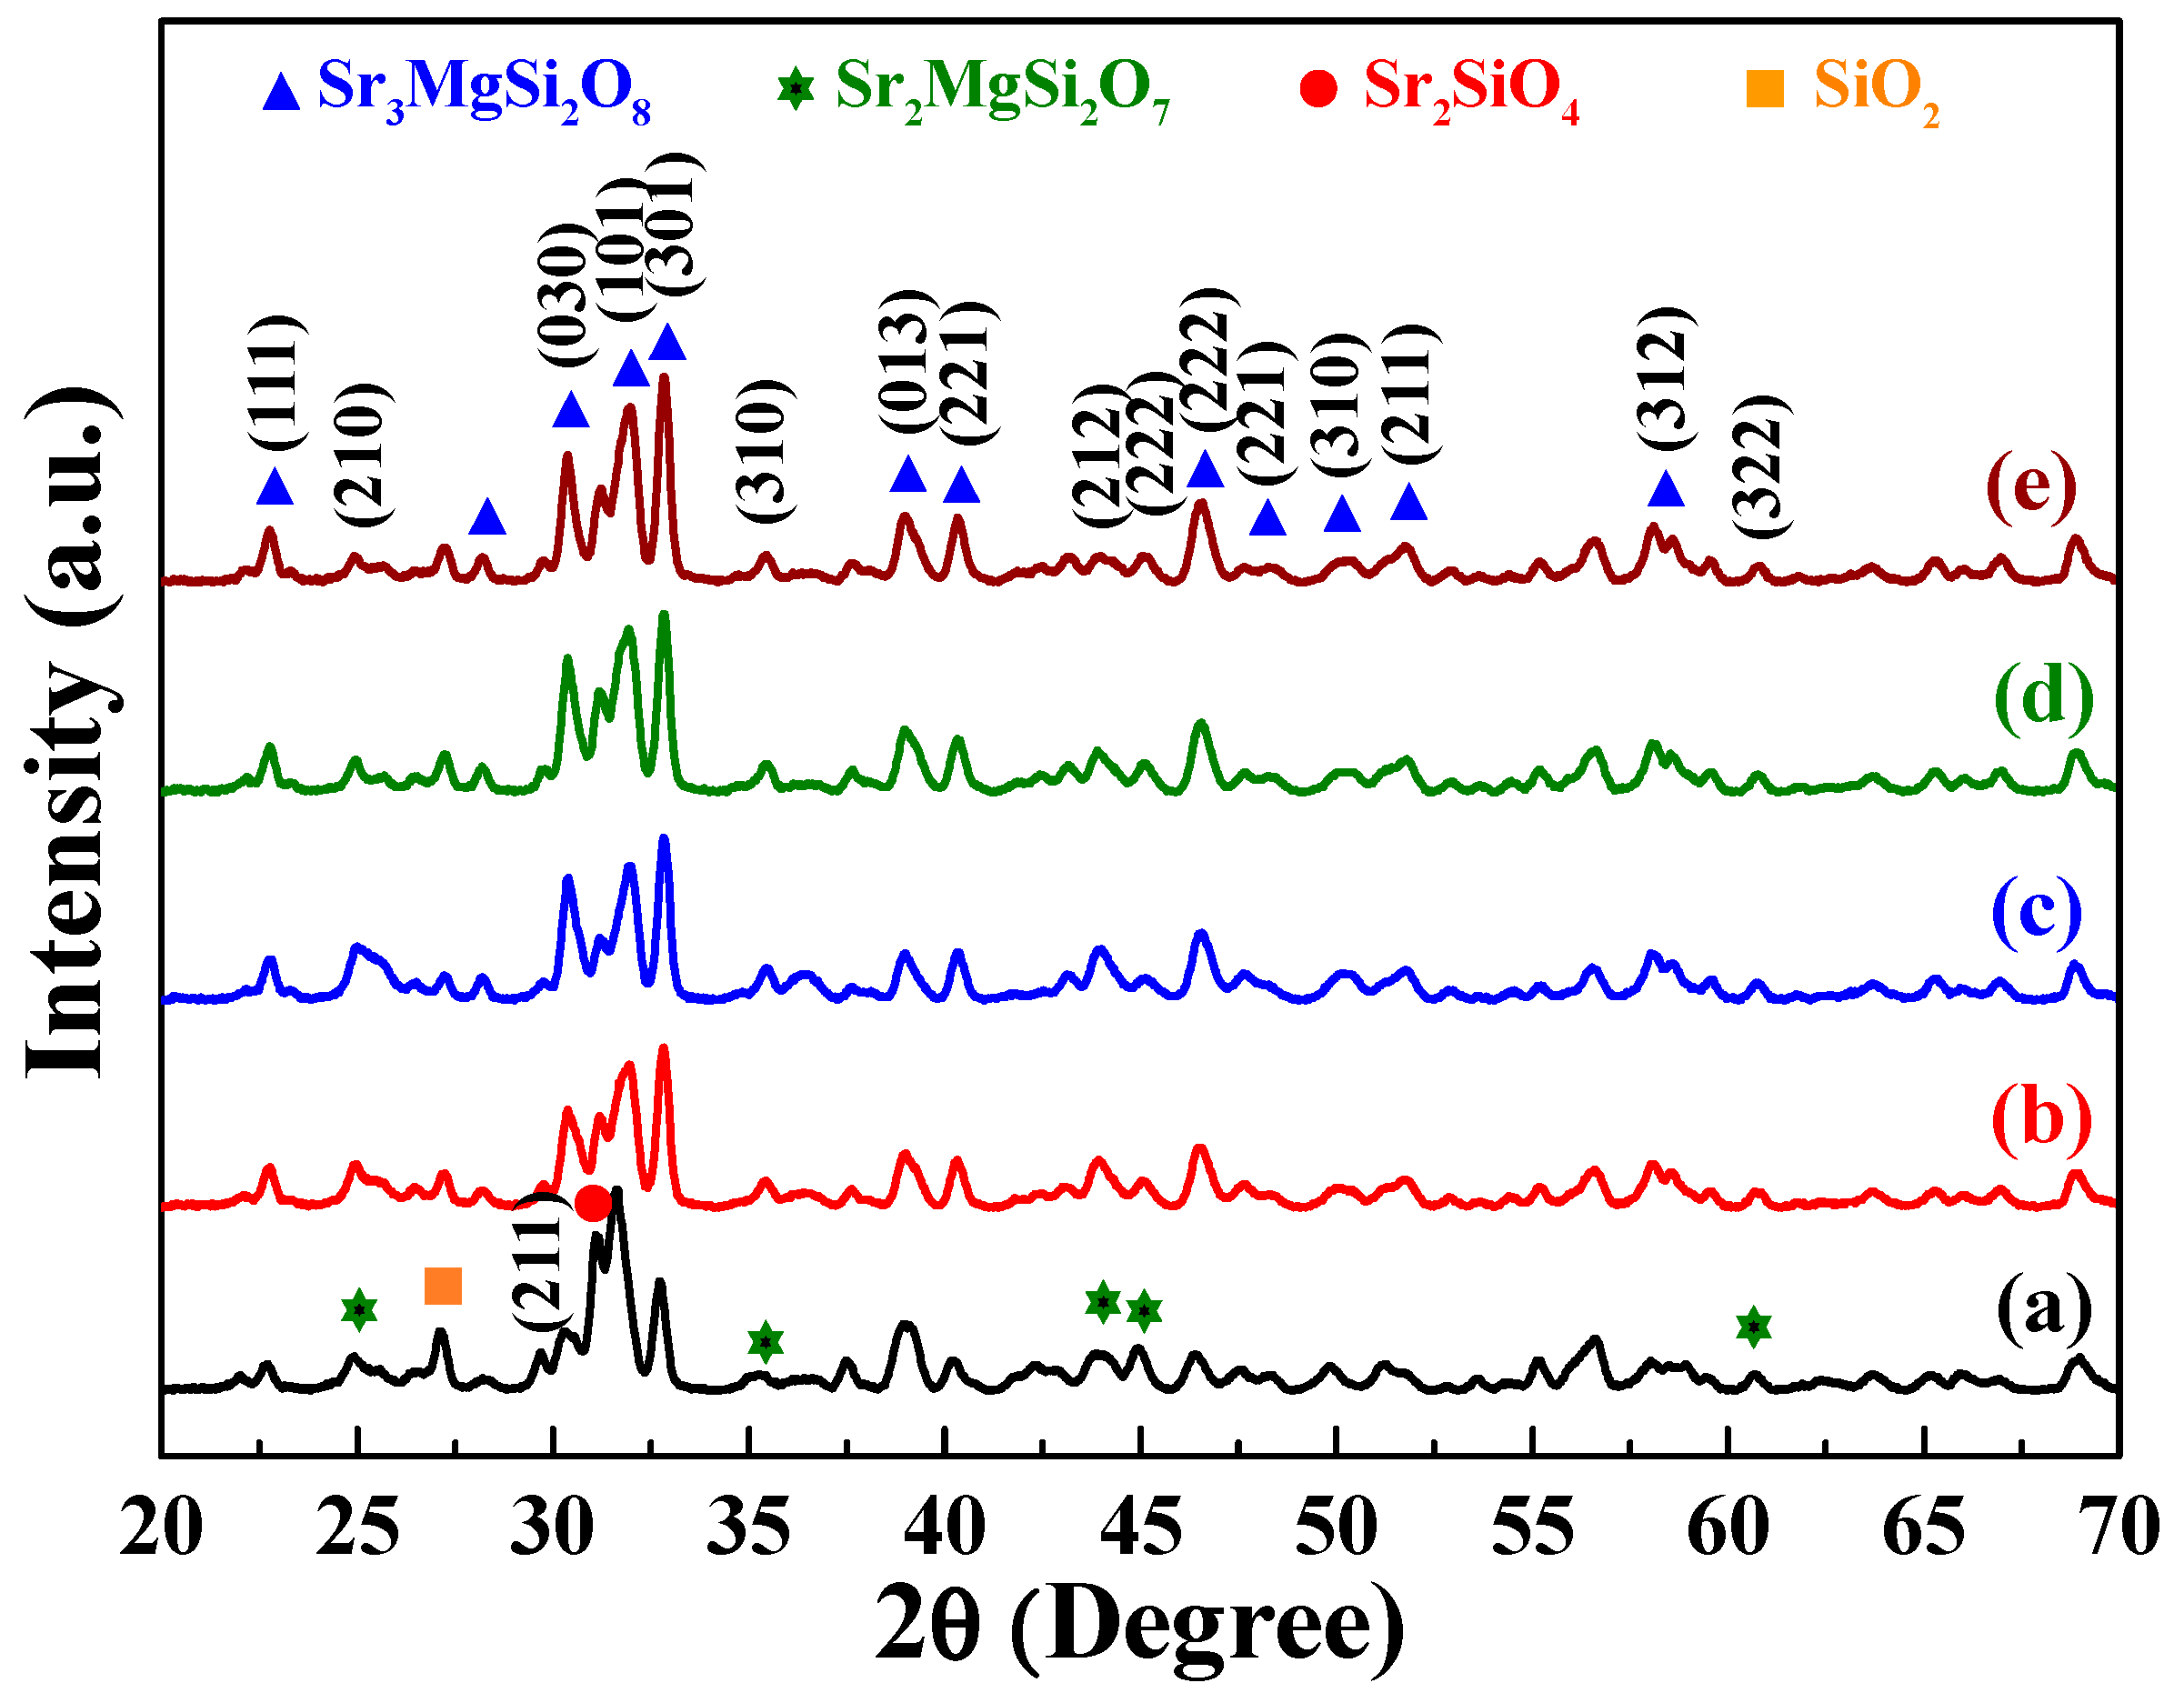
Figure 1 shows the diffraction peaks of the [Sr
0.99Eu
0.01]
3MgSi
2O
8 phosphors sintered at 1300 °C for different durations. These phosphors exhibited diffraction peaks at 2
θ values of 22.7°, 28.1°, 30.4°, 31.9°, 32.8°, 38.9°, 40.4°, 46.5°, 48.2°, 50.1°, 51.8°, 58.1°, 59.5°, and 60.8°. These characteristic peaks suggest that the aforementioned phosphors had a monoclinic structure (
a ≠
b ≠
c,
α =
β =
γ = 90°, P2
1/a space group). In addition, the 2
θ values of 24.9°, 31.1°, 35.4°, 43.9°, 45.1°, and 60.7° indicated the presence of the Sr
2MgSi
2O
7 phase (JCPDS No. 75-1736) and α-Sr
2SiO
4 phase (JCPDS No. 39-1256). No Eu
2O
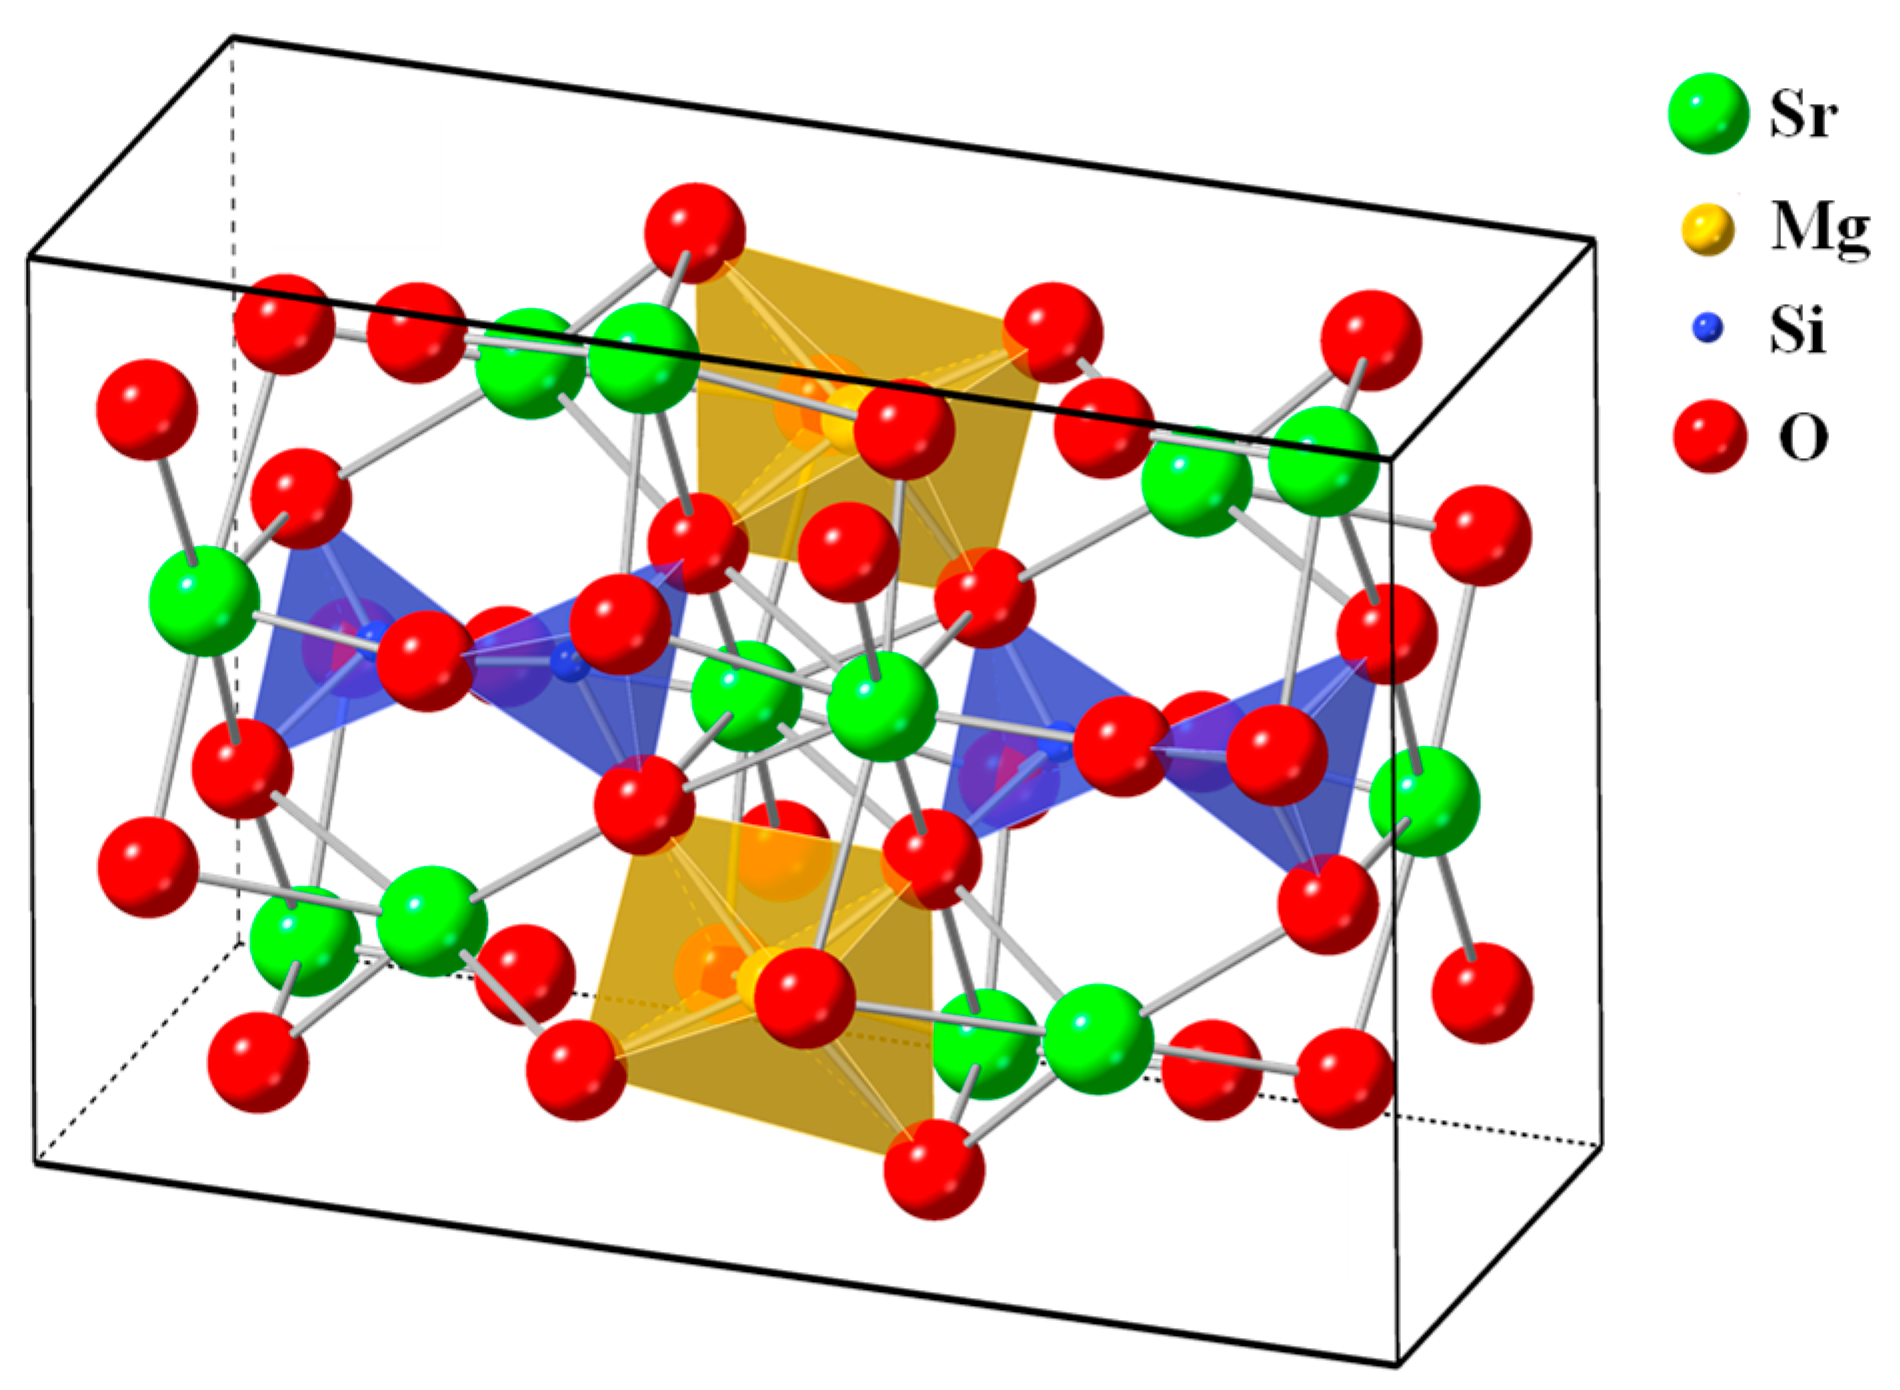
3 compound was found in the phosphors. As displayed in
Figure 2, in the phosphors, each Si atom was surrounded by four oxygen atoms, which resulted in the formation of a four-coordination [SiO
4] tetrahedral structure. Moreover, each Mg atom was surrounded by six oxygen atoms, which resulted in the formation of a [MgO
6] octahedron. A Sr atom could occupy three available sites, which were located in different crystallographic environments.
The Sr(I), Sr(II), and Sr(III) sites exhibited ten-coordination, eight-coordination, and nine-coordination, respectively. Eu
2+-doped [Sr
1−xEu
x]
3MgSi
2O
8 phosphors were obtained by reducing Eu
3+ ions to Eu
2+ ions in a reducing atmosphere during the sintering process. The ionic radius of Sr
2+ is 1.01 Å, which is close to that of Eu
2+ (1.12 Å). Mg
2+ and Si
4+ have smaller ionic radii (0.72 and 0.40 Å, respectively) than does Sr
2+. Therefore, the diffraction peaks of Eu
2O
3 were not observed, which demonstrated that Eu
2+ ions could be doped into the [Sr
0.99Eu
0.01]
3MgSi
2O
8 lattice because of the similar ionic radii and valence of Sr
2+ and Eu
2+. As displayed in
Figure 1, the intensity of the [Sr
0.99Eu
0.01]
3MgSi
2O
8 signal increased as the sintering time increased from 1 to 10 h. Moreover, the intensities of the α-Sr
2SiO
4 and Sr
2MgSi
2O
7 signals decreased with sintering time. Because the α-Sr
2SiO
4 and Sr
2MgSi
2O
7 phases were formed within short sintering times or relatively low sintering temperatures, the [Sr
0.99Eu
0.01]
3MgSi
2O
8 phosphors exhibited better crystalline structures at longer sintering times.
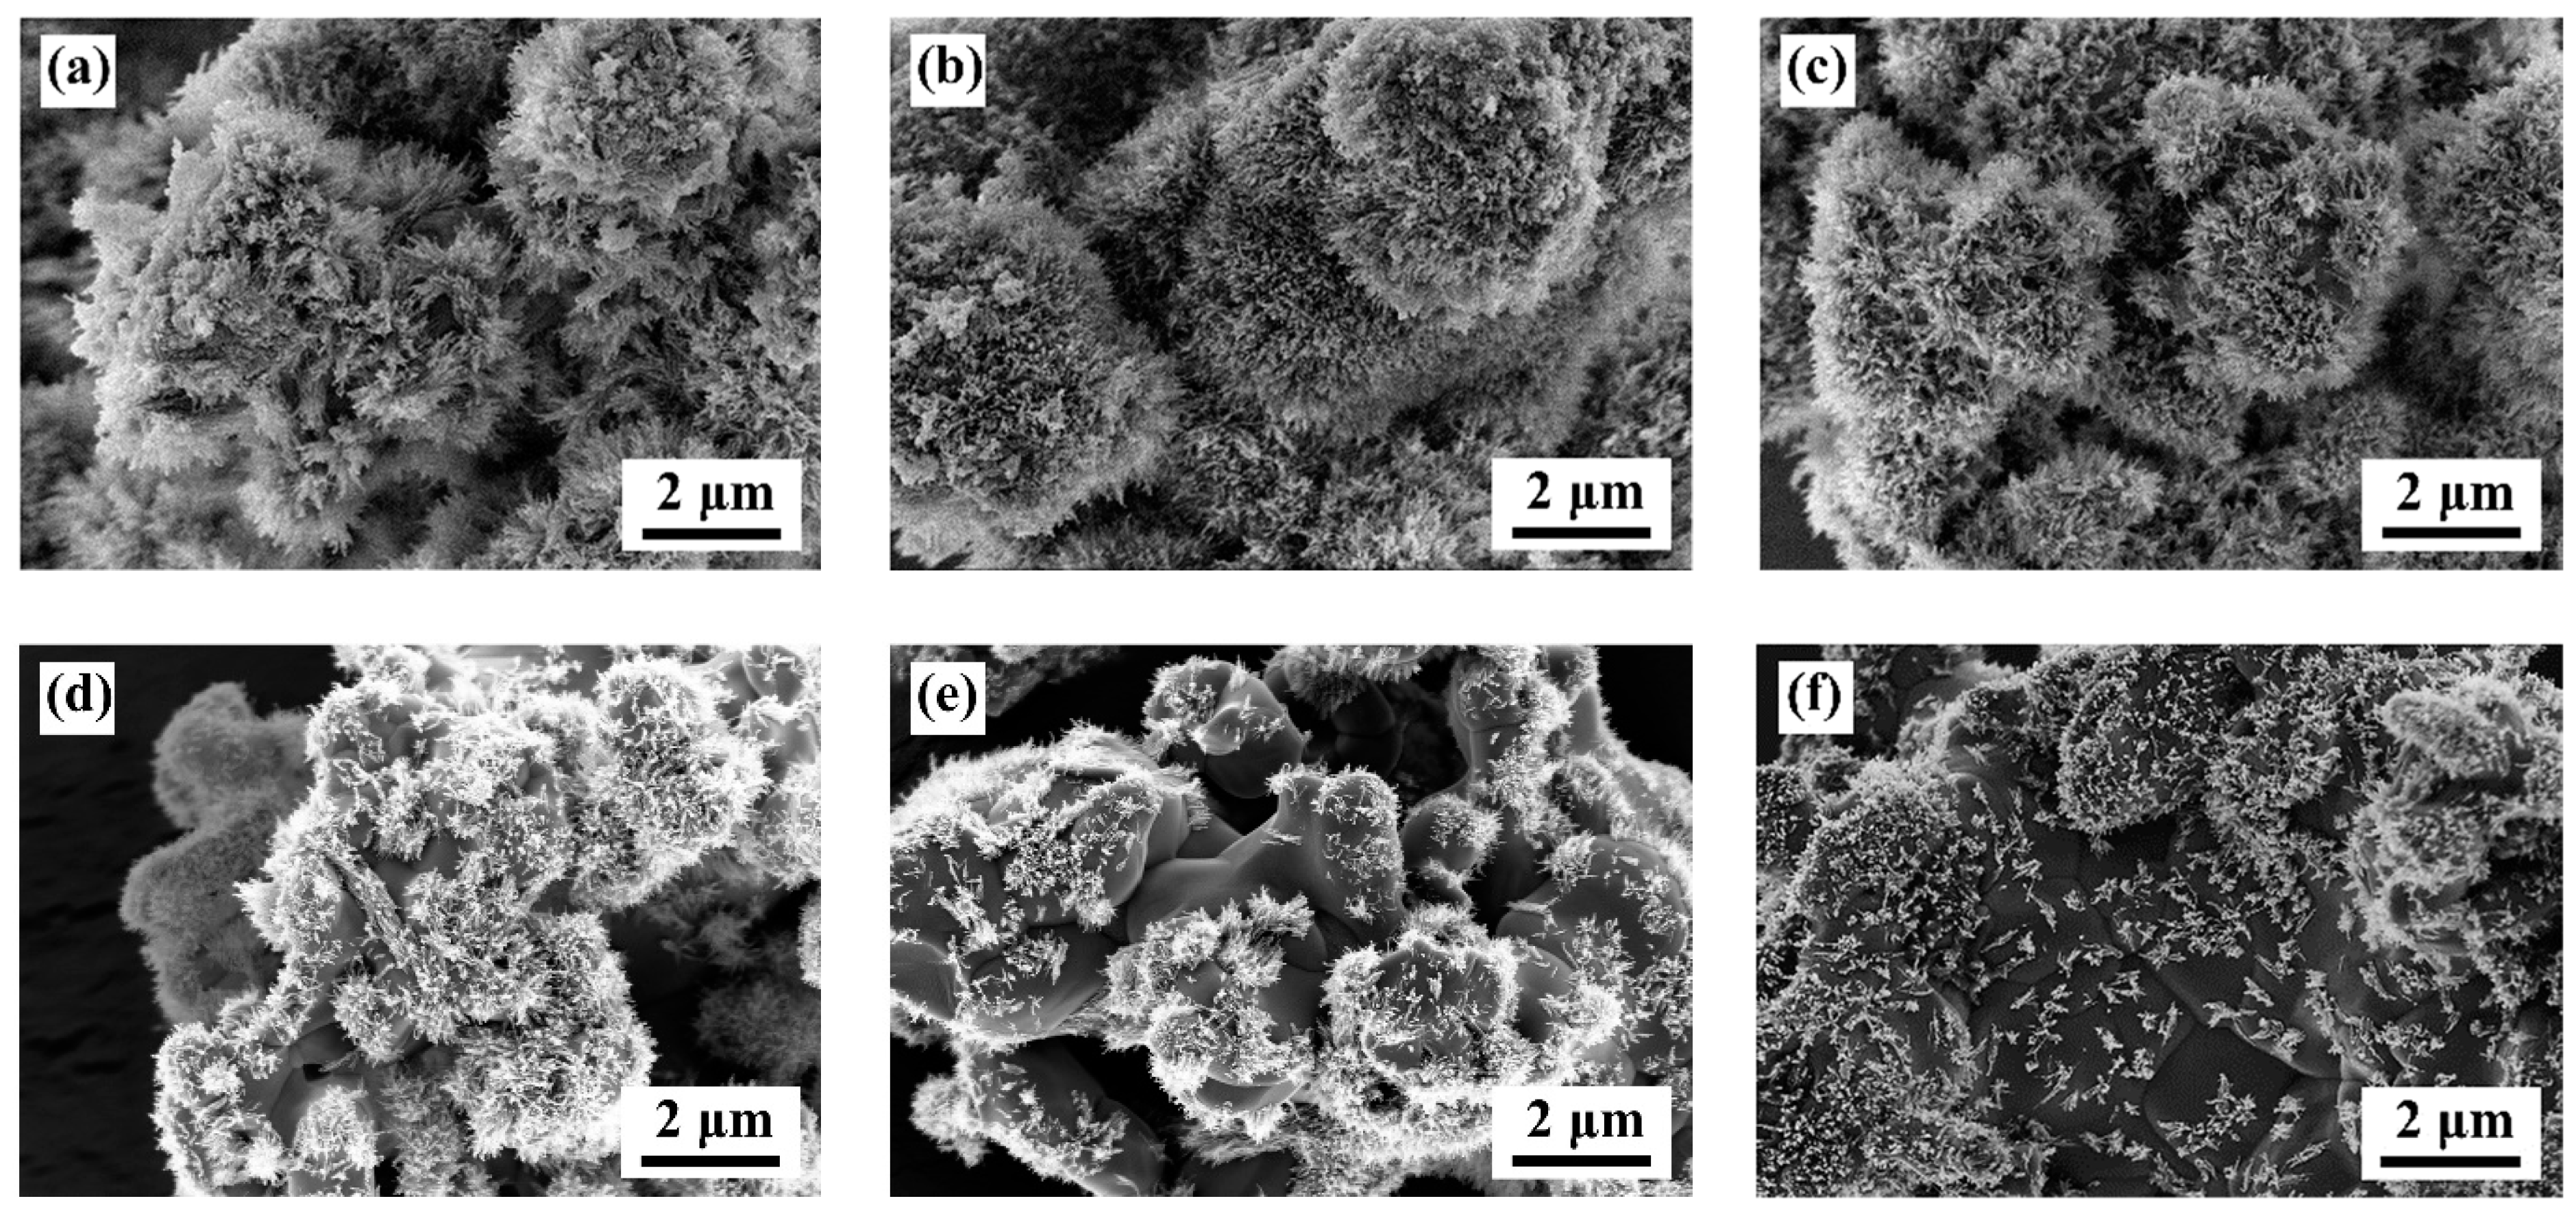
Figure 3 displays the FE-SEM images of the [Sr
0.99Eu
0.01]
3MgSi
2O
8 phosphors sintered at 1300 °C for different durations. When the sintering time was 1 h, the synthesized [Sr
0.99Eu
0.01]
3MgSi
2O
8 phosphors exhibited a special surface morphology. The particles of these phosphors appeared similar to
Clavularia viridis, which is a coral species, and exhibited many fine hairs on their surface. The number of fine hairs on the particle surface decreased as the sintering time increased from 1 to 6 h. In addition, to understand the microstructure of the fine hair, the prepared [Sr
0.99Eu
0.01]
3MgSi
2O
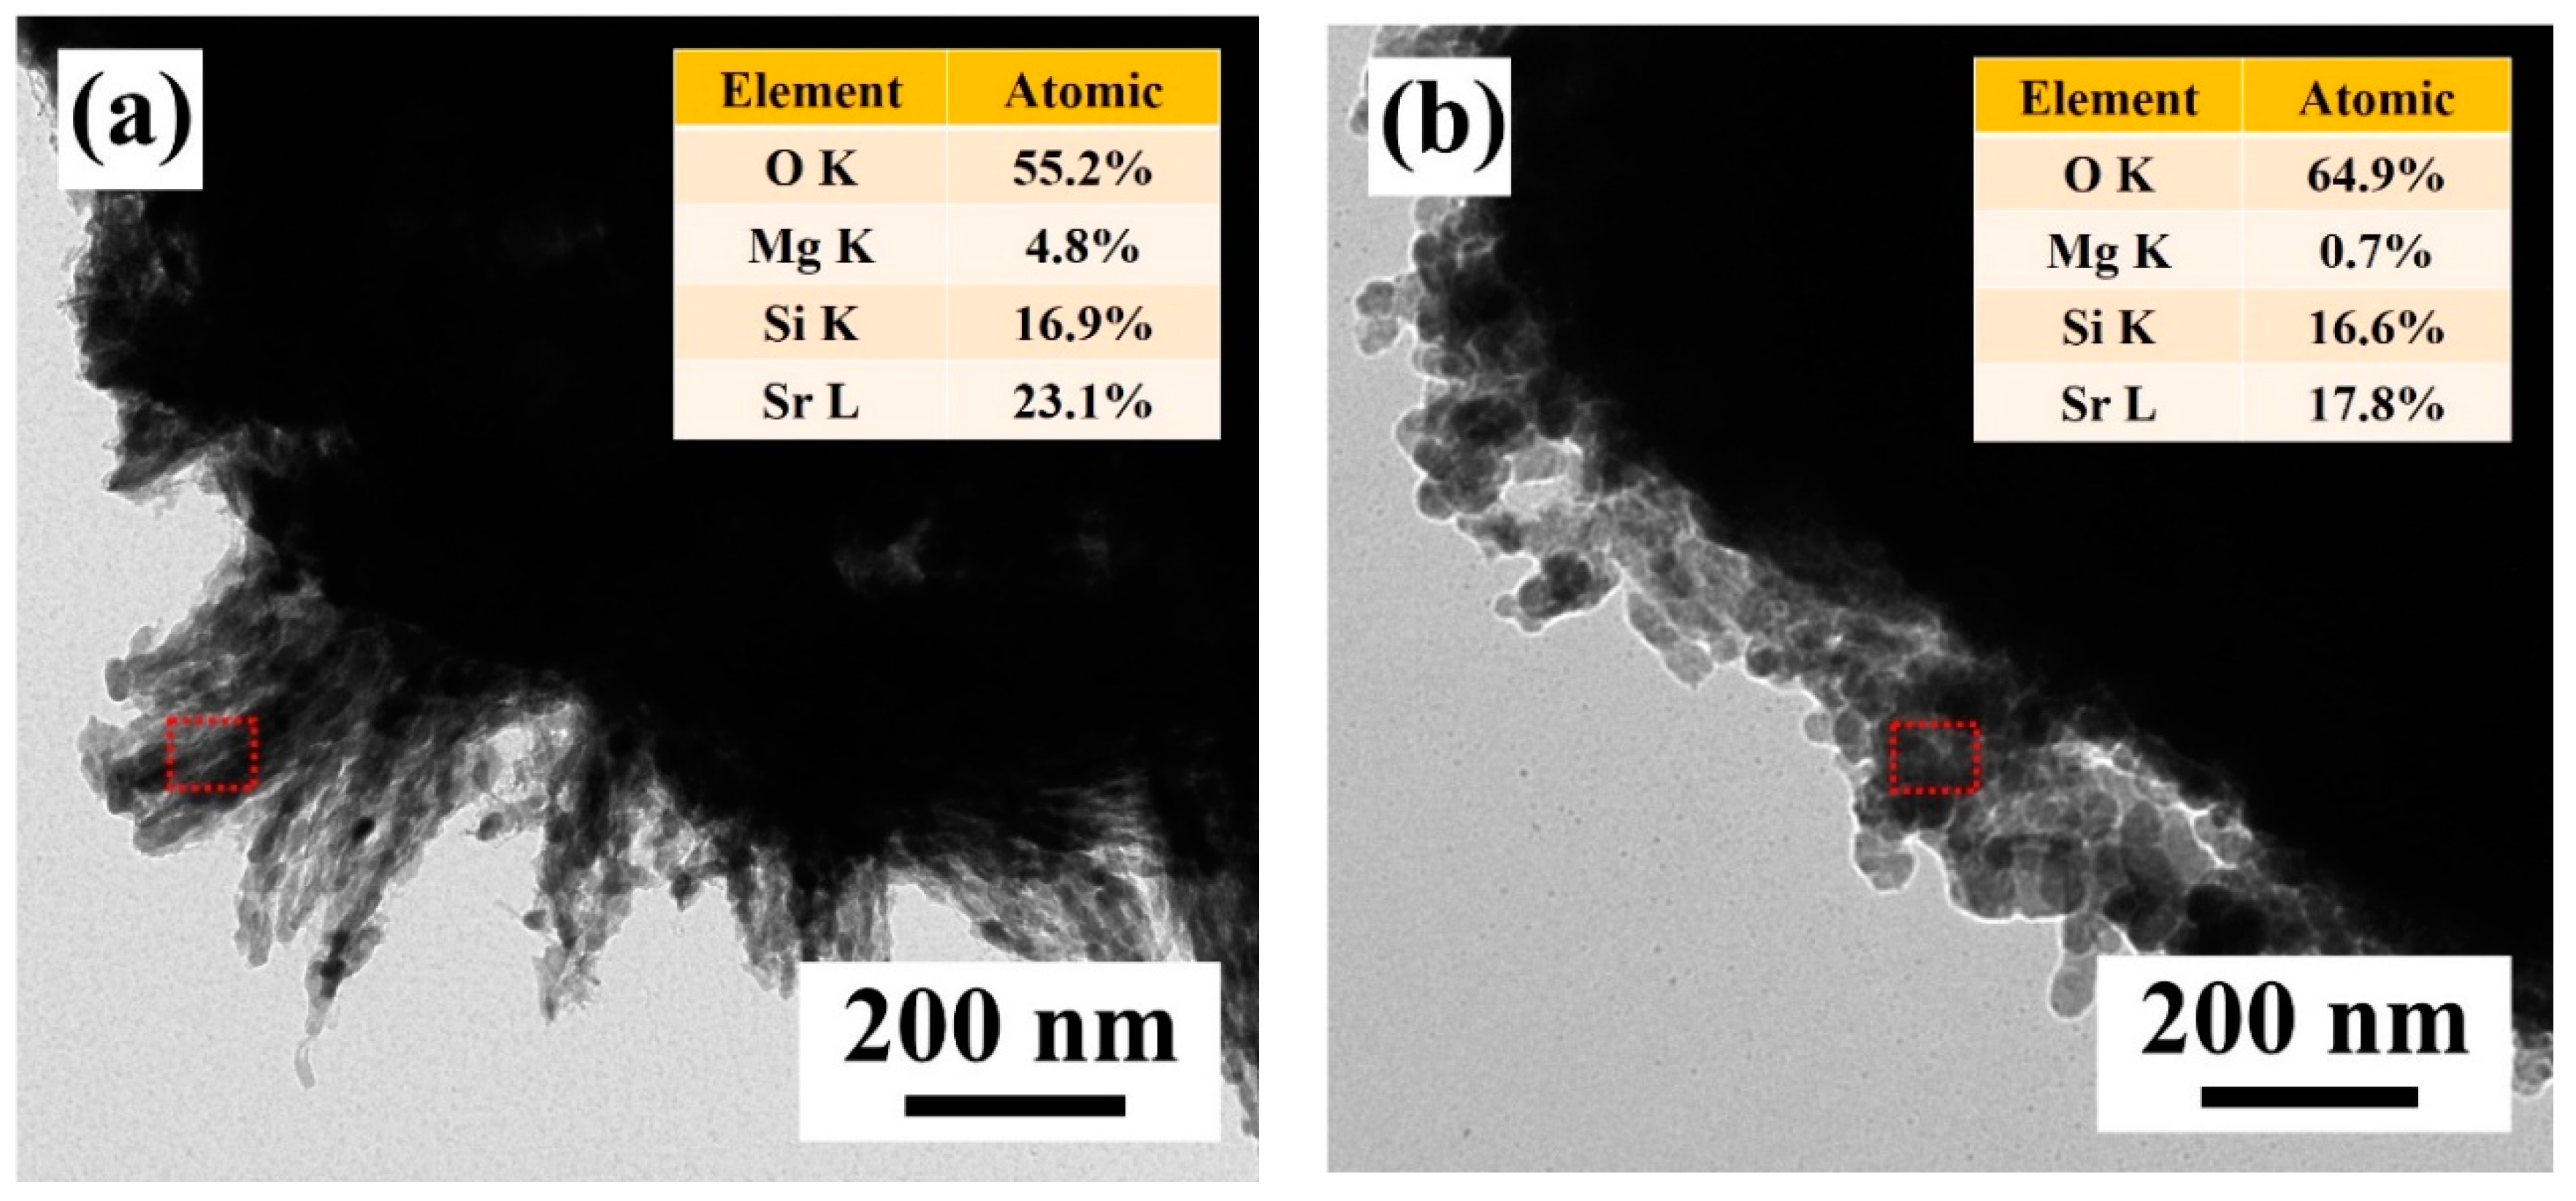
8 phosphors were subjected to HR-TEM and energy dispersive X-ray spectroscopy (EDS) analyses (
Figure 4). At a sintering time of 1 h, the atomic percentages of Sr, Mg, Si, and O in the fine hairs were 25.1%, 27.9%, 1.8%, and 45.2%, respectively. On the basis of this information and the XRD results (
Figure 1), we infer that the Sr
2SiO
4 and Sr
2MgSi
2O
7 phases were present in the fine hairs at a sintering time of 1 h. The element distribution images of the [Sr
0.99Eu
0.01]
3MgSi
2O
8 phosphors are shown in
Figure S1. The resulting presence of Sr, Si, and Mg can be found, and the element content was similar to the HR-TEM/EDS result (
Figure 4). At a sintering time of 5 h, the fine hairs contained Sr, Mg, Si, and O, which indicates that the Sr
2MgSi
2O
7 phase was present in the fine hairs at a sintering time of 5 h, almost the same as the detected atomic percentage and nominal compositions in quantity. The SEM images of the [Sr
0.99Eu
0.01]
3MgSi
2O
8 phosphors sintered for different durations, whose BET specific surface area were 18.4 m
2/g, 13.5 m
2/g, 9.4 m
2/g, 7.2 m
2/g, 5.8 m
2/g, and 2.5 m
2/g, respectively, as shown in
Figure 3a–f.
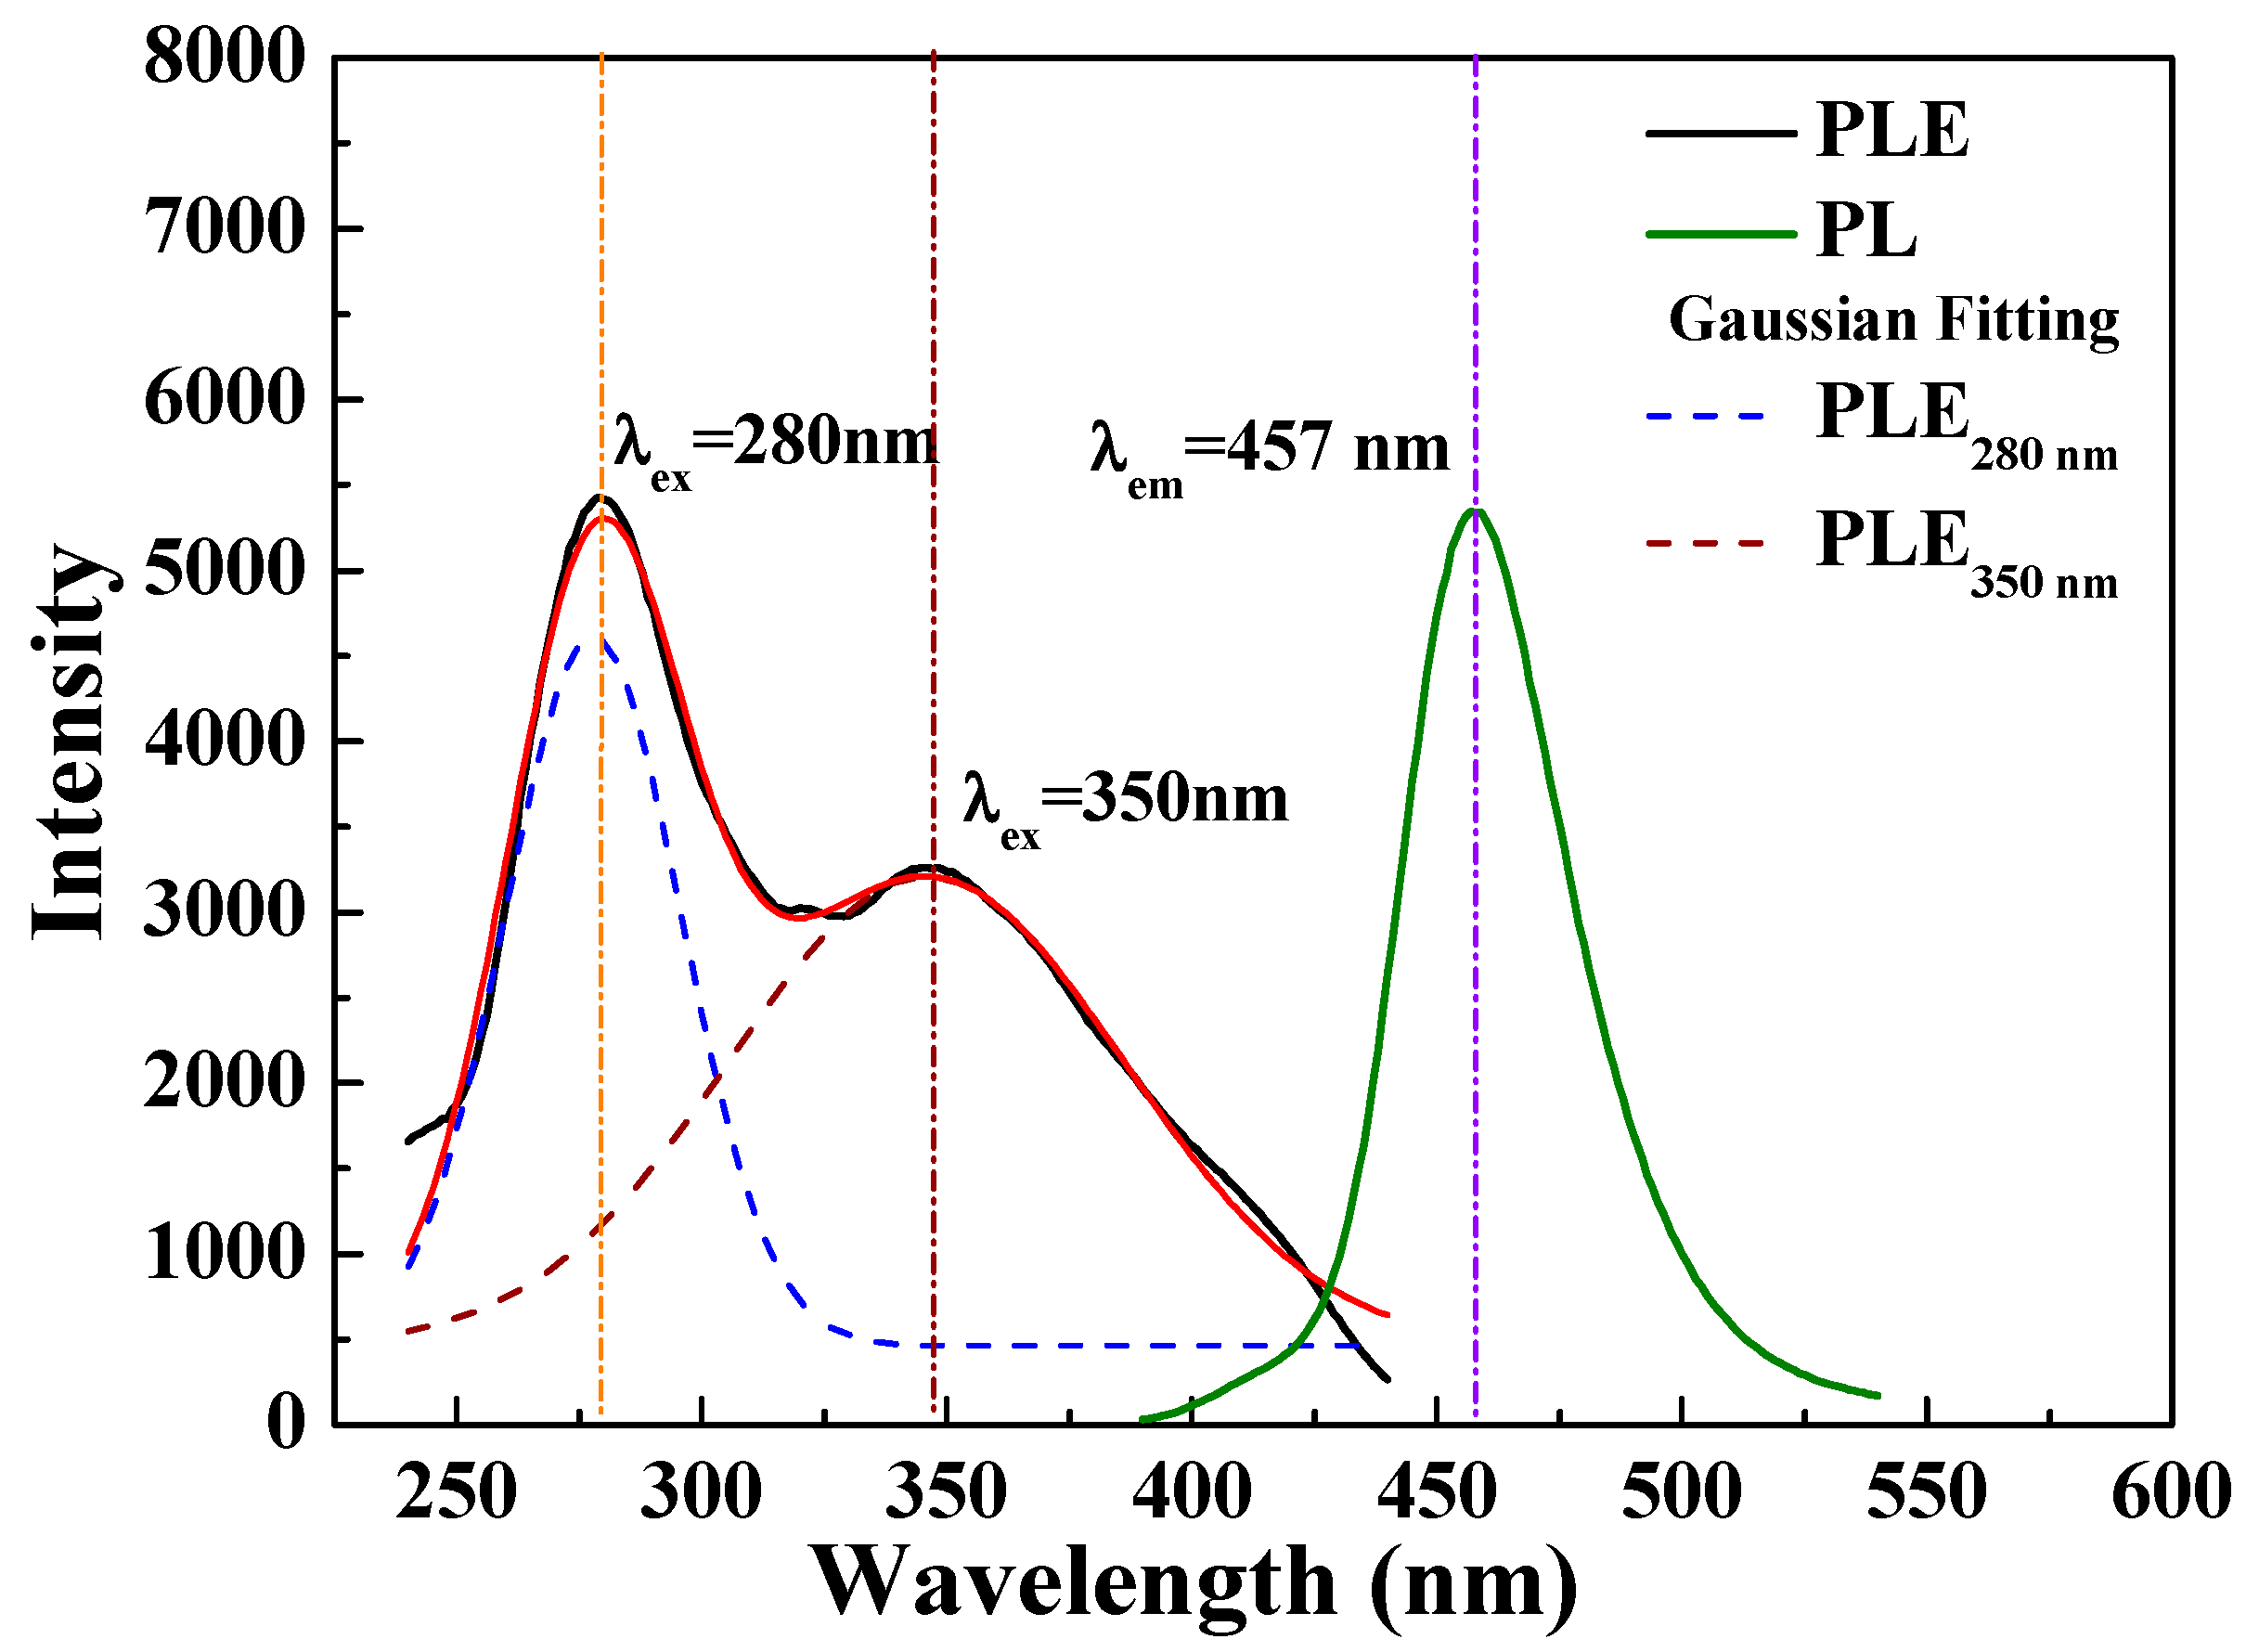
Figure 5 displays the PLE and PL spectra of the [Sr
0.99Eu
0.01]
3MgSi
2O
8 phosphors sintered at 1300 °C for 5 h. The Eu
2+ excitation band of the [Sr
0.99Eu
0.01]
3MgSi
2O
8 phosphors can be fitted into two Gaussian components with peaks at 280 and 350 nm, which correspond to the 4f
7(
8S
7/2)→4f
65d
1(t
2g) electron transition of Eu
2+ [
26].
Figure S2 shows the PLE spectra of the [Sr
0.99Eu
0.01]
3MgSi
2O
8 phosphors sintered for different durations. These spectra exhibit two broad bands ranging from 240 to 320 nm and from 330 to 410 nm, with peaks at 280 and 350 nm, which are assigned to the transitions between the ground state 4f
7 and the crystal-field split state 4f
65d
1. As the sintering time increased, the excitation intensity increased and reached a maximum value at a sintering time of 5 h. The aforementioned results demonstrate that as the sintering duration increased from 1 to 5 h, the crystallinity (
Figure 1), particle morphologies and sizes (
Figure 3), and PLE intensities of the phosphors increased.
Figure S3 shows the PL spectra of the [Sr
0.99Eu
0.01]
3MgSi
2O
8 phosphors sintered at 1300 °C for different durations. The emission spectra corresponding to 280 nm excitation contain a single band at around 457 nm. As displayed in
Figure S2, the [Sr
0.99Eu
0.01]
3MgSi
2O
8 phosphors exhibited the highest emission peak intensities when the sintering duration was 5 h, the Sr
3MgSi
2O
8 has a space group of P21/a, and the unit cell contains three Sr sites: one 12-coordinated Sr(I) site and two 10-coordinated Sr(II, III) sites [
27]. The broad band at around 457 nm is attributed to the 4f
65d–4f
7 transition at the Sr
2+(I) site, where Sr
2+ is substituted by Eu
2+ [
28,
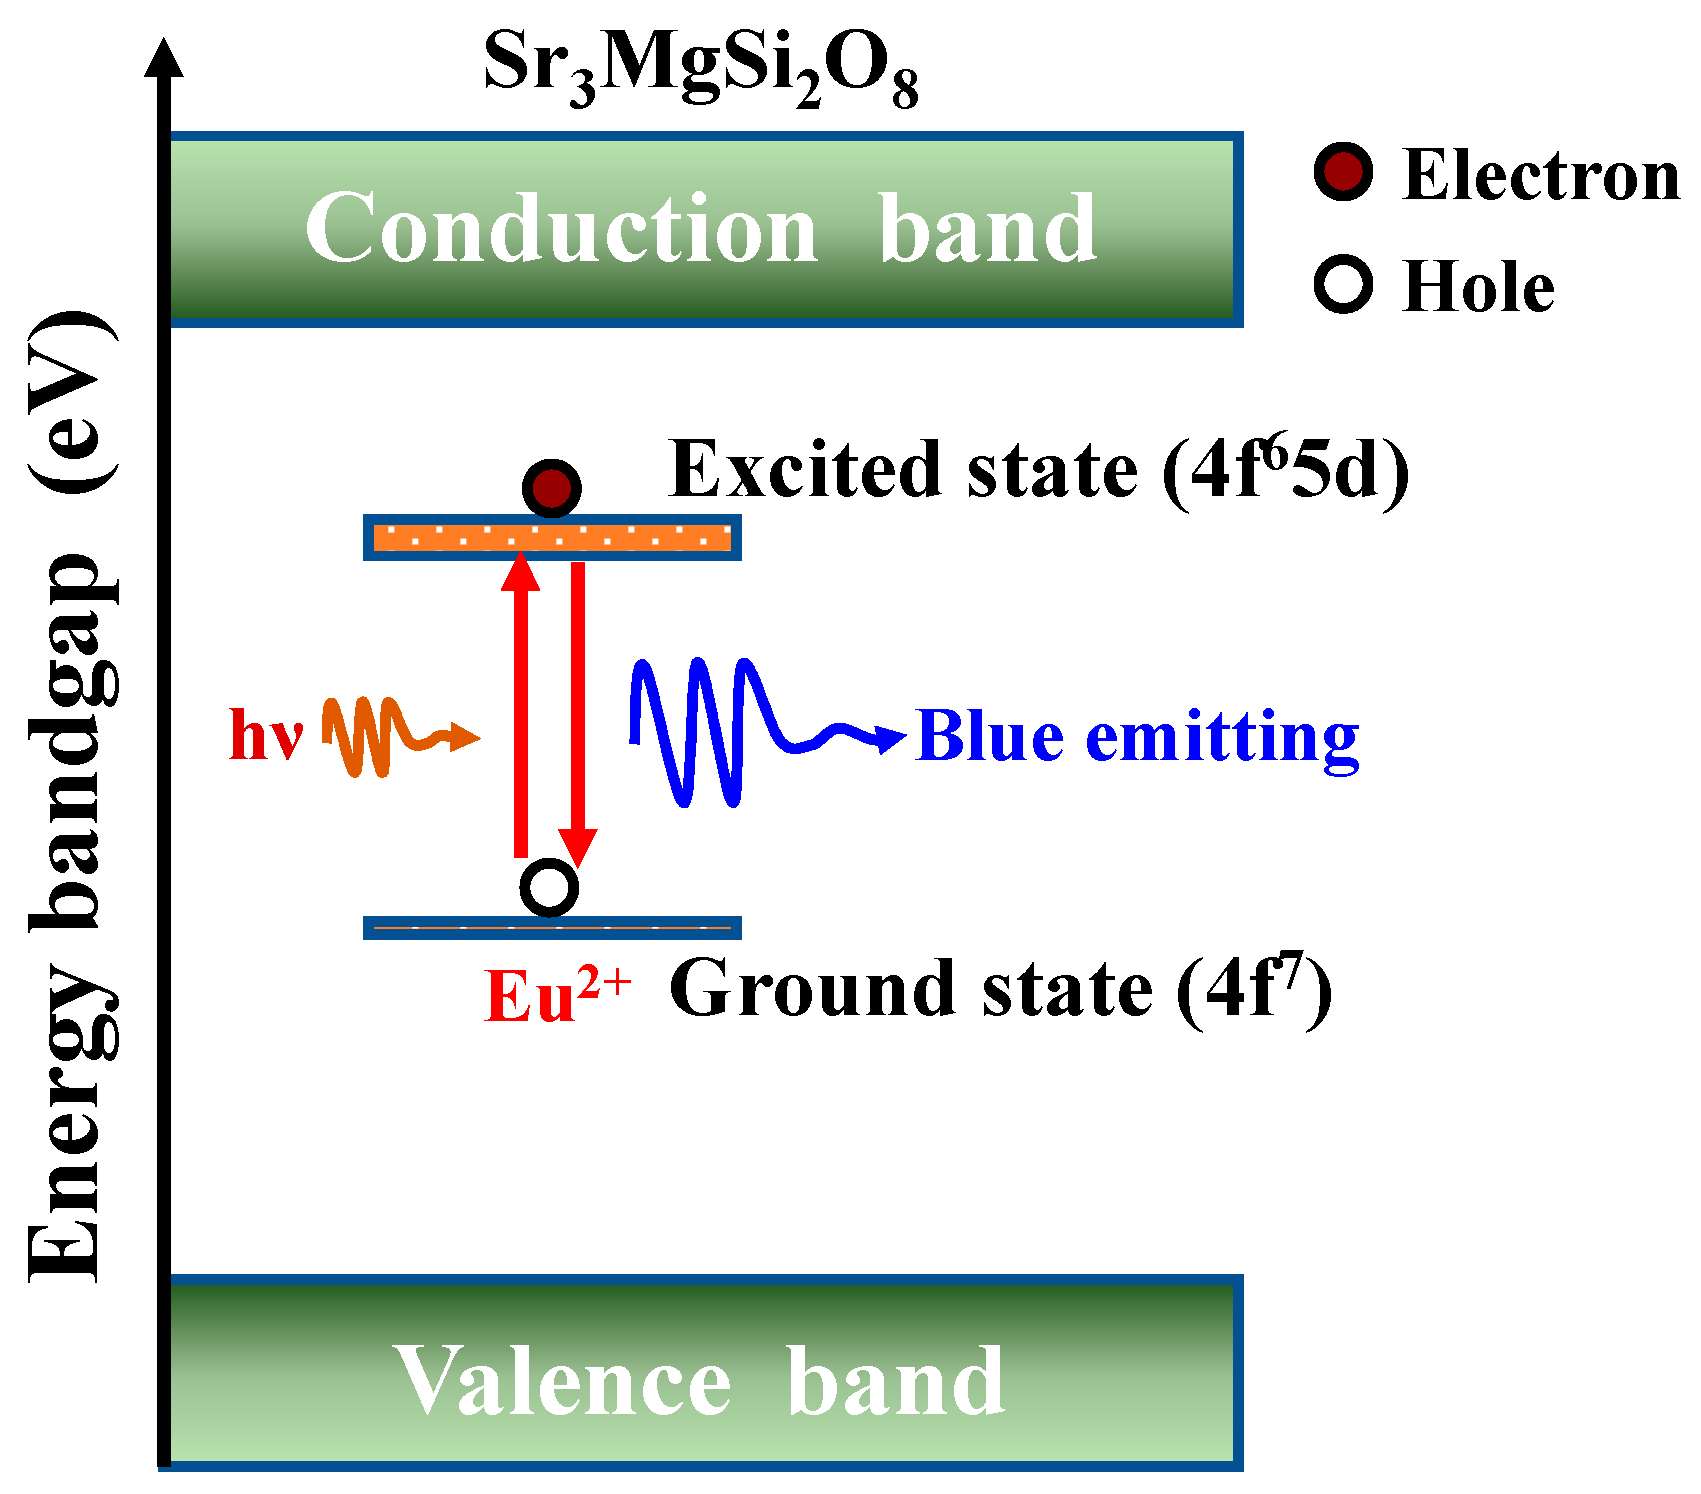
29]. The electronic mechanism of the [Sr
0.99Eu
0.01]
3MgSi
2O
8 phosphors is shown in
Figure 6. The 4f
65d–4f
7 transition belongs to the electronic dipole-allowed transition, based on the Laporte selection rule. Kim et al. indicated that the 570 nm band to Eu
2+ ions at the Sr
2+ (II, III) sites occurs at high Eu
2+ doping concentrations in Sr
3MgSi
2O
8 [
28].
Figure S2 does not indicate an emission peak at 570 nm; thus, only Eu
2+ ions substituted Sr
2+ at the Sr
2+(I) site. The full width at half maximum (FWHM) of the broad band of emission peaks were approximately 50, 46, 43, 41, and 40 nm as the sintered for 1 to 5 h. This result was caused by the electron on the outer 5
d-orbital of the atom, while the emission peak of the [Sr
0.99Eu
0.01]
3MgSi
2O
8 phosphors was easily influenced by the external environment.
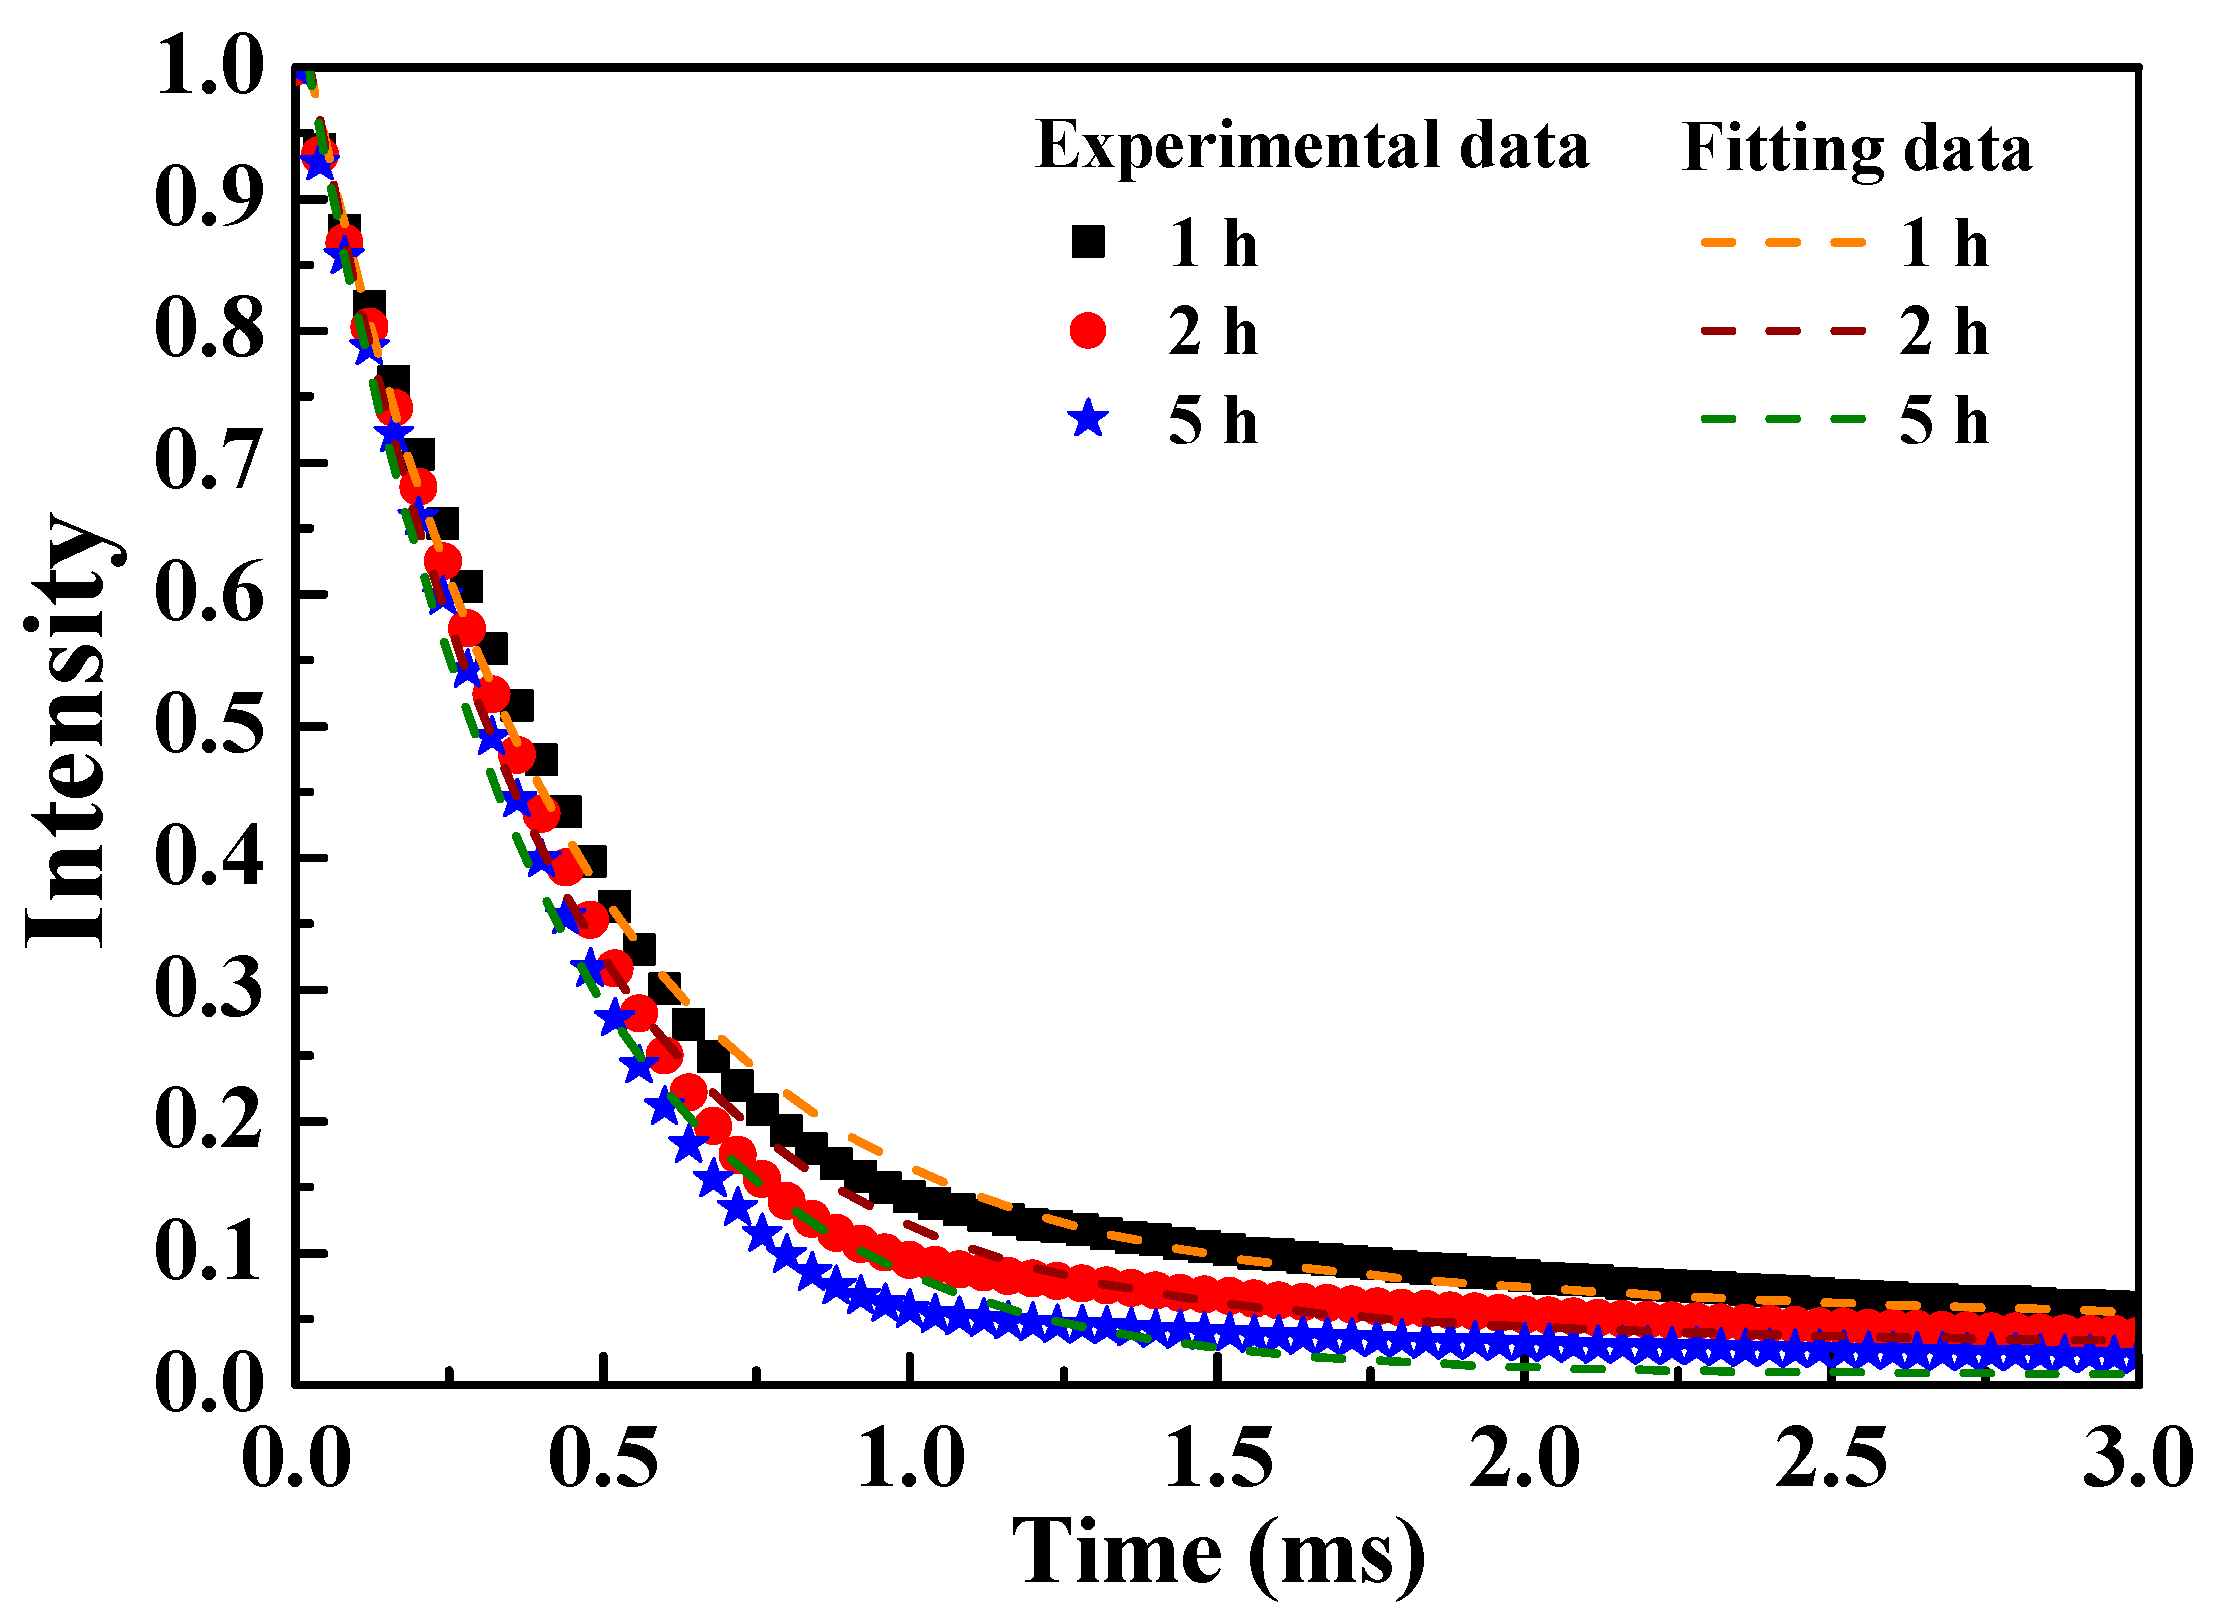
Figure 7 displays the fluorescent decay curves of the [Sr
0.99Eu
0.01]
3MgSi
2O
8 phosphors excited at 280 nm and monitored at 457 nm. These data fit well with a double-exponential curve. The aforementioned curves indicate the possible interactions between Eu
2+ ions and suggest that these ions occupied the cationic sites (Sr
2+). To calculate the luminescence lifetimes, all the fluorescent decay curves were fitted using the double-exponential equation of Sahu et al. [
30], which is expressed as follows:
where
I is the PL intensity,
A1 and
A2 are the fitting parameters, and
τ1 and
τ2 are the decay constants of the exponential components.
On the basis of the aforementioned equation, the average luminescence lifetimes (
τ*) of a rare-earth ion can be calculated using the following equation [
31]:
The average luminescence lifetimes of the [Sr
0.99Eu
0.01]
3MgSi
2O
8 phosphors were calculated to be 3.406, 3.191, and 1.143 ms for the sintering durations of 1, 2, and 5 h, respectively. The parameter
τ* decreased with sintering time. This phenomenon might be attributed to the energy transfer between the Eu
2+ ions located at the Sr
2+ sites [
32].
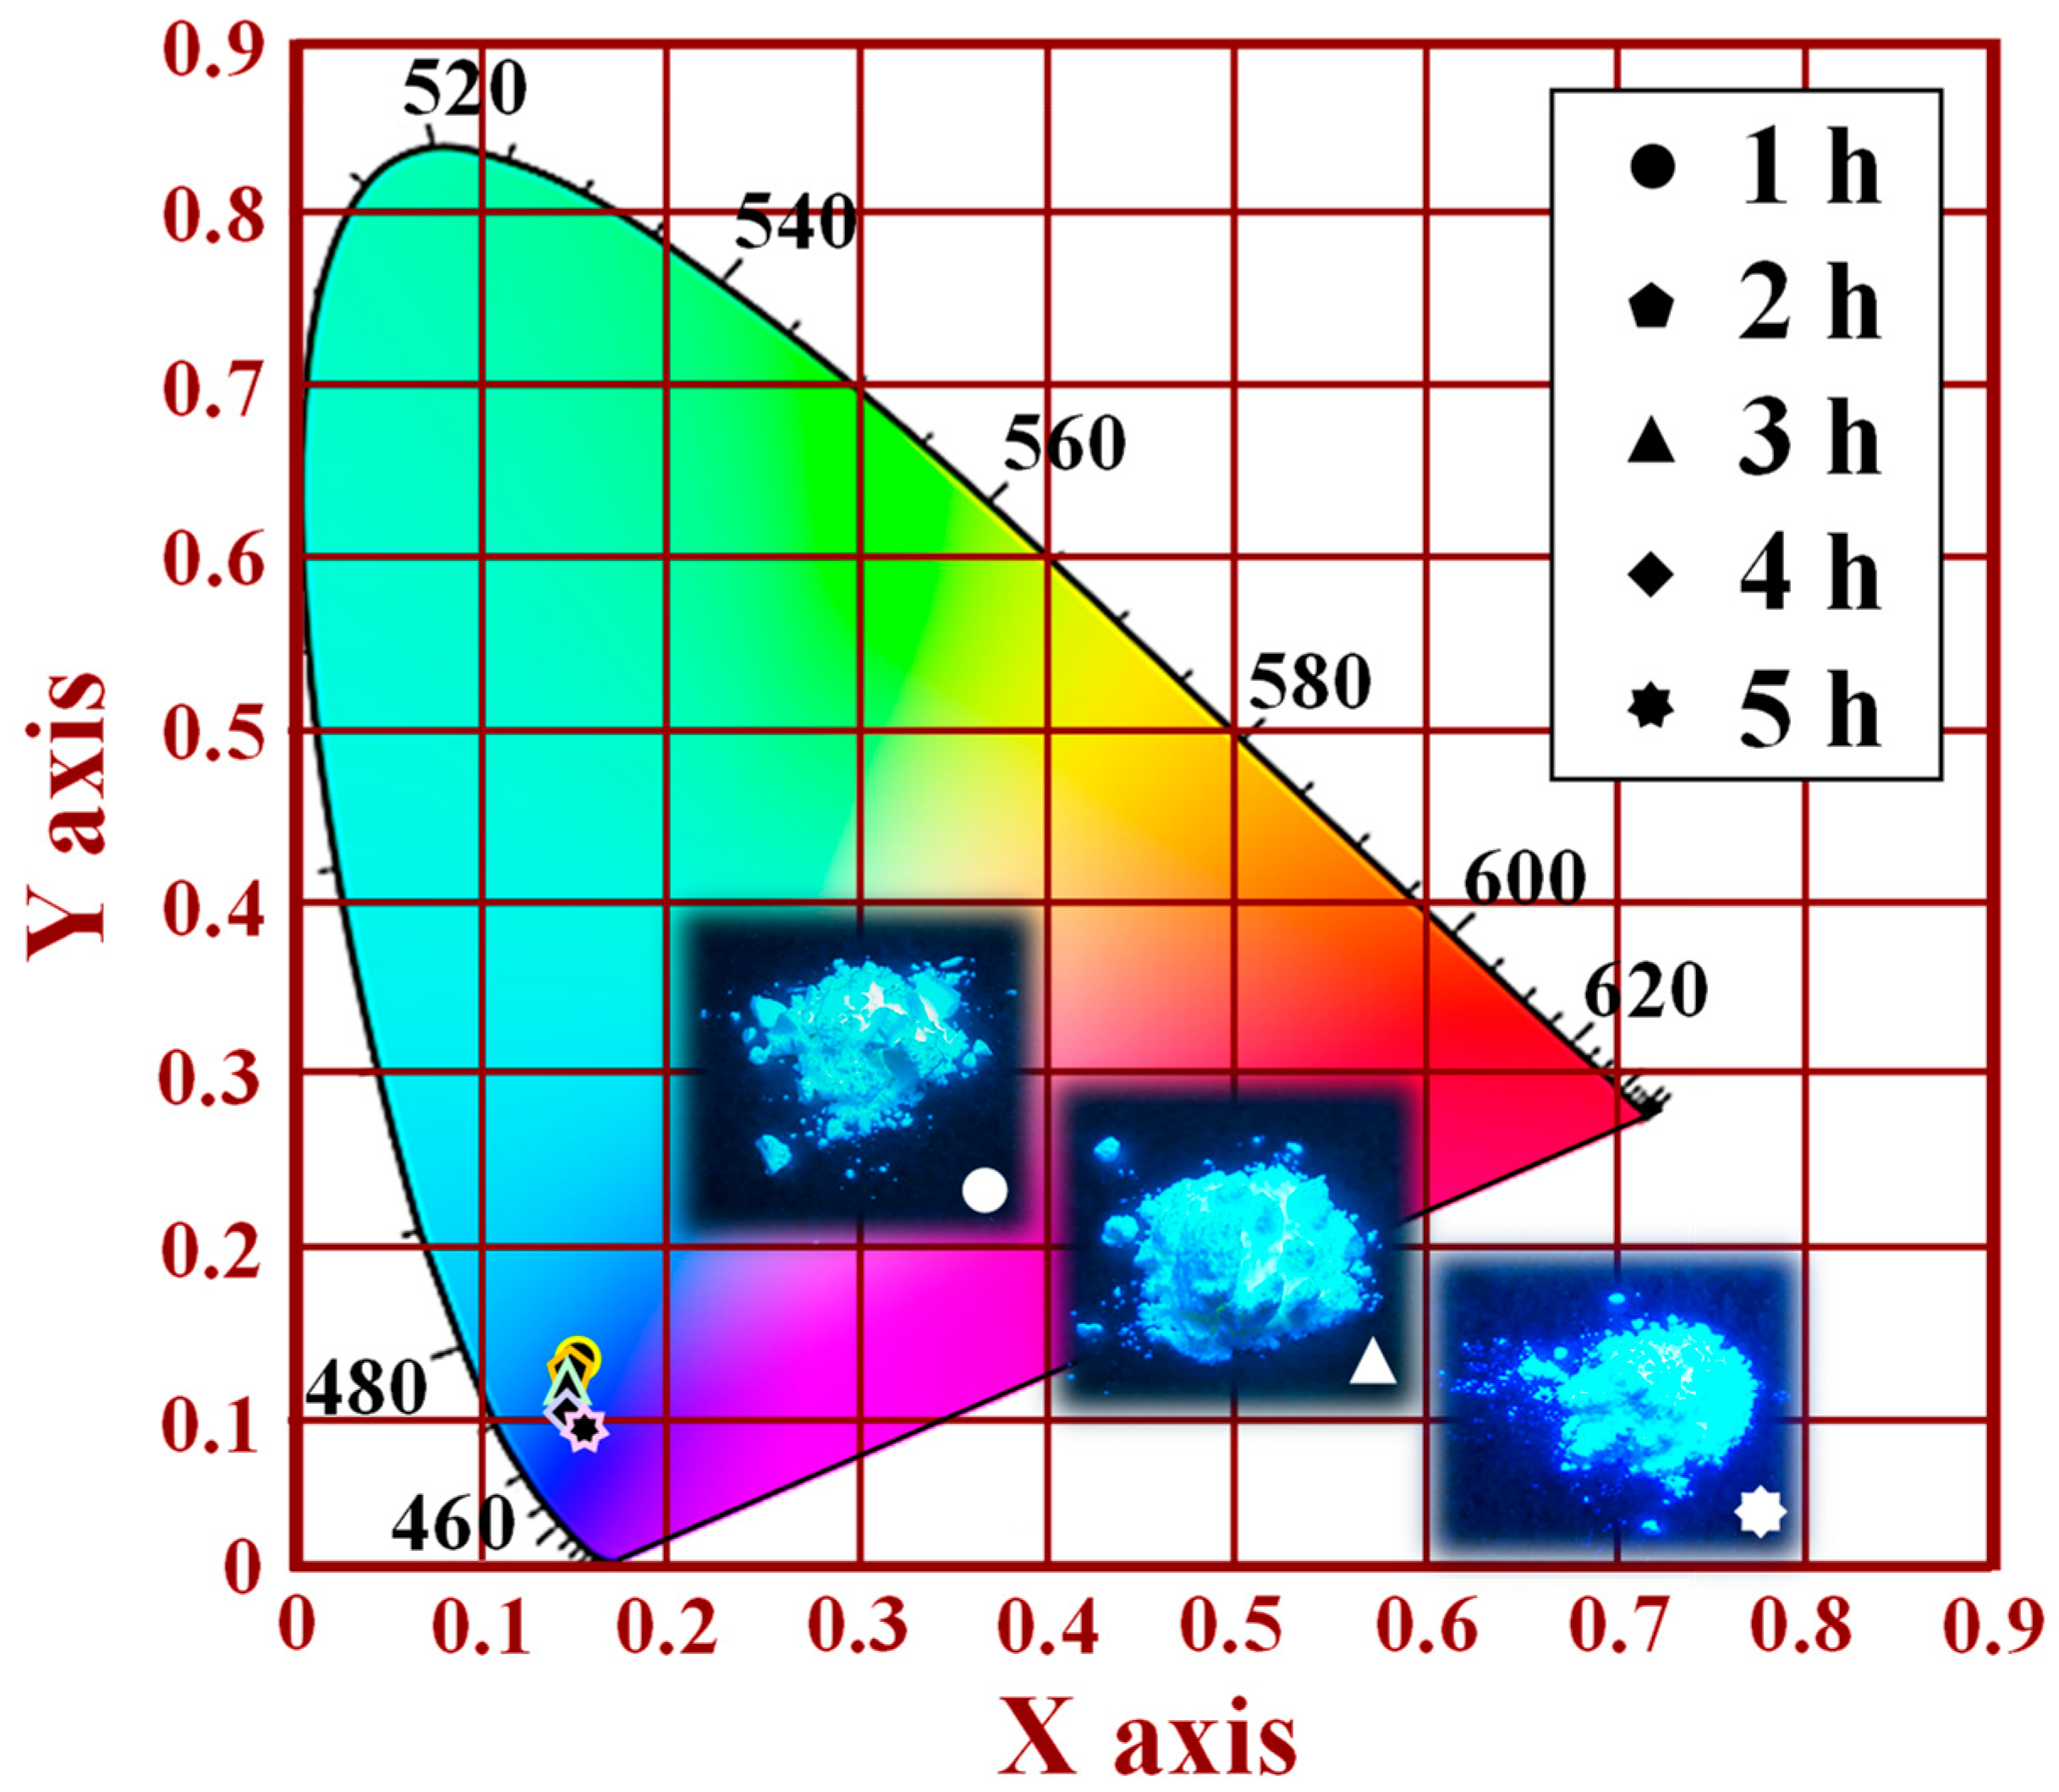
Figure 8 shows the CIE chromaticity results of the [Sr
0.99Eu
0.01]
3MgSi
2O
8 phosphors as a function of the sintering duration. The CIE (1931 chromaticity) diagram can be used to describe the color purity of the luminescent emissions of phosphors. In this study, a CIE chromaticity diagram was obtained for an excitation wavelength of 280 nm. The color coordinates of the [Sr
0.99Eu
0.01]
3MgSi
2O
8 phosphors sintered for 1, 2, 3, 4, and 5 h were (0.1659, 0.1382), (0.1612, 0.1256), (0.1593, 0.1211), (0.1549, 0.1111), and (0.1527, 0.1006), as displayed in
Figure 8. The CIE chromaticity diagram indicates that as the sintering duration increased from 1 to 5 h, the emissions of the [Sr
0.99Eu
0.01]
3MgSi
2O
8 phosphors changed from being light blue to navy blue. Thus, a sintering temperature of 1300 °C and a sintering duration of 5 h are optimal settings for the synthesis of a blue phosphor. The aforementioned results indicate that sintering duration is the main factor affecting the crystalline structure and PL properties of [Sr
0.99Eu
0.01]
3MgSi
2O
8 phosphors.
Images of the [Sr
0.99Eu
0.01]
3MgSi
2O
8 phosphors sintered for different durations under ultraviolet (UV) light irradiation are shown in the inset of
Figure 8 and in
Figure S4. The brightness of the [Sr
0.99Eu
0.01]
3MgSi
2O
8 phosphors increased with sintering duration. The phosphors sintered at 1300 °C for 5 h were very bright.
Sintering temperature affects the PL properties and structure of phosphors. Therefore, we attempted to determine the optimal sintering temperature for preparing [Sr
0.99Eu
0.01]
3MgSi
2O
8 phosphors. XRD patterns of the [Sr
0.99Eu
0.01]
3MgSi
2O
8 phosphors sintered using the solid-state method at temperatures of 1200, 1250, 1300, 1350 and 1400 °C for 5 h are depicted in
Figure 9.
Figure 9a shows the diffraction peaks of the phosphor sintered at 1200 °C. This phosphor exhibited main diffraction peaks at 2
θ values of 22.7°, 28.1°, 30.4°, 31.9°, 32.8°, 38.9°, 40.4°, 46.5°, 48.2°, 50.1°, 51.8°, 58.1°, 59.5°, and 60.8°. This set of XRD peaks is similar to that observed for Sr
3MgSi
2O
8 (JCPDS No. 10-0075). In addition, the [Sr
0.99Eu
0.01]
3MgSi
2O
8 phosphor contained the Sr
2MgSi
2O
7 (JCPDS No. 75-1736) and α-Sr
2SiO
4 (JCPDS No. 39-1256). The intensity of the [Sr
0.99Eu
0.01]
3MgSi
2O
8 signal increased with sintering temperature from 1200 to 1400 °C. Moreover, the intensities of the Sr
2MgSi
2O
7 and α-Sr
2SiO
4 signals decreased with sintering temperature.
The aforementioned results indicate that the row material of SrCO
3 decomposed into SrO and CO
2, then SrO reacted with SiO
2 to form Sr
2SiO
4, and finally SrO and MgO reacted with SiO
2 to form the Sr
2MgSi
2O
7 and Sr
3MgSi
2O
8 phases. When the sintering temperature was lower than 1000 °C, the following reaction occurred:
When the sintering temperature was between 1000 and 1200 °C, the following reaction occurred [
33,
34]:
When the sintering temperature was between 1200 and 1300 °C, the following reaction occurred [
35]:
At 1450 °C, the [Sr0.99Eu0.01]3MgSi2O8 phosphor melted. Consequently, the crystalline structures and PL properties of the [Sr0.99Eu0.01]3MgSi2O8 phosphors were not examined at sintering temperatures higher than 1450 °C.
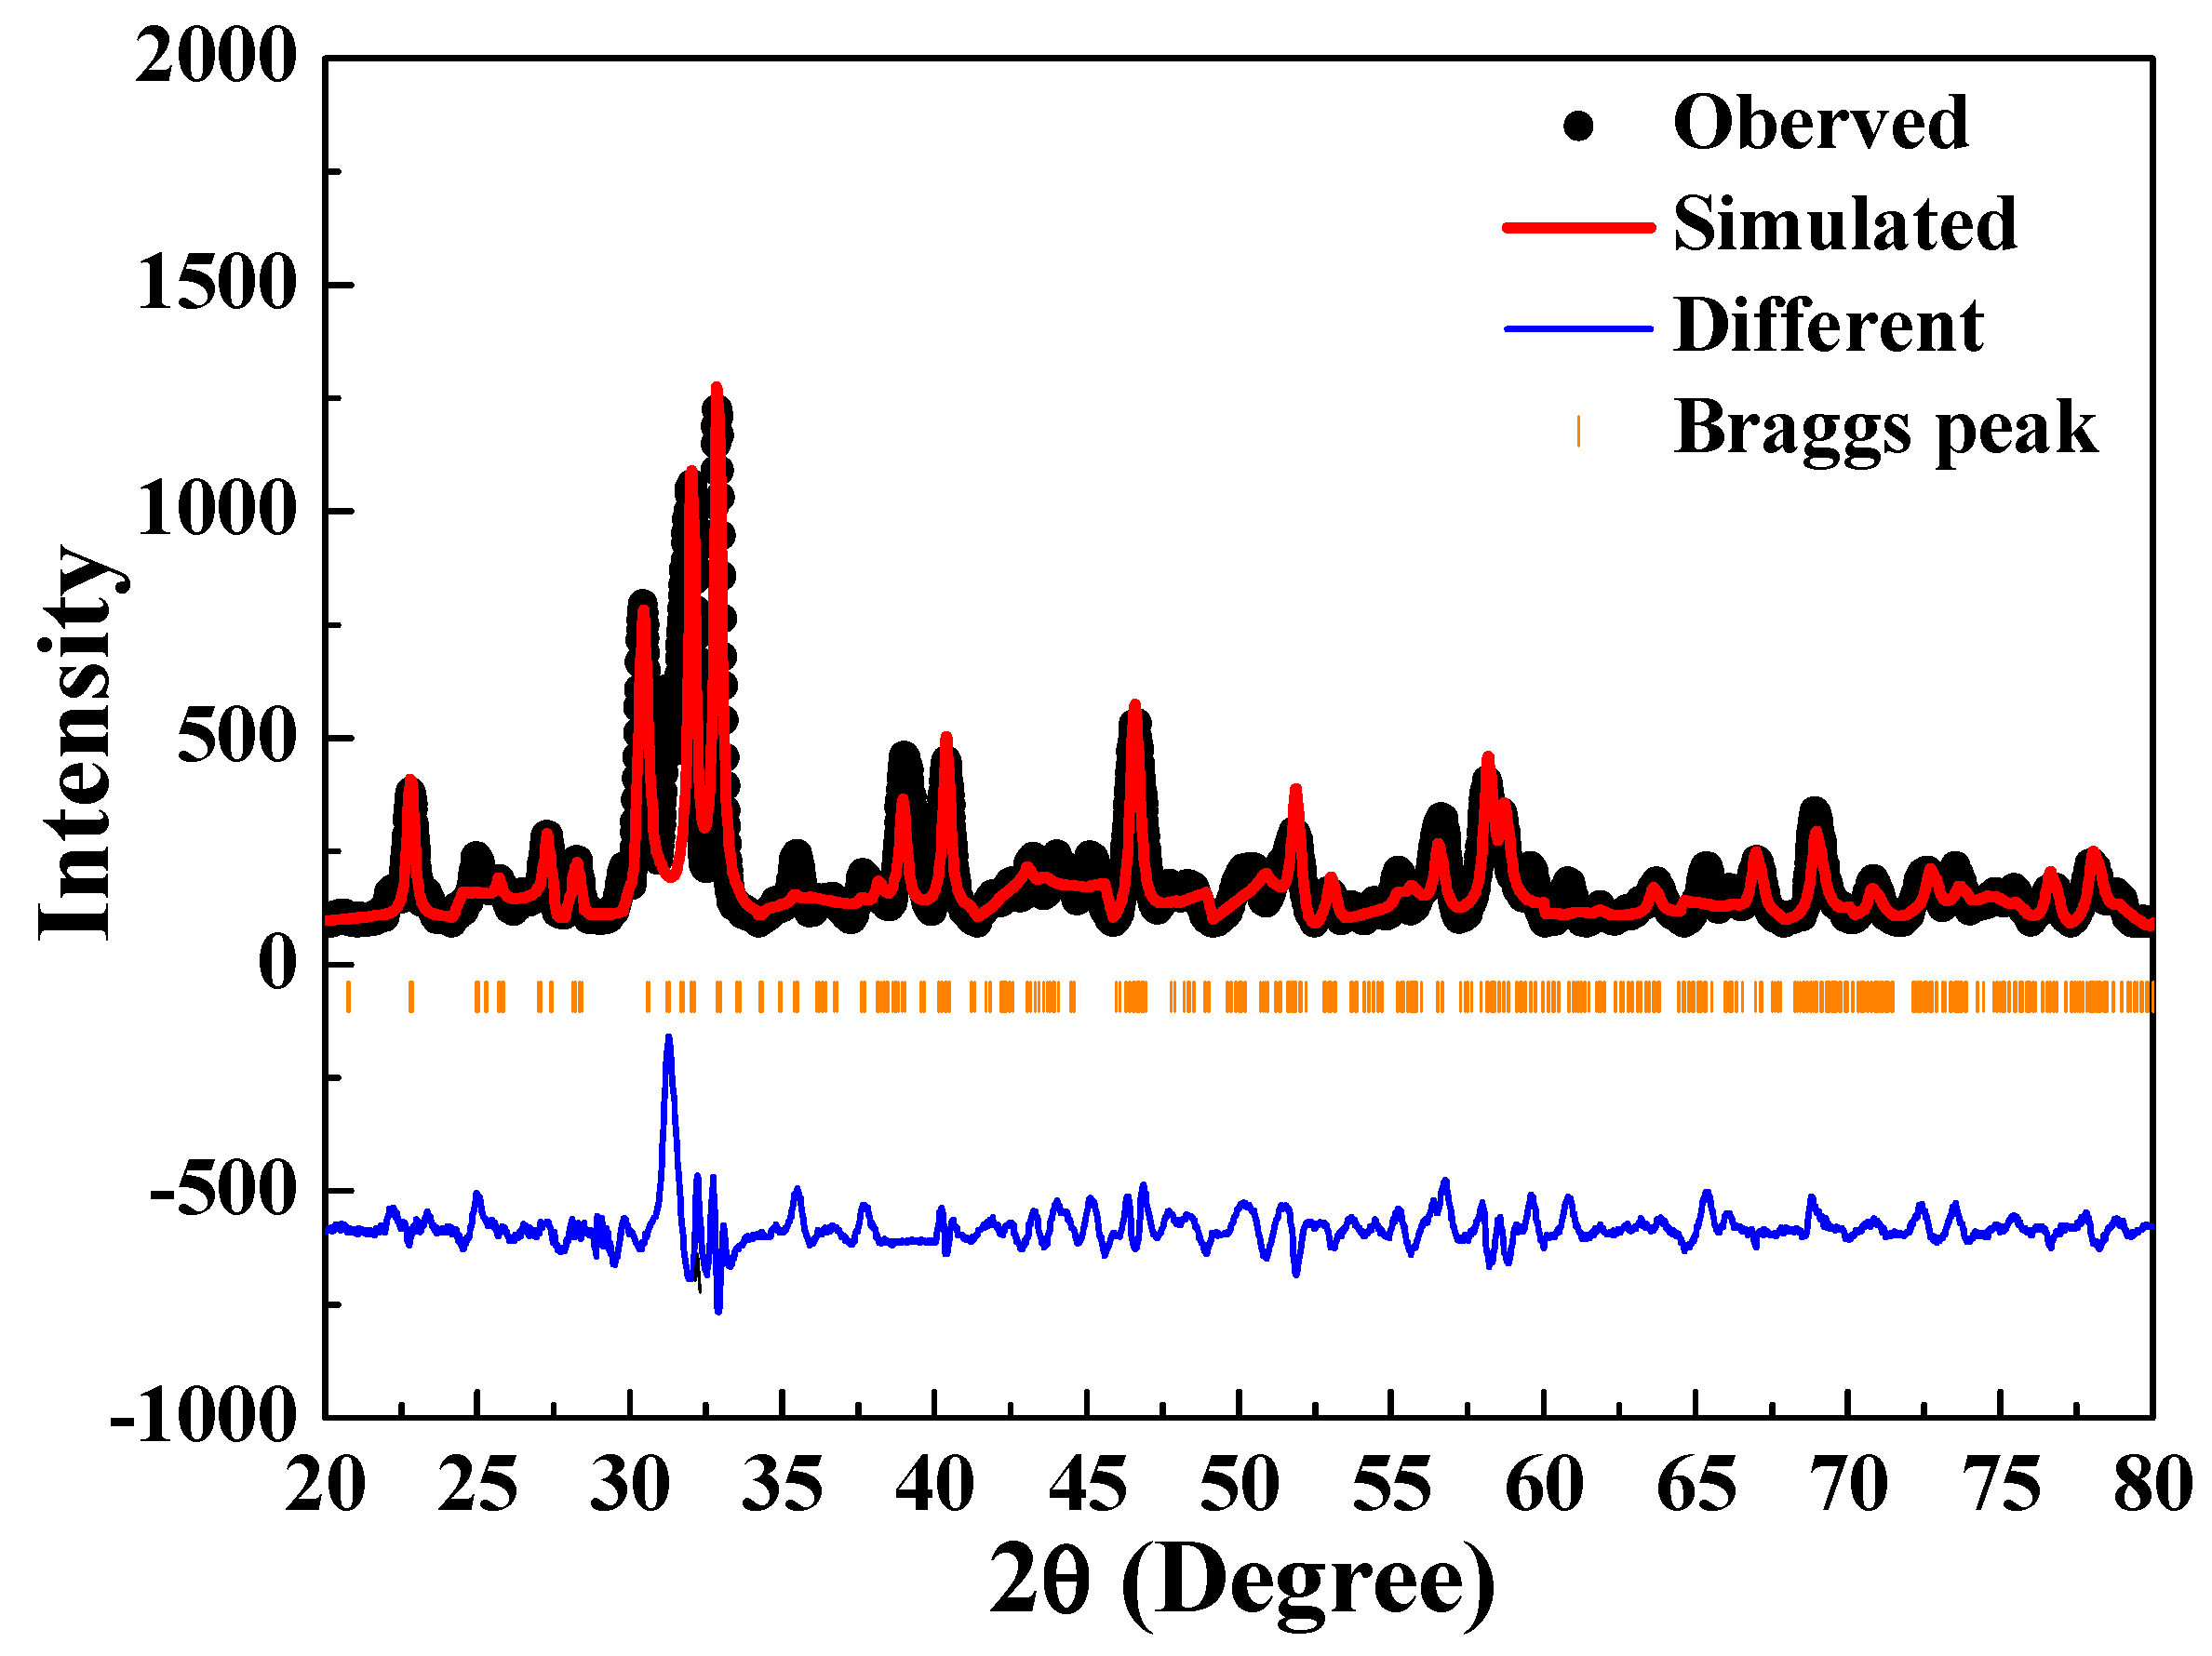
The findings for the crystal structure of the [Sr
0.99Eu
0.01]
3MgSi
2O
8 phosphor sintered at 1400 °C was fitted using the following parameters:
a = 5.341 Å,
b = 9.700 Å, and
c = 7.184 Å (Sr
3MgSi
2O
8 phosphors). Subsequently, Rietveld refinement was conducted on the XRD data of this phosphor (
Figure 10). The final refinement convergence was achieved when
χ2 = 5.42, which is marginally higher than the optimal value
χ2 value of <2. This result was due to the coexistence of the Sr
2MgSi
2O
7 (2
θ = 29.7° and 30.2°) and α-Sr
2SiO
4 (2
θ = 35.4°, 43.9°, 45.1°, and 60.7°) phases in the aforementioned phosphor. The remaining diffraction peak of 2
θ values, in addition to those mentioned above, were assigned to the [Sr
0.99Eu
0.01]
3MgSi
2O
8 phase. It demonstrated that the Sr
2+ ions were substituted by Eu
2+ ions in the [Sr
0.99Eu
0.01]
3MgSi
2O
8 phosphors.
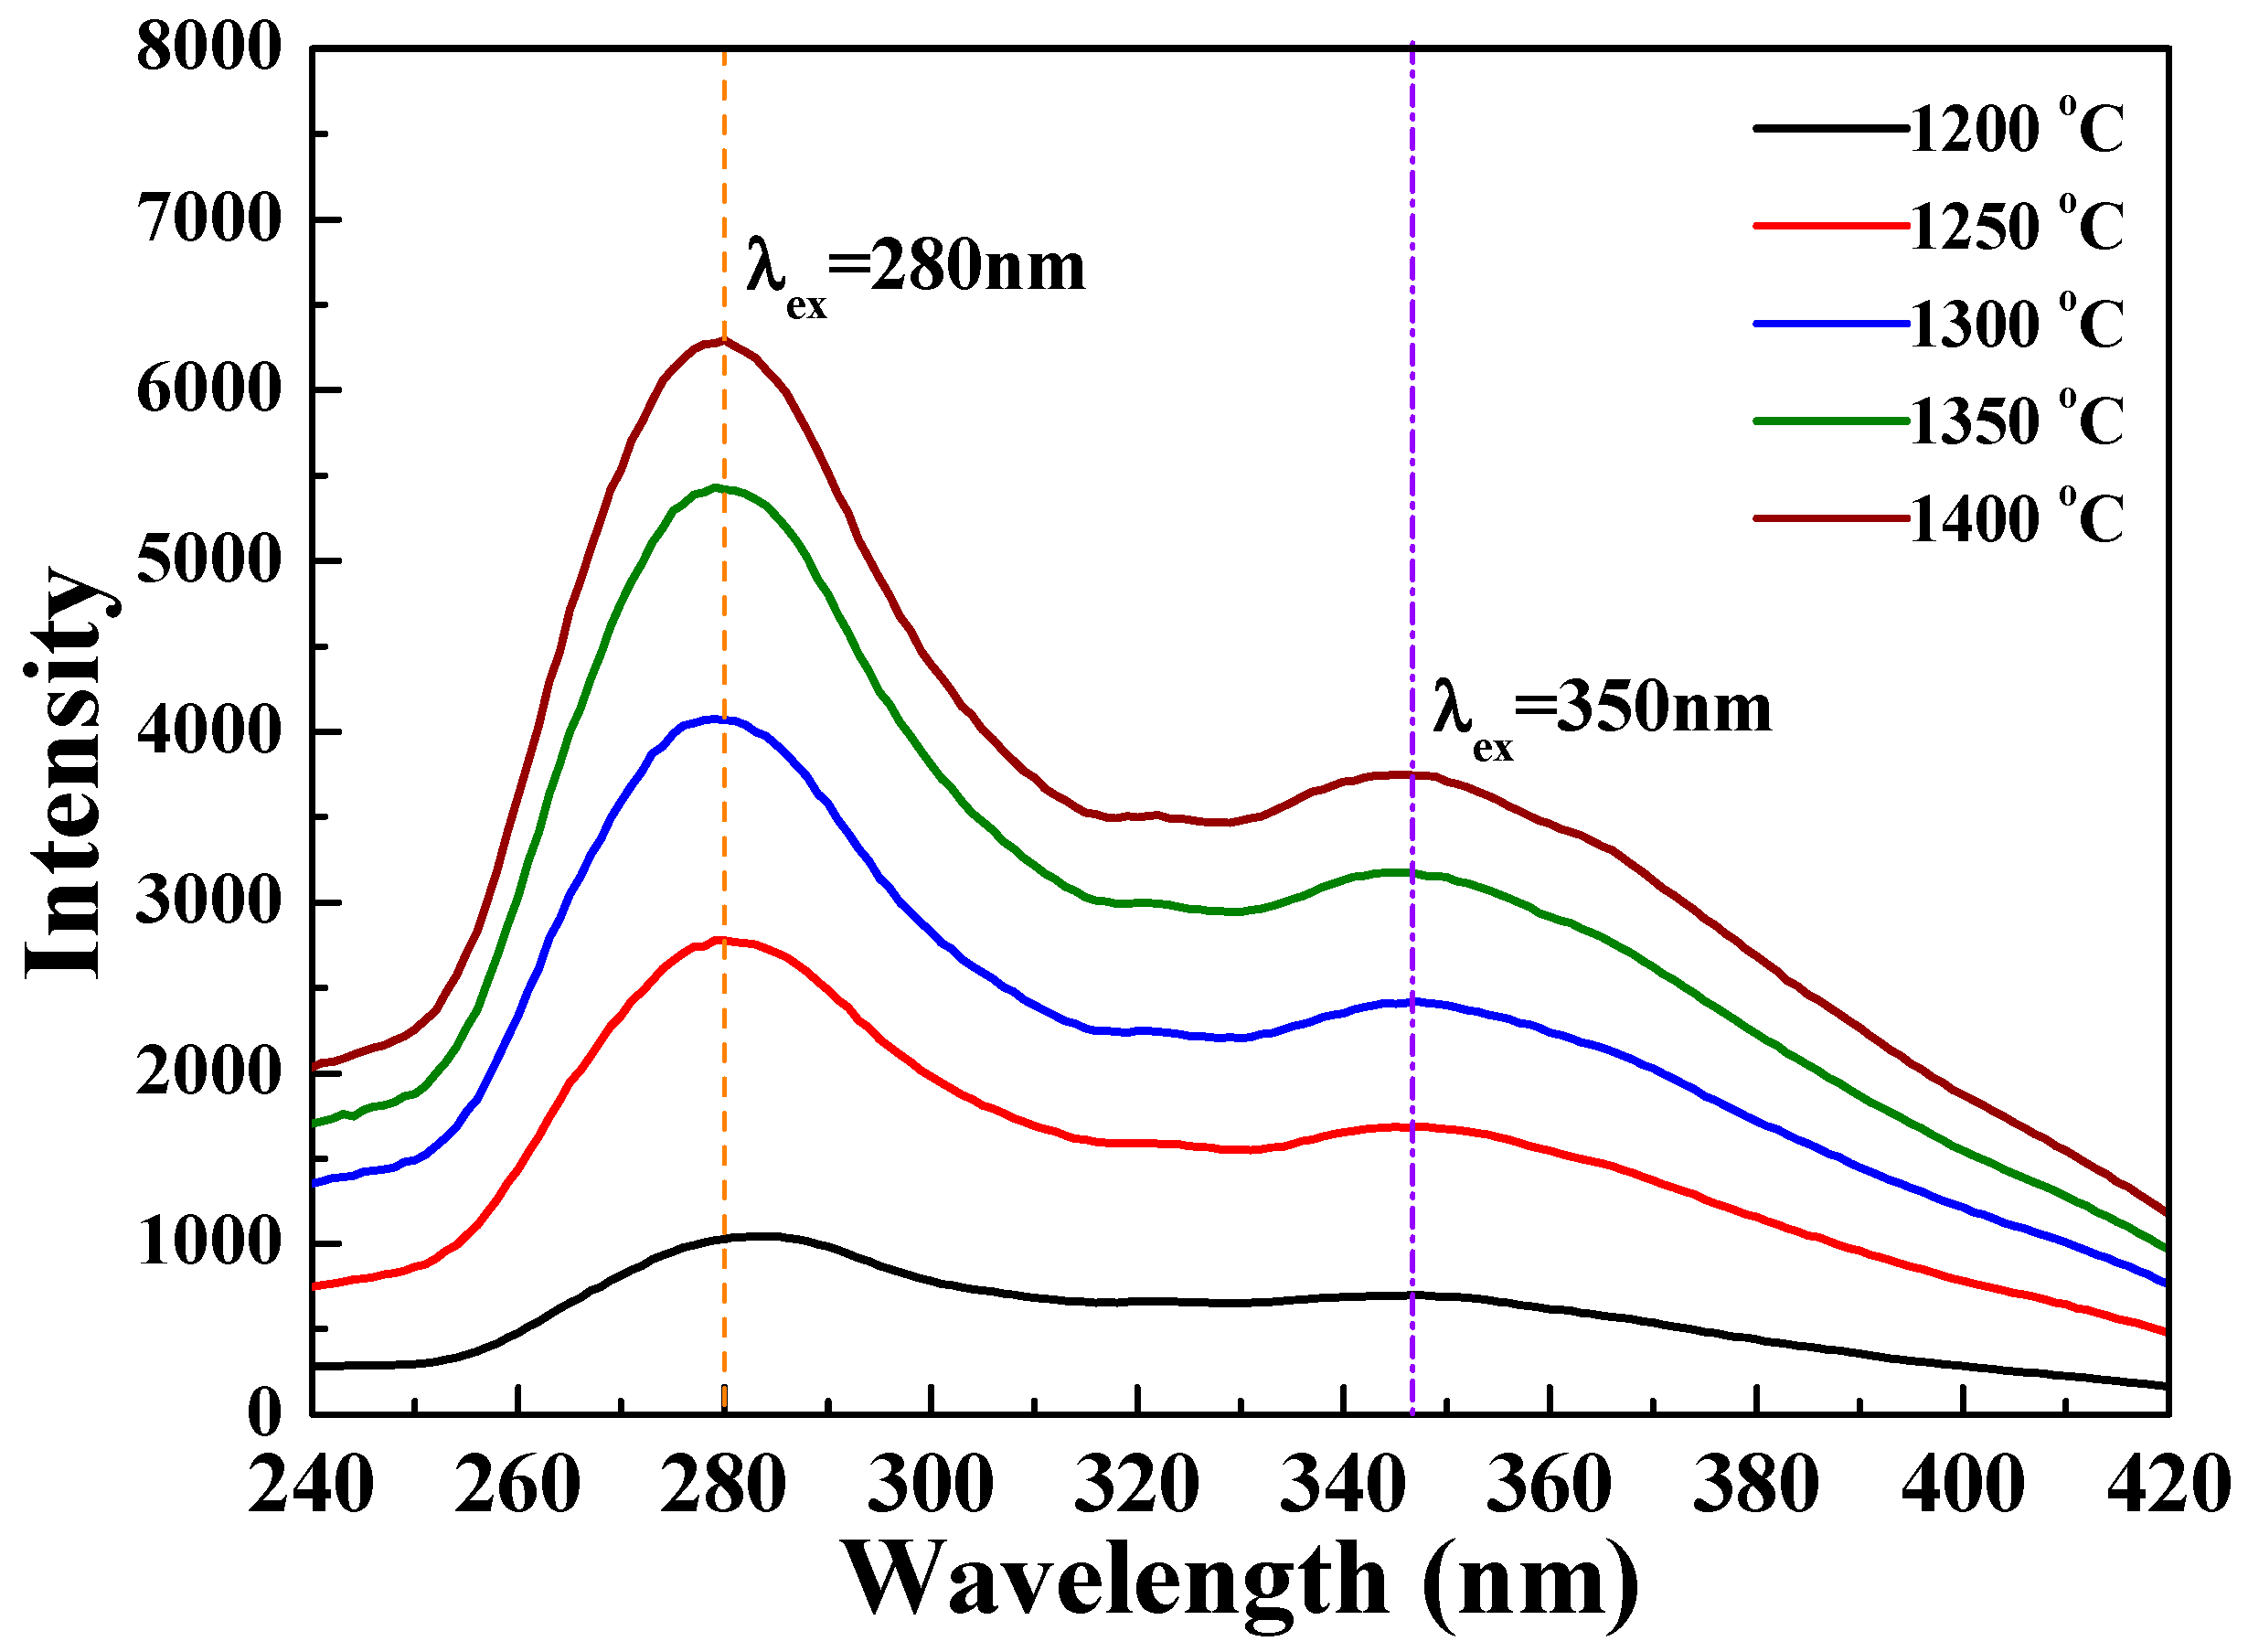
Figure 11 and
Figure 12 depict the PLE and PL spectra of the [Sr
0.99Eu
0.01]
3MgSi
2O
8 phosphors sintered at different temperatures. As the sintering temperature increased, the PLE intensity also increased, and the maximum PLE intensity was achieved when the sintering temperature was 1400 °C (
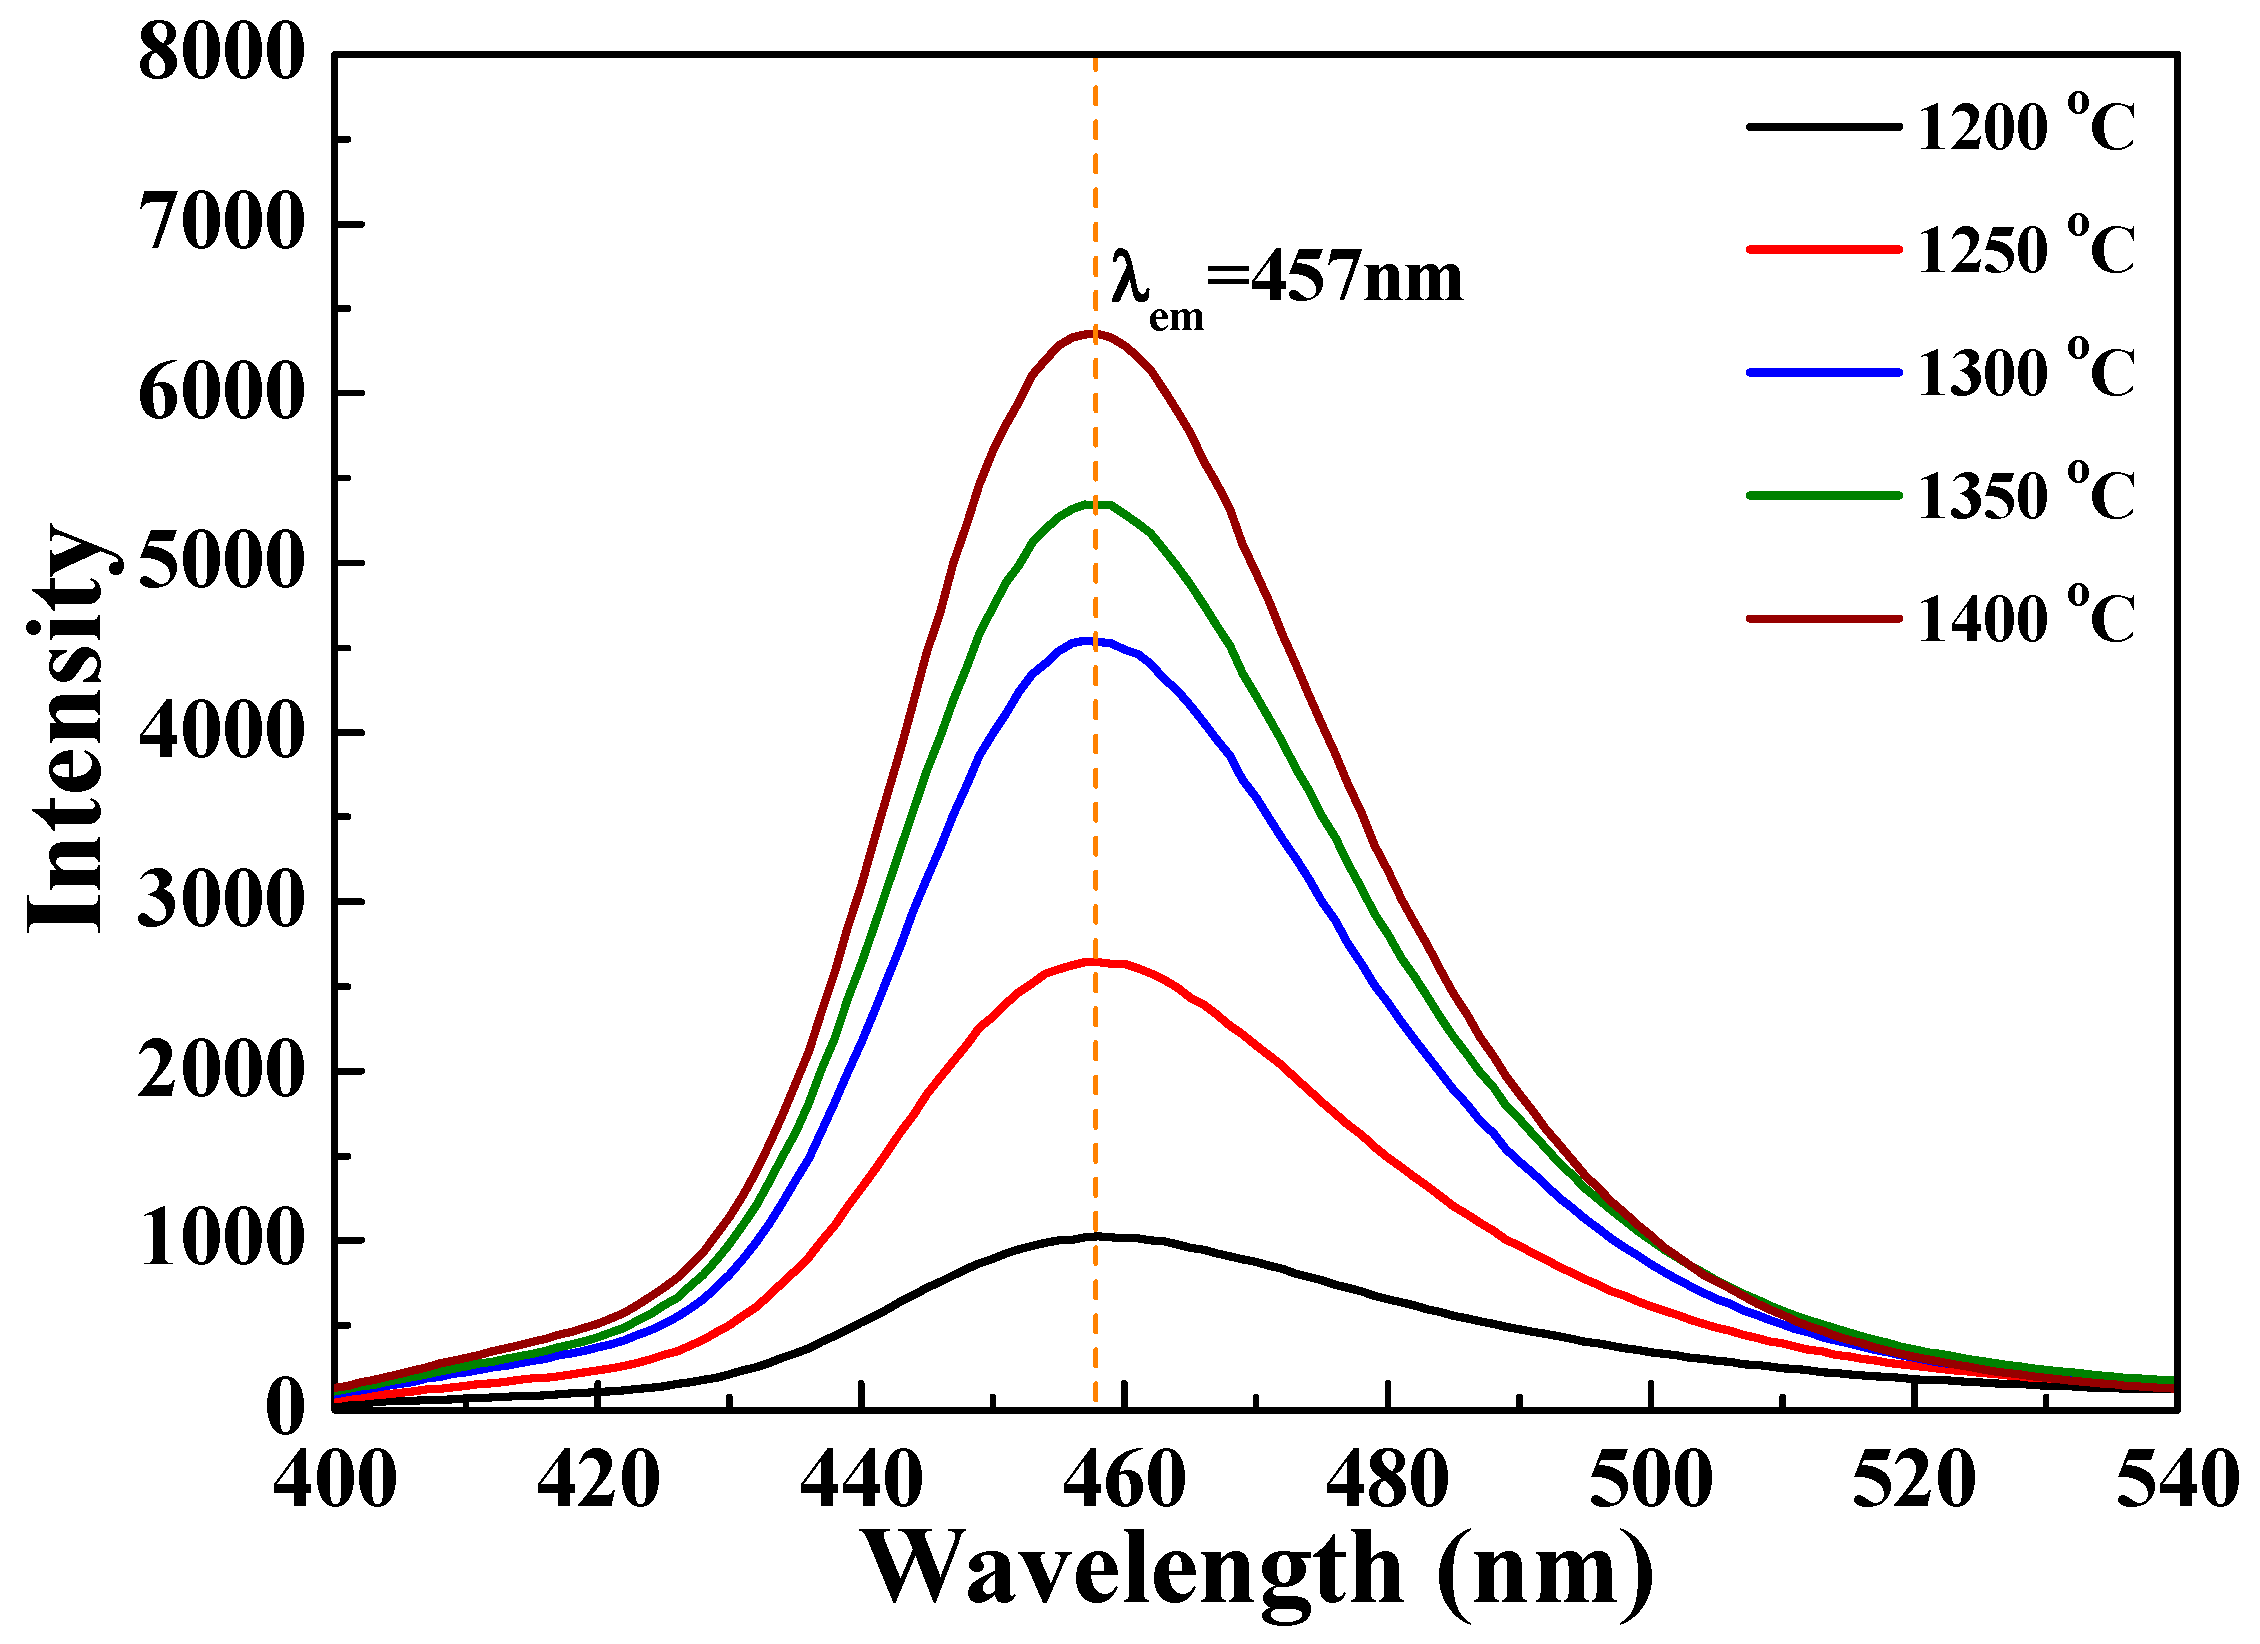
Figure 11). As depicted in
Figure 12, the PL intensity of the [Sr
0.99Eu
0.01]
3MgSi
2O
8 phosphors increased with sintering temperature. The [Sr
0.99Eu
0.01]
3MgSi
2O
8 phosphor sintered at 1400 °C exhibited the highest PL intensity, and the broad and asymmetric band with an FWHM value of 38 nm was observed at around 457 nm. The FWHM of the broad band of emission peaks were approximately 38, 40, 43 and 45 nm as the sintered temperature decreased from 1400 °C to 1200 °C. The blue emission band of the [Sr
0.99Eu
0.01]
3MgSi
2O
8 phosphors at 457 nm was attributed to the 5
d–4
f electron transition of Eu
2+.
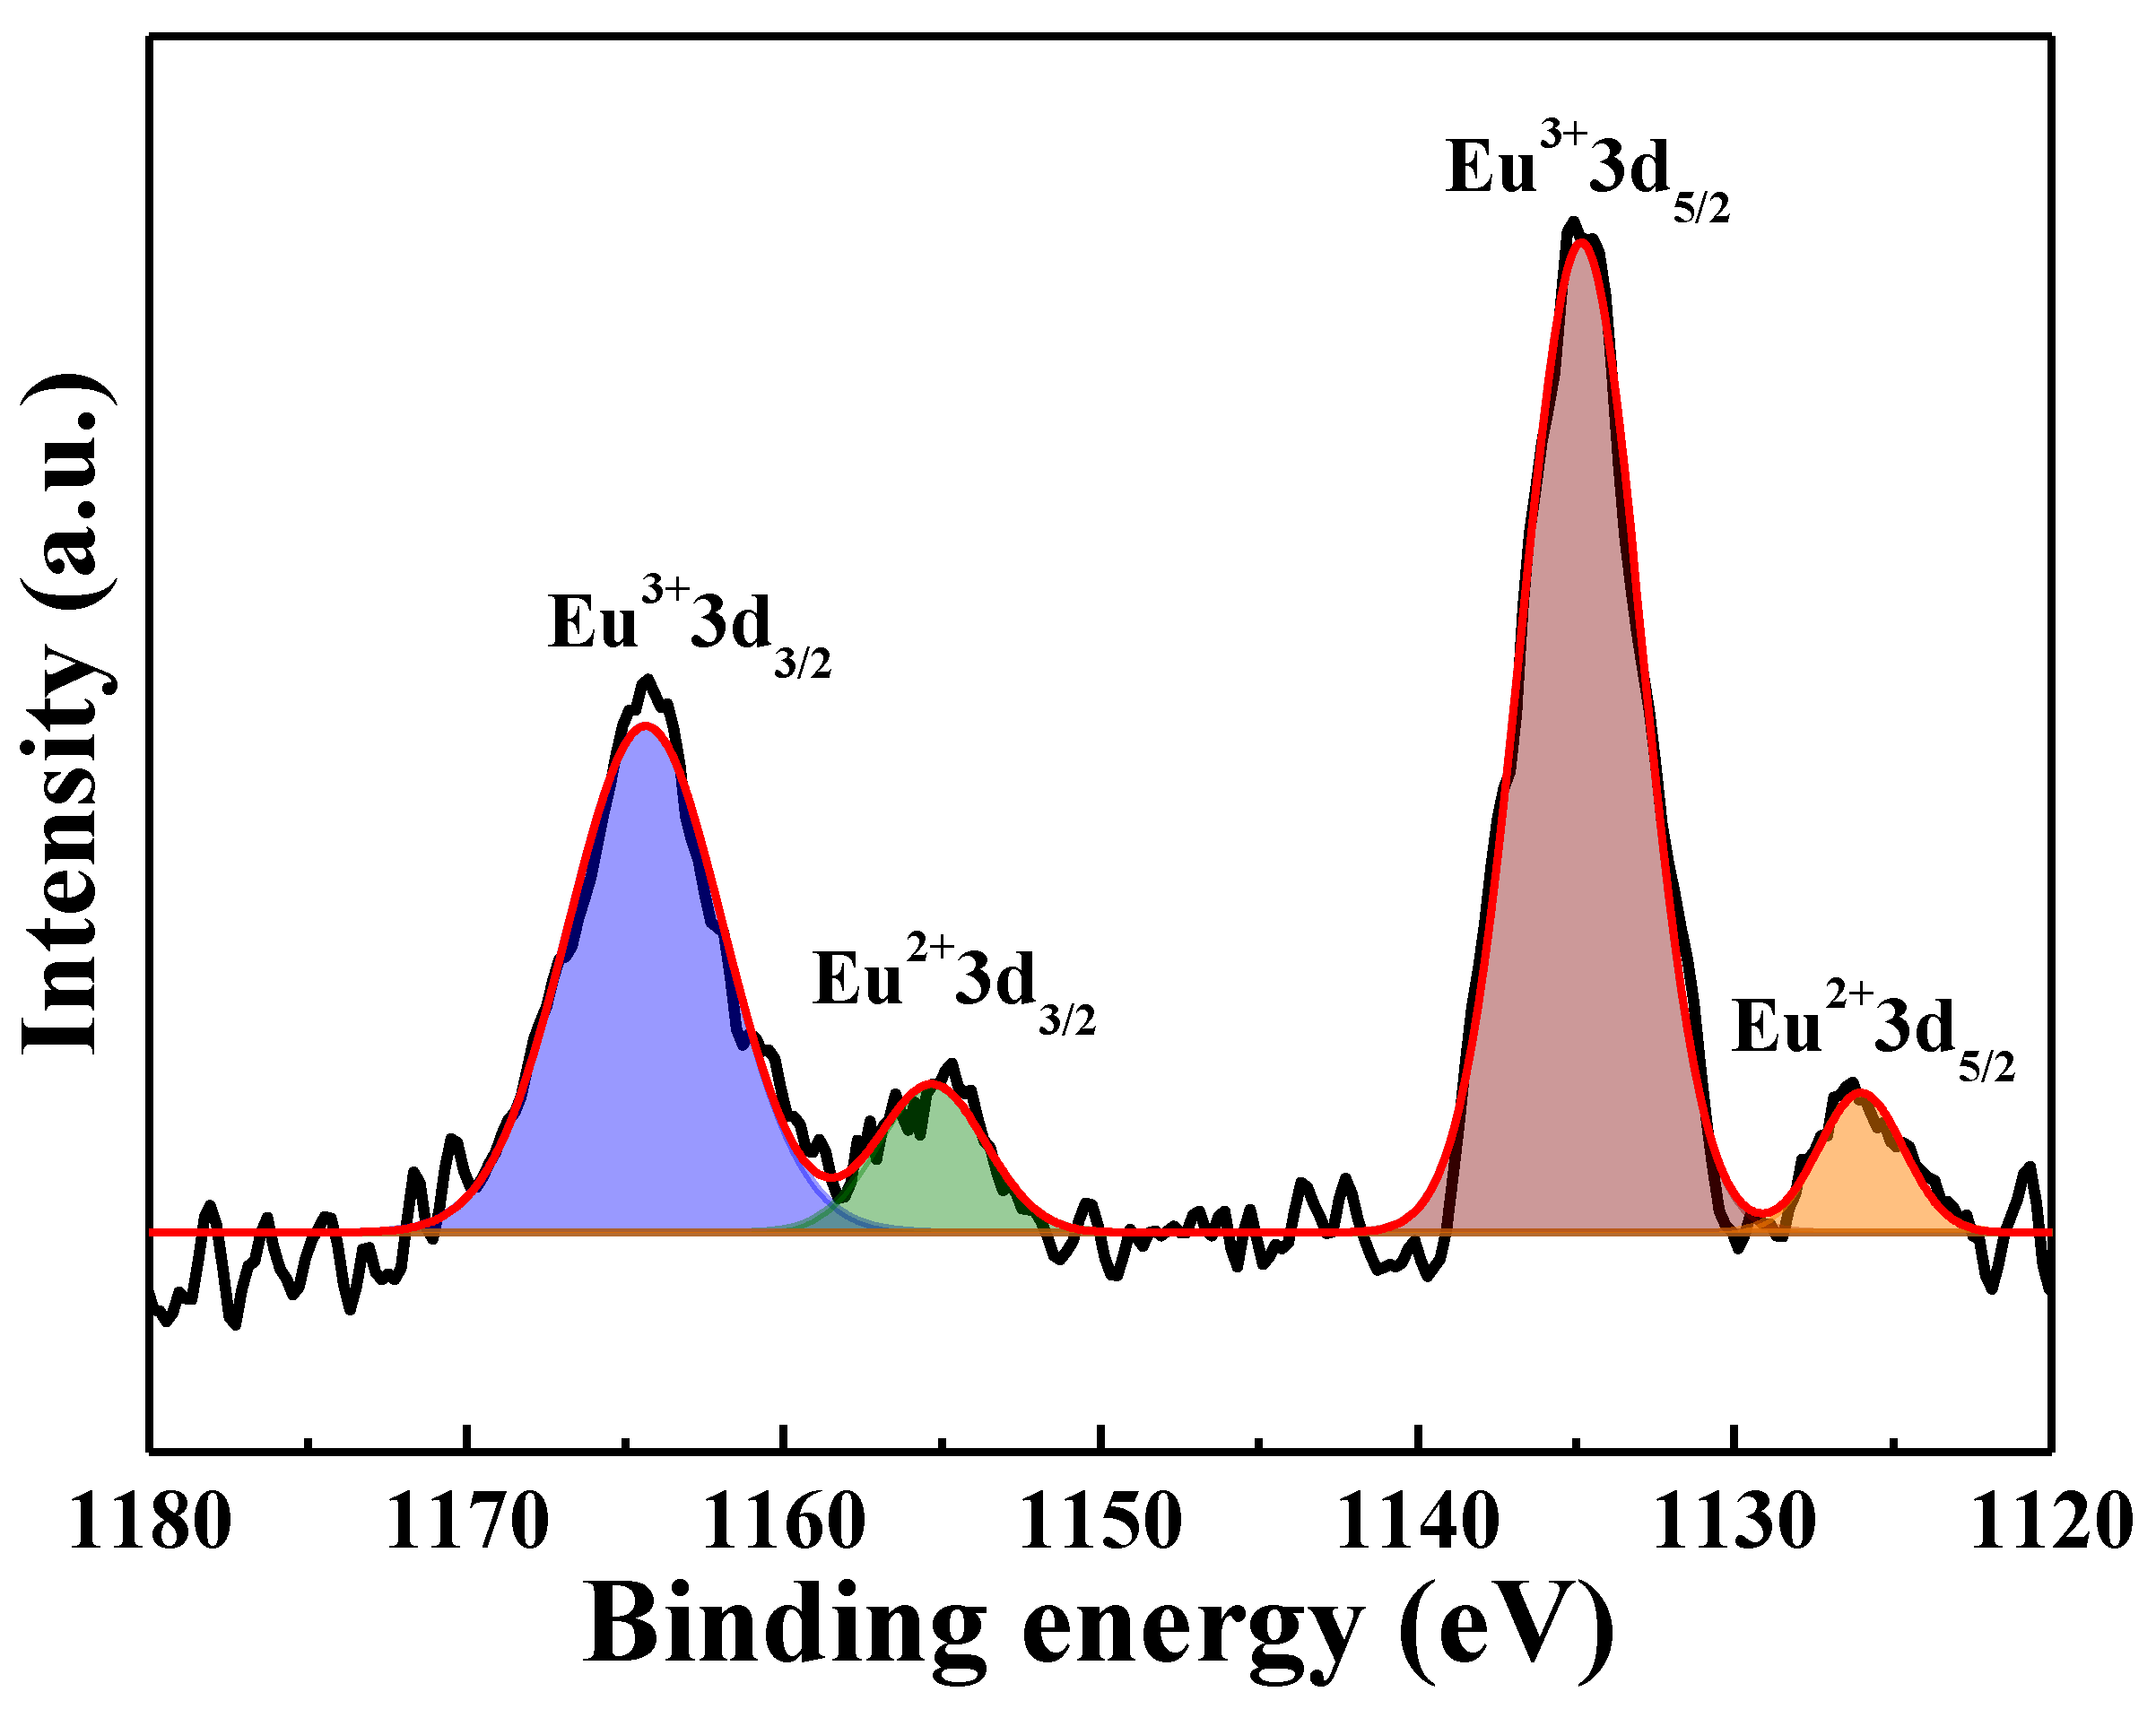
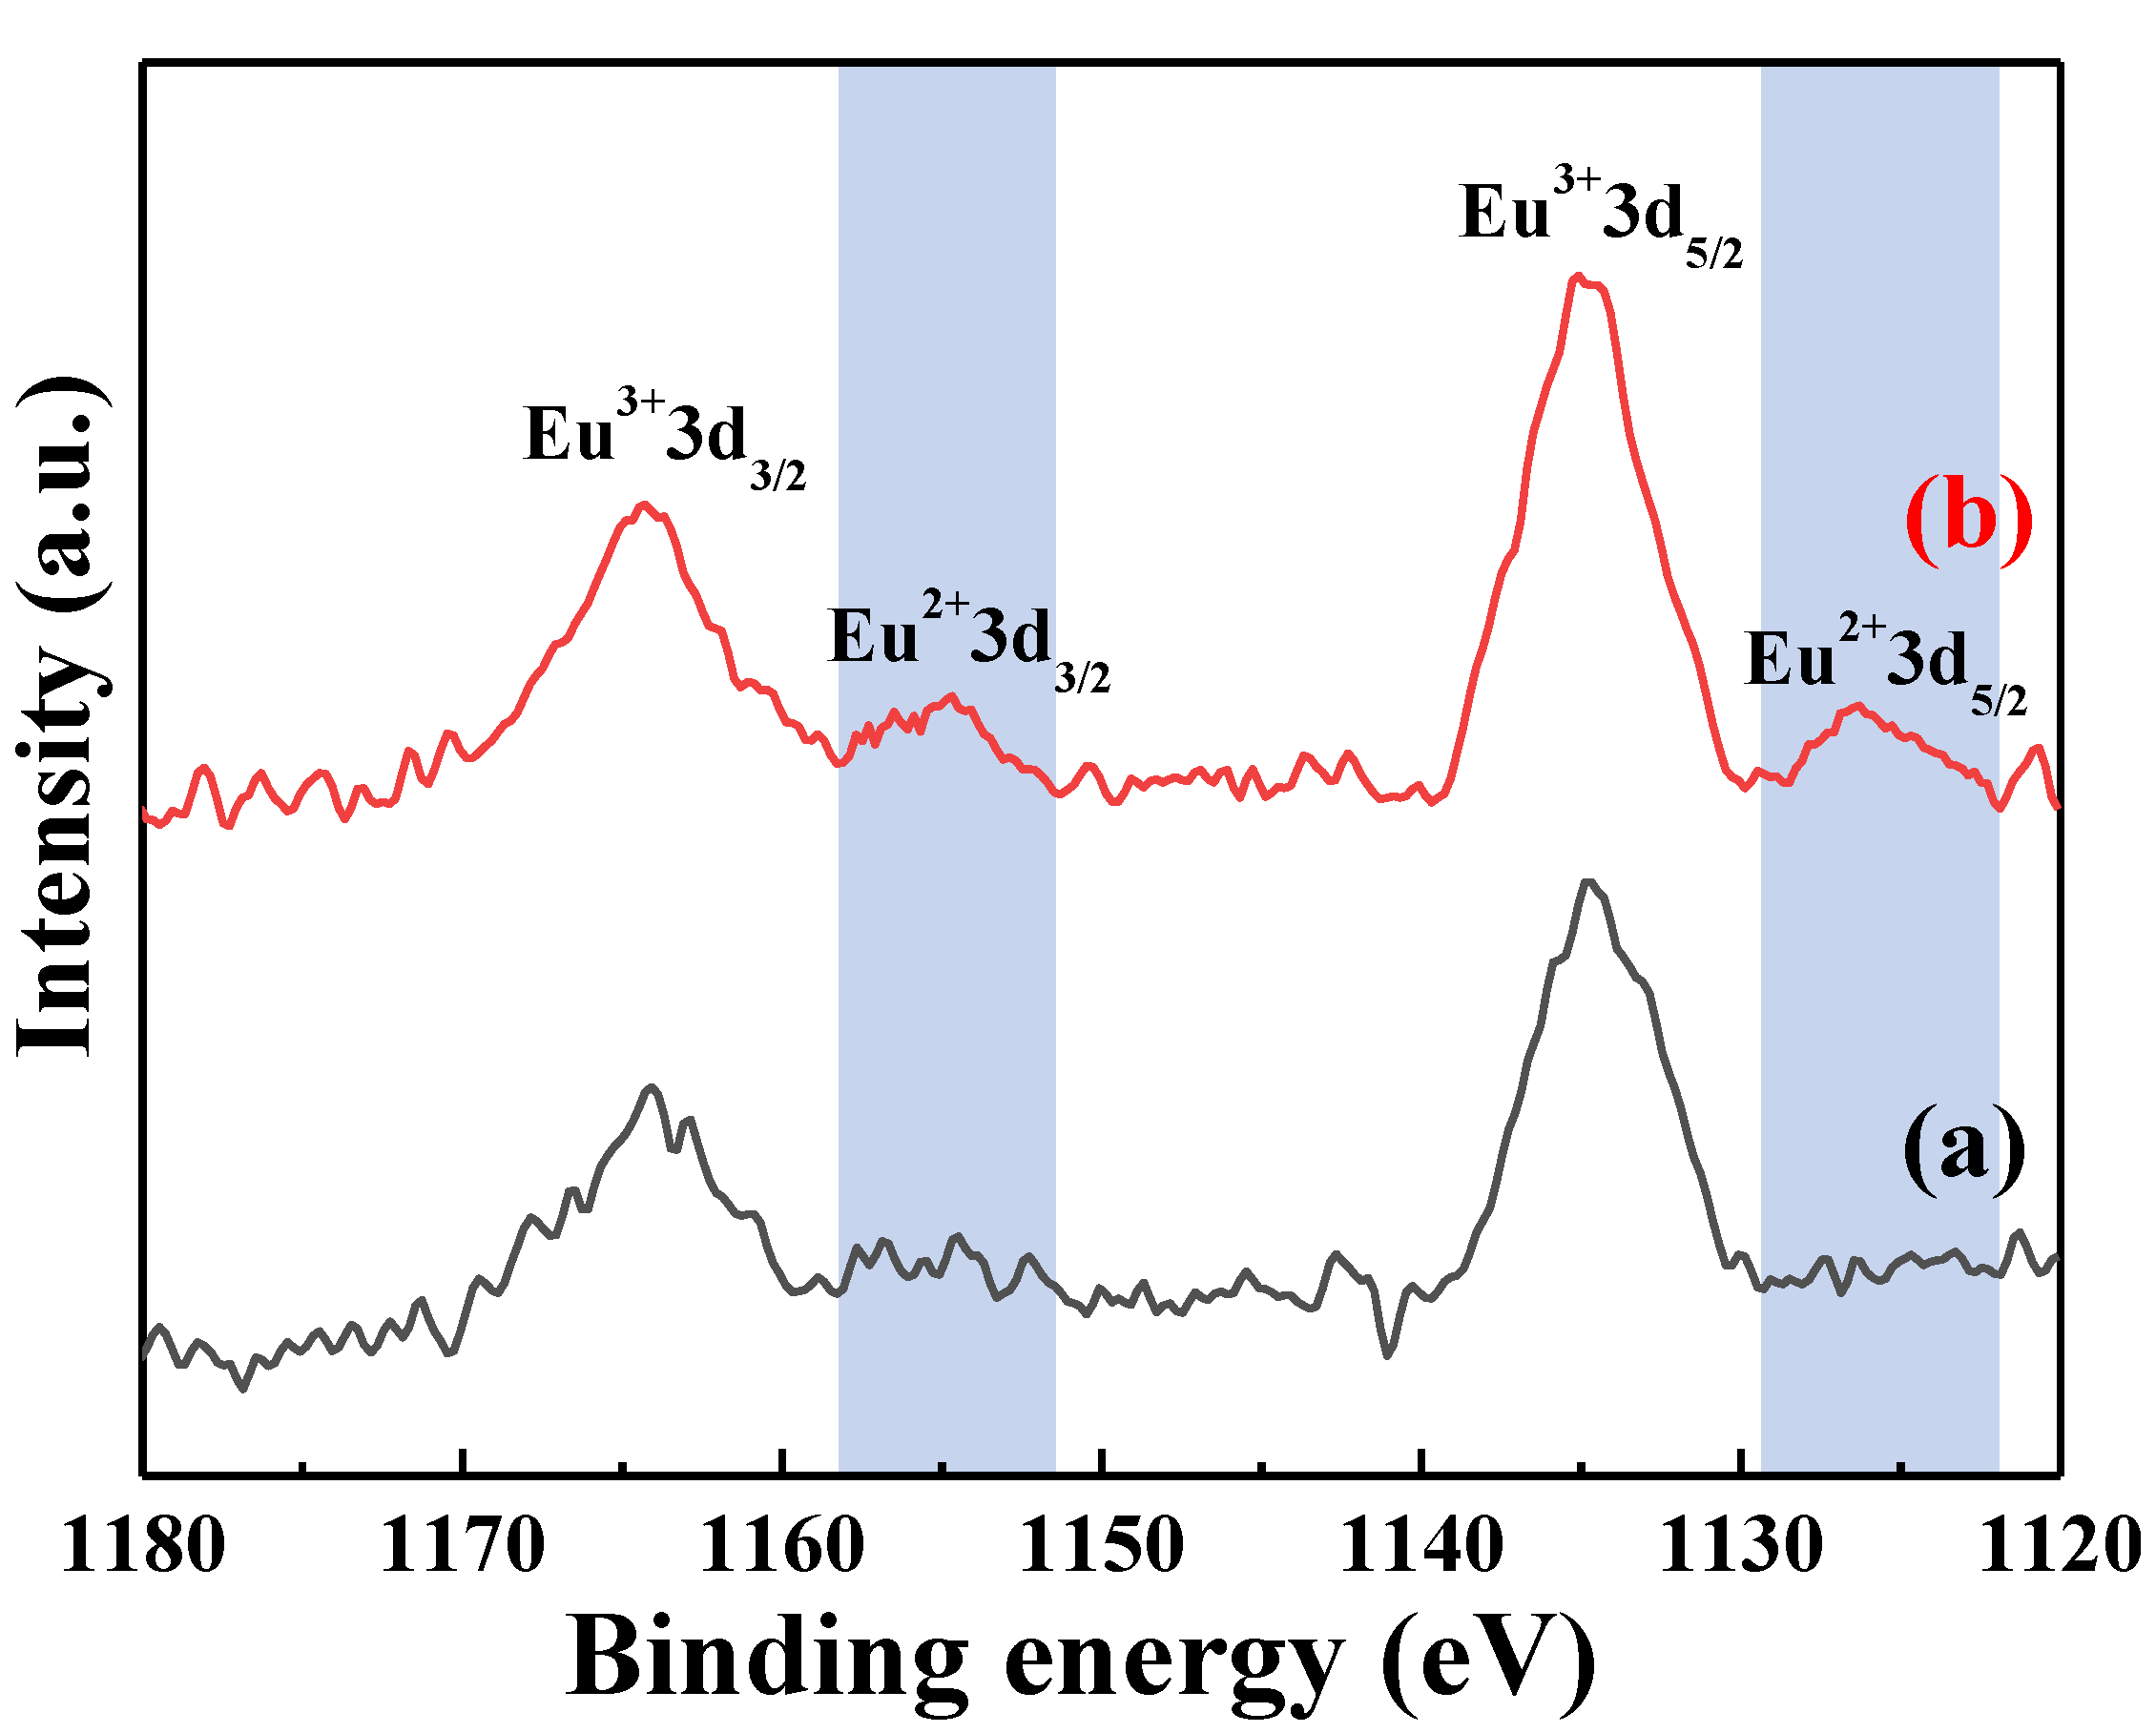
Figure 13 shows the Eu 3d XPS spectra of the [Sr
0.99Eu
0.01]
3MgSi
2O
8 phosphors sintered at different temperatures. The results shows that there is no Eu
2+-related peaks at the sintered temperature of 900 °C (
Figure 13a), and the Eu
2+ peak appeared at the sintering temperature of 1400 °C (
Figure 13b). The Eu 3d XPS spectra of the [Sr
0.99Eu
0.01]
3MgSi
2O
8 phosphors sintered at 1400 °C is shown in
Figure 14, revealing the Eu 3d peak deconvolution of the electron binding energies of Eu
3+ 3d
3/2 (1164 eV), Eu
2+ 3d
3/2 (1155 eV), Eu
3+ 3d
5/2 (1134 eV), and Eu
2+ 3d
5/2 (1125 eV). This result demonstrated that the Eu
3+ ions are successfully reduced to Eu
2+ ions at a 1400 °C sintering temperature. In general, Eu
3+→Eu
2+ reduction requires a higher temperature in the reducing atmosphere.
Figure S5 displays the fluorescent decay curves of the [Sr
0.99Eu
0.01]
3MgSi
2O
8 phosphors excited at 280 nm and monitored at 457 nm. The data fit well with a double-exponential curve. The average luminescence lifetimes of the [Sr
0.99Eu
0.01]
3MgSi
2O
8 phosphors sintered at 1200, 1300, and 1400 °C were calculated from Equation (2) to be 1.074, 1.144, and 1.197 ms, respectively. The parameter
τ* decreased with sintering temperature. This result demonstrates that energy transfer occurred between the Eu
2+ ions located at the Sr
2+ sites [
32].
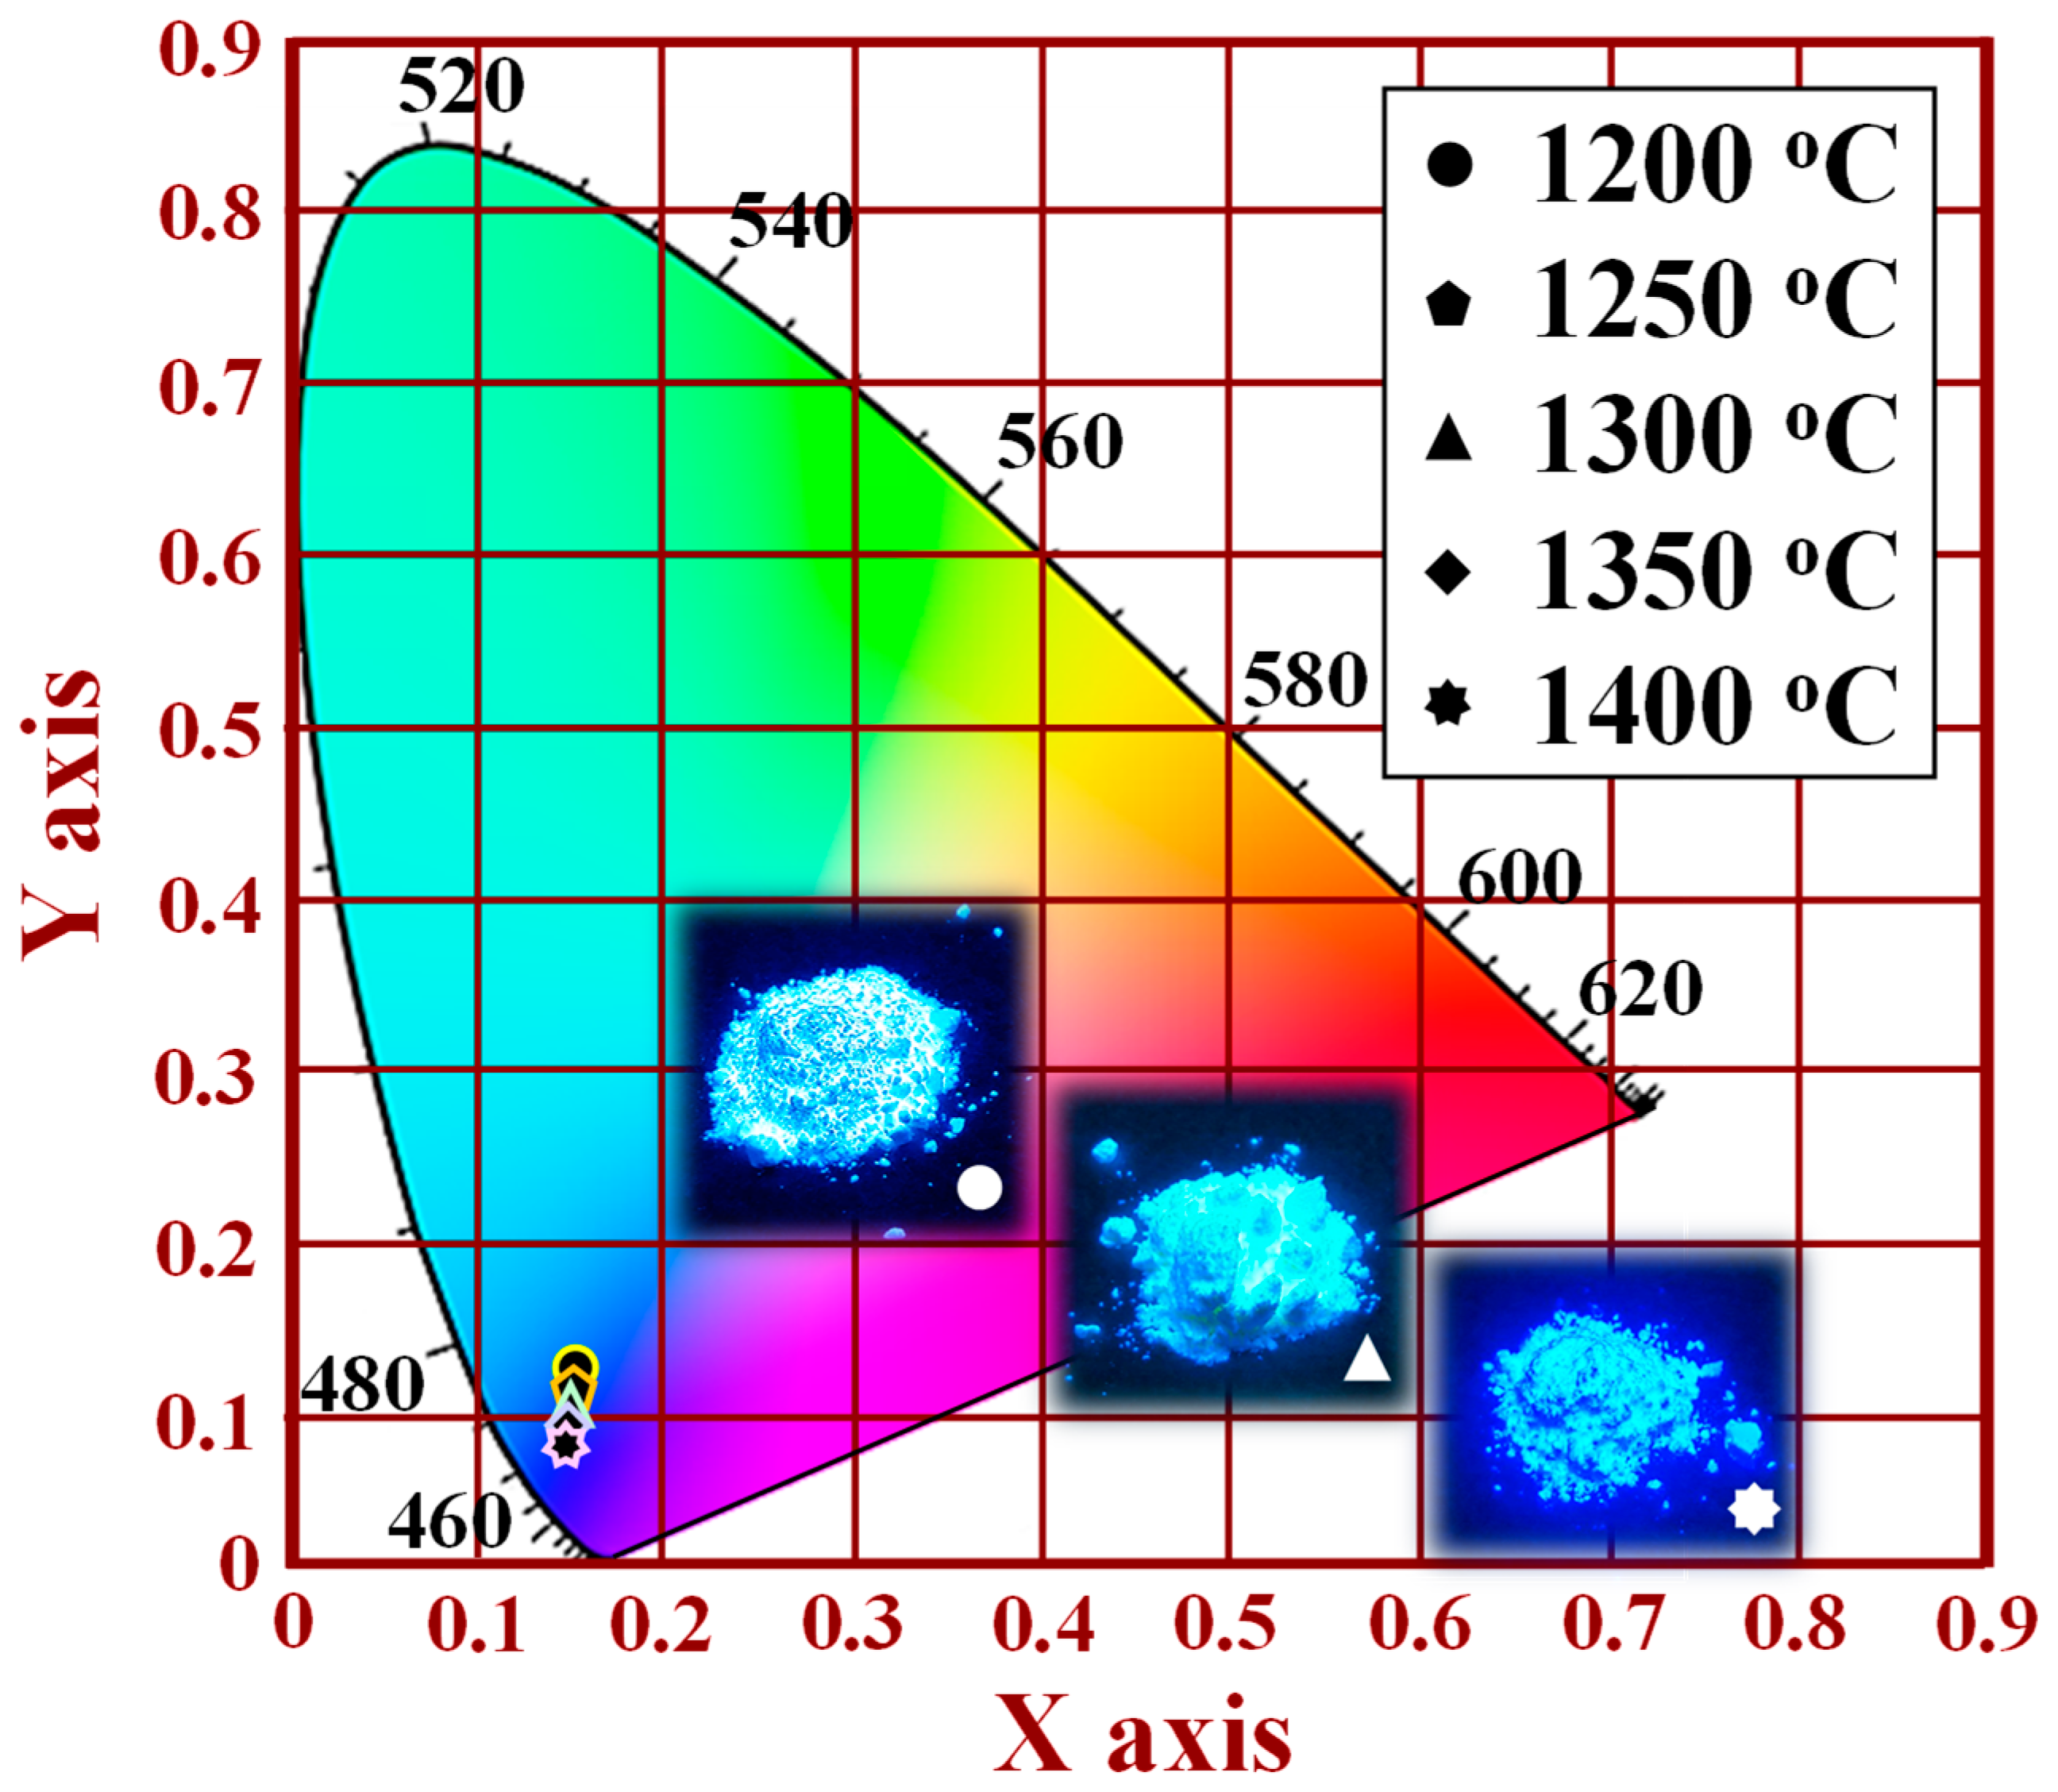
Figure 15 shows the CIE chromaticity coordinates and photographs of the [Sr
0.99Eu
0.01]
3MgSi
2O
8 phosphors sintered at different temperatures. The CIE chromaticity diagram was obtained for an excitation wavelength of 280 nm. When the sintering temperature was increased from 1200 to 1400 °C, the CIE chromaticity coordinates shifted from a light blue region (
x = 0.1659,
y = 0.1382) to an ultramarine blue region (
x = 0.1494,
y = 0.0942). Therefore, the optimal sintering temperature in the production of blue phosphors is 1400 °C. Images of the [Sr
0.99Eu
0.01]
3MgSi
2O
8 phosphors sintered at different temperatures under UV light irradiation are displayed in the inset of
Figure 15 and in
Figure S6. The brightness of the [Sr
0.99Eu
0.01]
3MgSi
2O
8 phosphors increased with sintering temperature. The highest brightness occurred at a sintering temperature of 1400 °C.


