Article

Optical Properties and Concentration Quenching Mechanism of Er3+ Heavy Doped Gd2(MoO4)3 Phosphor for Green Light-Emitting Diode

1
Guangdong Provincial Key Laboratory of Development and Education for Special Needs Children, Zhanjiang 524048, China
2
School of Physics Science and Technology, Lingnan Normal University, Zhanjiang 524048, China
3
Institute of High Energy Physics and National Center for Nanoscience and Technology, Chinese Academy of Sciences, Beijing 100049, China
*
Authors to whom correspondence should be addressed.
Nanomaterials 2022, 12(20), 3641; https://doi.org/10.3390/nano12203641
Submission received: 12 August 2022 / Revised: 4 October 2022 / Accepted: 13 October 2022 / Published: 17 October 2022
(This article belongs to the Special Issue Recent Advances in Luminescent Nanomaterials for LEDs)

Abstract

:
Upconversion materials capable of converting low-energy excitation photons into high-energy emission photons have attracted considerable interest in recent years. However, the low upconversion luminescence seriously hinders the application of upconversion phosphors. Heavy lanthanide doping without concentration quenching represents a direct and effective method to enhance the emission intensity. In this study, Er3+ heavy doped Gd2(MoO4)3 phosphor with a monoclinic phase was prepared by a sol–gel process. Under excitation at 976 nm, Gd2(MoO4)3:Er3+ phosphor emitted remarkably intense green emission, and Er3+ concentration up to 20 mol% did not cause concentration quenching. Here, we discuss the upconversion mechanism and concentration quenching. When the Er3+ concentration was in the range of 30–60 mol%, the concentration quenching was governed by the electric dipole–dipole interaction, and when the concentration was greater than 60 mol%, the concentration quenching was controlled by the exchange interactions. The result provides a schematic basis for identifying a phosphor host with heavy lanthanide doping.

1. Introduction

Lanthanide-doped upconversion materials capable of converting low-energy near-infrared light to high-energy visible light are potential candidates for white light displays [1], upconversion lasers [2], solar cells [3], anticounterfeit labels [4], photocatalytic structures [5], volumetric color imaging [6], temperature measurement [7], super-resolution imaging [8], and biological fluorescence labeling [9]. However, some problems limit their applications, including low upconversion emission intensity.
Enhancing upconversion emission intensity by heavy doping is a straightforward method [10]. High concentrations of sensitizer and activator ions contribute to improved absorption of excitation light and emission intensity. Generally, the doping concentration of the activator should not exceed 2 mol%; otherwise, it will cause concentration quenching and reduce the emission intensity [11,12]. Concentration quenching can be eliminated by employing core-shell structures in sensitizer Yb3+/RE3+ (RE = Er, Tm, Ho activators) systems [10,13,14,15,16]. However, this approach to enhancing upconversion emission intensity is limited, as the host lattice cannot easily accommodate a large number of dopant ions. Therefore, it is imperative to develop host materials that allow for heavy lanthanide doping.
Gd2(MoO4)3 is an excellent host due to its relatively low maximum phonon energy and good thermal stability. In addition, Gd3+ ions and activated ions (RE3+) are both rare earth ions with similar chemical properties and can achieve high-concentration doping in a Gd2(MoO4)3 host, increasing the number of luminescent centers and enhancing the intensity of upconversion luminescence. Few reports have been published to date on the upconversion luminescence of Er3+ single-doped Gd2(MoO4)3 [17]. The upconversion luminescence properties of Gd2(MoO4)3:Er3+ phosphors had been investigated under excitation in the range of 1510–1565 nm [17]. However, for the most widely used ~980 nm excitation wavelength, it is necessary to study the upconversion luminescence characteristics and conduct concentration quenching analysis of Er3+ heavy doped Gd2(MoO4)3 phosphors.
In this study, Er3+ heavy doped Gd2(MoO4)3 phosphor with a monoclinic phase was prepared by a sol–gel method. The upconversion mechanism of Gd2(MoO4)3:Er3+ phosphor was studied under the excitation of a 976 nm diode laser (LD). Furthermore, the concentration quenching mechanism was analyzed.

2. Materials and Methods

Gd2(MoO4)3:xEr3+ (x = 1, 5, 10, 15, 20, 25, 30, 35, 40, 50, 60, 70, 80, 90 mol%) phosphors were prepared using a simple sol–gel process. All raw materials were purchased from Sinopharm. According to our previous work [18], Gd(NO3)3·6H2O (AR), (NH4)6Mo7O24 (AR), and Er(NO3)3·6H2O (AR) with precalculated concentrations were dissolved in deionized water, and citric acid (AR) was added to this solution. Subsequently, the pH level of the solution was adjusted to about 7 by adding an appropriate amount of ammonia (AR). The resulting solution was heated at 80 °C under continuous magnetic vigorous stirring for 0.5 h and dried in a drying box at 130 °C for 20 h. Finally, the dried gel was placed in a muffle furnace at 800 °C for 2 h.
The crystalline phases were identified by an X-ray diffractometer (Empyrean, Panalytical, The Netherlands) with Cu Kα radiation (λ = 1.5418 Å) at a scanning rate of 4° per minute. A scanning electron microscope (SEM) (JSM-5510; JEOL, Tokyo, Japan) equipped with an energy-dispersive X-ray spectrum (EDS) analyzer was used to characterize the microstructures. The upconversion emission spectra were measured using an iHR550 spectrofluorometer.

3. Results and Discussion

3.1. Crystal Structure and Morphology

The XRD patterns of Gd2(MoO4)3:xEr3+ phosphors are shown in Figure 1a. The XRD patterns are well-matched with the standard data (JCPDS No. 26-0655), indicating that a single monoclinic phase, Gd2(MoO4)3:Er3+ phosphor, is acquired [19]. The monoclinic Gd2(MoO4)3 has a space group of C2/c with the following cell parameters: a = 7.53, b = 11.38, c = 11.40 Å, and β = 109.32 degrees. The stronger diffraction peaks are located at 28.42° and 29.4°, corresponding to the (–221) and (023) crystal planes, respectively. No other impurity peaks are observed, indicating that the doped Er3+ ions have been incorporated into the lattice, replacing the lattice position of Gd3+. The morphology and the elemental components of Gd2(MoO4)3:20Er3+ phosphor were identified by SEM and EDS measurements, as shown in Figure 1b,c. The prepared phosphor is composed of tightly packed particles with relatively uniform morphology, and the average particle size is about 0.9 μm (see inset of Figure 1b). Such morphology is commonly observed in molybdate and tungstate phosphors synthesized by the sol–gel method with subsequent annealing [20,21,22]. The EDS result confirms that the elemental components are Gd, Mo, Er, and O.

3.2. Upconversion Mechanism Analysis

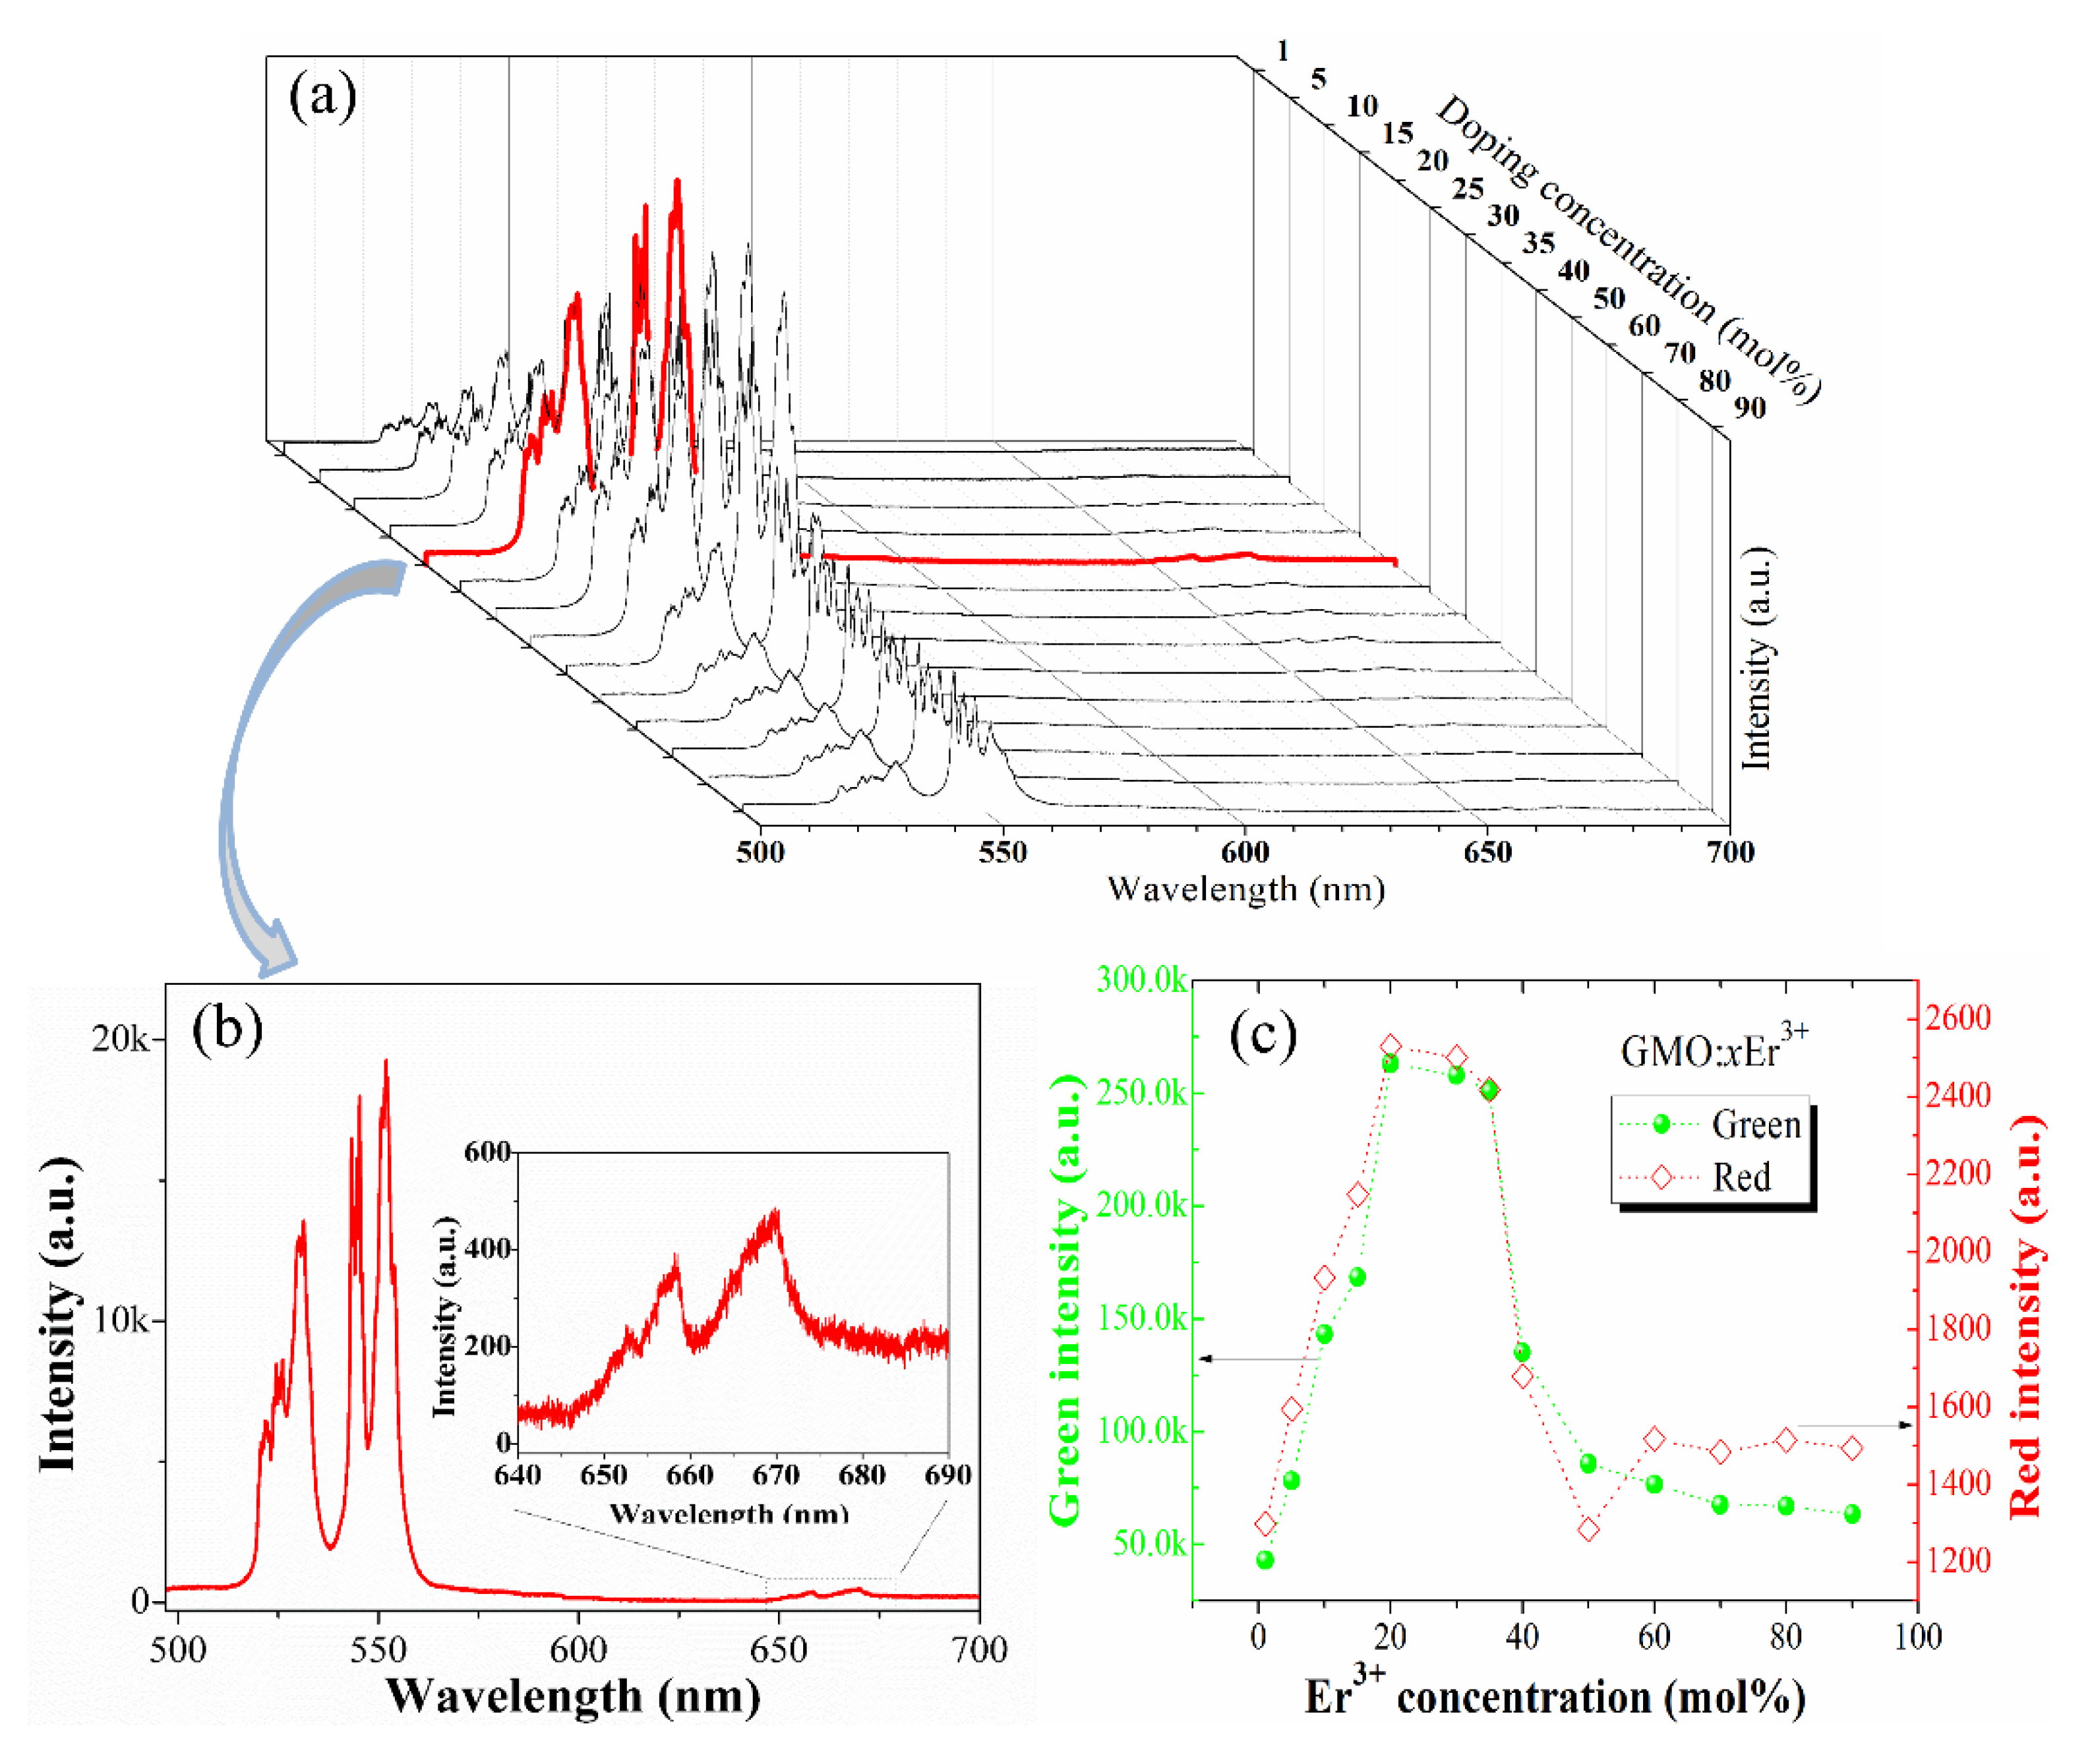
The upconversion emission properties of Gd2(MoO4)3:Er3+ phosphor depend strongly on the Er3+ doping concentration. To reveal the concentration-dependent upconversion luminescence properties, the upconversion luminescence spectra of Gd2(MoO4)3:xEr3+ phosphors under 976 nm LD excitation are shown in Figure 2a. When the Er3+ concentration increases to 20 mol%, the green and red upconversion emission intensities are the strongest, decreasing with increasing Er3+ concentration. The intense green and weak red emissions centered at 531, 552, and 668 nm are attributed to the 2H11/24I15/2, 4S3/24I15/2, and 4F9/24I15/2 transitions of Er3+, respectively. The green emission intensity is quite strong in comparison to the red emission intensity, as shown in Figure 2b. Compared with the Gd2(MoO4)3:1Er3+ phosphor, the green and red emission intensities of Gd2(MoO4)3:20Er3+ phosphor increase by about sixfold and twofold, respectively (see Figure 2c). As the Er3+ concentration increases from 20 to 60 mol%, the luminescence intensity decreases rapidly due to concentration quenching. When the concentration of Er3+ increases from 60 to 90 mol%, the green emission intensity decreases slowly as a result of the concentration quenching effect. The red emission intensity increases in this concentration range, possibly because at such a high Er3+ ion concentration, the distance between Er3+ ions is reduced, and the interaction is enhanced. Through cross relaxation, 2H11/24I9/2 and 4I15/24I13/2, the layout of the intermediate energy level (4I13/2) results in the enhancement of red emission [23]. When the Er3+ concentration in the Gd2(MoO4)3 host is as high as 20 mol%, concentration quenching has not occurred, indicating that Gd2(MoO4)3 is an excellent host material. This may be because the chemical properties of Er3+ ions and those of Gd3+ ions are similar, and their radii are almost the same. Therefore, Er3+ ions can easily replace Gd3+ ions in the matrix and enter the lattice.
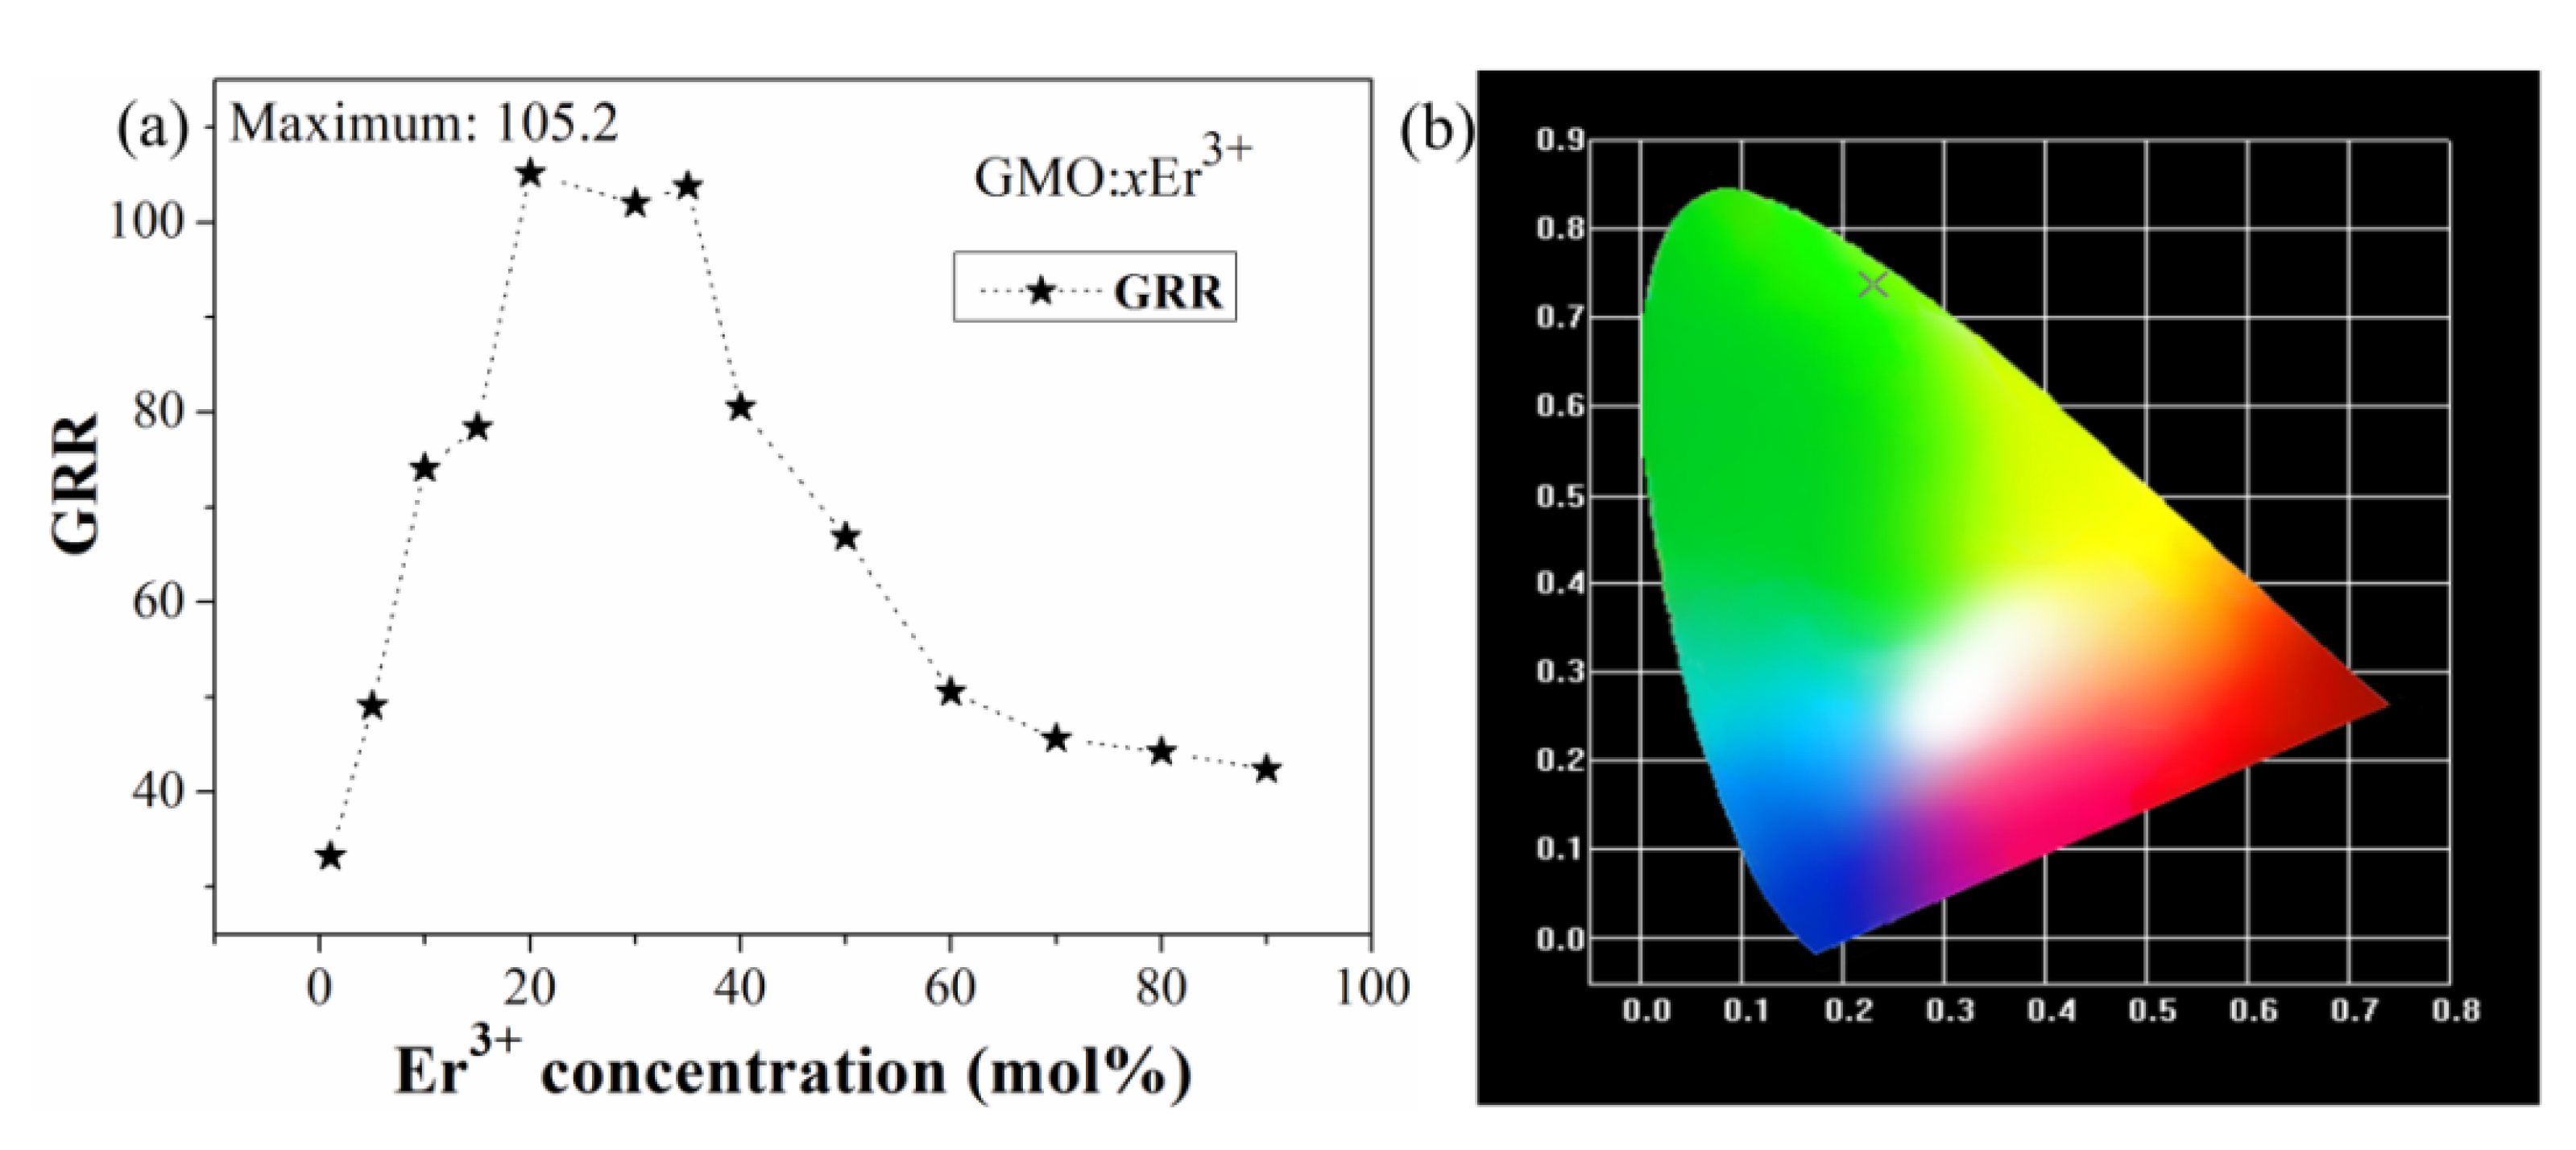
Figure 3a shows the intensity ratio of green and red light (GRR) in Gd2(MoO4)3:xEr3+ phosphors. With increased Er3+ concentration from 1 to 20 mol%, the GRR correspondingly increases from 33.2 to 105.2. However, as the Er3+ concentration continues to increase, GRR shows a decreasing trend. When the concentration of Er3+ is 90 mol%, the GRR is 42.4. Due to its high GRR, Er3+-doped Gd2(MoO4)3 powder is a high-quality green phosphor. The calculated chromaticity coordinate of Gd2(MoO4)3: 20Er3+ phosphor is X = 0.23 and Y = 0.74, falling exactly in the green region of the CIE chromaticity diagram (see Figure 3b).
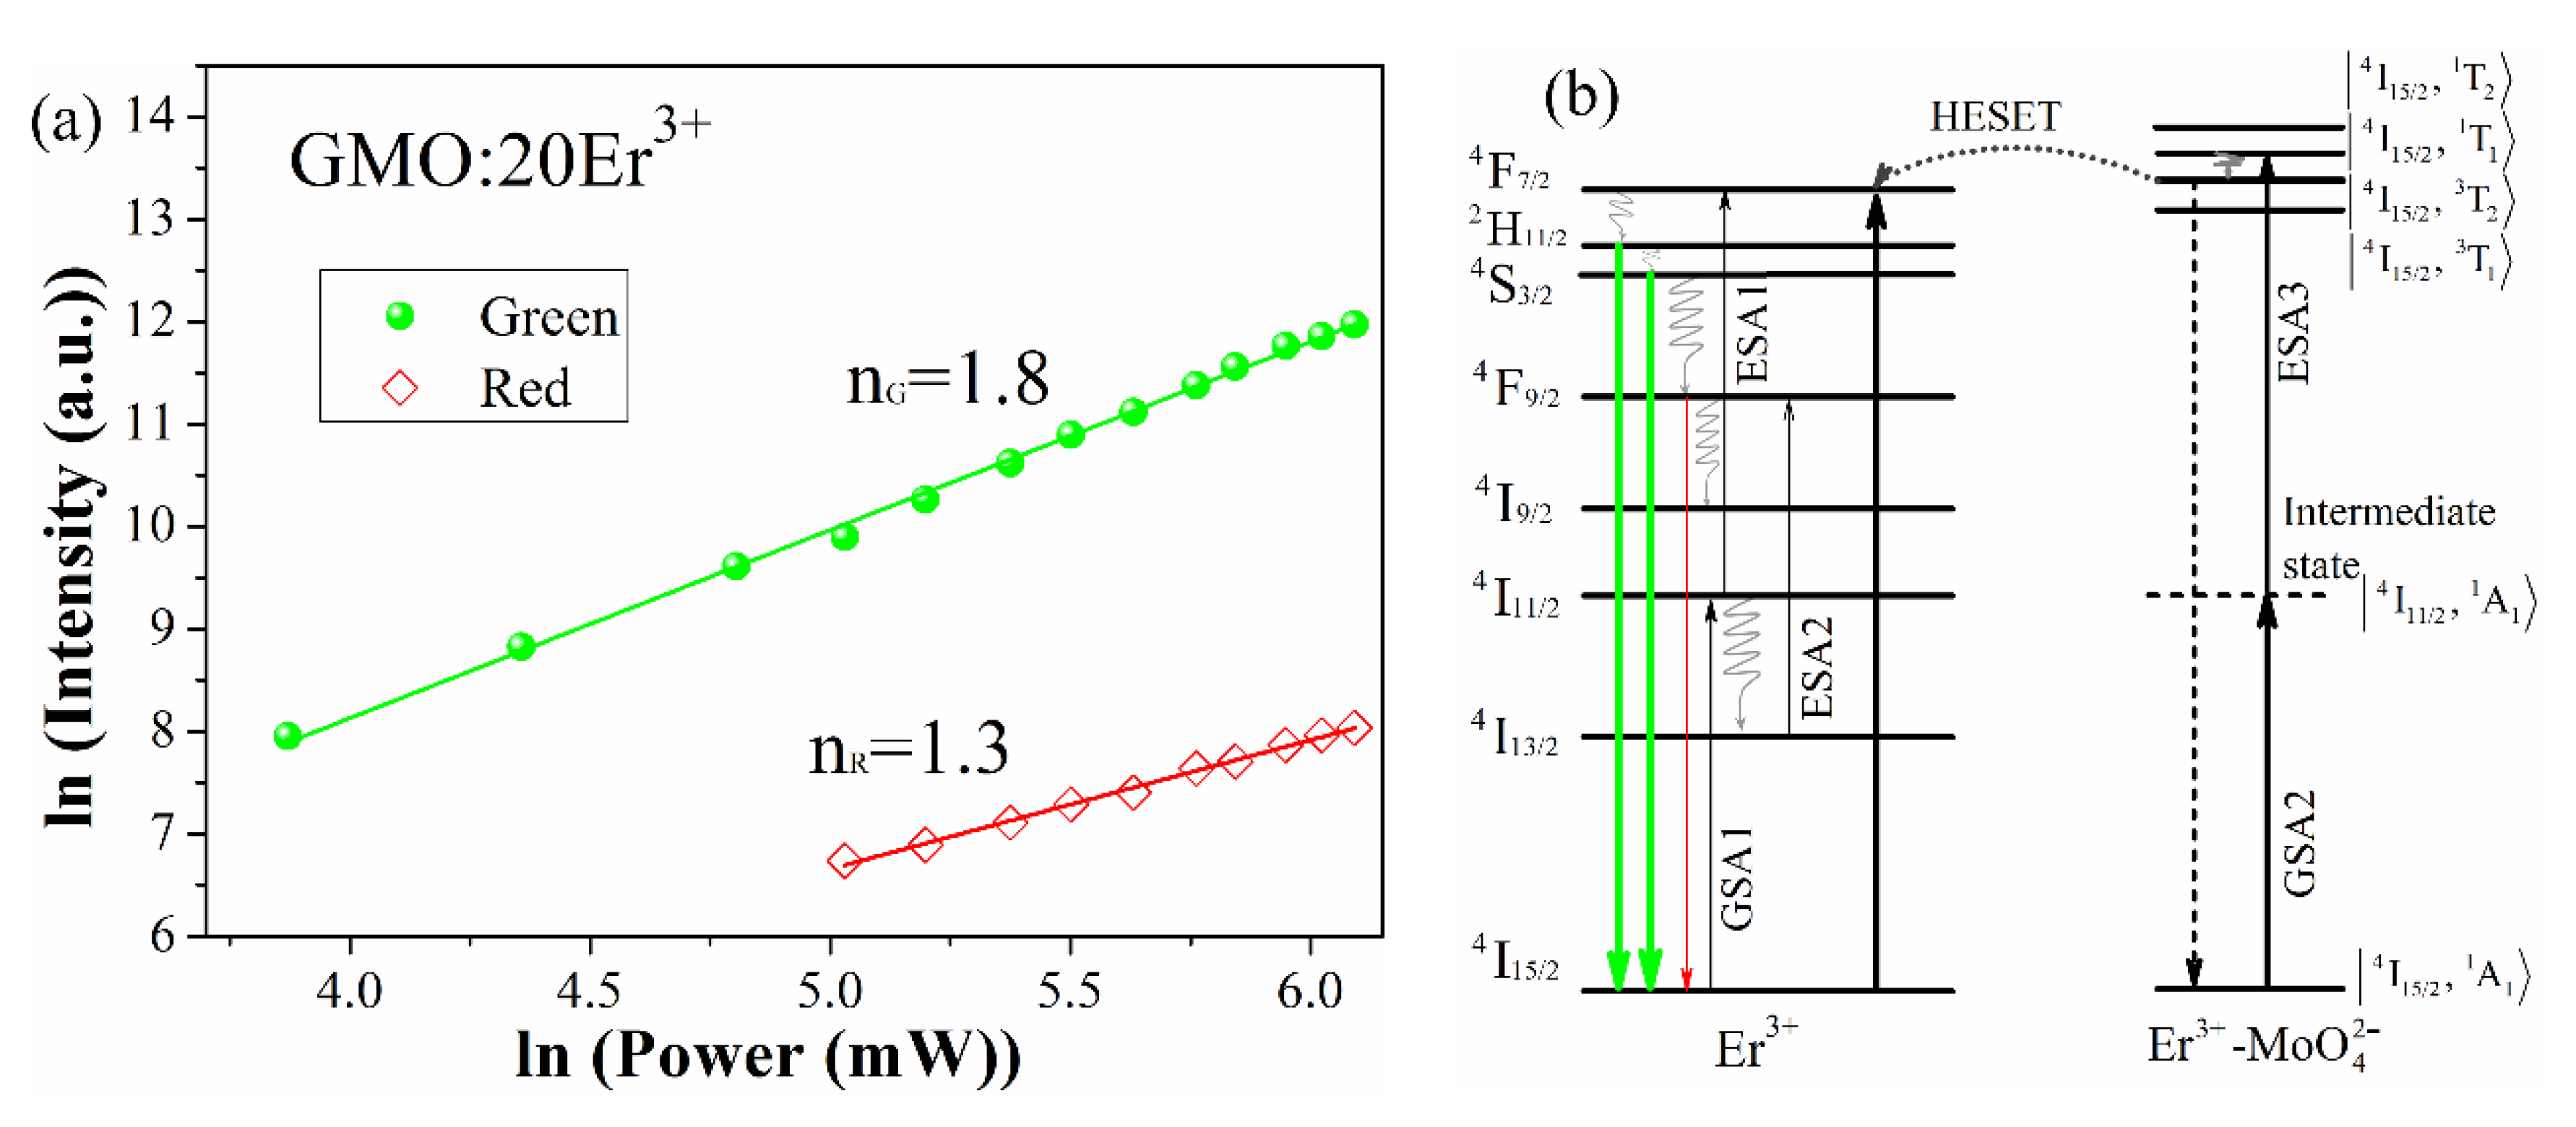
To understand the upconversion processes in Gd2(MoO4)3:Er3+ phosphor, the excitation power dependence of the green and red emission intensities was measured (see Figure 4a). In the upconversion process, the upconversion emission intensity is proportional to the n value of pumping laser power [24]
I P n
where I is the upconversion emission intensity, P is the pump laser power, and n is the number of pumping photons required in the upconversion process. The slopes (n value) are 1.8 and 1.3 for the green and red upconversion emissions, respectively. The n values indicate that two photons are involved in the green and red upconversion emissions. The possible upconversion mechanism for Gd2(MoO4)3:Er3+ phosphor is shown in Figure 4b, and the detailed upconversion mechanism was discussed in our previous work [18]. The 2H11/2/4S3/2 and 4F9/2 levels of Er3+ ions are populated via multiphonon relaxation from the 4F7/2 level, and the green and red upconversion emissions are observed. There are two possible upconversion pathways for population of the 4F7/2 level of Er3+. The first is the electronic transition from ground state 4I15/2 to the 4I11/2 level via ground-state absorption (GSA1), with further excitation to the 4F7/2 level via excited-state absorption (ESA1). The second possible upconversion pathway is a high excited state energy transfer (HESET). The Er3+–MoO42− dimer complex absorbs an infrared photon and is excited from the ground state |4I15/2, 1A1> to the intermediate state |4I11/2, 1A1> via GSA2 under 976 nm excitation. Subsequently, the |4I15/2, 1T1> state is further excited from the |4I11/2, 1A1> state via ESA3 and then decays nonradiatively to the |4I15/2, 3T2> state. The energy transfer from |4I15/2, 3T2> to the 4F7/2 level of Er3+ via the HESET process is efficient. Thus, the populated 4F7/2 level relaxes nonradiatively by a fast multiphonon decay process to the 2H11/2/4S3/2 and 4F9/2 levels. Then, the electrons transition from the excited state (2H11/2/4S3/2 and 4F9/2) to the ground state, accompanied by intense green and weak red emissions, in agreement with our experimental results (see Figure 2a). Furthermore, the 4F9/2 (Er3+) is populated via ESA2, which involves the 4F9/24I13/2 transition.

3.3. Concentration Quenching Analysis

As previously stated, Gd2(MoO4)3:Er3+ phosphor emitted remarkably intense green emission under excitation at 976 nm, and Er3+ concentration up to 20 mol% did not cause concentration quenching. Typically, the optimal doping concentration of Er3+ ions does not exceed 2 mol% to reduce excitation energy loss due to cross relaxation. Why is the Er3+ doping concentration of Gd2(MoO4)3 so high? According to the Dexter theory, the functional relationship between the fluorescence intensity (I) and the activator concentration (x) can be expressed as [25,26,27]:
I 1 + A / γ α 1 s / 3 Γ 1 + s / 3 α 1
where α = x 1 + A X 0 / γ 3 / s Γ 1 s / 3 x ; Γ(1 − s/3) is a Γ function; simplies the interaction mechanism between Er3+ ions; s = 3, 6, 8, and 10 denote exchange interaction, electric dipole-dipole interaction, electric dipole-quadrupole interaction, and electric quadrupole-quadrupole interaction, respectively; γ is the intrinsic transition probability of the donor; I is the upconversion emission intensity for 2H11/2/4S3/24I15/2 transitions of Er3+; x is the Er3+ concentration; and A and X0 are constants. Given the logarithm operation on both sides of Equation (2), the following can be derived [27,28]:
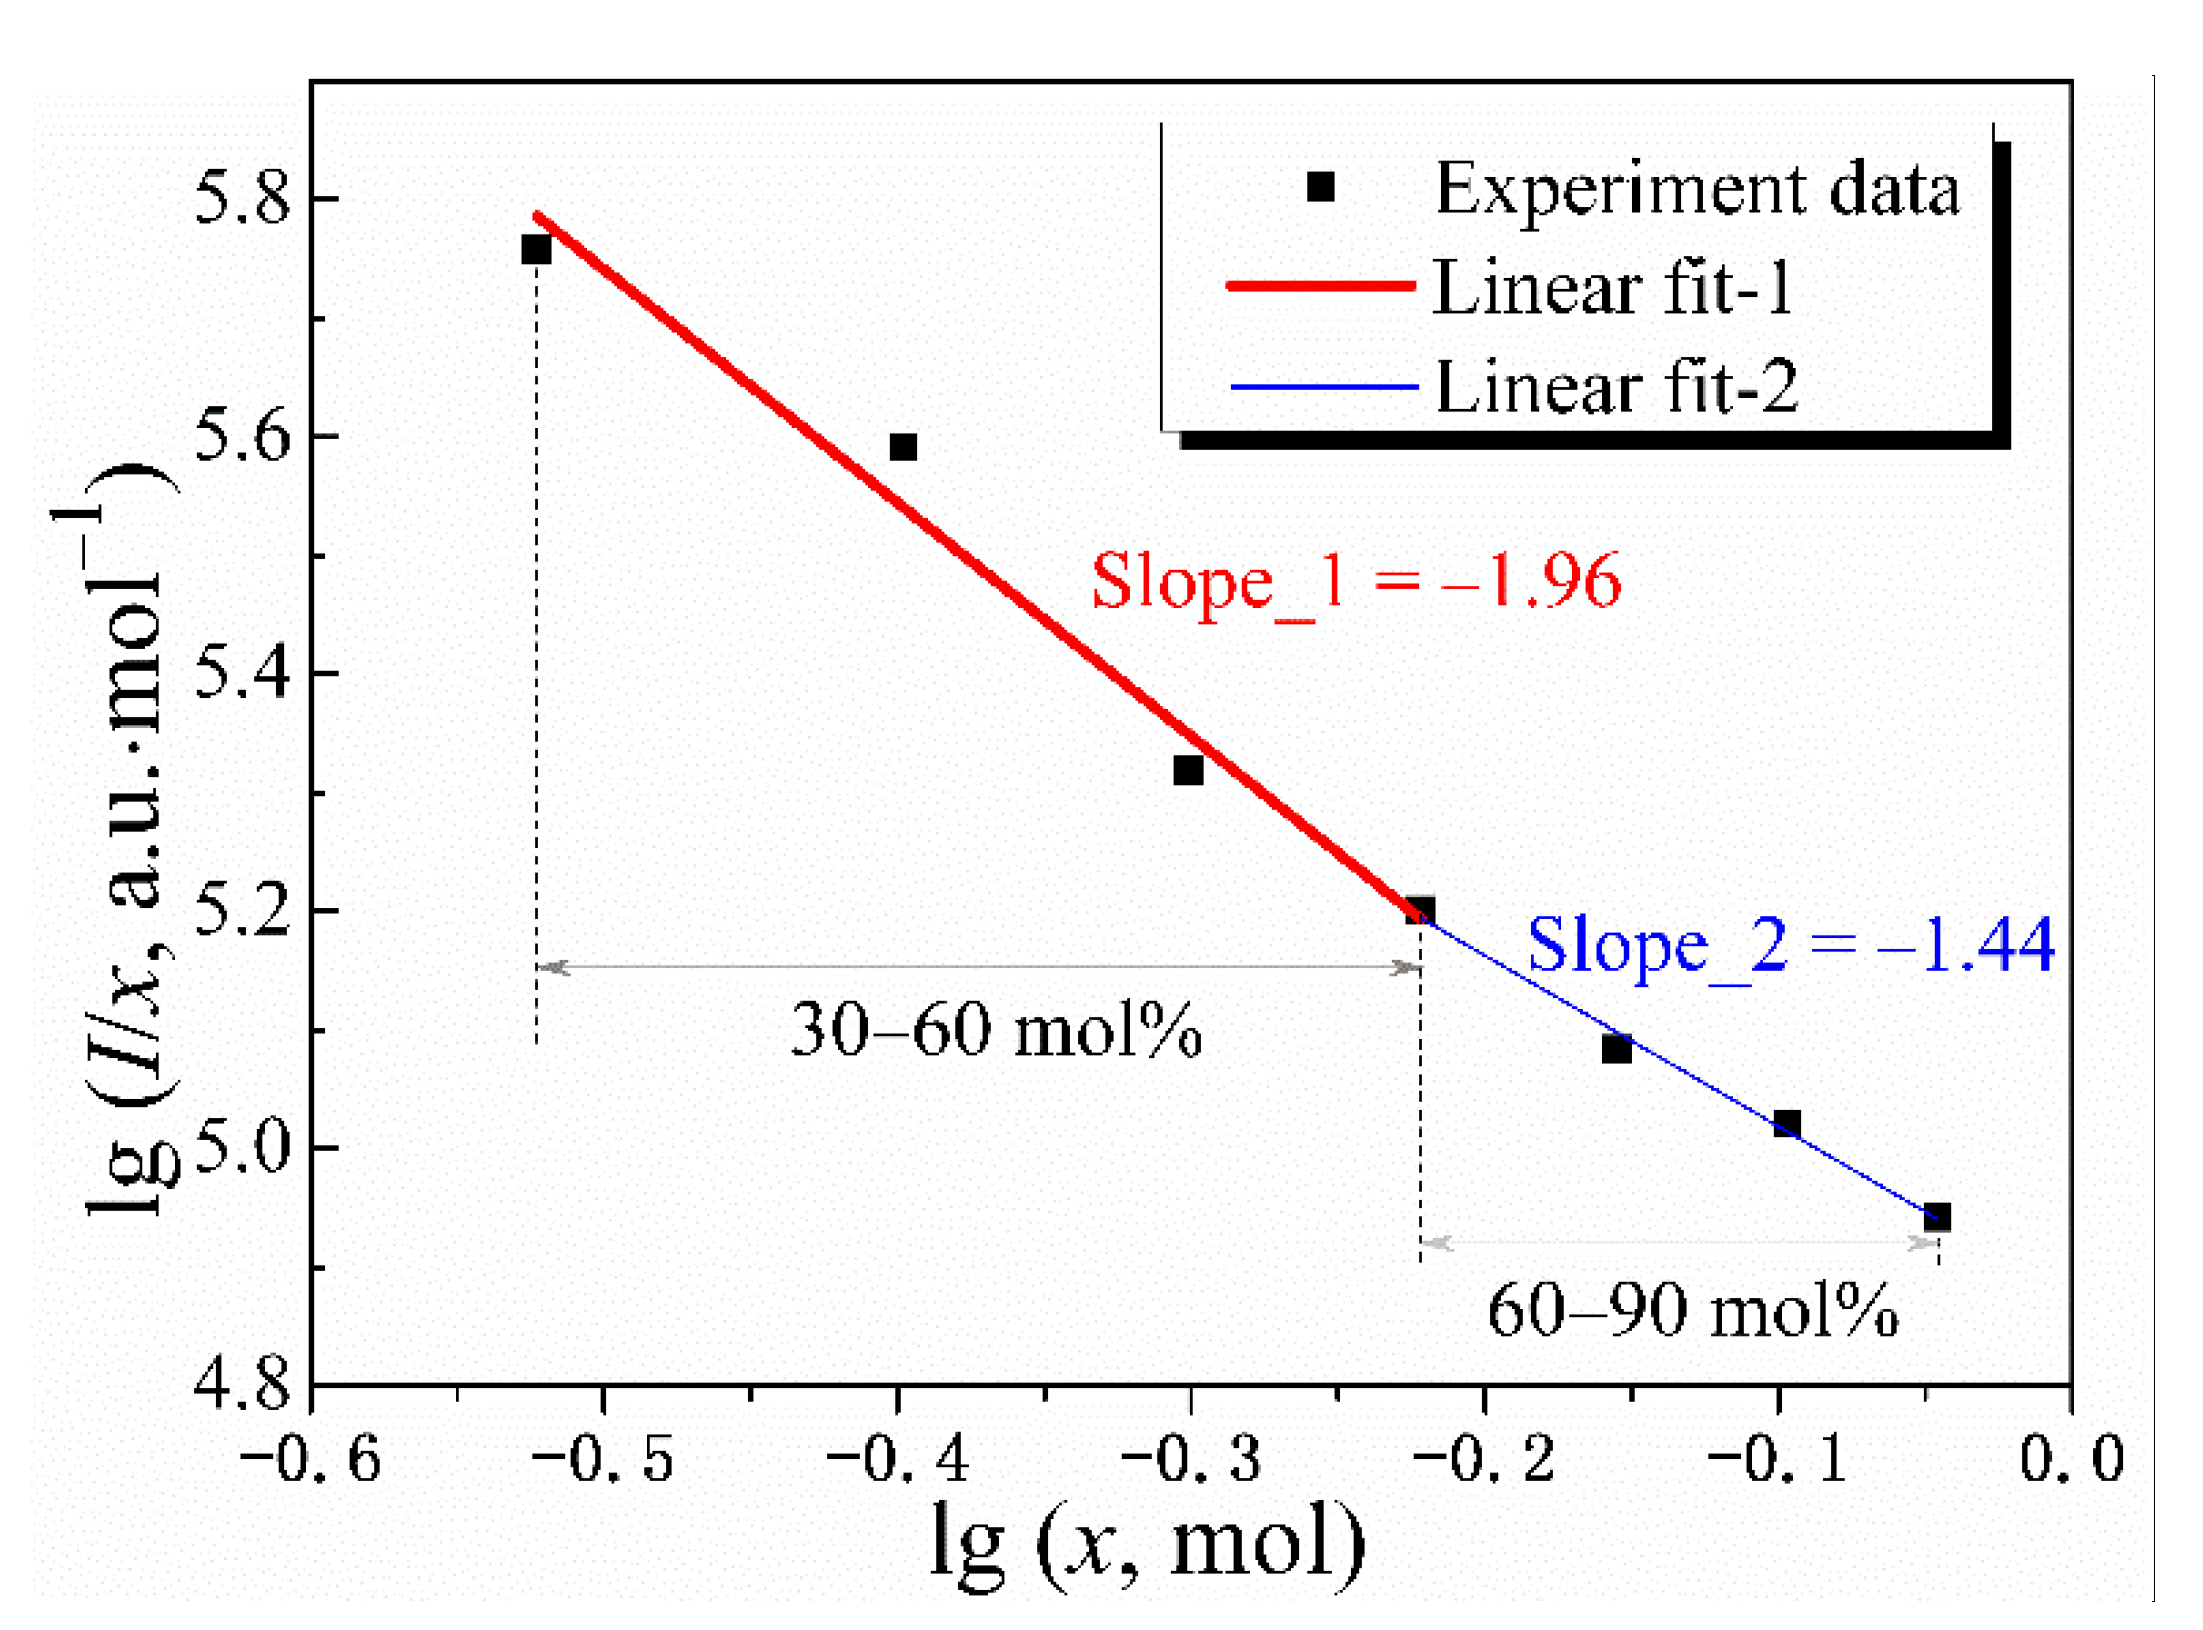
lg I / x = s / 3 · lg x + b
where b is the constant. Plots of lg(I/x) versus lgx are depicted in Figure 5 based on the upconversion emission spectra. The concentration quenching phenomenon occurs only when the Er3+ concentration is greater than 20 mol%, so the selected concentration is in the range of 30 to 90 mol%. When the Er3+ concentration is 30–60 mol%, the slope obtained by the fitting is −1.96, and the corresponding s value is 5.88 (1.96 × 3), which is very close to the theoretical value of 6 for the electric dipole–dipole interaction (see Figure 5). Therefore, in Gd2(MoO4)3:Er3+ phosphor, the fluorescence quenching caused by Er3+ concentration in the range of 30–60 mol% is governed by the electric dipole–dipole interaction. When the Er3+ concentration is increased from 60 to 90 mol%, the corresponding s value is 4.32 (1.44 × 3), which approaches the theoretical value of 3 for the exchange interactions. Therefore, it is inferred that in this concentration range, the fluorescence quenching is mainly caused by the exchange interaction.
To obtain insight into the concentration quenching, Dexter also pointed out that the type of activator ion interaction is crucially determined by the distance between the activator ions [25]. Blasse and Grabmaier calculated that when the critical distance (Rc) between the activator ions is in the range of 5–8 Å, the fluorescence quenching is caused by the exchange interaction, and when the Rc is about 3 nm, the fluorescence quenching is caused by the electric dipole–dipole interaction. RC can be calculated according to the following formula [29]:
R C 2 3 V 4 π x C N 1 / 3
where V is the unit cell volume, xC is the critical concentration of activator ions, and N refers to the number of cations in the unit cell. The monoclinic Gd2(MoO4)3 with space group C2/c (a = 7.55, b = 11.44, c = 11.47 Å, V = 934.51 Å3, β = 109.32 degree, Z = 4) is constructed by GdO8 and MoO4 polyhedral groups. According to the above inference, the Er3+ ion concentration of 60 mol% is the turning point of the Er3+ ion exchange interaction and electric dipole–dipole interaction. Substituting xC = 0.6 into equation (4) yields RC = 9 Å. This distance is very close to the critical distance of 8 Å for the exchange interaction. The radius of Er3+ ions is 0.89 Å, which is slightly smaller than the Gd3+ ion radius of 0.94 Å. When the Er3+ concentration is as high as 60 mol%, it is reasonable to believe that the calculated RC is larger than the real value. That is, when the Er3+ ion concentration is 60 mol%, the exchange interaction has already occurred. This further verifies the correctness of the above inferences. Due to the unique lattice structure of Gd2(MoO4)3, the distance between the activated ions is large, allowing for higher concentrations to be incorporated without concentration quenching. Combined with the model analysis, this result can also provide some theoretical guidance to identify a host that allows for the incorporation of high concentrations of rare earth elements.

4. Conclusions

In summary, Gd2(MoO4)3:xEr3+ phosphors with a monoclinic phase were prepared by a simple sol–gel method. The phosphors exhibit intense upconversion green emission under 976 nm excitation. The delayed quenching concentration for 2H11/2/4S3/24I15/2 transition of Er3+ reaches up to 20 mol%. When the Er3+ concentration is in the range of 30–60 mol%, the concentration quenching progress is governed by the electric dipole–dipole interaction, and when the Er3+ concentration is greater than 60 mol%, concentration quenching is governed by the exchange interaction. The results show that Gd2(MoO4)3:Er3+ powder is an excellent green phosphor, and Gd2(MoO4)3 material is an excellent host for lanthanide heavy doping.

Author Contributions

Writing and editing, methodology, D.L.; phosphor synthesis and characterization, B.X., Z.Z., and T.Z.; crystal structural analysis, D.W. and X.L.; upconversion mechanism analysis, X.J. and Q.L.; ideas, reviewing, and editing, Z.H. All authors have read and agreed to the published version of the manuscript.

Funding

This research was supported by the National Natural Science Foundation of China (61705095 and 12004093), the Natural Science Foundation of Guangdong Province (2022A1515012448, 2019A1515011461, and 2019A1515011228), Special Projects in Key Areas of Guangdong Higher Education Institutes (2019KZDZX2008), Key Scientific Research Platforms and Projects in Guangdong Universities (2020ZDZX2055 and 2022ZDZX2041), the Science and Technology Program of Zhanjiang (2020A03003 and 2021A05042), and the Yanling Excellent Young Teacher Program of Lingnan Normal University (YL20200102).

Institutional Review Board Statement

Not applicable.

Informed Consent Statement

Not applicable.

Data Availability Statement

Not applicable.

Acknowledgments

The authors would like to thank Yuxiao Wang for helpful discussions on topics related to this work. The authors would like to acknowledge financial support from NSFC, NSF of Guangdong Province, and Key Scientific Research Platforms and Projects in Guangdong Universities.

Conflicts of Interest

The authors declare no conflict of interest.

References

  1. Wang, X.; Li, C.; Li, Z.; Ma, X.; Chen, D.; Wan, X.; Deng, Z.; Deng, R.; Peng, X. Near-Infrared-Light Emitting Diode Driven White Light Emission: Upconversion Nanoparticles Decorated Metal-Organic Frame-works Thin Film. Chem. Eng. J. 2021, 409, 128220. [Google Scholar] [CrossRef]
  2. Scheps, R. Upconversion Laser Processes. Prog. Quant. Electron. 1996, 20, 271–358. [Google Scholar] [CrossRef] [Green Version]
  3. Li, D.; Sun, W.; Shao, L.; Wu, S.; Huang, Z.; Jin, X.; Zhang, Q.; Li, Q. Tailoring Solar Energy Spectrum for Efficient Organic/Inorganic Hybrid Solar Cells by Up-conversion Luminescence Nanophosphors. Electrochim. Acta 2015, 182, 416–423. [Google Scholar] [CrossRef]
  4. Zhang, X.; Ali, R.F.; Boyer, J.C.; Branda, N.R.; Gates, B.D. Direct Photolithographic Deposition of Color-Coded Anti-Counterfeit Patterns with Titania Encapsulated Upconverting Nanoparticles. Adv. Opt. Mater. 2020, 8, 2000664. [Google Scholar] [CrossRef]
  5. Du, P.; Ran, W.; Wang, C.; Luo, L.; Li, W. Facile Realization of Boosted Near-Infrared-Visible Light Driven Photocatalytic Activities of BiOF Nanoparticles through Simultaneously Exploiting Doping and Upconversion Strategy. Adv. Mater. Inter. 2021, 8, 2100749. [Google Scholar] [CrossRef]
  6. Hong, A.R.; Kyhm, J.H.; Kang, G.; Jang, H.S. Orthogonal R/G/B Upconversion Luminescence-Based Full-Color Tunable Upconversion Nanophosphors for Transparent Displays. Nano Lett. 2021, 21, 4838–4844. [Google Scholar] [CrossRef]
  7. Li, D.; Xu, W.; Huang, Z.; Jin, X.; Xu, B.; Zhang, Z.; Zhang, T.; Wang, D.; Liu, X.; Suo, H.; et al. Simultaneous Enhancement of Emission and Thermal Sensitivity via Phase Transition in Gd2(MoO4)3:Yb3+/Er3+ Crystals. J Am Ceram Soc. 2022, 1–10. [Google Scholar] [CrossRef]
  8. Liu, Y.; Lu, Y.; Yang, X.; Zheng, X.; Wen, S.; Wang, F.; Vidal, X.; Zhao, J.; Liu, D.; Zhou, Z. Amplified Stimulated Emission in Upconversion Nanoparticles for Super-Resolution Nanoscopy. Nature 2017, 543, 229–233. [Google Scholar] [CrossRef]
  9. Wang, F.; Banerjee, D.; Liu, Y.; Chen, X.; Liu, X. Upconversion Nanoparticles in Biological Labeling, Imaging, and Therapy. Analyst 2010, 135, 1839–1854. [Google Scholar] [CrossRef]
  10. Wen, S.; Zhou, J.; Zheng, K.; Bednarkiewicz, A.; Liu, X.; Jin, D. Advances in Highly Doped Upconversion Nanoparticles. Nat. Commun. 2018, 9, 1–12. [Google Scholar] [CrossRef]
  11. Chen, B.; Wang, F. Emerging Frontiers of Upconversion Nanoparticles. Tren. Chem. 2020, 2, 427–439. [Google Scholar] [CrossRef]
  12. Chen, B.; Wang, F. Combating Concentration Quenching in Upconversion Nanoparticles. Acc. Chem. Res. 2019, 53, 358–367. [Google Scholar] [CrossRef]
  13. Liu, L.; Lu, K.; Xu, L.; Tang, D.; Liu, C.; Shahzad, M.K.; Yan, D.; Khan, F.; Zhao, E.; Li, H. Highly Efficient Upconversion Luminescence of Er Heavily Doped Nanocrystals through 1530 nm Excitation. Opt. Lett. 2019, 44, 711–714. [Google Scholar] [CrossRef]
  14. Wen, S.; Li, D.; Liu, Y.; Chen, C.; Wang, F.; Zhou, J.; Bao, G.; Zhang, L.; Jin, D. Power-Dependent Optimal Concentrations of Tm3+ and Yb3+ in Upconversion Nanoparticles. J. Phys. Chem. Lett. 2022, 13, 5316–5323. [Google Scholar] [CrossRef]
  15. Johnson, N.J.; He, S.; Diao, S.; Chan, E.M.; Dai, H.; Almutairi, A. Direct Evidence for Coupled Surface and Concentration Quenching Dynamics in Lanthanide-Doped Nanocrystals. J. Am. Chem. Soc. 2017, 139, 3275–3282. [Google Scholar] [CrossRef]
  16. Liu, Y.; Pan, G.; Gao, H.; Zhang, H.; Ao, T.; Gao, W.; Mao, Y. Single Band Red Emission of Er3+ Ions Heavily Doped Upconversion Nanoparticles Realized by Active-Core/Active-Shell Structure. Ceram. Int. 2021, 47, 18824–18830. [Google Scholar] [CrossRef]
  17. Liang, X.; Huang, X.; Zhang, Q. Gd2(MoO4)3:Er3+ Nanophosphors for an Enhancement of Silicon Solar-Cell Near-Infrared Response. J. Fluoresc. 2009, 19, 285–289. [Google Scholar] [CrossRef]
  18. Li, D.; Huang, Z.; Nie, Z.; Zhang, L.; Bai, Y.; Zhang, X.; Song, Y.; Wang, Y. Anomalous Upconversion Luminescence of SrMoO4:Yb3+/Er3+ Nanocrystals by High Excited State Energy Transfer. J. Alloys Comp. 2015, 650, 799–804. [Google Scholar] [CrossRef]
  19. Jin, X.; Li, H.; Li, D.; Zhang, Q.; Li, F.; Sun, W.; Chen, Z.; Li, Q. Role of Ytterbium-Erbium Co-Doped Gadolinium Molybdate (Gd2(MoO4)3:Yb/Er) Nanophosphors in Solar Cells. Opt. Express 2016, 24, A1276–A1287. [Google Scholar] [CrossRef]
  20. Lim, C.S.; Aleksandrovsky, A.; Molokeev, M.; Oreshonkov, A.; Atuchin, V. The Modulated Structure and Frequency Upconversion Properties of CaLa2(MoO4)4:Ho3+/Yb3+ Phosphors Prepared by Microwave Synthesis. Phys. Chem. Chem. Phys. 2015, 17, 19278–19287. [Google Scholar] [CrossRef]
  21. Chang Sung, L.; Victor, V.A.; Aleksandr, S.A.; Yuriy, G.D.; Maxim, S.M.; Aleksandr, S.O. Fabrication of Microcrystalline NaPbLa(WO4)3:Yb3+/Ho3+ Phosphors and Their Upconversion Photoluminescent Characteristics. J. Korean Mater. Res. 2019, 29, 741–746. [Google Scholar]
  22. Lim, C.S.; Atuchin, V.V.; Aleksandrovsky, A.S.; Molokeev, M.S. Preparation of NaSrLa(WO4)3:Ho3+/Yb3+ Ternary Tungstates and Their Upconversion Photoluminescence Properties. Mater. Lett. 2016, 181, 38–41. [Google Scholar] [CrossRef]
  23. Bae, H.; Lee, E.; Lee, K.T. Power-Dependent Photophysical Pathways of Upconversion in BaTiO3:Er3+. Phys. Chem. Chem. Phys. 2021, 23, 14587–14591. [Google Scholar] [CrossRef] [PubMed]
  24. Pollnau, M.; Gamelin, D.R.; Lüthi, S.R.; Güdel, H.U.; Hehlen, M.P. Power Dependence of Upconversion Luminescence in Lanthanide and Transition-Metal-Ion Systems. Phys. Rev. B 2000, 61, 3337–3346. [Google Scholar] [CrossRef]
  25. Dexter, D.L. A Theory of Sensitized Luminescence in Solids. J. Chem. phys. 1953, 21, 836–850. [Google Scholar] [CrossRef]
  26. Van Uitert, L. Characterization of energy transfer interactions between rare earth ions. J. Electrochem. Soc. 1967, 114, 1048. [Google Scholar] [CrossRef]
  27. Ozawa, L.; Jaffe, P.M. The Mechanism of the Emission Color Shift with Activator Concentration in Eu+3 Activated Phosphors. J. Electrochem. Soc. 1971, 118, 1678. [Google Scholar] [CrossRef]
  28. Li, H.; Zhao, R.; Jia, Y.; Sun, W.; Fu, J.; Jiang, L.; Zhang, S.; Pang, R.; Li, C. Sr1.7Zn0.3CeO4: Eu3+ Novel Red-Emitting Phosphors: Synthesis and Photoluminescence Properties. ACS Appl. Mater. Interf. 2014, 6, 3163–3169. [Google Scholar] [CrossRef]
  29. Blasse, G. Energy Transfer in Oxidic Phosphors. Phys. Lett. A 1968, 28, 444–445. [Google Scholar] [CrossRef]
Figure 1. XRD patterns of Gd2(MoO4)3:xEr3+ (x = 0, 10, 20, 40, 60, 80, 90 mol%) phosphors (a). SEM image (b) and EDS spectrum (c) of Gd2(MoO4)3:20Er3+ phosphor. The inset of (b) shows the particle size distribution.
Nanomaterials 12 03641 g001
Figure 2. Upconversion emission spectra of Gd2(MoO4)3:xEr3+ phosphors (a). Upconversion emission spectrum of Gd2(MoO4)3:20Er3+ phosphor; inset: the red emission band (b). The intensities of green emission (left) and red emission (right) as a function of Er3+ concentration in Gd2(MoO4)3:xEr3+ phosphors (c).
Nanomaterials 12 03641 g002
Figure 3. GRR as a function of Er3+ concentration in Gd2(MoO4)3:xEr3+ phosphors (a). CIE chromaticity diagram of Gd2(MoO4)3:20Er3+ phosphor (b).
Nanomaterials 12 03641 g003
Figure 4. Pump power dependence of the green and red emission intensities in Gd2(MoO4)3:20Er3+ phosphor (a). Energy-level diagrams and possible upconversion mechanism for Gd2(MoO4)3:Er3+ phosphor (b).
Nanomaterials 12 03641 g004
Figure 5. Plots of lg(I/x) versus lgx of Gd2(MoO4)3:xEr3+ phosphors under 976 nm excitation.
Nanomaterials 12 03641 g005
Publisher’s Note: MDPI stays neutral with regard to jurisdictional claims in published maps and institutional affiliations.