1. Introduction
Since the discovery of the plastic continent, use of polymers is becoming controversial due to their extraction and their uncontrolled end of life. Especially the pollution by non-biodegradable plastics, due to a lack of recycling possibilities, degradation into microplastics in the landscape are problematic. However, plastics have numerous advantages: they can save lives when they are used as COVID-19 protection clothes or any medical devices; they can lighten structures and then reduce the kerosene or oil consumption, decreasing the CO2 emission in the transportation domain. Polymers are also used in energy domain (fuel cells, battery, etc.) for devices with less CO2-emitting conversion principles.
In order to meet the environmental and social concerns, a way is to use bio-based and/or bio-degradable polymers. Bio-based allows to dispense from petroleum, whereas biodegradable prevents from the pollution of soils and seas. However, this last case is only recommended for special applications such as packaging, whereas for many other applications, biodegradability is not required.
PLA and PA11 are two bio-based polymers and their blend leads to a polymeric material with interesting properties, depending on the ratio of each polymer in the final blend. Indeed, it is now well-established that by varying the proportion of each polymer in a blend, it is possible to tune the final properties, especially fire [
1] and mechanical [
2] properties. The influence of the proportion of each polymer in PLA/PA11 blends was studied regarding the morphology [
3], rheological properties [
4], and mechanical properties [
5].
Nanoparticles are particles with at least one dimension lower than 100 nm. Due to their high specific surface area, nanoparticles are known to improve mechanical, thermal, fire, barrier, or electrical properties of the polymeric medium in which they are dispersed. However, dispersion of nanoparticles in polymers must be controlled in order to take into account their high specific surface area. By dispersing nanoparticles into polymer blends it is possible to change the morphology and then the final properties. Parameters that play a key role in the morphology of polymer blend nanocomposites are nanoparticle parameters (size, shape, aspect ratio, surface chemistry), polymer parameters (viscosity and viscosity ratio, interfacial tension, melting temperature), and processing parameters (mainly sequence of mixing) [
6]. Hence, by adding nanoparticles into a polymer blend it is possible to attain unexpected morphologies and enhanced final properties.
Regarding the influence of nanoparticles (NPs) on the morphology of polymer blend, NPs have a general tendency to extend the dual continuity zone [
7,
8,
9,
10,
11]. The co-continuous morphology is a non-equilibrium morphology which is formed during the processing when the breakup time of the elongated domains becomes longer than coalescence phenomenon; that is to say when the relaxation processes are slowed down. Hence, when dispersed in the minor phase, NPs can slow down the relaxation of this phase and extend the dual continuity zone. This was explained by Steimann et al. [
12] while adding glass spheres of 250 nm diameter into a poly(methyl methacrylate)/ polystyrene (PMMA/PS) blend. Liu et al. [
13] explored the shape relaxation processes of PS droplets filled with nanosilica into a polypropylene (PP) matrix. Nano-silica were found to retard the relaxation process of the elongated PS droplets due to the increased friction that decreases the mobility of molecular chains. In another article, Wu et al. [
14] observed a transition from sea-island to co-continuous morphology when adding small amounts of carbon black (CB) into a 80/20 Acrylonitrile-Butadiene-Styrene/polyamide6 (ABS/PA6) blend. They explained this change in morphology by the self-networking of CB into PA6 dispersed phase.
The increased elasticity and viscosity of the phase that hosted the nanoparticles influence the final morphology by slowing down the relaxation of elongated polymer phases during processing. Another parameter that influences the elongation and relaxation of the filled droplets is the interfacial tension [
8]. Indeed, interfacial tension between two polymers is affected when nanoparticles are added in one of the two phases.
A previous study dealt with the dispersion of organoclay, sepiolite and carbon nanotubes (CNTs) into 90/10 and 70/30 PLA/PA11 blends [
15]. The authors evidenced that the three fillers bearing different high aspect ratio preferentially located in the PA11 dispersed phase. Moreover, the three fillers were able to convert the droplet-matrix morphology into a co-continuous one. The sepiolite needles were more effective than the CNTs in inducing co-continuity, suggesting that the deformability of the nanoparticles was another important parameter to take into account. Fumed silica were used by Chen et al. [
16] to refine the morphology of 80/20 PS/PP blends and to compatibilize this blend. However, to the best of our knowledge, the effect of different fumed silica (bearing different surface energy) on the morphology of PLA/PA11 blends was not studied.
In the present work, we propose to study the effect of spherical silica nanoparticles bearing a fractal structure (fumed silica) [
17] on the final morphology of a 80/20 PLA/PA11 blend. We tested two different fumed silica: one hydrophilic and one hydrophobic. The microstructure of the blend nanocomposites is deeply investigated and a link is established between these microstructures and the rheological behavior.
2. Materials and Methods
2.1. Materials
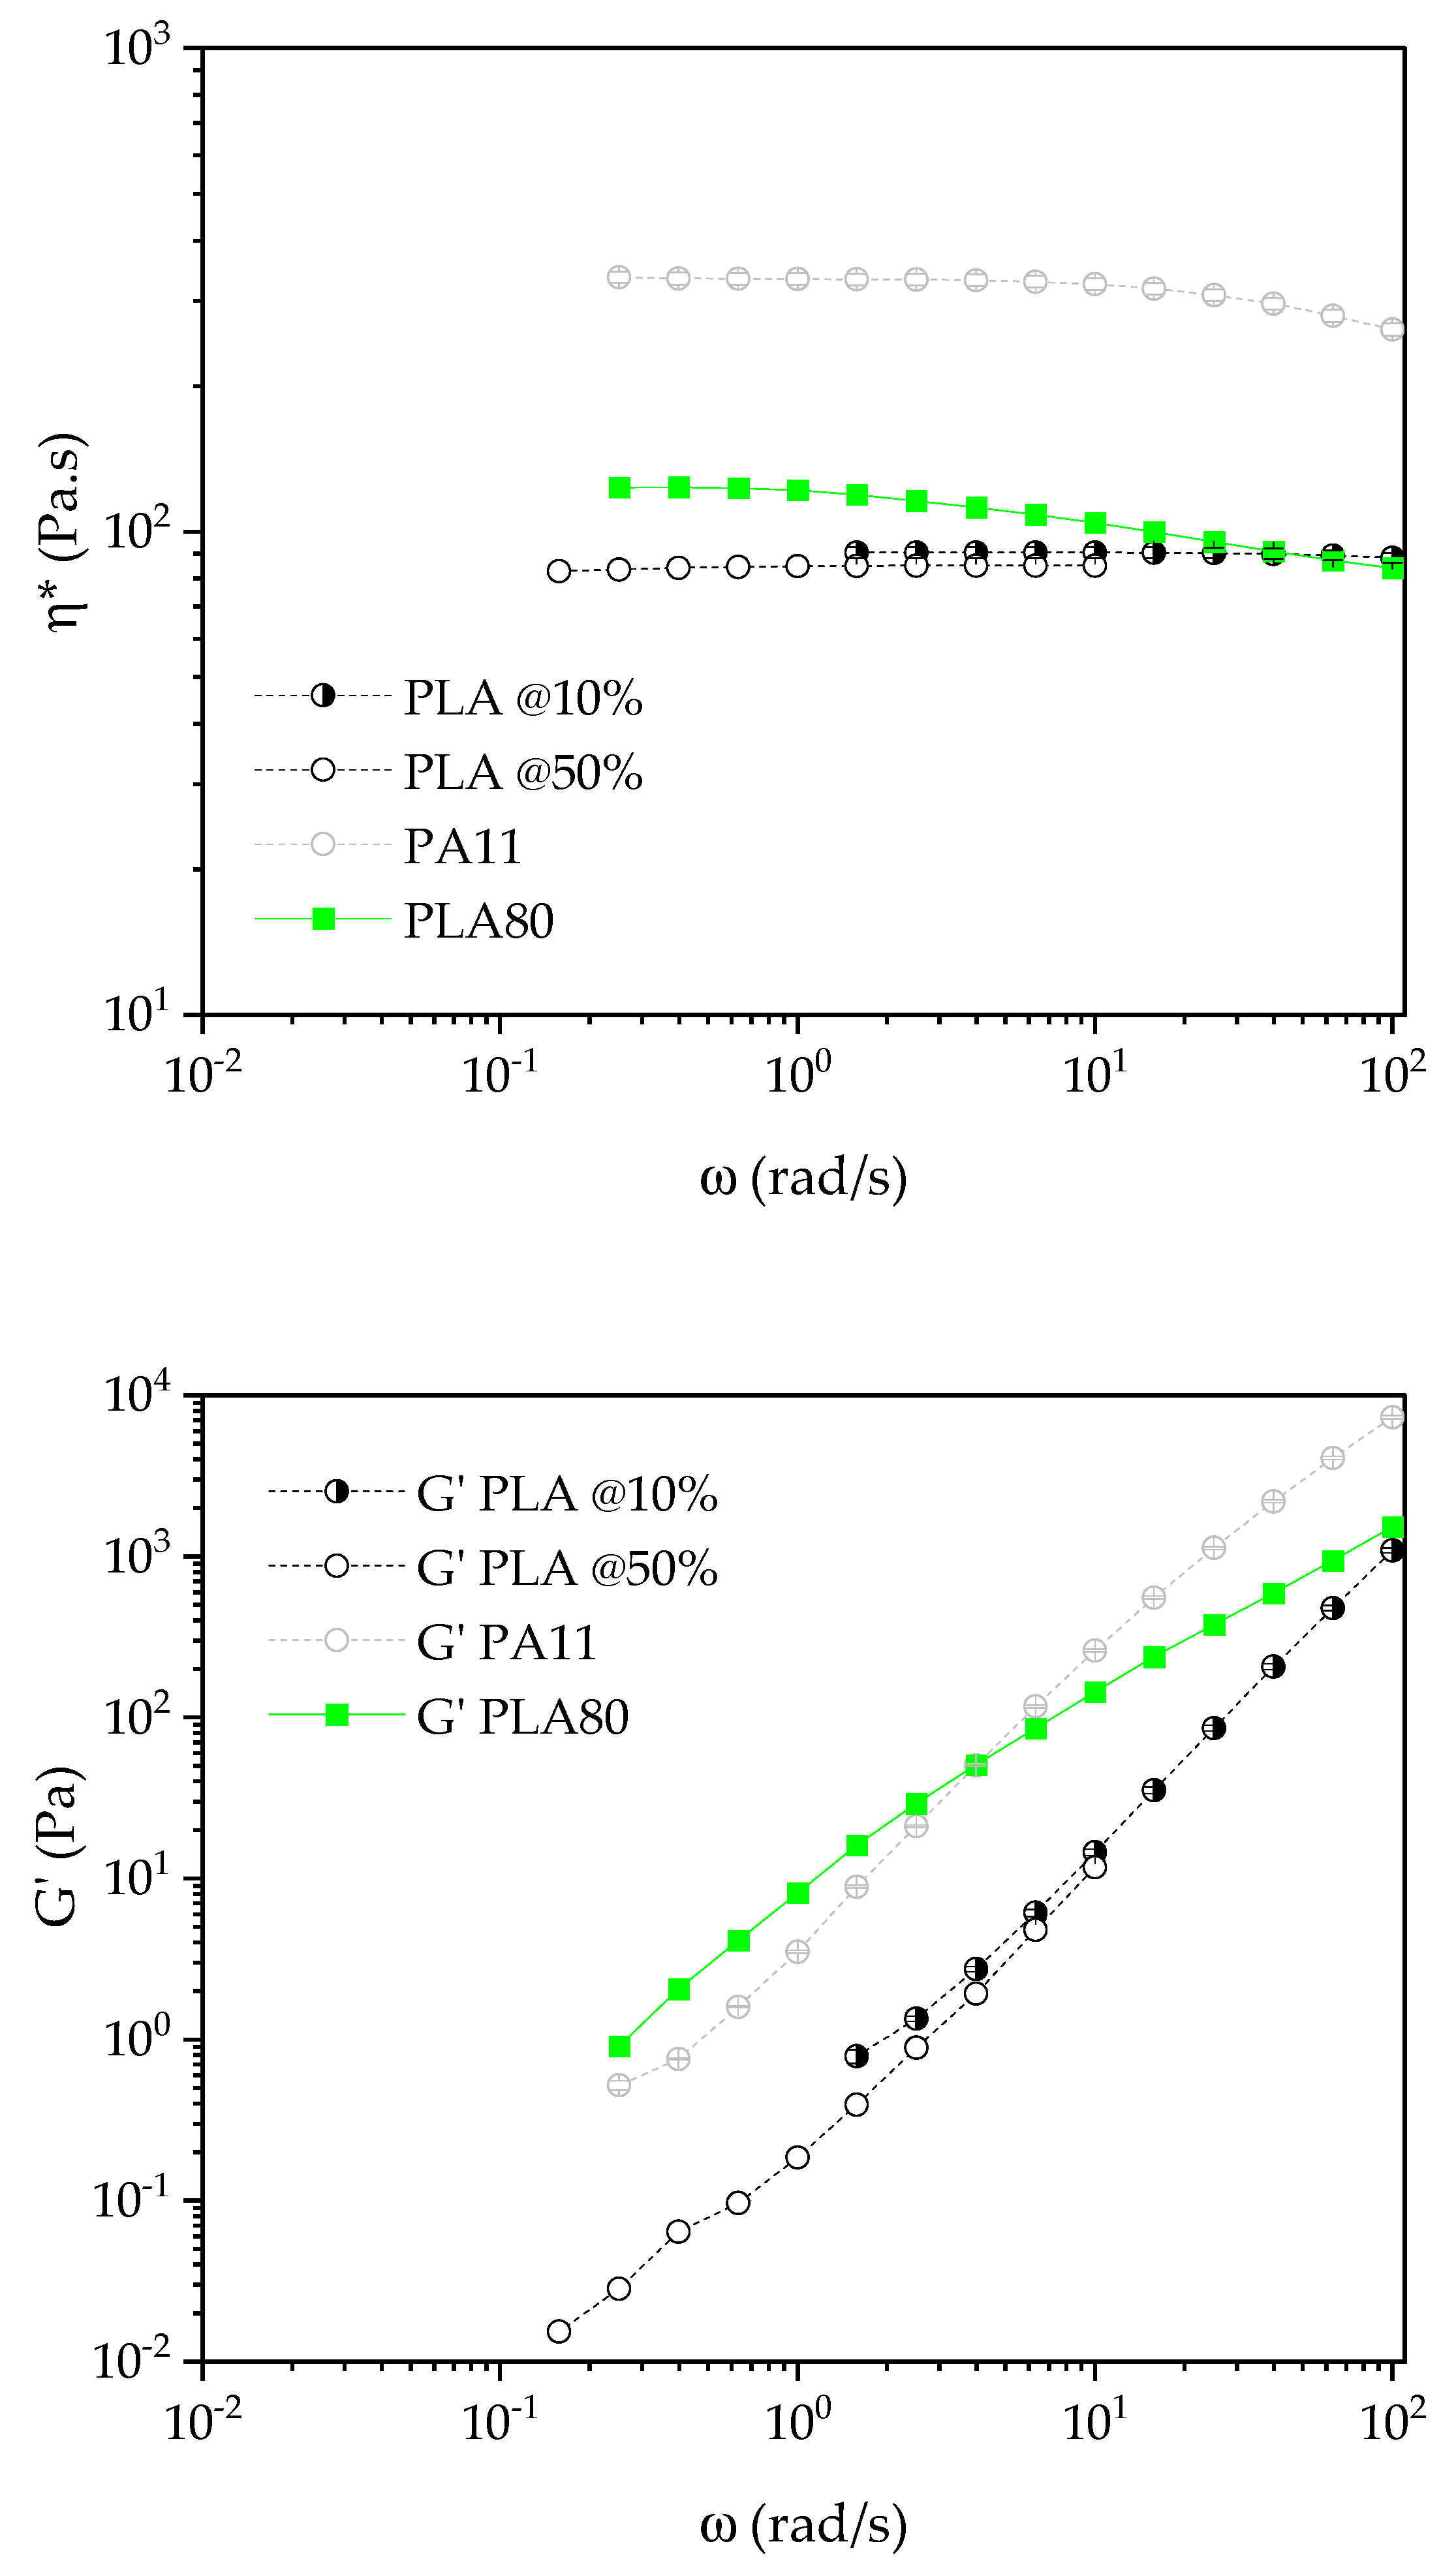
The polylactide (PLA grade 3251D) used in this study was purchased from NatureWORKS (Minnetonka, MN, USA). It is a semi-crystalline grade. The polyamide 11 (PA11 grade LMFO) was produced by Arkema (Colombes, France) under the trade name Rilsan
®. PLA and PA11 polymers exhibit a zero shear viscosity of 95 and 330 Pa.s at 210 °C, respectively. Aerosil A200 and R805 fumed silica nanoparticles were purchased from Evonik. Aerosil A200 is known to be hydrophilic without any surface modification whereas Aerosil R805 was modified with trimethoxyoctylsilane, in order to increase its hydrophobicity (48% of the surface is covered by octyl groups). All characteristics of silica are summarized in
Table 1.
2.2. Nanocomposite Processing
Different kinds of formulations were prepared: (1) neat polymer nanocomposites: A200 and R805 at an amount of 5 wt % were incorporated in each pure PLA and PA11 polymers; (2) polymer blend nanocomposites: blends based on 80 wt % of PLA, 20 wt % of PA11 and 5 wt % of each silica were prepared. Either neat or blend nanocomposites were prepared in a co-rotating twin-screw extruder (Clextral BC21, France), with a screw length L of 1200 mm, a diameter D f 25 mm and a L/D ratio of 48. A vacuum pump was used to avoid oxidation and hydrolytic degradation during extrusion. For all formulations, polymer pellets were introduced in the feed zone (zone 1) whereas silica nanoparticles were introduced in the fifth zone (the screw contains 13 zones). The extrusion temperature profile at the feed zone was 60 °C for the neat polymers with silica and 80 °C for the filled blends. The extrusion temperature for all the other zones and the die was 180 °C (for PLA with silica) or 210 °C for the other formulations. A feeding rate of 6 kg/h and a 250 rpm screw speed were applied for the neat polymer nanocomposites. Whereas, a feeding rate of 4 kg/h and a 200 rpm screw speed were applied for the polymer blend nanocomposites. Prior to extrusion, PLA and PA11 pellets were dried overnight at 80 °C under vacuum; A200 and R805 silica powders were dried overnight at 110 °C in an oven. All extrusion conditions and composition of the formulations are summarized in
Table 2 and
Table 3.
All formulations mentioned in
Table 3 were dried one night at 80 °C under vacuum prior to injection molded. Injection molding was performed using a Zamak Mercator mini-press to obtain disks with a diameter of 25 mm and a thickness of 1.5 mm.
2.3. Thermo-Gravimetric Analysis
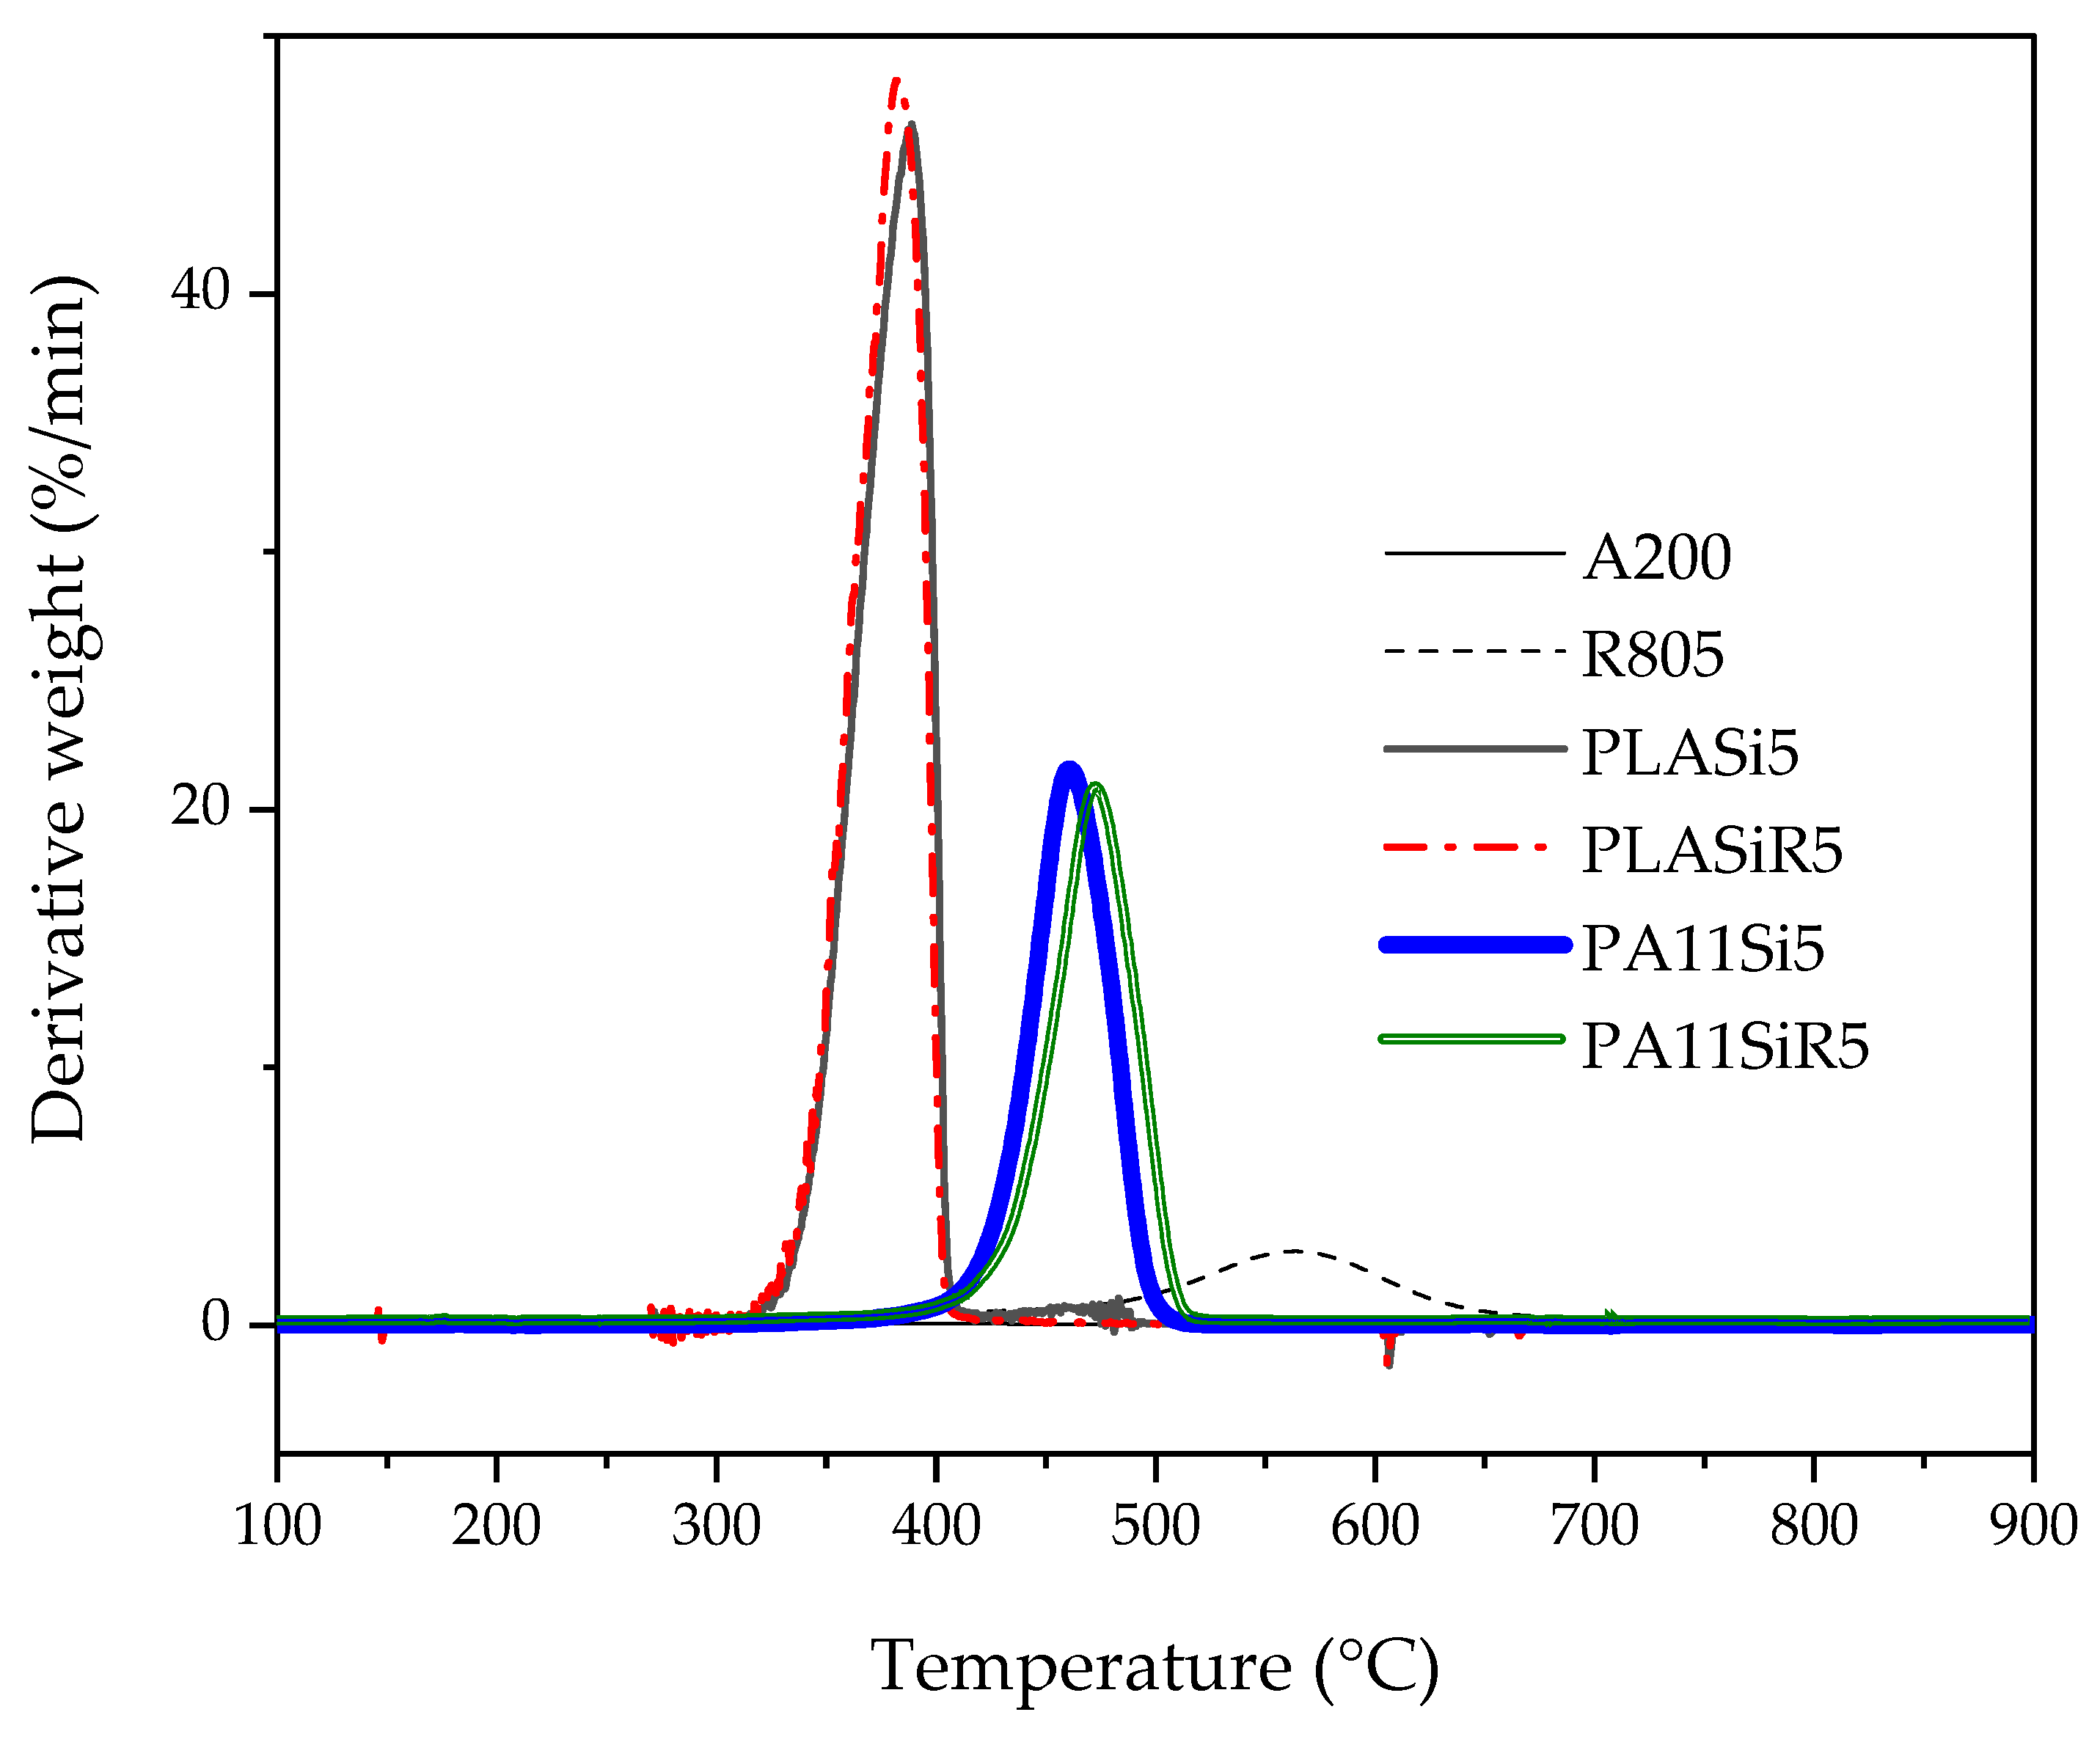
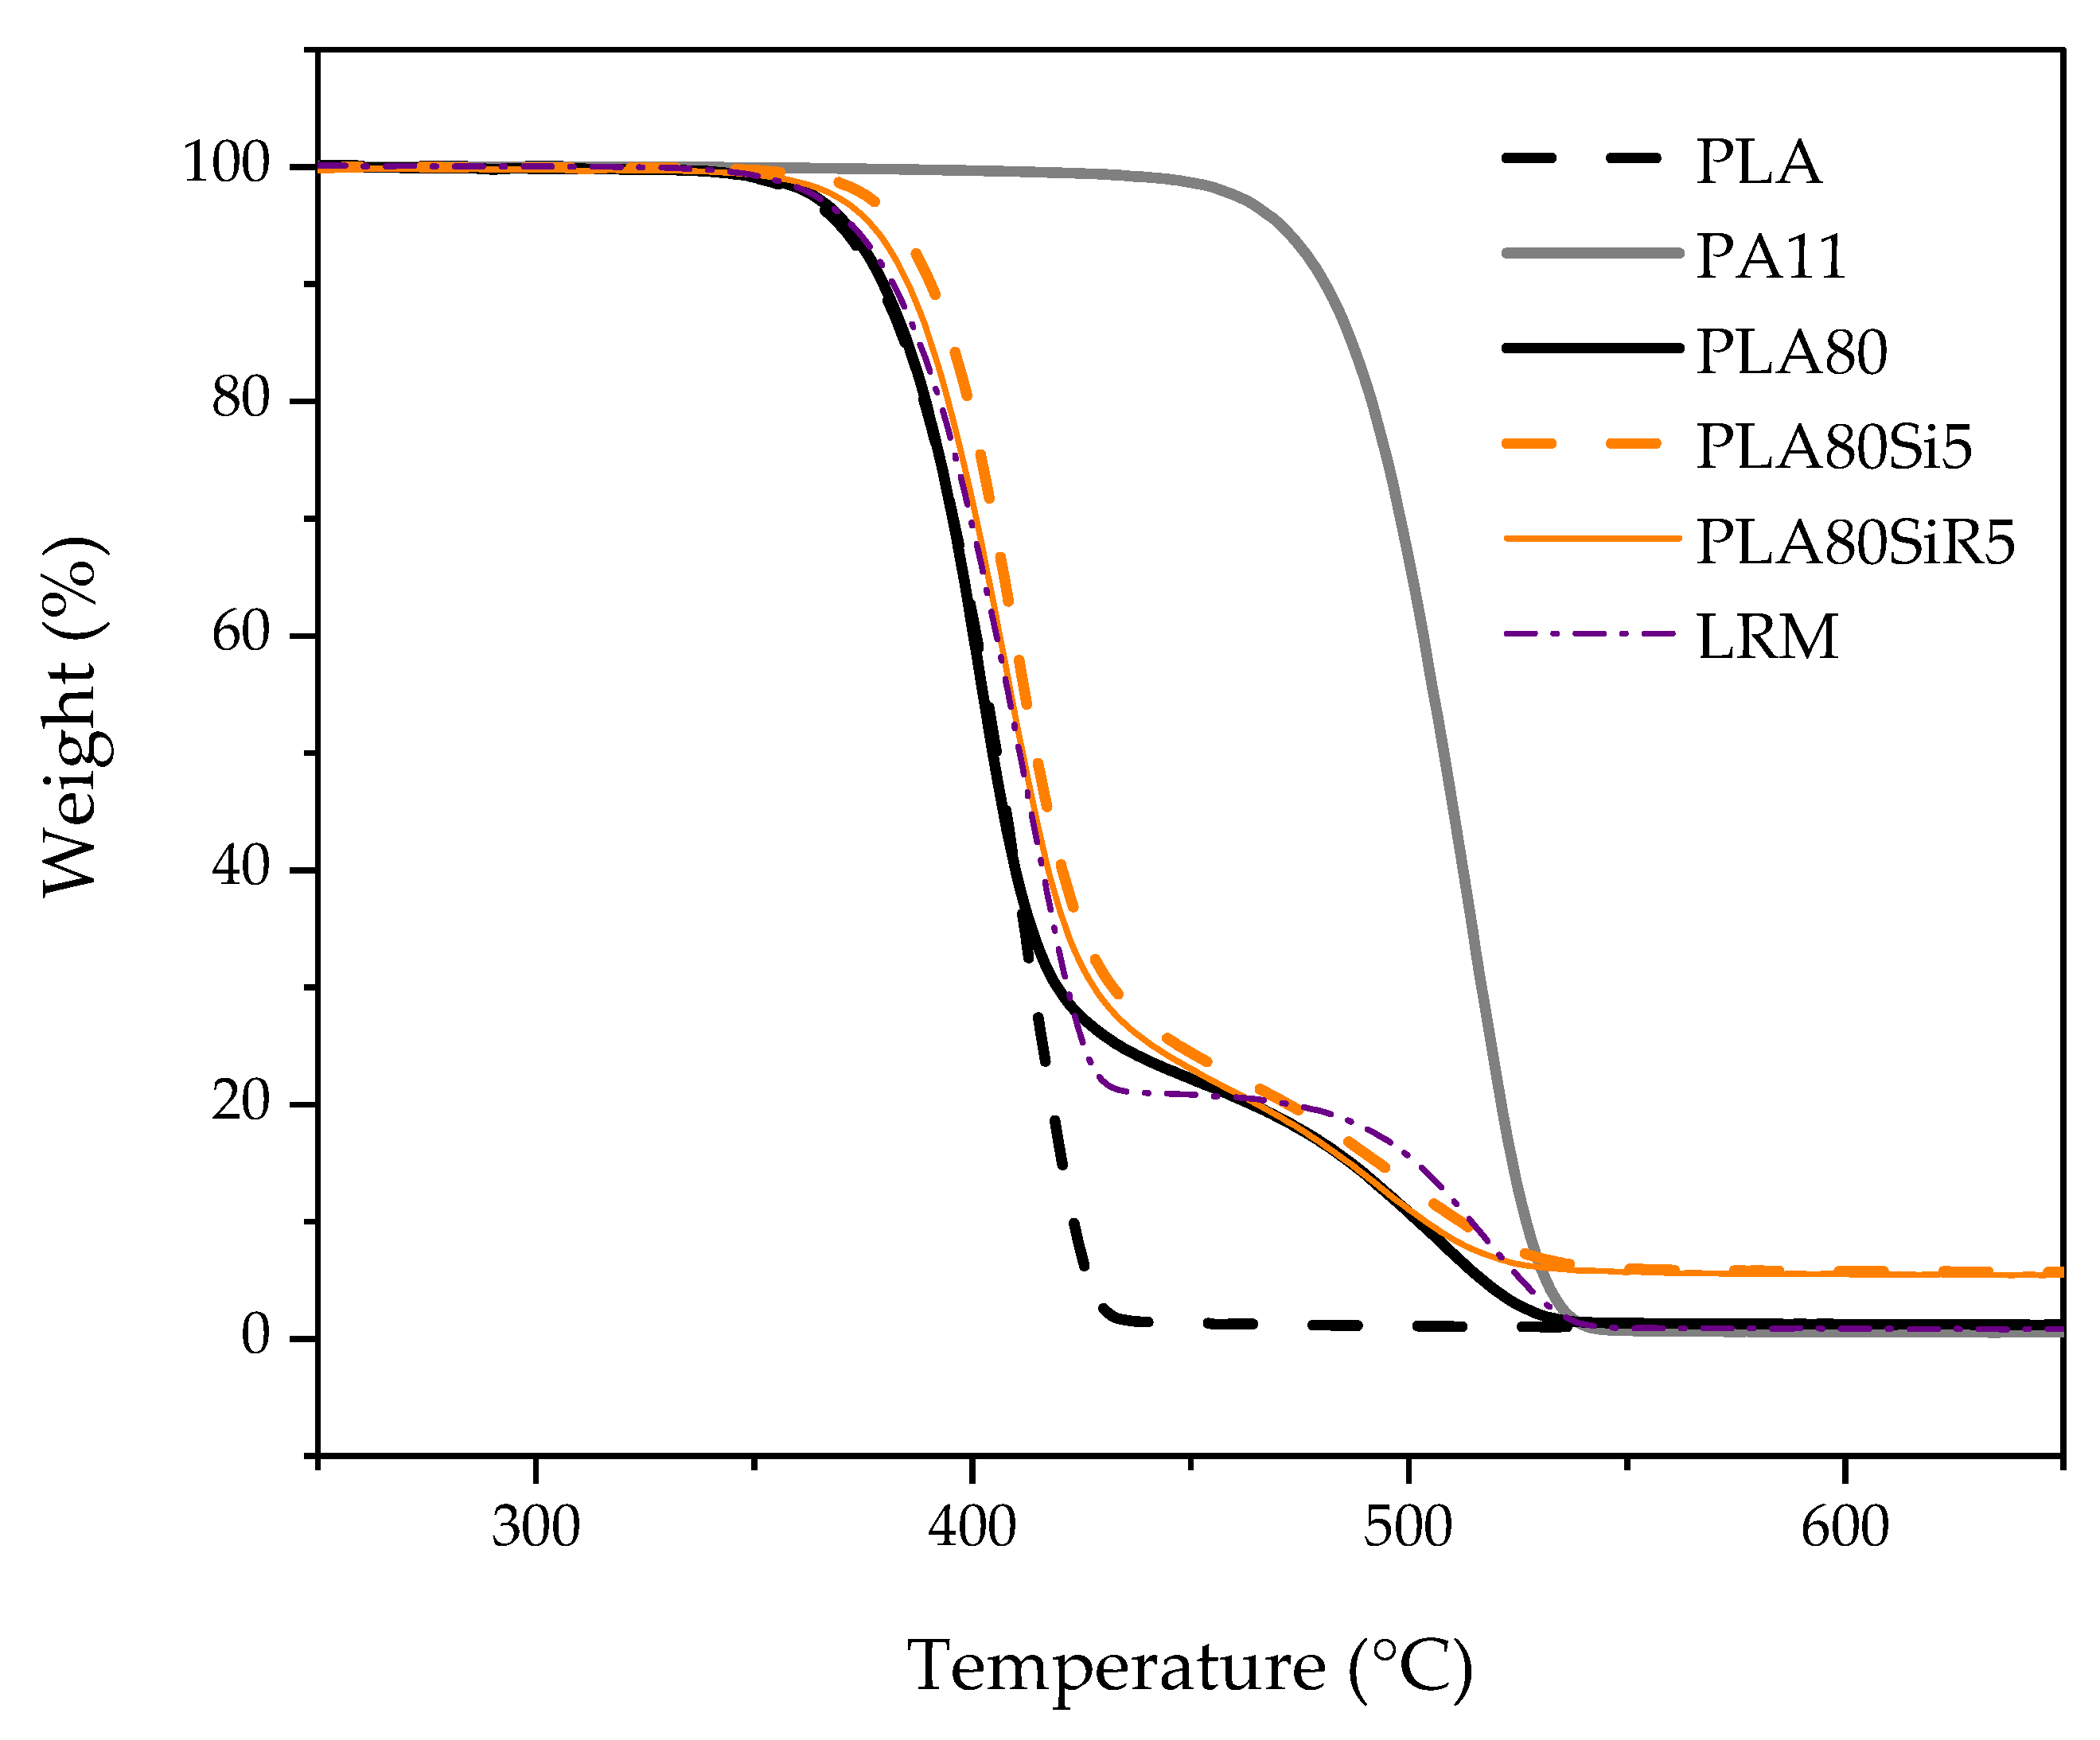
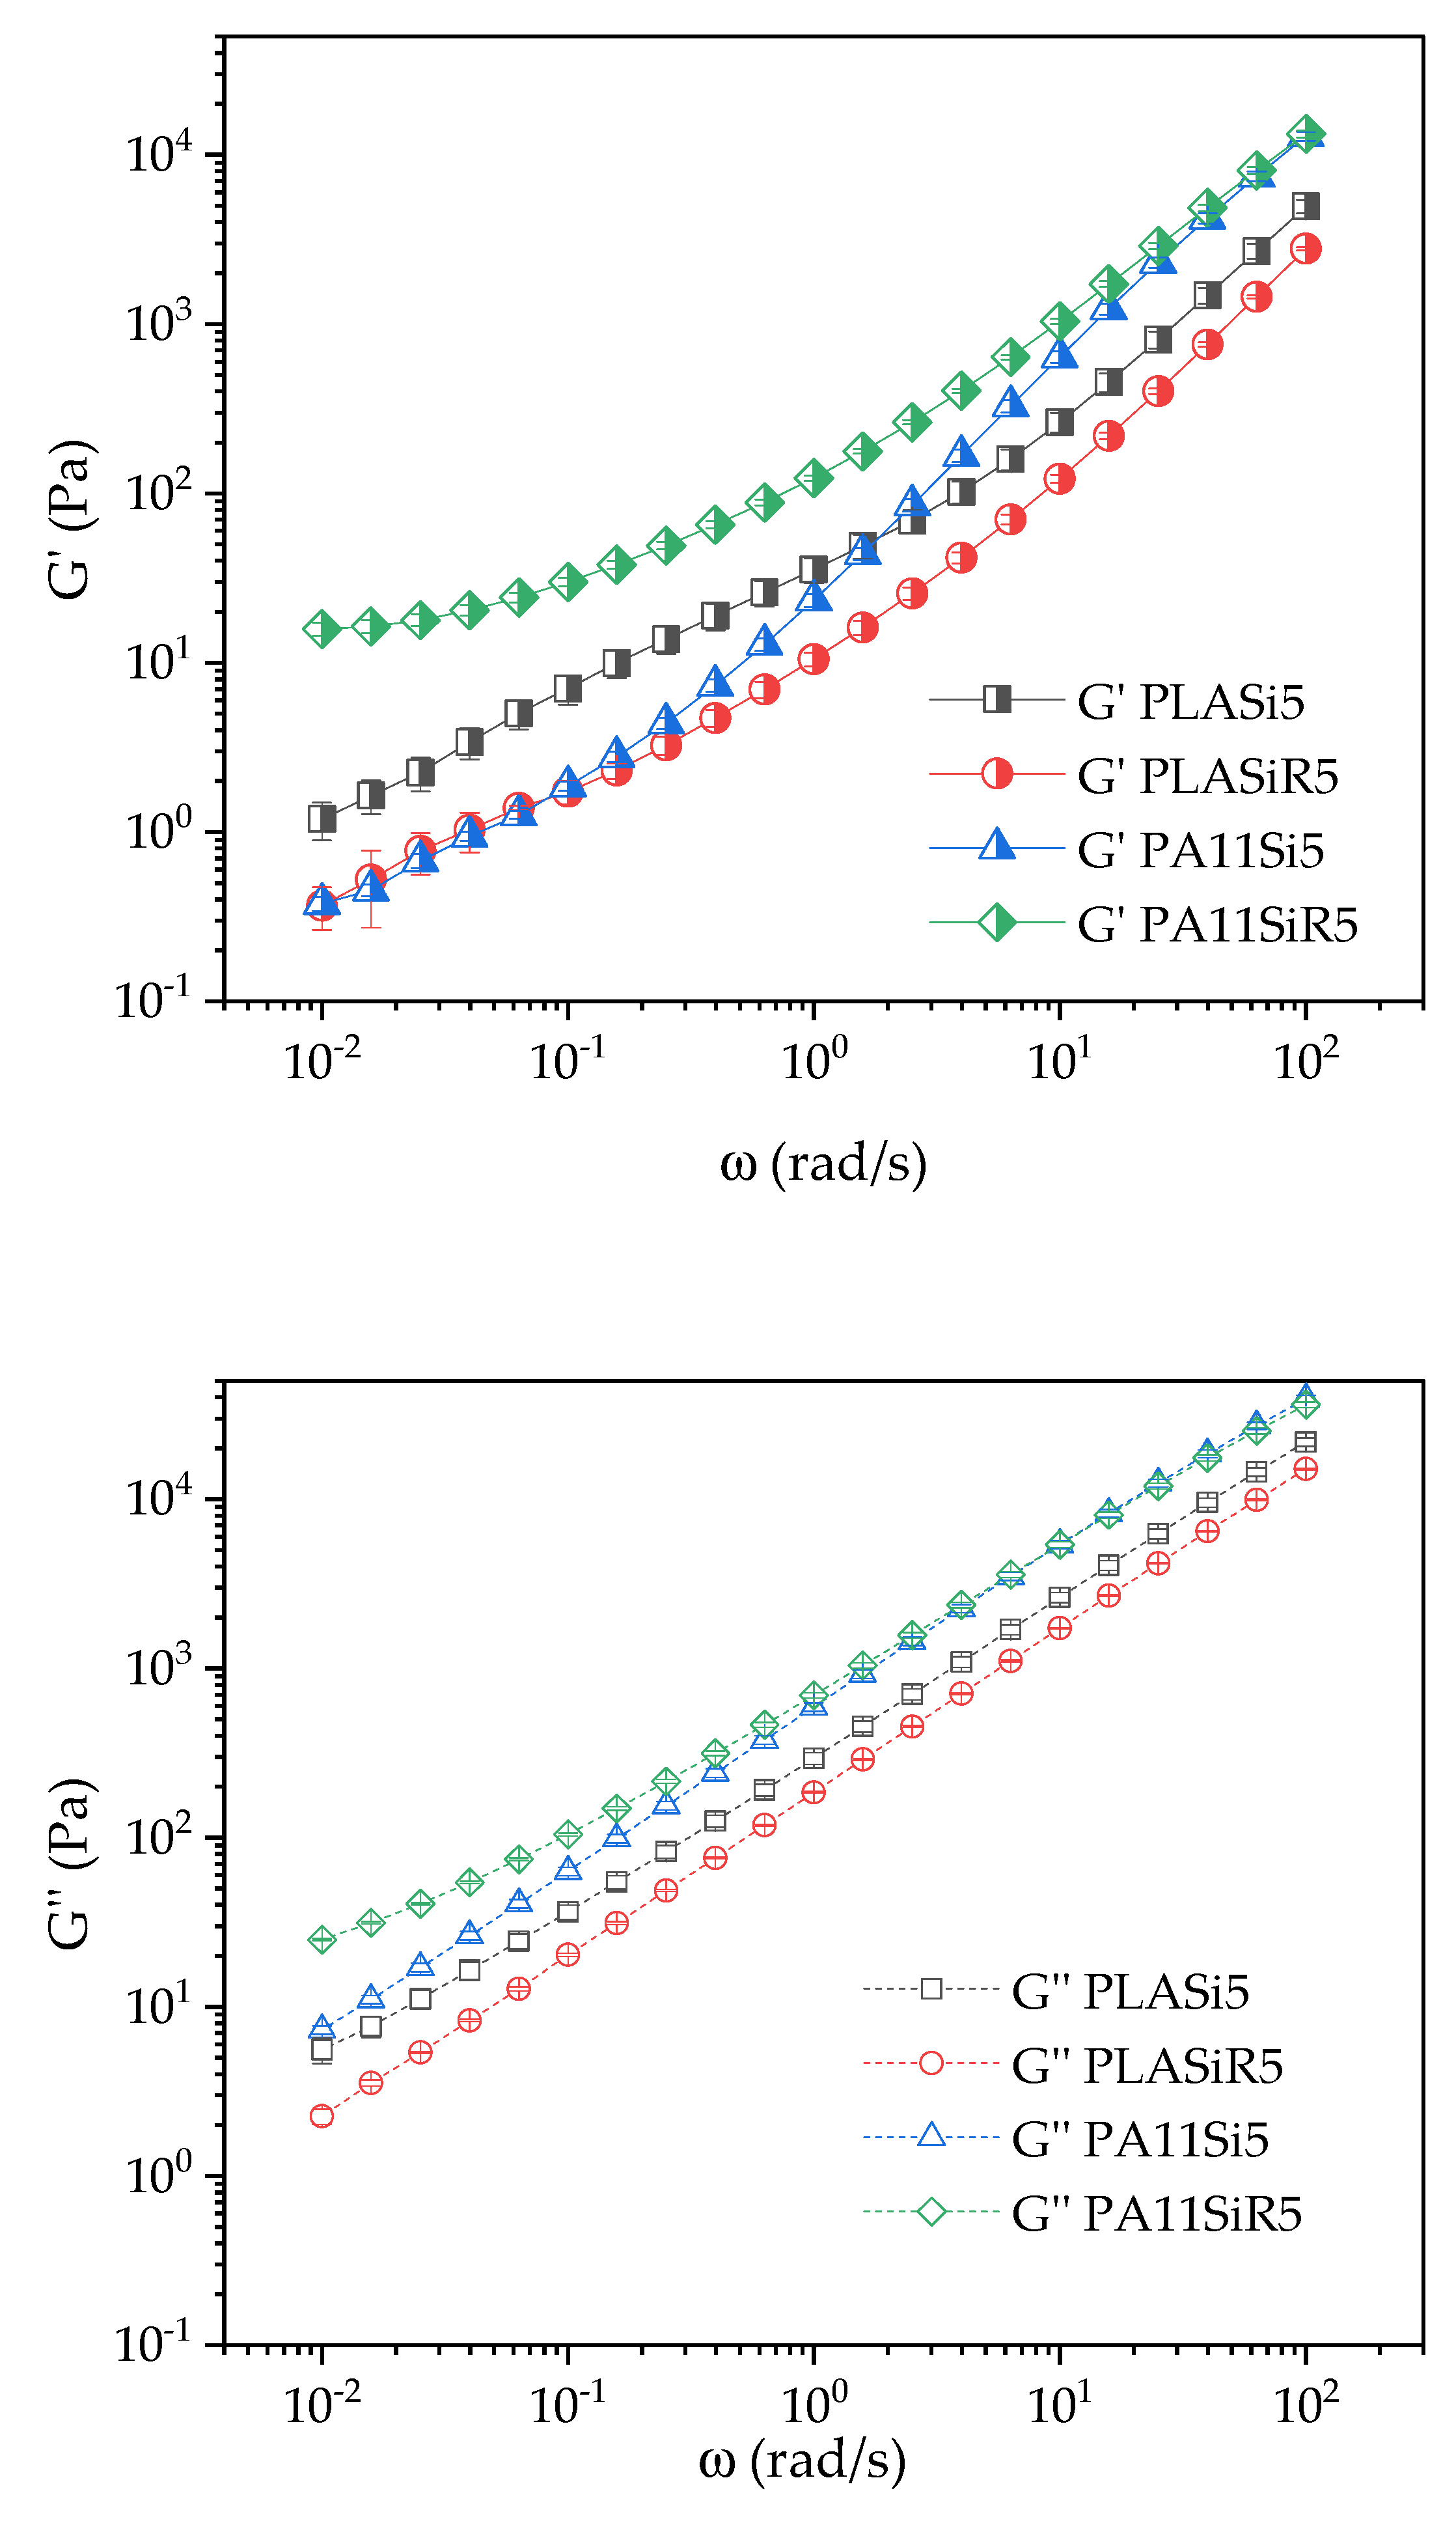
Thermogravimetric analysis (TGA) were conducted on PLASi5, PLASiR5, PA11Si5, and PA11SiR5, mainly to verify the amount of silica in each neat polymer nanocomposite. Thermal characterization was carried out with a PerkinElmer Pyris-1 instrument on 10 mg of samples, under nitrogen. Samples were heated at 60 °C/min from 30 to 800 °C. Three tests were carried out for each nanocomposite.
2.4. Rheological Measurements
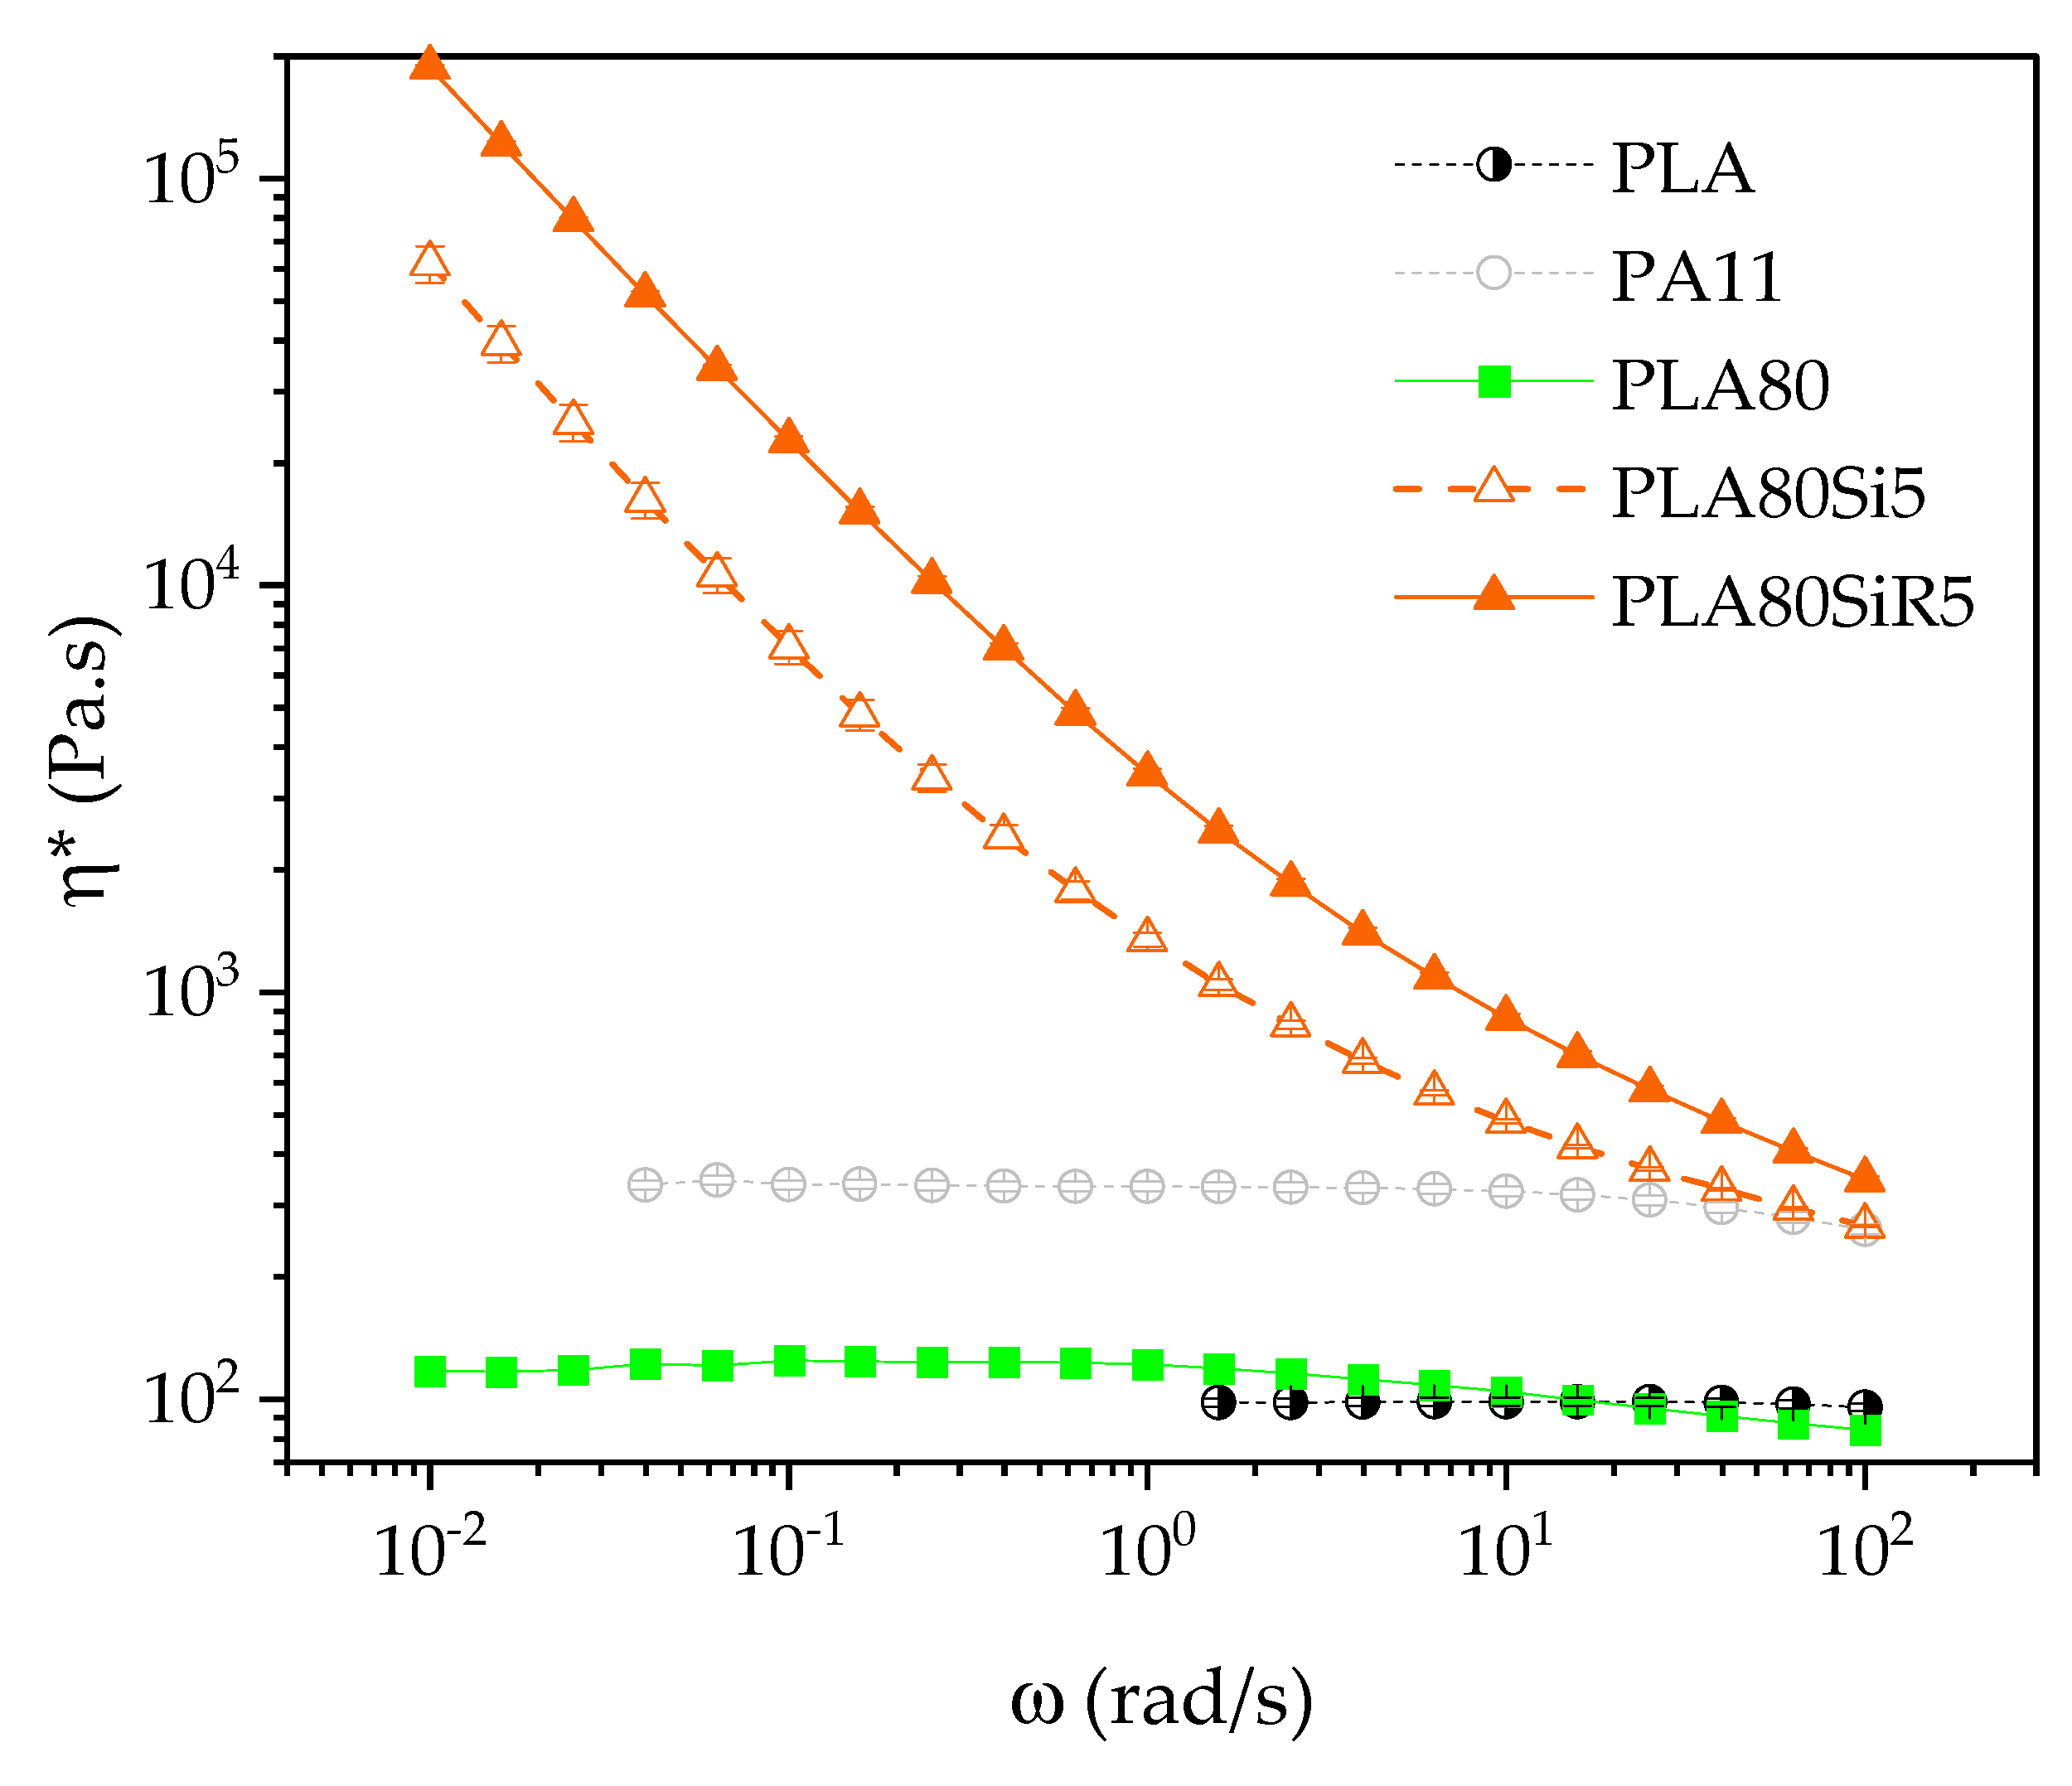
The rheology was performed using a MCR 702 rotational rheometer (Anton Paar, Austria) equipped with a parallel plate geometry (diameter of 25 mm). Tests were conducted at 210 °C under nitrogen with a gap of 1 mm into disks samples. All samples were dried under vacuum at 80 °C for one night prior to each test. Three tests were carried out for each protocol to ensure repeatability of the measurements. Error bars were then measured and added to any results.
To avoid any degradation, especially polyamide polycondensation [
18], all the tests were conducted during a lower duration than 60 min.
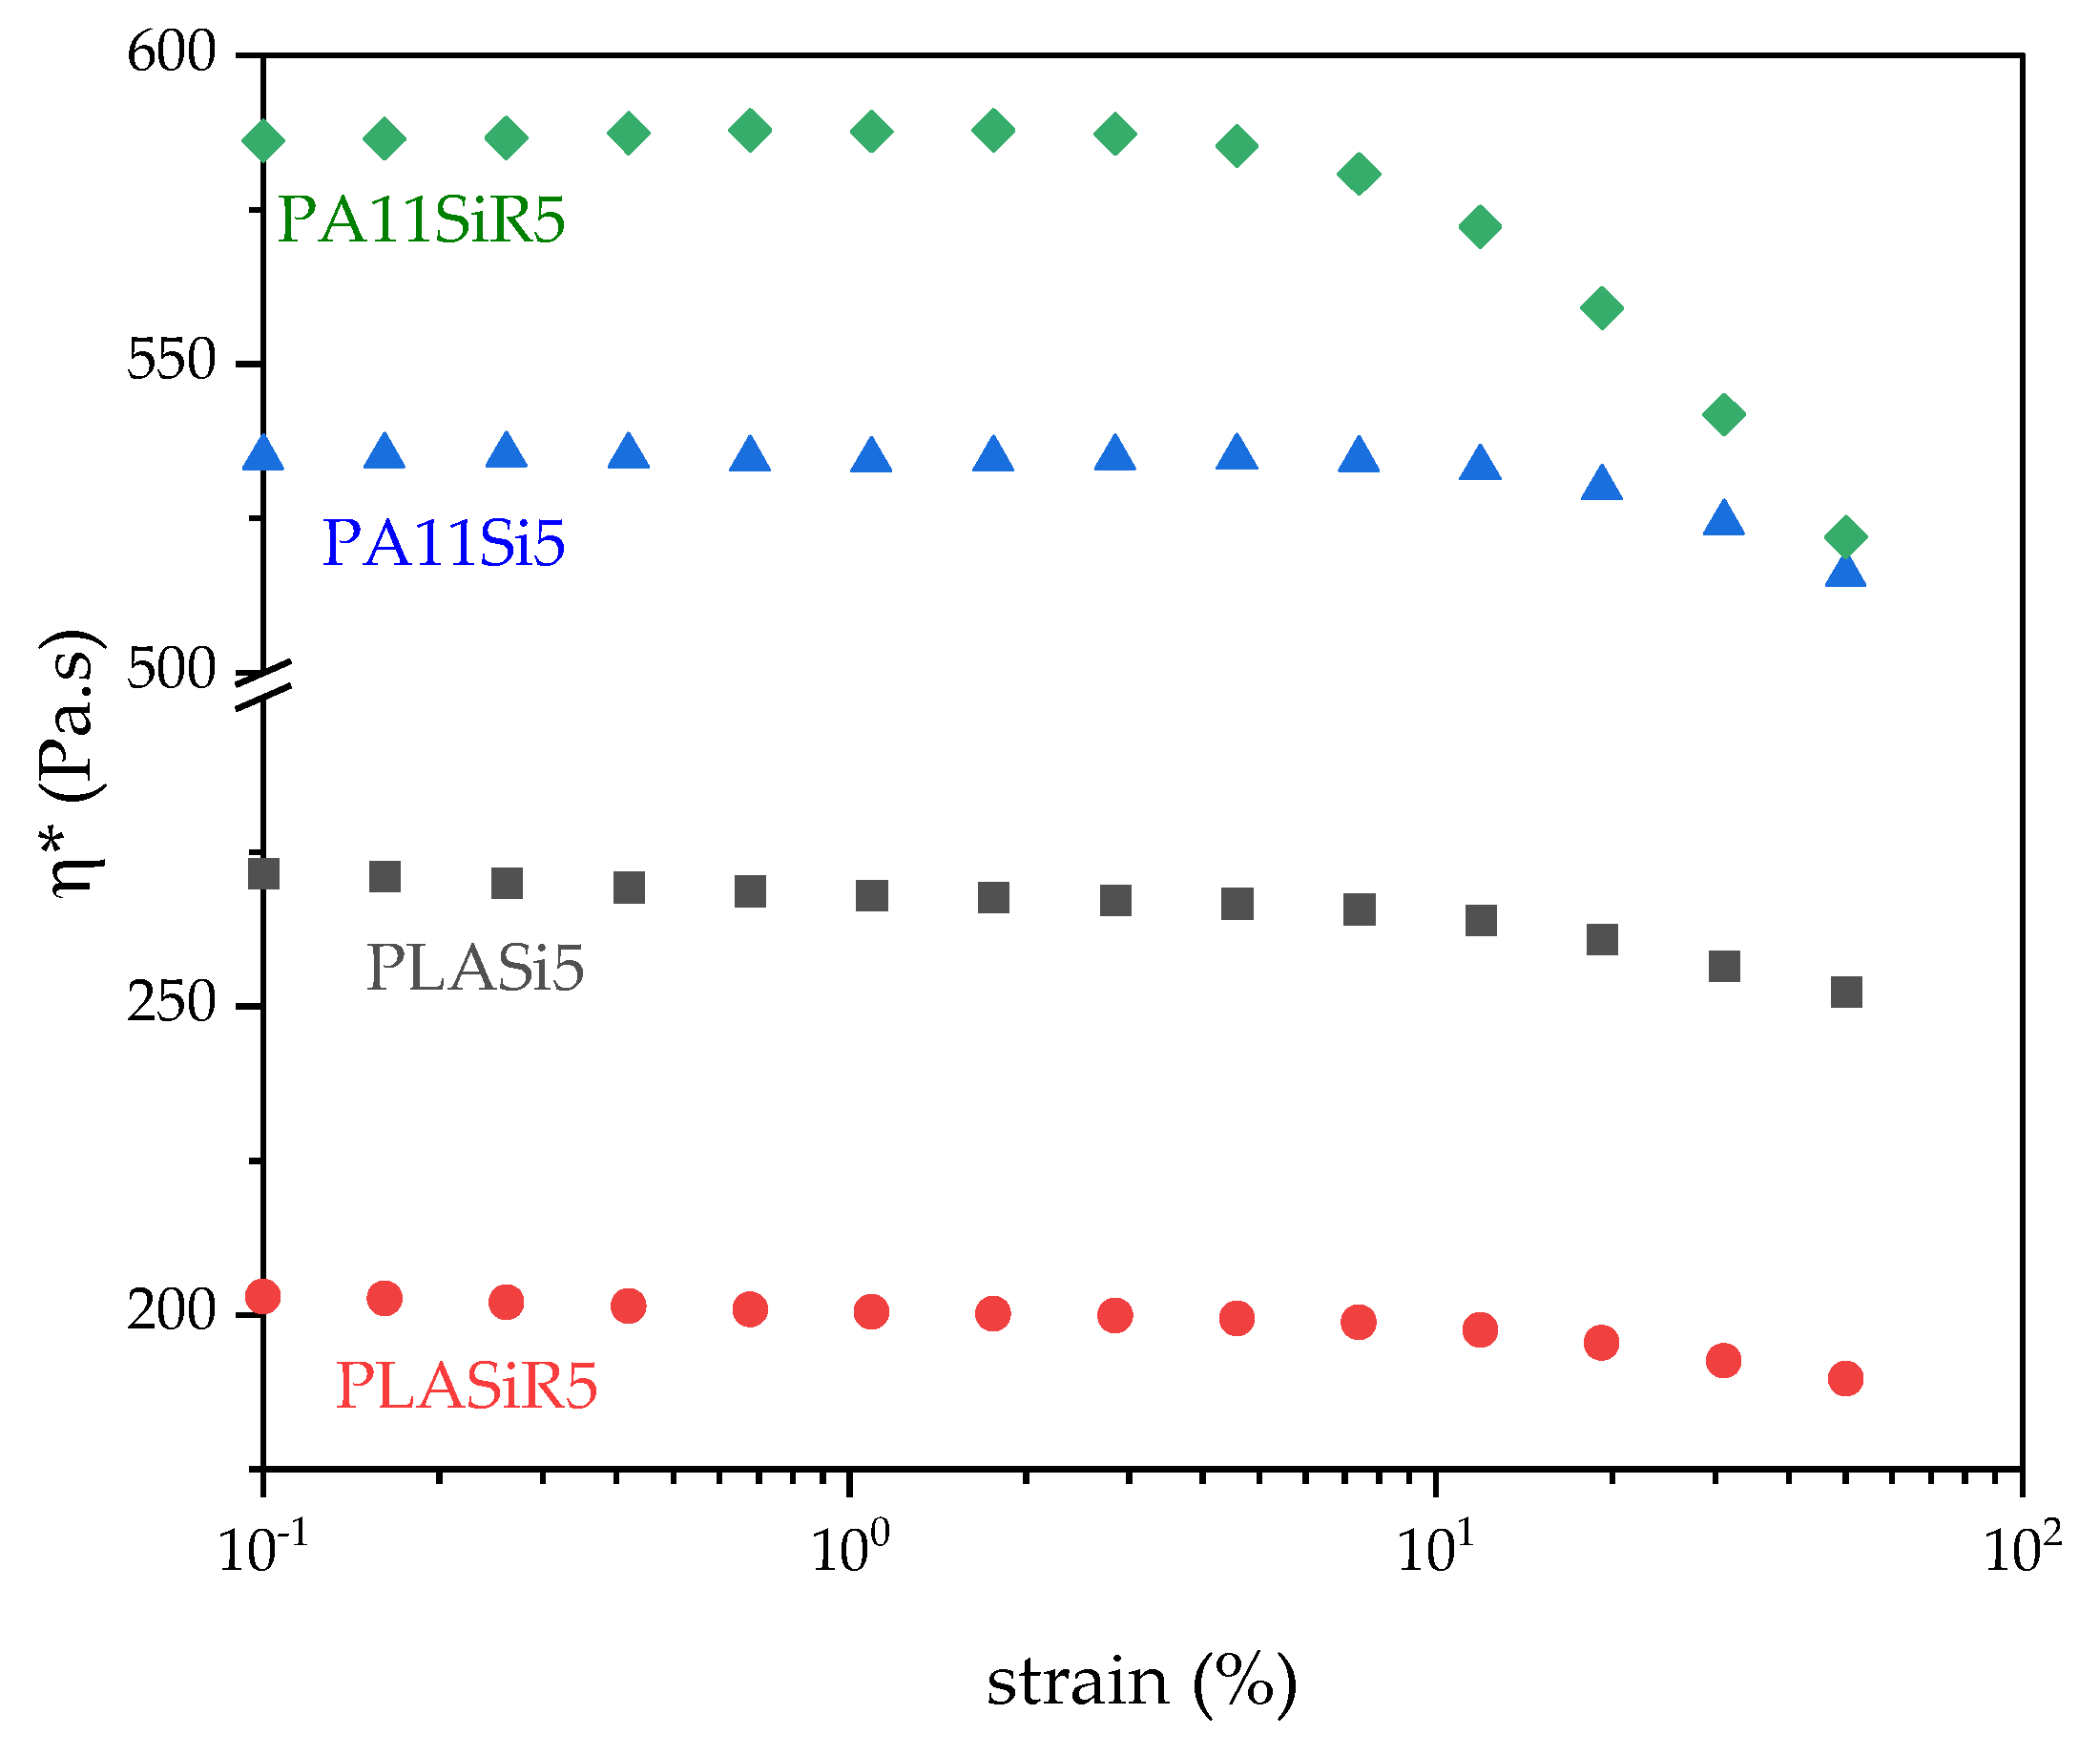
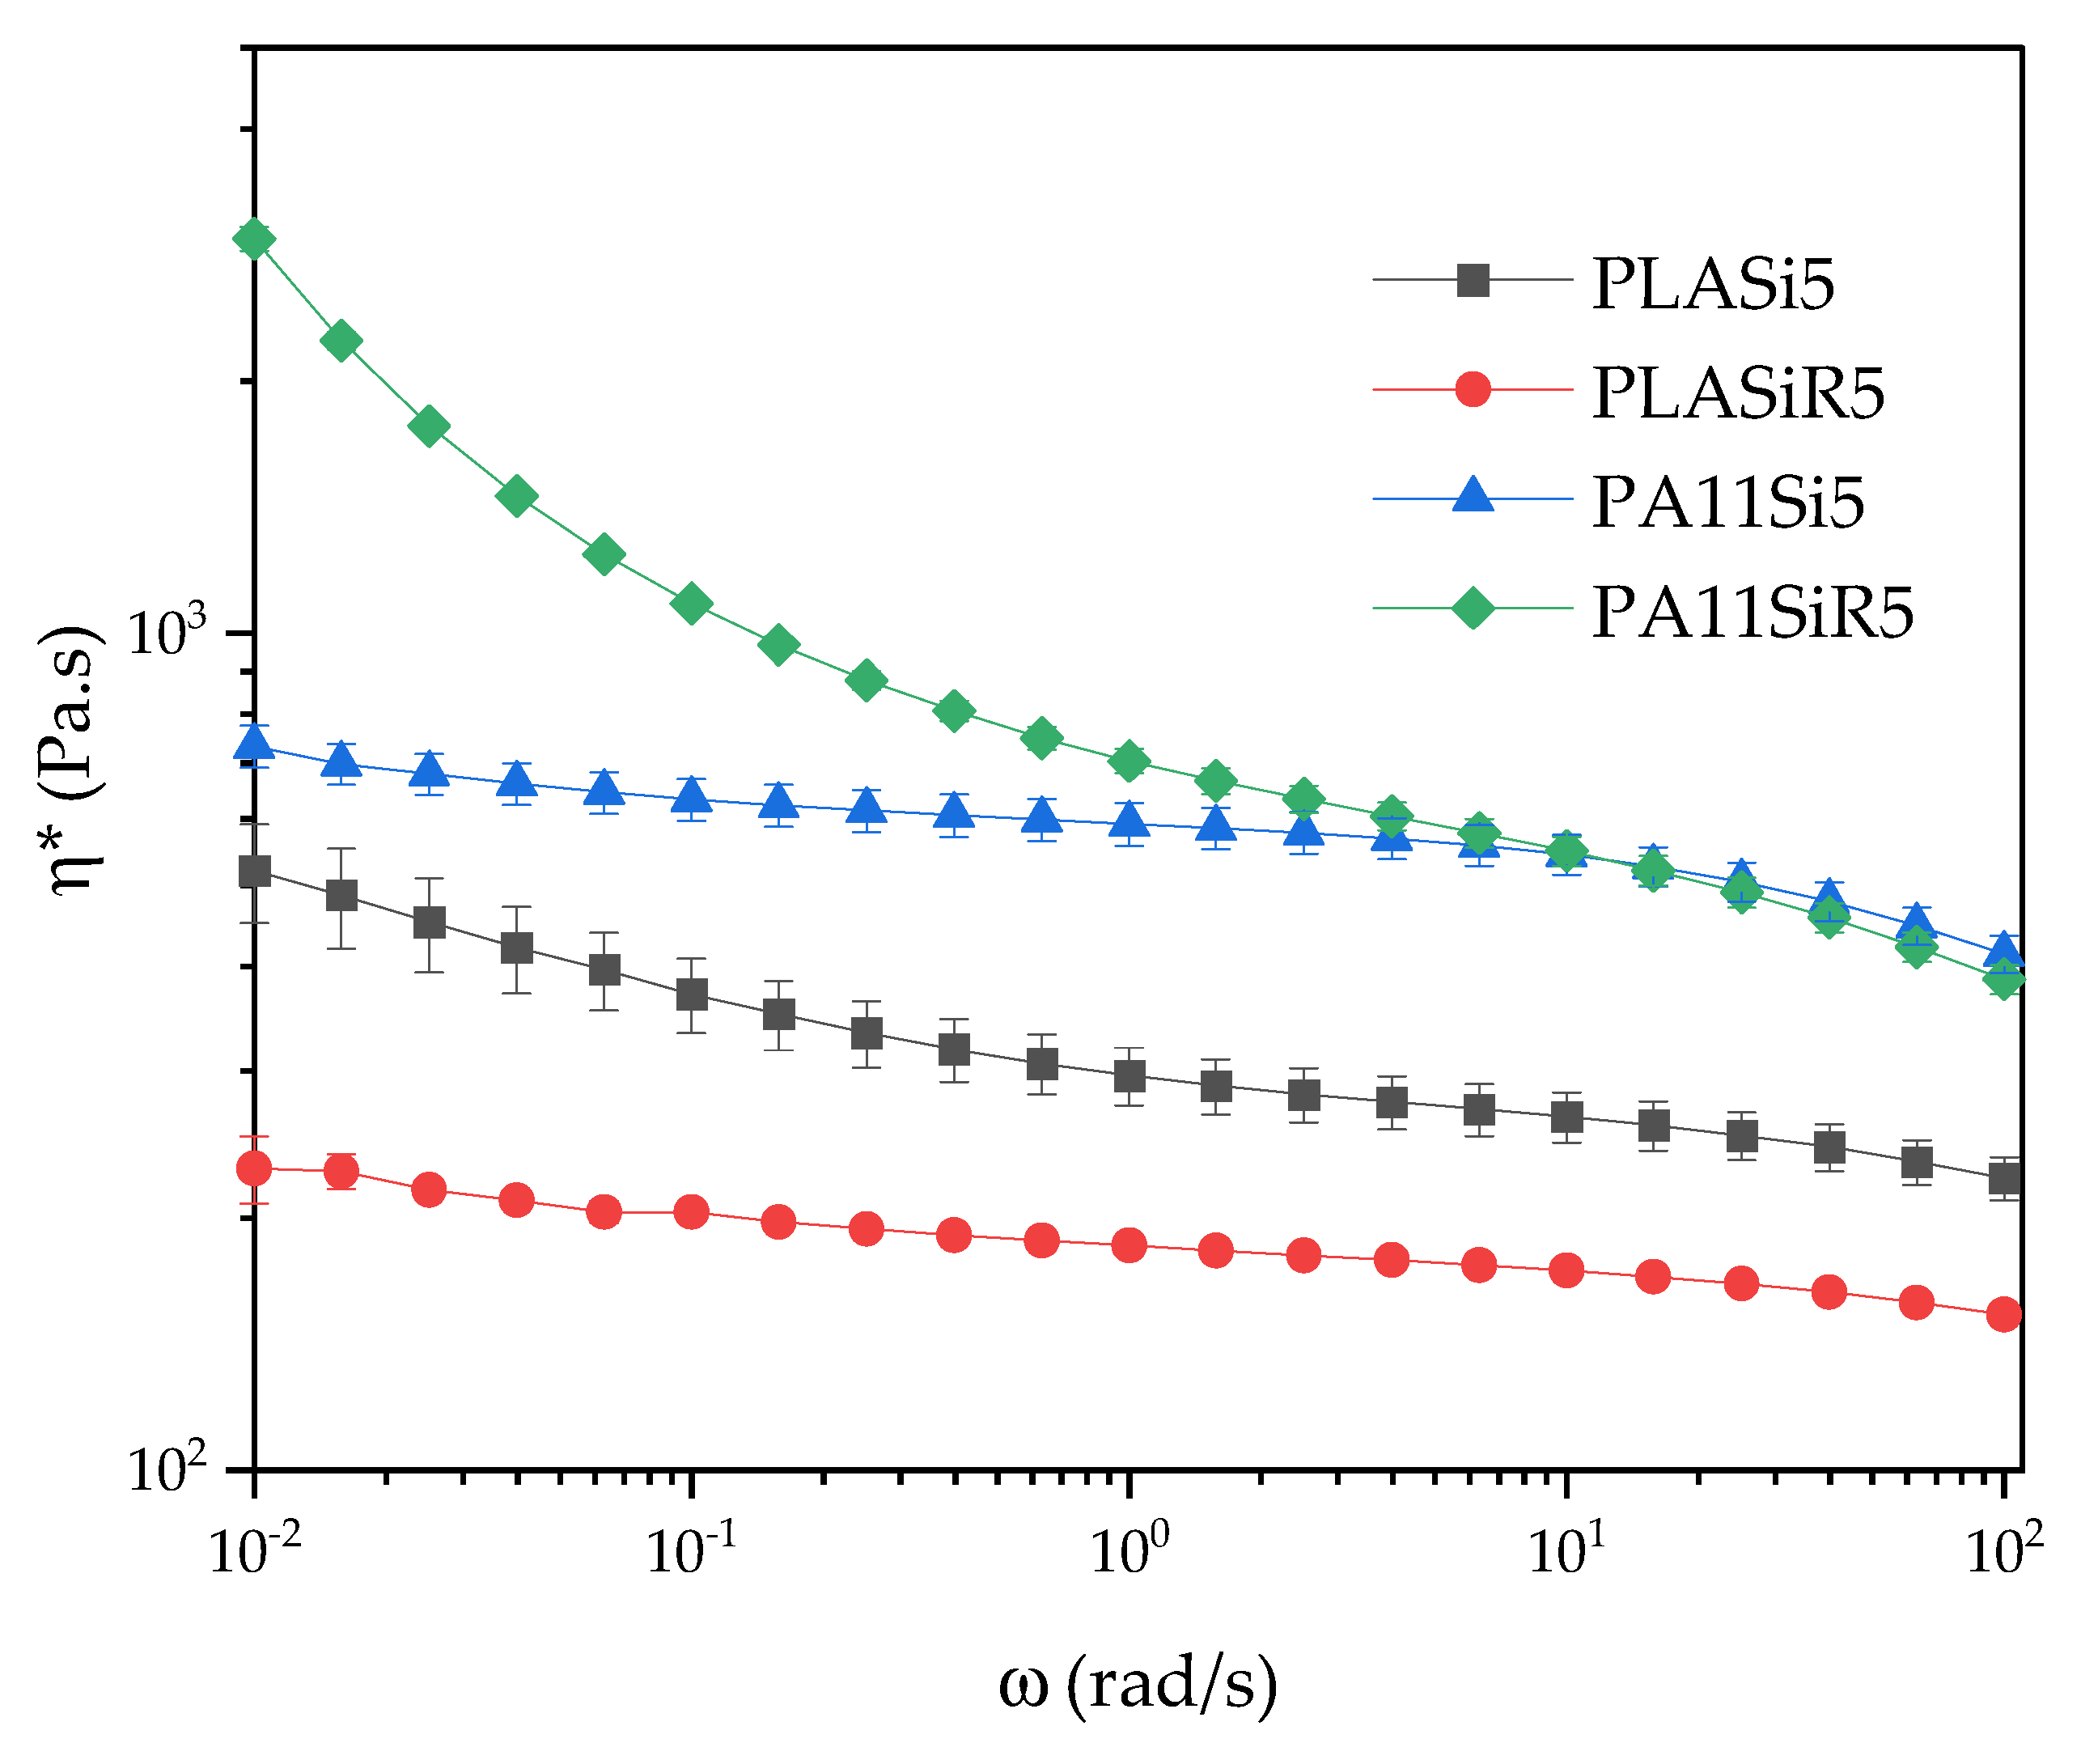
The linear zone was determined with strain sweep tests conducted at 6.28 rad/s. The strain range goes from 0.01% to 50%. This protocol allows to determine the linear zone (i.e., the range of strains that keeps each sample in a linear response regarding the measured complex viscosity ). Regarding the curves obtained by this protocol, the linear range is up to 7% for all the formulations, except for PLA80SiR5. Hence, the next frequency sweep test for PLA80SiR5 must be conducted at a lower strain than 2%.
Finally, frequency sweep tests were conducted at a strain of 2% for all the formulations except for PLA80SiR5 where a 0.8% of strain was applied. The range of frequency goes from ω = 100 to 0.01 rad/s.
The choice of each parameter regarding those protocols are discussed in the Results and Discussion section.
2.5. Microstructure Characterizations
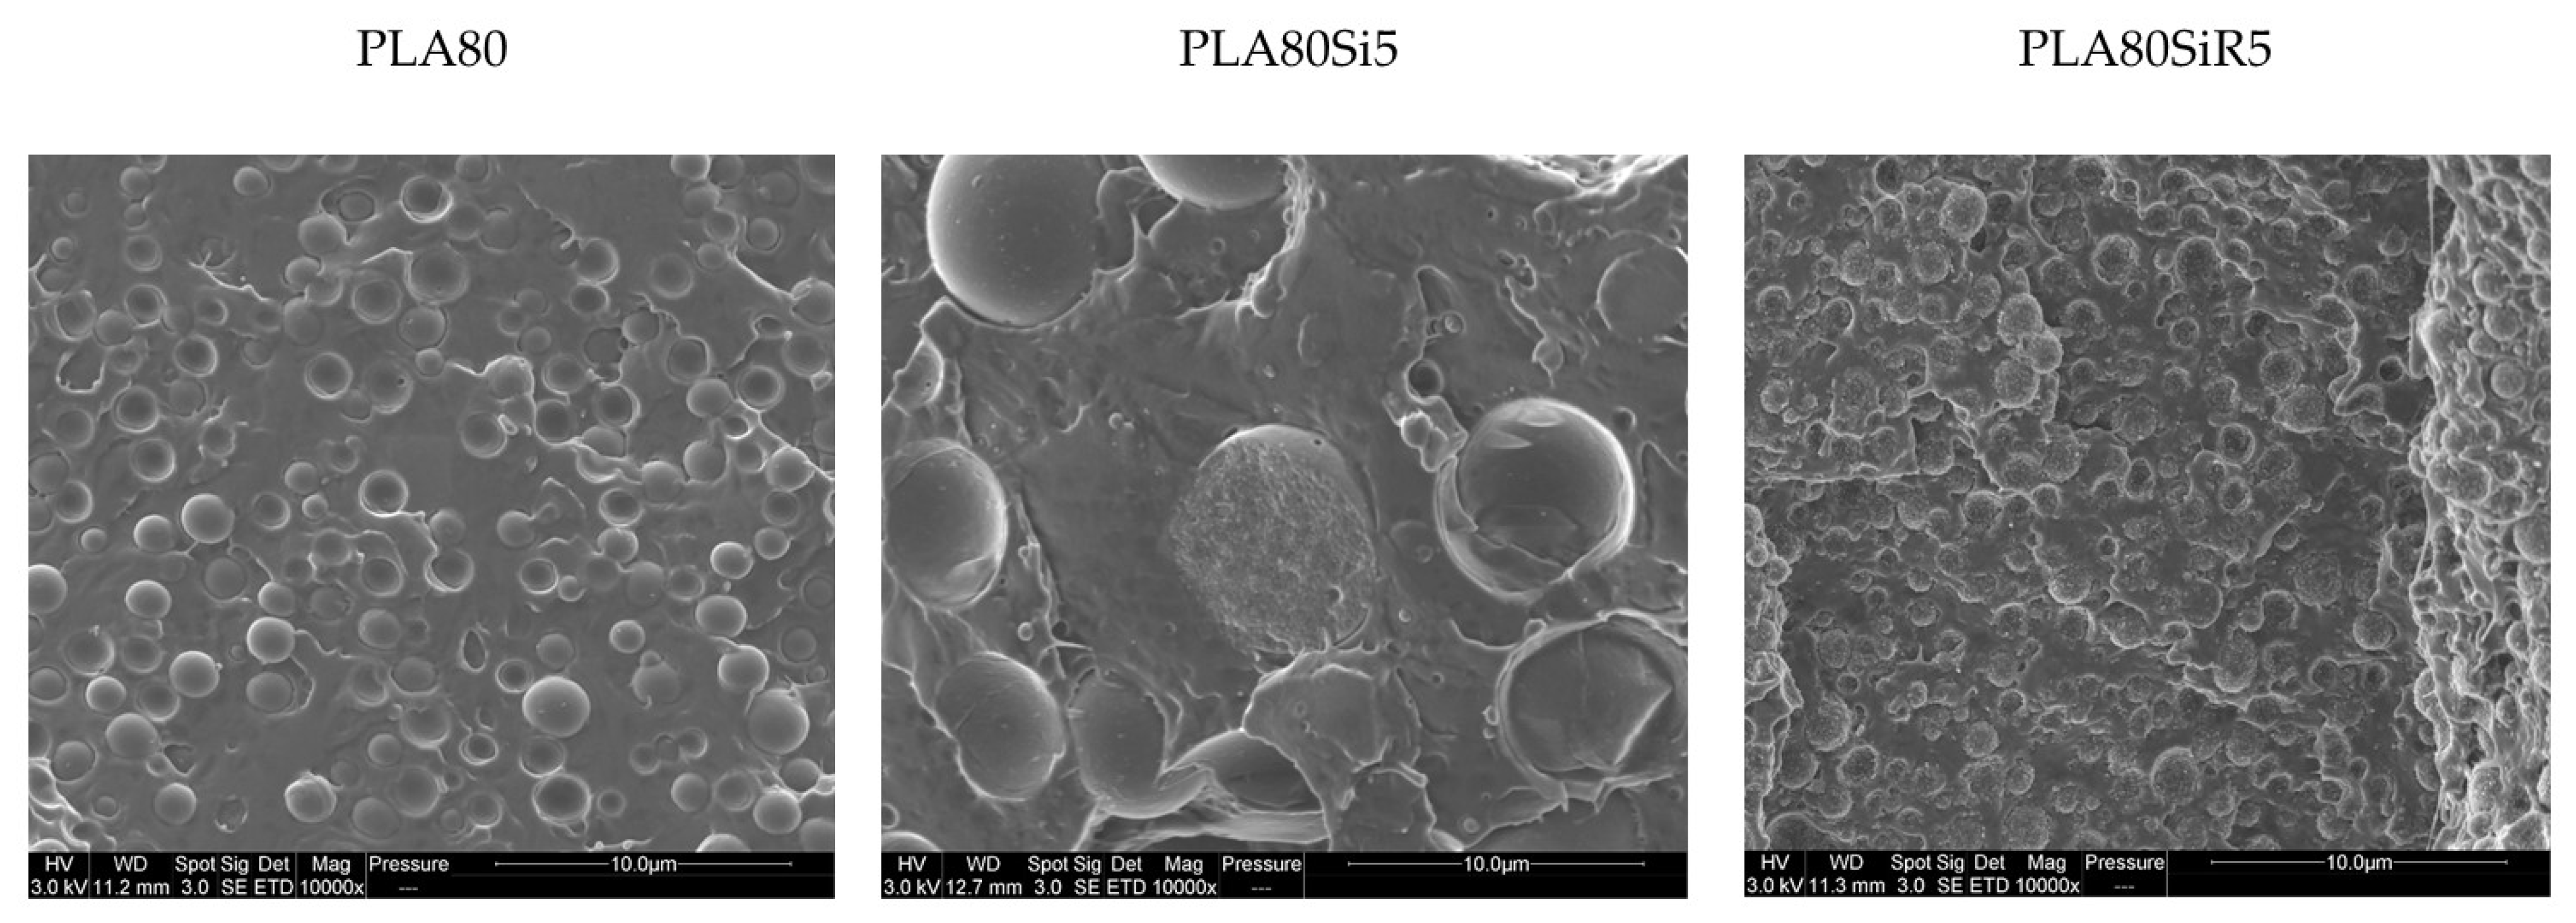
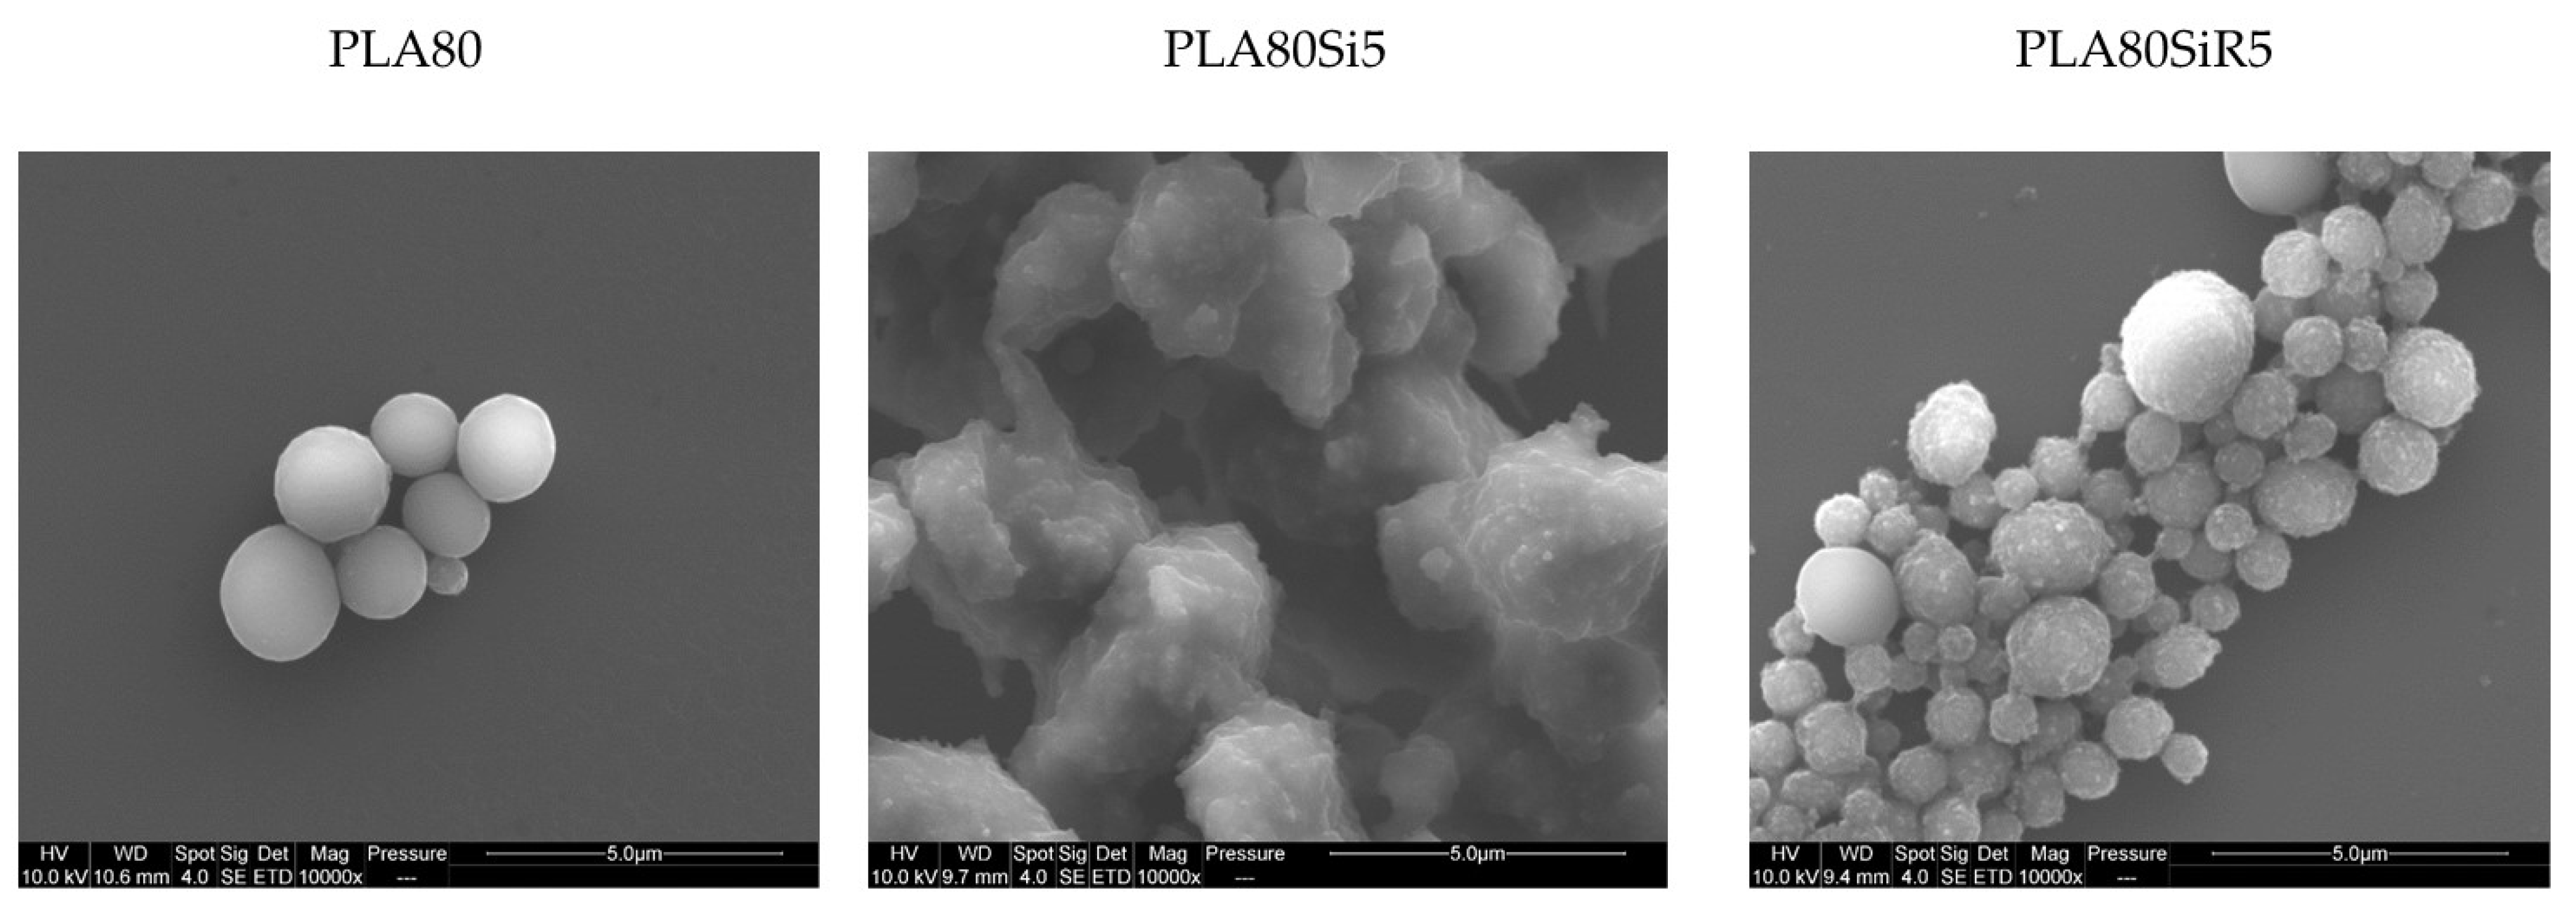
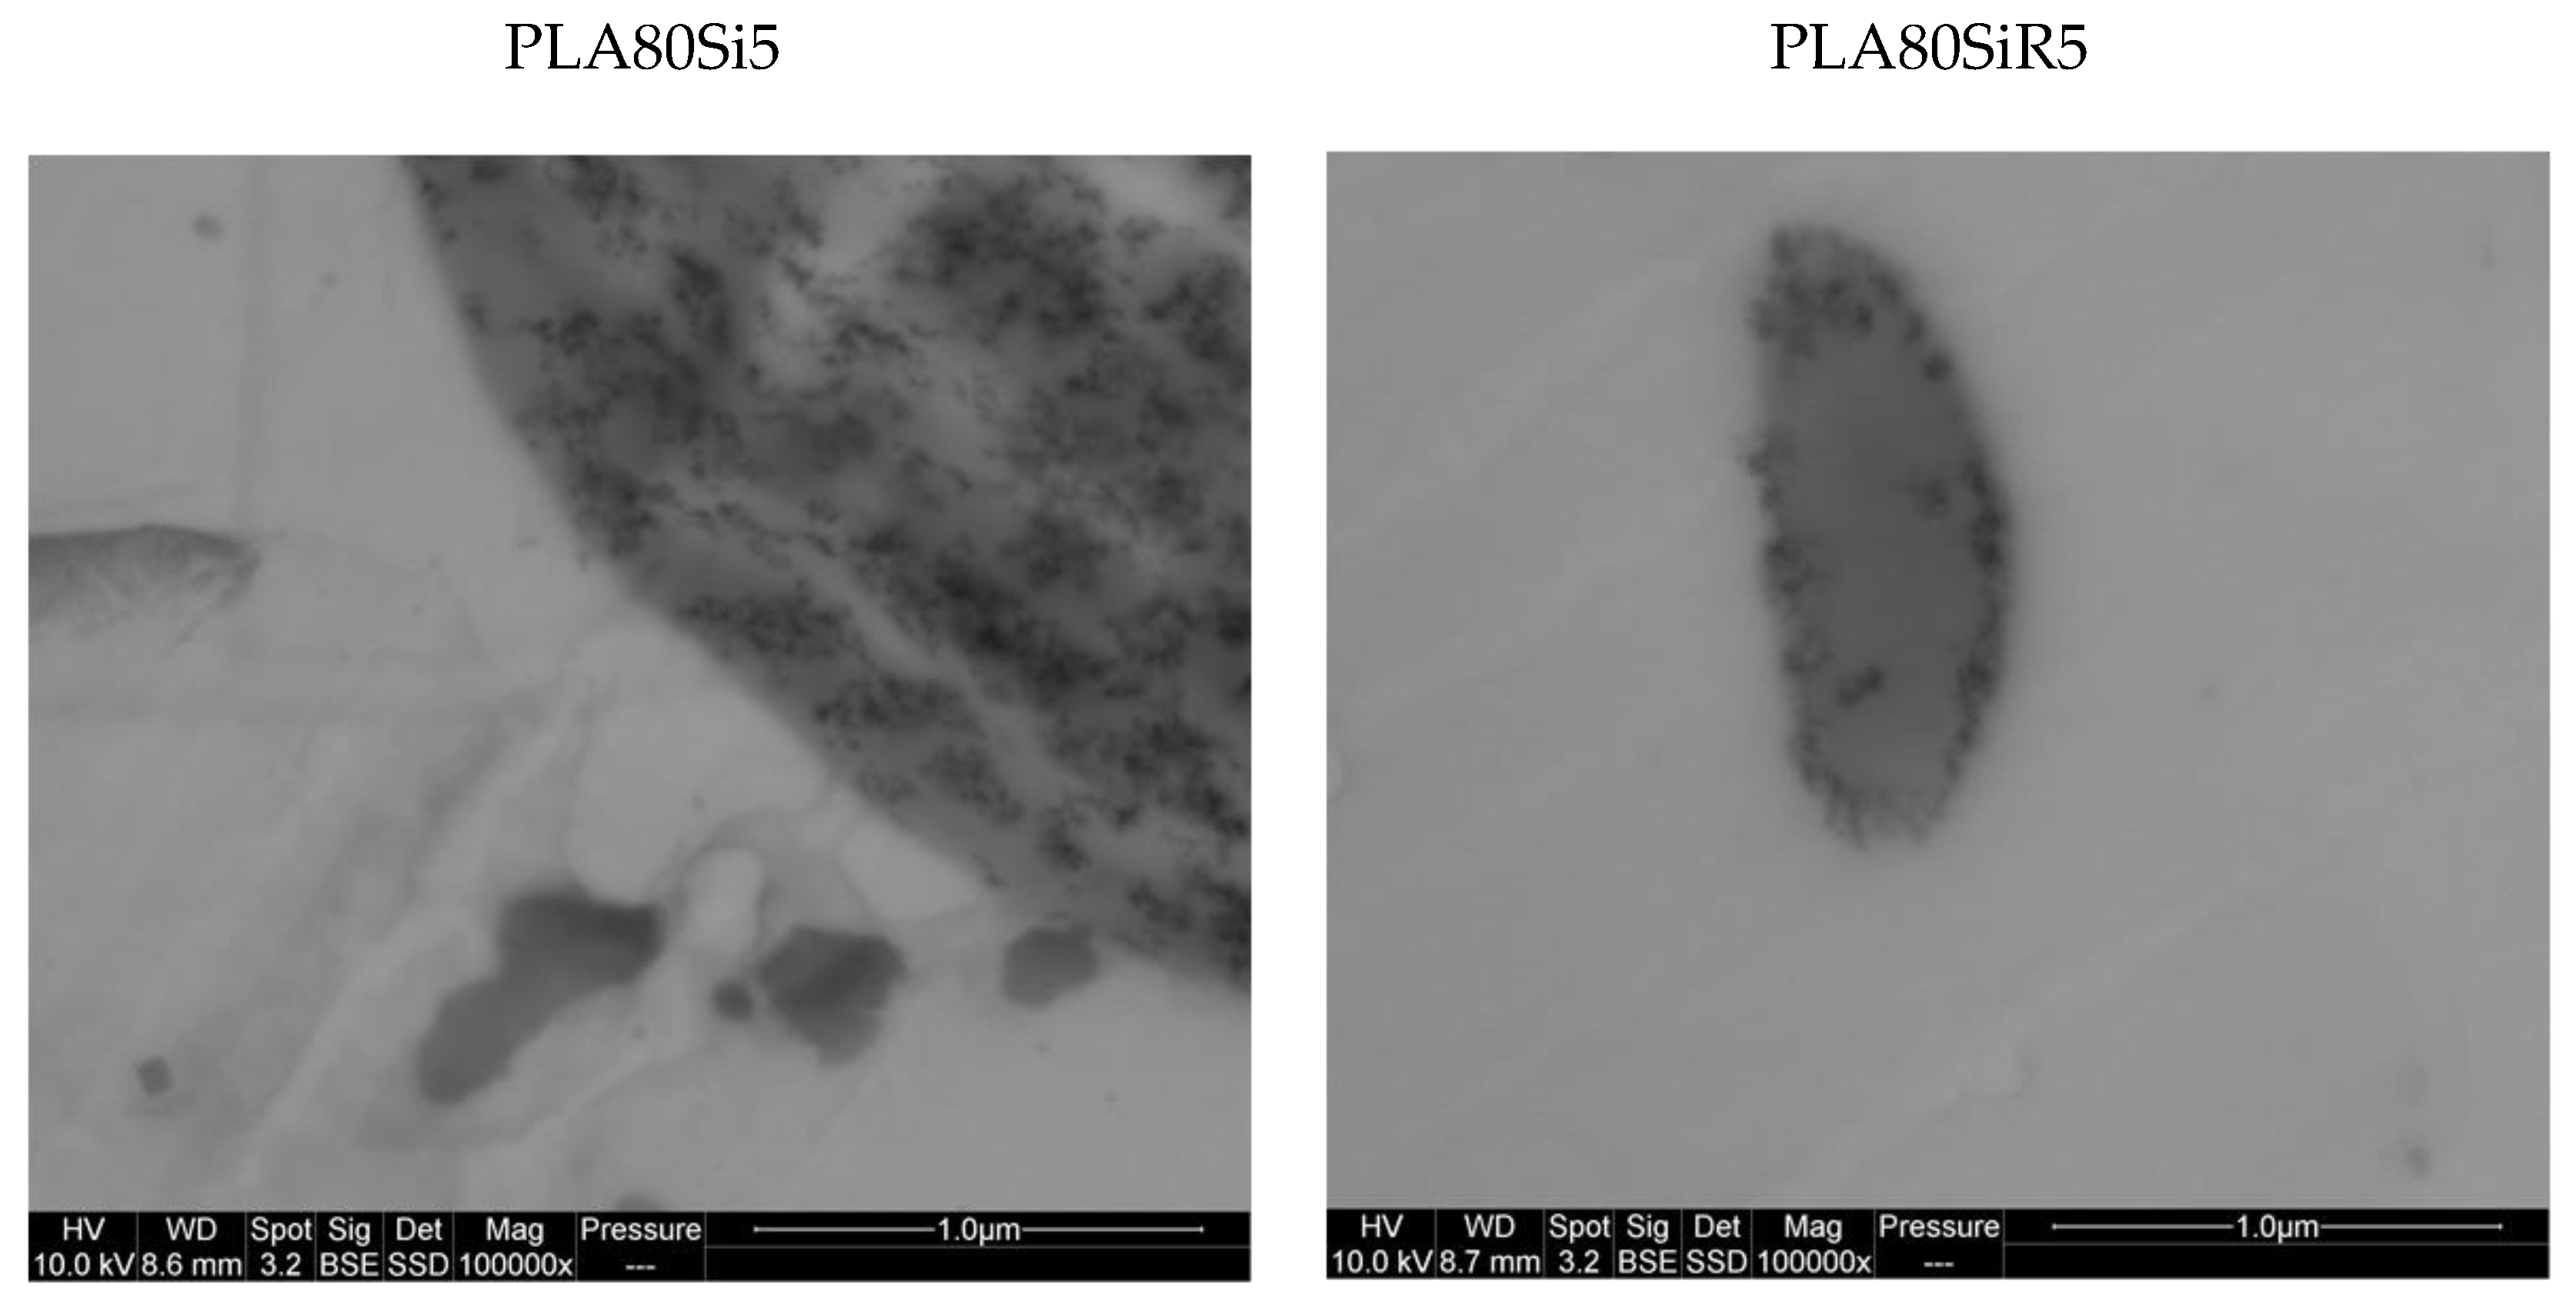
A scanning electron microscope Quanta 200 FEG (FEI, The Netherlands) was used to observe blend morphologies. For these characterizations, the samples were cryofractured under liquid nitrogen, either in the transverse or in the parallel direction of the thread collected after extrusion, and fracture surfaces were coated with carbon. The transmission mode (STEM) was also used. In this case, samples were ultramicrotomed under liquid nitrogen with a Leica apparatus, EM UC7 (Germany). All STEM micrographs were recorded at an accelerating voltage of 10 kV.
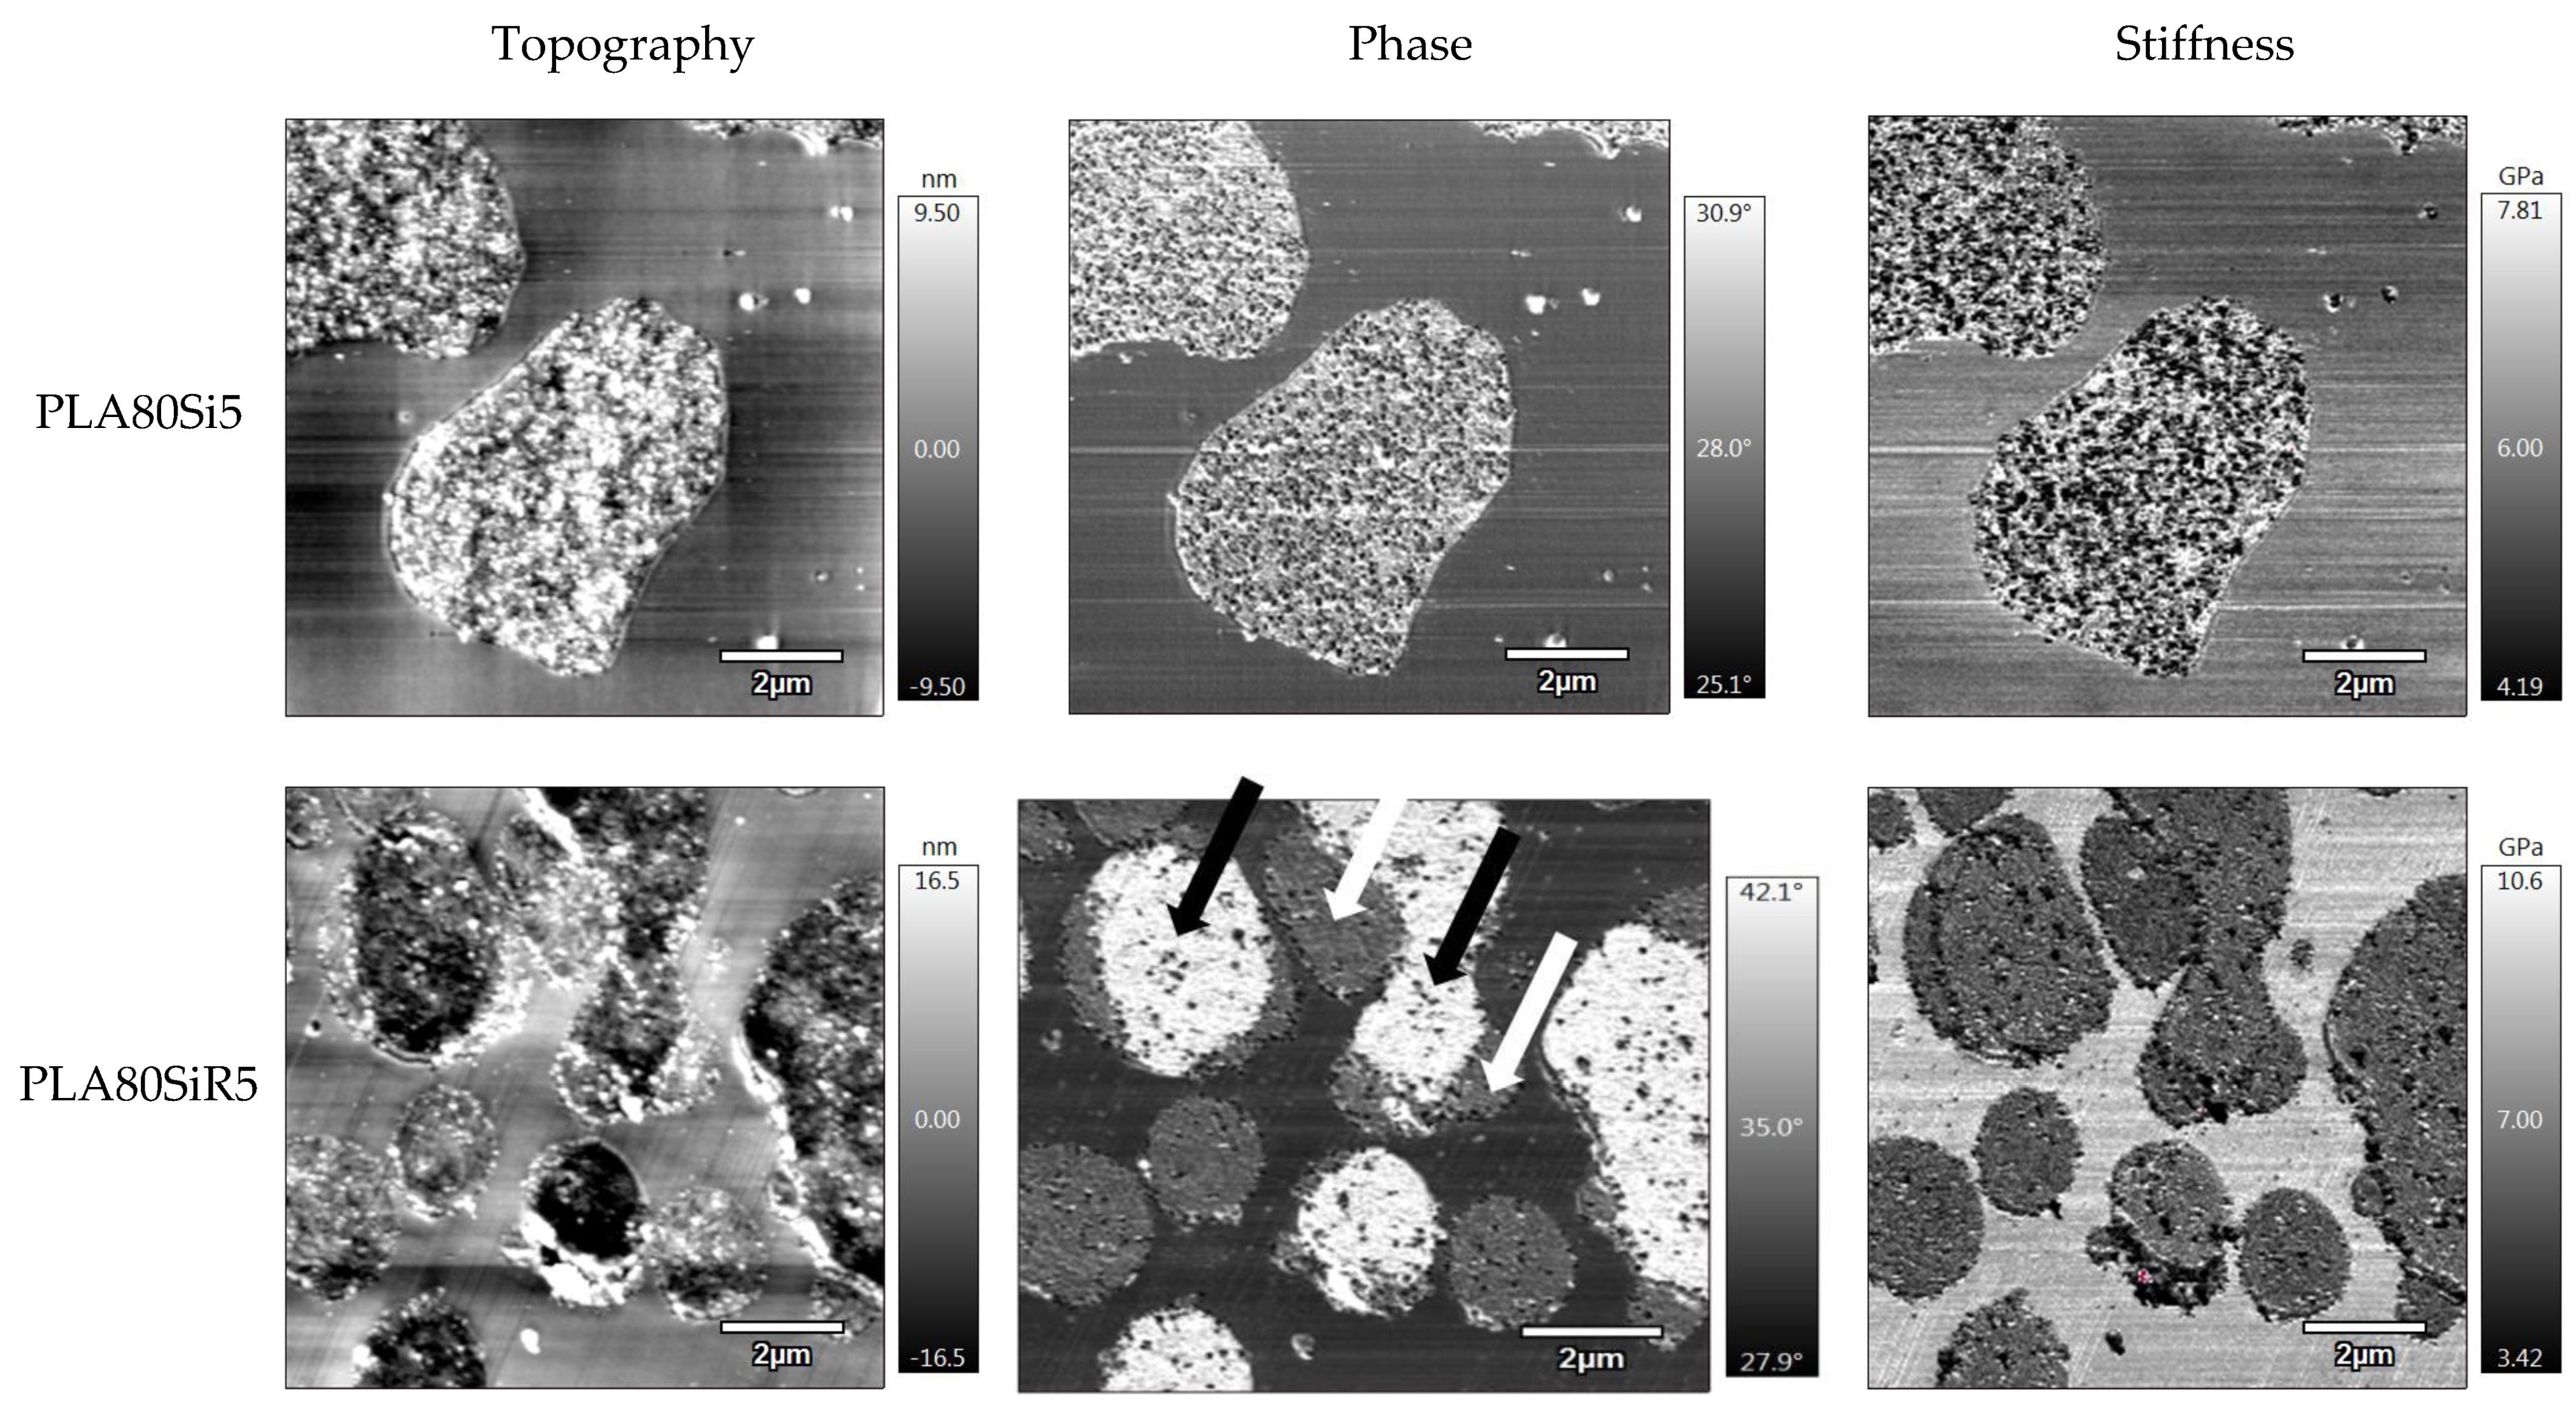
Cryo-ultramicrotomy with the EM UC7 apparatus was also performed on threads in the transverse direction, in order to prepare sample surfaces for AFM characterizations. PLA80Si5 and PLA80SiR5 blends were then tested with the MFP-3D Infinity (Asylum Research). A bimodal tapping mode (AMFM) was set, allowing to obtain mapping of surface topography, phase, and stiffness. A silicon probe (AC160R3) was used with a spring constant of 26 N/m and a resonant frequency of 300 kHz. A scan rate of 1 Hz was set for each test.
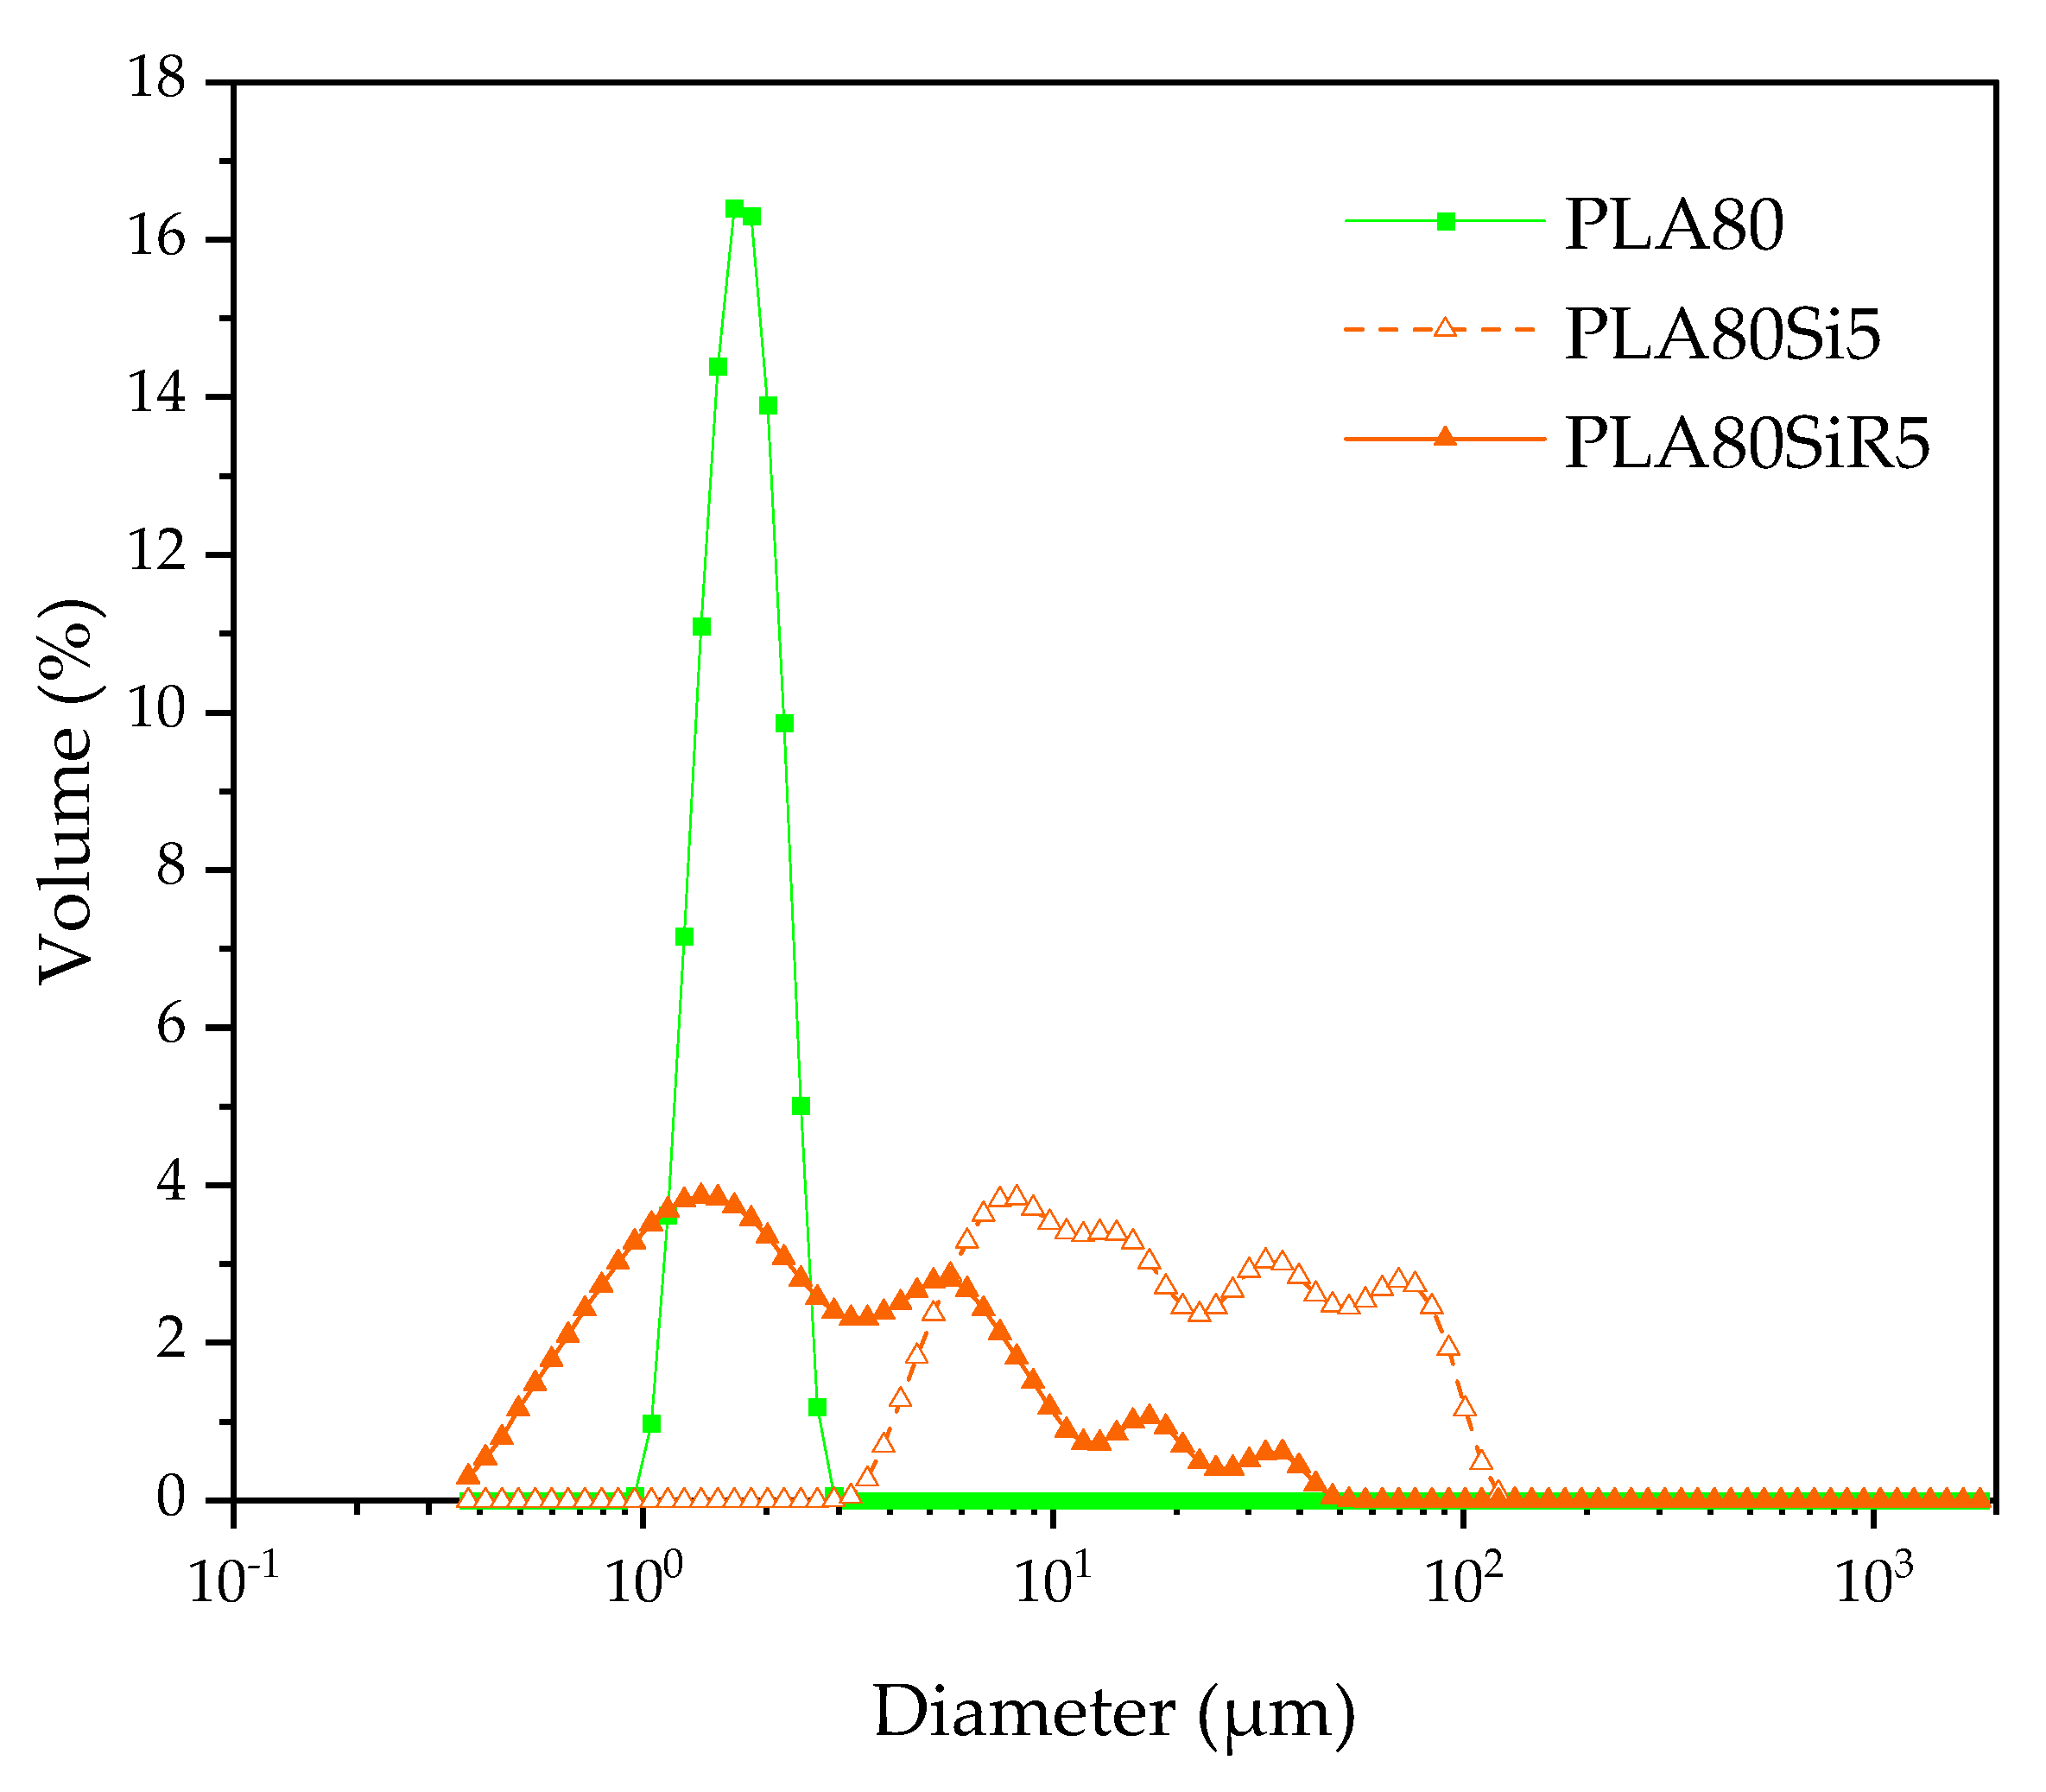
For each composition, 900 mg of extruded thread were immersed into 15 mL of chloroform at room temperature and stirred under ultrasonic probe during 48 h to dissolve the PLA. Then, PA11 nodules were purified by three washing/centrifugation cycles (10,000 rpm, 5 min) using chloroform and finally collected for analysis. A Coulter LS 13230 (Coulter Beckmann Co., USA) laser diffraction particle size analyzer instrument was used to determine the size distribution of extracted PA11 nodules. Size measurements were performed using the micro liquid module (15 mL) in chloroform. Obscuration was 10 ± 2%. Three measurements were performed for each sample. Laser diffraction particle size analyzer is an interesting alternative method to characterize dispersed phases in immiscible polymer blends. In fact, the number of dispersed phases analyzed by this method is much larger than the number analyzed with conventional image analysis from electron microscopy observations (SEM or TEM).
2.6. Interfacial Tension and Wetting Parameter
To predict the final localization of silica in the polymer blend nanocomposites, while considering thermodynamic parameters at room temperature, the wetting coefficient
ωAB was calculated based on Equation (1) [
6].
where
γSB,
γSA, and
γAB are the interfacial tensions between silica and polymer B, silica, and polymer A and both polymers A and B, respectively.
Interfacial tensions were obtained from the mean harmonic and geometric equations of Wu for polymer/polymer and polymer/silica interfacial tensions, respectively as shown in Equations (2) and (3) [
19]:
Mean harmonic equation of Wu for
γABMean geometric equation of Wu for
γSB and
γSA
with
the interfacial tension between components i and j (i and j can be a polymer or silica),
the surface tension of component
i and
and
the dispersive and polar contributions of the surface tension of the same component, respectively.
Dispersive and polar contributions of the surface tension for each component (PLA, PA11, silica A200, and silica R805) were obtained by contact angle measurements using distilled water and diiodomethane as liquids deposited on injection molded (for polymers) or compression molded (for silica, performed in another article [
20]) disks of each component. The Owens–Wendt equation was used to calculate
and
from the contact angle θ (Equation (4)).
The measurement of the contact angle θ between the liquid and the disk was performed with a goniometer DSA30 Series apparatus (Krüss, Germany) equipped with the KRUSS-AVANCE 1.5.1.0 software.
The methodology of the results part (below) consists in proving first that the amount of silica of all formulations was effectively 5 wt %. This is necessary to compare rheological tests performed on each formulation. Secondly, the oscillatory shear rheology was conducted on neat polymer nanocomposites to investigate the dispersion (and affinity) of each silica in each polymer. Then, polymer blend nanocomposites were investigated. Indeed, their rheological behavior and their microstructure were studied. Finally, the localization of both silica was compared to that obtained by calculating the wetting parameter. Then, all those results were discussed based on the results in the literature.
4. Discussion
The viscosity of the polymeric phases such as the ratio of viscosity (
, where
ηd is the viscosity of the PA11 dispersed phase and
ηm is the one of the PLA matrix) are known to play a key role in the final dispersion of nanoparticles. The literature remains controversial regarding the influence of those parameters. Three different works are described below to highlight that the influence of viscosity and viscosity ratio is not yet fully understood. Feng et al. [
23] studied the localization of carbon black nanoparticles (CB NPs) either in PMMA dispersed phase or PP matrix depending on the PMMA viscosity. They observed that CB NPs were dispersed into the PMMA preferred phase when the viscosities of PMMA and PP are comparable, whereas by increasing the viscosity of PMMA, CB NPs tend to disperse at the interface and in the PP phase. In that case, they concluded that the high viscosity of PMMA droplets inhibits the diffusion of CB NPs inside them. The process is known to play a crucial role in the final morphology of the blend and especially in the localization of the NPs. The authors mentioned that the blend was melt mixed with an internal mixer at 190 °C and 30 rpm without any more details regarding the processing route [
23]. In a more recent work, Plattier et al. [
24] studied the localization of CB fillers (particle size in the range of 200–400 nm) into a co-continuous PP/PCL blend regarding the viscosity ratio. As processing, the authors first melt mixed the blend (PP and PCL) by a microcompounder and then added the CB fillers. CB fillers are known to prefer the PCL phase. The authors observed that CB fillers were systematically dispersed in the most viscous phase except for the viscosity ratio of 1 for which they were dispersed at the interface. The authors explained their results in terms of hydrodynamic forces acting on the CB fillers. Fillers are extracted to the most viscous phase that applies the most important forces. When the viscosity ratio is close to 1, the two forces balance each other and the CB fillers are localized in between the two phases [
24]. Finally, Favis et al. published a series of works dealing with the localization of different particles (nanosilica, microsilica, and nanowires of copper) into two different matrix/dispersed phase blends: low interfacial tension one (PLA/ Polybutylene adipate terephthalate, PBAT) and high interfacial tension one (PLA/Low density polyethylene, LDPE) [
25,
26,
27,
28]. The viscosity ratio for the PLA/LDPE and PLA/PBAT blends is 0.83 and 0.12, respectively. Hence, we can consider a viscosity ratio lower than 1. The two polymeric phases were first added into the internal mixer. Then the fillers (mentioned previously) were incorporated in a second step. Only the conclusions regarding the process in which all components were added together are presented here. Whatever the interfacial tension (low or high) and whatever the viscosity ratio between the two polymers, the fillers were always dispersed into the most preferred phase: i.e., PLA most viscous matrix phase for PLA/LDPE and PBAT less viscous dispersed phase in the case of PLA/PBAT. This illustrates that whatever the viscosity ratio, interfacial tension, composition of the blend and aspect ratio of the particles, the final localization is the one predicted by the wetting parameter. Those different works highly illustrate the difficulty to converge into one main conclusion regarding the influence of the viscosity and the viscosity ratio of polymeric phases on the final localization of a (nano)particle.
In our case, for silica R805, thermodynamic prediction correlates with the observation as this silica goes to the interface. It is also in good agreement with Favis et al. observation regarding the transfer to the interface of nanosilica, while using a two steps process and low interfacial tension blend (PLA/PBAT) [
27,
28]. For silica A200, the conclusions are different as the wetting parameter predicts that those silica NPs should localize in the PLA matrix whereas they are mainly localized in the PA11 dispersed phase. As PA11 is more viscous than PLA (
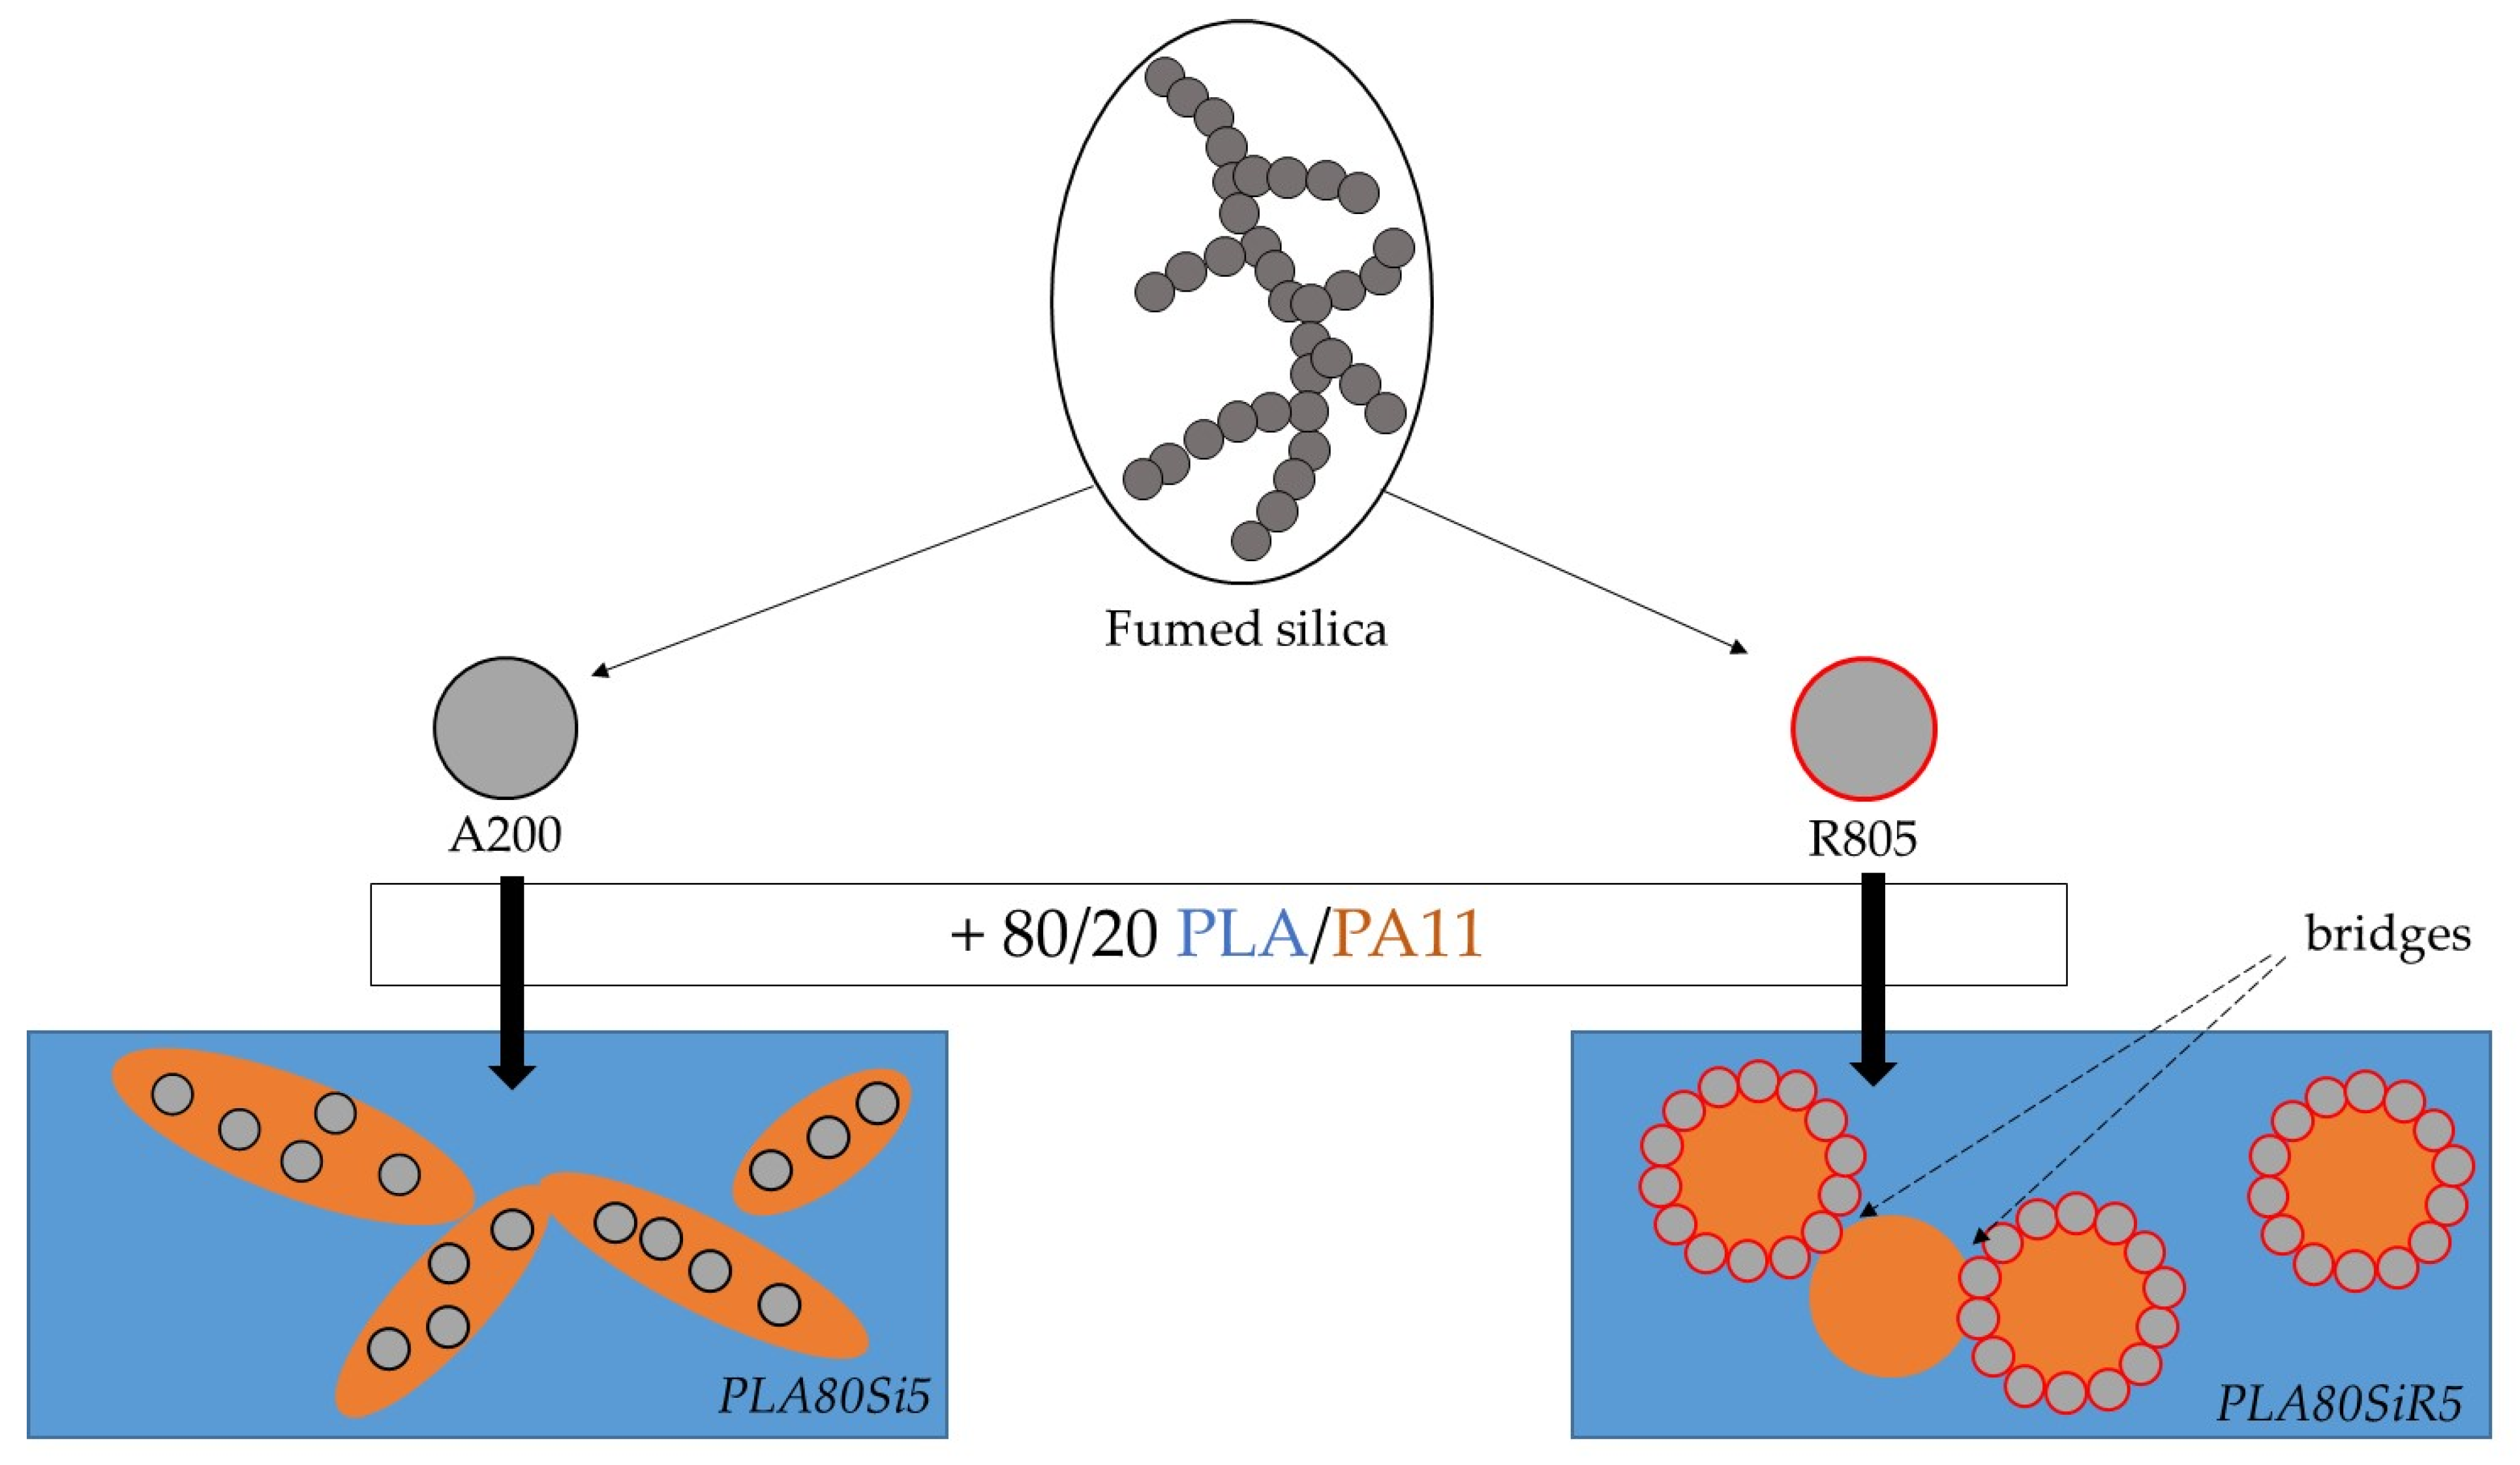
), it can be assumed that, during the process, silica NPs are extracted from the PLA phase toward the highest stress-applying PA11 phase. Moreover, this extraction is accompanied by an elongation of the PA11 dispersed phases. Hence, the elongated shape of PA11 phases observed in the case of PLA80Si5 can be explained by the increased yield stress of the filled PA11 phase, accompanied by a slowdown of the relaxation. This stabilizes the elongated morphology leading to a quasi-co-continuous morphology. We propose to discuss the obtaining of a quasi-co-continuous morphology with A200 by comparing what is seen in the literature.
This phenomenon was described by Liu et al. [
13], Pawar et al. [
8] and Wu et al. [
14] and is due to the NPs that drag the domains of wetting polymer causing their co-continuity formation. Indeed, Wu et al. have stated the self-networking of 10 phr of carbon black fillers into ABS/PA6 (80/20) blends leading to co-continuity at such low amount of PA6 [
14]. In their work, they showed a SEM micrograph of the ABS/PA6 (80/20) filled with 15 phr of CB after selective extraction of ABS by tetrahydrofuran, THF. Their microstructure is very close to that of
Figure 10 for PLA80Si5. It is obvious that A200 silica nanoparticles entrapped in a highly elongated PA11 phase will lead to the formation of a solid network identified under rheological tests at low frequency [
29]. Finally, the localization of A200 in the blend, the shape of PA11 phases as well as the rheological behavior of PLA80Si5 is now well-understood. What about the microstructure and rheology of PLA80SiR5?
R805 silica is shown to segregate at the interface of our PLA/PA11 blend. Usually, elongation of the dispersed phase is expected when nanosilica find their way to the interface during processing. This is clearly described by Jalali et al. [
27], who observed and explained the formation of an elongated PBAT dispersed phase into 70/30 PLA/PBAT blend filled with 3 wt % of nanosilica. In their case η*
PBAT < η*
PLA, whereas in our case PA11 dispersed phase have a higher viscosity than PLA matrix. This parameter can explain on his own the difference of dispersed phase shape observed. Hence, in our PLA80SiR5, silica NPs are localized at the interface with nearly spherical shape of the dispersed PA11 phase [
27]. Now, how to explain their rheological behavior, and especially the gel-like behavior evidenced at low frequency during frequency sweep test? Here again, we propose to discuss the rheological behavior of our polymer blends nanocomposites by comparing what is seen in the literature.
Velankar et al. [
30] were among the first to describe the particle-bridged drop cluster phenomenon in which particles glue two immiscible polymers. Zou et al. [
31] has taken up this theory and described the microstructure and rheological behavior obtained for 90/10 and 10/90 polybudadiene/polydimethylsiloxane (PBD/PDMS) blends filled with various amounts of hydrophobic fumed silica. The silica are supposed to go to the interface. In their case, as polymers are in the liquid form at room temperature, the process was very simple: hand-mixing with a spatula in a small Petri dish until a homogeneous mixture was formed. At high loadings (>1 wt %), when the droplet surface was completely covered with particles, as fumed silica exhibit high aspect ratio, fractal-like shape and high interparticle attractions (i.e., O-Si strong ionic bonds), they have a high tendency to flocculate. In their blend, this gives a peculiar morphology of the system described as droplet clusters structure [
31].
Those previous results allow highlighting the microstructure and rheology of our PLA80SiR5. In our case, as shown by AFM, the surface of some PA11 dispersed phase is fully covered by fumed silica, whereas other PA11 droplets are only partially covered by silica. Moreover, as fumed silica has a fractal structure, it can flocculate and one floc can belong to different PA11 nodules. With a strong iono-covalent link between the nanometric individual particles, this leads to a strong link between each PA11 spherical nodules, that look stuck together. This can explain the solid network visible at low frequency under rheology. Both final microstructures are schematically represented in
Figure 13.
5. Conclusions
A200 and R805 silica form solid networks in PLA and PA11 respectively, as shown by frequency sweep tests. This rheological behavior is extended to the 80/20 PLA/PA11 blend, as both A200 and R805 silica form a solid network (as shown by the yield behavior of the blend nanocomposites). For the PLA80Si5 blend nanocomposite, the localization of A200 in the most viscous PA11 dispersed phase can be explained by an extraction from PLA phase toward the most viscous phase that apply the most important hydrodynamic forces. This is accompanied by an elongation of the PA11 droplets leading to a quasi-co-continuous morphology of the blend. For the PLA80SiR5 blend nanocomposite, silica NPs are localized at the interface, as predicted by thermodynamics and the yield behavior identified by frequency sweep tests in rheology is due to the fractal nature of those silica NPs that create bridges between the dispersed droplets. These final microstructures correlate with the literature.
Peculiar morphologies are then obtained with a 80/20 bio-based polymer blend filled with hydrophilic or hydrophobic fumed silica. Being able to achieve co-continuous morphologies at very low levels of dispersed phase opens up possibilities. In addition, the dispersed phase bridges created by fumed silica could improve other properties (mechanical such as stiffness, impact, toughness). Finally, by replacing the fumed silica by electrically conductive nanoparticles, it can be expected to have a percolated network and a high electrical conductivity.


