Article

Employing Machine Learning and Deep Learning Models for Mental Illness Detection

1
School of Engineering and Applied Science, University of Pennsylvania, Philadelphia, PA 19104, USA
2
Center for Data Science, New York University, New York, NY 10012, USA
3
College of Computing, Georgia Institute of Technology, Atlanta, GA 30332, USA
4
Department of EECS, University of California, Berkeley, Berkeley, CA 94720, USA
5
Khoury College of Computer Science, Northeastern University, Seattle, WA 98109, USA
*
Author to whom correspondence should be addressed.
Computation 2025, 13(8), 186; https://doi.org/10.3390/computation13080186
Submission received: 23 June 2025 / Revised: 23 July 2025 / Accepted: 30 July 2025 / Published: 4 August 2025

Abstract

Social media platforms have emerged as valuable sources for mental health research, enabling the detection of conditions such as depression through analyses of user-generated posts. This manuscript offers practical, step-by-step guidance for applying machine learning and deep learning methods to mental health detection on social media. Key topics include strategies for handling heterogeneous and imbalanced datasets, advanced text preprocessing, robust model evaluation, and the use of appropriate metrics beyond accuracy. Real-world examples illustrate each stage of the process, and an emphasis is placed on transparency, reproducibility, and ethical best practices. While the present work focuses on text-based analysis, we discuss the limitations of this approach—including label inconsistency and a lack of clinical validation—and highlight the need for future research to integrate multimodal signals and gold-standard psychometric assessments. By sharing these frameworks and lessons, this manuscript aims to support the development of more reliable, generalizable, and ethically responsible models for mental health detection and early intervention.

1. Introduction

Mental health disorders, especially depression, have become a significant concern worldwide, affecting millions of individuals across diverse populations [1]. Mental health is defined by the World Health Organization (WHO) as a state of well-being in which every individual realizes their own potential, can cope with the normal stresses of life, can work productively, and is able to contribute to their community. In contrast, a mental disorder (or mental illness) refers to a clinically significant disturbance in an individual’s cognition, emotional regulation, or behavior, typically associated with distress or impairment in social, occupational, or other important areas of functioning [1]. These definitions are established in international classification systems such as the Diagnostic and Statistical Manual of Mental Disorders, Fifth Edition [2], and the International Classification of Diseases, Tenth Revision [3]. Early detection of depression is crucial, as it can lead to timely treatment and better long-term outcomes. In today’s digital age, social media platforms such as X (Twitter), Facebook, and Reddit provide a unique opportunity to study mental health. People often share their thoughts and emotions on these platforms, making them a valuable source for understanding mental health patterns [4,5].
Recent advances in computational methods, particularly machine learning (ML) and deep learning (DL), have shown promise in analyzing social media data to detect signs of depression. These techniques can uncover patterns in language use, emotions, and behaviors that may indicate mental health challenges [6,7].
However, applying these methods effectively is not without challenges. A recent systematic review [8] highlighted issues such as a lack of diverse datasets, inconsistent data preparation, and inadequate evaluation metrics for imbalanced data [9,10,11]. Similarly, Liu et al. [12] identified additional linguistic challenges in ML approaches for detecting deceptive activities on social networks, including biases from insufficient linguistic preprocessing and inconsistent hyperparameter tuning, all of which are pertinent to mental health detection.
To address the methodological challenges outlined in a prior systematic review [8], the objective of this manuscript is to provide a practical, step-by-step tutorial for mental health classification based on social media data. This work is intended as a follow-up to our previous review, offering specific guidance and standardized workflows for each critical stage in the pipeline.
To illustrate and implement these practices, we employ the ‘Sentiment Analysis for Mental Health’ dataset available on Kaggle (https://www.kaggle.com/datasets/suchintikasarkar/sentiment-analysis-for-mental-health/data, accessed on 23 November 2024). This dataset is not associated with any competition and does not have a leaderboard. It is selected for demonstration purposes, as it aggregates posts from multiple social media platforms and includes a range of mental health categories such as depression, anxiety, stress, bipolar disorder, and personality disorder. Its diversity makes it suitable for exploring both binary and multi-class classification scenarios, and for highlighting practical issues encountered in real-world data.
The main benefits of using this dataset are its accessibility, the inclusion of multiple mental health labels enabling multi-class modeling, and its reflection of the heterogeneity present in social media mental health discourse. Nevertheless, we recognize the limitations, including label ambiguity and inconsistency arising from aggregated, self-reported user content, and the fact that these labels are not equivalent to formal clinical diagnoses.
Throughout this paper, mental health categories such as ‘depression,’ ‘anxiety,’ and ‘stress’ refer to the labels as provided in the dataset, which are derived from user-generated posts and do not constitute clinical assessments. Our analysis and results should, therefore, be interpreted as the classification of linguistic and thematic signals within social media, rather than medical diagnoses.
This manuscript is designed to address these gaps by guiding readers through the steps necessary to create reliable and accurate models for depression detection using social media data. It focuses on practical techniques to
  • Collect and preprocess data, including handling language challenges like sarcasm or negations;
  • Build and optimize models with attention to tuning and evaluation;
  • Use appropriate metrics for datasets where depressive posts are a minority.

Key Takeaways and New Best Practices

Building directly upon the prior systematic review [8], which highlighted gaps such as non-representative sampling, inconsistent preprocessing, inadequate hyperparameter tuning, and overreliance on accuracy in imbalanced settings, this tutorial introduces several new best practices and consolidated guidelines for mental health detection using machine learning on social media. The main takeaways are as follows:
  • End-to-end reproducibility: This tutorial provides a complete, open-source workflow—including dataset selection, code, and standardized modeling steps—enabling transparent and replicable research.
  • Rigorous data partitioning and class imbalance handling: The manuscript demonstrates effective use of train–validation–test splits and class-weighted metrics, ensuring robust evaluation even for underrepresented categories.
  • Appropriate metric selection: It advocates for moving beyond accuracy and demonstrates the use of weighted F1-score and AUROC as more meaningful metrics for imbalanced multi-class tasks.
  • Standardized preprocessing pipeline: Clear, replicable steps for text cleaning, lemmatization, and feature extraction are provided, which can serve as a template for future studies.
  • Separation of linguistic patterns and clinical interpretation: The paper explicitly distinguishes between computational signals in user-generated text and clinical diagnoses, emphasizing responsible interpretation and ethical reporting.
  • Ethical transparency and data stewardship: Throughout the workflow, considerations of privacy, transparency, and limitations of non-clinical labels are highlighted to guide responsible use and reporting.
Together, these contributions provide new, consolidated methodological guidelines that address persistent limitations in previous work and offer a practical foundation for future research in the field.
Our goal is to provide a clear, step-by-step approach that researchers and practitioners can use to improve their methods. By addressing common challenges in this field, we hope to encourage more robust and ethical use of technology for improving mental health outcomes.

2. Method

This section provides a comprehensive overview of the methodological framework employed in this study, detailing the processes for data preparation, model development, and evaluation metrics. All analyses and model implementations were conducted using Python 3, leveraging popular libraries such as pandas for data manipulation, scikit-learn for machine learning, PyTorch for deep learning, and Transformers for pre-trained language models. These tools enabled efficient preprocessing, hyperparameter optimization, and performance evaluation. The models were trained on Google Colab using a high-performance NVIDIA T4 GPU with a high-RAM configuration, ensuring efficient computational resources for both ML and DL tasks. The following subsections elaborate on the key steps and methodologies involved in the study.

2.1. Data Preparation

2.1.1. Data Sources and Collection Methods

A sufficiently representative dataset is essential for machine-learning-based mental health detection. This study utilized the Sentiment Analysis for Mental Health dataset, available on Kaggle (https://www.kaggle.com/datasets/suchintikasarkar/sentiment-analysis-for-mental-health/data, accessed on 23 November 2024). The dataset integrates textual content from multiple repositories focused on mental health topics, including depression, anxiety, stress, bipolar disorder, personality disorders, and suicidal ideation. The primary sources of these data are social media platforms such as Reddit, Twitter, and Facebook, where individuals frequently discuss personal experiences, emotional states, and mental health concerns.
It should be noted that, although this dataset is hosted on Kaggle, it is not part of any official Kaggle competition and does not have an associated leaderboard or widely recognized set of published benchmark results. Our use of this dataset is motivated by its accessibility, diversity, and relevance for methodological demonstration and tutorial purposes, rather than for competitive performance comparison.
The dataset was originally compiled using platform-specific APIs (e.g., Reddit, Twitter, and Facebook) and web scraping tools, allowing for the collection of substantial volumes of publicly available text data. After the acquisition, duplicates were removed, irrelevant and spam content was filtered, and mental health labels were standardized to ensure consistency across repositories. Personal identifiers were removed to safeguard privacy and ensure compliance with ethical guidelines for data usage. The final dataset was consolidated into a structured CSV file with unique identifiers for each entry.
Although the dataset combines data from multiple platforms to provide a diverse corpus, it is not free from limitations. Differences in platform demographics, such as age, cultural background, and communication styles, may affect the generalizability of models trained on this data. Additionally, linguistic variability, including colloquialisms, slang, and code-switching, reflects the informal nature of social media communication. While this diversity enriches the dataset, it also presents challenges for natural language processing (NLP) techniques, particularly in tokenization and embedding generation. To address these complexities, the preprocessing pipeline was designed to handle diverse linguistic patterns and balance class distributions where needed.
Given the absence of a public leaderboard or standardized published baselines for this dataset, the results reported in this study are intended to serve as an initial, reproducible reference point for future research utilizing this resource.

2.1.2. Data Preprocessing

A standardized preprocessing pipeline was applied to prepare the dataset for training both machine learning (ML) and deep learning (DL) models. These steps ensured consistency in data handling while accommodating the unique requirements of each modeling approach:
  • Text Cleaning: Social media text often contains noise such as URLs, HTML tags, mentions, hashtags, special characters, and extra whitespace. These elements were systematically removed using regular expressions to create cleaner input for both ML and DL models.
  • Lowercasing: All text was converted to lowercase to maintain uniformity across the dataset and minimize redundancy in text representation.
  • Stopword Removal: Commonly used words that provide little semantic value (e.g., ‘the,’ ‘and,’ ‘is’) were excluded using the stopword list available in the Natural Language Toolkit (NLTK) [13], reducing noise while retaining meaningful content.
  • Lemmatization: Words were reduced to their base forms (e.g., ‘running,’ ‘ran,’ ‘runs’ → ‘run’) using NLTK’s Lemmatizer. This step normalized variations of words, aiding both feature extraction and embedding generation.
The dataset was divided into training, validation, and testing subsets using a two-step random sampling process with a fixed random seed to ensure reproducibility. First, 20% of the data was set aside as the test set. The remaining 80% was then further divided into a training set (60% of the original data) and a validation set (20% of the original data). This split ensured that the models were trained on the majority of the data while reserving separate subsets for hyperparameter tuning and final performance evaluation.

2.1.3. Class Labeling

The dataset’s class labels were prepared as follows: (1) For multi-class classification, the labels included six categories: Normal, Depression, Suicidal, Anxiety, Stress, and Personality Disorder. (2) For binary classification, the labels were grouped into two classes: Normal and Abnormal.

2.1.4. Feature Transformation for ML Models

In natural language processing, the method of feature extraction varies with the type of model. ML models require structured, numerical representations, whereas DL models are capable of processing raw text sequences or precomputed dense vector embeddings.
For ML applications, a prevalent method is to convert text into numerical features using the bag-of-words (BoW) model [14], which creates vectors based on token counts but does not differentiate between the importance of words. To overcome this limitation, Term Frequency-Inverse Document Frequency (TF-IDF) [15], as shown in (1), improves upon BoW by weighting words according to their significance—highlighting informative terms while reducing the impact of common ones.
TF - IDF ( t , d ) = TF ( t , d ) × log N DF ( t ) ,
where TF - IDF ( t , d ) is the term frequency of t in document d (often just the count of t in d), N is the total number of documents in the corpus, and  DF ( t ) is the document frequency, i.e., the number of documents in which the term t appears.
Although word embeddings (e.g., Word2Vec [16], GloVe [17], FastText [18]) can capture deeper semantic relationships by mapping words into dense vector spaces, they generally require larger datasets and more computational power.
In our study, TF-IDF Vectorization was used to transform the text into structured features for traditional ML models. The cleaned text was converted into numerical representations using TF-IDF to capture term frequencies while down-weighting overly frequent words. The vectorizer was configured to extract up to 1000 features and account for both unigrams and bigrams (n-gram range: 1–2).
The code for data preparation, including text cleaning, class labeling, dataset splitting, and TF-IDF feature creation, is publicly available on GitHub (https://github.com/VVVVVOID/Tutorial-on-Using-Machine-Learning-and-Deep-Learning-Models-for-Mental-Illness-Detection/tree/main, accessed on 12 April 2025). The code was implemented in Python 3.10 using the following libraries: scikit-learn (version 1.4.0), pandas (version 2.2.0), nltk (version 3.8.1), and imbalanced-learn (version 0.12.0).

2.2. Model Development

This study employed a range of machine learning (ML) and deep learning (DL) models to analyze and classify mental health statuses based on textual data. Each model was selected to explore specific aspects of the data, from linear interpretability to handling complex patterns and long-range dependencies. Detailed implementation code for all models, including hyperparameter tuning and evaluation, is available on GitHub. Below, we provide an overview of each model, its methodology, and its performance in the context of binary and multi-class mental health classification tasks.

2.2.1. Logistic Regression

Logistic regression is one of the most widely used methods for classification tasks and has long been employed in social science and biomedical research [19]. In the context of mental health detection, it provides a straightforward yet interpretable modeling framework, translating linear combinations of predictors (e.g., term frequencies) into estimated probabilities of class membership through the logit function.
The logistic regression model predicts the probability of a binary outcome using the following expression:
y ^ = 1 1 + exp ( w x b ) ,
where y ^ represents the predicted probability, w is the vector of model coefficients, x is the feature vector, and b is the bias term. For multi-class classification, the model generalizes to predict probabilities for K classes using the softmax function:
P ( y = k x ) = exp ( w k x + b k ) j = 1 K exp ( w j x + b j ) ,
where k { 1 , , K } represents the class index.
Both binary and multi-class logistic regression models were optimized using cross-entropy loss during training and configured to converge with a maximum iteration limit of 1000. Regularization was applied to prevent overfitting, using 2 (ridge) regularization, which penalizes large coefficients by adding their squared magnitude to the loss function:
L = 1 n i = 1 n y i log ( y ^ i ) + ( 1 y i ) log ( 1 y ^ i ) + λ β 2 2 ,
where λ controls the regularization strength, y i is the true label, y ^ i is the predicted probability, and  β represents the model coefficients.
Hyperparameter tuning was conducted using a grid search across several parameters. The regularization strength (C), which is the inverse of the regularization parameter λ , was tested with values such as 0.1, 1, and 10. Various optimizers, including liblinear (Library for Large Linear Classification), lbfgs (Limited-memory Broyden–Fletcher–Goldfarb–Shanno), and saga (Stochastic Average Gradient Augmented), were evaluated for optimization. To address class imbalance, the class_weight parameter was explored with options for balanced and None. For multi-class tasks, the multinomial strategy was employed, while the one-vs-rest strategy was implicitly applied for binary classification scenarios.
For both binary and multi-class tasks, the weighted F1 score was used as the primary evaluation metric, ensuring balanced performance across categories, including minority classes. A combined grid search configuration was applied for both tasks, as their hyperparameter spaces largely overlapped. The best configurations effectively handled class imbalance using the class_weight=‘balanced’ parameter, yielding robust performance on the validation and test sets.
The logistic regressions were implemented using the LogisticRegression class from the scikit-learn library. Detailed implementation code for logistic regression, including hyperparameter tuning and evaluation, is available on GitHub.

2.2.2. Support Vector Machine (SVM)

Support Vector Machines (SVMs) are supervised learning models that are widely used for both classification and regression tasks. Originally introduced by Cortes and Vapnik [20], SVMs aim to find the optimal hyperplane that maximizes the margin between data points of different classes. The margin is defined as the distance between the closest data points (support vectors) from each class to the hyperplane. By maximizing this margin, SVMs achieve better generalization for unseen data.
For a linearly separable dataset, the decision boundary is defined as
f ( x ) = w T x + b ,
where w is the weight vector, x is the feature vector, and b is the bias term. The optimal hyperplane is determined by solving the following optimization problem:
min w , b 1 2 w 2 , subject to y i ( w T x i + b ) 1 , i = 1 , , N ,
where y i { 1 , + 1 } are the class labels.
For datasets that are not linearly separable, the optimization problem is modified to include a penalty for misclassifications:
min w , b , ξ 1 2 w 2 + C i = 1 N ξ i , subject to y i ( w T x i + b ) 1 ξ i , ξ i 0 , i = 1 , , N ,
where ξ i are slack variables that allow for misclassifications, and  C > 0 is the regularization parameter that controls the trade-off between maximizing the margin and minimizing classification errors.
In the multi-class SVM, a one-versus-one (OvO) strategy is used, meaning that a separate binary classifier is trained for each pair of classes (e.g., Normal vs. Depression, Normal vs. Suicidal, Depression vs. Suicidal, etc.). The final prediction is made by aggregating the votes from these individual classifiers, enabling the model to effectively distinguish between every pair of mental health categories.
Kernel methods enable SVMs to handle nonlinearly separable data by mapping the input features into a higher-dimensional space where linear separation becomes possible. This mapping is performed implicitly using a kernel function K ( x i , x j ) , which computes the inner product in the transformed space:
K ( x i , x j ) = ϕ ( x i ) T ϕ ( x j ) ,
where ϕ ( · ) represents the mapping function.
In this project, kernel selection was based on preliminary experiments, with both linear and radial basis function (RBF) kernels being the primary choices. The linear kernel computes the dot product of input vectors and is suitable for linearly separable data, while the RBF kernel enables modeling of complex, nonlinear relationships. All kernel definitions and mathematical properties follow standard implementations as provided in scikit-learn.
For both binary and multi-class classification tasks, the same hyperparameter tuning strategy was employed. A grid search was conducted over the following hyperparameters:
  • Regularization parameter C: values of {0.1, 1, 10}.
  • Kernel type: linear and RBF.
  • Class weight: balanced or none.
  • Gamma (for RBF kernel): scale and auto.
The grid search aimed to identify the optimal combination of hyperparameters using the weighted F1 score as the primary evaluation metric. For multi-class classification, the one-vs-one strategy inherent to the SVC implementation was used.
The loss function for SVM is analogous to logistic regression, as both models minimize the cross-entropy loss during optimization. However, for SVM, the hinge loss is typically used for linear separable cases, defined as follows:
L hinge = 1 N i = 1 N max ( 0 , 1 y i f ( x i ) ) .
The SVM models were implemented with the SVC class from scikit-learn. Detailed implementation code for SVMs, including grid search and evaluation, is available on GitHub.

2.2.3. Tree-Based Models

Classification and Regression Trees (CARTs) are versatile tools used for analyzing categorical outcomes (classification tasks). The CART algorithm constructs a binary decision tree by recursively partitioning the data based on covariates, optimizing a predefined splitting criterion. For classification tasks, the quality of a split is typically evaluated using impurity measures such as Gini impurity or entropy [21]. The Gini impurity for a node is defined as follows:
G = i = 1 C p i ( 1 p i ) ,
where p i is the proportion of observations in class i at the given node, and C is the total number of classes.
Alternatively, entropy can be used to measure impurity:
H = i = 1 C p i log ( p i ) ,
where p i represents the same class proportions as in the Gini impurity formula. Lower impurity values indicate greater homogeneity within a node.
At each step, the algorithm selects the split that minimizes the weighted impurity of the child nodes. The impurity reduction for a given split is computed as follows:
Δ I = I parent n L n I L + n R n I R ,
where I parent is the impurity of the parent node, I L and I R are the impurities of the left and right child nodes, n L and n R are the number of observations in the left and right child nodes, and n is the total number of observations in the parent node.
The splitting process continues until one stopping criterion is met. Common criteria include the following: (1) a minimum number of samples in a node, (2) a maximum tree depth, and (3) No further reduction in impurity beyond a predefined threshold.
To address overfitting, pruning techniques [22] are employed. Pruning reduces the tree size by removing splits that contribute minimally to predictive performance, improving the model’s generalizability.
Due to their tendency to overfit, simple CART models were not evaluated in this project. Instead, ensemble methods like Random Forests and Gradient Boosted Trees, which combine multiple CART models, were used for improved robustness.
Random Forests
Random Forests are ensemble learning methods that aggregate multiple decision trees parallelly to enhance classification performance. By building trees on bootstrap samples of the data and introducing random feature selection at each split, Random Forests reduce overfitting and improve generalization. Each tree is trained on a random bootstrap sample, where data points are sampled with replacements from the original dataset, meaning some observations may appear multiple times in the training sample, while others are excluded. Additionally, Random Forests introduce randomness during the tree-building process by selecting a random subset of covariates at each split instead of considering all available covariates. This randomization decorrelates the trees, reduces variance, and enhances the model’s robustness. For classification tasks, the final prediction is determined by majority voting across all trees [23].
To further mitigate overfitting, each tree in the Random Forest is grown to its full depth without pruning, fitting the bootstrap sample as accurately as possible. Hyperparameters such as the number of trees (n_estimators), the maximum depth of each tree (max_depth), and the minimum samples required to split a node (min_samples_split) or form a leaf (min_samples_leaf) play a critical role in balancing bias and variance. The parameter class_weight, when set to ‘balanced’, adjusts weights inversely proportionally to class frequencies, effectively addressing the class imbalance.
A grid search approach was employed to optimize key hyperparameters for both binary and multi-class classification tasks. The parameter grid explored values such as 50, 100, and 200 for the number of trees (n_estimators); depths of 10, 20, or unrestricted (None) for max_depth; and split criteria (min_samples_split and min_samples_leaf) to control tree complexity. The weighted F1 score served as the primary evaluation metric to account for imbalances in the dataset. For the binary classification task, the best-performing model, determined through validation, effectively handled class imbalance and demonstrated robust predictive performance for distinguishing between Normal and Abnormal mental health statuses. In addition to traditional hyperparameter tuning techniques, recent studies have explored novel metaheuristic approaches to optimize Random Forest parameters. For instance, Tan et al. [24] proposed an improved dung beetle optimizer that refines hyperparameter tuning, further enhancing model performance.
For the multi-class classification task, the same hyperparameter grid was used with a slightly reduced scope to streamline the search process. The weighted F1 score guided model selection across all classes, including Normal, Depression, Anxiety, and Personality Disorder. The optimal model achieved balanced performance across multiple categories, leveraging Random Forests’ ability to aggregate predictions from diverse decision trees.
Random Forests’ inherent feature importance metrics provided additional insights into the most influential predictors for mental health classification. This capability enhances interpretability by highlighting covariates that most strongly influence predictions. The Random Forest models were built using the RandomForestClassifier from scikit-learn. Parameter grids for the number of estimators, maximum depth, and other parameters were evaluated over a predefined hyperparameter space. Detailed implementation code, including grid search and evaluation procedures, is available on GitHub.
Light Gradient Boosting Machine (LightGBM)
Light Gradient Boosting Machine (LightGBM) is a gradient-boosting framework optimized for efficiency and scalability, particularly in handling large datasets and high-dimensional data. Gradient Boosting Machines (GBMs) work by sequentially building decision trees, where each new tree corrects the errors made by the previous ones, leading to highly accurate predictions. However, traditional GBM frameworks can be computationally intensive, especially for large datasets [25]. Unlike traditional Gradient Boosting Machines (GBMs), LightGBM employs a leaf-wise tree growth strategy, which enables deeper splits in dense data regions, enhancing performance by focusing complexity where it is most needed. Additional optimizations, such as histogram-based feature binning, reduce memory usage and accelerate training. These enhancements make LightGBM faster and more resource-efficient than standard GBM implementations, without compromising predictive accuracy [26,27,28].
Key hyperparameters tuned for LightGBM included the number of boosting iterations (n_estimators), learning rate, maximum tree depth (max_depth), number of leaves (num_leaves), and minimum child samples (min_child_samples). To address the class imbalance, the class_weight parameter was tested with both ‘balanced’ and None options. Grid search was employed to explore all possible combinations of these hyperparameters, and the weighted F1 score was used as the primary metric for selecting the best configuration.
LightGBM was applied to both binary and multi-class mental health classification tasks. For binary classification, the model differentiated between Normal and Abnormal statuses. For multi-class classification, it predicted categories such as Normal, Depression, Anxiety, and Personality Disorder using the multi-class objective. Hyperparameter tuning via grid search ensured balanced performance across all categories, guided by the weighted F1 score.
The best-performing models demonstrated robust predictive power, evaluated using precision, recall, F1 scores, confusion matrices, and one-vs-rest ROC curves. Additionally, LightGBM’s feature importance metrics provided interpretability by highlighting the most influential linguistic and sentiment-based features. Its combination of high performance, scalability, and interpretability made LightGBM a key component in this project. The LightGBM models were developed using the LGBMClassifier from the lightgbm library. Hyperparameter tuning, including the number of boosting iterations, learning rate, and tree depth, was performed over a predefined hyperparameter space. Detailed implementation code, including grid search procedures, is available on GitHub.

2.2.4. A Lite Version of Bidirectional Encoder Representations from Transformers (ALBERT)

A Lite version of Bidirectional Encoder Representations from Transformers (BERT), known as ALBERT [29], is a transformer-based model designed to improve efficiency while maintaining performance. While BERT [30] is highly effective for a wide range of natural language processing (NLP) tasks, it is computationally expensive and memory-intensive due to its large number of parameters. ALBERT addresses these limitations by introducing parameter-sharing across layers and factorized embedding parameterization, which significantly reduces the number of parameters without sacrificing model capacity. Additionally, ALBERT employs Sentence Order Prediction (SOP) as an auxiliary task to enhance pretraining, improving its ability to capture sentence-level coherence. These optimizations make ALBERT a lightweight yet powerful alternative to BERT, capable of achieving competitive performance with reduced memory and computational requirements, making it particularly suitable for large-scale text classification tasks like mental health detection.
In this project, ALBERT was employed for both binary and multi-class classification tasks. For binary classification, the model was fine-tuned to differentiate between Normal and Abnormal mental health statuses, while for multi-class classification, it was configured to predict multiple categories, including Normal, Depression, Anxiety, and Personality Disorder. The implementation leveraged the pre-trained Albert-base-v2 model, with random hyperparameter tuning conducted over 10 iterations to optimize the learning rate, number of epochs, and dropout rates. The weighted F1 score served as the primary evaluation metric throughout the tuning process.
For both binary and multi-class classification tasks, hyperparameter tuning was conducted to optimize learning rates between 10 5 and 10 4 , dropout rates between 0.1 and 0.5, and epochs ranging from 3 to 5. For binary classification, the model achieved high validation F1 scores and demonstrated strong generalization on the test set. For multi-class classification, the objective was adjusted to predict seven categories, with weighted cross-entropy loss applied to address class imbalances and ensure adequate representation of minority categories. The final models were evaluated on the test set using metrics such as accuracy, weighted F1 scores, and confusion matrices.
ALBERT’s architecture efficiently captures long-range dependencies in text while retaining the computational advantages of its lightweight design. The use of random hyperparameter tuning further refined its performance, enabling robust classification for both binary and multi-class tasks. The ALBERT models were fine-tuned with the Transformers (AlbertTokenizer and AlbertForSequenceClassification) library from Hugging Face. Hyperparameter tuning was conducted manually through random search over learning rates, dropout rates, and epochs. detailed implementation code, including data preparation, training, and hyperparameter tuning, is available on GitHub.

2.2.5. Gated Recurrent Units (GRUs)

Gated Recurrent Units (GRUs) are a type of recurrent neural network (RNN) designed to capture sequential dependencies in data, making them particularly effective for natural language processing (NLP) tasks such as text classification [31]. Compared to Long Short-Term Memory networks (LSTMs), GRUs are computationally more efficient due to their simplified architecture, which combines the forget and input gates into a single update gate [32]. This efficiency allows GRUs to model long-range dependencies while reducing the number of trainable parameters.
In this study, GRUs were employed for both binary and multi-class mental health classification tasks. For binary classification, the model was configured to differentiate between Normal and Abnormal mental health statuses. For multi-class classification, it was adapted to predict categories such as Normal, Depression, Anxiety, and Personality Disorder.
The GRU architecture comprised three key components:
  • Embedding Layer: Converts token indices into dense vector representations of a fixed embedding dimension.
  • GRU Layer: Processes input sequences and retains contextual information across time steps, utilizing only the final hidden state for classification.
  • Fully Connected Layer: Maps the hidden state to output logits corresponding to the number of classes.
Dropout regularization was applied to prevent overfitting, and a weighted cross-entropy loss function was used to address class imbalances in the dataset.
For both binary and multi-class classification tasks, hyperparameter tuning was conducted using random search across predefined ranges. The parameters optimized included embedding dimensions (150–250), hidden dimensions (256–768), learning rates ( 10 4 10 3 ), and epochs (5–10). The weighted F1 score served as the primary evaluation metric during validation. The best-performing models achieved high F1 scores on validation datasets and demonstrated robust generalization on the test sets.
GRUs excelled at capturing sequential patterns in text, enabling the model to identify linguistic cues associated with mental health conditions. Despite being less interpretable than tree-based models, their lightweight architecture ensured computational efficiency and strong performance in text-based classification tasks. The GRU models were implemented with the torch.nn module in PyTorch. Key layers included nn.Embedding, nn.GRU, and nn.Linear. Optimization was performed using the torch.optim.Adam optimizer, and class weights were applied using nn.CrossEntropyLoss. The GRU models were implemented using PyTorch version 2.6.0 with CUDA 12.4 support, executed in the Google Colab environment. Detailed implementation code, including data preprocessing, model training, and evaluation, is available on GitHub.

2.3. Evaluation Metrics

When modeling mental health statuses—particularly for conditions like depression or suicidal ideation—class distributions are often skewed. In many real-world scenarios, the ‘positive’ class (e.g., individuals experiencing depression) is underrepresented compared to the ‘negative’ class (e.g., no mental health issue). This imbalance renders certain evaluation metrics, such as accuracy, less informative: a model that predicts ‘no issue’ for every instance might still achieve a high accuracy if the majority class dominates. Consequently, more nuanced metrics are preferred to evaluate the performance of classification models:

2.3.1. Precision

Precision measures the proportion of positive predictions that are truly positive:
Precision = True Positives True Positives + False Positives .
In mental illness detection, high precision is crucial because a high false positive rate (i.e., many individuals incorrectly labeled as having a mental health issue) can lead to unnecessary anxiety, stigma, and unwarranted interventions [33]. It is noted that focusing solely on precision might result in a model that is overly cautious—predicting very few positives and potentially missing many genuine cases—thereby also carrying significant risks.

2.3.2. Recall (Sensitivity)

Recall captures the proportion of actual positives correctly identified:
Recall = True Positives True Positives + False Negatives .
In the context of mental illness detection, high recall is essential because failing to recognize individuals who are truly at risk (i.e., a high false negative rate) can result in missed opportunities for timely intervention and support, potentially worsening their condition [33]. Thus, both precision and recall are important metrics, as errors in either direction—false positives or false negatives—can have serious and adverse consequences for individuals.

2.3.3. F1 Score

The F1 score serves as the harmonic mean of precision and recall, providing a balance between these two metrics [34]:
F 1 = 2 · Precision · Recall Precision + Recall .
The F1 score is particularly useful in imbalanced classification scenarios because it penalizes extreme trade-offs, such as very high precision coupled with very low recall. In mental health detection, achieving a high F1 score ensures the model can effectively identify positive cases while maintaining a reasonable level of precision in its predictions.

2.3.4. Area Under the Receiver Operating Characteristic Curve (AUROC)

AUROC provides an aggregate measure of performance across all possible classification thresholds. It evaluates the model’s ability to discriminate between positive and negative classes. However, in the presence of severe class imbalance, AUROC may not fully reflect the challenges posed by a majority class dominating the dataset. Nevertheless, it remains valuable for assessing model performance across varying decision thresholds [35,36,37].

3. Results

This section presents the findings from the analysis of the dataset and the evaluation of machine learning and deep learning models for mental health classification. First, we provide an overview in Section 3.1, highlighting the inherent class imbalances within the dataset and their implications for model development. Next, Section 3.2 details the parameter tuning process, which ensures that each model performs at its best configuration for both binary and multi-class classification tasks. Finally, Section 3.3 compares the models’ performance based on key metrics, including F1 scores and Area Under the Receiver Operating Characteristic Curve (AUROC). Additionally, nuanced observations, such as the challenges associated with underrepresented classes, are discussed to provide deeper insights into the modeling outcomes.

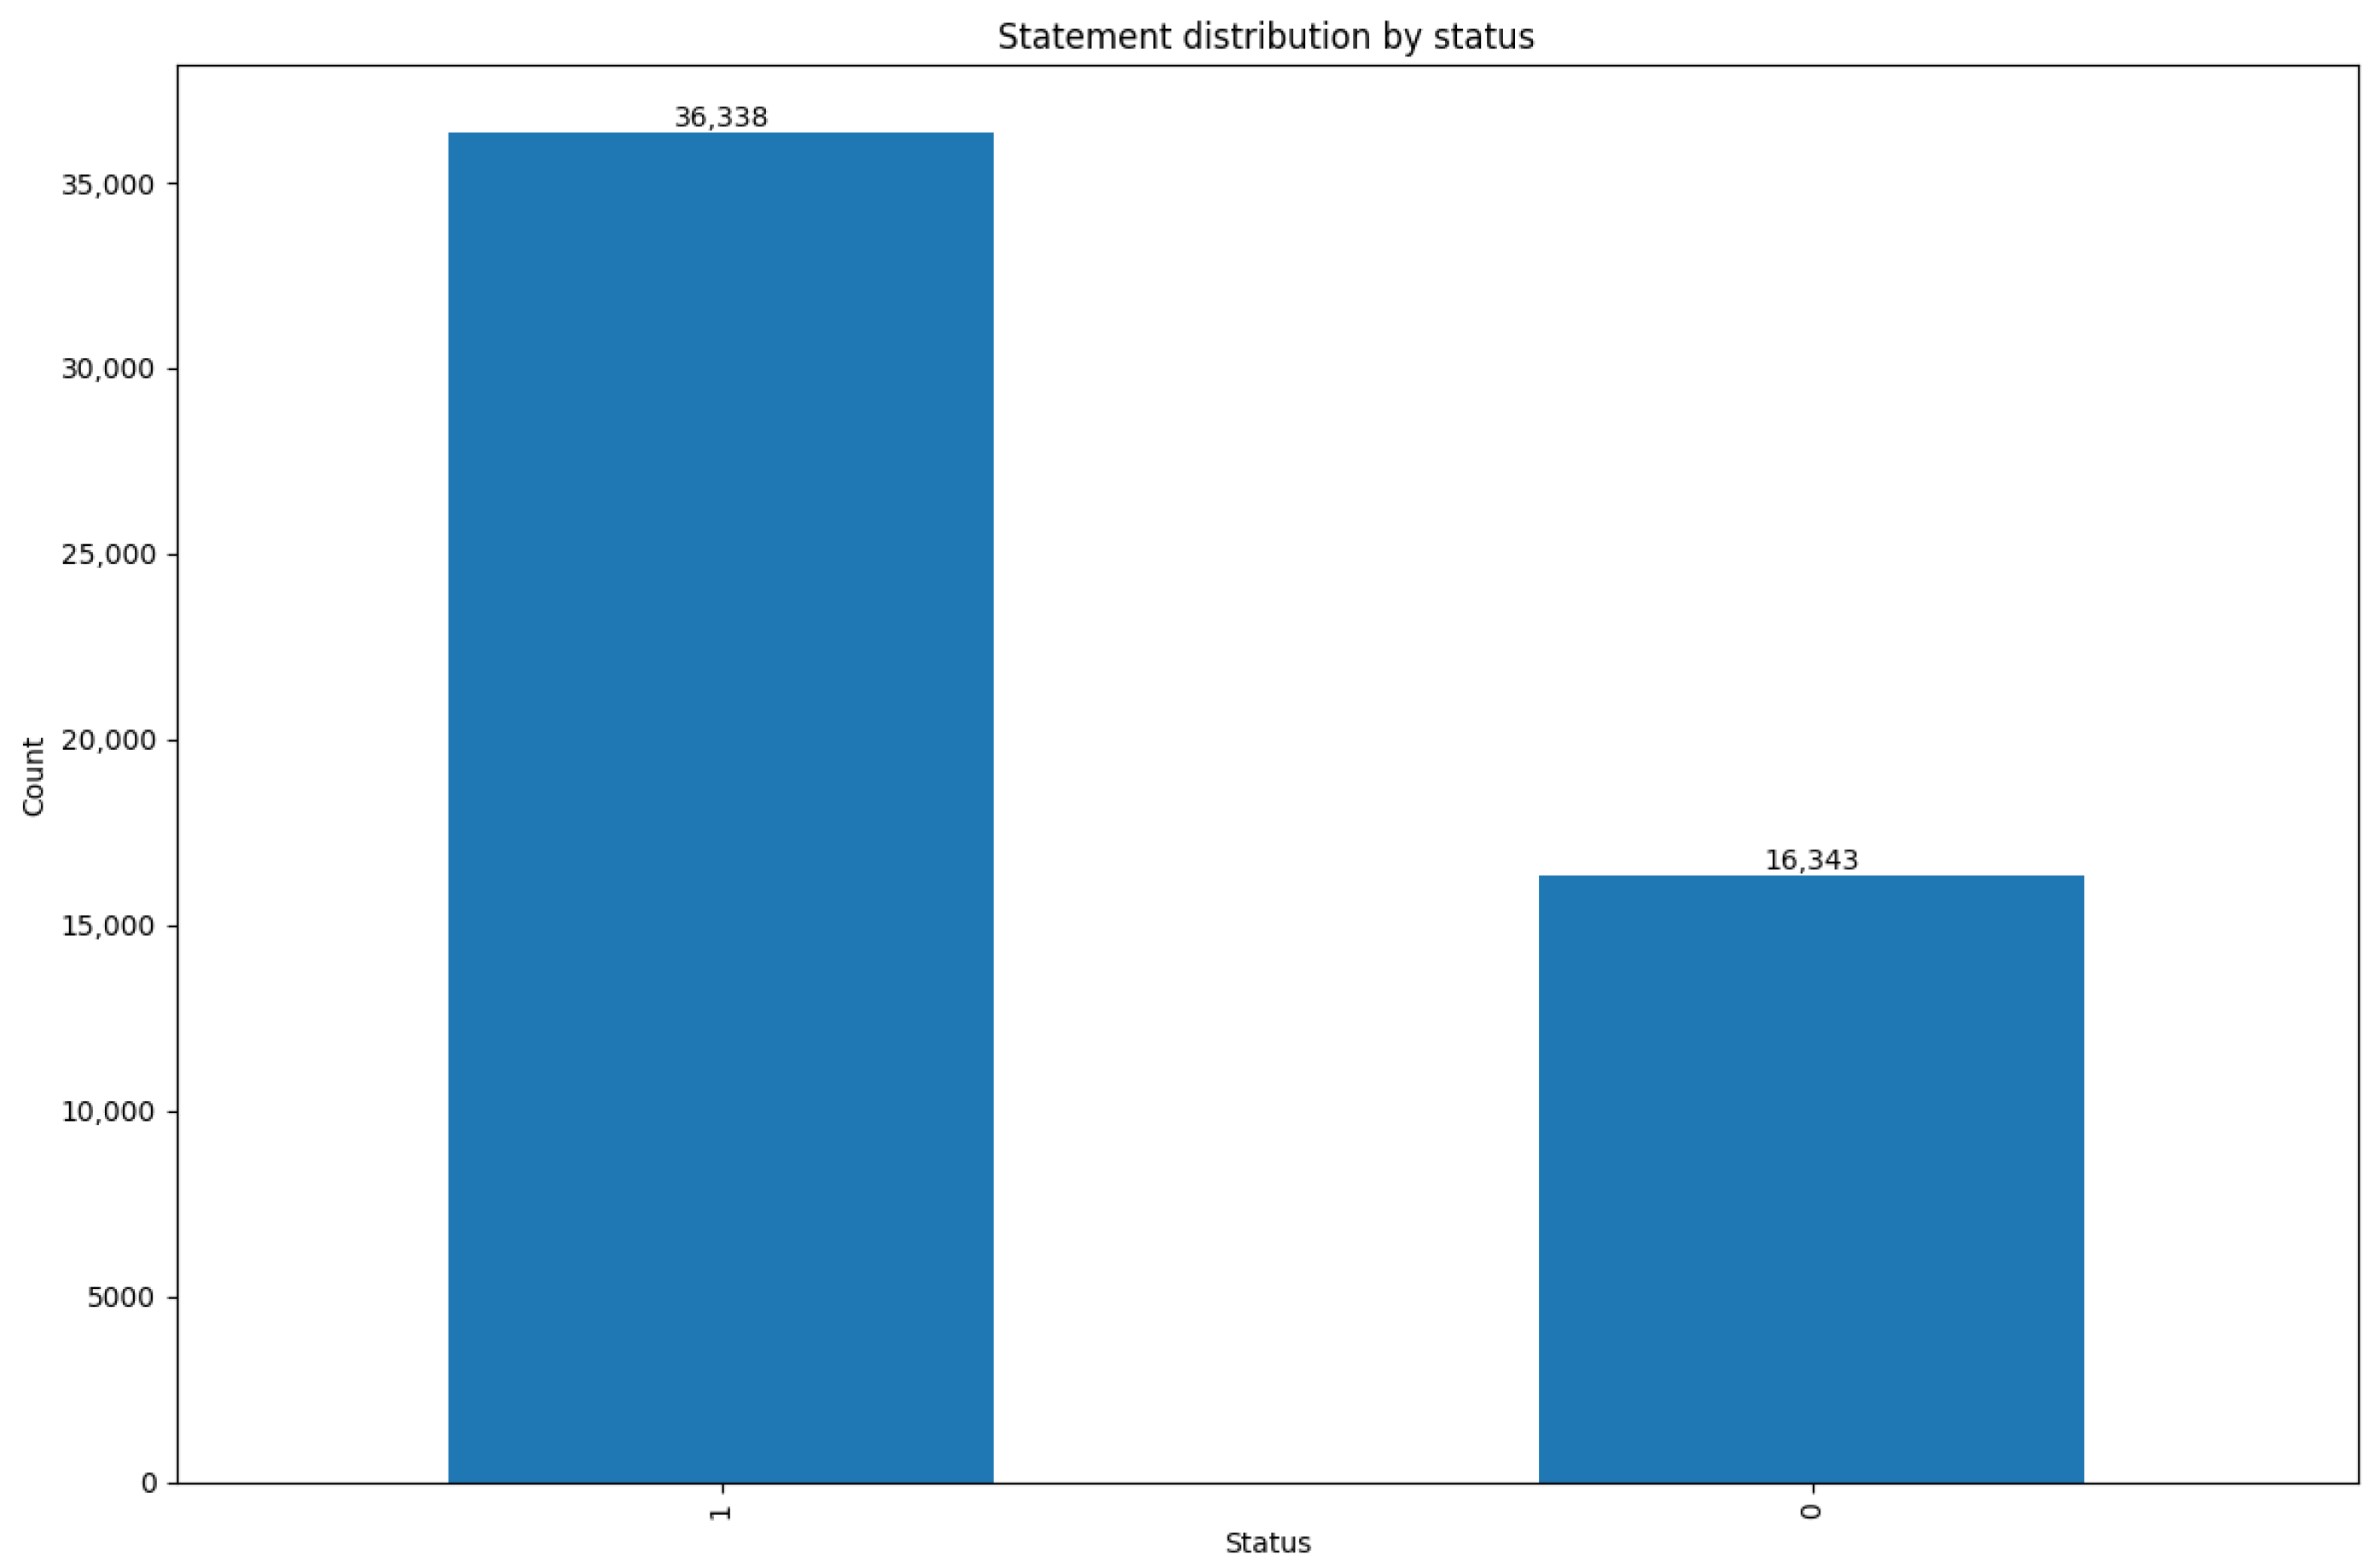
3.1. Overview of Mental Health Distribution

Before hyperparameter optimization and model evaluation, an analysis of the dataset’s class distributions was conducted to highlight potential challenges in classification. The dataset, sourced from Kaggle, contains a total of 52,681 unique statements categorized into three primary groups: Normal (31%), Depression (29%), and Other (40%). The Other category encompasses a range of mental health statuses such as Anxiety, Stress, and Personality Disorder, among others.
Figure 1 illustrates the expanded distribution of mental health statuses across seven detailed categories in the multi-class classification setup. The dataset shows a significant imbalance, with categories such as Normal, Depression, and Suicidal dominating the distribution, while others like Stress and Personality Disorder are notably underrepresented. This class imbalance poses challenges for multi-class classification tasks, particularly for the accurate identification of minority classes. Addressing such imbalances requires techniques like class-weighted loss functions and the use of metrics such as weighted F1 scores for model evaluation.
For the binary classification task, the dataset is divided into two classes: Normal and Abnormal. The distribution, shown in Figure 2, reveals that the Abnormal class (labeled as 1) accounts for approximately twice the number of records as the Normal class (labeled as 0). Although the imbalance is less severe compared to the multi-class scenario, it still necessitates strategies to ensure that the minority class (Normal) is adequately captured during model training.

3.2. Hyperparameter Optimization

Hyperparameter optimization is a critical step in enhancing the performance of machine learning (ML) and deep learning (DL) models. For this study, a grid search or random search approach was employed to systematically explore a predefined range of hyperparameters for each model. The primary evaluation metric used to select the best-performing hyperparameter configuration was the weighted F1 score, as it effectively balances precision and recall, particularly in the presence of imbalanced class distributions. This approach ensures that the selected models perform robustly across both binary and multi-class mental health classification tasks.
The optimized hyperparameters for each model, alongside their corresponding weighted F1 scores on the test set, are summarized in Table 1. These results highlight the configurations that achieved the best trade-off between underfitting and overfitting, providing insight into the hyperparameter values critical to the classification tasks.

3.3. Model Performance Evaluation

The evaluation metrics, including F1 scores (Table 2) and Area Under the Receiver Operating Characteristic Curve (AUROC) (Table 3), reveal minimal numeric differences across the models for both binary and multi-class classification tasks. This consistency in performance can be attributed to two primary factors. First, each model underwent rigorous hyperparameter tuning, ensuring only the best configurations were used for evaluation. Second, the dataset size, being of medium volume, provided sufficient information for machine learning models to achieve strong performance, while deep learning models could not fully demonstrate their potential advantages due to the limited data scale.
In the binary classification task, all models exhibited competitive F1 scores and AUROC values, effectively balancing precision and recall while distinguishing between normal and abnormal mental health statuses. Deep learning models such as ALBERT and GRU demonstrated slightly superior performance, achieving AUROC values of 0.95 and 0.94, respectively, which highlights their ability to capture complex linguistic patterns. Machine learning models, including Logistic Regression and LightGBM, also performed well, with AUROC scores of 0.93, underscoring their robustness in simpler classification settings.
In the multi-class classification task, a slight decline in performance was observed compared to the binary task. This decline aligns with the increased complexity of distinguishing between seven mental health categories. Nevertheless, deep learning models retained their advantage, with GRU and LightGBM achieving the highest micro-average AUROC scores of 0.97, followed closely by ALBERT with an AUROC of 0.95. Machine learning models such as Logistic Regression and Random Forest also performed commendably, with AUROC scores of 0.96, demonstrating their ability to handle multi-class tasks effectively when optimized.
Another important observation in the multi-class classification task is the consistently lower AUROC scores for Depression (Class 2) across all machine learning models, with values not exceeding 0.90. While deep learning models demonstrated a slight improvement, their performance for this class remained comparatively weaker than for other categories. This difficulty likely arises from the significant overlap between Depression (Class 2) and other categories in both linguistic and contextual features. The reduced AUROC scores highlight the models’ challenges in effectively distinguishing Depression, resulting in higher misclassification rates. These findings emphasize the need for refined feature engineering techniques or more sophisticated model architectures to enhance the separability and accurate classification of this particular class.
The minimal differences in performance metrics across models suggest that the combined effects of comprehensive hyperparameter optimization and dataset size contributed significantly to these results. Binary classification consistently outperformed multi-class classification, likely due to its reduced complexity and fewer decision boundaries. While deep learning models demonstrated their ability to capture intricate patterns, machine learning models offered competitive performance, making them practical alternatives for medium-sized datasets.
Performance metrics for F1 scores and AUROC values are detailed in Table 2 and Table 3, respectively. This analysis highlights the importance of balancing model complexity with dataset characteristics and emphasizes the critical role of hyperparameter tuning in achieving optimal results.

3.4. Error Analysis and Practical Implications

To deepen our understanding of classification challenges in text-based mental health detection, we conducted a class-wise performance breakdown using standard metrics (see Table 4). This analysis is particularly valuable in a methodological benchmark setting, as it highlights not only the relative strengths of different model configurations but also the recurring obstacles practitioners may face when working with open-access, aggregated datasets.
Several important trends emerge from our results:
  • Semantic Overlap and Ambiguous Boundaries: The classes of ‘Depression’, ‘Personality Disorder’, and ‘Suicidal’ exhibit lower F1-scores and AUC values compared to other categories. Errors are most pronounced where semantic cues are ambiguous or context-dependent, resulting in frequent misclassification between these classes. This is especially apparent in Depression, which demonstrates both the lowest F1-score (0.7086) and AUC (0.90), reflecting underlying ambiguity in textual expression and label assignment.
  • Impact of Data Integration: Given that the dataset pools user-generated content from diverse platforms and annotation schemes, some class boundaries are inherently noisy or inconsistent. This heterogeneity may dilute signal strength for models and complicate the task of reliably distinguishing between closely related mental health states.
  • Underrepresented Classes: Categories such as Stress and Suicidal, while clinically important, are both minority classes in the dataset and yield lower precision, recall, and F1-scores. This underlines a persistent challenge for real-world applications—ensuring fair and effective detection across all relevant mental health categories, not just the most prevalent ones.
It is important to emphasize that these findings should not be interpreted as a clinical diagnosis, but as a reflection of the current capabilities and limitations of text-based classification on social media data. The present results are intended as a reproducible benchmark for the research community, providing both a reference point for future methodological improvements and practical guidance for those deploying ML/DL tools in non-clinical settings.
For a full quantitative summary, see Table 4.

4. Discussion

The growing use of social media data for mental health detection has opened new possibilities for early identification and intervention, yet also presents significant methodological and ethical challenges. In this context, it is increasingly important to move beyond fragmented or ad hoc approaches, and to establish transparent, reproducible standards for data handling, modeling, and reporting. This study responds to these needs by systematically benchmarking a variety of machine learning and deep learning models for text-based classification, analyzing their performance and limitations, and critically reflecting on the broader implications for research and practice. The following discussion highlights our main contributions, addresses persistent limitations, and outlines key directions for future advancement in this rapidly evolving field.

4.1. Main Contributions and Practical Implications

This manuscript serves as a practical resource to address key methodological and analytical challenges in mental health detection on social media, as identified in the systematic review [8]. By focusing on best practices and reproducible methods, the manuscript aims to advance research quality and promote equitable outcomes in this important field.
A critical issue identified in the review is the narrow scope of datasets, which are often limited to specific social media platforms, languages, or geographic regions. This lack of diversity restricts the generalizability of findings. In this manuscript, strategies for expanding data diversity are explored, including integrating datasets across multiple platforms, collecting data from underrepresented regions, and analyzing multilingual content. These efforts aim to make research outcomes more inclusive and applicable to diverse populations.
Text preprocessing emerged as another key challenge, particularly in handling linguistic complexities such as negations and sarcasm. These nuances are critical for accurately interpreting mental health expressions. This manuscript offers practical guidelines for building preprocessing pipelines that address these complexities. Techniques for advanced tokenization, feature extraction, and managing contextual meanings are discussed to enhance the reliability of text-based analyses.
Research practices related to model optimization and evaluation were also found to be inconsistent in many studies. Hyperparameter tuning and robust data partitioning are essential for reliable outcomes, yet they are often inadequately implemented. This manuscript provides step-by-step instructions for optimizing models and ensuring fair evaluations, emphasizing the importance of strategies like cross-validation and train–validation–test splits. By following these practices, researchers can reduce bias and improve the validity of their results.
Evaluation metrics were another area of concern, with many studies relying on accuracy despite its limitations in imbalanced datasets. This manuscript highlights the importance of metrics such as precision, recall, F1-score, and AUROC, which provide a more balanced assessment of model performance. Additionally, practical approaches to managing imbalanced datasets, including oversampling, undersampling, and synthetic data generation, are illustrated.
Transparency in reporting methodologies and results is a foundational element of reproducible research. We encourage researchers to document their processes comprehensively, including data collection, preprocessing, model development, and evaluation. Sharing code and datasets is also emphasized, fostering collaboration and allowing other researchers to validate findings.
Ethical considerations are central to mental health research, particularly when using sensitive social media data. This manuscript stresses the need for privacy protection and adherence to ethical standards, ensuring that research respects the rights and dignity of individuals. Responsible data handling and clear communication of ethical practices are essential for maintaining trust and accountability in this field.
By addressing these challenges, this manuscript equips researchers with the tools and practices needed to improve the quality and impact of their work. Ultimately, these advancements contribute to the broader goal of promoting equitable and effective mental health interventions on a global scale.

4.2. Limitations and Future Directions

This study has several important limitations. First, the nature and construction of the dataset introduce fundamental challenges. The data is aggregated from multiple sources, each with its own annotation guidelines and labeling practices. There is no guarantee that labels across datasets were assigned using consistent definitions, standards, or procedures. This inherent heterogeneity in labeling and annotation creates uncertainty about class boundaries, undermines comparability across sources, and may impact the reliability of downstream analyses.
Second, these data limitations manifest directly in our error analysis. We observe persistent confusion among semantically overlapping categories—particularly Depression, Suicidal, and Personality Disorder. This confusion is likely compounded by both the ambiguity introduced through inconsistent labeling and the linguistic similarity of user-generated content. Additionally, minority classes such as Stress and Suicidal remain underrepresented, resulting in lower F1 and AUC scores for these categories even with class balancing techniques. These patterns highlight the practical limits of text-only machine learning for fine-grained mental health classification using multi-source, inconsistently labeled data.
Third, the reliability and validity of our findings are further constrained by the nature of the labels themselves. All class labels in this study are derived from user-generated, non-clinically assessed social media content. Consequently, evaluation metrics such as F1-score and AUROC reflect computational rather than clinical validity, and results should not be interpreted as diagnostic or psychometric outcomes. Future work should validate such models against gold-standard psychometric assessments or longitudinal clinical data before considering real-world application.
In addition, there are ethical and broader methodological considerations. Even with anonymization and ethical review, analyzing sensitive mental health content from social media poses risks of re-identification, stigmatization, and unintended harm. Furthermore, our dataset’s demographic and cultural biases limit the generalizability of findings. While this study focuses exclusively on textual data, recent research highlights the potential of multimodal approaches—such as integrating voice, facial expressions, or biosignals—to improve detection accuracy and better capture complex mental health states. Future research should explore these complementary modalities while remaining vigilant about ethical, technical, and privacy-related challenges.
Finally, a further limitation of this study is its exclusive focus on textual data. While recent advances in mental health informatics increasingly leverage multimodal signals—such as voice [38,39], facial expressions [40], or physiological biosignals (e.g., EEG/ECG)—to improve detection robustness [41,42], our work was designed as a text-based methodological benchmark and did not incorporate these modalities. This reflects both the tutorial-driven scope of our study and the available data resources. However, we acknowledge that multimodal data fusion represents a promising direction for future research, and integrating multiple information streams could help overcome some of the inherent limitations of text-only approaches in capturing complex mental health states.

4.3. Conclusions Statement

Looking forward, addressing these limitations will be critical for advancing the field of mental health detection on social media. As machine learning methods and available datasets continue to evolve, there is increasing opportunity to refine models, improve generalizability, and incorporate richer, clinically validated information. At the same time, the ethical landscape surrounding mental health analytics remains complex, requiring ongoing dialogue and adaptive best practices from both the research and practitioner communities.
In conclusion, this study provides a practical, reproducible benchmark for text-based mental health detection and critically assesses its strengths and weaknesses. By transparently reporting both methodological advances and current limitations, we aim to support the next generation of research and encourage the responsible use of computational tools in mental health science. Continued interdisciplinary collaboration, with close attention to both data-driven insights and human-centered values, will be essential for realizing the full potential of these technologies in promoting better mental health outcomes.

Author Contributions

Conceptualization, Y.C.; methodology, Z.W., Z.D., Y.C. and Y.Z.; software, Z.W., Z.D. and Y.Z.; validation, Z.W., Z.D., Y.C. and Y.Z.; formal analysis, Y.Z.; investigation, X.S., Z.D. and Y.Z.; data curation, Z.W. and Y.Z.; writing—original draft preparation, Y.C., Y.T. and Y.L.; writing—review and editing, Y.C., Y.T. and Y.L.; visualization, J.D.; supervision, Y.C.; project administration, Y.C. All authors have read and agreed to the published version of the manuscript.

Funding

This research received no external funding.

Data Availability Statement

The data analyzed in this study are publicly available on Kaggle (https://www.kaggle.com/datasets/suchintikasarkar/sentiment-analysis-for-mental-health/data, accessed on 23 November 2024).

Conflicts of Interest

The authors declare no conflicts of interest.

References

  1. WHO. Mental Disorders. 2023. Available online: https://www.who.int/news-room/fact-sheets/detail/mental-disorders (accessed on 9 February 2025).
  2. American Psychiatric Association. Diagnostic and Statistical Manual of Mental Disorders, 5th ed.; American Psychiatric Publishing: Washington, DC, USA, 2013. [Google Scholar]
  3. World Health Organization. International Statistical Classification of Diseases and Related Health Problems, 10th Revision (ICD-10); World Health Organization: Geneva, Switzerland, 1992. [Google Scholar]
  4. De Choudhury, M.; Counts, S.; Horvitz, E. Social media as a measurement tool of depression in populations. In Proceedings of the 5th Annual ACM Web Science Conference, Paris, France, 2–4 May 2013. [Google Scholar]
  5. Guntuku, S.C.; Yaden, D.B.; Kern, M.L.; Ungar, L.H.; Eichstaedt, J.C. Detecting depression and mental illness on social media: An integrative review. Curr. Opin. Psychol. 2017, 18, 43–49. [Google Scholar] [CrossRef]
  6. Shatte, A.B.R.; Hutchinson, D.M.; Teague, S.J. Social Media Markers to Identify Fathers at Risk of Postpartum Depression: A Machine Learning Approach. Cyberpsychology Behav. Soc. Netw. 2020, 23, 611–618. [Google Scholar] [CrossRef]
  7. Yazdavar, A.H.; Mahdavinejad, M.S.; Bajaj, G.; Romine, W.; Sheth, A.; Monadjemi, A.H.; Thirunarayan, K.; Meddar, J.M.; Myers, A.; Pathak, J.; et al. Multimodal mental health analysis in social media. PLoS ONE 2020, 15, e0226248. [Google Scholar] [CrossRef]
  8. Cao, Y.; Dai, J.; Wang, Z.; Zhang, Y.; Shen, X.; Liu, Y.; Tian, Y. Machine Learning Approaches for Depression Detection on Social Media: A Systematic Review of Biases and Methodological Challenges. J. Behav. Data Sci. 2025, 5, 67–102. [Google Scholar] [CrossRef]
  9. Hargittai, E. Is Bigger Always Better? Potential Biases of Big Data Derived from Social Network Sites. Ann. Am. Acad. Political Soc. Sci. 2015, 659, 63–76. [Google Scholar] [CrossRef]
  10. Helmy, A.; Nassar, R.; Ramdan, N. Depression Detection for Twitter Users Using Sentiment Analysis in English and Arabic Tweets. Artif. Intell. Med. 2024, 147, 102716. [Google Scholar] [CrossRef]
  11. Xu, S.; Cao, Y.; Wang, Z.; Tian, Y. Fraud Detection in Online Transactions: Toward Hybrid Supervised–Unsupervised Learning Pipelines. Preprints 2025, 2025051101. [Google Scholar] [CrossRef]
  12. Liu, Y.; Shen, X.; Zhang, Y.; Wang, Z.; Tian, Y.; Dai, J.; Cao, Y. A Systematic Review of Machine Learning Approaches for Detecting Deceptive Activities on Social Media: Methods, Challenges, and Biases. Int. J. Data Sci. Anal. 2025. [Google Scholar] [CrossRef]
  13. Bird, S.; Klein, E.; Loper, E. Natural Language Processing with Python; O’Reilly Media Inc.: Sebastopol, CA, USA, 2009. [Google Scholar]
  14. Harris, Z.S. Distributional Structure. Word 1954, 10, 146–162. [Google Scholar] [CrossRef]
  15. Jones, K.S. A Statistical Interpretation of Term Specificity and Its Application in Retrieval. J. Doc. 1972, 28, 11–21. [Google Scholar] [CrossRef]
  16. Mikolov, T.; Chen, K.; Corrado, G.; Dean, J. Efficient Estimation of Word Representations in Vector Space. In Proceedings of the International Conference on Learning Representations (ICLR), Scottsdale, AZ, USA, 2–4 May 2013. [Google Scholar]
  17. Pennington, J.; Socher, R.; Manning, C.D. GloVe: Global Vectors for Word Representation. In Proceedings of the Conference on Empirical Methods in Natural Language Processing (EMNLP), Doha, Qatar, 25–29 October 2014; pp. 1532–1543. [Google Scholar]
  18. Bojanowski, P.; Grave, E.; Joulin, A.; Mikolov, T. Enriching Word Vectors with Subword Information. In Proceedings of the Transactions of the Association for Computational Linguistics, Vancouver, BC, Canada, 30 July–4 August 2017; Volume 5, pp. 135–146. [Google Scholar]
  19. Hosmer, D.W.; Lemeshow, S. Applied Logistic Regression, 2nd ed.; John Wiley & Sons, Inc.: New York, NY, USA, 2000. [Google Scholar] [CrossRef]
  20. Cortes, C.; Vapnik, V.N. Support-Vector Networks; Springer: Berlin/Heidelberg, Germany, 1995; Volume 20, pp. 273–297. [Google Scholar]
  21. Bishop, C.M. Pattern Recognition and Machine Learning; Springer: Berlin/Heidelberg, Germany, 2006. [Google Scholar]
  22. Breiman, L.; Friedman, J.H.; Olshen, R.A.; Stone, C.J. Classification and Regression Trees; Wadsworth & Brooks/Cole Advanced Books & Software: Monterey, CA, USA, 1984. [Google Scholar]
  23. Breiman, L. Random Forests; Springer: Berlin/Heidelberg, Germany, 2001; Volume 45, pp. 5–32. [Google Scholar]
  24. Tan, L.; Liu, X.; Liu, D.; Liu, S.; Wu, W.; Jiang, H. An improved dung beetle optimizer for random forest optimization. arXiv 2024, arXiv:2411.17738. [Google Scholar] [CrossRef]
  25. Friedman, J.H. Greedy function approximation: A gradient boosting machine. Ann. Stat. 2001, 29, 1189–1232. [Google Scholar] [CrossRef]
  26. Ke, G.; Meng, Q.; Finley, T.; Wang, T.; Chen, W.; Ma, W.; Ye, Q.; Liu, T.Y. LightGBM: A highly efficient gradient boosting decision tree. In Proceedings of the 31st International Conference on Neural Information Processing Systems (NIPS), Long Beach, CA, USA, 4–9 December 2017; pp. 3149–3157. [Google Scholar]
  27. Tian, Y.; Xu, S.; Cao, Y.; Wang, Z.; Wei, Z. An Empirical Comparison of Machine Learning and Deep Learning Models for Automated Fake News Detection. Mathematics 2025, 13, 2086. [Google Scholar] [CrossRef]
  28. Huang, T.; Cui, Z.; Du, C.; Chiang, C.E. CL-ISR: A Contrastive Learning and Implicit Stance Reasoning Framework for Misleading Text Detection on Social Media. arXiv 2025, arXiv:2506.05107. [Google Scholar] [CrossRef]
  29. Lan, Z.; Chen, M.; Goodman, S.; Gimpel, K.; Sharma, P.; Soricut, R. ALBERT: A Lite BERT for Self-supervised Learning of Language Representations. arXiv 2020, arXiv:1909.11942. [Google Scholar] [CrossRef]
  30. Devlin, J.; Chang, M.W.; Lee, K.; Toutanova, K. BERT: Pre-training of deep bidirectional transformers for language understanding. arXiv 2019, arXiv:1810.04805. [Google Scholar] [CrossRef]
  31. Cho, K.; van Merrienboer, B.; Gulcehre, C.; Bahdanau, D.; Bougares, F.; Schwenk, H.; Bengio, Y. Learning phrase representations using RNN encoder-decoder for statistical machine translation. In Proceedings of the 2014 Conference on Empirical Methods in Natural Language Processing (EMNLP), Doha, Qatar, 25–29 October 2014; pp. 1724–1734. [Google Scholar]
  32. Wang, Y.; Guo, Y.; Wei, Z.; Huang, Y.; Liu, X. Traffic Flow Prediction Based on Deep Neural Networks. In Proceedings of the 2019 International Conference on Data Mining Workshops (ICDMW), Beijing, China, 8–11 November 2019; IEEE: Piscataway, NJ, USA, 2019; pp. 302–309. [Google Scholar] [CrossRef]
  33. Bradford, A.; Meyer, A.N.D.; Khan, S.; Giardina, T.D.; Singh, H. Diagnostic error in mental health: A review. BMJ Qual. Saf. 2024, 33, 663–672. [Google Scholar] [CrossRef]
  34. Powers, D.M. Evaluation: From precision, recall and F-measure to ROC, informedness, markedness and correlation. J. Mach. Learn. Technol. 2011, 2, 37–63. [Google Scholar]
  35. Davis, J.; Goadrich, M. The relationship between Precision-Recall and ROC curves. In Proceedings of the 23rd International Conference on Machine Learning, Pittsburgh, PA, USA, 25–29 June 2006; ACM: New York, NY, USA, 2006; pp. 233–240. [Google Scholar]
  36. Zhang, Z.; Wang, X.; Zhang, X.; Zhang, J. Simultaneously detecting spatiotemporal changes with penalized Poisson regression models. arXiv 2024, arXiv:2405.06613. [Google Scholar]
  37. Xu, S.; Tian, Y.; Cao, Y.; Wang, Z.; Wei, Z. Benchmarking Machine Learning and Deep Learning Models for Fake News Detection Using News Headlines. Preprints 2025, 2025061183. [Google Scholar] [CrossRef]
  38. Cummins, N.; Scherer, S.; Krajewski, J.; Schnieder, S.; Epps, J.; Quatieri, T.F. A review of depression and suicide risk assessment using speech analysis. Speech Commun. 2015, 71, 10–49. [Google Scholar] [CrossRef]
  39. Al Hanai, T.; Ghassemi, M.M.; Glass, J.R. Detecting depression with audio/text sequence modeling of interviews. In Proceedings of the Interspeech, Hyderabad, India, 2–6 September 2018; pp. 1716–1720. [Google Scholar]
  40. Valstar, M.; Gratch, J.; Schuller, B.; Ringeval, F.; Lalanne, D.; Torres Torres, M.; Scherer, S.; Stratou, G.; Cowie, R.; Pantic, M. Avec 2016: Depression, mood, and emotion recognition workshop and challenge. In Proceedings of the 6th International Workshop on Audio/Visual Emotion Challenge, Amsterdam, The Netherlands, 15–19 October 2016; pp. 3–10. [Google Scholar]
  41. Acharya, U.R.; Oh, S.L.; Hagiwara, Y.; Tan, J.H.; Adeli, H.; Subha, D.P. Automated EEG-based screening of depression using deep convolutional neural network. Comput. Methods Programs Biomed. 2015, 161, 103–113. [Google Scholar] [CrossRef] [PubMed]
  42. Craik, A.; He, Y.; Contreras-Vidal, J.L. Deep learning for electroencephalogram (EEG) classification tasks: A review. J. Neural Eng. 2019, 16, 031001. [Google Scholar] [CrossRef] [PubMed]
Figure 1. Multi-class distribution of mental health statuses.
Computation 13 00186 g001
Figure 2. Binary classification distribution of Normal versus Abnormal mental health statuses.
Computation 13 00186 g002
Table 1. Best Hyperparameters for binary and multi-class classification models.
ModelBest Parameters (Binary)Best Parameters (Multi-Class)Interpretation
Logistic Regression{C: 10, solver: ‘liblinear’, penalty: ‘l2’, class_weight: None}{C: 10, solver: ‘lbfgs’, penalty: ‘l2’, multi_class: ‘multinomial’, class_weight: ‘balanced’}For binary tasks, liblinear is chosen for smaller datasets. For multi-class, lbfgs supports a ‘multinomial’ strategy to optimize across multiple categories. The regularization strength (C) of 10 prevents overfitting.
SVM{C: 1, kernel: ‘rbf’, class_weight: ‘balanced’, gamma: ‘scale’}{C: 1, kernel: ‘rbf’, class_weight: ‘balanced’, gamma: ‘scale’}The RBF kernel captures nonlinear relationships in text data, while class_weight: ‘balanced’ was selected to address class imbalance. Regularization strength (C) balances margin maximization and misclassification.
Random Forest{n_estimators: 100, max_depth: None, min_samples_split: 5, min_samples_leaf: 1, class_weight: ‘balanced’}{n_estimators: 200, max_depth: None, min_samples_split: 2, min_samples_leaf: 2, class_weight: ‘balanced’}For binary tasks, 100 trees ensure stability. For multi-class, 200 trees improve coverage of complex class distributions. Weighted class adjustments handle imbalances.
LightGBM{n_estimators: 100, learning_rate: 0.1, max_depth: -1, num_leaves: 50, min_child_samples: 10, class_weight: None}{n_estimators: 100, learning_rate: 0.1, max_depth: None, num_leaves: 63, class_weight: ‘balanced’}For both tasks, LightGBM achieves efficiency via leaf-wise tree growth. For multi-class, additional leaves (63) improve the representation of minority classes.
ALBERT{lr: 1.46 × 10⁻⁵, epochs: 4, dropout: 0.11}{lr: 1.17 × 10⁻⁵, epochs: 4, dropout: 0.15}ALBERT’s lightweight architecture fine-tunes well with minimal learning rates and dropout for regularization. Minor adjustments improve class representation in multi-class settings.
GRU{embedding_dim: 156, hidden_dim: 467, lr: 0.0004, epochs: 5}{embedding_dim: 236, hidden_dim: 730, lr: 0.0003, epochs: 6}Embedding dimensions and hidden states effectively capture sequential dependencies in text. Multi-class configurations benefit from higher hidden dimensions and epochs.
Table 2. Weighted F1 scores of models for binary and multi-class classification tasks.
ModelBinary ClassificationMulti-Class Classification
Support Vector Machine (SVM)0.94010.7610
Logistic Regression0.93450.7498
Random Forest0.93590.7478
LightGBM0.93580.7747
ALBERT0.95760.7841
Gated Recurrent Units (GRU)0.95120.7756
Table 3. Area Under the Receiver Operating Characteristic Curve (AUROC) scores for binary and multi-class classification tasks.
ModelBinary Classification AUROCMulti-Class Classification Micro-Average AUROC
SVM0.930.95
Logistic Regression0.930.96
Random Forest0.920.96
LightGBM0.930.97
ALBERT0.950.97
GRU0.940.97
Table 4. Class-wise performance metrics in multi-class mental health classification (precision, recall, F1-Score, AUC).
ClassPrecisionRecallF1-ScoreAUC
Anxiety (0)0.79470.83580.81470.98
Bipolar (1)0.88090.81400.84620.98
Depression (2)0.71580.70160.70860.90
Normal (3)0.90780.92020.91400.99
Personality Disorder (4)0.87500.56120.68380.97
Stress (5)0.63310.59890.61550.96
Suicidal (6)0.66130.70110.68060.92
Disclaimer/Publisher’s Note: The statements, opinions and data contained in all publications are solely those of the individual author(s) and contributor(s) and not of MDPI and/or the editor(s). MDPI and/or the editor(s) disclaim responsibility for any injury to people or property resulting from any ideas, methods, instructions or products referred to in the content.

