Article

Additive Manufacturing Gyroid Structures Used as Crash Energy Management

by
Horacio Rostro-González
1,
Guillermo Reyes-Pozo
1,
Josep Maria Puigoriol-Forcada
1,
Francisco-José López-Valdés
2,
Sriharsha Srinivas Sundarram
3 and
Andres-Amador Garcia-Granada
1,*
1
Grup d’Enginyeria en Producte Industrial (GEPI), Institut Químic de Sarrià, Universitat Ramon Llull, E08017 Barcelona, Spain
2
Laboratorio de Movilidad, Biomecánica y Salud (MOBIOS), IIT, Escuela Técnica Superior de Ingeniería (ICAI), Universidad Pontificia de Comillas, 28015 Madrid, Spain
3
Department of Mechanical Engineering, Fairfield University, Fairfield, CT 06824, USA
*
Author to whom correspondence should be addressed.
Computation 2024, 12(12), 248; https://doi.org/10.3390/computation12120248
Submission received: 3 September 2024 / Revised: 11 November 2024 / Accepted: 11 December 2024 / Published: 19 December 2024
(This article belongs to the Special Issue Advances in Crash Simulations: Modeling, Analysis, and Applications)

Abstract

:
Gyroid-like structures are promising in terms of energy absorption levels. Due to additive manufacturing, they can now be manufactured and verified for different functions. In this article, it has been proven that a Gyroid manufactured by FDM using PLA with 0.2 relative density must be oriented so that compression takes place along the build direction to obtain higher levels of force and energy. The Gyroid can be scaled, allowing the use of a single compression curve with almost constant forces up to 50% compression. The model to predict properties as a function of relative density fits well with a power-law for n = 2.2. The ability of the Gyroid to absorb energy per kilogram is about seven times lower than that of a solid PLA cube, but it can be used to obtain desired levels of deceleration. It is possible to use a simple constant deceleration model to define the Gyroid size, mass, and velocity of the object to be impacted. The use of this approach allows the tailored combination of Gyroid sizes to meet multi-objective impact targets. The simulation of impacts with a finite element model of only 125 solid elements is possible with errors below 10%. By combining different Gyroid sizes, two different safety regulations can be met. Modeling the Gyroid by meshing the real geometry allows for the local maximum force magnified at high strain rates, but it is not able to correctly predict densification.

1. Introduction

Additive manufacturing enables designers to create complex shapes with diverse functionalities. Doubrovski et al. [1] explored the potential for achieving optimal designs, while Yang et al. [2] emphasized the enhanced freedom of design. When combined with computer-aided engineering, additive manufacturing allows for topology optimization, resulting in shapes that would otherwise be unachievable through traditional manufacturing methods. An example of optimization to minimize mass and maximize stiffness and frequency is provided by Efa et al. [3]. The production of complex shapes has led to significant improvements in energy management, such as enhanced cooling in injection molds, with state of the art provided by Khan et al. [4] and optimized channel designs by Pietropaoli et al. [5].
Recently, triply periodic minimal surfaces (TPMS), such as Gyroids, have gained popularity in additive manufacturing for their potential to optimize graded cellular structures, as shown by Li et al. [6], and achieve ideal combinations of varying densities, as shown by Zhang et al. [7]. TPMS structures, including Gyroid and Diamond, were mechanically characterized by Naghavi et al. [8] in the context of Ti6Al4V scaffolds. They provided equations to better understand the behavior of these complex Diamond structures:
D x , y , z = s i n 2 π a x s i n 2 π b y s i n 2 π c z + s i n 2 π a x c o s 2 π b y c o s 2 π c z + c o s 2 π a x s i n 2 π b y c o s 2 π c z + c o s 2 π a x c o s 2 π b y s i n 2 π c z = C
and for Gyroid, as used in this research as lattice structures:
G x , y , z = s i n 2 π a x c o s 2 π b y + s i n 2 π b y c o s 2 π c z + s i n 2 π c z c o s 2 π a x = C
according to Maskery et al. [9], (x,y,z) represent the Cartesian coordinates, while a, b, and c denote the unit cell lengths in each respective direction. The constant C represents the defined relative density. Sheet-based TPMS structures are defined as the zero isosurface where the level-set function G x , y , z = 0 . To incorporate thickness into the design, the unit cell is bounded by two isosurfaces, G x , y , z = t / 2 ., where t defines the value of sheet thickness.
Chouhan and Bala Murali [10] provide a comprehensive review of bioinspired Gyroid structures, focusing on manufacturing parameters and their impact on mechanical and thermal properties. Li et al. [11] compared the mechanical properties and energy absorption capabilities of Gyroid cellular structures with graded densities. In their paper, the authors proposed using equations to relate material properties to relative density, drawing on the Gibson–Ashby model:
σ G σ C = k ρ G ρ C n
where σ G represents the material property (such as Young’s modulus, yield stress, etc.) of the resultant homogenized Gyroid structure, and σ C denotes the corresponding property of a solid cube fabricated to reach PLA filament density of 1240 kg/m3. Similarly, ρ G and ρ C are the densities of the Gyroid and the solid cube, respectively. The constants k and n are empirically determined for each material property through experimental fitting.
Li et al. [11] found that for Young’s modulus, assuming n = 2, the constant k was 0.512 or 0.817, depending on whether the structure was fabricated using struts or sheets. For yield stress, they assumed n = 1.5 and determined k values of 0.135 or 0.179. Although they also provided energy values in kJ/m3, these were not fitted to a model equation. Notably, the researchers did not employ Fused Deposition Modelling (FDM) or Fused Filament Fabrication (FFF); instead, they used Stereolithography (SLA) with a Form 2 (Formlabs, Somerville, MA, USA) machine.
Naghavi et al. [8] obtained similar results for Ti6Al4V alloy (Grade 23 ELI) using a selective laser melting (SLM) machine (ISO name Laser Powder Bed Fusion (L-PBF)). They also adjusted the parameter n to fit their data. For the Young’s modulus, they found k = 0.9 for the Gyroid structure with n = 1.58 (instead of 2). For yield stress, they determined k = 0.536 with n = 1.45 (instead of 1.5). This study also provides the complete compression curve for Gyroid specimens, although only up to 6% compression strain.
Research on the compression of FDM structures can be found in Zisopol et al. [12]. They compared different infill strategies for cubes, including Gyroid. Additionally, they provided compression curves up to 60% strain, at which point the forces began to increase due to the densification of the component.
For energy absorption applications, Weber and Sundarram [13] studied 3D-printed and foamed TPMS structures using PLA and FDM/FFF technique. They presented force–displacement curves and energy absorption data up to 50% compression for various TPMS, including Gyroid structures with a relative density of approximately 22%. Zhao et al. [14] studied the improvement of mechanical properties of body-centered cubic (BCC) TPMS structures fabricated by SLM. They found that the TPMS-based samples have a favorable capacity to absorb energy, particularly with a 30% volume fraction; the energy absorbed up to 50% strain was approximately three times higher than that of the CAD-based sample with an equal volume fraction.
For energy absorption related to crash impacts, A.A. Garcia-Granada [15] conducted compression impact tests on solid cubes fabricated using FDM. The study found that the fabrication direction had minimal influence under high compression and demonstrated that scaling forces, decelerations, and other parameters for impact protection were straightforward. Kim et al. [16] employed topology optimization to enhance stiffness while ensuring acceptable levels of deceleration.
The most relevant research linking Gyroid structures to impact loads was provided by Ramos et al. [17]. They provided material properties for different strain rates from quasistatic to 5500(s−1). Additionally, they conducted compressive impact experiments with energies ranging from 40 to 120 (J) by varying the mass and velocity of the impact. For this study, they used AlSi10Mg fabricated with an SLM machine and employed a combination of drop tests and Split Pressure Hopkinson Bar testing for their experiments.
For impacts on FDM PLA Gyroid structures, Silva et al. [18] conducted a comparative study with PolyJet-fabricated structures. They evaluated Charpy and impact tests at a velocity of 0.15 m/s for various Gyroid relative densities. However, the study only reported energy values and did not provide detailed curves.
For multi-objective optimization for crash safety designs, Rostro-Gonzalez et al. [19] described strategies to achieve optimal deceleration levels. Their work indicated that for low-mass scenarios, soft materials are preferable, while hard materials are more suitable for high-mass impacts. The primary challenge is designing a component that can effectively address both types of impact configurations while maintaining safety. Multiple safety regulations need to be addressed in vehicle design [20]. In the case of pedestrian protection, some areas of the car might be impacted by a 4.5 kg adult headform and also by a 3.5 kg child headform with different impact angles (β), as shown in Figure 1. Wang et al. [21] provided many examples with accelerations over 100 times gravity, targeting values below 80 g to avoid brain damage.
In this paper, we focus on Gyroid structures fabricated using common FDM techniques with PLA material to evaluate their compression loads and deceleration characteristics under impact, aiming to develop a useful simulation model. Our objectives are as follows:
  • Assess the impact of fabrication direction on the energy capabilities of Gyroid structures in compression.
  • Evaluate the scalability of Gyroid structures to achieve the desired force or deceleration.
  • Derive power-law coefficients to estimate forces and energies for different relative densities.
  • Evaluate the estimation of deceleration impacting Gyroids, assuming constant deceleration.
  • Simulate compression and impact tests with a simplified model.
  • Design a tailored deformation element that meets two distinct deceleration requirements.
  • Analyze computational stability results using data from the open material database instead of compression of real lattice structures.

2. Materials and Methods

In this section, we first outline the process for fabricating our Gyroid lattice form (Equation (2)) structures in Section 2.1. Then, in Section 2.2, we perform quasistatic compression tests. We obtain an average stress value of 2.3 MPa for all sizes, which helps to estimate, in Section 2.3, the mass and velocity for impact tests with two scenarios: similar impact time or similar deceleration level. Finally, in Section 2.4, we define the simulation approach for quasistatic and impact compression tests.
We utilize a fundamental TPMS structure with a cell unit spanning just two periods. For a period of 10 mm, the resulting Gyroid structure forms a cube with dimensions of 20 × 20 × 20 mm, a wall thickness of 0.7 mm, and a relative density (compared to cube solid material) of 0.2, as illustrated in Figure 2. The geometry shown in this figure is not a mesh for simulation but a stereolithography (STL) triangle format used for additive manufacturing.

2.1. Fabrication of PLA Gyroid Structures

For the fabrication of Gyroid specimens, a Prusa i3mk3 (Prusa3d, Prague, Czech Republic) was used to maximize the reproducibility of this research. The filament was purchased from Sunlu PLA with a filament diameter of 1.75 mm in a roll of 1 kg. Different colors were used to identify each repetition sample. Slicing was performed using Ultimaker Cura 4.8.0 with a 100% infill and layers of 0.2 mm. Figure 3 shows the slicing process from the basic TPMS structure scaled from just one STL to fit in sizes of cubes of 10, 20, 30, 40, and 50 (mm), respectively. Scaling was applied with the same scale factor in all directions. The five scaled components were fabricated at the same time to obtain the same conditions for fabrication. Figure 3a shows the slicing of all components. Figure 3b shows a detail of the slicing of the largest component (L = 50 (mm)) with four deposition lines used to fabricate a sinusoidal wall of theoretical thickness 1.85mm. Figure 3c shows a detail of the slicing of the smallest component (L = 10 (mm)) with just one deposition line used to fabricate a sinusoidal wall of theoretical thickness 0.35mm. Red lines are used for shell faces of the component, green lines for inner walls and these gyroid did not require yellow lines for infill as it was requested for solid cubes [15]. Fine grey grid lines are shown at distance of 1 mm.
All specimens were weighed post-fabrication. The 10 mm specimens were discarded due to significant printing errors with a single filament (see Figure 3c). The weights of the Gyroid specimens were compared to solid cubes from [15] to verify that the relative density of the Gyroid structures was approximately 0.2 (see Table 1). Despite variations in PLA color and fabrication date, weight deviations exhibited standard deviations below 2%. A total of 20 samples for each size were fabricated and measured. The size of Gyroid cubes is larger than that of solid cubes due to their relative density, as the intention was to obtain a similar range of weights for posterior performance comparisons.

2.2. Compression Tests

Compression tests were performed using an Instron 5985 machine (Instron, Norwood, MA, USA) equipped with a load cell capable of measuring forces up to 50 kN. Compression plates made of steel were used to minimize friction with the Gyroid, following ASTM D695-15, the Standard Test Method for Compressive Properties of Rigid Plastics, similar to ISO 604. The tests were conducted under displacement control with a strain rate of 0.02 s−1, corresponding to displacement speeds ranging from 0.4 mm/s for specimens with L = 20 mm to 1.0 mm/s for those with L = 50 mm. Compression was carried out until a strain of 80% was reached (test duration 0.8/0.02 = 40 s), at which point the structure’s densification resulted in significantly increased forces. In order to evaluate the influence of strain rate, tests at 2 s−1 (test duration 0.8/2 = 0.4 s) were added. Each compression test was repeated five times to check the repeatability of the results.
Figure 4a displays Gyroid specimens fabricated using various PLA colors. Figure 4b illustrates compression along the fabrication direction, while Figure 4c depicts compression perpendicular to the fabrication direction.
With results from these experiments, in Section 3.1, it will be discussed if building direction is important. In Section 3.2, we will show the scalability of results as a function of Gyroid size, and in Section 3.3, we will fit results to a power law.

2.3. Estimation of Impact Tests with Various Mass and Initial Velocity

The main objective of this paper was to obtain a useful impact simulation that can be correlated with experimental results. If we have an energy value of 100 Joules, we can define an impact using a mass of 2 kg and an impact speed of 10 m/s or an impact with a mass of 200 kg and a speed of 1 m/s. First, we must decide on mass and energy and then decide which Gyroid size to use. In this section, we provide a useful estimation of these values before we have experimental results. Without deciding mass, velocity, and Gyroid size, we cannot perform simulations or experimental tests.
Impact tests were defined with this estimation approach to achieve similar impact durations and deceleration levels across all Gyroid sizes, with the goal of compressing each specimen by approximately 50%. Table 2 presents the mass and velocity values for each impact configuration, which determine the corresponding kinetic energy. Based on the compression tests, we estimated an average force and, from this, calculated the average deceleration. Using this average deceleration, we estimated the impact time. Finally, by assuming a constant average deceleration, we verified that the penetration would be approximately 50%.
All theoretical approach calculations were performed assuming an average compression stress of 2.3 MPa using results from quasistatic compressions. For a specimen size of 20 mm, the expected force is calculated as F = 2.3 × 20 × 20 = 920 N, with energy at 50% compression estimated as E = 920 × 20/2 × 0.001 = 9.2 J. Similarly, for a specimen size of 50 mm, the expected force is F = 2.3 × 50 × 50 = 5750 N, and the energy at 50% compression is E = 5750 × 50/2 × 0.001 = 143.75 J.
For the first strategy, where the goal is to achieve a similar impact duration, we assume constant deceleration for all Gyroid sizes and use the relationship v = a × t = (F/m − g × sin(β)) × t, where β is the angle with the horizontal (90° for a free drop, 65°, for an adult headfrom, 50° for a child headform, and 0° for a legform, as shown in Figure 1). In order to estimate impacts for any configuration, gravity is ignored in this estimation as we are targeting high values of deceleration. From the kinetic energy equation, m = 2 × E/v2, we derive the initial impact velocity as v = 2 × E/(F × t) = L/t. To achieve an impact duration of approximately 14 ms for the 20 mm specimen, we calculate v = 2 × 9.2/(0.012 × 920) = 20/0.014 = 1.43 m/s, with a corresponding mass of m = 2 × 9.2/1.432 = 9 kg. For the 50 mm specimen, the required velocity v = 50/0.014 = 3.57 m/s, with a mass of m = 2 × E/v2 = 2 × 143.75/3.572 = 22.54 kg. This is just an estimation of initial velocity assuming constant deceleration and ignoring gravity for future impact tests to be carried out experimentally and by finite element simulations.
In the second strategy, aimed at achieving similar deceleration for all Gyroid sizes, the mass is estimated as m = F/(a − g × sin(β)), and initial impact velocity v = √(2 × E/m) = √(a × L). Therefore, if we want to obtain an impact of approximately 105 m/s2 for size L = 20 mm, we require m = 2.3 × 20 × 20/105 = 8.8 kg and v = √(105 × 20/1000) = 1.45 m/s, while for L = 50 mm, we require m = 2.3 × 50 × 50/105 = 54.8 kg and v = √(105 × 50/1000) = 2.29 m/s. Once again, this is just an estimation to decide the impact mass and initial velocity. For a free drop of β = 0°, ignoring gravity introduces an error of around 9% (9.805/105), which is acceptable for estimation purposes, as acceleration is not constant in any case. However, this estimation is important to design experimental and simulation impact configurations.
In Table 2, we summarize all estimated numbers for each Gyroid size for mass and initial impact velocity available in the drop test setup. Table 2 also provides estimates of penetration for experimental setup, assuming a constant force and deceleration, to check that they are around 50% of Gyroid size. Table 2 shows in bold the strategy for 14 ms impact time to compare with the strategy to obtain 105 m/s2.
With these 4 × 2 = 8 impact configurations, the effectiveness of this estimation will be discussed in Section 3.4. Once again, this is just a useful estimation approach that can be extrapolated to any Gyroid size and values of desired deceleration or impact time before having experimental results to perform a perfect integration of curves.

2.4. Simulation Model for Compression and Impact Tests

All simulations were performed using ESI® Virtual-Performance version 2019 (formerly known as PamCrash). The simulations were executed on an HP Envy laptop equipped with a 4-core Intel® Core™ i5-10300H CPU @ 2.5 GHz (Santa Clara, CA, USA), with Python scripting employed to ensure consistent postprocessing across all simulations. An explicit solver was chosen to account for changes in geometry and contact interactions under large deformations. In these simulations, the positions of all nodes are continuously updated, allowing for accurate calculations of the real cross-sectional area and length. Consequently, the software utilizes a true stress and true strain approach. The computational cost of a single explicit increment is small because the information needed is available, and the calculation is straightforward and fast. However, the time increment cannot be too large because the method becomes unstable, and the error in the solution increases exponentially. There is no need to invert a stiffness matrix or define convergence criteria as used in implicit simulations.
Coherent units were applied consistently, with length in millimeters (mm), mass in kilograms (kg), and time in milliseconds (ms). As a result, derived units include velocity in mm/ms (equivalent to m/s), acceleration in mm/ms2, stress in GPa, force in kN, energy in J, and density in kg/mm3.
The simulation model is very simple, with a fixed base, a mesh model of the Gyroid, and a rigid plate guided to move only in the vertical direction with the desired mass and initial velocity (for impact) or fixed velocity (for compression) towards the Gyroid. The contact between the rigid plates and Gyroid will induce the collapse of the Gyroid along the simulation time estimated in Table 2. There are no additional boundary conditions.
Two different modeling approaches were utilized: a simplified model using solids and shells. For solids, a cube with eight-node hexahedron solid elements was used. Section 3.5 shows the simulation of impact compression to validate the methodology of using a unique stress–strain curve for all Gyroid sizes, while Section 3.6 allows to discuss if we can design a tailored combination of Gyroid sizes to meet multi-objective targets for deceleration.
In order to discuss computational details in greater depth, Section 3.7 delves into other element types and thicknesses for shells, material models, and strain rate effects.
The detailed shell mesh used a combination of four-node quadratic elements and three-node triangular elements. The thick shell option enables the contribution of transverse normal deformation in the strain energy, whereas, in the thin shell option, only membrane bending with transverse shear is considered. The thin shell mesh was simulated with two levels of mesh refinement: fine and coarse.
The solid Gyroid cubes were simulated with a mesh consisting of 125 solid hexahedron elements (5 × 5 × 5) and 216 nodes (6 × 6 × 6). For a Gyroid size of L = 20 mm, the mesh length (size) was set to 4 mm (20/5), yielding a minimum stable time step of 3.73 μs. This time step is proportional to the mesh size and decreases as the Gyroid is compressed, reducing to 1.87 μs at 50% compression and further to 0.75 μs at 80% compression. For the simple solid mesh, a material type for crushable foams was used. This material corresponds to solid materials with highly compressible, non-linear elastic foam material with strain rate dependency and optional energy absorption (hysteresis). Stress–strain computation was uncoupled in the principal directions, incorporating numerical robustness. CPU performance employed stiffness proportional damping instead of viscous damping. Extrapolation beyond the last specified point on a stress–strain curve uses the last slope calculated from the data, while extrapolation for strain rate is controlled for both loading and unloading paths.
The detailed fine shell model, with a fine mesh of the Gyroid structure, used 9278 elements, consisting of 8779 quadrilateral (quad) elements and 499 triangular (tria) elements. The mesh had a nominal length (size) of 0.5 mm and a minimum mesh length of 0.25 mm, with a shell thickness of 0.7 mm. Using material properties for solid PLA as defined in [14] the stable time step for most elements was 0.12 μs, with only 1% of the mesh having a time step below 0.01 μs. The minimum stable time step, corresponding to the smallest mesh length, was 0.06 μs. For the L = 20 mm specimen, mass scaling was required, but it had a negligible effect on the results as for solid cubes in [14].
Due to the low ratio of shell length to thickness, a second coarse mesh was generated with a nominal length (size) of 1.0 mm and a minimum mesh length of 0.5 mm, still maintaining the shell thickness at 0.7 mm. This coarser mesh required only 2237 elements (1779 quads and 458 trias). In this configuration, all elements had stable time steps above 0.01 μs, eliminating the need for mass scaling. For shell mesh, elastic–plastic behavior can be input via a true stress versus total true strain curve. This approach enables elastic stiffening to be introduced at any segment of the curve. The plasticity algorithm follows an iterative procedure that ensures the stress tensor remains on the von Mises yield surface and respects the associated plastic flow rule. The trial stress tensor uses the instantaneous elastic modulus. During elastic stiffening, loading/unloading is purely elastic.
The shell mesh was generated using the preprocessing software ANSA v21.1.0 from BETA CAE Systems SA, which provided control over mesh quality attributes such as time step stability, warping, skewness, aspect ratio, taper, and interior angles of the elements. Figure 5 shows the comparison between solid mesh and fine shell mesh. Figure 5 shows both mesh strategies with blue arrow for “z” direction which is the fabrication direction, while red arrow is “x” and green “y” direction.
For comparison purposes, all simulations were conducted with a fixed time step of 0.1 μs, which is below the stable time step. Based on the data in Table 2, the simulation time required to achieve 50% compression during impact was estimated. Each simulation ran for 40 ms, resulting in a total of 400,000 time steps (40 ms/0.0001 s). Time history plots of section forces, displacements, velocities, and accelerations were recorded every 5 μs, yielding 8000 data points (40 ms/0.005 ms). Additionally, the deformed mesh was captured every 1 ms, producing 40 frames for impact animation.
In the compression simulations, the rigid plates were set to move at a constant speed to achieve 80% compression. This approach ensured stability throughout the simulation. As compression progressed, energy increased because external forces were necessary to maintain a constant velocity.
For the impact simulations, the initial velocity and mass of the top plate were specified. Total energy was maintained at a constant level by adjusting the kinetic energy and increasing the internal energy during the impact process.
This section addresses several objectives, such as 3.5 single-size compression, 3.6 tailored combinations of sizes for muti-objective scenarios, and 3.7 discussion on stability for type of elements, material models, mesh size, shell thickness, and other parameters such as strain rate.

3. Results

The results are categorized based on the initial objectives of this research, as stated at the end of the introduction. The focus is on how to simulate correctly impacts on Gyroids by addressing: (1) compression tests, (2) possibility to scale the components, (3) possibility to define properties as a function of relative density, (4) estimate the right mass and initial velocity, (5) simulate real compression experiments, (6) design combinations of Gyroids to meet several regulations for different impact energies, and finally (7) discuss topics for Computation as type of element SOLID/SHELL, use of right thickness, use of mesh size, and material models including strain rate effects.

3.1. Compression Results Depending on Fabrication Direction

The first objective was to evaluate how fabrication direction (building orientation) affects the energy absorption capabilities of Gyroid structures under compression. The evaluation was performed using the experimental results obtained from the quasistatic tests described in Section 2.2. Figure 6a illustrates the force–displacement curves for a Gyroid with size L = 20 mm, both along the “z” direction and perpendicular (“x” direction) to the building direction. Results in the “y” direction are similar to those in the “x” direction. It is observed that the Gyroid exhibits a relatively flat plateau in the force–displacement curve when loaded in the fabrication direction (building orientation), whereas a significant drop in force is noted when loaded perpendicular to the fabrication direction. This discrepancy is attributed to the separation of filaments and multiple fractures within the specimen, as shown previously in Figure 4b against Figure 4c. Similar results were obtained with steel Gyroid free interaction and using double-sided tape. Repeatability of quasistatic compression results was checked for five repetitions, as shown in Figure 6b, finding force results to be within ±10%.
Legends in Figure 6 indicate that the part was manufactured using PLA with a Gyroid geometry of 20 mm, obtaining two layers, making a real thickness of 0.5 mm, and taking just 20 min to fabricate. The suffix “-p” indicates that the specimen has been tested in a direction perpendicular to the building direction.
After evaluating all Gyroid sizes, it was concluded that Gyroids should be oriented in the fabrication direction (blue) to achieve stable and efficient energy absorption.

3.2. Scalability of Quasistatic Compression Results

The second objective was to assess the scalability of Gyroid structures to work with a unique stress–strain curve for all sizes. Figure 7a presents the force–displacement curves for Gyroid sizes of 20, 30, 40, and 50 mm. It is observed that the increase in force from size 20 to 30 mm of about 100% increase is clearly higher than the scatter in repetitions for the same size of ±10%, as shown in Figure 6b. Figure 7b shows the integration of these curves to determine the absorbed energy. The energy absorbed increases almost linearly up to 50% compression, indicating that assuming a constant force could be a valid approximation for impact estimations.
The first region in Figure 7a for size 50 mm shows a force that grows linearly up to 6000 N, which corresponds to elastic compression. After this point, initial buckling of the walls of the Gyroid results in a force peak at around 7000 N and 5 mm compression, followed by a posterior force decrease. Once the bending of the Gyroid walls stabilizes, the force is kept almost constant beyond 15 mm compression due to plastic deformation. This flat area is commonly known as the plateau [6,9,10,14]. Finally, at around 25 mm (50% compression), contact between deformed walls produces a force increase in a region known as densification. Peak and plateau values are shown later in Table 3 to be compared for scalability with normalized values. All force–displacement curves drawn with solid line were carried out at 0.02 s−1, while the dotted line shows the effect of a larger strain rate of 2 s−1. The effect of strain rate is similar to the change in Gyroid size. However, in real impact configuration, the strain rate changes from a high initial strain rate at the initial contact between the impactor to decreasing to zero at maximum compression and zero velocity. For this reason, simulations are important, as a perfect estimation of energy during impact would be impossible without obtaining stress–strain curves for each size and at each strain rate to perform the right approach.
Legend names indicate that specimens were fabricated in PLA using a Gyroid geometry with different sizes due to scaling, which resulted in different thicknesses of the walls and manufacturing times of 20, 80, 120, and 245 min, respectively. All specimens were tested in the building direction.
Figure 8 presents the stress–strain curves derived from Figure 7a, normalized by cross-sectional area and length. This means that engineering stress was calculated as force divided by size2 (L2), while engineering strain was calculated as displacement divided by size (L). The stress–strain curves are similar across all Gyroid sizes, demonstrating the potential for scaling forces and energies. However, the scaling is not as precise as that observed for solid cubes [15], where the curves were nearly identical, except for the smallest cube, where fabrication errors had a more significant impact.
Table 3 shows the experimental results for each Gyroid size, including peak force, plateau force at 50% compression, and energy at 50% compression as an average of five repetitions for each size, as shown in Figure 6a. This table also shows normalized values of force converted into stress and energy divided by Gyroid mass. With this table, we can compare results for each Gyroid size to validate the approximation of scalability, as normalized results of stress and energy per unit mass are similar for all sizes.
It is possible to see in Table 3 that the average stress at 50% compression is 2.058 MPa, similar to the value of 2.3 MPa used in the estimation to define impact mass and impact velocity. This is similar to saying that energy, assuming constant stress, is 2.3 × 5 × 10 × 10/(1.2 × 0.2) = 4791 J/kg, while the real integration of the curve leads to an average value of 3795 J/kg. If we repeat the same procedure used for the estimation of solid PLA cubes, we used 80 MPa and energy 80 × 5 × 10 × 10/1.2 = J/kg. Obviously, we could use each curve to obtain the real deceleration, but even so, we would include some errors, as in real impacts, we initially have a high strain rate that decreases to zero. This means that we would request experimental curves for each size and each strain rate, depending on the impact velocity, which is the output from our estimation method.

3.3. Power-Law Coefficients for Relative Density Based on Quasistatic Compression Tests

The third objective was to determine power-law coefficients for estimating forces and energies across different relative densities. The analysis shows a good correlation with the Gibson–Ashby model, with an exponent n = 2.2. For a solid part, the stress is approximately 1/d(2.2) = 1/0.2(2.2) = 34.5 times greater than that of our Gyroid. This value, obtained from a power-law fit, agrees with the values shown in Table 3. However, if we just look at energy at 50%, we can think that the fit can be improved, but this value is the best fit for the whole curve up to 50%. Figure 9a illustrates stress normalized by this factor, demonstrating that the corrected stress values for the Gyroid and solid cubes are very similar.
Energies normalized by mass require correction by a factor of 1/d(2.2−1) = 1/0.2(1.2) = 6.9. This indicates that, for the same weight, solid parts require approximately 6.9 times more energy than a Gyroid. Figure 9b presents the energies normalized by mass after applying this correction. It shows that, at around 50% compression, a Gyroid absorbs approximately 3795 J/kg, while a solid cube absorbs about 24,260 J/kg (average values from Table 3). This yields a factor of 24,260/3795 = 6.39, which is close to the power-law approximation. However, once again, the fit of the curve is better observed in Figure 9b than when considering just one value at 50% compression. Normalized stress and energy maintain the same units because we adjust for relative density, which has no units according to the power-law Equation (3).
Legends in Figure 9 indicate that all specimens were fabricated using PLA. For Gyroid sizes with solid lines, the resultant thickness was documented. For cube sizes with dashed lines, the expected weight was documented. A cube of size 20 mm required 60 min compared to a Gyroid of size 20 mm, which required 1/5th of the material and only 20 min. If we compare parts with similar weights, a Gyroid of size 40 mm (15.1 g in Table 1) required 120 min, while a cube of size 25 mm (18.8 g in Table 1) required 110 min, indicating the printing time (and cost) with the same flow rates is similar for similar weights.

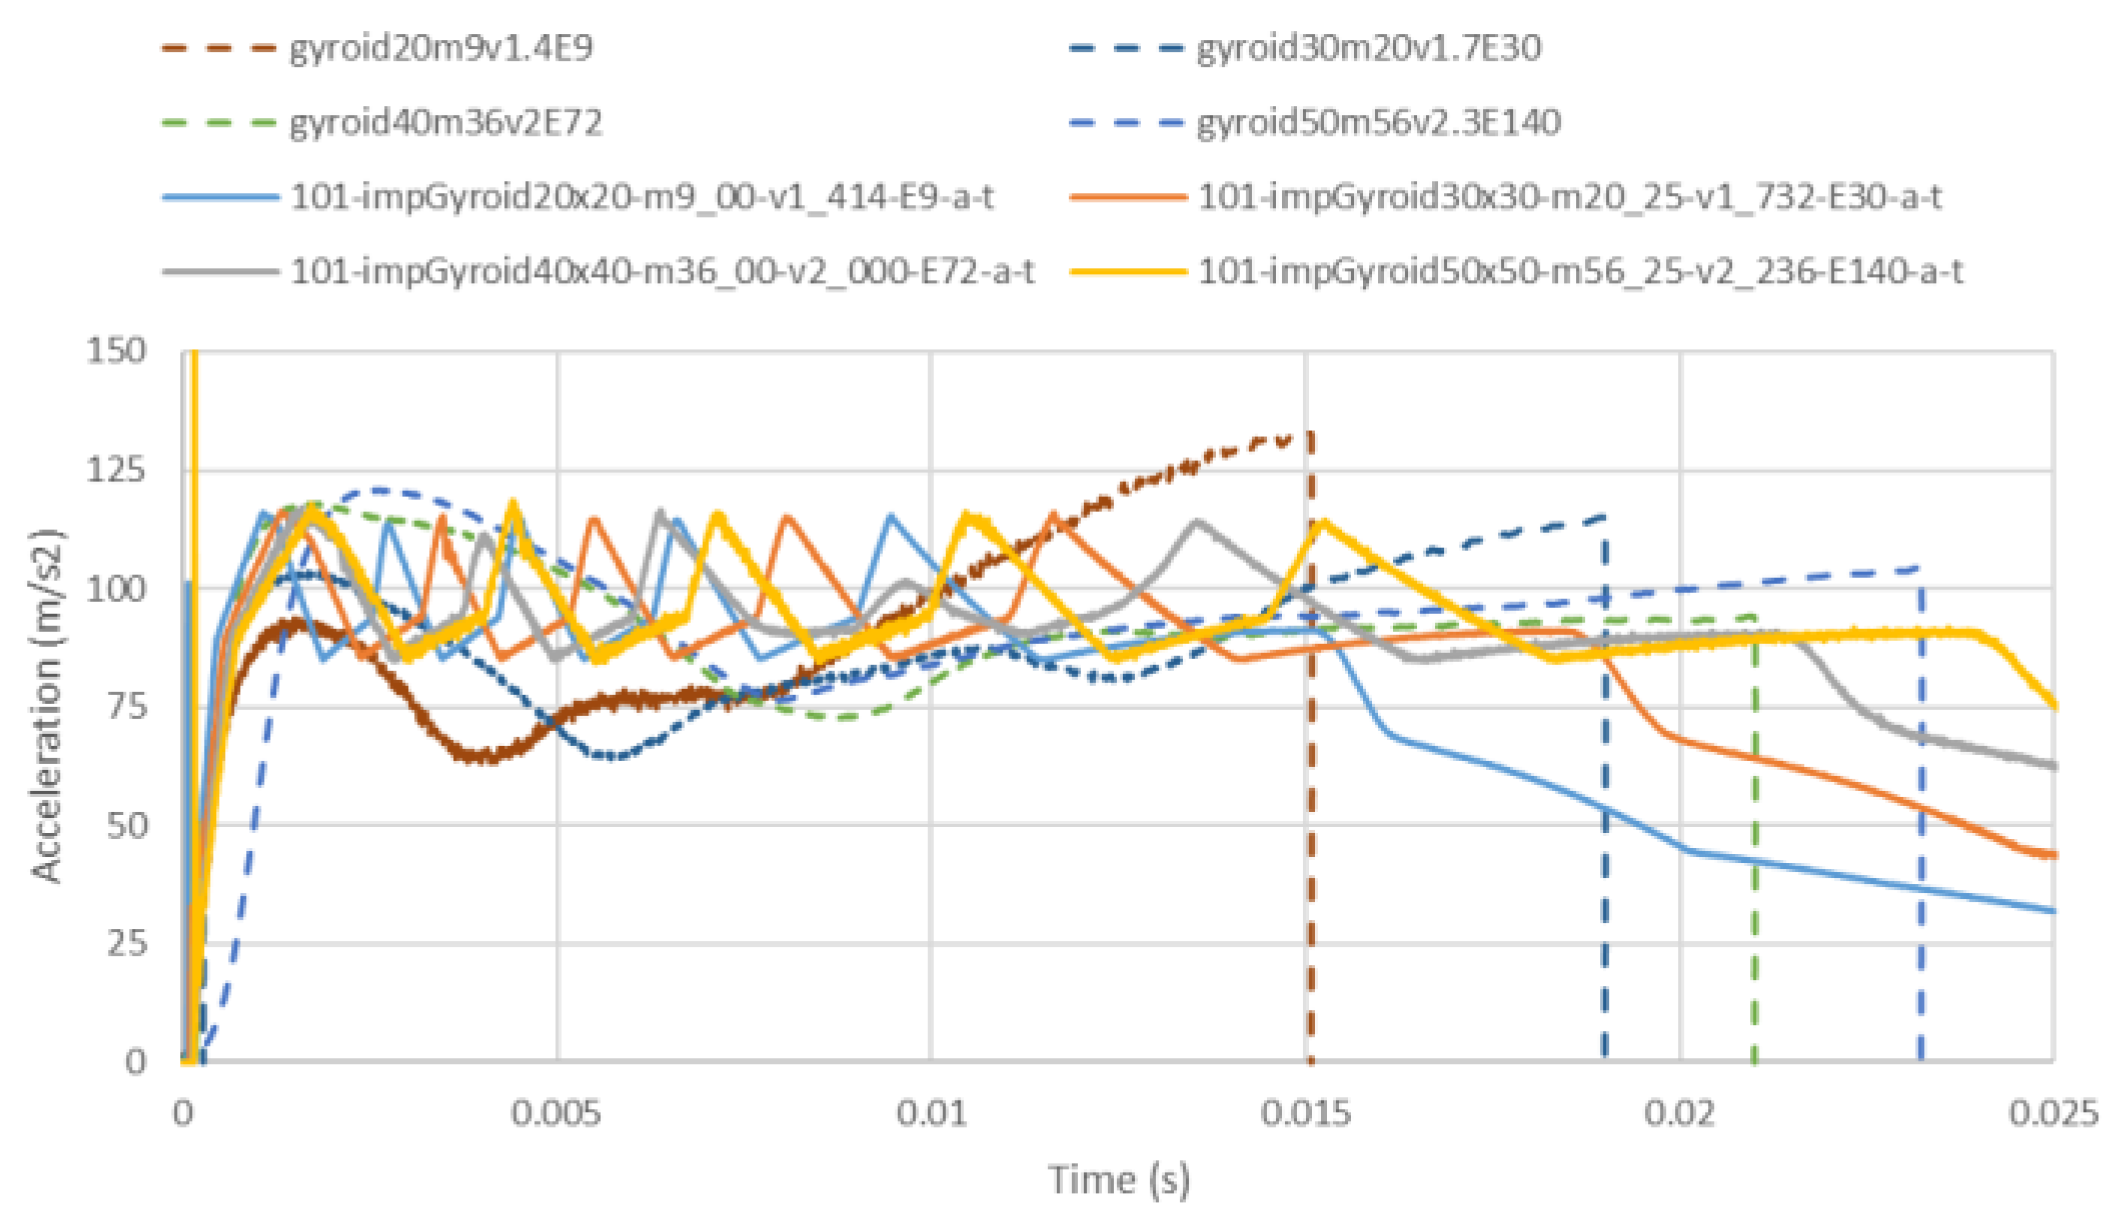
3.4. Estimation of Acceleration Impacting Gyroids

The fourth objective was to evaluate the estimation of deceleration during impacts on Gyroids, assuming constant deceleration. This estimation is very simple and makes many assumptions, but it is required to decide the mass and initial velocity for impact simulations. Table 2 outlines impact configurations designed to achieve a 14 ms impact duration using solid lines, or a deceleration of 105 m/s2 for each Gyroid size using dotted lines. Figure 10 shows that the actual impact durations ranged between 13 and 14.5 ms (estimated for 14 ms), with decelerations varying between 75 and 120 m/s2 as initially designed for 105 m/s2. While the approximation is not perfect due to the assumption of constant force and the use of a single model for all Gyroid sizes, it provides a useful preliminary estimate before conducting finite element optimization. With just four values of impact time, it is difficult to provide normal distributions and error bars of the estimation, assuming constant deceleration and ignoring gravity for such high values of deceleration.
Legends in Figure 10 indicate the size of the Gyroid used, the mass in kg, the initial velocity in m/s, and the resultant impact energy in J. Solid lines are used for impacts designed to stop at 14 ms with different decelerations, while dotted lines are used for impacts designed to obtain an average deceleration of 105 m/s2. According to Figure 10, it could be concluded that estimation method based on constant plateau stress of 2.3 MPa is quite useful to define the right mass and velocity to obtain a desired impact time or a desired impact average deceleration.

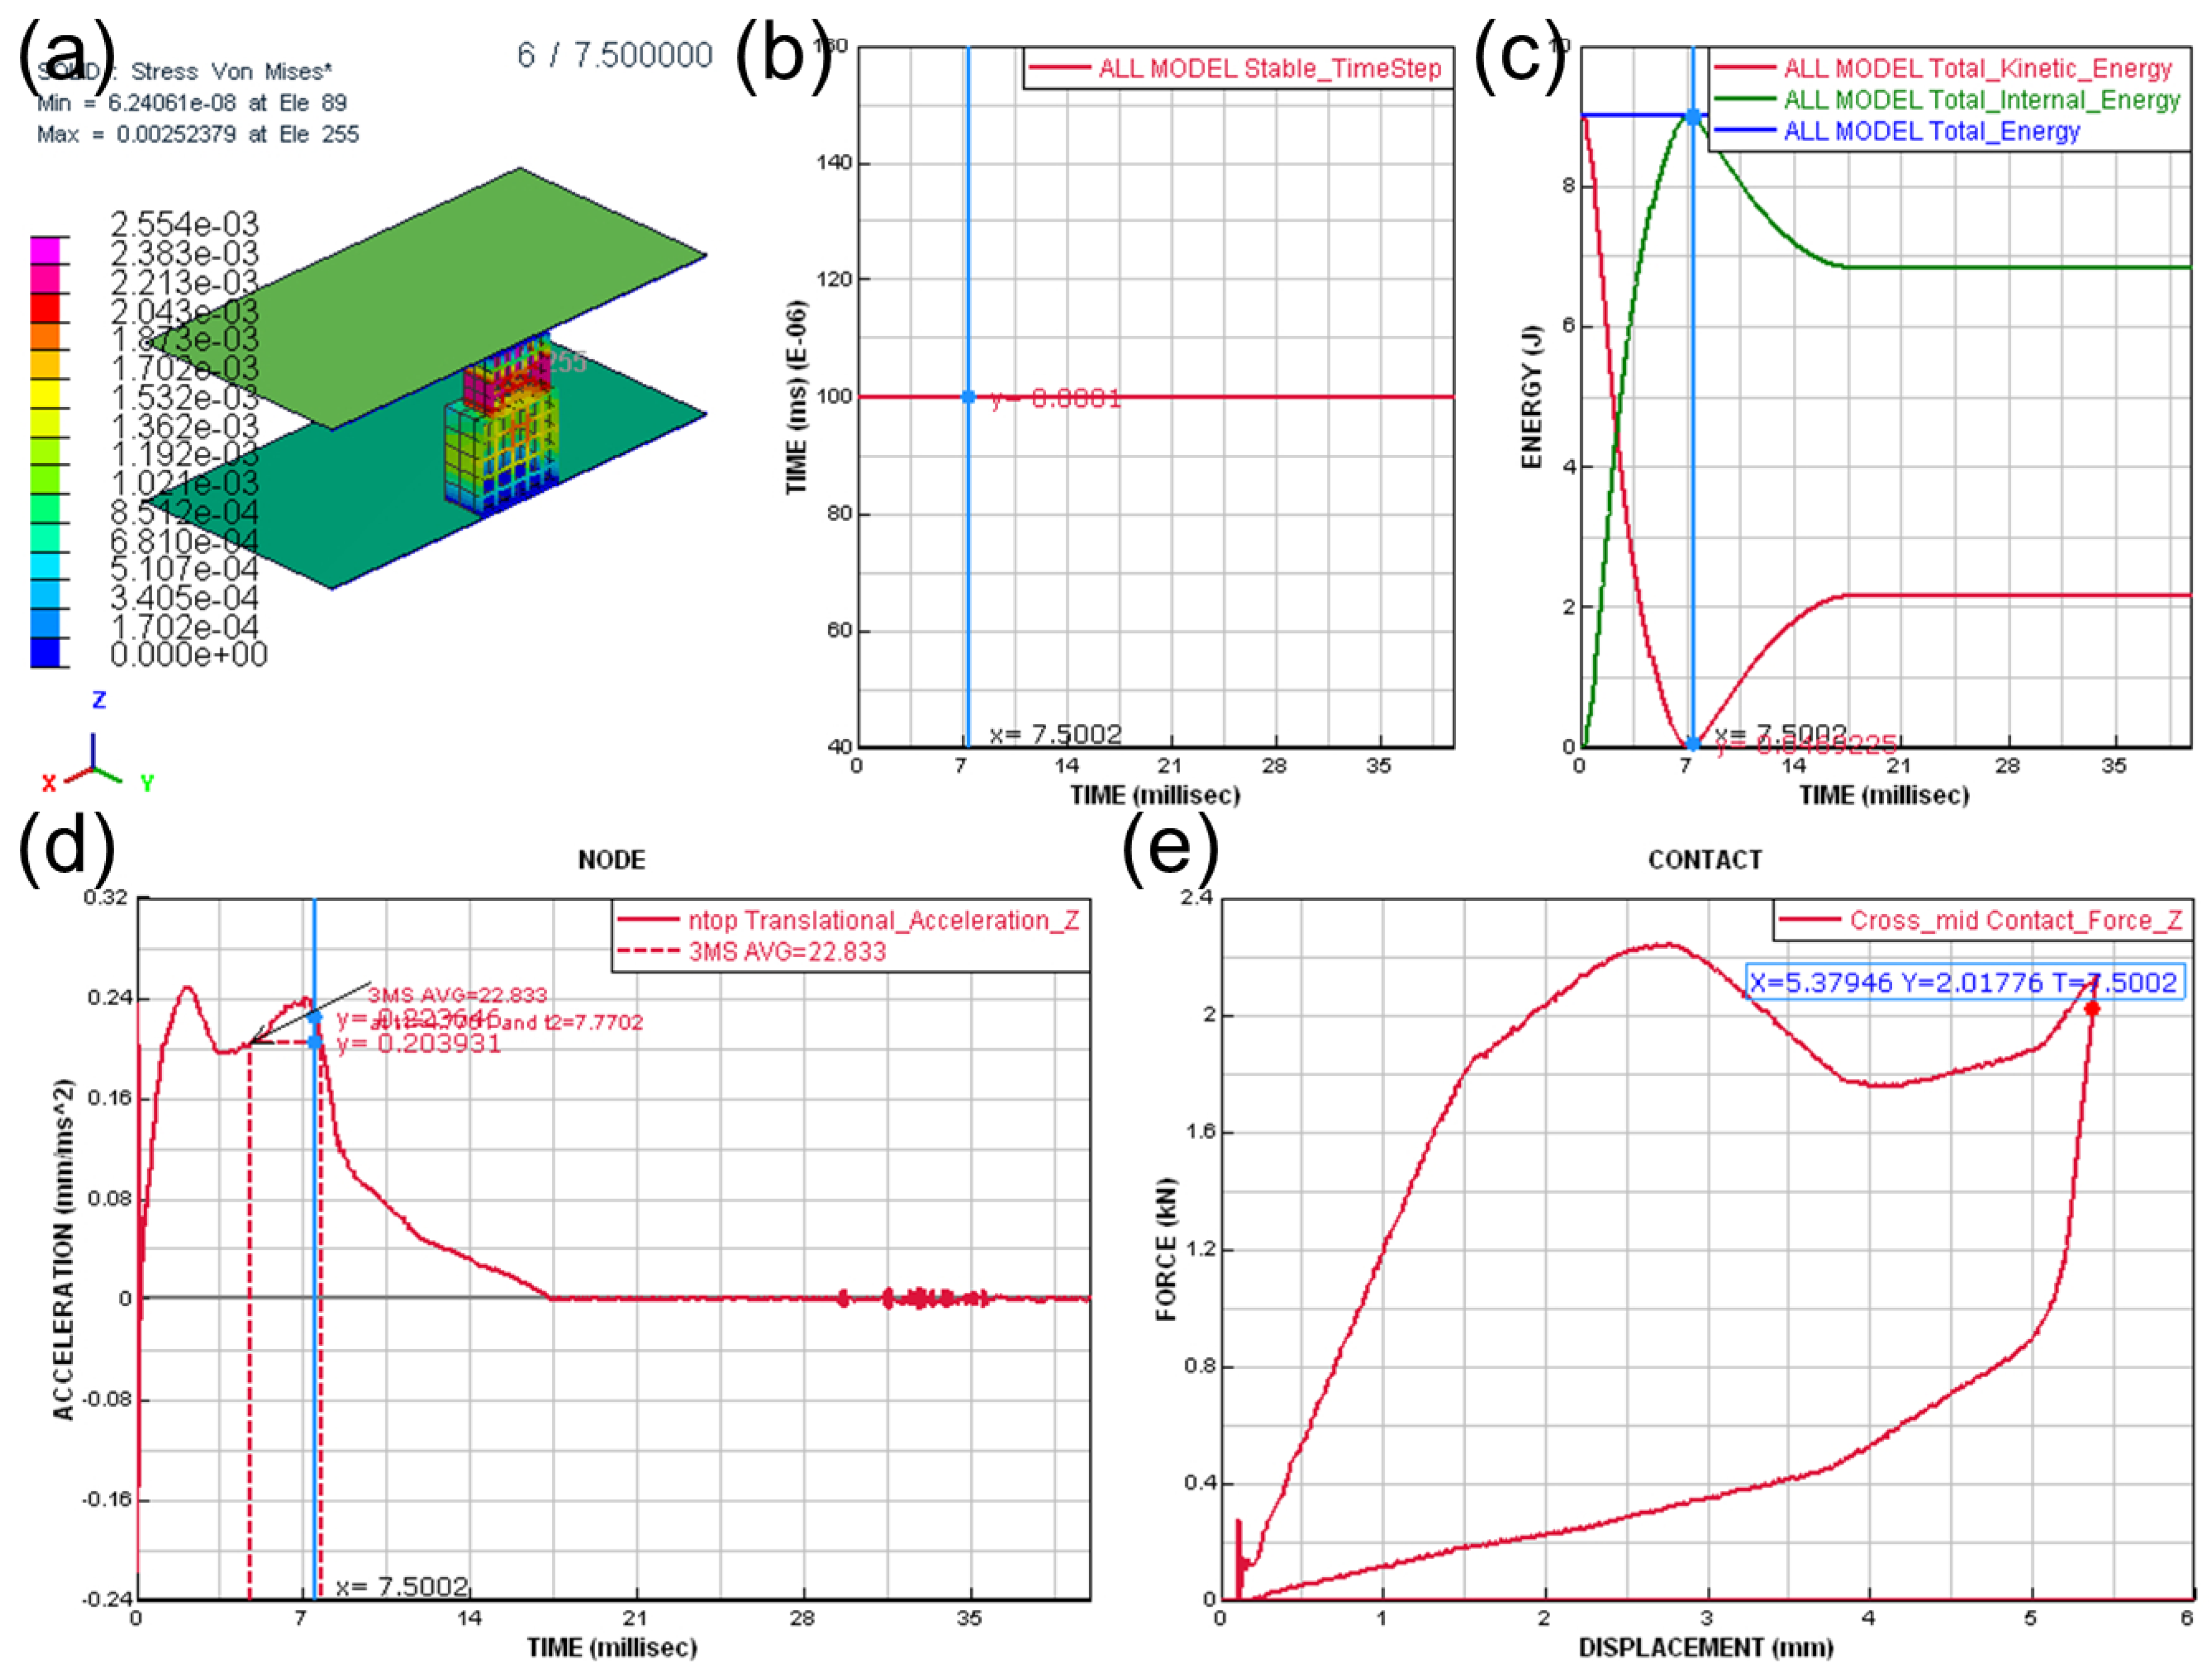
3.5. Simulation of Compression of Gyroids

The fifth objective was to validate the simulations by comparing them to compression and impact test results using a simplified model. Once we know the impact mass and initial velocity from the estimation method, we can perform simulations and compare them to experimental results. In this section, we just discuss results for the simple solid mesh, leaving the discussion about the mesh type, material model, and strain rate for Section 3.7. Figure 11 displays the results from simulations with the 125-element solid model compared to impact experiments. The simulations show good agreement with experimental data in terms of acceleration ranges. However, it is important to note that our simulations rely on a single stress–strain curve derived from scaling Gyroid structures. The simulations exhibit oscillatory force and acceleration profiles, which result from the uniaxial compression and the local maxima present in the stress–strain curve. This leads to localized instabilities in the simulations, though the results remain useful for evaluating energy absorption. Figure 11 and Table 2 indicate that the experimental and theoretical deceleration values, expected to be around 105 m/s2 assuming constant force, are consistent with the simulation results, with a safety factor ensuring decelerations are below 200 m/s2.
Legends in Figure 11 indicate dotted lines for experimental acceleration estimates for Gyroid sizes, including mass in kg, initial speed in m/s, and resultant energy in J. Using solid lines, we have simulation 101 for the same mass and velocity. The prefix 101 in simulation is used for the simple solid elements described in materials and methods.
Once we believe we have a good simulation model to predict levels of deceleration, we focus on the real problem to find a solution for several cases of impact mass and deceleration in a multi-objective approach.

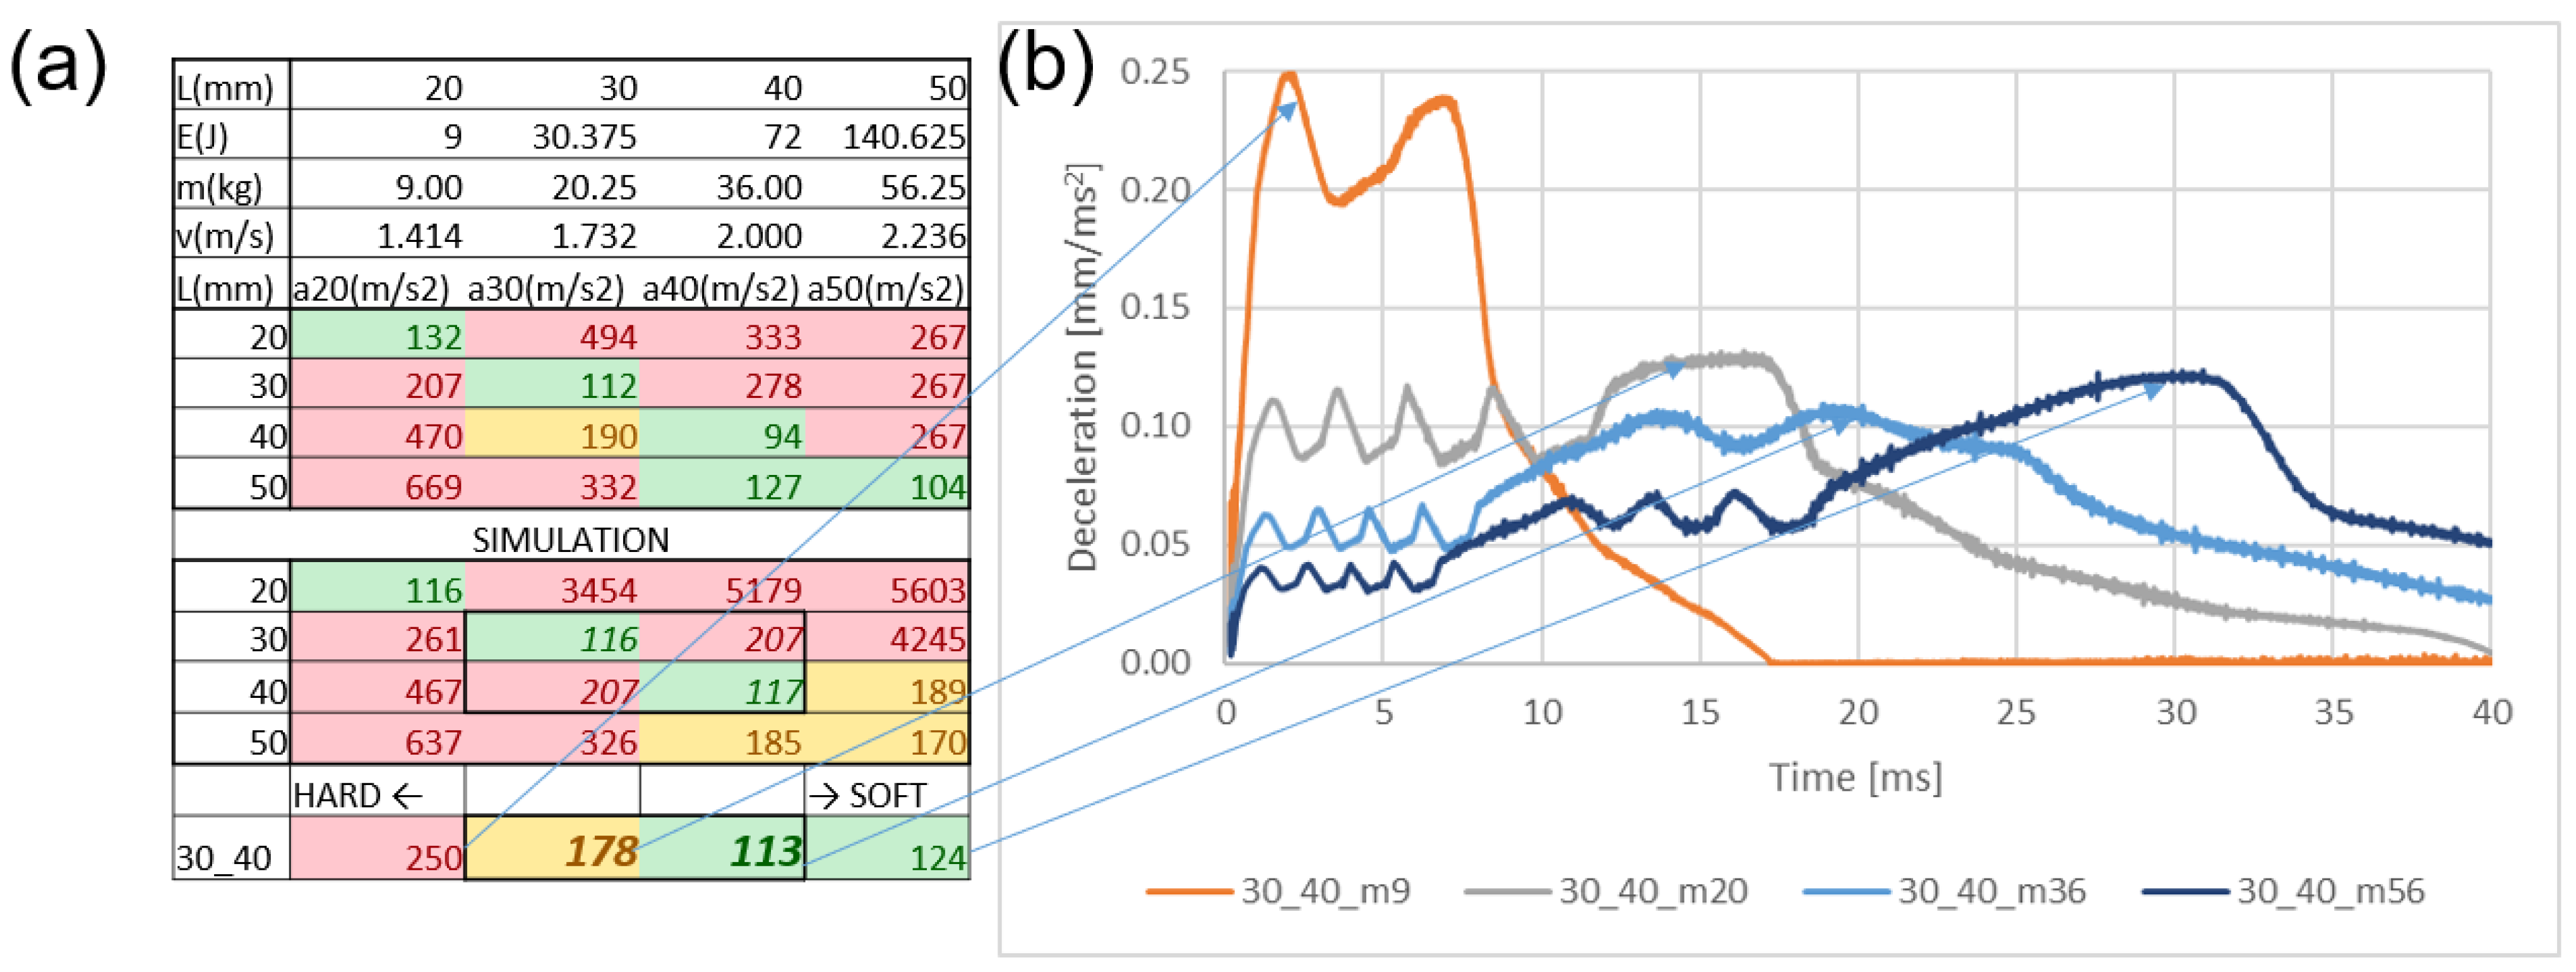
3.6. Design to Meet Two Different Requirements of Decelerations

The sixth objective was to design a tailored deformation element capable of meeting two distinct deceleration requirements by combining Gyroids of different sizes. This is the justification for having a methodology based on estimations for each size and the use of Gyroids. The smallest Gyroid is intended to absorb impact from low-mass objects (e.g., a pedestrian child headform), while a larger, stronger Gyroid is placed below it to handle impacts from higher-mass objects (e.g., a pedestrian adult headform).
Figure 12a presents a table of design scenarios for various mass and velocity combinations obtained from Table 2, considering a constant deceleration of 105 m/s2. The first column, with 9 J, is ideal for the smallest Gyroid, while the last column, with 140 J, suits the largest Gyroid. Each row in the table indicates the acceleration value for a Gyroid of size L. The table uses color coding to denote acceleration ranges: red for values above 200 m/s2 (indicating high risk), orange for values between 150 and 200 m/s2 (suitable but with some risk), and green for values below 150 m/s2 (considered safe).
For energy requirements of E = 30.375 J and E = 72.000 J (more than double), no single Gyroid size meets the criteria effectively. The Gyroid of size 30 mm is too weak for high-energy impacts (278 m/s2 estimated, 207 m/s2 simulated), while the Gyroid of size 40 mm is too rigid for low-energy impacts (190 m/s2 estimated, 207 m/s2 simulated). By combining Gyroid sizes 30 mm and 40 mm, the simulations yield deceleration values of 178 m/s2 for low-energy impacts and 113 m/s2 for high-energy impacts, offering a viable optimization approach. This is only possible using these Gyroid sizes and the estimation approach. If we use the same simulations with cubes for the same energy, the smaller size leads to higher, unacceptable values of acceleration [15].
Figure 12b illustrates the deceleration curves for the 30_40 Gyroid combination across four different impact configurations.
Legends in Figure 12b indicate results for a combination of Gyroid 30 and Gyroid 40 for the energies described in Figure 12a. For simplicity, only the mass is indicated in the legend.
Figure 13 presents the simulation results, including the deformed mesh with von Mises stress distribution, stable time step, energy absorption, deceleration profiles, and force–displacement curves.
Von Mises stress in Figure 13a is shown at the point of maximum compression, where kinetic energy in 13c is zero. Figure 13a shows that the maximum stress is 2.554 × 10⁻³ GPa = 2.554 MPa, indicating that we managed to stop before going too much inside the densification region. Figure 13b is incorporated to show that we managed to keep the time step at 0.1 μs, even when mesh size is reduced due to large compression. Figure 13c shows the impact energy, which is transformed from kinematic energy into deformation energy, with a small elastic rebound. The impact time for this multi-objective configuration is about 8 ms, during which kinetic energy and strain rate reach zero value. Figure 13d shows the deceleration versus time curve, showing that we achieve acceleration levels of 0.25 mm/ms2 = 250 m/s2. If we use the specification for damage of acceleration maintained for 3 ms (known as a3ms), we obtain a value of 22.833 g. This is the worst point of Figure 12a, where the mass is 9 kg, the initial velocity is 1.414 m/s, and therefore energy is 9 J. For this small impact mass, the resultant acceleration is too big. Finally, Figure 13e shows force versus displacement. For this small energy, we obtain only 5.37 mm of penetration into the Gyroid, which is related to the high values of acceleration. Cyan vertical line shown in Figure 13b–d corresponds to the impact time of 7.5 ms where the maximum compression of gyroid is obtained with zero velocity and therefore, kinematic energy is zero. Despite velocity is zero we have a high deceleration of impact object at this impact time.
Simulations are performed using coherent units (mm, kg, ms), which result in kN for force and GPa for stress. Therefore, values directly from the ESI Visual Viewer are used in these units for the facility to avoid scientific notation for time and displacement.

3.7. Computation Results for Mesh Type, Hardening, and Strain Rate

The final objective of this research was to refine the methodology for achieving accurate simulation results while ensuring stability and optimizing computational resources. This is our major objective: to define the most useful approach in terms of minimizing model preparation time, experiments required and computational resources.
The first approach involves using real experimental compression results for Gyroid structures to apply a common stress–strain curve across all sizes. Figure 14b shows, in green, experimental tests carried out at low and high strain rates, with higher values of force at higher strain rates, as shown in Figure 7a. This curve is introduced as a test for the solid material type for crushable foams. Figure 14a, for low strain rates, illustrates that employing a compression curve with peak stress at 0.08 strain leads to unstable vibrations in force (Figure 14b) and acceleration results. Flattening the real compression stress–strain curve (red dashed line) stabilizes the simulation, but this method fails to capture the force reduction beyond 0.08 strain (=1.6 mm/20 mm).
Alternatively, modeling the Gyroid with a shell mesh and applying material properties from standard PLA yields a more accurate representation of force decrease. Adjusting the shell thickness from the ideal 0.7 mm (blue dashed line) to a more realistic 0.5 mm measured and shown in Figure 3 slicing (dotted orange curve in Figure 14b) aligns the simulation forces more closely with experimental results, although densification is not accounted for.
Comparing the fine shell mesh (blue dashed line) with the coarse mesh (blue solid line) in Figure 14b shows that their behaviors are quite similar, indicating that the finer mesh provides a comparable level of accuracy.
Finally, comparing results using compression tests at high strain rates (red dotted line), they can better fit the experiment design at initial high strain rates but fail to fit the large force decrease during the fall of the strain rate.
The legends in Figure 14 indicate that red flat versus real are simulations using simple solid elements with compression curves from 14a and dotted red lines for high strain rate. For simulation using shell elements, we compare results with a thickness of 0.7 mm (as measured in STL) with a thickness of 0.5 mm (as measured on real parts with just two contours of material per layer (refer to Figure 3 for real fabricated thickness)). The solid blue line for shell m0_5 indicates the change from coarse to fine mesh.
Once we have discussed the possibilities of using a simple solid or detailed shell model, the correction of thickness for shells according to real fabrication and the difficulty of obtaining all strain rate curves, we can analyze the requirements for computing resources. Table 4 presents the CPU time and elapsed time for different models: the solid, simple model, the fine shell mesh, and the coarse shell mesh. The computation time for the fine shell mesh is approximately 9.2 times longer than that for the solid model, whereas the coarse shell mesh increases computation time by about 2.8 times. Despite these differences, the results from the shell mesh models remain less reliable due to their inability to accurately capture densification, leading to computational errors and significant node rotations in high-energy simulations.
To address the challenges associated with compressing shell Gyroids, Figure 15 illustrates various levels of compression for both fine and coarse meshes. As compression progresses, plastic strains develop, and self-contact within the components should begin around 50% compression, leading to increased force due to densification. The accurate modeling of this complex self-contact, considering factors such as contact thickness, penalties, friction, and damping, presents a significant area for future computational research.

4. Discussion and Conclusions

Recent research highlights the substantial energy storage capabilities of TPMS structures. This article focuses on analyzing these structures for their deformation energy absorption during impacts with varying masses and velocities, specifically examining Gyroids manufactured using FDM with PLA material.
The suitability of different Gyroid sizes for energy storage is initially evaluated. Gyroids with a small size of L = 10 mm were excluded due to significant manufacturing errors. The analysis then narrows down to using Gyroids oriented to absorb energy in the fabrication direction. In contrast, Gyroids oriented perpendicular to the fabrication direction demonstrate minimal energy absorption due to delamination and fractures between filament layers. Repeatability of compression curves produced differences in force ±10%, much lower than changes in the Gyroid scale.
The scalability of Gyroid sizes is then explored by comparing quasistatic compression curves. It is found that Gyroids exhibit scalability, producing stress and strain curves that are similar across different sizes, though not as consistent as those observed in solid cubes. These curves remain relatively flat up to 50% compression, with densification contributing to increased compressive forces. Unlike cubes, Gyroids exhibit a slight peak in force beyond 8% deformation, potentially due to the buckling of the Gyroid walls as they collapse.
Adjusting the Gyroid with a relative density of 0.2 to a power-law relationship is examined next. By aligning the model to a power-law exponent of n = 2.2, it is found that the stress in a Gyroid is approximately 34.5 times less than that in a solid cube of the same size and five times less in terms of weight. When analyzing energy per unit weight, the Gyroid stores about 6.9 times less deformation energy than a solid part. This result might discard Gyroids for energy absorption, as we could take the same energy with a lighter cube. However, Gyroids are used in combination with other functions, such as thermal exchange, due to the high ratio of surface area per volume. The combination of estimations and tailored designs for multi-objective targets allows the design of a solution with Gyroids, which is not feasible with solid cubes.
The prediction of deceleration during impacts, assuming a constant force of up to 50% compression, is then addressed. Two models were developed to estimate the required impact time or deceleration for each Gyroid size. The results suggest that these models are useful for selecting the appropriate Gyroid size based on the mass and speed of the impact. All predictions are based on a common average stress of 2.3 MPa prior to a complete set of compression experiments.
The practical utility of the simulation model is evaluated next. The simplest model’s deceleration results align well with experimental data, providing a basis for optimizing Gyroid size. However, the simulation model exhibits oscillations in acceleration and force values due to the local maximum observed at 8% compression.
The challenge of meeting several impact regulations is discussed as well. For scenarios requiring a soft component to absorb small impacts and a hard component for larger impacts, simulations demonstrate that combining different Gyroid sizes can meet diverse impact requirements effectively. The combination of Gyroid structures of different sizes allows for meeting multi-objective requirements.
Finally, the choice of simulation tactics is explored. While simulations using solid models are faster, they produce undesirable curve undulations due to local maxima at 8% compression. To mitigate these instabilities, smoothing the real curve eliminates these undulations but sacrifices the observed drop in force. However, the use of solid elements can predict decelerations with errors below 10%, as for hard Gyroids, the important factor is the initial peak, and for soft Gyroids, the important factor is the densification. Simulating Gyroids with real shell geometry requires more computational time and may not reproducibly capture self-contact densification. In order to adjust the peak force for hard Gyroids, we require considering the real thickness as fabricated by a number of contours. Errors in not considering the real fabricated thickness might reach 50% for hard Gyroids modeled as shells. Errors for soft Gyroid will be unacceptable as the densification is not properly captured. With high strain rates, the peak force is more pronounced, requiring the use of shell mesh. A complete set of experiments for several strain rates should be required to feed simulations to fit the initial high peak in force.

Author Contributions

Conceptualization, A.-A.G.-G. and S.S.S.; methodology, H.R.-G.; software, J.M.P.-F.; validation, G.R.-P. and S.S.S.; formal analysis, H.R.-G.; investigation, H.R.-G.; resources, F.-J.L.-V.; writing—original draft preparation, H.R.-G.; writing—review and editing, A.-A.G.-G.; supervision, A.-A.G.-G.; project administration, F.-J.L.-V.; funding acquisition, F.-J.L.-V. and A.-A.G.-G. All authors have read and agreed to the published version of the manuscript.

Funding

This research was financed by Universitat Ramon Llull Aristos Campus Mundus grant ACM2023_03 BioCrash.

Data Availability Statement

All simulations are available for download at https://meaagg.com/ESI/ESI_PAMCRASH.html (accessed on 10 December 2024).

Acknowledgments

Authors want to thank ESI for their continuous support with software implementation within IQS.

Conflicts of Interest

The author declares no conflict of interest.

References

  1. Doubrovski, Z.; Verlinden, J.C.; Geraedts, J.M. Optimal Design for Additive Manufacturing: Opportunities and Challenges. In Proceedings of the International Design Engineering Technical Conferences and Computers and Information in Engineering Conference, Washington, DC, USA, 28–31 August 2011; Volume 54860, pp. 635–646. [Google Scholar]
  2. Yang, S.; Tang, Y.; Zhao, Y.F. A New Part Consolidation Method to Embrace the Design Freedom of Additive Manufacturing. J. Manuf. Process. 2015, 20, 444–449. [Google Scholar] [CrossRef]
  3. Efa, D.A.; Gutema, E.M.; Lemu, H.G.; Gopal, M. Optimization of Titanium Alloy-Ti-6Al-4V to Minimize Mass, Maximize Stiffness and Frequency in Additive Manufacturing. Key Eng. Mater. 2024, 980, 3–13. [Google Scholar] [CrossRef]
  4. Khan, N.A.; Sankar, M.R.; Kumar, A. State of the Art on Additive Manufacturing of Moulding Dies with Conformal Cooling Channels. In International Conference on Processing and Fabrication of Advanced Materials; Springer Nature: Singapore, 2023; pp. 63–83. [Google Scholar] [CrossRef]
  5. Pietropaoli, M.; Ahlfeld, R.; Montomoli, F.; Ciani, A.; D’Ercole, M. Design for Additive Manufacturing: Internal Channel Optimization. J. Eng. Gas Turbines Power 2017, 139, 102101. [Google Scholar] [CrossRef]
  6. Li, D.; Liao, W.; Dai, N.; Dong, G.; Tang, Y.; Xie, Y.M. Optimal Design and Modeling of Gyroid-Based Functionally Graded Cellular Structures for Additive Manufacturing. Comput. Aided Des. 2018, 104, 87–99. [Google Scholar] [CrossRef]
  7. Zhang, B.; Mhapsekar, K.; Anand, S. Design of Variable-Density Structures for Additive Manufacturing Using Gyroid Lattices. In Proceedings of the ASME 2017 International Design Engineering Technical Conferences and Computers and Information in Engineering Conference, Cleveland, OH, USA, 6–9 August 2017. [Google Scholar]
  8. Naghavi, S.A.; Tamaddon, M.; Marghoub, A.; Wang, K.; Babamiri, B.B.; Hazeli, K.; Xu, W.; Lu, X.; Sun, C.; Wang, L.; et al. Mechanical Characterisation and Numerical Modelling of TPMS-Based Gyroid and Diamond Ti6Al4V Scaffolds for Bone Implants: An Integrated Approach for Translational Consideration. Bioengineering 2022, 9, 504. [Google Scholar] [CrossRef] [PubMed]
  9. Maskery, I.; Sturm, L.; Aremu, A.O.; Panesar, A.; Williams, C.B.; Tuck, C.J.; Wildman, R.D.; Ashcroft, I.; Hague, R.J.M. Insights into the Mechanical Properties of Several Triply Periodic Minimal Surface Lattice Structures Made by Polymer Additive Manufacturing. Polymer 2018, 152, 62–71. [Google Scholar] [CrossRef]
  10. Chouhan, G.; Murali, G.B. Designs, Advancements, and Applications of Three-Dimensional Printed Gyroid Structures: A Review. Proc. Inst. Mech. Eng. Part E J. Process Mech. Eng. 2024, 238, 965–987. [Google Scholar] [CrossRef]
  11. Li, D.; Liao, W.; Dai, N.; Xie, Y.M. Comparison of Mechanical Properties and Energy Absorption of Sheet-Based and Strut-Based Gyroid Cellular Structures with Graded Densities. Materials 2019, 12, 2183. [Google Scholar] [CrossRef]
  12. Zisopol, D.G.; Minescu, M.; Iacob, D.V. A Study on the Evaluation of the Compression Behavior of PLA Lattice Structures Manufactured by FDM. Eng. Technol. Appl. Sci. Res. 2023, 13, 11801–11806. [Google Scholar] [CrossRef]
  13. Weber, D.; Sundarram, S.S. 3D-Printed and Foamed Triply Periodic Minimal Surface Lattice Structures for Energy Absorption Applications. Polym. Eng. Sci. 2023, 63, 1133–1145. [Google Scholar] [CrossRef]
  14. Zhao, M.; Liu, F.; Fu, G.; Zhang, D.Z.; Zhang, T.; Zhou, H. Improved mechanical properties and energy absorption of BCC lattice structures with triply periodic minimal surfaces fabricated by SLM. Materials 2018, 11, 2411. [Google Scholar] [CrossRef] [PubMed]
  15. Garcia-Granada, A.-A. High-Compression Crash Simulations and Tests of PLA Cubes Fabricated Using Additive Manufacturing FDM with a Scaling Strategy. Computation 2024, 12, 40. [Google Scholar] [CrossRef]
  16. Kim, G.-W.; Park, Y.-I.; Park, K. Topology Optimization and Additive Manufacturing of Automotive Component by Coupling Kinetic and Structural Analyses. Int. J. Automot. Technol. 2020, 21, 1455–1463. [Google Scholar] [CrossRef]
  17. Ramos, H.; Santiago, R.; Soe, S.; Theobald, P.; Alves, M. Response of Gyroid Lattice Structures to Impact Loads. Int. J. Impact Eng. 2022, 164, 104202. [Google Scholar] [CrossRef]
  18. Silva, C.; Pais, A.I.; Caldas, G.; Gouveia, B.P.P.A.; Alves, J.L.; Belinha, J. Study on 3D Printing of Gyroid-Based Structures for Superior Structural Behaviour. Prog. Addit. Manuf. 2021, 6, 689–703. [Google Scholar] [CrossRef]
  19. Rostro-González, H.; Puigoriol-Forcada, J.M.; Pérez-Peña, A.; Menacho, J.; Garcia-Granada, A.-A. Optimizing Crash Box Design to Meet Injury Criteria: A Protocol for Accurate Simulation and Material Selection. Struct. Multidiscip. Optim. 2024, 67, 1–17. [Google Scholar] [CrossRef]
  20. Association, European Automobile Manufacturers. ACEA-Regulatory-Guide-2023. 2024. Available online: https://www.acea.auto/files/ACEA-Regulatory-Guide-2023.pdf (accessed on 1 October 2024).
  21. Wang, D.; Deng, W.; Wu, L.; Xin, L.; Xie, L.; Zhang, H. Impact of Vehicle Steering Strategy on the Severity of Pedestrian Head Injury. Biomimetics 2024, 9, 593. [Google Scholar] [CrossRef] [PubMed]
Figure 1. Crash regulations in Europe, the United Nations, and the USA, with details on pedestrian protection according to UN R127-02 [20].
Computation 12 00248 g001
Figure 2. Gyroid STL basic structure featuring a period of 10 mm, designed as a cube with dimensions of 20 × 20 × 20 mm. The structure has a wall thickness of 0.7 mm and a relative density calculated as approximately 0.2 (1.59/23).
Computation 12 00248 g002
Figure 3. Slicing details for PLA Gyroid structures: (a) Overview of slicing for all sizes; (b) Close-up of slicing for the L = 50 mm component; (c) Close-up of slicing for the L = 10 mm component.
Computation 12 00248 g003
Figure 4. PLA manufactured parts (a) tested in building direction (b) and perpendicular to building direction (c).
Computation 12 00248 g004
Figure 5. Mesh for simplified 125 solid elements (a) and 9278 fine shell elements (b).
Computation 12 00248 g005
Figure 6. Force–displacement during compression for Gyroid size 20 mm: (a) tested in fabrication direction (solid line) and perpendicular (dotted line), and (b) repeatability in building direction.
Computation 12 00248 g006
Figure 7. (a) Force–displacement during compression and (b) energy versus strain for different Gyroid sizes tested in fabrication direction.
Computation 12 00248 g007
Figure 8. Stress versus strain during compression for Gyroid structures of different sizes, tested along the fabrication direction.
Computation 12 00248 g008
Figure 9. (a) Normalized stress versus strain as a function of relative density, and (b) normalized energy versus strain as a function of weight for different Gyroid and cube sizes.
Computation 12 00248 g009
Figure 10. Acceleration versus time for several impact configurations on Gyroid structures.
Computation 12 00248 g010
Figure 11. Comparison of accelerations from experiments and simulations for different Gyroid sizes.
Computation 12 00248 g011
Figure 12. (a) Deceleration values for different impact configurations and (b) deceleration curves for 30_40 configuration.
Computation 12 00248 g012
Figure 13. Simulation for 30_40 configuration showing (a) von Mises stress, (b) time step of 0.1 μs, (c) energy, (d) deceleration, and (e) force–displacement.
Computation 12 00248 g013
Figure 14. (a) Stress strain real versus flat (b) and force–displacement compared to experiments.
Computation 12 00248 g014
Figure 15. Compression of detailed shell results for a plastic strain with large mesh size for 0% (a), 40% (b), and 80% (c), and for fine mesh size for 0% (d), 40% (e), and 80% (f).
Computation 12 00248 g015
Table 1. Mass of Gyroid structures compared to solid cubes [15].
L (mm)2030405010152025
Mass of a Gyroid StructureMass of a Cube Structure
Min (g)1.826.1314.8629.491.214.099.6218.71
Max (g)1.886.4815.3029.661.274.119.7018.90
Avg (g)1.8586.35115.09629.5831.2414.1009.66018.820
Std (g)0.026300.113280.136400.086220.017980.008160.036510.08206
Std (%)1.416%1.784%0.904%0.291%1.449%0.199%0.378%0.436%
Density (kg/m3)232.19235.22235.89236.671240.561214.811207.501204.48
Relative density (-)0.190.200.200.201.031.011.001.00
Table 2. Mass and velocity values for each impact test are designed to achieve approximately 50% compression.
StrategyGyroid (mm)Mass (kg)Velocity (m/s)Energy (J)Time (ms)Deceleration (m/s2)Penetration (mm)Penetration (%)
Time2081.47.84141009.8049%
30122.126.461415014.7049%
40162.862.721420019.6049%
50203.5122.51425024.5049%
Deceleration2091.4913.31059.3347%
30201.73016.210513.7646%
403627219.010519.0548%
50562.314021.910525.1950%
Table 3. Force, stress, and energy comparing Gyroids and cubes from [15].
Size Gyroid (mm)Peak Force (N)Plateau Force at 50% (N)Energy at 50% (J)Peak Stress (MPa)Plateau Stress at 50% (MPa)Energy by Weight (J/kg)Size Cube (mm)Plateau Stress at 50% (MPa)Energy by Weight (J/kg)Stress Ratio Cube/Gyroid (-)Energy Ratio Cube/Gyroid (J-)
2089585672.242.1435281080.122,10037.436.26
3020501653242.281.8435841582.224,91244.676.95
4042103352632.632.1039692081.425,00138.766.30
50692053731272.772.1540973080.225,02637.306.11
avg 2.482.0583795 80.9824,26039.366.39
estimate 2.32.34791 8033,33334,786.95
Table 4. Simulation time for simplified solid models compared to detailed shell models.
SolidShell–FineShell–Fine/SolidShell–CoarseShell–Coarse/Solid
Elements125927874.2223717.9
CPU Time (s)463728.11052.3
Elapsed time (s)201849.2552.8
Disclaimer/Publisher’s Note: The statements, opinions and data contained in all publications are solely those of the individual author(s) and contributor(s) and not of MDPI and/or the editor(s). MDPI and/or the editor(s) disclaim responsibility for any injury to people or property resulting from any ideas, methods, instructions or products referred to in the content.

