Article

Comparative Analysis of Energy Efficiency in Conventional, Modular, and 3D-Printing Construction Using Building Information Modeling and Multi-Criteria Decision-Making

Programa de Engenharia Ambiental, Universidade Federal do Rio de Janeiro, Rio de Janeiro 21941-901, Brazil
*
Author to whom correspondence should be addressed.
Computation 2024, 12(12), 247; https://doi.org/10.3390/computation12120247
Submission received: 26 November 2024 / Revised: 14 December 2024 / Accepted: 16 December 2024 / Published: 18 December 2024

Abstract

:
Energy efficiency has become a crucial focus with the growing attention on sustainable development and decreasing energy consumption in the built environment. Different construction methods are being applied worldwide, such as conventional, modular, and 3D-printing methods, to increase energy efficiency in buildings. This study aims to enhance the decision-making process by identifying optimal construction techniques, material selection, and ventilation window dimensions to promote sustainable energy use in buildings. A novel framework combining Building Information Modeling (BIM), computational analysis, and Multi-Criteria Decision-Making (MCDM) approaches is applied to assess the energy use intensity (EUI), annual electric energy consumption, and lifecycle energy cost across multiple sequences for each type of construction. Computational analysis in this research is combined in two main tools. Minitab is utilized for experimental design to determine the number and configurations of sequences analyzed. The Simple Additive Weighting (SAW) method, applied as an MCDM tool, is used to assess and rank the performance of sequences based on equally weighted criteria. Subsequently, 3D models of case study buildings are developed, and energy simulations are conducted using Autodesk Revit and Autodesk Green Building Studio, respectively, as BIM tools to compare the energy performance of various design alternatives. The results revealed that 3D printing surpassed other methods, where Sequence 7 achieved approximately 10.3% higher efficiency than modular methods and 40.5% better performance than conventional methods in the evaluated criteria. The findings underscore the higher energy efficiency of 3D printing, followed by modular construction as a competitive method, while conventional methods lagged significantly.

1. Introduction

The construction industry is considered to be the major player in forming the built environment and affecting global sustainability [1]. Construction practices have often been responsible for high resource consumption, carbon emissions, and environmental deterioration [2]. Consequently, there are new trends calling for a shift towards more sustainable and energy-efficient building practices [3]. Recently, there has been a notable effort to adopt sustainable practices across the globe; those efforts are driven by several factors, such as environmental awareness, regulatory requirements, cost saving, climate change mitigation, and market demand [4].
The awareness of the environmental impact of buildings, their contribution to greenhouse gas emissions, resource depletion, and waste generation has been growing in recent years [5]. Stakeholders involved in the construction industry started to prioritize sustainability and look for new methods to minimize their environmental imprint [6]. Governments and regulatory bodies also started to implement stricter building codes and standards to promote energy efficiency and sustainability in construction [7]. These regulations usually decree the use of local and energy-efficient materials, renewable energy resources, and green building practices [8].
Buildings that are considered efficient in terms of energy consumption can lead to significant cost saving during their lifecycle [9]. Sustainable buildings can lower operational expenses and increase property value, as they consume less energy, improve indoor air quality, and enhance occupant comfort [10]. Energy-efficient buildings could play a vital role in mitigating global warming by minimizing energy demand, reducing carbon emissions, and promoting renewable energy resources [11].
Energy efficiency is a key factor in the field of sustainable buildings, where it directly grants the ability to reduce energy consumption, operating costs, and environmental impact [12]. Improving the energy performance of buildings can be achieved through many means, such as efficient design, building materials, insulation materials, lighting, HVAC systems, and renewable energy integration [13]. Thus, the construction industry can play a pivotal role in achieving sustainability objectives and mitigating climate change.
Construction methods are another factor that can play an important role in energy performance in buildings. This factor can considerably influence the energy efficiency of buildings over their entire lifespan, including the construction, operation, and demolition phases [14]. Even though all construction methods have the potential to contribute to energy-efficient buildings, some specific methods can offer fundamental priorities in terms of design flexibility, insulation, airtightness, material efficiency, and sustainability. Thus, some construction methods, such as modular and 3D-printing construction, could help improve the performance of buildings in terms of energy consumption [15]. It is worth noting that effective application requires a precise examination of project-determined requirements, local climatic circumstances, building codes, and stakeholder concerns [16].
Throughout the 20th and 21st centuries, conventional construction has dominated the building market. Over time, conventional construction has adapted to include energy efficiency and sustainability measures in response to environmental concerns and regulatory pressures [17]. Numerous studies have investigated strategies and technologies to enhance the energy performance of conventional buildings. Some researchers investigated the rule of building envelope design in reducing energy consumption and environmental impact [18,19,20]. Others have studied the impact of building materials and insulation materials on energy performance [21,22,23,24]. The impacts of window parameters and the window-to-wall ratio on thermal comfort and energy consumption have also been addressed by many researchers [25,26,27].
Modular construction, originating in the early 20th century, has evolved significantly over time. Initially driven by the need for rapid, affordable housing, it gained traction post World War II and expanded with technological advancements in the 1960s and 1970s [28]. Modular construction is known as off-site or prefabricated construction; it allows one to construct and assemble building elements in a factory environment before they are transported and installed on the site [29]. In recent years, energy efficiency in modular construction has become a critical focus of research and development. Many researchers have focused on improving the energy efficiency and sustainability of modular buildings. Topics and issues regarding energy efficiency and sustainability in modular buildings also focus on the building envelope, building materials, insulation materials, and the impact of window parameters [27,30,31,32,33,34,35].
Three-dimensional-printing construction, known as additive manufacturing in construction, is an innovated approach that takes advantage of developed technologies to manufacture building elements layer by layer utilizing robotic arms or large-scale 3D-printers [36]. This cutting-edge method enables the prompt prototyping and construction of complex geometries, enabling architects and designers to examine new formations and structures [37]. Three-dimensional printing provides several advantages, such as reducing construction timelines, reducing material waste, and increasing design freedom [38]. However, it is still an emerging technology and faces challenges such as scalability, regulatory approval, and material selection [39]. Additive manufacturing is an emerging technology that offers significant potential for enhancing energy efficiency through innovative building envelope designs, eco-friendly materials, and new methods of insulation [40]. Thus, there is a huge focus on studies related to 3D-printing technology in the field of sustainability and energy efficiency.
Building Information Modeling (BIM) is a digital framework that enables the creation and management of a 3D model integrated with detailed data throughout a building’s lifecycle [40]. BIM tools, such as Autodesk Revit, Navisworks, and Green Building Studio, facilitate collaborative design, visualization, and analysis, allowing project teams to optimize construction workflows and performance [41]. Applications of BIM extend from architectural design and structural analysis to energy modeling and facility management, supporting a wide range of project phases [41]. Integrated methods, such as Lifecycle Assessment (LCA), can be embedded within BIM to evaluate a building’s environmental impact, enabling more sustainable design decisions by analyzing energy use, material sourcing, and overall carbon footprint [42]. This approach enhances decision-making by aligning design choices with long-term sustainability goals.
The integration of BIM with Multi-Criteria Decision-Making (MCDM) methods enhances decision-making processes in construction by providing a systematic evaluation of design alternatives against multiple performance criteria [43]. MCDM techniques offer a structured approach to ranking and selecting the best design options based on criteria like cost, energy efficiency, environmental impact, and material durability [36]. Combining BIM with MCDM enables project teams to simulate, assess, and compare different design scenarios with high precision, ensuring that all critical factors are considered [44]. This integration supports sustainable and efficient design choices, aligning project objectives with optimal resource use and long-term operational performance.
Haruna et al. [44] conducted research aiming to develop a BIM-integrated fuzzy MCDM model to support decision-making for low-carbon building (LCB) measures in high-density subtropical urban settings. Their model provided a consolidated tool for design decision-makers to systematically select LCB measures based on technical, economic, and environmental performance. Yarramsetty et al. [45] developed an integrated MCDM-BIM approach to evaluate design options across different construction stages. Their approach enabled the ranking of design options and provided 3D visualizations of both current and potential configurations, facilitating informed decision-making for floor plan selection [45].
Abdelaal et al. [46] evaluated the sustainability of concrete structures using a BIM–LCA approach to rank and select concrete types based on sustainability criteria like CO2 emissions, embodied energy, and cost. The study applied the Analytical Hierarchy Process (AHP) and used the One-Click LCA tool to assess traditional and green concrete alternatives in a multi-story car-park structure. The findings indicated that concrete with 50% GGBFS is the most sustainable in terms of CO2 emissions and embodied energy, demonstrating the value of the BIM–LCA–AHP approach for sustainable design evaluation [46]. Namaki et al. [47] presented a design framework that integrates BIM, LCA, and MCDM algorithms to support sustainable material selection in building projects. The researchers developed a case study of a single-family housing project in British Columbia, Canada, to evaluate three design scenarios—conventional hot-rolled steel, recycled steel, and timber—using the integrated BIM-LCA-MCDM framework. Their findings showed that recycled steel significantly improves environmental performance, surpassing conventional steel and performing similarly to timber, highlighting the framework’s effectiveness in guiding sustainable material choices [47].
This research aims to evaluate the energy performance of three construction methods, conventional, modular, and 3D-printing, focusing on their energy consumption characteristics. It uses a case study to validate a proposed framework that integrates BIM with parametric analysis and MCDM to assess energy use. Autodesk Revit and Green Building Studio are applied to simulate energy performance, aiming to support informed decision-making for sustainable energy management and aligning modular construction with goals for Nearly Zero-Energy Buildings (NZEBs). Simple Additive Weighting (SAW) is applied as a tool of MCDM to compare the results on two levels. The first level is internal and deals with each type of construction, while the second level is external and deals with comparing the results between the three proposed types of construction.

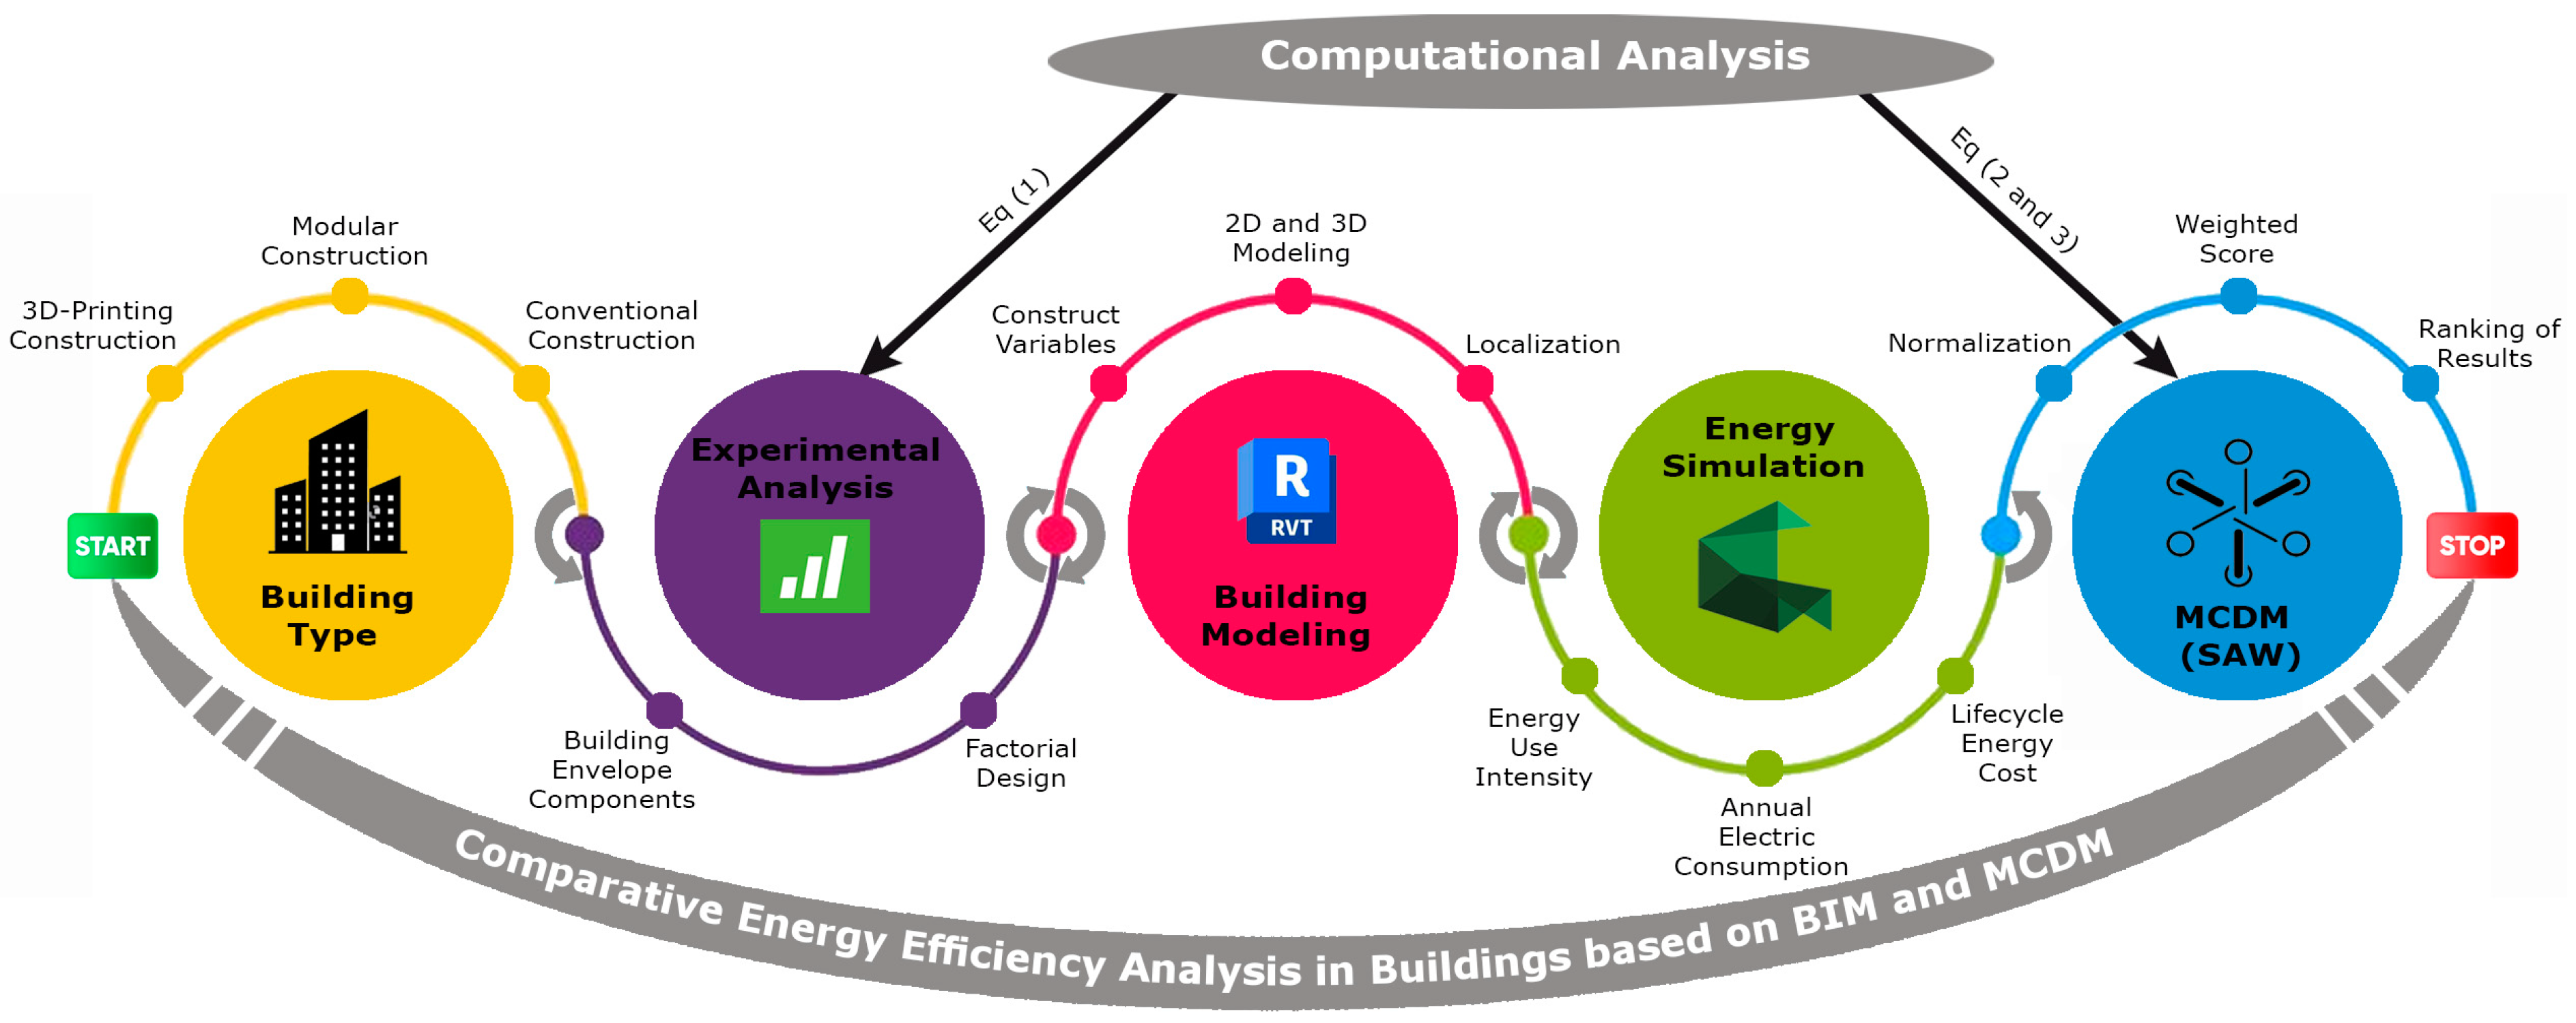
2. Materials and Methods

This paper aims to establish a pioneering framework devised to assess the energy consumption of diverse construction projects, aiming to facilitate informed decision-making towards sustainable energy utilization and management in buildings. This framework seamlessly integrates Building Information Modeling (BIM) with parametric analysis of construction components and MCDM. By synergizing these methodologies, the framework offers a comprehensive approach to evaluate energy efficiency across various construction methods as depicted in Figure 1. This framework aids the decision-making process toward sustainable energy use and management in such buildings through a parametric analysis across different types of constructions.

2.1. Building Types

The first step is highly important for the proposed framework. It revolves around defining and describing the chosen construction methods, building parameters, and building materials. The aim of this step is to help understand the possibility to improve energy efficiency in different construction methods and empower the decision-making process in terms of the selection and implementation of appropriate materials in building construction. Describing the construction methods involves collecting information about each type of construction, define the building technique that will be applied, and assign the building materials for each type.
Defining building parameters comprises a profound inspection of the objectives and constraints of the construction project to ensure that the analysis is carried out considering the sustainability goals. The goals at this stage include reducing energy consumption, enhancing thermal comfort, and ensuring compliance with environmental regulations. Additionally, this phase establishes sustainability objectives, such as improving indoor environmental quality and increasing resilience. It also outlines the technical parameters, indicators, and variables to be included in the analysis (walls, roofs, and window-to-wall ratio). For the case study building in this research, it is crucial to understand and apply Brazilian standards regarding thermal comfort in buildings, ABNT NBR 15220, for construction projects [48].
The last step of this phase includes defining the materials to be used in the case study. Defining the materials for the inspected parameters is a crucial step as the physical and thermal characteristics of these materials play the main role in this framework to achieve its goals and objectives. Selecting materials that balance these characteristics can contribute significantly to an energy-efficient building design, supporting both environmental goals and enhanced energy performance.

2.2. Experimental Analysis

This stage of the study is considered the first step of computational analysis. This phase involves applying the experimental design to facilitate the examination of various building components and project parameters, such as orientation, HVAC systems, lighting control, lighting efficiency, construction elements of roofs and external walls, glazing types, shadows, and window-to-wall ratios. Minitab 17 software is utilized as an experimental design tool to determine the applied levels and their variables through linear regression analysis, thereby reducing regression errors and uncertainty [49]. The statistical factorial planning technique employed in this experimental design study is based on Equation (1), where the factorial design model is analyzed through regression analysis to estimate all coefficients {β0, …, βκ} [50]:
E = β0 + β1 · χ1 + β2 · χ2 + … + βκ · χκ + ε
In this equation, E represents the predicted energy efficiency metric (e.g., energy use intensity or annual electric consumption), xi denotes the independent factors such as the orientation or glazing type, and ϵ represents the residual error in the regression model.
The experimental design involved simulations conducted in a virtual environment using BIM tools, with accuracy ensured by calibration against industry standards. Parameters were varied systematically using a factorial design approach to capture interactions between variables. Measurement accuracy was validated by minimizing regression errors through statistical analysis in Minitab, with an error estimate of less than 5% based on validation tests. This robust methodology enables a reliable evaluation of how various design parameters influence building energy efficiency.

2.3. Building Modeling

BIM programs and plug-ins operate as the technical base of BIM tools, which provide developed intelligent modeling and information management abilities [51]. It represents a significant advancement in information technology within the construction industry, combining building data and promoting knowledge across all stages of a project lifecycle, from planning and design to construction, management, and eventual demolishing [52].
BIM promotes multidimensional modeling to manage the entire lifecycle of a construction project. The main BIM dimensions comprise 3D modeling, which enables design and data sharing during the planning stage; 4D, which involves consolidating time with project scheduling for building simulations; 5D, which combines cost estimation and the 4D model for precise budgeting; and 6D, which centers on facilitating the management process during the operational phase. Further, 7D BIM underlines sustainability by estimating design alternatives to achieve environmental goals, while 8D BIM combines safety factors into both design and construction phases. These dimensions assist optimization, decision-making, and resource management, contributing to promoting project quality and efficiency over all phases of the building lifecycle [53].
The phase involves comprehensive 2D and 3D simulations of the designated case study using Autodesk Revit. This initial step enables the creation of intelligent models, facilitating subsequent analysis. After collecting the required sequences in Minitab, simulation and modeling of design alternatives, as well as the execution of different sequences, can be performed manually on Autodesk Revit. This process involves creating families for each desired level and variable of materials, entering the name of the sequence, and running the added alternatives.
Following simulation, Revit projects are transformed into gbXML format to facilitate importation into Autodesk Green Building Studio. Here, the energy performance of each building is meticulously simulated and analyzed, accounting for energy EUI and annual energy consumption. Through comparative analysis of collected data, the research aims to discern the impact of individual building components on energy efficiency across diverse construction methods.

2.4. Energy Simulation

The energy simulation was conducted using the building elements mode for a single-family facility operating continuously, 24 h a day, 7 days a week. Adhering to European standards, the ventilation rate was established at 0.30 h−1, ensuring an adequate supply of fresh air for the single-family unit. The HVAC system implemented in the simulation is a residential 14 SEER/8.3 HSPF split packaged heat pump, sourced from the Autodesk Revit library.
Upon completing the creation of a new project in Autodesk Green Building Studio, the imported building’s energy performance is thoroughly analyzed and processed. After designing the case studies for different construction methods, individual performance evaluations can be conducted in Autodesk Green Building Studio. The simulation and modeling of design alternatives are performed manually by entering the name of the sequence, adding the alternatives, and running the simulations for these alternatives. At this stage of the analysis, Autodesk Green Building Studio enables a comparison between each added alternative of the building exported from Autodesk Revit.
After performing all the sequences and running the added alternatives, the process of informed decision-making begins. At this stage of the analysis, an evaluation of the collected data for each sequence is required. Comparisons are made based on the EUI, annual electric consumption, and lifecycle energy cost with the goal of improving energy efficiency in buildings and determining the impact of each building component on energy consumption for each construction method.
This analysis emphasizes that EUI accounts for building occupancy (i.e., daily and yearly use periods) and building function, which are crucial for articulating energy efficiency in construction projects. Evaluating the components of external walls, roofs, windows, and lighting control systems is essential in such buildings. The case studies presented in this work validate the methodological framework and illustrate the simulation and application process of the proposed framework. In particular, the examined lighting control systems are evaluated to demonstrate their significant role in enhancing energy efficiency in buildings. Variables related to roofs, floors, and external walls are analyzed to highlight the critical importance of these construction components in the three construction methods under study. The evaluation process and subsequent comparisons are intended to generate the necessary and recommended graphics that support the novelty of this work.

2.5. Multi-Criteria Decision-Making (MCDM)

This phase is the second step of the computational analysis. It involves applying MCDM as a procedure or combination of methods applied to assess and prioritize various, often incompatible, criteria when forming decisions [54]. It is usually effective in scenarios where decisions necessitate a balance between different factors, and a sole criterion cannot thoroughly detain the complexity of the issue.
SAW is a multi-attribute decision-making method that evaluates alternative elements or factors based on a weighted summary of their performance across various criteria [55]. Every substitute is appointed a score by summing its weighted ranking for all assessed criteria, and the alternative with the highest outcome is recognized as the most appropriate and recommended option [56]. This method adequately supports decision-making procedures and can be applied in addition to overlay processes to support the analysis. The core principle of SAW is to calculate the weighted performance ratings of substitutes across all criteria. To guarantee comparability among criteria with different elements or scales, the SAW approach demands normalizing the decision model (X). This normalization procedure calibrates the data to a combined scale, enabling a precise and compatible assessment of all alternatives [55].
The first step in applying SAW is to define the alternatives and criteria to be assessed. This step involves identifying the set of alternatives to be evaluated and the criteria which they will be judged upon. The second phase is constructing a decision matrix. This step involves creating a matrix where each row illustrates an alternative and each column presents a criterion. The aim of those matrix entries is to list the performance of each alternative for each criterion. The third step is to normalize the decision matrix. Ensuring comparability across criteria with different units, normalization regulates the performance result of all substitutes to a common scale. Normalization can be typically performed by applying Equation (2) [55].
T i j = X i j M a x X i j
where (Tij) is the normalized score of alternative (i) under criterion j and it represents the performance of an alternative after normalization. (Xij) is the raw performance score of alternative (i) under criterion j from the original decision matrix. Max (Xij) is the maximum value of criterion j across all alternatives.
The fourth step involves assigning weights (Wj) to each criterion to reflect their relative importance in the decision-making process. In the SAW method, this is typically performed by expert judgment or stakeholder input based on the context of the study. Each criterion is evaluated for its significance in influencing the decision, and the weights are assigned proportionally to reflect this importance. The weights are normalized to ensure their sum equals 1 (∑Wj = 1), maintaining consistency in the evaluation process.
The fifth phase involves calculating the weighted normalized scores (Rij), which link directly to the normalized values (Tij) from Equation (2). This is achieved by multiplying the normalized scores by their respective criterion weights: Rij = Wj⋅Tij. These weighted scores are then summed for each alternative to determine the total score (Si), as in Equation (3) [55].
S i = j = 1 n Wj Rij
where Si is the total score for alternative (I); this value determines the final ranking of the alternative. Wj is the weight assigned to criterion j indicating its relative importance. The sum of all Wj values must equal (=1). The last step is to rank the alternatives based on their scores (Si), where the alternative with the lowest score is considered the most efficient option [55].

3. Case Study

To validate the proposed framework, this research leverages a series of case studies representing distinct construction techniques—conventional, modular, and 3D-printing. Each case study embodies a standardized unit measuring 8.5 m in length by 6.4 m in width, adaptable for residential, office, retail, or commercial purposes (see Figure 2). The dimensions of the case study were derived from the catalog of Volferda, which is a high-tech enterprise specialized in researching, developing, and producing tiny houses [57]. The simulated environment within each unit encompasses basic amenities and appliances for lighting, heating, and cooling, providing a realistic basis for energy consumption analysis.

3.1. Conventional Construction

The base design utilizes reinforced concrete as the primary structural material. This method emphasizes durability and longevity. Ecological bricks, comprising mud, sand, and Portland Cement, form the walls, promoting sustainability and eco-friendliness. The roof incorporates flat reinforced concrete and polystyrene insulation for thermal regulation. The alternative design utilizes areole concrete for the walls and wood frames with high insulation for the roof.
The window-to-wall ratios are defined according to the Brazilian standards regarding thermal comfort in buildings, ABNT NBR 15220, for construction projects [48]. The standard categorizes Brazil into eight bioclimatic zones and specifies ventilation opening sizes: medium openings (15–25% of floor area) are recommended for zones 1 to 6, small openings (10–15%) are recommended for zone 7, and large openings (40% or more) are recommended for zone 8. The examined case study herein is located in the city of Rio de Janeiro in Brazil, which is in the 8th bioclimatic zone of the country; the window-to-wall ratios should be 40% or more of the floor area. Thus, this work will take into consideration two different sizes of openings (40% and 50%) of floor area, as illustrated in Table 1. These sizes represent large ventilation openings, which are particularly effective at enhancing airflow and reducing reliance on mechanical cooling, thus improving energy efficiency in buildings. By comparing these two sizes, the study can assess the incremental impact of increased opening dimensions on indoor thermal comfort and energy consumption. Regarding the external walls, this work considers two conventional components, ecological brick with high insulation and areole concrete, as presented in Table 1. Further, this work takes into consideration two alternatives for conventional external roofs in Brazil such as a flat insulated concrete roof and a wooden frame with a highly insulated roof, as highlighted in Table 1.

3.2. Modular Construction

The first set of materials comprises steel frames and concrete panels as structural elements, ensuring robustness and flexibility in design. The exterior walls feature precast concrete panels augmented with rigid foam insulation for enhanced thermal efficiency. The roof structure adopts a flat insulated design, incorporating reinforced concrete, polystyrene insulation, and asphalt covered with aluminum paint for optimal insulation, as presented in Table 2. The second set of materials involves wood frames with high insulation for walls, wooden panels with insulation tiles of solid wood for flooring, and wood frames for the roof with high insulation as explained in Table 2. The third set of materials comprises concrete frames for structural elements. The exterior walls feature brick walls augmented with rigid foam insulation for enhanced thermal efficiency. The roof structure adopts a flat insulated design, incorporating reinforced concrete, polystyrene insulation, and asphalt covering with aluminum paint for optimal insulation as shown in Table 2. As for the window-to-wall ratio, this work will take into consideration two different sizes of openings (40% and 50%) of floor area for the modular method, as was explained in the previous section.

3.3. Three-Dimensional-Printing Construction

The first set of materials for 3D printing utilizes a single row of 10 cm thick cork concrete mix for the walls and roof, integrating E-PLA for insulation. The cork concrete mix consists of 32% gravel, 25% silica sand, 24% cork, 15% cement, 3% air, and 1% polypropylene fiber as shown in Table 3. The second set of materials for this method incorporates a single row of 10 cm thick sulfur concrete mix for the walls and roof, integrating E-PLA for insulation. The sulfur concrete mix consists of 44% silica sand, 34% gravel, 20% sulfur, 1% air, and 1% polypropylene fiber as illustrated in Table 3. The third set of materials involves using double rows of 10 cm thick cork concrete (with E-PLA for insulation) for the walls and wood frame with high insulation for the roof. The fourth sets comprises double rows of 10 cm thick sulfur concrete (with E-PLA for insulation) for the walls and wood frame with high insulation for the roof as explained in Table 3. This method will also utilize the same two different sizes of openings (40% and 50%) of floor area as in the conventional and modular methods. The technique used in all sets for printing is the Material Deposition Method (MDM), which is a process that involves progressively pouring material layer by layer until the imported computer-aided model is completed. To achieve the desired quality of the final product without any deformations, the material mixture must be designed to support both its weight and the weight of the overlapping layers.

3.4. Experimental Design Analysis of the Case Study

The experimental design layout is based on the interaction between the assigned factors, achieved by simulating all possible variables using the statistical factorial design technique, as outlined in Equation (1). The modeling of the applied factors and levels for the examined case study in Minitab software began with creating a factorial design based on a general full factorial design, considering three factors: the external walls, roof, and window-to-wall ratio. Consequently, the number of sequences is calculated by multiplying the number of all levels associated with each factorial design considered for the analyzed variables. Specifically, the required sequences to model the examined variables in this study are 8 (2 × 2 × 2) for cases constructed using the conventional method. Table 4 shows the factorial design and the alternatives for the conventional method.
The required sequences to model the examined variables for cases constructed using the modular method are 12 (3 × 2 × 2). The factorial design and the different sequences of the modular method are presented in Table 5.
The required sequences to model the examined variables for cases constructed using the 3D-printing method are 24 (4 × 3 × 2). Table 6 provides a detailed layout of the experimental design analysis for the applied design factors in the examined case study for 3D-printing cases.

4. Results and Discussions

After defining the set of materials selected for each method of construction and modeling all the sequences of the chosen case study using Autodesk Revit, all the sequences were exported into gbXML archives to be imported into Green Building studio and all of them were to simulate the energy performance of each sequence. Later, the results of the three criteria (EUI, annual electric consumption, and lifecycle energy cost) for each sequence of different methods of construction were recorded and are listed in Table 7. For the conventional construction sequences, the evaluation revealed a range of performance outcomes. The modular construction method showed a slightly wider variation in performance as reflected in the same table. In the context of 3D-printing construction, 24 different sequences were evaluated to determine their energy efficiency using the same criteria. The assessment focused on the same three key performance indicators.
The analysis conducted using the SAW method provides a comprehensive evaluation of the energy performance of different construction methods: conventional, modular, and 3D-printing. The results are presented in two phases: first is the internal comparison of sequences within each construction type; this phase will first discuss the best sequences for each criterion before applying the SAW to normalize, weight, and rank the scores to highlight the best sequences for each type in construction based on the three criteria. The second phase will involve a cross comparison of the best-performing sequences across all construction types to determine the best sequences among all the construction methods and define which type of construction has the best potential performance regarding energy efficiency.

4.1. Internal Comparison

The internal comparison for each construction method was based on three primary criteria: EUI, annual electricity consumption, and lifecycle energy cost. In the evaluation of EUI on a yearly basis for the conventional method, Sequence 6 achieved the highest efficiency, ranking first with a value of 946.2 MJ/(m2 year). This indicates that Sequence 6 consumed the least energy per square meter compared to all other sequences. Contradictorily, Sequence 2 performed the worst in terms of EUI, recording the highest value of 1058.1 MJ/(m2 year), as illustrated in Figure 3. This demonstrates that Sequence 2 required significantly more energy per unit area, highlighting a considerable gap between the best and worst performers in this criterion.
In the evaluation of EUI for the modular construction sequences, Sequence 7 achieved the highest efficiency, ranking first with a value of 762.2 MJ/(m2 year). This shows that Sequence 7 consumed the least energy per square meter compared to all other modular sequences. Conversely, Sequence 12 performed the worst in terms of EUI, recording the highest value of 1118.30 MJ/(m2 year), as depicted in Figure 3. This large disparity indicates that Sequence 12 required substantially more energy per unit area, highlighting a significant efficiency gap between the best and worst performers in this category.
The 24 sequences for the 3D-printing method demonstrated a range of performance outcomes. The sequence with the lowest EUI, Sequence 7, achieved a value of 726.4 MJ/(m2 year), indicating it was the most energy-efficient in terms of energy consumption per unit area. Contrariwise, Sequence 12 recorded the highest EUI, reaching 12,922 MJ/(m2 year), reflecting the least efficient performance in this criterion. These results reveal a substantial range in EUI across the 3D-printing sequences, as shown in Figure 3.
When examining annual electric energy consumption for the conventional method, Sequence 3 ranked first with the lowest consumption, totaling 11,250 kWh/year (40,500 MJ/year). This signifies that Sequence 3 was the most efficient in terms of electricity use for building operations. In contrast, Sequence 2 again ranked last, consuming the most electricity, with an annual total of 13,182 kWh/year (47,455.2 MJ/year). The notable difference between these sequences underscores the variations in electric energy efficiency across the sequences, as shown in Figure 4.
Regarding annual electric energy consumption in the modular method, Sequence 7 ranked first, with the lowest consumption at 8579 kWh/year (30,884.4 MJ/year), signifying its efficiency in terms of electricity use for building operations. In contrast, Sequence 12 ranked last, where it consumed the highest electricity with a total of 13,733 kWh/year (49,486.8 MJ/year). This noticeable difference between the sequences emphasizes the variability in electric energy efficiency among the modular sequences, as shown in Figure 4.
The performance among the 3D-printing sequences also varied significantly in terms of electric energy consumption. Sequence 7 still ranked first with the lowest electric consumption, consuming 8151 kWh/year (29,326.8 MJ/year). This indicates that it was the most efficient in terms of electricity use for building operations as well. In contrast, Sequence 12 again recorded the highest consumption, reaching 12,922 kWh/year (46,495.2 MJ/year), indicating it was the least efficient in this respect. These variations in electric energy consumption are illustrated in Figure 4.
The analysis of lifecycle energy costs for the conventional method shows considerable fluctuation, reflecting inconsistency in energy efficiency as shown in Figure 5. Seq07 and Seq03 exhibit the lowest costs, at BRL 114,812 and 115,237, respectively. In contrast, Seq02 ranked last with the highest lifecycle energy cost of BRL 135,001. The costs round up into two observable groups: a high-efficiency group (Seq07, Seq03, Seq08, Seq06) with costs shifting from BRL 114,812 to 120,752, and a moderate-to-high-cost group (Seq01, Seq05, Seq04, Seq02) varying from BRL 121,715 to 135,001. The marked variation of over BRL 20,000 between the most and least efficient sequences emphasizes the importance of incorporating lifecycle energy considerations into early design and construction planning.
Regarding the modular construction method, the lifecycle energy cost analysis sequences disclose a wide range of results, as presented in Figure 5. The cheapest cost perceived is Seq07 at BRL 87,950, followed by Seq08 at 93,605, which indicates remarkable overall energy performance. In contrast, Seq12 ranked last with the highest cost of BRL 140,626. The results can be assembled into three main groups. The first one is the high-efficiency group (Seq07 and Seq08), which indicates considerably lower lifecycle energy costs than the others. This group indicates the prospect for modular construction to attain significant energy savings when optimized. The moderate-efficiency group (Seq03, Seq09, Seq04, and Seq10) is the second one and it scored costs that range between BRL 115,868 and 122,907, reflecting reasonably efficient but less optimized systems. Finally, the high-cost group (Seq01, Seq05, Seq02, Seq06, Seq11, and Seq12) comprises sequences with lifecycle energy costs from BRL 129,304 to 140,626. It is worth noting that the range of lifecycle costs, spanning over BRL 50,000, highlights the significant influence of design choices on long-term energy efficiency. The distinguished differences between sequences indicate that modular construction can attain excellent energy performance but might also face threats of inadequacy if energy-saving measures are not prioritized.
The analysis of lifecycle energy cost for the 3D-printing method displays a wide extent of values that are presented in Figure 5, emphasizing not only its prospective for energy efficiency but also domains necessitating improvement. The lowest observed cost is in Seq07 at BRL 83,586, followed by several sequences, including Seq21 (90,176) and Seq23 (90,322), which underline the remarkable efficiency obtainable through 3D printing. Meanwhile, Seq12 has the highest cost at BRL 132,342, indicating areas where enhancements in design should be utilized. Accordingly, the results can be assorted into three clusters building on performance. The first one is the high-efficiency group; it includes Seq07, Seq21, Seq23, Seq01, and Seq15, with costs less than BRL 91,000. This group illuminates the distinguished energy performance achievable with optimized designs and material usage. The second cluster is the moderate-efficiency one and its shows costs from BRL 96,800 (Seq22) to 109,382 (Seq09) and displays sequences with balanced energy costs. The high-cost cluster includes sequences such as Seq11, Seq12, and Seq06, with lifecycle costs ranging from BRL 126,211 to 132,342. These elevated costs likely stem from inefficiencies associated with suboptimal material utilization or overly complex design choices, which compromise overall energy and cost performance.
After analyzing the results of each criterion and thoroughly evaluating the energy efficiency of the different sequences in this study, the SAW method was applied to assess and rank the sequences of construction methods based on three key criteria: EUI, annual electric energy consumption, and lifecycle energy cost. Each sequence was analyzed by normalizing the data for all criteria by applying Equation (2). Table 8 lists the normalized values for each sequence of conventional, modular, and 3D-printing methods.
The next phase is to weigh the three criteria, which means assigning weight to each criterion based on its importance. Based on the shared significance of the EUI, annual electric consumption, and lifecycle energy cost in evaluating energy efficiency, the decision was to apply equal weight for each criterion applying Equation (3). Table 9 shows the weighted score for each sequence of conventional, modular, and 3D-printing methods.
By summing the weighted scores for each criterion, a final score was generated for each sequence, producing a ranking that reflects the overall energy performance, as illustrated in Table 10. Sequence 3 emerged as the most balanced across all three criteria in conventional construction, achieving the lowest EUI along with reduced annual electricity and lifecycle energy cost compared to other conventional sequences. In contrast, Sequence 2 ranked the lowest in terms of overall energy performance. As for the modular method, Sequence 7 emerged as the most balanced across all three criteria, which makes it the most efficient option. In contrast, Sequence 12 ranked the lowest in terms of overall energy performance.
The final ranking for the 3D-printing method shows that Sequence 7 emerged as the best overall performer after applying SAW, demonstrating the most balanced and energy-efficient results across all three criteria. This sequence excelled in terms of low EUI, reduced electric consumption, and low lifecycle energy cost. In contrast, Sequence 12 ranked last, with higher energy consumption in all areas. The final ranking of all 24 sequences is also illustrated in Table 10, providing a clear overview of the performance distribution among the 3D-printing alternatives.

4.2. Cross Comparison Between Construction Methods

After identifying the top-performing sequences within each construction type, the top three sequences of each construction type will be compared using the same methods applied in the internal comparison to identify the overall performance of the three construction methods. Applying the SAW analysis again following the same steps that were followed before, Table 11 illustrates the results and ranking of the cross comparison for the top 3 sequences in each type of construction.
The comparison between construction methods discloses notable variations in energy efficiency and cost performance across the sequences. Sequence 7 of the 3D-printing method demonstrated the highest efficiency, with a weighted score of 0.6958. This sequence utilized a double row of insulated cork concrete mix for walls, a high-insulation cork concrete mix for roofs, and a 40% window-to-wall ratio, which contributed to its superior performance across the three evaluated criteria. Its optimized design underlines the probability of 3D printing to deliver low-energy buildings with cost-effective lifecycle performance.
Sequence 7 of the modular technique followed as the second most efficient option, with a weighted score of 0.7672. This sequence combined high-insulation wood frame panels for both walls and roofs and maintained the same 40% window-to-wall ratio. While it ranked behind 3D printing by approximately 10.3%, the modular method still displayed strong performance, especially in decreasing annual electricity consumption, exhibiting its competitiveness as a sustainable construction option.
In contrast, Sequence 7 of conventional construction ranked last with a weighted score of 0.9780, reflecting considerably higher values. Its performance fell behind 3D printing by approximately 40.5%, emphasizing the inefficiency of traditional methods in minimizing energy use and lifecycle costs. Sequence 6 of conventional methods also scored deficiently, reinforcing the challenges conventional methods face in meeting energy efficiency goals.
The analysis also reveals that other sequences of 3D printing, like Sequences 21 and 15, ranked highly as well, with weighted scores of 0.7541 and 0.7551, respectively, demonstrating the stability of 3D printing in achieving energy-efficient results. Modular sequences, including Sequence 8 with a score of 0.7896, also performed well but were ordinarily less efficient than the top-performing 3D-printed sequences. Meanwhile, conventional sequences consistently displayed higher energy demands and lifecycle costs, ranking at the bottom across all assessed criteria.

5. Conclusions

This study emphasizes the importance of energy efficiency in promoting sustainable construction and reducing energy consumption. By integrating BIM and MCDM approaches, the energy performance of conventional, modular, and 3D-printing construction methods was assessed across various design sequences, using key metrics such as EUI, annual electricity consumption, and lifecycle energy costs. The results show that 3D printing consistently outperformed other methods in energy efficiency, while modular construction was competitive, particularly in reducing electricity consumption. Conventional methods lagged due to higher resource demands and lifecycle energy costs. The use of the SAW method facilitated an objective comparison, improving decision-making by identifying the most energy-efficient design alternatives. This research underscores the potential of emerging technologies, especially 3D printing, to drive sustainable energy use in buildings. However, the study focused mainly on energy efficiency and excluded other critical factors like construction time, material impacts, and social acceptance, which could influence the choice of construction methods. Future research should address these aspects and explore the integration of diverse climate conditions, advanced materials, and renewable energy systems to further optimize construction techniques and support the transition to a more sustainable built environment.

Author Contributions

Conceptualization, A.A.M. and M.K.N.; methodology, A.A.M., A.N.H. and M.K.N.; software, A.A.M. and M.K.N.; validation, A.N.H. and M.K.N.; formal analysis, A.A.M., A.N.H. and M.K.N.; investigation, M.K.N.; resources, A.A.M., A.N.H. and M.K.N.; data curation, M.K.N.; writing—original draft preparation, A.A.M.; writing—review and editing, A.N.H. and M.K.N.; visualization, A.A.M. and M.K.N.; supervision, A.N.H. and M.K.N.; project administration, A.N.H. and M.K.N. All authors have read and agreed to the published version of the manuscript.

Funding

The authors would like to acknowledge the support of Conselho Nacional de Desenvolvimento Científico e Tecnológico (CNPq 304726/2021-4), Coordination for the Improvement of Higher Education Personnel (CAPES)- Finance Code 001, Fundação Carlos Chagas Filho de Amparo à Pesquisa do Estado do Rio de Janeiro (FAPERJ E-26400.205.206/2022 (284891)), and (FAPERJ E-26/210.950/2024 (295973)).

Data Availability Statement

Data may be obtained upon reasonable request.

Conflicts of Interest

The authors declare no conflicts of interest.

References

  1. Al Masri, A.; da Costa, B.B.F.; Vasco, D.; Boer, D.; Haddad, A.N.; Najjar, M.K. Roles of Robotics in Architectural and Engineering Construction Industries: Review and Future Trends. J. Build. Des. Environ. 2024, 3. [Google Scholar] [CrossRef]
  2. Labaran, Y.H.; Mathur, V.S.; Muhammad, S.U.; Musa, A.A. Carbon footprint management: A review of construction industry. Clean. Eng. Technol. 2022, 9, 100531. [Google Scholar] [CrossRef]
  3. Carvalho, J.P.; Bragança, L.; Mateus, R. A Systematic Review of the Role of BIM in Building Sustainability Assessment Methods.pdf. Appl. Sci. 2020, 10, 4444. [Google Scholar] [CrossRef]
  4. Hoeft, M.; Pieper, M.; Eriksson, K.; Bargstädt, H.J. Toward life cycle sustainability in infrastructure: The role of automation and robotics in ppp projects. Sustainability 2021, 13, 3779. [Google Scholar] [CrossRef]
  5. Andric, I.; Kamal, A.; Al-Ghamdi, S.G. Efficiency of green roofs and green walls as climate change mitigation measures in extremely hot and dry climate: Case study of Qatar. Energy Rep. 2020, 6, 2476–2489. [Google Scholar] [CrossRef]
  6. LLatas, C.; Soust-Verdaguer, B.; Hollberg, A.; Palumbo, E.; Quiñones, R. BIM-based LCSA application in early design stages using IFC. Autom. Constr. 2022, 138, 104259. [Google Scholar] [CrossRef]
  7. Nilimaa, J. Smart materials and technologies for sustainable concrete construction. Dev. Built Environ. 2023, 15, 100177. [Google Scholar] [CrossRef]
  8. Harputlugil, T.; de Wilde, P. The interaction between humans and buildings for energy efficiency: A critical review. Energy Res. Soc. Sci. 2021, 71, 101828. [Google Scholar] [CrossRef]
  9. Javaid, M.; Haleem, A.; Singh, R.P.; Suman, R. Substantial capabilities of robotics in enhancing industry 4.0 implementation. Cogn. Robot. 2021, 1, 58–75. [Google Scholar] [CrossRef]
  10. Han, Y.; Yang, Z.; Ding, T.; Xiao, J. Environmental and economic assessment on 3D printed buildings with recycled concrete. J. Clean. Prod. 2021, 278, 123884. [Google Scholar] [CrossRef]
  11. Brankley, L.; Camci, L.; Tugrul, A.; Knight, D. Towards digital sharing of verified global warming potential data in concrete reinforcing bar. In Proceedings of the Fib Symposium, Rome, Italy, 5–7 September 2022; pp. 125–131. Available online: https://www.scopus.com/inward/record.uri?eid=2-s2.0-85143915428&partnerID=40&md5=38ac6746f4385abf3e82ac950d580459 (accessed on 17 December 2024).
  12. Lu, Y.; Khan, Z.A.; Alvarez-alvarado, M.S.; Zhang, Y.; Huang, Z.; Imran, M. A Critical Review of Sustainable Energy Policies for the Promotion of Renewable Energy Sources. Sustainability 2020, 12, 5078. [Google Scholar] [CrossRef]
  13. Yeung, J.; J Hahn Menacho, A.; Marvuglia, A.; Navarrete Gutiérrez, T.; Beach, T.; Rezgui, Y. An open building information modelling based co-simulation architecture to model building energy and environmental life cycle assessment: A case study on two buildings in the United Kingdom and Luxembourg. Renew. Sustain. Energy Rev. 2023, 183, 113419. [Google Scholar] [CrossRef]
  14. Lotfabadi, P.; Hançer, P. A comparative study of traditional and contemporary building envelope construction techniques in terms of thermal comfort and energy efficiency in hot and humid climates. Sustainability 2019, 11, 3582. [Google Scholar] [CrossRef]
  15. Pessoa, S.; Guimarães, A.S.; Lucas, S.S.; Simões, N. 3D printing in the construction industry—A systematic review of the thermal performance in buildings. Renew. Sustain. Energy Rev. 2021, 141, 110794. [Google Scholar] [CrossRef]
  16. Wolniak, R.; Saniuk, S.; Grabowska, S. Context of the Development of Industry 4.0 Using the Polish Steel Sector as an Example. Energies 2020, 13, 2867. [Google Scholar] [CrossRef]
  17. Bharany, S.; Sharma, S.; Badotra, S.; Khalaf, O.I.; Alotaibi, Y.; Alghamdi, S.; Alassery, F. Energy-Efficient Clustering Scheme for Flying Ad-Hoc Networks Using an Optimized LEACH Protocol. Energies 2021, 14, 6016. [Google Scholar] [CrossRef]
  18. Li, Y.; Zhao, Y.; Chi, Y.; Hong, Y.; Yin, J. Shape-morphing materials and structures for energy-efficient building envelopes. Mater. Today Energy 2021, 22, 100874. [Google Scholar] [CrossRef]
  19. Homod, R.Z.; Almusaed, A.; Almssad, A.; Jaafar, M.K.; Goodarzi, M.; Sahari, K.S.M. Effect of different building envelope materials on thermal comfort and air-conditioning energy savings: A case study in Basra city, Iraq. J. Energy Storage 2021, 34, 101975. [Google Scholar] [CrossRef]
  20. Han, Y.; Fan, C.; Geng, Z.; Ma, B.; Cong, D.; Chen, K.; Yu, B. Energy efficient building envelope using novel RBF neural network integrated affinity propagation. Energy 2020, 209, 118414. [Google Scholar] [CrossRef]
  21. Kumar, D.; Alam, M.; Zou, P.X.W.; Sanjayan, J.G.; Memon, R.A. Comparative analysis of building insulation material properties and performance. Renew. Sustain. Energy Rev. 2020, 131, 110038. [Google Scholar] [CrossRef]
  22. Dickson, T.; Pavía, S. Energy performance, environmental impact and cost of a range of insulation materials. Renew. Sustain. Energy Rev. 2021, 140, 110752. [Google Scholar] [CrossRef]
  23. Hung Anh, L.D.; Pásztory, Z. An overview of factors influencing thermal conductivity of building insulation materials. J. Build. Eng. 2021, 44, 102604. [Google Scholar] [CrossRef]
  24. Chen, S.; Zhang, G.; Xia, X.; Setunge, S.; Shi, L. A review of internal and external influencing factors on energy efficiency design of buildings. Energy Build. 2020, 216, 109944. [Google Scholar] [CrossRef]
  25. Elghamry, R.; Hassan, H. Impact of window parameters on the building envelope on the thermal comfort, energy consumption and cost and environment. Int. J. Vent. 2020, 19, 233–259. [Google Scholar] [CrossRef]
  26. Sana, S.; Hayati, A.; Salmanzadeh, M. Optimization of Window-to-Wall Ratio for Buildings Located in different climates: An IDA-indoor climate and energy simulation study. Energies 2021, 14, 1974. [Google Scholar] [CrossRef]
  27. Chi, F.; Wang, Y.; Wang, R.; Li, G.; Peng, C. An investigation of optimal window-to-wall ratio based on changes in building orientations for traditional dwellings. Sol. Energy 2020, 195, 64–81. [Google Scholar] [CrossRef]
  28. Abdelmageed, S.; Zayed, T. A study of literature in modular integrated construction—Critical review and future directions. J. Clean. Prod. 2020, 277, 124044. [Google Scholar] [CrossRef]
  29. Hořínková, D. Advantages and Disadvantages of Modular Construction, including Environmental Impacts. IOP Conf. Ser. Mater. Sci. Eng. 2021, 1203, 32002. [Google Scholar] [CrossRef]
  30. Yang, Y.; Chen, S. Dynamic thermal performance and energy-saving potential analysis of a modular pipe-embedded building envelope integrated with thermal diffusive materials. Build. Simul. 2023, 16, 2285–2305. [Google Scholar] [CrossRef]
  31. Sarmento, R.; Posani, M.; Fernandes, P.; Rodrigues, A.M.; Gomes, M.G. Energy efficiency in modular emergency shelters: Impact of envelope finishings and shadowing. J. Build. Eng. 2024, 94, 110029. [Google Scholar] [CrossRef]
  32. Mohammed, M.A.; Budaiwi, I.M.; Al-Osta, M.A.; Abdou, A.A. Thermo-Environmental Performance of Modular Building Envelope Panel Technologies: A Focused Review. Buildings 2024, 14, 917. [Google Scholar] [CrossRef]
  33. Chippagiri, R.; Gavali, H.R.; Ralegaonkar, R.V.; Riley, M.; Shaw, A.; Bras, A. Application of Sustainable Prefabricated Wall Technology for Energy Efficient Social Housing. Sustainability 2021, 13, 1195. [Google Scholar] [CrossRef]
  34. Huang, B.; Lu, W. Experimental Investigation of the Multi-Physical Properties of an Energy Efficient Translucent Concrete Panel for a Building Envelope. Appl. Sci. 2020, 10, 6863. [Google Scholar] [CrossRef]
  35. Pan, W.; Iturralde, K.; Bock, T.; Martinez, R.G.; Juez, O.M.; Finocchiaro, P. A Conceptual Design of an Integrated Façade System to Reduce Embodied Energy in Residential Buildings. Sustainability 2020, 12, 5730. [Google Scholar] [CrossRef]
  36. Sepasgozar, S.M.E.; Shi, A.; Yang, L.; Shirowzhan, S. Additive Manufacturing Applications for Industry 4.0: A Systematic Critical Review. Buildings 2020, 10, 231. [Google Scholar] [CrossRef]
  37. Pan, Y.; Zhang, Y.; Zhang, D.; Song, Y. 3D printing in construction: State of the art and applications. Int. J. Adv. Manuf. Technol. 2021, 115, 1329–1348. [Google Scholar] [CrossRef]
  38. Sotorrío Ortega, G.; Alonso Madrid, J.; Olsson, N.O.E.; Tenorio Ríos, J.A. The Application of 3D-Printing Techniques in the Manufacturing of Cement-Based Construction Products and Experiences Based on the Assessment of Such Products. Buildings 2020, 10, 144. [Google Scholar] [CrossRef]
  39. El-Sayegh, S.; Romdhane, L.; Manjikian, S. A critical review of 3D printing in construction: Benefits, challenges, and risks. Arch. Civ. Mech. Eng. 2020, 20, 34. [Google Scholar] [CrossRef]
  40. Góra, M.; Bańkosz, M.; Tyliszczak, B. Use of Innovative Methods to Produce Highly Insulating Walls Using 3D-Printing Technology. Material 2024, 17, 3990. [Google Scholar] [CrossRef] [PubMed]
  41. Mikhailov, S.; Mikhailova, A.; Nadyrshine, N.; Nadyrshine, L. BIM-technologies and digital modeling in educational architectural design. IOP Conf. Ser. Mater. Sci. Eng. 2020, 890, 012168. [Google Scholar] [CrossRef]
  42. Najjar, M.; Figueiredo, K.; Hammad, A.W.A.; Haddad, A. Integrated optimization with building information modeling and life cycle assessment for generating energy efficient buildings. Appl. Energy 2019, 250, 1366–1382. [Google Scholar] [CrossRef]
  43. Tan, T.; Mills, G.; Papadonikolaki, E.; Liu, Z. Combining multi-criteria decision making (MCDM) methods with building information modelling (BIM): A review. Autom. Constr. 2021, 121, 103451. [Google Scholar] [CrossRef]
  44. Haruna, A.; Shafiq, N.; Montasir, O.A. Building information modelling application for developing sustainable building (Multi criteria decision making approach). Ain Shams Eng. J. 2021, 12, 293–302. [Google Scholar] [CrossRef]
  45. Yarramsetty, S.; Faheem, M.; Siva Kumar, M.V.N. An Integrated Approach to Building Planning Using the Multi-Criteria Decision Method (MCDM) and BIM. Int. J. Sustain. Constr. Eng. Technol. 2023, 14, 49–63. [Google Scholar] [CrossRef]
  46. Abdelaal, M.A.; Seif, S.M.; El-Tafesh, M.M.; Bahnas, N.; Elserafy, M.M.; Bakhoum, E.S. Sustainable assessment of concrete structures using BIM–LCA–AHP integrated approach. Environ. Dev. Sustain. 2023, 26, 25669–25688. [Google Scholar] [CrossRef]
  47. Namaki, P.; Vegesna, B.S.; Bigdellou, S.; Chen, R.; Chen, Q. An Integrated Building Information Modeling and Life-Cycle Assessment Approach to Facilitate Design Decisions on Sustainable Building Projects in Canada. Sustainability 2024, 16, 4718. [Google Scholar] [CrossRef]
  48. Desempenho Térmico de Edificações NBR 15220; Parte 3: Zoneamento Bioclimático Brasileiro e Diretrizes Construtivas Para Habitações Unifamiliares de Interesse Social; ABNT—Associação Brasileira de Normas Técnicas: Rio de Janeiro, Brazil, 2005.
  49. Minitab Blog Regression Analysis Tutorial and Examples. Available online: https://blog.minitab.com/en/adventures-in-statistics-2/regression-analysis-tutorial-and-examples (accessed on 13 November 2024).
  50. Najjar, M.K.; Franco de Carvalho Willcox, L.; Khalas, M.; Da Costa, B.; Haddad, A.; Boer, D. BIM and Experimental Design Analysis Toward Sustainable Energy Efficiency in Buildings: A Modular Construction Case Study BT. Proceedings of CIRMARE 2023, Covilhã, Portugal, 5–7 December 2023; Lanzinha, J.C.G., Qualharini, E.L., Eds.; Springer Nature: Cham, Switzerland, 2024; pp. 483–495. [Google Scholar]
  51. Huang, X.; Liu, Y.; Huang, L.; Onstein, E.; Merschbrock, C. BIM and IoT data fusion: The data process model perspective. Autom. Constr. 2023, 149, 104792. [Google Scholar] [CrossRef]
  52. Najjar, M.; Figueiredo, K.; Palumbo, M.; Haddad, A. Integration of BIM and LCA: Evaluating the environmental impacts of building materials at an early stage of designing a typical office building. J. Build. Eng. 2017, 14, 115–126. [Google Scholar] [CrossRef]
  53. Najjar, M.K.; Tam, V.W.Y.; Di Gregorio, L.T.; Evangelista, A.C.J.; Hammad, A.W.A.; Haddad, A. Integrating parametric analysis with building information modeling to improve energy performance of construction projects. Energies 2019, 12, 1515. [Google Scholar] [CrossRef]
  54. Taherdoost, H.; Madanchian, M. Multi-Criteria Decision Making (MCDM) Methods and Concepts. Encyclopedia 2023, 3, 77–87. [Google Scholar] [CrossRef]
  55. Ibrahim, A.; Surya, R.A. The Implementation of Simple Additive Weighting (SAW) Method in Decision Support System for the Best School Selection in Jambi. J. Phys. Conf. Ser. 2019, 1338, 12054. [Google Scholar] [CrossRef]
  56. Fitrul Hadi, A.; Permana, R.; Syafwan, H. Decision Support System in Determining Structural Position Mutations Using Simple Additive Weighting (SAW) Method. J. Phys. Conf. Ser. 2019, 1339, 12015. [Google Scholar] [CrossRef]
  57. Volferda Volferda Company Catalog. Available online: https://spacecapsulehouse.com/lp-capsule-house/?gad_source=1&gclid=EAIaIQobChMI0-ba5oz4iQMVTBFECB35rwVyEAAYASAAEgLF7fD_BwE (accessed on 17 December 2024).
Figure 1. Proposed framework for the study.
Computation 12 00247 g001
Figure 2. Floor plan and 3D view of the designed case study.
Computation 12 00247 g002
Figure 3. Comparison of energy use intensity among construction methods.
Computation 12 00247 g003
Figure 4. Comparison of annual electricity consumption among construction methods.
Computation 12 00247 g004
Figure 5. Comparison of lifecycle energy cost among construction methods.
Computation 12 00247 g005
Table 1. Chosen materials for the conventional method.
External WallsExternal RoofWindow-to-Wall Ratio
Ecological brick with high insulationFlat insulated concrete roof 40%
Areole concreteWood frame with high insulation50%
Table 2. Chosen materials for the modular method.
External WallsExternal RoofWindow-to-Wall Ratio
Steel frames and concrete panels with high insulationFlat roof with high insulation40%
Wood panels with high insulationWood frame and wood panel with high insulation50%
Brick with rigid foam for insulation
Table 3. Chosen materials for the 3D-printing method.
External WallsExternal RoofWindow-to-Wall Ratio
Single row of 10 cm thick cork concrete mix
E-PLA for insulation
Cork concrete mix and E-PLA for insulation40%
Double rows of 10 cm thick cork concrete mix
E-PLA for insulation
Wood frame roof with high insulation50%
Single row of 10 cm thick sulfur concrete mix
E-PLA for insulation
Sulfur concrete mix and E-PLA for insulation
Double rows of 10 cm thick sulfur concrete mix
E-PLA for insulation
Table 4. The layout of the experimental design for conventional cases.
Seq.External WallsRoofWindow-to-Wall Ratio
1Ecological brick with high insulationFlat insulated concrete roof 40%
2Ecological brick with high insulationFlat insulated concrete roof 50%
3Ecological brick with high insulationWood frame with high insulation40%
4Ecological brick with high insulationWood frame with high insulation50%
5Areole concreteFlat insulated concrete roof 40%
6Areole concreteFlat insulated concrete roof 50%
7Areole concreteWood frame with high insulation40%
8Areole concreteWood frame with high insulation50%
Table 5. The layout of the experimental design for modular cases.
Seq.External WallsRoofWindow-to-Wall Ratio
1Concrete panels with high insulationFlat roof with high insulation40%
2Concrete panels with high insulationFlat roof with high insulation50%
3Concrete panels with high insulationWood frame, panels with high insulation40%
4Concrete panels with high insulationWood frame, panels with high insulation50%
5Wood panels with high insulationFlat roof with high insulation40%
6Wood panels with high insulationFlat roof with high insulation50%
7Wood panels with high insulationWood frame, panels with high insulation40%
8Wood panels with high insulationWood frame, panels with high insulation50%
9Brick with rigid foam for insulationFlat roof with high insulation40%
10Brick with rigid foam for insulationFlat roof with high insulation50%
11Brick with rigid foam for insulationWood frame, panels with high insulation40%
12Brick with rigid foam for insulationWood frame, panels with high insulation50%
Table 6. The layout of the experimental design for 3D-printing cases.
Seq.External WallsRoofWindow-to-Wall Ratio
1Single row of insulated cork concrete mix Cork concrete mix and E-PLA for insulation40%
2Single row of insulated cork concrete mix Cork concrete mix and E-PLA for insulation50%
3Single row of insulated cork concrete mix Wood frame roof with high insulation40%
4Single row of insulated cork concrete mix Wood frame roof with high insulation50%
5Single row of insulated cork concrete mix Sulfur concrete mix and E-PLA for insulation40%
6Single row of insulated cork concrete mix Sulfur concrete mix and E-PLA for insulation50%
7Double row of insulated cork concrete mix Cork concrete mix and E-PLA for insulation40%
8Double row of insulated cork concrete mix Cork concrete mix and E-PLA for insulation50%
9Double row of insulated cork concrete mix Wood frame roof with high insulation40%
10Double row of insulated cork concrete mix Wood frame roof with high insulation50%
11Double row of insulated cork concrete mix Sulfur concrete mix and E-PLA for insulation40%
12Double row of insulated cork concrete mix Sulfur concrete mix and E-PLA for insulation50%
13Single row of insulated sulfur concrete mixCork concrete mix and E-PLA for insulation40%
14Single row of insulated sulfur concrete mixCork concrete mix and E-PLA for insulation50%
15Single row of insulated sulfur concrete mixWood frame roof with high insulation.40%
16Single row of insulated sulfur concrete mixWood frame roof with high insulation.50%
17Single row of insulated sulfur concrete mixSulfur concrete mix and E-PLA for insulation40%
18Single row of insulated sulfur concrete mixSulfur concrete mix and E-PLA for insulation50%
19Double row of insulated sulfur concrete mixCork concrete mix and E-PLA for insulation40%
20Double row of insulated sulfur concrete mixCork concrete mix and E-PLA for insulation50%
21Double row of insulated sulfur concrete mixWood frame roof with high insulation40%
22Double row of insulated sulfur concrete mixWood frame roof with high insulation50%
23Double row of insulated sulfur concrete mixSulfur concrete mix and E-PLA for insulation40%
24Double row of insulated sulfur concrete mixSulfur concrete mix and E-PLA for insulation50%
Table 7. Results of energy simulation derived from Green Building Studio.
Seq.ConventionalModular3D-Printing
EUI
[MJ/m²/Year]
Annual Electric Consumption [kWh] Lifecycle Energy Cost [BRL] EUI
[MJ/m²/Year]
Annual Electric Consumption [kWh] Lifecycle Energy Cost [BRL] EUI
[MJ/m²/Year]
Annual Electric Consumption [kWh] Lifecycle Energy Cost [BRL]
11003.112,467128,3751017.8012,624129,304789.00885490,767
21058.113,182135,0011067.7013,272135,918999.1012,415127,166
3979.711,250115,237995.611,364116,404927.7010,624108,842
41032.511,884121,7151048.9012,001122,907976.5011,211114,836
51003.112,467127,6951017.6012,637129,439948.3011,753120,408
6946.211,791120,7521066.7013,275135,951999.1012,415127,166
7981.711,208114,812762.2857987,950726.4815183,586
81015.111,608118,897811.1921393,605805.4873392,913
91008.5011,312115,868954.4010,677109,382
101062.5011,946122,3421004.3011,263115,367
111067.6013,084134,0001008.0012,321126,211
121118.3013,733140,6261054.9012,922132,342
13784.10958898,292
14841.4010,331105,873
15786.10886090,822
16840.80951397,490
17784.10958898,292
18841.4010,331105,873
19795.00881290,326
20850.60946496,994
21793.70879790,176
22848.90944596,800
23795.00881190,322
24850.60946496,995
Table 8. The normalized values for all sequences of each type of construction.
Normalized Values
Seq.ConventionalModular3D-Printing
Normalized EUINormalized annual electric consumptionNormalized lifecycle energy costNormalized EUINormalized annual electric consumptionNormalized lifecycle energy costNormalized EUINormalized annual electric consumptionNormalized lifecycle energy cost
10.94800.94570.950910.91010.91920.91940.74790.68510.6858
21.001.001.000.95470.96640.96650.94710.96070.9608
30.92590.85340.85360.89020.82740.82770.87940.82210.8224
40.97580.90150.90150.93790.87380.87390.92560.86750.8677
50.94800.94570.94580.90990.92010.92040.89890.90950.9098
60.89420.89440.89440.95380.96660.96670.94710.96070.9608
70.92770.92610.85040.68150.62460.62540.68850.63070.6315
80.95930.88050.88070.72520.67080.66560.76340.67580.7020
90.90180.82370.82390.90470.82620.8265
100.95010.86980.86990.95200.87160.8717
110.95460.95270.95280.95550.95340.9536
121.001.001.001.001.001.00
130.74320.74190.7427
140.79760.79940.7999
150.74510.68560.6862
160.79700.73610.7366
170.74320.74190.7427
180.79760.79940.7999
190.75360.68190.6825
200.80630.73230.7329
210.75230.68070.6813
220.80470.73090.7314
230.75360.68180.6824
240.80630.73230.7329
Table 9. Weighted scores of all sequences for overall energy performance.
ConventionalModular3D-Printing
Seq.Weighted scoreSeq.Weighted scoreSeq.Weighted score
10.947210.915310.7056
20.999020.961620.9552
30.876730.847630.8404
40.925340.894340.8861
50.945650.915950.9051
60.893460.961460.9552
70.900570.643270.6496
80.905980.686580.7130
90.848990.8516
100.8957100.8975
110.9524110.9532
120.9990120.9990
130.7419
140.7982
150.7049
160.7558
170.7419
180.7982
190.7053
200.7564
210.7041
220.7549
230.7052
240.7564
Table 10. Ranking the sequences of each type of construction for overall energy performance.
ConventionalModular3D-Printing
RankingSequencesRankingSequencesRankingSequences
1Seq 31Seq 071Seq 07
2Seq 62Seq 082Seq 21
3Seq 73Seq 033Seq 15
4Seq 84Seq 094Seq 23
5Seq 45Seq 045Seq 19
6Seq 56Seq 106Seq 01
7Seq 17Seq 017Seq 08
8Seq 28Seq 058Seq 13
9Seq 119Seq 17
10Seq 0610Seq 22
11Seq 0211Seq 16
12Seq 1212Seq 20
13Seq 24
14Seq 14
15Seq 18
16Seq 03
17Seq 09
18Seq 04
19Seq 10
20Seq 05
21Seq 11
22Seq 02
23Seq 06
24Seq 12
Table 11. Ranking the best three sequences of each construction method.
RankingEUIAECLECNormalized EUINormalized AECNormalized LECWeighted Score
Seq 07 3D-printing726.4815183,5860.72960.66760.69220.6958
Seq 07 Modular762.2857987,9500.77790.76250.76320.7671
Seq 21 3D-printing793.70879790,1760.79720.72050.74670.7541
Seq 15 3D-printing786.10886090,8220.78950.72570.75210.7550
Seq 08 Modular811.1921393,6050.81460.78130.77510.7896
Seq 3 Conventional979.711,250115,2370.98400.95410.95430.9631
Seq 03 Modular995.611,364116,40410.93080.96390.9639
Seq 6 Conventional946.211,791120,7520.95030.965810.9711
Seq 7 Conventional981.712,208114,8120.986010.95080.9779
Disclaimer/Publisher’s Note: The statements, opinions and data contained in all publications are solely those of the individual author(s) and contributor(s) and not of MDPI and/or the editor(s). MDPI and/or the editor(s) disclaim responsibility for any injury to people or property resulting from any ideas, methods, instructions or products referred to in the content.

