1. Introduction
Computations of electronic structure provide an important input to research in physics, chemistry, and materials science, and density functional theory (DFT) is behind a major part of such computations. While DFT is a formally exact theory, its practical use relies on the implementation of approximative exchange-correlation functionals. A second but not less important ingredient to DFT applications consists in the development and verification of numerical electronic structure codes. Here, we consider the latter subject.
The task to solve the Kohn-Sham equations of DFT is well defined, but its solution is far from being trivial. The mathematical complexity of this system of non-linear integro-differential equations is mirrored by the complexity of its solvers, numerical codes with typically several 105 source lines. Codes of such a size and complexity bear two unavoidable problems: approximations and coding errors. Fortunately, a large number of codes has been developed in past decades by independent teams. These codes partly rely on completely different approximations for, e.g., the representation of the wave function. Thus, many of them can be considered as virtually independent implementations with little risk to suffer from the same source of inaccuracy. Hence, deviations from the numerically exact solution can be considered as code-specific and uncorrelated, at least for codes with different wave function representations. As noteworthy exceptions, we mention standard algebra routines that are frequently taken from common software packages and methods for k-space integrations. The latter are usually implemented independently in each code but may lead to method-specific convergence behavior with the number of k-points.
In 2016, a comparison was published regarding the volume-dependent total energy,
, calculated by means of 15 different DFT codes for 71 elements of the periodic table [
1]. The goal of that work was to evaluate the achievable precision of Kohn-Sham solvers under well-defined common choices of exchange-correlation functional and treatment of relativistic effects. Thereby,
precision was defined as the scatter among computed equation-of-state data, in distinction to
accuracy which would describe the deviation of the mean DFT result from experiment [
1].
In the present work which is again solely focused on the comparison of computations, we will use the terms accuracy and precision in a slightly different sense. Motivated by the idea that the total energy is a variational quantity, lower total energy will be identified with higher numerical accuracy in the common meaning of a smaller systematic error [
2]. This choice comes with the known caveat that numerical problems like basis set over-completeness can reduce the resulting total energy in an unpredictable manner [
3] and have to be excluded by appropriate data analysis. Furthermore, our definition only makes sense if all calculations make use of one and the same exchange-correlation approximation. With this condition fulfilled, the numerical accuracy of a modern DFT code is mainly determined by the completeness of the basis set for the representation of the Bloch states.
Regarding precision as a description of random errors [
2], we will associate this term with numerical noise along the
curve. This choice is motivated by the following consideration. DFT computations are usually quasi-deterministic. Thus, it is not possible to perform a statistical analysis for a single point on
. However, different points on
are known to show quasi-random deviations from averaging approximants to
, such as polynomial fits. The default numerical settings of advanced codes are nowadays tight enough to keep these quasi-random contributions to
well below its systematic deviations from a hypothetical, exact solution of the Kohn-Sham problem. In other words, the numerical precision of
is much higher than its numerical accuracy. However, this may not be the case for derivatives of the total energy which are of interest on their own. For the sake of brevity, we will drop the qualifier “numerical” for the considered accuracy and precision in most places below.
Seven of the codes taken into account in the abovementioned comparison are so-called all-electron codes which do not rely on approximative pseudopotentials but include the complete nuclear potential and the electronic core wave functions in the calculation. Considering the scatter of results only among these seven codes used with their numerically best settings, the data produced by Wien2k [
4] turned out to be close to the barycenter [
1]. This finding confirms the status of Wien2k as the “gold standard” of DFT codes: a well-deserved result of several decades of dedicated work by the developer team of Wien2k, formed and headed by Karlheinz Schwarz.
The predictive computation of physical properties by means of DFT codes has been widely established in past decades. If applied to a large set of materials, such a property screening is faced with resource considerations. Disregarding so-called
methods – they are not among the most commonly used DFT codes and are often geared towards certain subsets of compounds like insulators –, the required CPU time and main storage grow with the third and second power, respectively, of the Hamilton matrix rank. Hence, a code with a small matrix, i.e., a small basis set, is usually superior to a code with a large basis set in terms of computation time and main storage demand. However, small basis sets frequently limit the achievable accuracy. Thus, it is important to gauge the quality of codes with small basis sets against a confirmed quality standard such as Wien2k both in terms of accuracy and precision. In the current study, we compare Wien2k and the full-potential local-orbital (FPLO) code [
5] with each other. They are based on completely different concepts to represent the Bloch wave function and the FPLO code is equipped with a much smaller basis set than Wien2k. However, both these codes belong to the all-electron category of electronic structure codes. This allows a direct comparison of their total energies.
To establish a procedure for comparing the quality of two codes concerning their predictive power beyond total energies, we advance from the previous equation-of-state comparison [
1] to the consideration of total energy derivatives which give access to more detailed thermodynamic information. For example, the first derivative of the total energy with respect to the magnetization equals the external field necessary to stabilize this magnetization, and a zero second derivative indicates a metamagnetic transition. Yet more subtle is the detection of an electronic topological transition (ETT), also called Lifshitz transition, on the sole basis of total-energy data. For hexagonal Osmium, a previous experimental study claimed visibility of an ETT as a kink in the ratio of lattice parameters
vs. pressure
p [
6]. Theoretical equation-of-state data should in principle allow to identify such a peculiarity. In later work, however, the existence of this particular ETT was doubted, see Ref. [
7] and references therein.
Here, we demonstrate for a particular case that a conventional ETT can be detected in the third derivative of as obtained from current DFT codes, a denoting the lattice parameter. The reader may object that ETTs can simply be found by careful inspection of band structure and density of states. This was indeed our starting point in seeking to distinguish the traces of ETTs from numerical noise. We achieved a substantial reduction of the latter by modifying the default numerical settings for both considered codes. This allowed us to obtain even relations with high resolution. The obtained precision enabled us to perform convincing Birch-Murnaghan fits using the minimum possible number of data points.
Our exercise focuses on the comparatively simple case of face centered cubic (fcc) Aluminium. This metal was already the target of very early Fermi surface investigations by electronic structure theory [
8]. Later, Fermi surface changes under different types of pressure were predicted [
9] and an ETT was observed by nuclear magnetic resonance experiments on Al under hydrostatic pressure [
10].
Details of the computational methods are provided in the following
Section 2. Results and the related discussion are presented in
Section 3, and
Section 4 summarizes this work.
2. Methods
The Wien2k calculations were performed in the version 19.1 of this code [
4]. The parameter
was varied in the range from 4 to 12, and the muffin-tin sphere radius
was chosen as 2.39 Bohr radii for Aluminium. As convergence conditions,
for density and
Rydberg for the total energy were used in almost all calculations. The only exception was one data point for
nm,
, for which only a density convergence of
could be achieved.
FPLO was used in the version FPLO-18.00-52 [
11]. Self-consistency of the iterations was considered to be achieved upon stability of both density and total energy. The default values,
for density and
Hartree for energy, were taken as related thresholds if not indicated otherwise. A specific modification of the numerical mesh for orbital-potential matrix elements is explained and discussed in
Section 3.3.
All calculations, performed with either of the codes, were conducted in a scalar relativistic mode according to Koelling and Harmon [
12] and using the generalized gradient approximation (GGA) in the parameterization by Perdew, Burke, and Ernzerhof (PBE) [
13]. Integrations in reciprocal space were done with a linear tetrahedron method including Blöchl corrections [
14]. It should be noted that broadening techniques are less suited for the detection of ETTs.
The
k-point numbers of the specific calculations are defined in
Section 3 using the following notation: A mesh with
intervals in the full Brillouin zone, the irreducible part of which was used in a self-consistent calculation, is denoted as scK
n; a mesh with
intervals in the full Brillouin zone, the irreducible part of which was used in a single-step calculation with an input density from a calculation scK
n, is denoted as K
m-scK
n.
Calculations were performed for fcc Aluminium (space group 225) with lattice parameters a between 0.36 nm and 0.41 nm in steps of 0.0005 nm. In certain cases, the step size was chosen as 0.0001 nm.
In our evaluation of the
data, numerical differentiation plays an important role. This approach, however, requires a trade-off between the conflicting demands for the best possible resolution and the lowest possible noise. Here, we applied two approaches. The first one, called ”direct evaluation” henceforth, uses generalizations of the midpoint formula of differentiation. For a given set of data points with equidistant arguments,
and
were evaluated for
nm. This value is a carefully chosen compromise between a high noise level for small step sizes and a suppression of physical singularities for large step sizes. A considerable further noise reduction can be achieved by starting from third-order polynomial fits within a moving window. This second approach, called “moving window differentiation” below, was carried out on equidistant data sets with
nm and 33 data points in each fit.
3. Results and Discussion
3.1. Effect of the k-Mesh on the Density of States
The density of states (DOS), g, is a primary quantity obtained in any electronic structure calculation on extended systems. It has widely been used for the interpretation of numerous experimental results like photon- or electron-spectroscopy data, thermodynamic properties, or electron-nucleus interaction data. Here, we focus on the DOS at the Fermi level . It is related to the low-temperature specific heat and also to the Knight shift. Last but not least, singularities in the dependence of on the volume (or lattice parameter, or pressure) signal Lifshitz transitions. The aim of this subsection is to sensitize the reader to the importance of choosing a dense k-mesh in order to achieve a precise DOS. Henceforth, we use as abbreviation for .
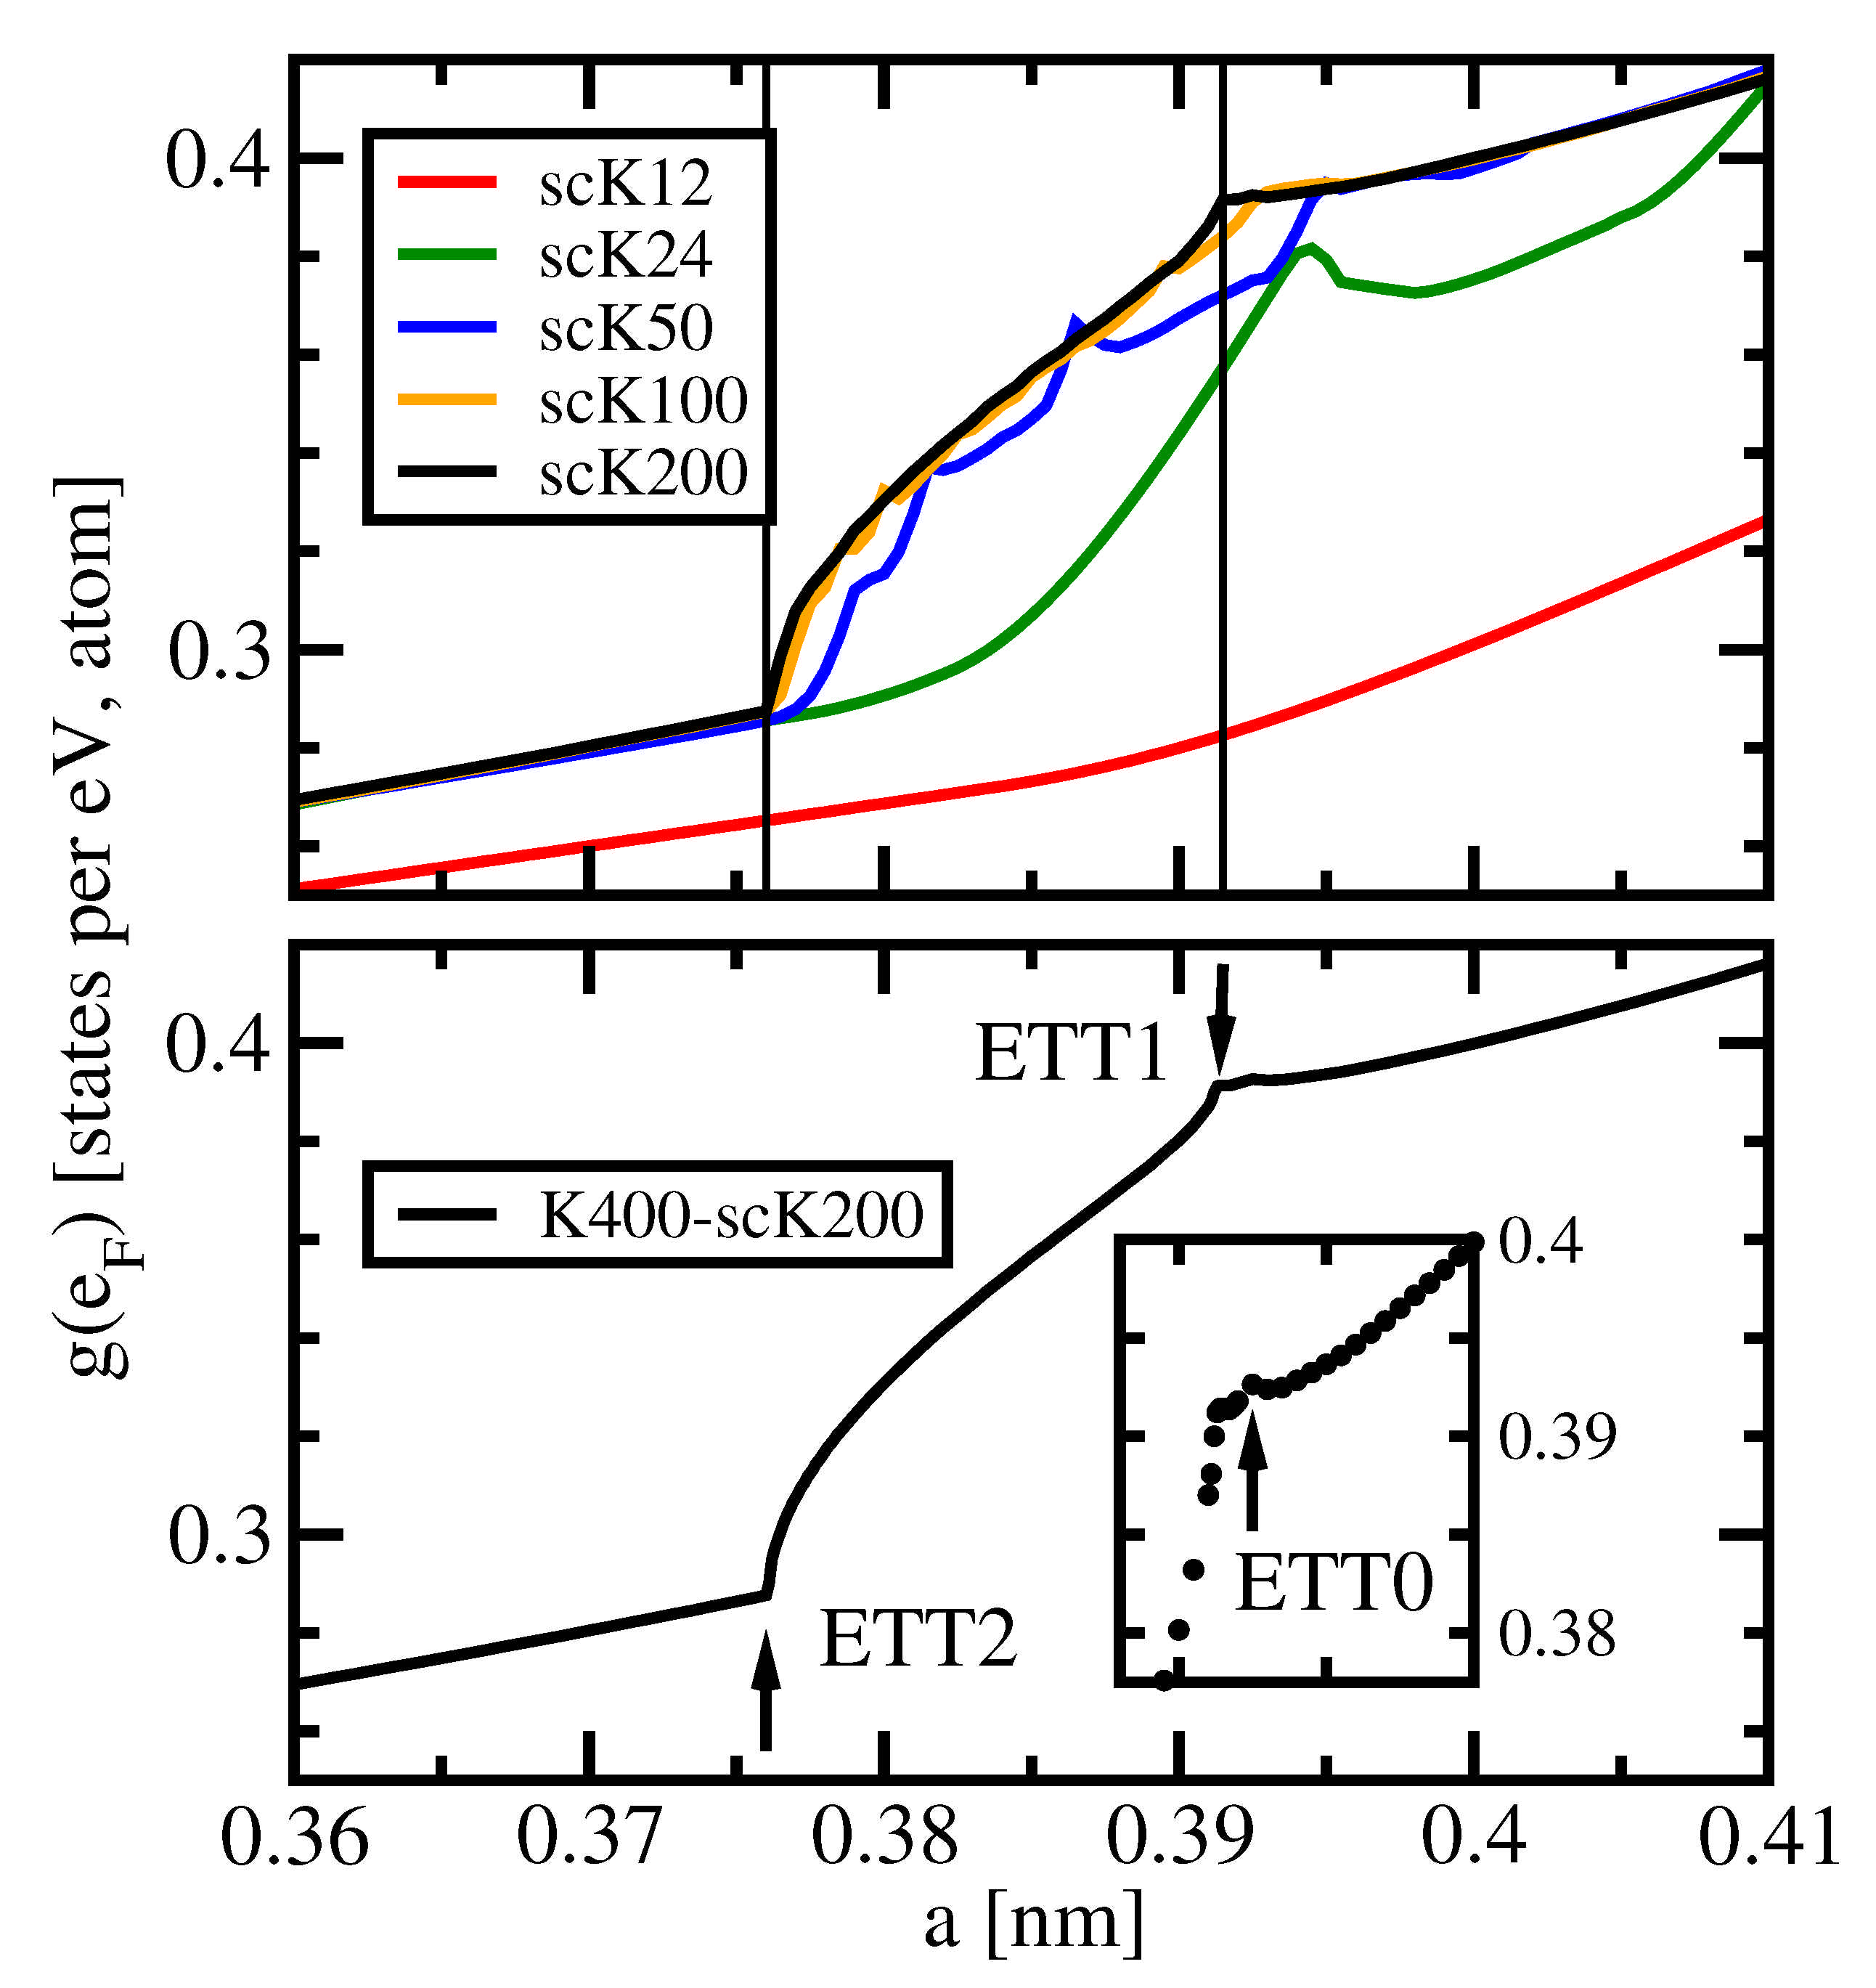
Figure 1 shows
of fcc Aluminium vs. lattice parameter
a for different
k-meshes. Consider the upper panel of the figure first. The default
k-mesh scK12 (red line) provides a smooth behavior of
in the whole range of the lattice parameter. It does, however, not meet the expectation of a root-like dependence for a nearly-free electron situation. For the next denser mesh scK24, a local maximum of
appears close to
nm. This maximum could be related to an ETT, but the yet denser mesh scK50 produces a much more structured curve with several local maxima or kinks. The majority of these singularities can be assigned to numerical minigaps arising from wrong band connections. Such minigaps are more numerous but smaller in the scK100 results, and they are almost invisible in the scK200 curve.
The latter two data sets each exhibit two kinks that indeed originate from ETTs. They are marked by the vertical lines and named ETT1 and ETT2. Furthermore, data obtained with a very dense
k-mesh K400-scK200 are presented in the lower panel of the figure and in its inset. The related curve is piece-wise quasi-analytic. Here, another but less prominent Lifshitz transition, ETT0, is recognizable close to
nm, see the inset of
Figure 1.
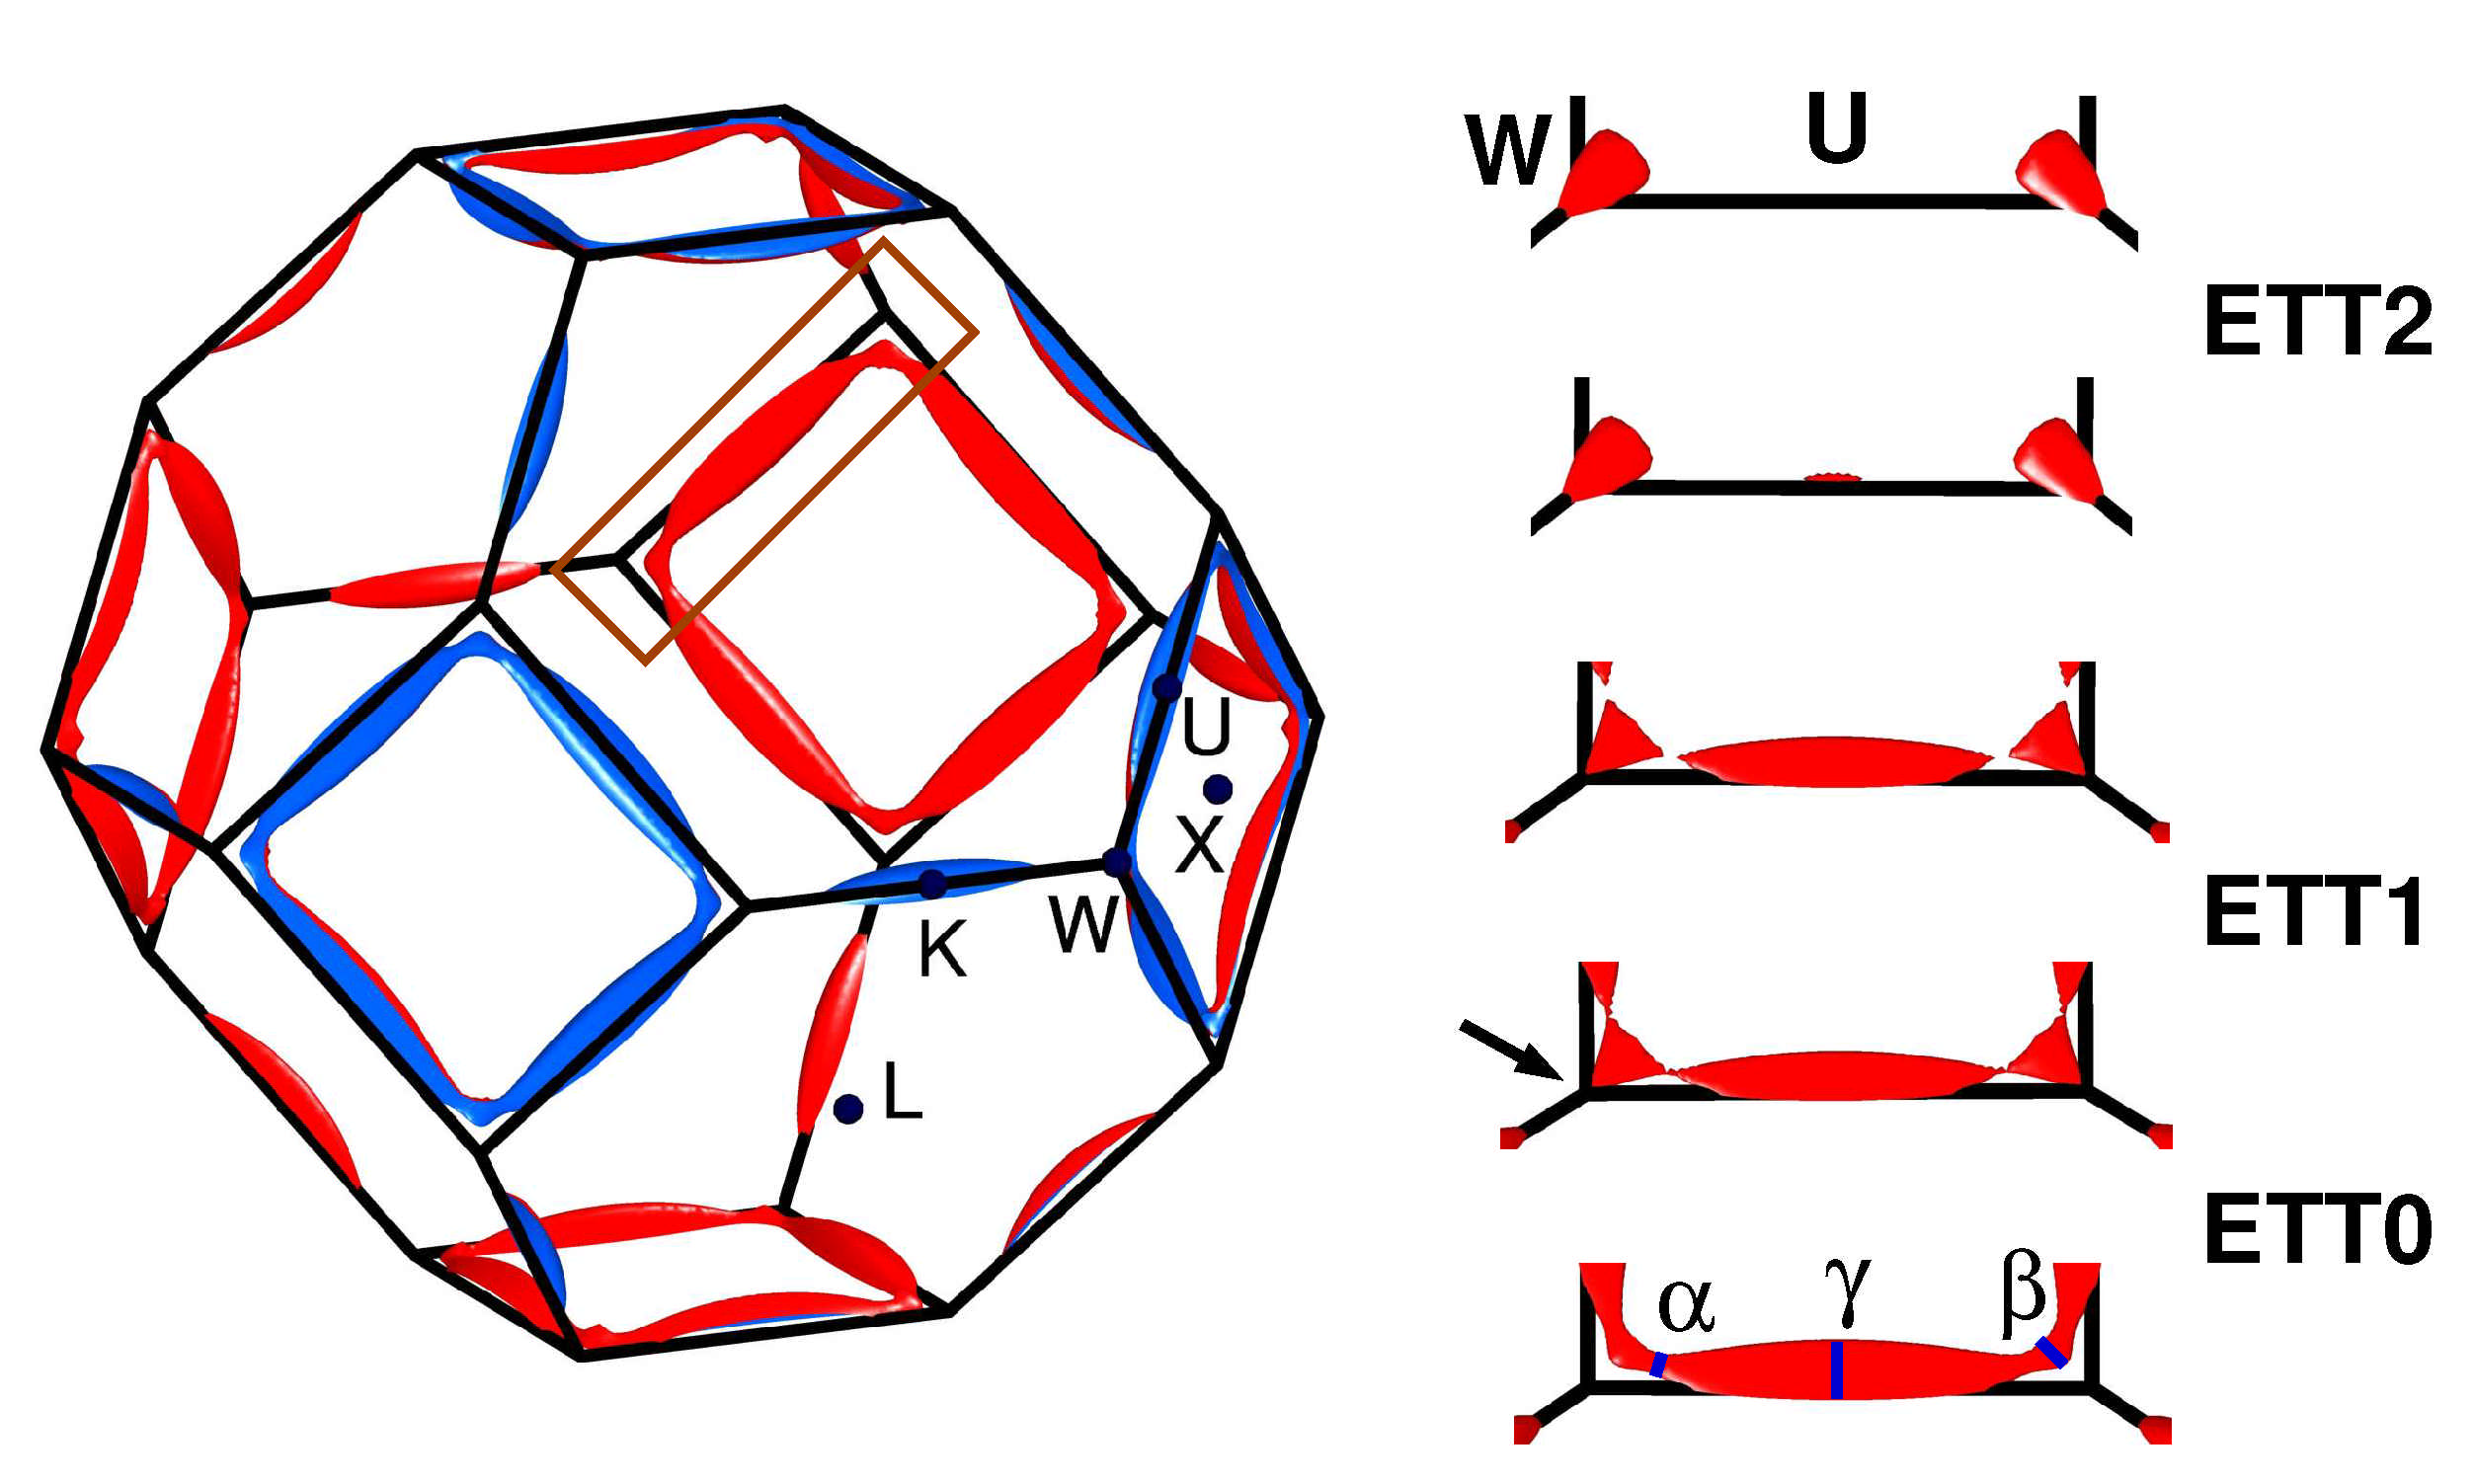
All three ETTs detected above can be identified in the schematic Fermi surface plots shown in
Figure 2. Therein, the well-known third-zone monster of fcc Aluminium is shown in the left-hand part within the complete Brillouin zone and as the lowest detail in the right-hand part, both for the equilibrium situation.
Consider the right-hand part of
Figure 2. Upon reduction of
a, the
-orbit merges with its neighbor and the monster become multiply connected (arrow in the second lowest detail). This ETT0 is barely visible in the DOS, compare the inset of
Figure 1. A slight further reduction of
a disconnects the Fermi surface and lets the
-orbits vanish, as shown in the third detail. This transition was named ETT1 above. Finally, the ellipsoid around symmetry point U vanishes in another Lifshitz transition, named ETT2. The latter two transitions are well-resolved in the DOS, provided it is computed with appropriate precision, see
Figure 1.
To avoid the occurrence of the abovementioned artificial singularities of the DOS, resulting from wrong band connections, broadening techniques are frequently used for
k-integration and even for the calculation of the DOS. Such approaches, however, do not allow for the identification of van Hove singularities as indicators of ETTs. Hence, the use of a linear tetrahedron method with a very dense
k-mesh is the only safe way to identify an ETT in the DOS. An alternative way is to calculate Fermi surfaces using an equally dense mesh. We stress that a band structure at symmetry lines is usually not sufficient for this aim since changes of the Fermi surface topology frequently happen at general
k-points, compare
Figure 2.
The limited precision of DOS data evaluated by using a coarse
k-mesh also results in large errors in the predicted values of Sommerfeld parameters, Pauli susceptibilities, and Knight shifts. To illustrate this remark,
Table 1 compiles the relative differences between the well-converged value of
obtained from K400-scK200 and
data obtained from less dense meshes for three specific lattice parameters. It shows that the default mesh, which is in many cases sufficient for fairly accurate self-consistent calculations, provides an error of up to 30% in
at the considered lattice parameters. Even the rather dense mesh scK100 yields an error of up to 2%.
The data presented in
Table 2 corroborate the above note that
k-meshes of usual density are sufficient for the computation of integral properties like the equilibrium lattice parameter
. For each of the considered
k-meshes,
was obtained as the minimum of a parabola through the three total energy values computed for
nm. These lattice parameter values are close to the GGA equilibrium which we identify with
nm, denoting
computed with scK400. Already for scK36, the relative error
is below
. Note, this precision is somewhat better than the stability of the Aluminium sample lattice parameter in an experiment without explicit and accurate temperature control. For this situation, temperature stability of 1 K and thermal expansion of
are assumed. After increasing the density of
k-points by a factor of 8, that is for scK72, the deviation is already reduced to
, far better than the achievable precision of any single X-ray experiment.
3.2. Preliminary Considerations—Wien2k
Before a serious numerical investigation by means of any DFT code for a periodic system can be started, two important decisions regarding the numerical settings have to be taken. The first one, choosing the method and mesh density for k-space integration, was discussed in the previous subsection. The second one is the choice of the basis set for the Bloch wave function representation. In the Wien2k code, the extend of the basis set is encoded in the parameter , the product of the smallest muffin-tin sphere radius and the largest k-vector of the plane wave basis set used in the interstitial space. In addition, the number of local orbitals depends on .
In order to check the impact of
on the accuracy, we performed calculations for a number of integer values around the default value
, using a dense
k-mesh K100-scK50.
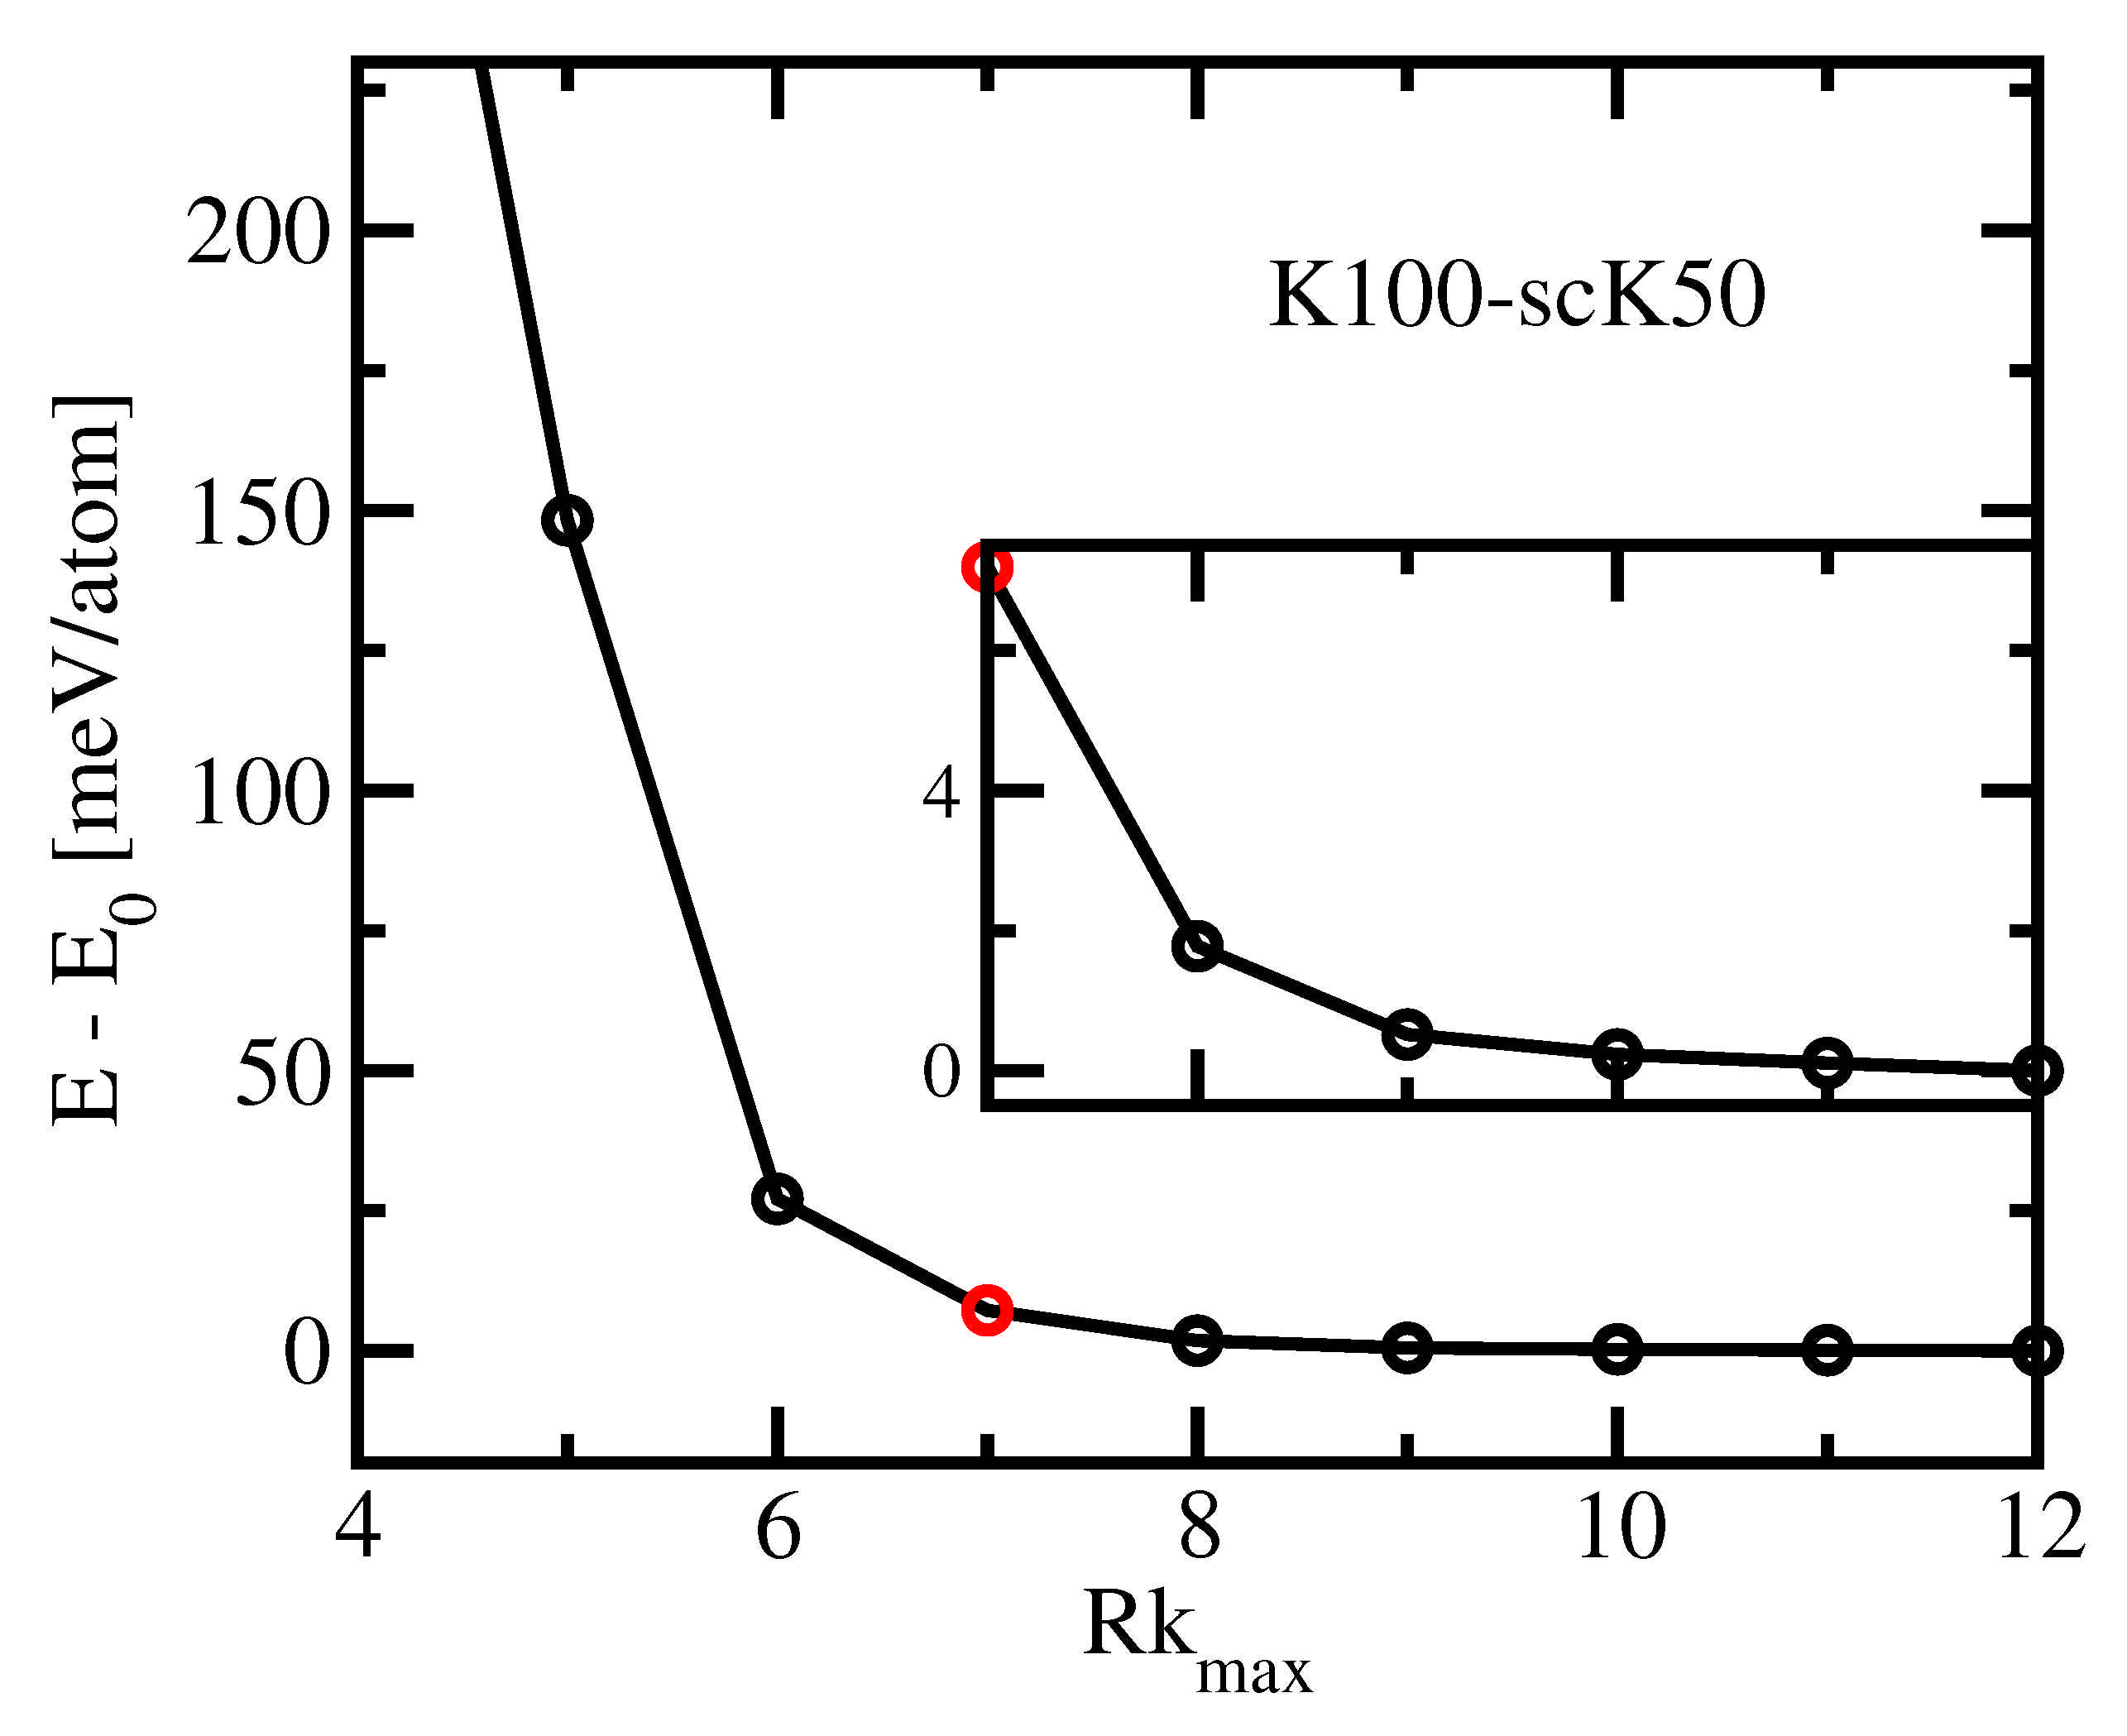
Figure 3 shows the total energy vs.
of fcc Aluminium for
nm, which is close to the GGA equilibrium. The default value of
is indicated by a red circle. We note that the total energy diminishes monotonically with growing
between
. Hence, the accuracy improves with growing
at least till
. The energy seems to be converged within about 0.1 meV for this largest tested basis set. The default setting
provides a total energy about 7 meV above the lowest value.
Next, we turn to the influence of
on the precision by evaluating total energy derivatives with respect to the lattice parameter.
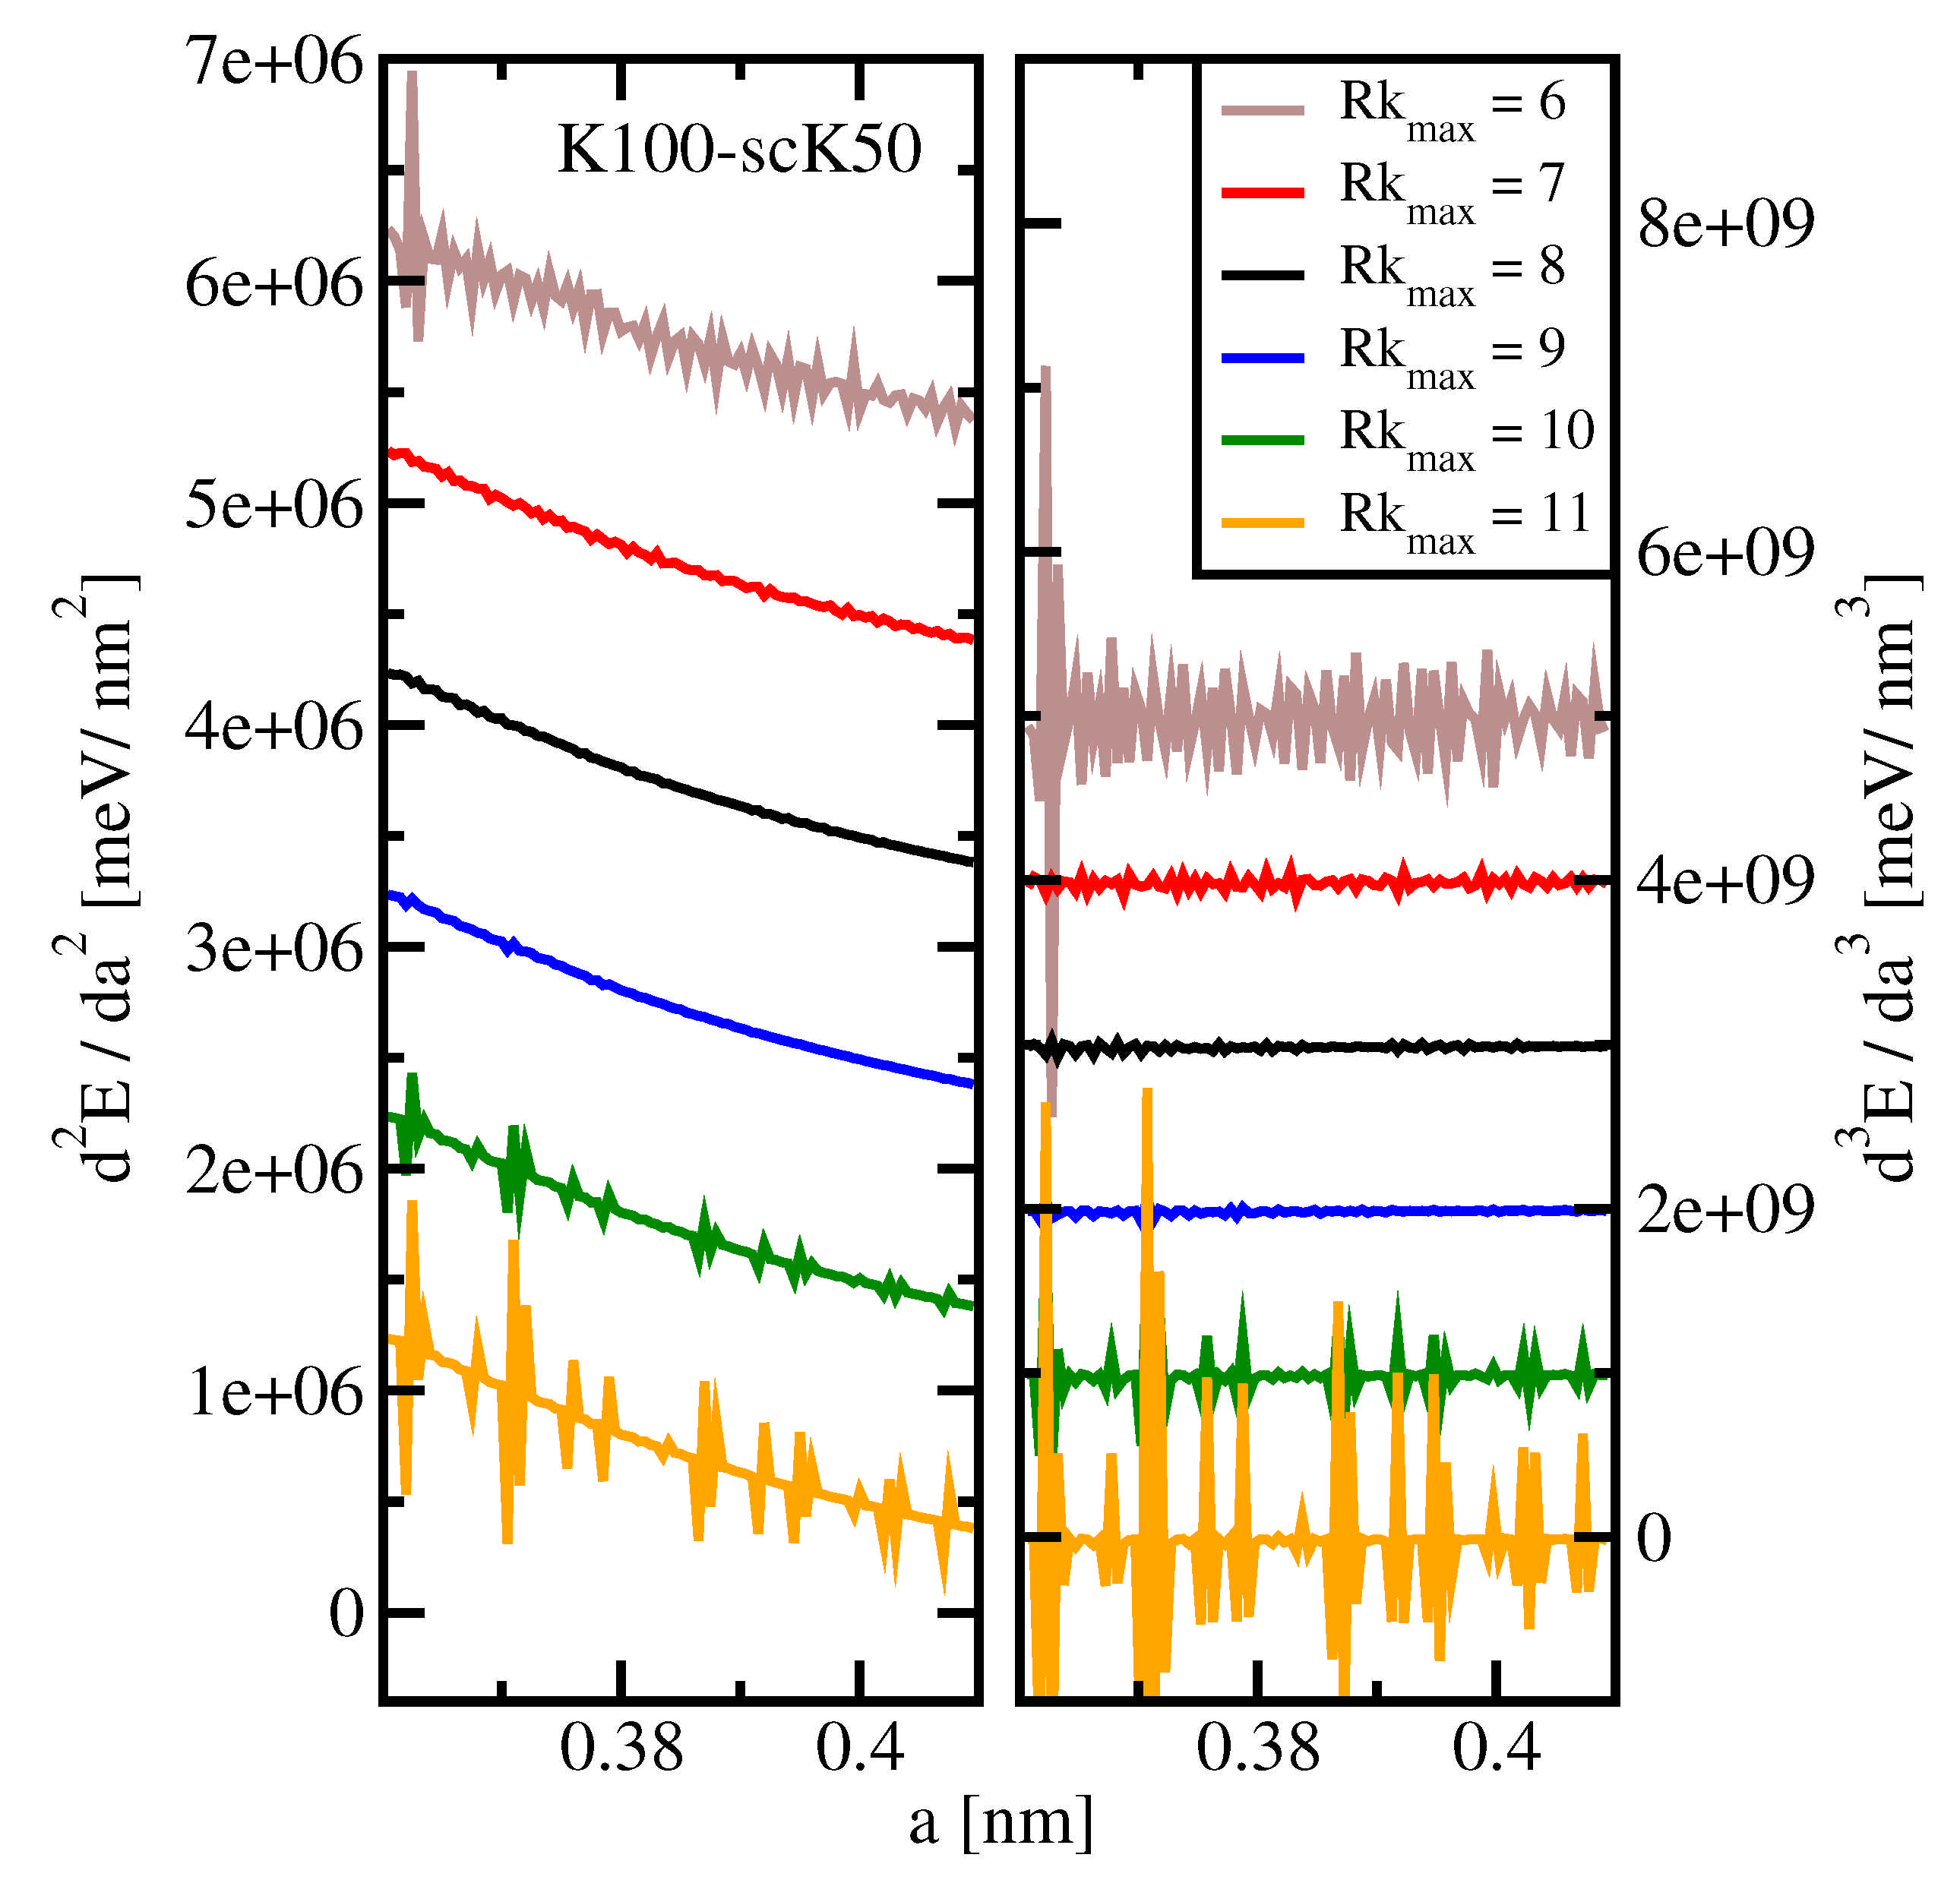
Figure 4 shows
(left panel) and
(right panel) vs.
a, as obtained using Wien2k for a lattice parameter step size of 0.0005 nm. Note that, in order to avoid strong overlap, the individual data sets are offset against each other as detailed in the figure caption. For both the second and third derivatives, the numerical noise is smallest for
8 or 9, slightly above the default value
. For both
and
, the precision decreases. We stress that, in the case of third derivatives, the noise level is larger than the absolute mean value of the derivative for all values of
. This fact will necessitate data smoothing in the search for ETTs, see
Section 3.5.
One possible explanation for, above , the noise unexpectedly increasing with increasing number of plane waves could be numerical problems arising from near completeness. In such a situation, the newly added basis vectors contain more and more redundant directions in Hilbert space. Shifting (a tiny) wave function weight from one to another of these directions will not alter the charge density in any appreciable manner. However, which directions are finally chosen to contribute to the wave function is increasingly determined by unavoidable numerical noise from various places of the code in a quasi-random fashion, the less important the added directions are. Such noise will reflect in derivatives of the total energy. We have no hypothesis that could explain the observed increase of noise if a smaller basis than the default one is chosen.
3.3. Preliminary Considerations—FPLO
The precision of the total energy computation, viz. the noise of , can be evaluated in two ways. In the previous subsection, we used numerical differentiation for this aim. Now, we consider the comparison to a global fit of the data set: the subtraction of a Birch-Murnaghan fit, , from the original data removes a large and smooth contribution.
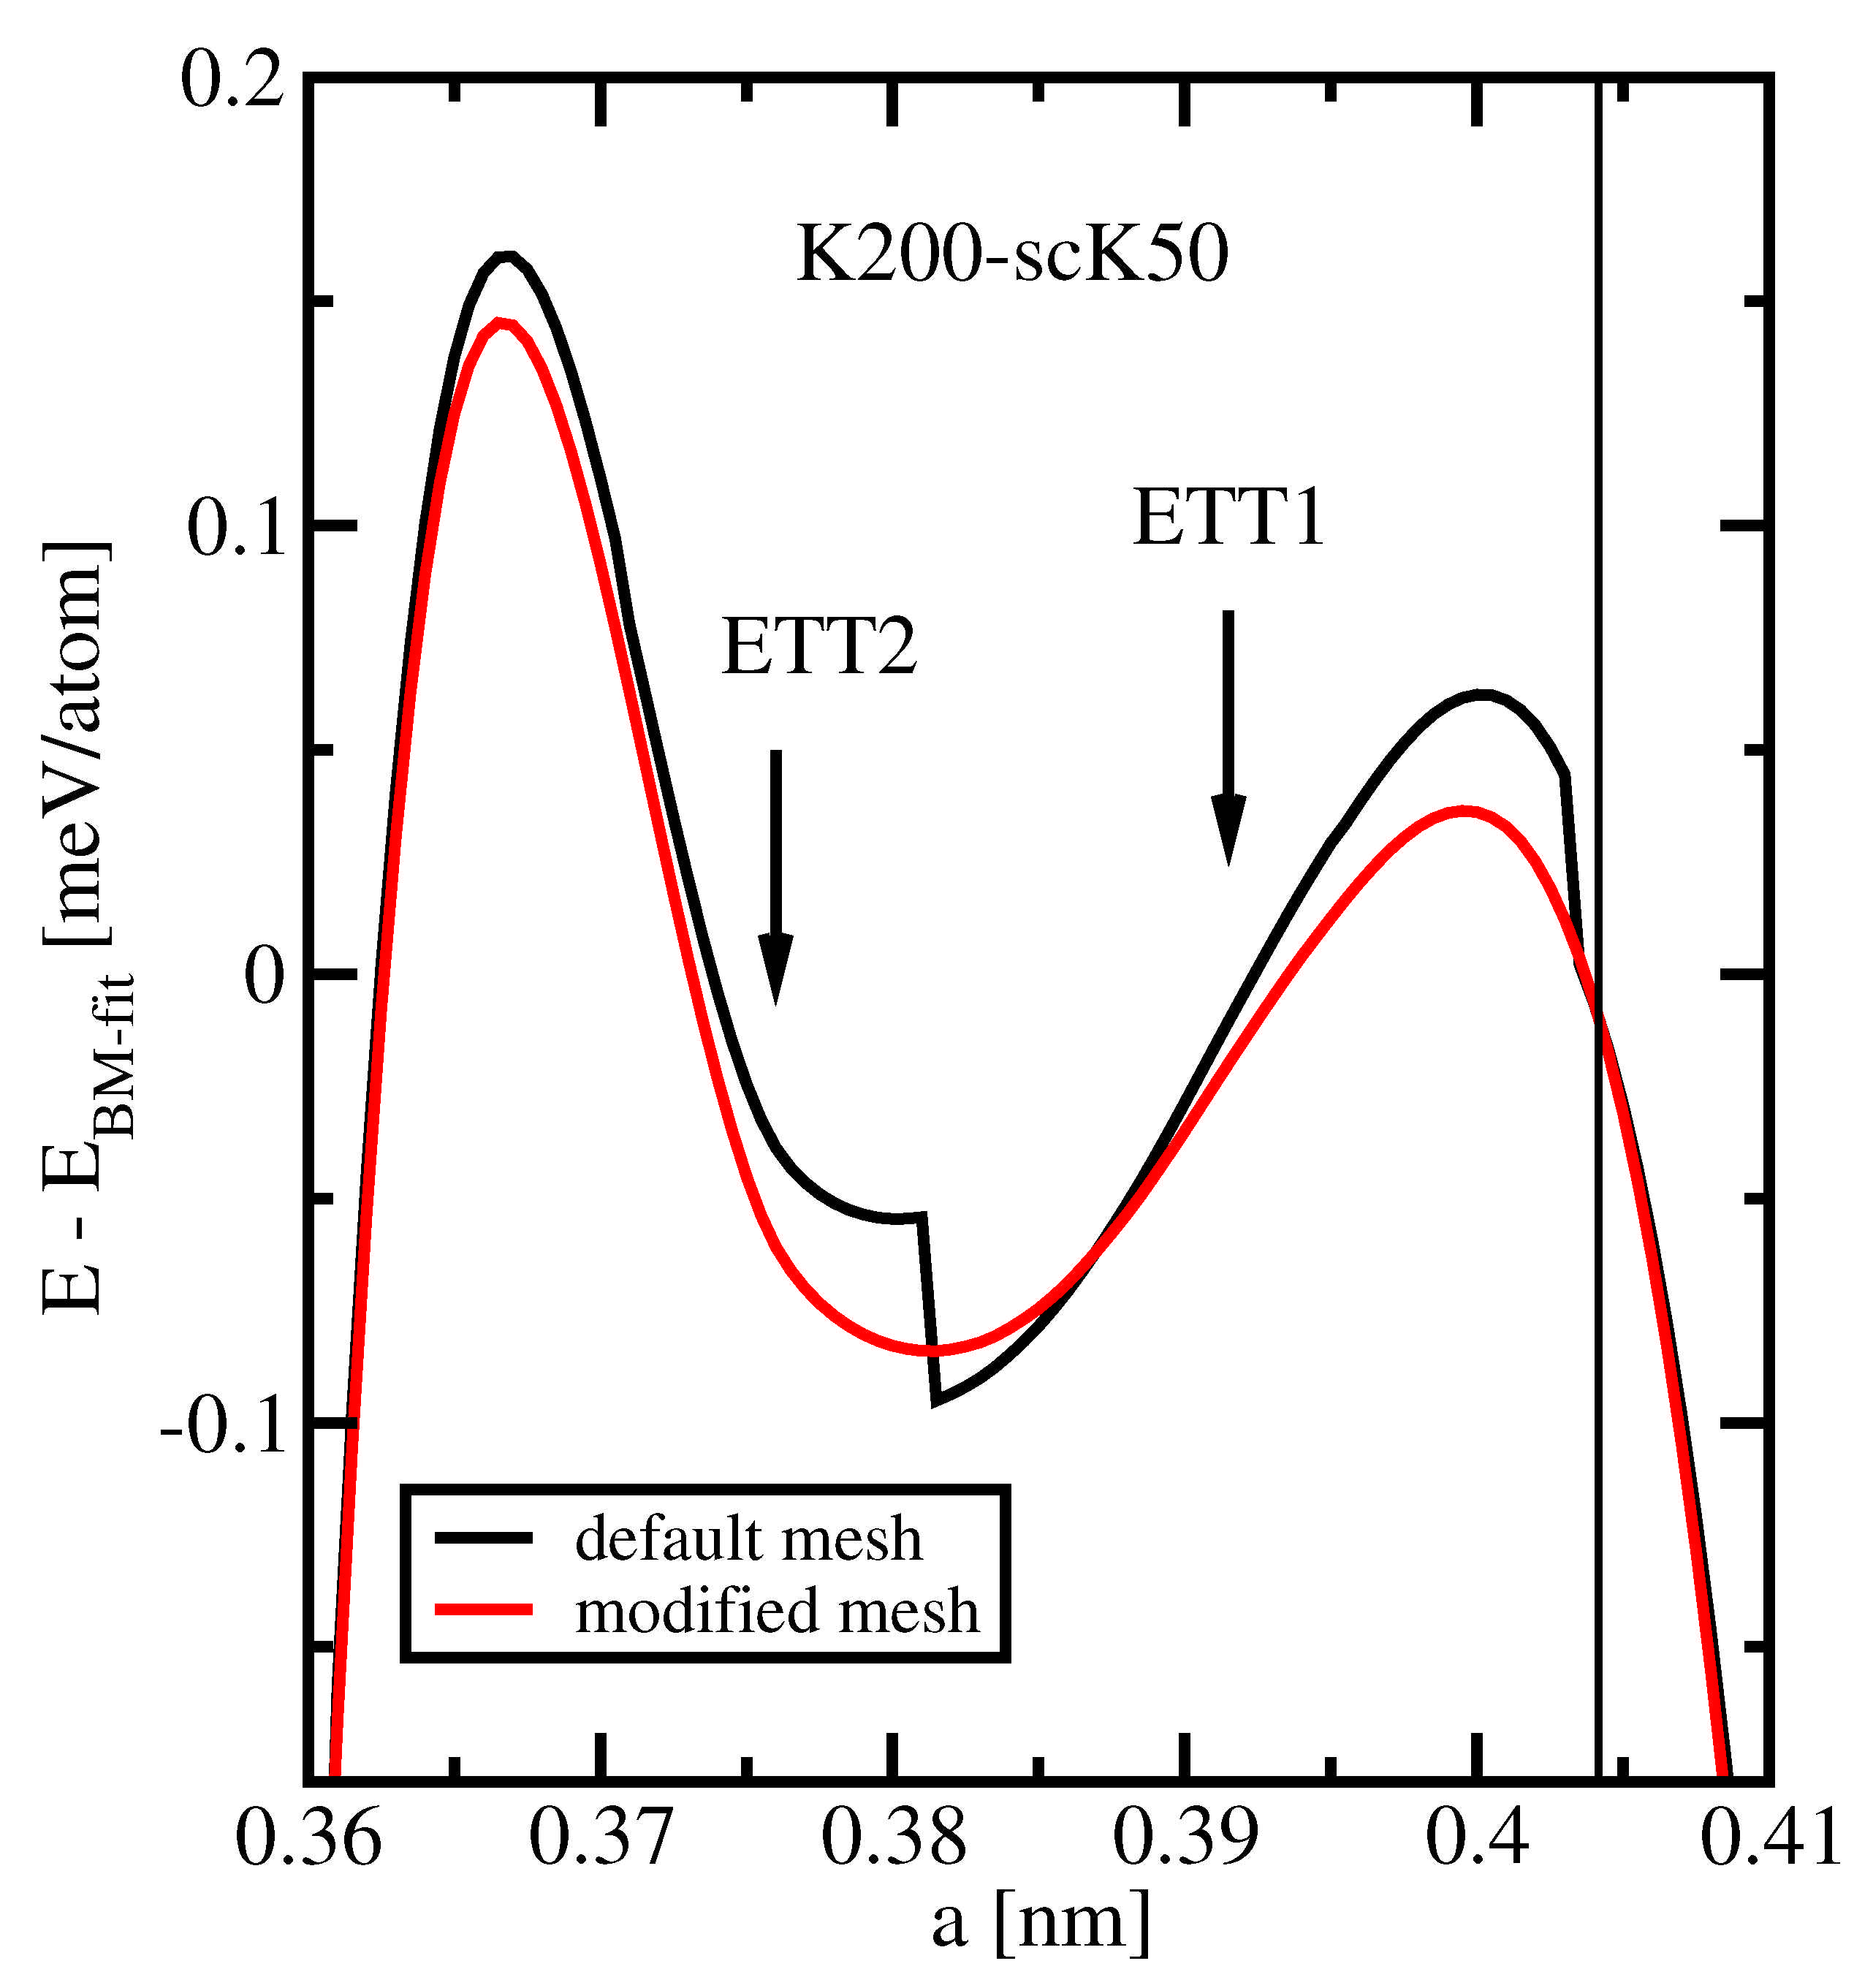
Figure 5 compares the results of this procedure when applied to two FPLO data sets obtained with different treatment of orbital-potential matrix elements. In both cases, the rather dense
k-mesh K200-scK50 and default settings concerning all other parameters were used. The black and red curves present the lattice parameter dependences of the difference
obtained with default and modified integration meshes for the orbital-potential matrix elements, respectively. Along the whole range of considered lattice parameters, these energy differences amount to less than
parts of the total energy.
The general behavior of both curves is typical of a fourth-order polynomial, as expected for the residual of a third-order fit. However, the black curve exhibits two well-visible discontinuities at nm and nm, as well as another, barely visible one at nm. The energy residual jumps at these lattice parameter values by less than 0.05 meV, which is about two orders of magnitude smaller than the energy variations usually encountered. Hence, these discontinuities are not visible in most presentations. They are, moreover, not important in most applications. In the present study, however, they are essential.
A possible idea would be to relate the discontinuities in
to Lifshitz transitions. However, the two ETTs identified in
Section 3.1 occur at other lattice parameters, were no singularity in
is visible in
Figure 5. The true origin of these discontinuities lies in a time-saving approximation in the evaluation of the orbital-potential matrix elements. This numerical integration is performed on a three-dimensional grid, which combines a radial mesh with angular meshes at each of the radial points. In FPLO, computing time is saved by using angular meshes with lower density for smaller radii. Since, the transition from smaller to larger meshes with varying radius happens at reasonably chosen fixed distances from the nuclei, the number of grid points changes with varying lattice parameter, resulting in the observed discontinuities.
The remedy is to choose the most dense angular mesh at all radii, which increases the CPU time only by about 10%. This modification has been applied to compute the data shown in the red curve of
Figure 5. There, no visible deviation from a smooth behavior is observed and the noise level is well below 0.01 meV. For this reason, we used the modified mesh for the evaluation of the orbital-potential matrix elements for all calculations presented in this work, except for the default data in
Figure 5.
Finally, we remark that such small precision-related effects in the total energy as visualized in
Figure 5 can only be detected by considering the difference between total energy and a Birch-Murnaghan or another appropriate polynomial fit. The parameter values of the Birch-Murnaghan fits used here are given in
Table 3. They are equivalent to each other, i.e., the precision of these parameters is not reduced by applying the default integration mesh instead of the modified one as long as the fit is performed with a large enough number of data points.
3.4. Comparison of Total Energies
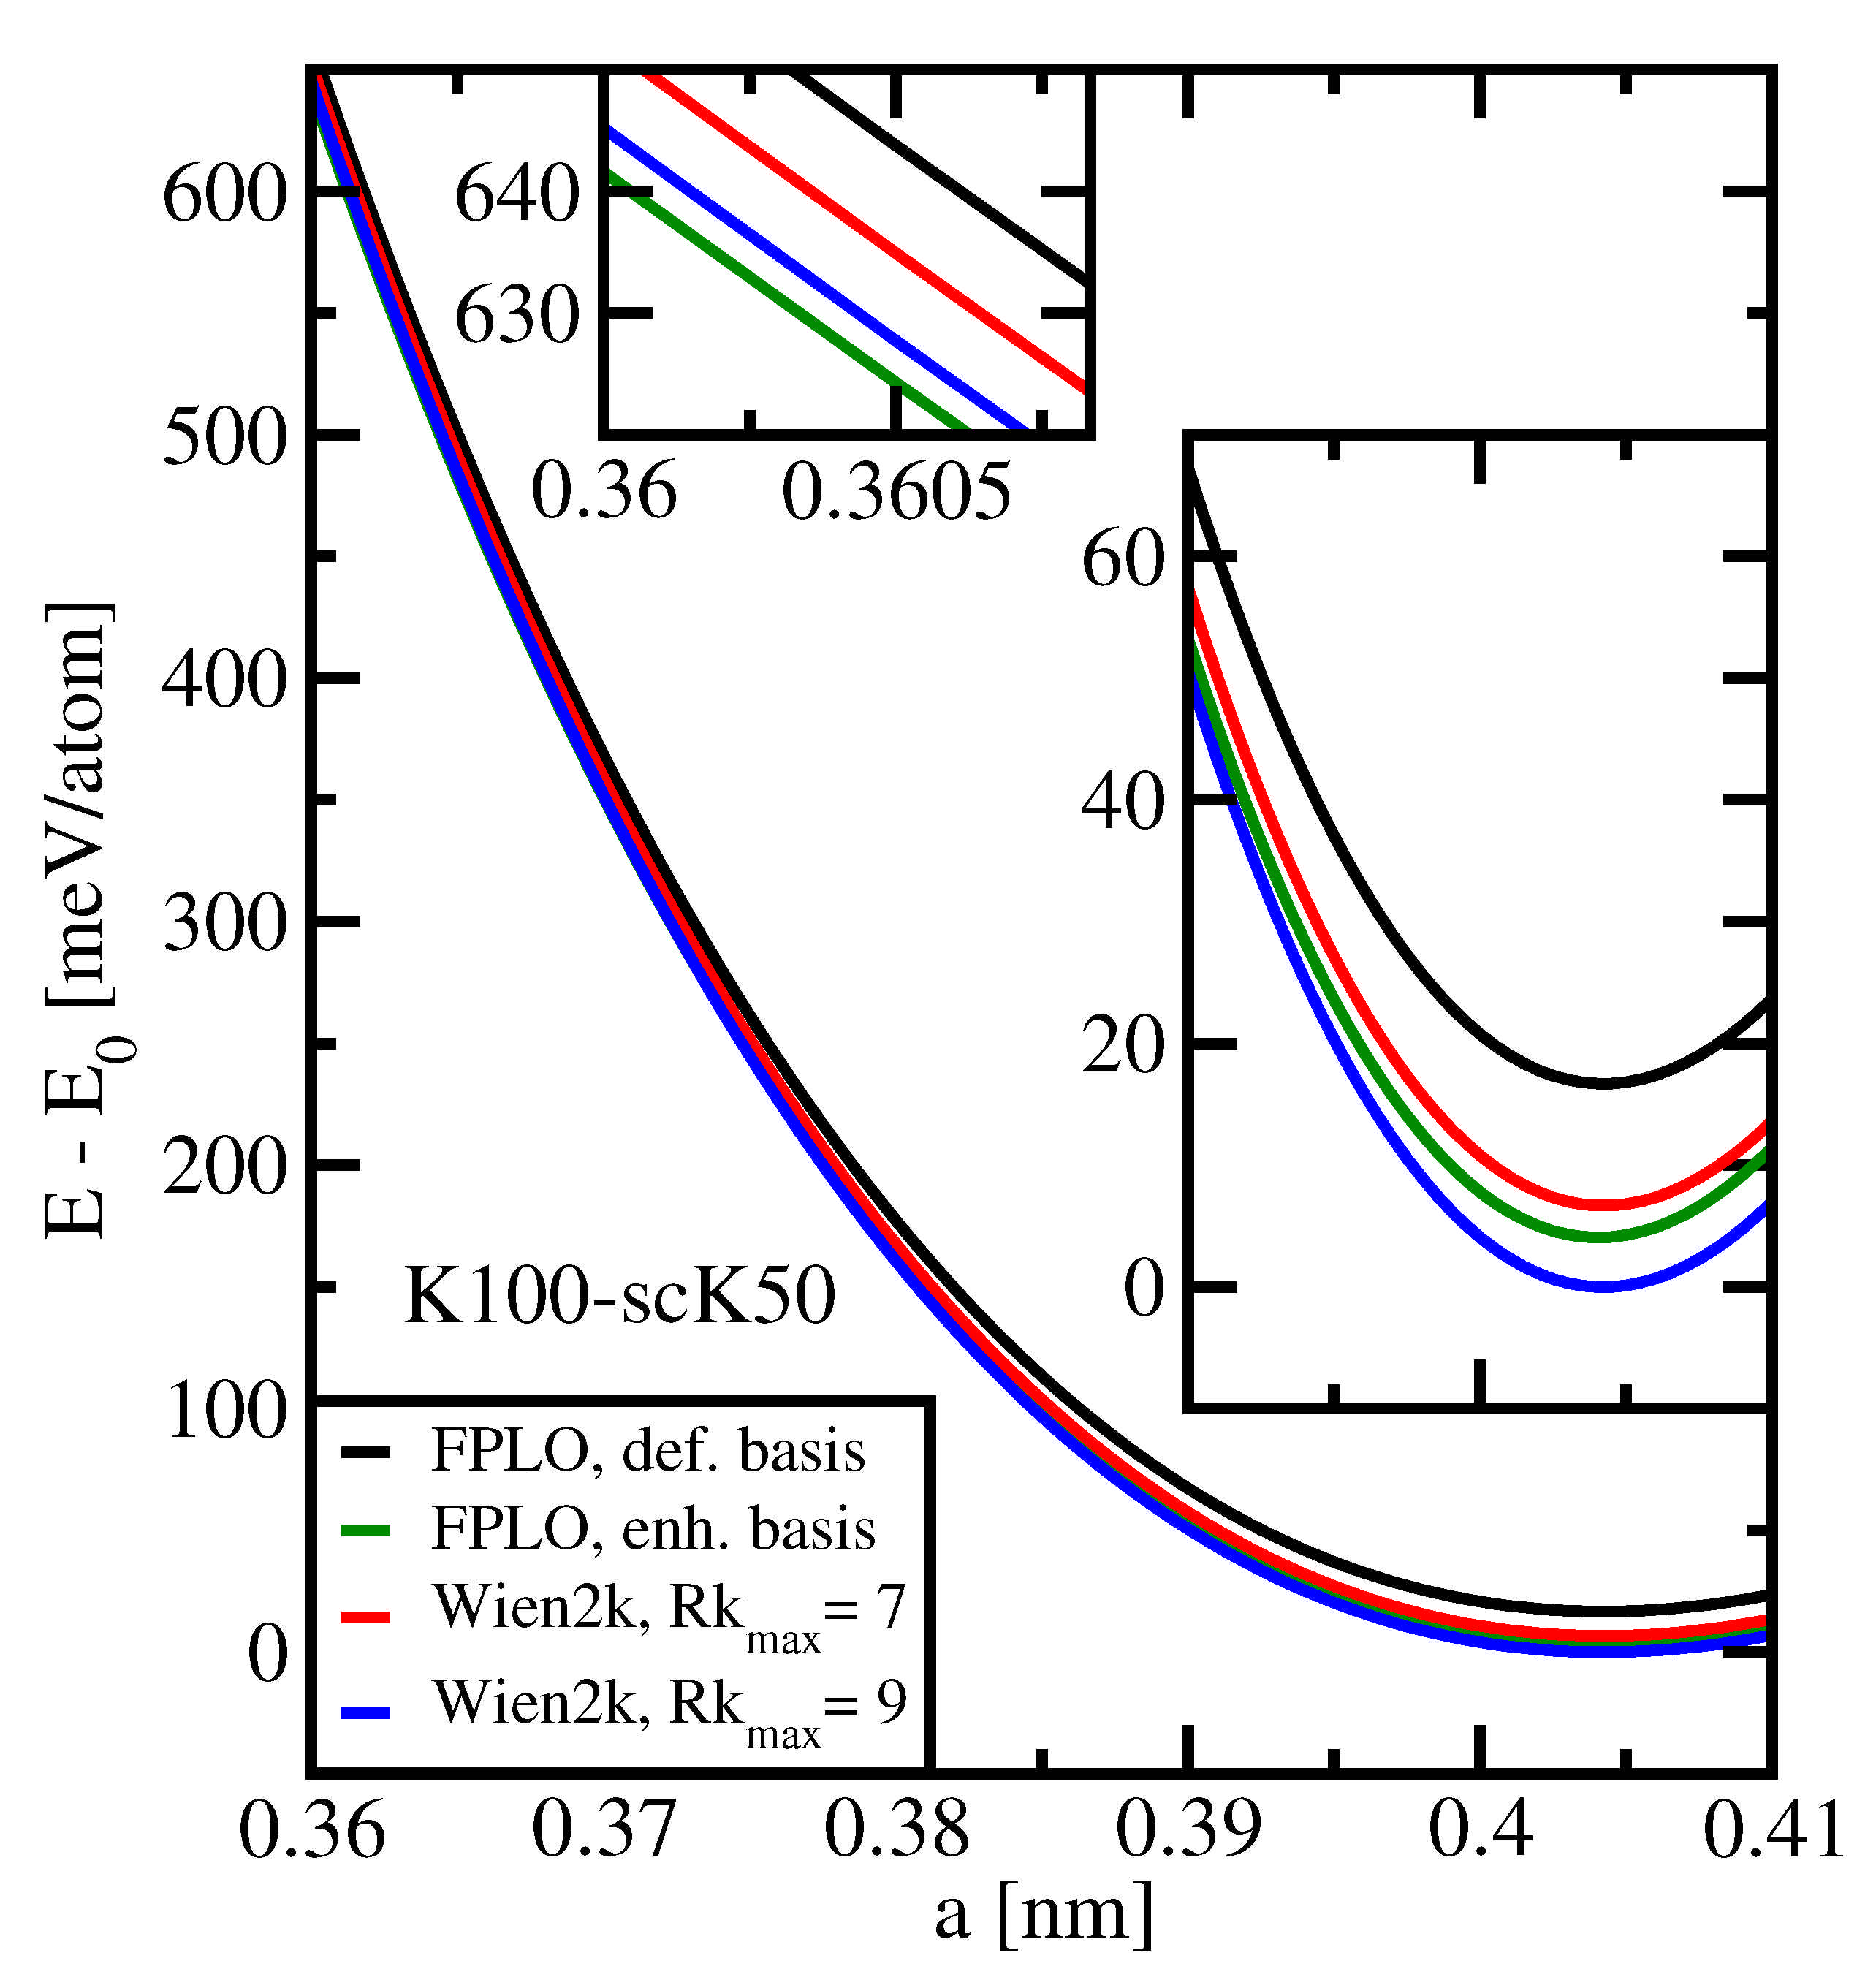
We now compare the accuracies reached by the Wien2k and FPLO codes. This will be done by considering the equation of state for two different basis sets of each code.
Figure 6 shows results obtained with default basis sets (Wien2k:
= 7; FPLO: local states
) and with basis sets for enhanced accuracy (Wien2k:
= 9; FPLO: local states
). For the Wien2k code, the enhanced basis set was defined according to the precision considerations in
Section 3.2; for the FPLO code, the enhanced basis set as defined in the appendix to Ref. [
1] was used. We remark that the
settings for Wien2k in the mentioned reference were 6.5 for default and 10.0 for enhanced accuracy calculations [
1].
We learn from
Figure 6 that the characterization of Wien2k as a highly accurate code is once more confirmed. For the default settings, the ground-state energy obtained by FPLO is about 10 meV per atom above the corresponding value obtained by the Wien2k code; considering the enhanced settings, this difference is reduced to about 4 meV per atom. At lattice spacings much smaller than the equilibrium spacings, the order is, however, reversed for the enhanced settings: the FPLO energy is found to be about 4 meV below the Wien2k value (see upper inset). A larger value of
, which could be chosen at the price of reduced precision, would not change this picture, since it would reduce the total energy by merely 0.5 meV compared with the value for
. We remark that the different sequences of the total energy values obtained by Wien2k and FPLO for equilibrium spacing, on the one hand, and for much smaller values of
a, on the other hand, are not very surprising: DFT codes are usually optimized to achieve high accuracy close to the equilibrium state. For the case of high pressure, numerical settings may have to be adapted specifically.
Table 4 presents a comparison of the parameter values obtained by means of Birch-Murnaghan fits to all four data sets. These fits yield virtually the same results:
nm, bulk modulus
GPa, and its pressure derivative
.
It is very remarkable that two completely independent codes yield total energies with an absolute difference of less than 5 meV and a relative difference of less than 10−6 along the whole range of lattice parameters. These findings confirms the reliability of both codes because the probability of accidental error compensation is extremely low. Note finally that Aluminium is usually considered to be a nearly-free-electron metal. Thus, it is expected to be best described by plane-wave related methods. The above results prove that, even in this case, a local orbital based code achieves almost the celebrated accuracy of an augmented plane wave code.
We would like to conclude this evaluation of accuracies with a comparison of the related numerical efforts. One anticipates that a better accuracy requires a larger effort. This expectation is indeed confirmed by the typical computation times presented in
Table 5. We observed that, as a rough estimate, the Wien2k calculations consume about one order of magnitude more CPU resources than the FPLO calculations. This difference originates mainly from the following: Wien2k uses about twice as many basis functions as contained in the enhanced basis of FPLO.
3.5. Search for ETTs by Means of Total Energy Derivatives
In
Section 3.1, carefully inspecting the lattice parameter dependence of the density of states at the Fermi level, we detected three Lifshitz transitions. Two of them, termed ETT1 and ETT2, are clearly visible in
, see
Figure 1, provided the
k-mesh is K100 or better; another one, ETT0, is hardly visible. Close to a three-dimensional ETT related to the bottom of a band at
, the total energy contains a contribution proportional to
[
15]. In other situations, the sign can be changed. Assume linear dependence of
on
a close to the transition. Consequently, the ETT should be signaled by a divergence of the third derivative
.
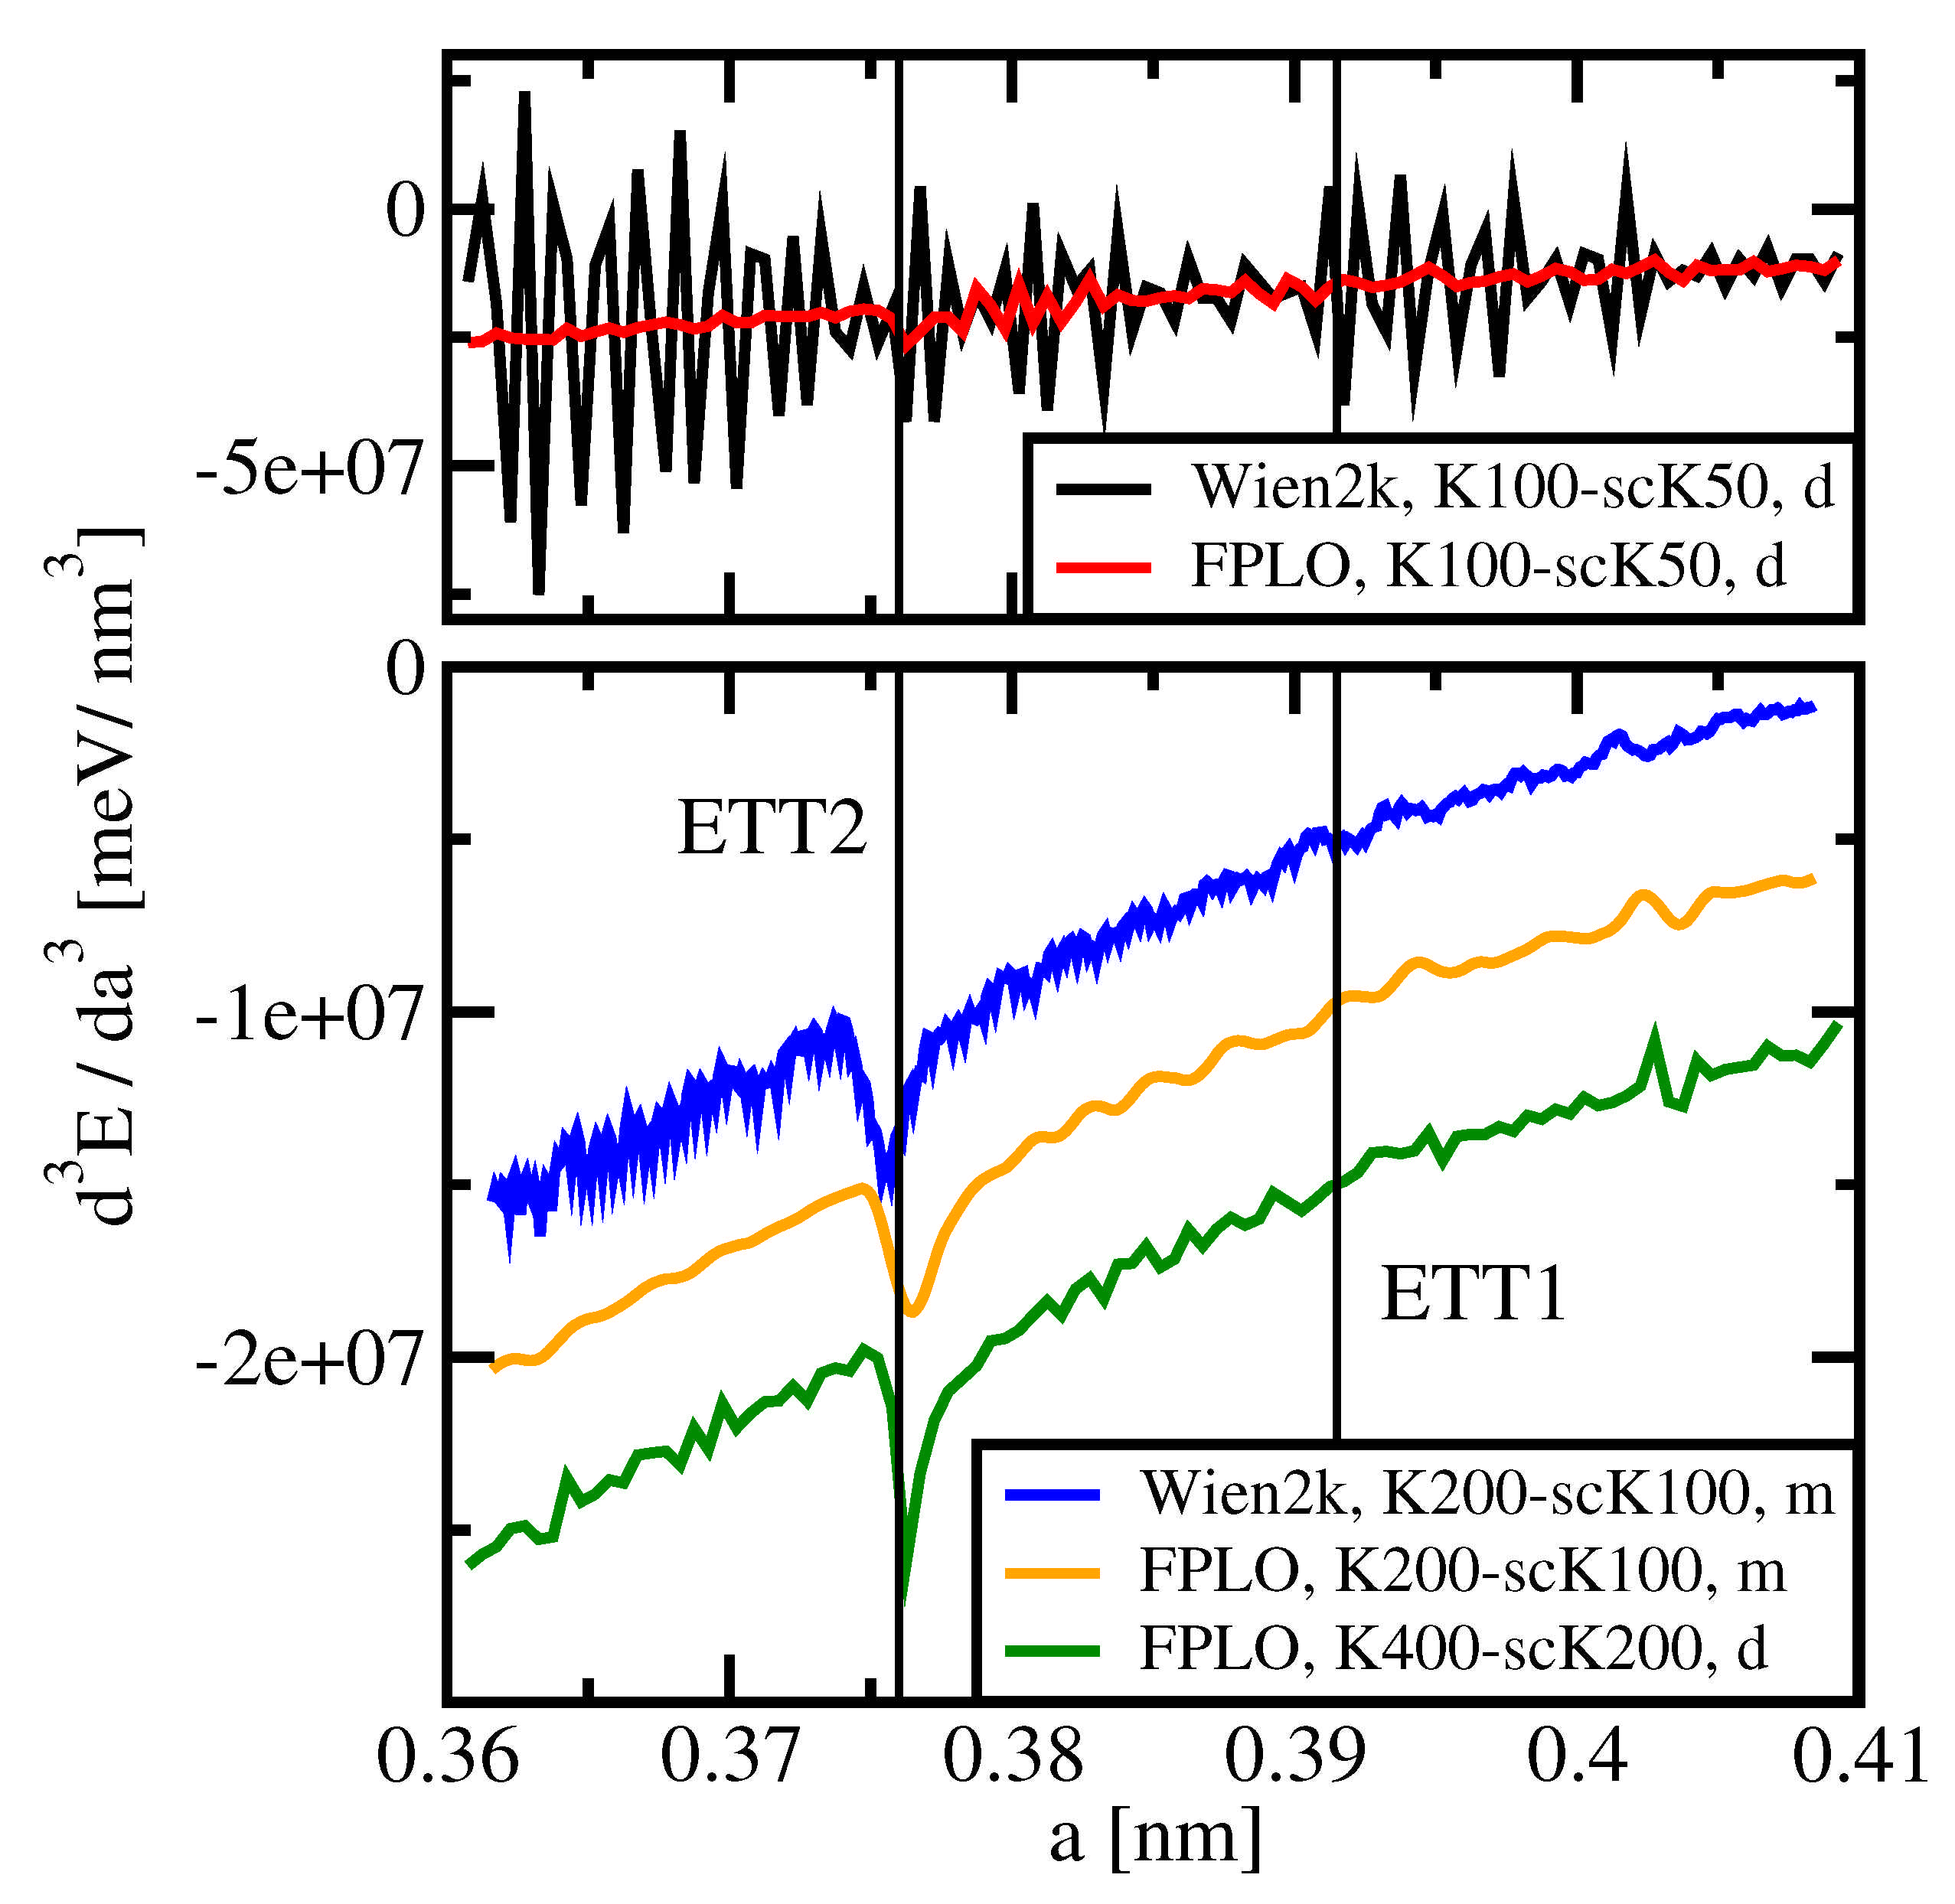
We now ask whether the respective optimum total energy precision of Wien2k and FPLO is sufficient for the identification of such divergences. The upper panel of
Figure 7 shows
vs.
a as obtained by means of both codes with K100-scK50 and subsequent direct numerical differentiation (d). In both cases, the step size of
a was set to
nm. Despite the use of rather dense
k-meshes and although the settings of both codes were optimized with respect to low numerical noise, there is no sign of a divergence visible in the upper panel data close to any of the expected critical lattice parameters, which are indicated by vertical lines.
The fluctuations of the Wien2k data (black curve) are considerably stronger than those of the FPLO data (red), which points to a better precision of the latter. We remark that FPLO data generated with enhanced basis set as described in
Section 3.4 (not included in
Figure 7) exhibit up to four times stronger noise of
than data obtained using the default basis (red curve).
The lower panel of
Figure 7 shows data obtained for the setting K200-scK100 using yet denser
k-meshes than above (blue, Wien2k and orange, FPLO), and for K400-scK200 (green, FPLO). The two former data sets were computed by using a moving window differentiation (m) with 33 equidistant data points (distance 0.0001 nm). In this way, a clear singularity is seen at the expected position of ETT2, which is yet more pronounced in the FPLO K400-scK200 data set which was obtained by direct evaluation of the derivative (distance 0.0005 nm). On the one hand, the moving window differentiation reduces the numerical noise considerably; on the other hand, it broadens the singularity which is more pronounced in the latter data. Note that the individual data are offset against each other as detailed in the figure caption.
None of the presented data sets shows any peculiarity exceeding numerical fluctuations at the position of ETT1 or of ETT0. We remind that the root-like singularities in
caused by ETT0 and ETT1 are less strong than that one caused by ETT2, see
Figure 1. This difference may result from the differing natures of the respective topological changes: ETT0 and ETT1 are the opening and the closing of connections between Fermi surface parts, whereas ETT2 is the vanishing of an isolated part of the Fermi surface, see
Figure 2.
To conclude this section, we have shown that an electronic topological transition can in principle be detected in a higher derivative of the total energy. To this end an extreme precision is required, such that the total energy curve appears very smooth as compared to usual code applications. Our calculations have shown that ETT2 is indeed visible as a singularity in
, whereas we could not detect the other ETT in this way. The other kinks observed are not related to topological transitions. In consequence, the total energy is not suited to detect such transitions. This implies that similar analyses of experimental data, which have a naturally lower precision than a highly tuned computer code, will be challenging. These strict statements, however, do no longer hold if the ETT is of lower than three-dimensional nature, in which case the transition can become first order and more easily detectable [
16]. The differentiation procedures used here are very sensitive and might be helpful both in detecting first or second order phase transitions or in disproving their existence, such as in the case of
-Zirconium. There, contrary to earlier claims, no evidence for isostructural phase transitions was recently found [
17].
3.6. Birch-Murnaghan Fits Using Minimum Number of Data Points
We have shown in
Section 3.1 that the calculation of the equilibrium lattice constant is well converged already for moderately large
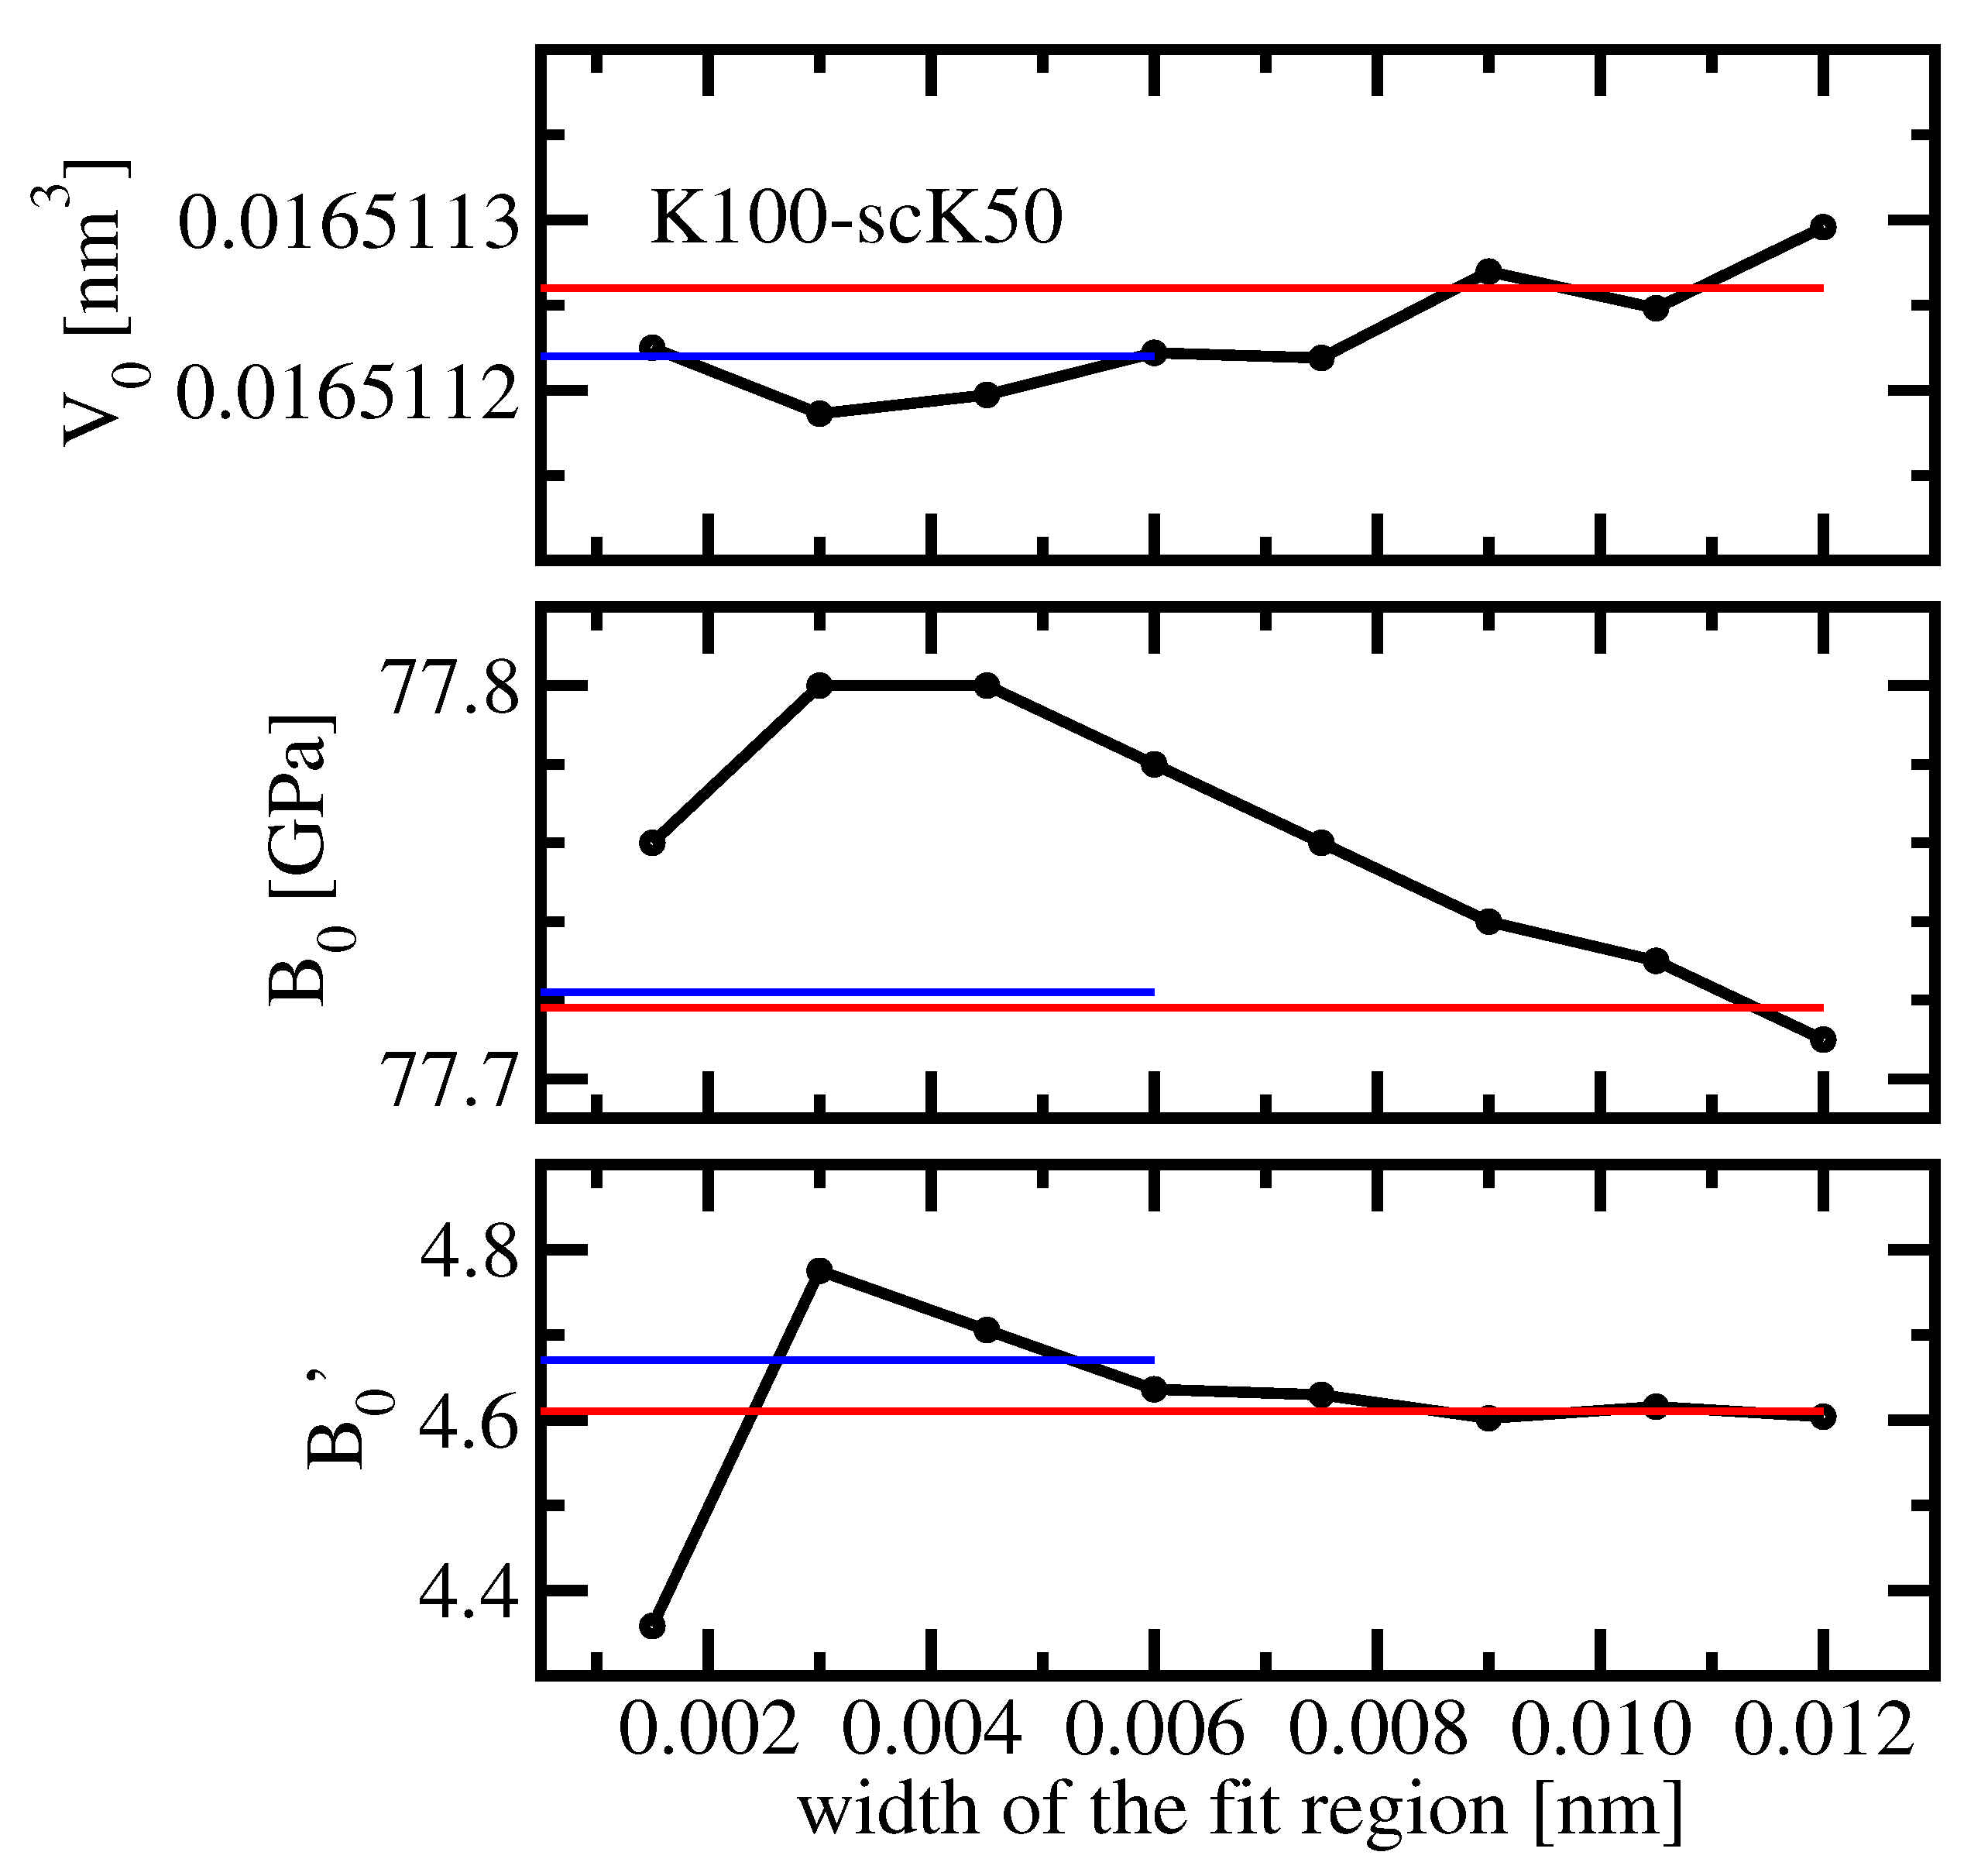
k-meshes. Now, we would like to find out whether it is possible to utilize precise total energy data for evaluating the equilibrium volume, the bulk modulus, and its pressure-derivative with the minimum number of data points needed. For this aim, third-order Birch-Murnaghan fits were performed with only four total energy values obtained using FPLO with K100-scK50 setting. The equidistant fit points are distributed within a fit region of
nm around the equilibrium lattice parameter.
Figure 8 shows results for the three experimentally accessible fit parameters vs. the width of the fit region. For comparison, the results of two Birch-Murnaghan fits to 25 and 13 data points, respectively, are shown as well. As expected from the results presented in
Table 2, the equilibrium volume is almost independent of the width of the fit region. Furthermore, the variation of the bulk modulus, 0.1 GPa within the considered range, is negligible. Only the value of
seems to be unstable if the fit region is chosen smaller than
nm. This observation is consistent with the fact that the stability of numerical derivatives worsens with their order increasing.
The possibility to use a minimum number of precise data points to numerically evaluate quantities derived from the total energy can be useful e.g., for screening studies. However, this chance comes at the price of a sufficiently dense k-mesh. As long as specific effects of band structure or DOS, such as ETTs, Weyl points or magnetic instabilities, are not important, it can be useful to apply broadening techniques with a less dense k-mesh. They offer the advantages to reduce the related effort and to smoothen the self-consistent iteration.
4. Summary
Electronic structure calculation packages such as the famous Wien2k code, developed and maintained by Karlheinz Schwarz and his group for decades, are meanwhile indispensable tools for the interpretation of experimental data as well as for the prediction of materials properties. In the latter case, there is no standard to gauge the result but by other codes.
Doing so, we have confirmed the classification of Wien2k as the “gold standard” concerning total energy accuracy. This high numerical accuracy is achieved, as in the case of similar codes [
1], by using a large and elaborated basis set for the representation of the Bloch wave function. The FPLO code, taken in this study for comparison, uses a smaller basis set. In consequence, it can only reach slightly lower total energy accuracy than Wien2k, but it has the advantage of considerably smaller numerical effort.
Either of the two compared codes allows for the detection of one of the known electronic topological transitions of Aluminium under pressure by appropriate evaluation of . The other two discussed ETT, which are of different topological nature than the former one, are only visible in the density of states and in the Fermi surface. A surprising finding is the high total energy precision of FPLO, demonstrated by comparing with related Wien2k data.
The total energy precision can be improved in both codes by refining the k-mesh. While this behavior is expected, further strong improvements of the numerical precision are obtained in the case of Wien2k by optimizing the value of and in the case of FPLO by modifying a real-space integration mesh. Thus, it also became possible to perform meaningful third-order Birch-Murnaghan fits to the minimum number of four data points of the obtained very precise .
Concerning both codes, a counterintuitive finding has to be mentioned: tuning the respective basis sets toward optimum numerical accuracy results in a reduced numerical precision. This feature presumably originates from incipient linear dependence of the basis functions.
Finally, we note that our approach to quantify the numerical precision by means of total energy derivatives is not only applicable to the two codes considered in the present study, but can easily be extended to other methods.


