Article

Profiling Organizational AI Readiness in Thailand’s Logistics Industry Using TOE–UTAUT Features, Clustering Analysis, and Explainable Machine Learning

by
Wipada Sriwichien
,
Warawut Narkbunnum
and
Kittipol Wisaeng
*
Mahasarakham Business School, Mahasarakham University, Mahasarakham 44150, Thailand
*
Author to whom correspondence should be addressed.
Information 2026, 17(7), 672; https://doi.org/10.3390/info17070672
Submission received: 24 June 2026 / Revised: 7 July 2026 / Accepted: 8 July 2026 / Published: 10 July 2026

Abstract

Artificial intelligence (AI) adoption within logistics organizations remains uneven despite increasing digital transformation initiatives in emerging economies. This study investigates respondent-perceived organizational AI readiness profiles in Thailand’s logistics industry using an integrated analytical framework combining TOE–UTAUT predictors, clustering analysis, supervised machine learning, and explainable artificial intelligence techniques. Data were collected from 520 logistics and supply chain professionals in Thailand using a structured questionnaire. K-means clustering was applied to identify internally derived respondent-perceived AI readiness profiles, while Random Forest, Support Vector Machine (SVM), XGBoost, and LightGBM models were developed to classify readiness-profile membership. A weighted voting ensemble model was additionally employed to assess classification robustness and profile-differentiation stability across multiple learning algorithms. The findings identified three internally derived respondent-perceived AI readiness profiles representing relatively low, moderate, and advanced readiness patterns within the TOE–UTAUT feature space. Among the evaluated models, the SVM classifier achieved the strongest classification performance, obtaining the highest accuracy and AUC values. SHAP analysis indicated that Actual Use, Technological Factors, Facilitating Conditions, and Behavioral Intention exhibited the largest feature-attribution contributions within the readiness-profile classification framework. The study contributes to AI adoption research by integrating clustering-based segmentation, machine-learning classification, and explainable artificial intelligence into a unified readiness-profiling framework. The findings provide practical insights for managers and policymakers seeking to understand respondent-perceived organizational AI readiness patterns and support digital transformation initiatives within logistics professional contexts.

1. Introduction

Artificial intelligence (AI) technologies are increasingly reshaping logistics and supply chain operations by supporting data-driven decision-making, operational automation, and intelligent process optimization. AI-driven applications such as profiling analytics, route optimization, warehouse automation, demand forecasting, and real-time monitoring systems are becoming increasingly important for improving operational efficiency, reducing transportation costs, enhancing delivery accuracy, and strengthening supply chain responsiveness [1,2]. The rapid growth of e-commerce, rising customer expectations for fast and reliable delivery, and the broader transition toward Industry 4.0 have accelerated the adoption of AI technologies across logistics environments worldwide [3,4]. Consequently, logistics organizations are under growing pressure to strengthen digital capability and integrate AI technologies to remain competitive in increasingly dynamic and uncertain markets [5].
Thailand’s logistics industry represents a strategically important sector supporting national trade, manufacturing, tourism, and regional economic integration within the Association of Southeast Asian Nations (ASEAN). Under the Thailand 4.0 initiative, the Thai government has actively promoted digital transformation and AI implementation across industrial and logistics sectors [6,7]. However, AI adoption within Thailand’s logistics industry remains uneven. While some organizations demonstrate advanced digital readiness and AI implementation capability, others continue to face significant challenges related to technological infrastructure, organizational capability, employee competency, implementation cost, cybersecurity concerns, and uncertainty regarding investment outcomes [8,9]. These disparities indicate that logistics organizations do not adopt AI technologies uniformly and may exhibit heterogeneous AI readiness profiles and adoption readiness characteristics. Thailand therefore represents a particularly relevant context for investigating respondent-perceived organizational AI readiness because respondents may perceive varying levels of digital readiness, resource availability, and technological capability despite national digital transformation support.
Previous studies have extensively examined technology adoption and AI implementation using explanatory approaches such as regression analysis and structural equation modeling [10,11]. Although these approaches provide important theoretical insights regarding technology acceptance behavior, they may be limited in their ability to identify hidden organizational adoption groups, classify heterogeneous AI readiness patterns, and capture nonlinear relationships associated with organizational AI implementation [12]. Despite the growing body of research on AI adoption, several important limitations remain. First, existing studies have predominantly employed explanatory frameworks such as TOE and UTAUT to examine factors associated with technology adoption, often assuming relatively homogeneous adoption behavior across organizations [13,14]. Consequently, limited attention has been given to identifying heterogeneous AI readiness conditions among organizations operating within the same industrial environment [15]. Second, although clustering and machine-learning approaches have increasingly been applied in digital transformation and technology analytics research, these methods are rarely integrated with established technology-adoption theories to examine AI readiness profiles [16]. Existing studies typically focus either on theoretical explanation without profiling capability or on classification performance without strong theoretical grounding.
Third, explainable artificial intelligence techniques such as SHAP have received growing attention in machine learning research; however, their application to AI readiness profiling remains limited [17]. As a result, the contribution patterns of technological, organizational, environmental, and behavioral dimensions to readiness-profile differentiation remain insufficiently understood.
Collectively, these limitations suggest a need for an integrated analytical framework capable of identifying heterogeneous AI readiness profiles, differentiating profile membership using theory-informed features, and providing transparent interpretation of feature-attribution patterns.
To address the above research gaps, this study integrates the Technology–Organization–Environment (TOE) framework and the Unified Theory of Acceptance and Use of Technology (UTAUT) as theory-informed feature representations for AI readiness profiling. The TOE framework captures technological readiness, organizational capability, and environmental conditions associated with technology implementation [18], while UTAUT explains behavioral acceptance dimensions, including performance expectancy, effort expectancy, facilitating conditions, behavioral intention, and actual use [19]. The integration of TOE and UTAUT is considered appropriate because the respondent-perceived organizational AI adoption readiness profile involves both institutional readiness conditions and behavioral acceptance mechanisms. In this study, TOE and UTAUT constructs are operationalized as theory-informed predictors representing organizational and behavioral dimensions associated with AI adoption readiness profiles rather than as a causal structural model. Given these research gaps and industrial challenges, this study proposes a two-stage explainable machine learning framework for classifying AI adoption readiness profiles within Thailand’s logistics industry. First, K-means clustering analysis is employed to generate a respondent-perceived AI readiness profile consisting of relatively low, moderate, and advanced readiness patterns. Second, supervised machine learning techniques are used to classify these internally derived readiness profiles using TOE–UTAUT predictors. Random Forest, Support Vector Machine (SVM), XGBoost, and LightGBM are comparatively evaluated, while a weighted voting ensemble framework is incorporated to assess predictive robustness and model stability across multiple classifiers. SHAP analysis is subsequently applied to improve interpretability and identify the most influential predictors contributing to AI adoption readiness profile classification outcomes.
This study makes three contributions to AI adoption and information systems research. First, it reconceptualizes AI adoption as a readiness-profiling problem rather than a single behavioral outcome. By identifying heterogeneous respondent-perceived organizational AI readiness profiles among logistics and supply chain professionals, the study provides a profiling perspective that captures variation in organizational readiness conditions and highlights the multidimensional nature of AI adoption readiness within logistics environments. Second, the study demonstrates how TOE–UTAUT dimensions can be operationalized as theory-informed feature representations for readiness-profile differentiation and classification rather than solely as constructs within conventional causal hypothesis-testing models. This perspective illustrates how established technology-adoption theories can support data-driven profiling analytics while maintaining theoretical grounding. Third, the study develops an integrated readiness-profiling framework that combines K-means clustering, supervised machine-learning classification, and SHAP-based explainability analysis. The framework enables internally derived readiness profiles to be identified, differentiated, and interpreted within a transparent analytical environment. Rather than serving as a predictive model of externally validated adoption outcomes, the framework provides interpretable evidence regarding how organizational, technological, environmental, and behavioral dimensions contribute to readiness-profile differentiation. Collectively, these contributions provide a theory-informed and analytically transparent approach for examining respondent-perceived organizational AI readiness within Thailand’s logistics industry. The objectives of this study are as follows:
  • To examine the role of TOE and UTAUT constructs in differentiating perceived organizational AI readiness within Thailand’s logistics industry.
  • To use TOE–UTAUT constructs as theory-informed predictors for classifying AI readiness profiles.
  • To identify perceived organizational AI readiness patterns using clustering analysis.
  • To develop and compare machine learning classification models for differentiating internally derived AI readiness profiles.
  • To develop a weighted voting ensemble framework to assess classification robustness and model stability.
  • To analyze the relative importance of TOE and UTAUT predictors in differentiating AI readiness profiles using explainable machine learning techniques.

2. Literature Review

2.1. Artificial Intelligence Adoption in Logistics Environments

Artificial intelligence (AI) technologies are increasingly transforming logistics and supply chain operations by enabling data-driven decision-making, intelligent automation, profiling analytics, and real-time operational coordination. AI-driven applications such as demand forecasting, route optimization, warehouse automation, classification maintenance, and intelligent transportation systems are increasingly used to improve logistics efficiency, reduce operational costs, enhance delivery responsiveness, and strengthen supply chain resilience [20,21]. The rapid growth of e-commerce, increasing operational complexity, and the broader transition toward Industry 4.0 have accelerated organizational interest in AI implementation across logistics environments [22].
Despite increasing AI investment, respondent-perceived AI readiness profiles remain highly heterogeneous. Some logistics organizations demonstrate advanced digital readiness and strong AI implementation capability, whereas others continue to experience substantial barriers related to technological infrastructure, organizational capability, implementation cost, employee competency, cybersecurity concerns, and uncertainty regarding investment outcomes [23,24]. These differences indicate that AI adoption should not be interpreted as a homogeneous organizational phenomenon. Instead, logistics organizations may exhibit substantially different AI readiness profiles and adoption readiness profile characteristics despite operating within similar industrial contexts.
This issue is particularly relevant within emerging economy logistics environments such as Thailand, where organizations operate under unequal levels of digital infrastructure, organizational readiness, financial resources, and technological capability despite national digital transformation initiatives [25]. Consequently, AI adoption readiness profile analysis within Thailand’s logistics industry requires analytical approaches capable of identifying heterogeneous respondent-perceived organizational readiness patterns rather than assuming relatively uniform readiness perceptions across respondents and organizational contexts.
Previous studies examining AI adoption and technology implementation have primarily relied on explanatory approaches such as regression analysis and structural equation modeling [26,27]. Although these approaches provide valuable theoretical insights regarding technology acceptance and adoption determinants, they may be limited in their ability to identify hidden organizational adoption groups, classify heterogeneous readiness profiles, and capture nonlinear relationships associated with AI implementation behavior [28]. In organizational environments where technological, organizational, environmental, and behavioral factors interact simultaneously, segmentation-oriented and classification analytical approaches may provide additional insights beyond conventional explanatory adoption models.

2.2. TOE–UTAUT as Theory-Informed Predictors of AI Adoption Readiness Profile

The Technology–Organization–Environment (TOE) framework and the Unified Theory of Acceptance and Use of Technology (UTAUT) are among the most widely adopted theoretical perspectives in technology adoption research [29,30]. The TOE framework explains organizational technology adoption through three major dimensions consisting of technological readiness, organizational capability, and environmental conditions influencing technology implementation [31]. Previous studies have applied TOE extensively in digital transformation, cloud computing, big data analytics, and AI adoption research because the framework captures institutional and organizational readiness conditions associated with technology implementation capability [11].
In contrast, UTAUT focuses primarily on behavioral acceptance mechanisms influencing technology utilization behavior. The framework proposes that performance expectancy, effort expectancy, social influence, and facilitating conditions significantly influence behavioral intention and actual technology use [32]. UTAUT has been widely applied in information systems, employee technology acceptance, digital platform adoption, and organizational technology utilization studies because it captures user-oriented perceptions and behavioral responses toward technology implementation [33].
Although TOE and UTAUT are frequently applied independently, respondent-perceived AI readiness profiles involve both institutional readiness conditions and behavioral acceptance mechanisms. Organizations with comparable technological infrastructure and organizational resources may still demonstrate substantially different AI readiness profile levels because of variations in employee acceptance, facilitating conditions, behavioral intention, and actual technology utilization behavior [34]. Conversely, positive behavioral acceptance alone may be insufficient when organizational readiness and environmental support remain limited. The combined use of TOE and UTAUT therefore enables a multidimensional representation of respondent-perceived AI readiness profiles by integrating structural readiness conditions with behavioral acceptance characteristics.
Unlike conventional explanatory adoption studies that position TOE and UTAUT within causal structural modeling frameworks, this study operationalizes TOE–UTAUT dimensions as theory-informed classification features associated with AI adoption readiness profile classification. The framework is therefore used to represent organizational and behavioral dimensions contributing to heterogeneous AI readiness profiles rather than to validate causal relationships among latent constructs.

2.3. From Explanatory Adoption Research on Classification AI Adoption Profiling

Most prior AI adoption studies emphasize explanatory relationships among adoption determinants using regression-based or structural equation modeling approaches [35]. These approaches primarily focus on identifying statistically significant relationships between adoption factors and behavioral outcomes. While such approaches contribute important theoretical insights, they may provide limited capability for identifying heterogeneous organizational adoption structures or predicting organizational AI readiness profiles across respondents and organizational contexts with substantially different readiness conditions [36].
Recent developments in profiling analytics and machine learning have expanded analytical possibilities for investigating organizational technology adoption behavior. Unlike explanatory statistical models, machine learning approaches emphasize readiness profile capability, nonlinear pattern recognition, and multidimensional interaction analysis [36]. These characteristics are particularly important in AI adoption environments where organizational readiness, technological capability, and behavioral acceptance dimensions may interact in complex and nonlinear ways.
Among supervised classification approaches, Support Vector Machine (SVM) models have demonstrated strong performance in high-dimensional classification problems because of their capability to identify nonlinear decision boundaries using kernel-based learning mechanisms. Tree-based ensemble approaches such as Random Forest, XGBoost, and LightGBM additionally provide strong classification capability in organizational classification tasks involving nonlinear feature interactions and heterogeneous data structures. Random Forest improves classification stability through bootstrap aggregation mechanisms, whereas boosting-based approaches such as XGBoost and LightGBM iteratively improve classification performance through sequential error optimization processes [37,38].
However, readiness profile alone may not sufficiently identify hidden organizational AI readiness structures. Organizations may exhibit substantially different adoption readiness profile characteristics despite sharing similar industrial environments. Consequently, segmentation-oriented analytical approaches are important for identifying heterogeneous organizational adoption profiles before readiness profile analysis is conducted.

2.4. Clustering Analysis and Respondent-Perceived AI Readiness Profiles Segmentation

Clustering analysis has become increasingly important for identifying hidden respondent-perceived organizational readiness patterns and segmenting respondents into relatively homogeneous readiness-profile groups based on multidimensional TOE-UTAUT characteristics [39]. In respondent-perceived AI readiness profiles research, clustering approaches enable the identification of heterogeneous AI readiness profiles without requiring predefined readiness categories. This capability is particularly relevant within logistics environments where respondents assigned to readiness profiles differ substantially in technological capability, organizational support, digital readiness, and AI implementation readiness profile [40].
Among unsupervised learning approaches, K-means clustering remains one of the most widely applied clustering techniques because of its computational efficiency, scalability, and capability to partition observations into distinct similarity-based groups. Previous studies have applied K-means clustering in organizational segmentation, customer profiling, logistics analytics, and technology adoption research to identify meaningful readiness-profile groups hidden within multidimensional datasets [41].
Importantly, clustering analysis alone cannot predict the membership of respondents within internally derived readiness profile groups. The integration of clustering analysis with supervised machine learning therefore provides methodological advantages for respondent-perceived AI readiness profiles analysis [42]. Clustering analysis supports the identification of heterogeneous organizational AI readiness segments, whereas supervised machine learning enables the readiness profile of these readiness-profile segments using theory-informed TOE–UTAUT predictors. This analytical sequence addresses two important limitations of prior explanatory adoption research: insufficient organizational segmentation capability and limited readiness profile classification analysis.

2.5. Ensemble Learning and SHAP-Based Explainability

Ensemble learning approaches combine predictions generated from multiple classifiers to improve classification robustness and classification stability. Voting-based ensemble frameworks aggregate outputs from several machine learning algorithms using weighted or majority voting mechanisms, thereby reducing dependency on individual classifiers and improving generalization capability across heterogeneous datasets [43]. In respondent-perceived AI readiness profiles analysis, ensemble learning may provide additional robustness because different classifiers may capture distinct nonlinear organizational and behavioral relationships associated with AI readiness profiles [44].
Importantly, the purpose of ensemble learning in this study is not necessarily to outperform the strongest individual classifier but rather to assess classification robustness and classification consistency across multiple learning mechanisms. This distinction is important because respondent-perceived AI readiness profile datasets frequently contain heterogeneous behavioral patterns and nonlinear feature interactions that may be interpreted differently across classification models [45].
Despite the growing application of machine learning techniques in organizational analytics, machine learning models are frequently criticized for operating as black-box classification systems with limited interpretability. Explainable artificial intelligence (XAI) approaches have therefore become increasingly important for improving transparency and understanding how classification models generate classification outcomes [46]. Among XAI approaches, SHAP (SHapley Additive exPlanations) is particularly suitable for respondent-perceived AI readiness profile analysis because it provides both global and local interpretability while maintaining theoretical consistency in feature contribution estimation based on cooperative game theory principles [47].
SHAP analysis enables researchers to identify not only which TOE–UTAUT predictors contribute most strongly to classification outcomes overall, but also how individual organizational and behavioral dimensions contribute to AI adoption readiness profile classification across different organizational profiles. Consequently, SHAP provides an interpretability layer that complements readiness profile analysis by explaining how organizational and behavioral dimensions contribute to AI adoption readiness profile patterns [48].
To synthesize the existing literature more explicitly, Table 1 presents a thematic summary of prior research related to AI adoption, organizational readiness, machine-learning analytics, ensemble learning, and explainable artificial intelligence. Rather than reviewing individual studies separately, the synthesis highlights the principal findings, methodological limitations, and remaining research needs across the literature. The comparison indicates that prior research remains fragmented across explanatory adoption models, organizational readiness studies, machine-learning classification approaches, and explainable artificial intelligence applications. Consequently, there remains a need for an integrated framework capable of identifying heterogeneous AI readiness profiles, differentiating readiness-profile membership using theory-informed feature representations, and providing transparent interpretation of readiness-profile differentiation outcomes.
As summarized in Table 1, prior studies have established the importance of technological, organizational, environmental, and behavioral factors in AI adoption and digital transformation outcomes. However, the literature reveals three key limitations that remain unresolved. First, most studies focus on explaining relationships among adoption factors rather than identifying heterogeneous readiness conditions across organizations. Second, although clustering and machine-learning methods are increasingly used in organizational analytics, they are rarely integrated with established technology-adoption theories for readiness-profile discovery and differentiation. Third, explainable AI techniques such as SHAP remain underutilized, limiting understanding of how organizational and behavioral factors influence readiness-profile differentiation. These limitations are particularly relevant in Thailand’s logistics industry, where organizations operate under varying levels of technological capability, digital infrastructure, organizational readiness, and AI implementation experience. As a result, understanding of respondent-perceived AI readiness profiles remains limited. Consequently, there remains insufficient understanding of how respondent-perceived AI readiness profiles can be identified, differentiated, and interpreted within a theory-informed analytical framework. To address these gaps, this study integrates TOE–UTAUT feature representations, K-means clustering, supervised machine-learning classification, ensemble-learning-based robustness assessment, and SHAP-based explainability analysis to support AI readiness profiling in Thailand’s logistics sector.

2.6. Research Gap and Conceptual Positioning

The literature synthesis presented in Table 1 indicates that prior research has generated important knowledge regarding AI adoption, organizational readiness, machine-learning analytics, and explainable artificial intelligence. However, the existing body of knowledge remains fragmented across several analytical streams. Technology-adoption studies have primarily emphasized explanatory relationships among adoption-related factors, whereas machine-learning studies have focused largely on classification performance and operational prediction tasks. Similarly, explainable artificial intelligence research has concentrated on improving model transparency but has rarely been applied within AI readiness and technology-adoption contexts.
As a result, three important research gaps remain. First, limited attention has been given to identifying heterogeneous respondent-perceived AI readiness profiles within the same industrial environment. Second, relatively few studies integrate theory-informed technology-adoption dimensions with clustering and machine-learning techniques to support readiness-profile discovery and differentiation. Third, insufficient understanding exists regarding how technological, organizational, environmental, and behavioral dimensions contribute to readiness-profile differentiation within explainable analytical frameworks. These limitations are particularly relevant within Thailand’s logistics industry, where organizations operate under varying levels of technological capability, digital infrastructure, organizational readiness, and AI implementation experience despite ongoing national digital transformation initiatives. Consequently, there remains insufficient understanding of how respondent-perceived AI readiness profiles can be identified, differentiated, and interpreted using a unified theory-informed analytical framework [49].
To address these gaps, this study proposes an integrated AI readiness-profiling framework that combines TOE–UTAUT feature representations, K-means clustering, supervised machine-learning classification, ensemble-learning-based robustness assessment, and SHAP-based explainability analysis. Rather than examining AI adoption exclusively through causal or explanatory relationships, the proposed framework is designed to identify heterogeneous readiness profiles, differentiate internally derived profile membership, and provide transparent interpretation of readiness-profile differentiation outcomes.

2.7. Conceptual Framework of the Study

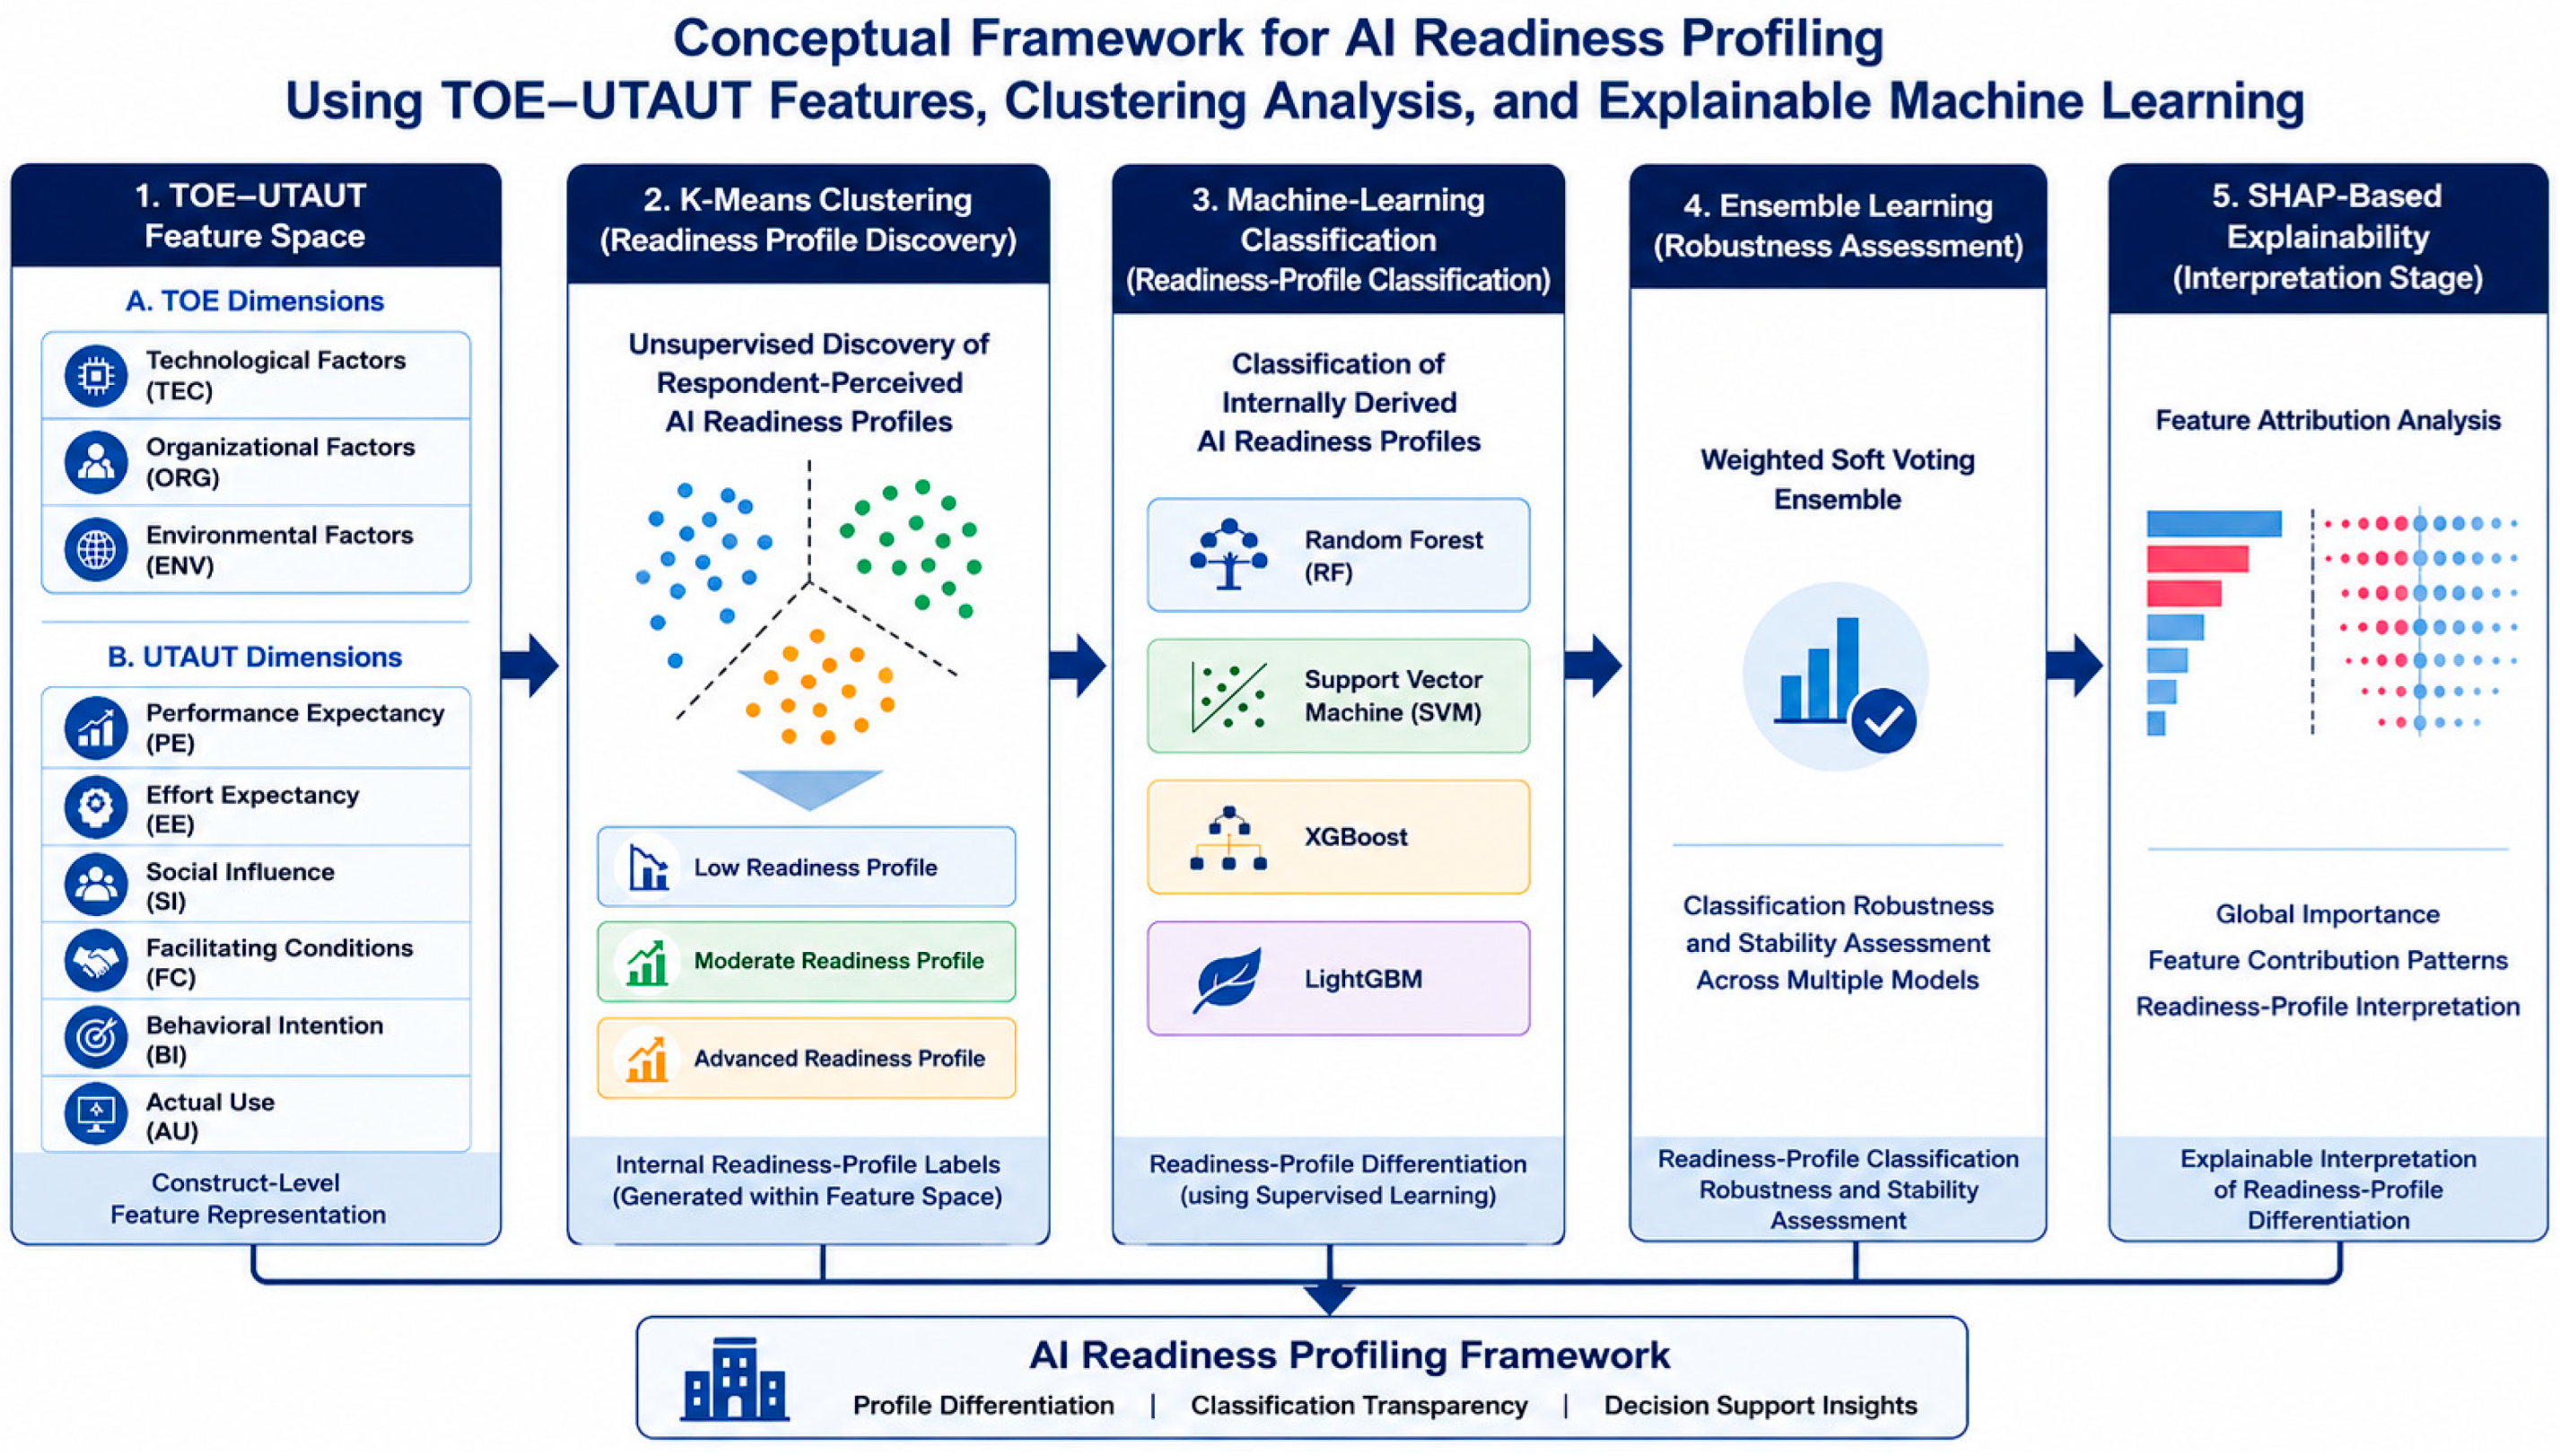
Based on the literature synthesis and research gaps identified earlier, this study proposes an integrated AI readiness-profiling framework to examine respondent-perceived organizational AI readiness in Thailand’s logistics industry. The framework combines technology-adoption theory, clustering analysis, machine-learning analytics, and explainable artificial intelligence within a unified approach. The framework addresses the three research gaps identified in Section 2.6. First, TOE–UTAUT dimensions serve as theory-informed features representing technological, organizational, environmental, and behavioral conditions related to AI readiness. Second, K-means clustering identifies heterogeneous respondent-perceived AI readiness profiles rather than assuming homogeneous adoption behavior. Third, supervised machine-learning and ensemble-learning techniques differentiate the derived profiles and evaluate classification robustness. Finally, SHAP-based explainability analysis provides transparent interpretation of feature contributions to profile differentiation.
Overall, the framework supports the identification, differentiation, validation, and interpretation of respondent-perceived AI readiness profiles within a single workflow. By integrating TOE–UTAUT features, clustering, machine-learning classification, ensemble assessment, and explainable AI, it offers a complementary data-driven perspective on heterogeneous AI readiness conditions in logistics environments. The conceptual framework of the study is presented in Figure 1.

3. Materials and Methods

3.1. Research Design

This study employed a quantitative cross-sectional research design integrated with clustering analysis, supervised machine learning classification, ensemble learning, and explainable artificial intelligence techniques to investigate the AI adoption readiness profile within Thailand’s logistics industry. The research design was developed to identify heterogeneous respondent-perceived AI readiness profiles and classify respondents into internally derived readiness profiles, classify organizations according to AI adoption readiness profile levels, and interpret the contribution of organizational and behavioral predictors within a unified profiling analytics framework [50].
All statistical analyses, clustering analysis, supervised machine-learning modeling, ensemble learning, and SHAP explainability analyses were performed using Python version 3.11 (Python Software Foundation, Wilmington, DE, USA). Machine-learning models were implemented using scikit-learn version 1.5.1, XGBoost version 2.1.1, LightGBM version 4.5.0, and SHAP version 0.46.0. Statistical data preparation and descriptive analyses were conducted using IBM SPSS Statistics version 29.0 (IBM Corp., Armonk, NY, USA). The analytical procedure consisted of several sequential stages. First, empirical data were collected from logistics and supply chain professionals using a structured questionnaire designed to measure TOE–UTAUT organizational and behavioral dimensions associated with AI adoption. Second, data preprocessing procedures, including missing data screening, duplicate response removal, construct score preparation, and feature normalization, were conducted to improve dataset consistency and analytical reliability [51]. Third, K-means clustering analysis was applied to segment respondents into heterogeneous, respondent-perceived AI readiness profiles based on similarities in technological readiness, organizational capability, environmental conditions, and technology utilization characteristics. The clustering procedure generated respondent-perceived AI readiness profiles labels representing low, moderate, and advanced AI adoption profiles. Fourth, supervised machine learning classification models including Random Forest (RF), Support Vector Machine (SVM), XGBoost, and LightGBM were implemented to classify respondent-perceived AI readiness profiles using TOE–UTAUT predictors. The classification stage was designed to evaluate classification consistency across multiple learning algorithms rather than to establish causal relationships among adoption factors [52]. Subsequently, a weighted voting ensemble framework was developed to assess classification robustness and classification stability across multiple classifiers. Finally, SHAP (SHapley Additive exPlanations) analysis was applied to interpret the contribution of TOE–UTAUT predictors to AI adoption readiness profile classification outcomes and to improve interpretability of the classification learning framework [53].
The study adopted a cross-sectional approach because the data were collected at a single point in time from logistics and supply chain organizations operating in Thailand. This design was considered appropriate for respondent-perceived AI readiness profiling within a rapidly evolving digital transformation environment. Importantly, the study was designed for AI adoption readiness profile classification and organizational profiling rather than causal hypothesis testing among TOE–UTAUT constructs. The unit of analysis in this study was the individual respondent rather than the organization itself. Data were collected from logistics and supply chain professionals who reported their perceptions of technological readiness, organizational support, environmental conditions, and AI utilization practices within the organizations in which they worked. Consequently, the AI readiness profiles identified in this study should be interpreted as respondent-perceived organizational AI readiness patterns rather than objective organizational readiness profile classifications. The clustering and machine-learning procedures therefore classify perceived AI readiness profiles derived from individual-level assessments of organizational conditions.

3.2. Population and Sampling

The target population of this study consisted of professionals working in Thailand’s logistics and supply chain industry who possessed knowledge, experience, or operational involvement related to AI-enabled technologies, digital logistics systems, or technology-driven supply chain practices. The population included employees, supervisors, managers, executives, warehouse operators, transportation planners, technology specialists, and supply chain professionals from organizations involved in transportation services, warehousing, freight forwarding, distribution management, inventory operations, and logistics-related business activities across Thailand.
A purposive sampling technique was employed to select respondents who met predefined eligibility criteria relevant to respondent-perceived AI readiness profiles and digital transformation practices. Purposive sampling was considered appropriate because the study specifically required respondents with familiarity or involvement in AI-related operational environments rather than general respondents without technology exposure. To improve respondent relevance, screening questions were used prior to participation. The inclusion criteria required respondents to: (1) currently work in the logistics or supply chain industry in Thailand; (2) possess basic knowledge, experience, or operational exposure related to AI-enabled systems, digital logistics technologies, automation tools, or digital transformation practices; and (3) have at least one year of working experience in logistics-related operations. These criteria were intended to ensure that the collected responses reflected organizational and behavioral perspectives associated with AI adoption readiness profiles within logistics environments. Although the study focuses on AI readiness within logistics organizations, the empirical unit of analysis was the individual respondent. Each respondent provided assessments regarding the technological, organizational, environmental, and behavioral conditions associated with AI adoption within the organization in which they were employed. Accordingly, the resulting dataset reflects respondent perceptions of organizational AI readiness rather than objective organization-level measurements or independently verified organizational readiness assessments. This distinction is important because the clustering and classification results represent perceived readiness profiles derived from individual assessments of organizational conditions.
The sample size was determined based on profiling analytics and machine learning considerations involving clustering analysis, multiclass classification, and cross-validation procedures. Previous machine learning studies have indicated that larger datasets improve clustering stability, classification consistency, and generalization capability in multidimensional analytical environments [54]. Accordingly, this study collected data from 520 respondents, which was considered suitable for clustering-based segmentation, supervised machine learning classification, and ensemble learning analysis involving multiple organizational and behavioral predictors. The final sample size of 520 respondents was considered adequate for clustering analysis and multiclass machine-learning classification. With nine TOE–UTAUT predictor variables and three readiness-profile classes, the dataset provided sufficient observations to support stable cluster formation, classifier training, and 10-fold cross-validation procedures.
Data collection was conducted using online survey distribution channels targeting logistics and supply chain professionals across Thailand. The questionnaire link was distributed through multiple recruitment channels, including professional logistics and supply chain networks, industry association communities, LinkedIn professional groups, logistics-related Facebook communities, alumni networks, and organizational referral channels. This multi-channel recruitment strategy was adopted to improve access to respondents possessing relevant logistics experience and familiarity with AI-enabled technologies and digital transformation initiatives.
Prior to participation, respondents were informed regarding the research objectives, voluntary participation, anonymity protection, and confidentiality of responses. Informed consent was obtained from all participants before questionnaire completion. Data collection was conducted over a one-month period, from 10 March to 9 April 2026. A total of 600 questionnaire invitations and survey-link distributions were disseminated through the selected recruitment channels. Following data screening, eligibility verification, and quality-control procedures, 520 valid responses were retained for analysis. To improve dataset quality, incomplete responses, duplicate submissions, and invalid records were removed prior to analysis. Response screening procedures were additionally conducted to ensure consistency and completeness of the collected data before clustering analysis and machine learning model development. Additional quality-control procedures were applied to identify potentially unreliable responses. Records exhibiting excessive missing information, failure to satisfy screening criteria, duplicate submissions, inconsistent response patterns, or unusually short completion times were excluded from the final dataset. These procedures were implemented to improve response quality and analytical reliability prior to clustering and machine-learning analysis.
Overall, the purposive sampling strategy and respondent screening procedures were considered suitable for investigating respondent-perceived organizational AI readiness profile patterns within Thailand’s logistics and supply chain industry using clustering-based profiling analytics techniques. Because all study variables were collected using a single self-reported survey instrument, several procedural remedies were implemented to reduce potential common method bias. Respondents were informed that participation was voluntary, responses would remain anonymous, and no individual information would be disclosed. The questionnaire was carefully reviewed by academic experts and industry practitioners to improve item clarity and reduce ambiguity. In addition, the survey included separate sections for demographic information and TOE–UTAUT constructs to minimize consistency motives and evaluation apprehension during questionnaire completion.

3.3. Measurement Instrument and Construct Operationalization

The measurement instrument used in this study was a structured questionnaire designed to collect quantitative data on organizational and behavioral dimensions associated with AI adoption readiness in Thailand’s logistics industry. The instrument was developed based on established constructs derived from the Technology–Organization–Environment (TOE) framework and the Unified Theory of Acceptance and Use of Technology (UTAUT). Specifically, the TOE dimensions included Technological Factors (TEC), Organizational Factors (ORG), and Environmental Factors (ENV), adapted from the TOE framework proposed by Tornatzky and Fleischer (1990) and subsequent organizational technology adoption studies [55]. The UTAUT dimensions included Performance Expectancy (PE), Effort Expectancy (EE), Social Influence (SI), Facilitating Conditions (FC), Behavioral Intention (BI), and Actual Use (AU), adapted from Venkatesh et al. (2003) [56].
The questionnaire consisted of two main sections. The first section collected demographic and organizational information, including gender, age, education level, position, and work experience. The second section measured nine TOE–UTAUT constructs using 27 reflective indicators. All measurement items were assessed using a five-point Likert scale ranging from 1 = “Strongly Disagree” to 5 = “Strongly Agree” to 5 = “Strongly Agree” [57]. Higher scores indicated stronger agreement with the corresponding organizational or behavioral AI adoption dimension. The complete list of measurement items and construct sources is provided in Appendix A.
For the purpose of clustering analysis and supervised machine learning classification, the TOE–UTAUT dimensions were operationalized as construct-level composite predictors. Construct scores were calculated by averaging the responses associated with each construct. These composite scores were subsequently used as theory-informed classification features within the clustering and classification framework to identify perceived AI adoption readiness profiles among logistics organizations, rather than as latent variables within a causal structural equation model.
Prior to the main survey administration, the questionnaire underwent a multi-stage instrument refinement process. First, the initial item pool was reviewed by academic experts and logistics industry practitioners to evaluate content relevance, wording clarity, and conceptual appropriateness. Second, a pilot study involving 30 logistics and supply chain professionals was conducted to assess questionnaire clarity, comprehensibility, and preliminary internal consistency. Feedback obtained from both expert review and pilot testing was used to refine item wording and improve questionnaire readability. No measurement items were removed during the pilot-testing stage because all indicators demonstrated acceptable content relevance and satisfactory preliminary reliability.
The finalized questionnaire was subsequently distributed through an online survey platform targeting logistics and supply chain professionals across Thailand. Respondents were informed regarding the research objectives, voluntary participation, anonymity protection, and confidentiality of responses prior to participation. Following data screening and quality-control procedures, 520 valid responses were retained for subsequent measurement validation, clustering analysis, supervised machine learning classification, ensemble learning, and SHAP-based explainability analysis aimed at identifying and characterizing perceived AI adoption readiness profiles.
To further evaluate measurement quality, reliability and construct validity assessments were conducted using the full sample prior to clustering and machine learning analysis. The results of Cronbach’s alpha, Composite Reliability (CR), Average Variance Extracted (AVE), and Confirmatory Factor Analysis (CFA) are reported in Section 4.1. Given that all constructs were measured using self-reported responses collected from a single survey instrument, a statistical assessment of common method bias was additionally conducted. Harman’s single-factor test was performed by loading all measurement items into an unrotated exploratory factor analysis. The first factor accounted for less than 50% of the total variance, suggesting that common method variance was unlikely to represent a substantial threat to the validity of the measurement instrument. And the results of the common method bias assessment are reported in Section 4.1.

3.4. Data Preprocessing and Analytical Pipeline

The analytical procedure consisted of five sequential stages: data preprocessing, K-means clustering, supervised machine learning classification, weighted voting ensemble learning, and SHAP-based explainability analysis. First, missing data and duplicate responses were examined prior to analysis. Construct-level composite scores for TOE–UTAUT dimensions were subsequently calculated by averaging item responses within each construct. Min–max normalization was then applied to ensure comparable feature scaling across clustering and machine learning procedures [58].
Second, K-means clustering analysis was conducted to identify heterogeneous respondent-perceived AI readiness profiles within the dataset. The number of clusters was assessed using the elbow method and silhouette analysis. The clustering procedure generated internal readiness-profile labels representing low, moderate, and advanced respondent-perceived AI readiness profiles [59].
Third, the labeled dataset was divided into training and testing subsets using stratified random sampling with an 80:20 ratio to preserve the distribution of AI readiness profiles across subsets. Supervised machine learning classification models, including Random Forest, Support Vector Machine, XGBoost, and LightGBM, were trained using TOE–UTAUT predictors to classify respondent-perceived AI readiness profiles. Ten-fold cross-validation was applied only to the training subset for model evaluation and parameter configuration [52].
Fourth, a weighted voting ensemble framework was developed to assess classification robustness and classification stability across multiple classifiers. Ensemble weights were derived from cross-validation performance on the training subset only. The hold-out testing subset was not used during model training, cross-validation, or ensemble weight assignment and was reserved exclusively for final model evaluation [52]. It is important to note that the supervised learning stage was not designed to predict an independent or externally observed AI adoption outcome. Rather, the objective was to evaluate the extent to which different machine learning algorithms could differentiate and classify the internally derived AI readiness profiles generated through the clustering procedure. Consequently, the classification models should be interpreted as readiness-profile classification mechanisms operating within the TOE–UTAUT feature space rather than classification models of externally validated respondent-perceived AI readiness profile outcomes. It should also be acknowledged that the clustering procedure was performed prior to the train–test partitioning process in order to establish a stable set of internally derived readiness-profile labels for subsequent classification analysis. Consequently, the machine learning evaluation reported in this study reflects the ability of the classifiers to reproduce and differentiate the internally derived readiness profiles rather than to validate cluster formation on completely unseen observations. Therefore, the proposed framework should be interpreted as a proof-of-concept readiness profiling and classification approach. Future research may extend this work by performing clustering exclusively on training data and subsequently assigning unseen observations to clusters to provide stronger out-of-sample validation.
Finally, SHAP (SHapley Additive exPlanations) analysis was applied to interpret TOE–UTAUT predictor contributions to AI adoption readiness profile classification outcomes. Global SHAP summary analysis was used to rank predictors according to their contribution to classification outcomes [11]. Because the AI adoption readiness profile labels were generated from K-means clustering using the same TOE–UTAUT construct space subsequently employed for supervised classification, the resulting explainability analysis should be interpreted as describing how the classifier differentiates internally derived readiness profiles rather than identifying independent determinants of externally validated AI adoption outcomes. The overall analytical framework is summarized in Table 2.

3.5. K-Means Clustering Procedure

K-means clustering analysis was applied to segment organizations into heterogeneous AI adoption readiness profiles based on similarities across TOE–UTAUT organizational and behavioral predictor dimensions. The clustering procedure was used to generate respondent-perceived AI readiness profiles prior to supervised machine learning classification. K-means clustering partitions observations into (k) clusters by minimizing the within-cluster sum of squared distances between observations and their assigned centroids [60].
The clustering objective function is expressed as Equation (1)
J = i = 1 n j k r i j x i μ j 2
where J is the objective function, n is the total number of respondents, k is the number of clusters, x i represents the feature vector of respondent i , μ j is the centroid of cluster j , and r i j = 1   if respondent i belongs to cluster j , otherwise r i j = 0 . In this study, the number of clusters was set to k = 3 , representing relatively low, moderate, and advanced readiness patterns. The Euclidean distance was used to measure similarity between respondents and cluster centroids.
The distance between each respondent and centroid was calculated as Equation (2).
d ( x i , μ j ) = p = 1 m ( x i p μ j p ) 2
where m is the number of input indicators. Before clustering, all Likert-scale indicators were normalized using Min–Max scaling to reduce scale bias. The parameter settings used in this study were: k = 3 , distance metric = Euclidean distance, initialization method = k-means++, maximum iterations = 300, convergence tolerance = 0.0001, and number of initializations = 10. The clustering procedure was implemented using Python-based machine learning libraries with a fixed random seed to improve reproducibility.
Because the AI adoption readiness profile labels were generated from clustering outcomes derived from the TOE–UTAUT construct space, the subsequent supervised learning stage was interpreted as organizational readiness profiling and cluster membership classification rather than independent prediction of externally observed adoption outcomes.

3.6. Supervised Machine Learning Classification Models

3.6.1. Random Forest

Random Forest (RF) was employed in this study as an ensemble machine learning algorithm for classifying AI adoption levels in Thailand’s logistics industry. The Random Forest algorithm combines multiple decision trees generated from randomly selected subsets of training data and input features to improve classification accuracy and reduce overfitting. Each tree independently predicts the class label, and the final prediction is determined using majority voting across all trees. This ensemble mechanism enhances model robustness and generalization capability when handling complex and nonlinear logistics datasets.
The Random Forest classification process can be represented as Equation (3).
Y ^ = m o d e { T 1 ( x ) , T 2 ( x ) , , T n ( x ) }
where Y ^ denotes the final predicted class, T 1 ( x ) , T 2 ( x ) , . . . , T n ( x ) represent the predictions generated by individual decision trees, and n   is the total number of trees in the forest. The algorithm selects the class label receiving the highest number of votes from all trees [61].
The parameter settings used in this study included number of trees ( n _ e s t i m a t o r s ) = 200, criterion = “gini”, maximum depth = 10, minimum samples split = 4, minimum samples leaf = 2, maximum features = “sqrt”, bootstrap sampling = True, and random state = 42. These settings were selected to balance classification performance and computational efficiency while minimizing overfitting.

3.6.2. Support Vector Machine

Support Vector Machine (SVM) was utilized in this study as a supervised machine learning algorithm for classifying AI adoption levels among logistics organizations in Thailand. SVM is designed to identify the optimal hyperplane that maximizes the margin between different classification classes. The algorithm is highly effective for handling high-dimensional datasets and nonlinear classification problems commonly observed in AI adoption analysis. By maximizing the separation margin between support vectors, SVM improves classification robustness and generalization performance.
The SVM decision function can be expressed as Equation (4).
f ( x ) = w T x + b
where f ( x ) represents the classification function, w is the weight vector, x denotes the input feature vector, and b is the bias term.
The objective of SVM is to determine the optimal hyperplane that maximizes the margin between different classes.
The optimization objective of SVM is formulated as Equation (5)
m i n 1 2 w 2 + C i = 1 n ξ i
where w 2 represents the margin maximization term, C is the regularization parameter controlling classification error tolerance, and ξ i denotes slack variables allowing limited misclassification.
In this study, the Radial Basis Function (RBF) kernel was applied to capture nonlinear relationships within logistics datasets.
The RBF kernel function is defined as Equation (6)
K ( x i , x j ) = e x p ( γ x i x j 2 )
where γ controls the influence range of training samples on the decision boundary.
The parameter settings used in this study included kernel = “rbf”, regularization parameter C = 1.0 , gamma = 0.01, tolerance = 0.001, maximum iterations = 1000, and random state = 42. These parameters were optimized to improve classification accuracy while minimizing overfitting [62].

3.6.3. XGBoost

Extreme Gradient Boosting (XGBoost) was employed as a gradient boosting-based ensemble classifier for respondent-perceived AI readiness profiles using TOE–UTAUT construct-level predictors. XGBoost was included in the comparative machine learning framework because it incorporates sequential tree learning and regularization mechanisms suitable for nonlinear multiclass classification tasks involving structured organizational datasets.
The prediction model of XGBoost can be represented as Equation (7).
y ^ i = k = 1 K f k ( x i ) , f k F
where y ^ i denotes the predicted output for observation i , K is the number of decision trees, f k ( x i ) represents the prediction generated by tree k , and F denotes the space of regression trees. The model iteratively adds new trees to correct the residual errors produced by previous trees.
A multiclass classification configuration was implemented to classify respondents across the three respondent-perceived AI readiness profiles. Specifically, the XGBoost classifier was configured using the multi:softprob objective function with num_class = 3, corresponding to the three internally derived AI readiness profile classes (Low, Moderate, and Advanced). This configuration generated a probability vector for each observation representing the estimated membership probability of each readiness-profile class. Class probabilities were using the XGBoost scikit-learn API predict_proba() interface and were subsequently incorporated into the weighted soft-voting ensemble.
The parameter settings applied in this study included number of estimators = 300, learning rate = 0.05, maximum tree depth = 6, subsample ratio = 0.8, colsample_bytree = 0.8, gamma = 0.1, minimum child weight = 1, regularization parameter lambda = 1.0, and random state = 42. These parameter settings were empirically configured to support comparative multiclass classification evaluation, probability estimation for ensemble learning, classification stability, and overfitting control.
XGBoost was evaluated as one of the comparative supervised learning classifiers within the clustering-based AI adoption readiness profile classification framework because of its suitability for nonlinear multiclass classification and multidimensional TOE–UTAUT predictor structures [63].

3.6.4. LightGBM

Light Gradient Boosting Machine (LightGBM) was employed as a gradient boosting-based ensemble classifier for respondent-perceived AI readiness profiles classification using TOE–UTAUT construct-level predictors. LightGBM was included in the comparative machine learning framework because of its computational efficiency and suitability for structured multiclass classification tasks involving multidimensional organizational datasets.
The prediction function of LightGBM can be expressed as Equation (8).
y ^ i = k = 1 K f k ( x i )
where y ^ i represents the predicted output for observation i , K   denotes the total number of boosting trees, and f k ( x i ) is the prediction generated by the k -th decision tree. Similar to other boosting algorithms, LightGBM sequentially minimizes prediction errors by adding new trees that correct residuals from previous iterations.
A multiclass classification configuration was implemented to classify organizations across the three AI adoption readiness groups. The parameter settings used in this study included number of estimators = 300, learning rate = 0.05, maximum depth = 8, number of leaves = 31, feature fraction = 0.8, bagging fraction = 0.8, bagging frequency = 5, minimum data in leaf = 20, lambda L2 regularization = 1.0, objective = “multiclass”, and random state = 42. These parameter settings were empirically configured to support comparative classification evaluation, classification stability, and overfitting control [64].
LightGBM was evaluated as one of the comparative supervised learning classifiers within the clustering-based AI adoption readiness profile classification framework because of its suitability for efficient multiclass classification and multidimensional TOE–UTAUT predictor structures. To support reproducibility and comparative evaluation consistency, all clustering and supervised machine learning models were implemented using predefined parameter configurations. The parameter settings were empirically configured based on model stability, computational feasibility, and multiclass classification suitability within the clustering-based AI adoption readiness profile classification framework. Consistent random seed initialization and cross-validation procedures were applied across all models to improve reproducibility and comparative consistency.
Table 3 summarizes the principal parameter settings used for the clustering and supervised machine learning models implemented in this study.

3.7. Weighted Voting Ensemble Framework

Following the evaluation of individual supervised classification models, a weighted voting ensemble framework was implemented to assess classification consistency and classification robustness across multiple classifiers within the AI adoption readiness profile classification framework. The ensemble approach combined the multiclass probability outputs generated by Random Forest (RF), Support Vector Machine (SVM), XGBoost, and LightGBM classifiers. The final ensemble prediction was determined using weighted probability aggregation across the base classifiers. The weighted voting mechanism can be expressed as follows.
The weighted voting prediction mechanism can be expressed as follows Equation (9)
Y ^ = arg ma x c i = 1 n ω i P i c
where:
  • Y ^ represents the final predicted AI adoption class
  • w i denotes the weight assigned to the i classification model
  • P i ( c ) represents the predicted probability of class c generated by the i model
  • n represents the number of base classifiers included in the ensemble model
A soft voting aggregation strategy was implemented to combine multiclass probability outputs from the individual classifiers. The ensemble weights were computed exclusively from the mean ten-fold cross-validation F1-score obtained from the training subset. Specifically, the mean cross-validation F1-score of each base classifier was normalized by the total cross-validation F1-score across all base classifiers to obtain the corresponding voting weight. The independent hold-out testing subset was reserved exclusively for final model evaluation and was not involved in the estimation of the ensemble weights. Therefore, Table 12 reports the mean ten-fold cross-validation F1-score used for voting-weight estimation, whereas Table 11 presents the independent hold-out testing performance used for final model evaluation.
The normalized voting weight assigned to each base classifier was calculated according to Equation (10).
w i = F 1 i j = 1 n F 1 j
where
  • F 1 i denotes the mean ten-fold cross-validation F1-score of classifier
  • i , and w i represents the normalized voting weight assigned to classifier i .
Models demonstrating relatively higher mean cross-validation F1-scores received proportionally larger voting weights within the ensemble framework. The weighted voting ensemble framework was positioned as a comparative robustness-oriented classification mechanism rather than as a replacement for the strongest-performing individual classifier. The ensemble framework was additionally used to assess classification consistency across multiple learning mechanisms, including kernel-based classification, tree-based ensemble learning, and gradient boosting approaches within the clustering-based AI adoption readiness profile classification framework [44].

3.8. SHAP-Based Explainability Procedure

SHapley Additive exPlanations (SHAP) analysis was implemented as a post hoc explainable artificial intelligence (XAI) technique to support interpretation of the multiclass AI adoption readiness profile classification framework. SHAP analysis was conducted using the XGBoost classifier because tree-based SHAP explainability frameworks provide computationally efficient and stable feature attribution estimation for structured multiclass classification tasks [65]. Although the Support Vector Machine (SVM) achieved the highest classification performance among the evaluated classifiers, XGBoost was selected for SHAP-based explainability analysis because tree-based ensemble models provide direct and computationally efficient estimation of SHAP values through the TreeExplainer framework. The purpose of the SHAP analysis was therefore not to explain the best-performing classifier, but rather to provide an interpretable feature-attribution perspective on how TOE–UTAUT predictors contribute to the differentiation of the internally derived AI adoption readiness profiles. Accordingly, XGBoost was employed as an interpretable surrogate model to support post hoc explanation of the classification framework in this study.
A global SHAP summary analysis was implemented using the TreeExplainer framework to estimate the relative feature contribution of TOE–UTAUT construct-level predictors to AI adoption readiness profile classification outcomes. For the multiclass XGBoost classifier, TreeExplainer generated separate SHAP values for each of the three respondent-perceived AI readiness profile classes (Low, Moderate, and Advanced). Mean absolute SHAP values were first calculated across all observations within each class to quantify class-specific feature importance. Subsequently, the overall feature-importance values reported in this study were obtained by computing the simple arithmetic mean of the three class-specific mean absolute SHAP values for each predictor. This aggregation procedure produced a single global, class-agnostic measure of feature importance across the multiclass classification framework.
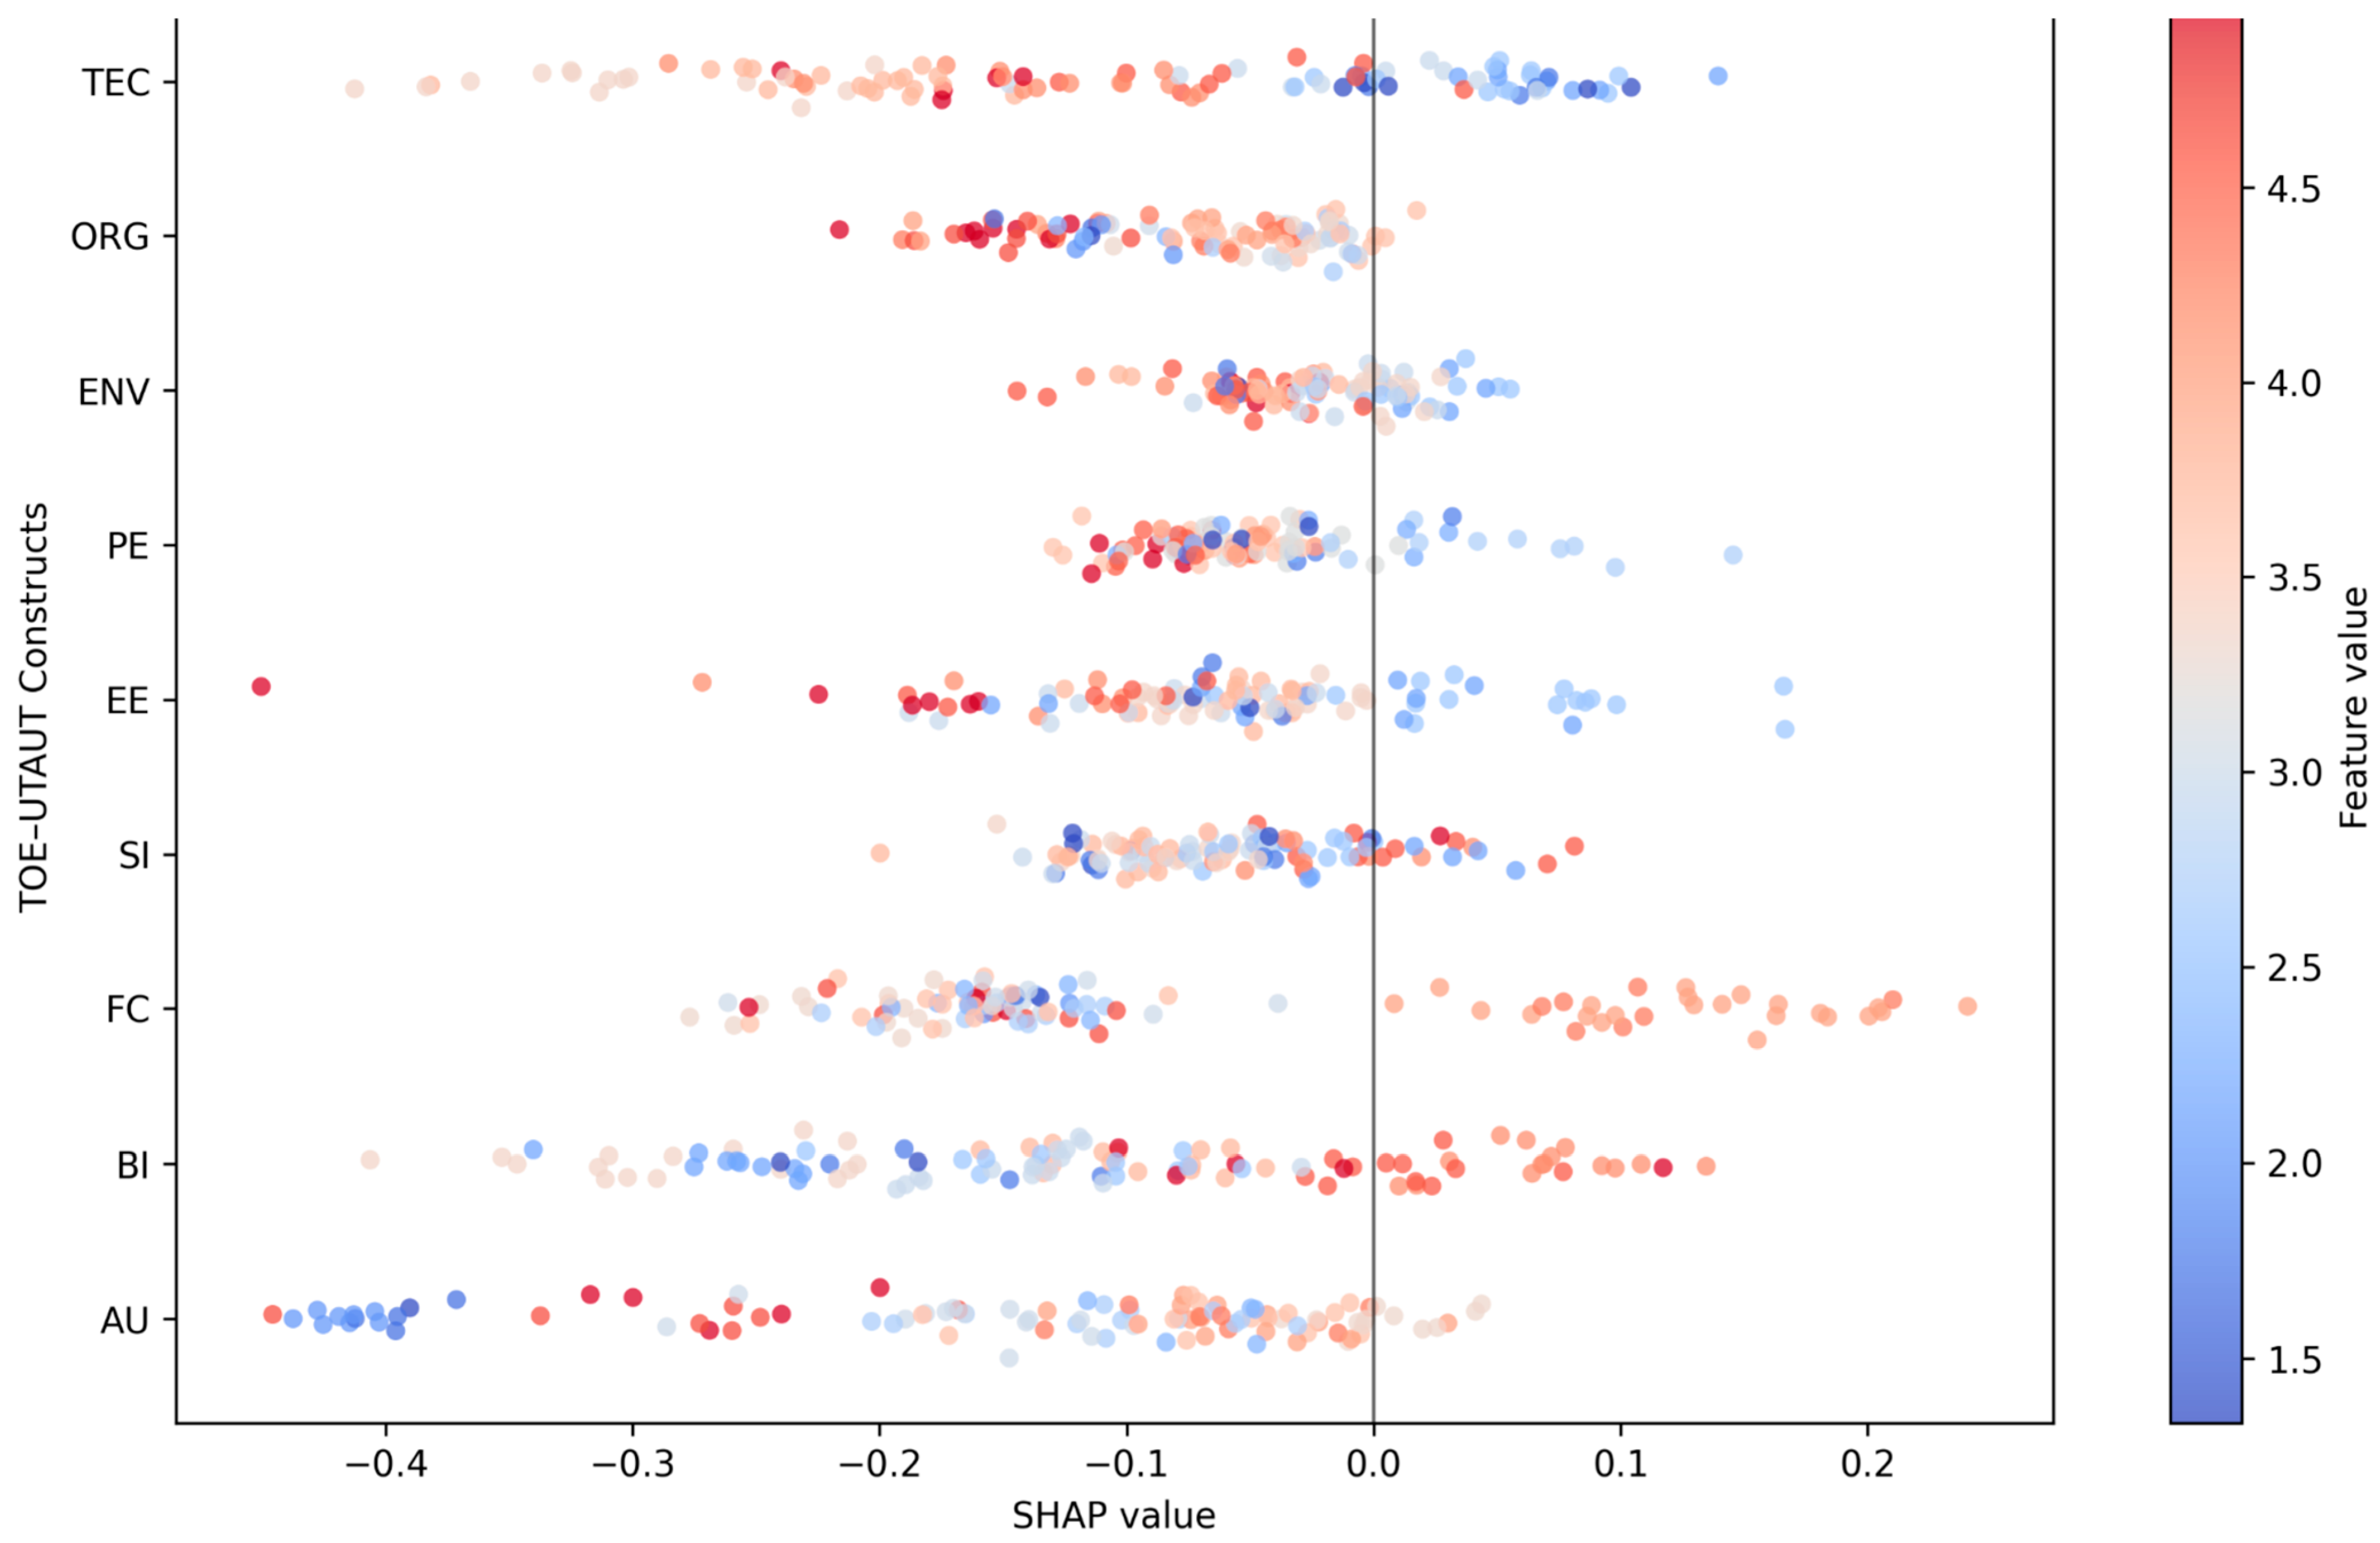
The SHAP summary plot (beeswarm-style visualization) was generated using these aggregated SHAP values, illustrating the distribution and magnitude of feature-attribution values across all observations within the multiclass classification framework. The horizontal axis represents SHAP values, while the color gradient reflects the magnitude of the original feature values. Because the reported beeswarm plot summarizes aggregated multiclass feature-attribution patterns rather than explanations for an individual readiness profile, positive and negative SHAP values should be interpreted only as indicating the direction of feature influence on the classifier output for individual observations and not as direct contributions toward any specific readiness profile. Predictor importance rankings were therefore based on the aggregated mean absolute SHAP values obtained using the multiclass aggregation procedure described above [53].
The vertical axis represents the TOE–UTAUT construct-level predictors, including Technological Factors (TEC), Organizational Factors (ORG), Environmental Factors (ENV), Performance Expectancy (PE), Effort Expectancy (EE), Social Influence (SI), Facilitating Conditions (FC), Behavioral Intention (BI), and Actual Use (AU). Predictor importance rankings were estimated using the average absolute SHAP values across observations within the multiclass classification framework. The SHAP-based explainability procedure was incorporated to support post hoc interpretation of feature attribution patterns within the clustering-based AI adoption readiness profile classification framework [66].

3.9. Model Evaluation Metrics and Reproducibility

The classification performance of the supervised machine learning classifiers was evaluated using multiple multiclass classification metrics, including accuracy, precision, recall, F1-score, and area under the receiver operating characteristic curve (AUC). These evaluation metrics were selected to provide a comprehensive assessment of classification performance across the AI adoption readiness profile generated through K-means clustering. Accuracy was used to evaluate the overall proportion of correctly classified observations, whereas precision and recall were used to assess classification consistency across the multiclass respondent-perceived AI readiness profiles. The F1-score was additionally calculated to balance precision and recall performance within the multiclass classification framework. Area under the receiver operating characteristic curve (AUC) was used to assess the discriminatory capability of the classification models across multiple class boundaries [67].
To support comparative classification evaluation, the dataset was partitioned into training and testing subsets using stratified random sampling with an 80:20 ratio. Ten-fold cross-validation was applied exclusively to the training subset during model development to assess classification stability and reduce overfitting risk prior to hold-out testing evaluation. All clustering and machine learning analyses were implemented using Python-based analytical libraries. The machine learning models were developed using Scikit-learn, XGBoost, LightGBM, and SHAP libraries within the Python version 3.11 analytical environment. Consistent random seed initialization (random state = 42) was applied across clustering, model training, and evaluation procedures to improve reproducibility and analytical consistency. Macro-averaging procedures were applied for multiclass precision, recall, and F1-score calculation to ensure balanced evaluation across the AI adoption readiness profile. Multiclass AUC evaluation was implemented using a one-versus-rest (OvR) classification strategy [68].

4. Result

This section presents the empirical findings obtained from the proposed clustering-based explainable machine-learning framework. Section 4.1 reports measurement validation results. Section 4.2 presents the clustering analysis and respondent-perceived AI readiness profiles. Section 4.3 reports the classification performance of the supervised machine-learning models and weighted voting ensemble framework. Section 4.4 presents additional machine-learning diagnostic analyses, including cross-validation stability, class-specific performance, and confusion-matrix evaluation. Finally, Section 4.5 presents the SHAP-based explainability results used to interpret predictor contribution patterns within the AI adoption readiness classification framework.

4.1. Measurement Validation

Before conducting clustering and machine learning analyses, the reliability and validity of the TOE–UTAUT measurement instrument were assessed. The questionnaire comprised 27 indicators representing nine constructs: Technological Factors (TEC), Organizational Factors (ORG), Environmental Factors (ENV), Performance Expectancy (PE), Effort Expectancy (EE), Social Influence (SI), Facilitating Conditions (FC), Behavioral Intention (BI), and Actual Use (AU). As shown in Table 4, all constructs demonstrated satisfactory reliability, with Cronbach’s alpha values ranging from 0.747 to 0.877 and Composite Reliability (CR) values from 0.749 to 0.877. Convergent validity was also supported, with AVE values ranging from 0.499 to 0.704. Although the AVE of Effort Expectancy (EE) was slightly below 0.50 (AVE = 0.499), its CR remained acceptable (CR = 0.749). Standardized factor loadings ranged from 0.663 to 0.844. Construct validity was further evaluated using confirmatory factor analysis (CFA). As shown in Table 5, the nine-factor measurement model exhibited excellent fit (χ2 = 289.915, df = 288, p = 0.457; CFI = 0.9997; TLI = 0.9997; RMSEA = 0.0036; SRMR = 0.0228), indicating strong measurement adequacy. Overall, the results confirm satisfactory reliability, convergent validity, and construct validity of the TOE–UTAUT instrument, supporting its use in subsequent clustering and machine learning analyses. Given that the TOE–UTAUT constructs were operationalized as classification features rather than latent variables in a structural model, discriminant validity assessment was considered supplementary rather than a prerequisite for subsequent machine-learning analyses.

Common Method Bias Assessment

Because all variables were collected using a single self-reported questionnaire, Harman’s single-factor test was conducted to assess potential common method bias. All measurement items were entered into an unrotated exploratory factor analysis. The first unrotated factor explained less than 50% of the total variance, indicating that common method variance was unlikely to represent a substantial threat to the validity of the findings. Combined with the procedural remedies implemented during questionnaire development and data collection, these results suggest that common method bias is unlikely to materially affect the subsequent clustering and machine learning analyses.

4.2. Clustering Results and Respondent-Perceived AI Readiness Profiles

Following data preprocessing, K-means clustering analysis was conducted to identify heterogeneous respondent-perceived AI readiness profiles within Thailand’s logistics and supply chain industry using TOE–UTAUT construct-level predictors. The clustering procedure aimed to classify organizations into homogeneous adoption groups based on similarities across technological, organizational, environmental, and behavioral dimensions associated with AI adoption. The clustering variables included Technological Factors (TEC), Organizational Factors (ORG), Environmental Factors (ENV), Performance Expectancy (PE), Effort Expectancy (EE), Social Influence (SI), Facilitating Conditions (FC), Behavioral Intention (BI), and Actual Use (AU). To evaluate the robustness of the clustering solution, multiple cluster-validation statistics were examined across alternative cluster configurations ranging from k = 2 to k = 6. Specifically, the elbow method, silhouette coefficient, Davies–Bouldin index, and Calinski–Harabasz index were jointly evaluated. The results are presented in Table 6.
As shown in Table 6, the two-cluster solution produced the highest silhouette coefficient and the lowest Davies–Bouldin index, indicating stronger statistical separation. However, the two-cluster solution provided limited practical differentiation for respondent-perceived AI readiness profiling because it primarily separated organizations into broad low-versus-high readiness groups. The three-cluster solution (k = 3) was therefore retained because it provided a more meaningful representation of respondent-perceived AI readiness profiles while maintaining acceptable clustering quality. Furthermore, the elbow plot demonstrated a visible inflection point at k = 3, after which reductions in within-cluster variance became progressively smaller. Consequently, the three-cluster solution was selected based on a combination of statistical evidence, theoretical interpretability, and practical usefulness for respondent-perceived AI readiness profiling. Although the silhouette coefficient of the three-cluster solution was modest, values above 0.223 have been considered acceptable in exploratory organizational segmentation studies involving behavioral and perceptual data, where cluster boundaries are inherently less distinct than in physical or engineering datasets.
Subsequently, K-means clustering partitioned the organizations into three distinct AI readiness profiles representing low, moderate, and advanced levels of organizational AI readiness. Table 7 presents the distribution of organizations across the identified profiles.
As presented in Table 7, the Moderate AI Readiness profile represented the largest respondent segment within the sample, accounting for 42.5% of the sample. The Low AI Adoption Readiness Profile accounted for 30.0% of respondents, whereas 27.5% were classified within the Advanced AI Adoption Readiness Profile. The profile distribution indicates substantial heterogeneity in respondent-perceived AI readiness profiles across Thailand’s logistics and supply chain industry. To further examine differences in respondent-perceived readiness profiles across the identified readiness profiles, the mean TOE–UTAUT construct scores were analyzed. The results are presented in Table 8.
The results presented in Table 8 indicate substantial variation across the three respondent-perceived AI readiness profiles. Respondents assigned to the Advanced AI Readiness profile reported comparatively higher construct-level scores across most TOE–UTAUT dimensions, particularly in Behavioral Intention (BI), Actual Use (AU), Performance Expectancy (PE), Facilitating Conditions (FC), and Technological Factors (TEC). In contrast, organizations within the Low AI Adoption Readiness Profile demonstrated comparatively lower construct-level scores across the majority of TOE–UTAUT predictors [11]. To further assess cluster validity, one-way analysis of variance (ANOVA) was conducted across all TOE–UTAUT constructs. The results are presented in Table 9.
As shown in Table 9, statistically significant differences were observed across the three AI adoption readiness profiles for all TOE–UTAUT constructs (p < 0.001). Furthermore, the corresponding eta-squared values ranged from 0.276 to 0.596, indicating moderate-to-large effect sizes. Because these constructs were also used to generate the cluster solution, the ANOVA results should be interpreted as descriptive evidence of profile separation within the TOE–UTAUT feature space rather than as independent external validation of the identified profiles. The results nevertheless indicate that the three profiles are internally distinguishable and represent different combinations of TOE–UTAUT characteristics within the sample.
Overall, the clustering results suggest that perceived organizational AI readiness among logistics and supply chain professionals is heterogeneous rather than uniform. The identified readiness profiles should be interpreted as internally derived readiness-profile segments generated from the TOE–UTAUT construct space rather than externally validated readiness classifications. The profiles nevertheless provide useful empirical insight into variation across technological readiness, organizational support capability, behavioral intention, and AI utilization characteristics within logistics and supply chain professional contexts. Importantly, the identified cluster memberships were subsequently transformed into multiclass target labels for the supervised machine learning classification stage [69].

4.3. Machine Learning Classification Performance

Following the identification of respondent-perceived AI readiness profiles through K-means clustering, supervised machine learning models were developed to classify respondents into the three perceived AI readiness profiles using TOE–UTAUT construct-level predictors. The objective of this stage was to evaluate the extent to which TOE–UTAUT construct-level features could differentiate the internally derived AI readiness profiles and to compare the classification performance of different machine learning algorithms within the readiness-profile classification framework.
Four supervised classification algorithms were evaluated, including Random Forest (RF), Support Vector Machine (SVM), Extreme Gradient Boosting (XGBoost), and Light Gradient Boosting Machine (LightGBM). In addition, a weighted voting ensemble framework was implemented to assess classification robustness by combining the probability outputs of the individual classifiers. Classification performance was evaluated using Accuracy, Precision, Recall, F1-score, and Area Under the Receiver Operating Characteristic Curve (AUC). The comparative results are presented in Table 10.
As shown in Table 10, all machine learning models achieved strong multiclass classification performance in distinguishing among the AI adoption readiness profile. Classification accuracy ranged from 0.885 to 0.923, while AUC values ranged from 0.963 to 0.987, indicating substantial discriminatory capability across the three readiness profile categories. Among the evaluated models, Support Vector Machine (SVM) achieved the strongest overall performance, obtaining the highest Accuracy (0.923), Precision (0.927), Recall (0.924), F1-score (0.925), and AUC (0.987). These results suggest that nonlinear decision boundaries captured by the radial basis function kernel were particularly effective for distinguishing respondent-perceived AI readiness profiles within the TOE–UTAUT predictor space. The tree-based ensemble methods also demonstrated strong classification capability. XGBoost achieved an accuracy of 0.904 and an AUC of 0.978, while LightGBM achieved an accuracy of 0.894 and an AUC of 0.971. Random Forest produced comparatively stable performance with an accuracy of 0.885 and an AUC of 0.963. Collectively, these findings indicate that the TOE–UTAUT construct structure contains sufficient information to support accurate classification of respondent-perceived AI readiness profiles across multiple machine learning paradigms.
To further evaluate model generalization capability, training and testing accuracies were compared. The results are presented in Table 11.
The differences between training and testing accuracy were relatively small across all models, ranging from 0.013 to 0.028. The smallest generalization gap was observed for SVM (0.013), suggesting strong model stability and limited overfitting. Although the boosting-based and ensemble approaches achieved slightly higher training performance, their testing performance remained consistent, indicating satisfactory generalization behavior when applied to unseen observations.
To assess classification robustness across multiple learning mechanisms, a weighted voting ensemble framework was subsequently developed. The ensemble combined the probability outputs generated by Random Forest, SVM, XGBoost, and LightGBM using cross-validation-F1-score-based weighting coefficients derived from mean ten-fold cross-validation F1-scores obtained exclusively from the training subset. Specifically, the voting weight assigned to each base classifier was calculated by normalizing its mean cross-validation F1-score relative to the sum of the corresponding scores across all base classifiers. The independent hold-out testing dataset was reserved exclusively for final model evaluation and was not used for weight estimation. Table 12 summarizes the mean cross-validation F1-score of each base classifier and the corresponding normalized voting weight used in the weighted soft-voting ensemble.
Table 12 presents the mean ten-fold cross-validation F1-score of each base classifier together with its corresponding normalized voting weight used in the weighted soft-voting ensemble. These weights were derived exclusively from mean ten-fold cross-validation F1-scores obtained from the training subset and therefore represent the ensemble-construction stage rather than the final model evaluation stage. The independent hold-out testing dataset remained completely unseen during weight estimation and was used solely for final performance evaluation, the results of which are reported in Table 11. Using the normalized voting weights presented in Table 12, the weighted voting ensemble achieved a hold-out testing accuracy of 0.904, as summarized in Table 11. Although the ensemble framework did not outperform the best individual classifier (SVM), it demonstrated competitive classification performance and consistent classification behavior across all evaluation metrics. This finding suggests that combining heterogeneous learning mechanisms can provide an additional robustness-oriented perspective for respondent-perceived AI readiness profile classification.
Overall, the machine learning results demonstrate that TOE–UTAUT construct-level predictors possess substantial classification capability for distinguishing among respondent-perceived AI readiness profiles. The consistently strong hold-out testing performance observed across kernel-based, tree-based, and boosting-based algorithms further supports the suitability of the proposed clustering-based machine learning framework for respondent-perceived organizational AI readiness-profile differentiation. Because the target labels were derived from unsupervised clustering within the same TOE–UTAUT feature space, the classification results should be interpreted as readiness-profile differentiation and cluster membership prediction rather than prediction of externally observed organizational outcomes [70].
The TOE–UTAUT construct structure contains sufficient information to support accurate differentiation among the internally derived AI readiness profiles. However, because the target labels were generated through clustering procedures using the same TOE–UTAUT feature space subsequently employed for classification, the classification results should be interpreted as readiness-profile classification performance rather than prediction of an independent or externally observed AI adoption outcome. Because the ensemble weights were derived exclusively from the mean ten-fold cross-validation F1-score obtained from the training subset, the reported hold-out testing results represent an independent evaluation of the final weighted ensemble rather than information used during ensemble-weight estimation or model construction. Accordingly, the machine learning models evaluated in this study should be viewed as profile-differentiation mechanisms that distinguish among internally derived readiness segments rather than classification models of objectively validated respondent-perceived AI readiness profiles.

4.4. Machine Learning Diagnostic Results

To further evaluate the robustness and reliability of the machine learning framework, additional diagnostic analyses were conducted beyond the overall classification performance metrics. Specifically, cross-validation stability analysis, class-specific performance assessment, and confusion matrix evaluation were performed to examine model consistency and classification behavior across the three AI adoption readiness profiles.

4.4.1. Cross-Validation Stability Analysis

The classification stability of the evaluated machine learning models was assessed using ten-fold cross-validation conducted on the training dataset. Figure 2 summarizes the mean ten-fold cross-validation F1-score (±SD) obtained from the training subset. These cross-validation results were used to assess model stability and to derive the normalized voting weights presented in Table 12.
The results indicate relatively stable classification performance across all machine learning algorithms. Mean cross-validation accuracy values ranged from approximately 0.83 to 0.86, while the associated standard deviations remained comparatively small. The weighted voting ensemble achieved the highest average cross-validation accuracy, followed closely by SVM, Random Forest, and LightGBM. The relatively narrow error bars suggest consistent classification performance across validation folds and provide evidence that the observed classification performance was not driven by a small subset of observations.
The stability observed across repeated validation folds provides additional support for the robustness of the proposed machine learning framework and reduces concerns regarding excessive sensitivity to particular training–testing partitions.

4.4.2. Class-Specific Classification Performance

To further assess classification robustness across the three AI adoption readiness profiles, class-specific performance metrics were examined for the best-performing Support Vector Machine (SVM) classifier. Table 13 presents the Precision, Recall, and F1-score values for each readiness category.
The results indicate consistently strong classification performance across all readiness profiles. The Low AI Adoption Readiness profile achieved the highest recall value (Recall = 1.000), indicating that all respondents assigned to the low-readiness profile in the testing dataset were correctly classified. This result suggests that respondents assigned to the profile reported limited AI readiness and implementation characteristics formed a relatively distinct readiness profile within the TOE–UTAUT feature space. The Moderate AI Adoption Readiness profile achieved a Precision of 0.936, Recall of 0.898, and F1-score of 0.917. Although classification performance remained strong, the slightly lower recall compared with the other classes suggests that some respondents within the transitional readiness stage were classified into an adjacent readiness profile. This finding is theoretically plausible because moderate readiness profiles share characteristics with both lower and higher readiness profiles. Similarly, the Advanced AI Adoption Readiness profile demonstrated strong classification performance, with Precision, Recall, and F1-score values of 0.933, 0.903, and 0.918, respectively. These results indicate that respondents assigned to the advanced-readiness profile reported higher readiness scores, and implementation capability was successfully differentiated from the remaining readiness profile. Overall, the class-specific performance results demonstrate balanced classification capability across all three respondent-perceived AI readiness profiles. The relatively consistent F1-scores across classes suggest that the classification framework did not disproportionately favor any single readiness profile and maintained stable performance throughout the multiclass classification environment.

4.4.3. Confusion Matrix Analysis

To further examine classification behavior at the observation level, a confusion matrix was generated for the best-performing classifier (SVM). Figure 3 presents the classification outcomes obtained from the hold-out testing dataset.
The confusion matrix demonstrates strong classification accuracy across all readiness profiles. Respondents assigned to the Low AI Adoption Readiness profile were classified with perfect accuracy, with no observed misclassification into alternative categories. Similarly, the Advanced AI Adoption Readiness profile exhibited high classification accuracy, with only a limited number of observations incorrectly assigned to the Moderate Adoption Readiness profile.
Most classification errors occurred within the Moderate Adoption Readiness category. Specifically, a small number of respondent-perceived organizational readiness were classified as either Low or Advanced readiness profiles. This pattern is theoretically reasonable because the moderate adoption profile represents a transitional readiness stage situated between lower and higher levels of organizational AI readiness. Consequently, some overlap between neighboring readiness profiles is expected.
Overall, the confusion matrix results indicate that the machine learning framework successfully captured the primary distinctions among respondent-perceived AI readiness profiles while maintaining strong classification consistency across the hold-out testing dataset.

4.5. SHAP-Based Explainability Results

To improve the transparency and interpretability of the machine learning classification framework, SHAP (SHapley Additive exPlanations) analysis was conducted using the XGBoost classifier. Although the Support Vector Machine (SVM) achieved the highest classification performance among the evaluated models, XGBoost was selected for explainability analysis because tree-based ensemble models allow direct estimation of SHAP values and provide stable observation-level feature-attribution interpretations. The SHAP analysis was therefore employed as a post hoc explainability mechanism rather than as an alternative performance evaluation framework. Figure 4 presents the SHAP summary plot (beeswarm-style), which visualizes the aggregated multiclass feature-attribution patterns obtained using the aggregation procedure described in Section 3.8. The horizontal axis represents SHAP values, indicating the contribution of each TOE–UTAUT construct to the classification outcome, while the color gradient reflects the magnitude of the original feature values. Features appearing at the top of the figure exhibit larger aggregated mean absolute SHAP values, indicating greater overall feature importance across the three respondent-perceived AI readiness profile classes.
The reported mean absolute SHAP values represent the simple arithmetic mean of the class-specific mean absolute SHAP values across the three respondent-perceived AI readiness profile classes, as described in Section 3.8. The SHAP analysis indicated that Actual Use (AU), Technological Factors (TEC), Behavioral Intention (BI), and Facilitating Conditions (FC) exhibited the highest mean absolute SHAP values, with AU (0.48) and TEC (0.46) emerging as the most influential predictors within the classification framework. BI (0.41) and FC (0.40) also demonstrated substantial attribution magnitudes, indicating that implementation-oriented readiness, technological capability, enabling support conditions, and behavioral willingness showed comparatively larger feature-attribution magnitudes in differentiating among the internally derived respondent-perceived AI readiness profiles. In contrast, Environmental Factors (ENV), Performance Expectancy (PE), and Organizational Factors (ORG) demonstrated comparatively smaller mean absolute SHAP values. ENV exhibited the lowest overall attribution value (0.14), suggesting that external environmental conditions contributed less to the classification process than implementation-oriented and organizational readiness characteristics. Similarly, PE (0.20) and ORG (0.24) demonstrated comparatively weaker attribution patterns within the trained classification model.
As illustrated in Figure 4, AU, TEC, BI, and FC exhibited relatively wider SHAP value distributions, indicating greater variability in their feature-attribution patterns across individual observations within the multiclass classification framework. This pattern suggests that the contribution of these constructs varied across observations and readiness profiles, reflecting their stronger involvement in the classification process. In contrast, ORG, PE, and ENV exhibited comparatively narrower SHAP distributions concentrated around zero, indicating weaker and more stable attribution patterns across observations. These attribution patterns are broadly consistent with the feature-importance rankings obtained from the Random Forest, XGBoost, permutation-importance, and overall explainability analyses, thereby providing additional evidence regarding the stability and robustness of the observed predictor contribution patterns [71].
It is important to note that the readiness profiles used as classification labels were generated through clustering procedures based on the same TOE–UTAUT feature space. Consequently, the SHAP results should be interpreted as explanatory feature-attribution patterns that describe how the classifier distinguishes among internally derived readiness profiles rather than as evidence of causal determinants of AI adoption. Therefore, the SHAP analysis serves as a descriptive interpretability mechanism that enhances transparency of the classification process while avoiding causal inference. Because the reported SHAP values are based on aggregated multiclass feature importance, they should be interpreted as global descriptive measures of overall predictor contribution rather than class-specific explanations for any individual readiness profile. Overall, the SHAP-based explainability analysis complements the clustering and machine learning results by providing insight into the relative contribution patterns of TOE–UTAUT constructs within the classification framework. The findings suggest that implementation-oriented readiness, technological capability, enabling support conditions, and behavioral intention play a prominent role in distinguishing among the identified AI adoption readiness profiles, while external environmental factors contribute comparatively less to profile differentiation within the classification model [72].

5. Discussion

This study investigated respondent-perceived organizational AI adoption readiness in Thailand’s logistics and supply chain industry using clustering, supervised machine learning, ensemble learning, and SHAP-based explainability techniques. The findings suggest that AI readiness should not be viewed as a homogeneous or linear phenomenon. Instead, AI readiness reflects a multidimensional respondent-perceived organizational readiness condition associated with technological capabilities, organizational support, and behavioral acceptance. This supports the view that readiness for emerging technologies depends not only on technology availability but also on broader socio-technical capabilities required for implementation [70].
The identification of three AI readiness profiles indicates substantial differences in respondent-perceived organizational readiness for AI adoption. These profiles should be interpreted as internally distinguishable patterns within the TOE–UTAUT feature space rather than fixed readiness-profile groups or externally validated readiness patterns. Rather than representing simple stages along a single continuum, these profiles reflect different combinations of technological readiness, organizational capability, and employee acceptance. This finding reinforces the multidimensional nature of AI readiness and highlights the limitations of binary adoption perspectives that overlook organizational heterogeneity. The predominance of the Moderate AI Adoption cluster suggests that many respondents perceived their organizations as being in transitional readiness patterns associated with digital transformation rather than having reached advanced AI readiness. This finding is consistent with studies in emerging economies, where respondents often perceive considerable differences in organizational infrastructure, managerial support, workforce readiness, and implementation resources across respondent-perceived organizational readiness [9]. The concentration of respondents within the moderate-readiness profile suggests that AI adoption is often associated with respondent-perceived organizational readiness conditions required for operational integration rather than by technology availability alone.
Higher readiness scores among respondents in the Advanced AI Readiness profile further suggest that respondent-perceived organizational AI preparedness is associated with the alignment of technological resources, organizational support, implementation capability, and employee acceptance. This supports socio-technical perspectives emphasizing that perceived organizational transformation is associated with both technological and human readiness conditions. Conversely, respondents assigned to lower-readiness profiles may perceive greater implementation barriers despite access to AI technologies, suggesting that technology investments alone may be insufficient without supporting respondent-perceived organizational capabilities and readiness conditions [70].
The machine learning results showed that TOE–UTAUT constructs possess strong discriminatory power for distinguishing AI readiness profiles. The superior performance of the Support Vector Machine (SVM) suggests that relationships among TOE–UTAUT dimensions may be nonlinear. This indicates that respondent-perceived AI readiness profiles are associated with combinations of technological, organizational, environmental, and behavioral dimensions rather than isolated construct differences, making readiness profiling a useful complement to conventional linear approaches [35].
The strong performance of XGBoost, LightGBM, and the weighted voting ensemble further supports the use of machine learning for readiness classification. However, classification analytics should not be viewed as a replacement for explanatory adoption theories. Instead, machine learning serves as a complementary tool for identifying respondent-perceived readiness patterns and uncovering multidimensional associations within the TOE–UTAUT feature space that may not be evident through traditional statistical methods [44]. The integration of classification and explanatory approaches therefore offers valuable opportunities for advancing AI adoption research.
The SHAP-based explainability analysis provided additional insight regarding the relative contribution patterns of TOE–UTAUT dimensions within the readiness profile framework. Actual Use (AU), Technological Factors (TEC), Facilitating Conditions (FC), and Behavioral Intention (BI) demonstrated comparatively larger feature-attribution distributions across the multiclass classification framework. Based on the mean absolute SHAP values, these constructs contributed more prominently to the differentiation of the internally derived respondent-perceived AI readiness profiles than the remaining TOE–UTAUT dimensions. The prominence of these factors suggests that implementation-oriented readiness, technological infrastructure capability, and organizational support conditions play relatively greater roles in the classification process than external environmental pressure alone [35]. The reported SHAP feature-attribution patterns represent aggregated explanatory information across the multiclass classification framework and should therefore be interpreted as descriptive measures of relative feature importance rather than class-specific directional effects.
From a managerial perspective, the results suggest that respondents assigned to higher-readiness profiles reported stronger perceptions of technological infrastructure, employee capability, organizational support, and change-management readiness. Such internal capability development may be associated with higher levels of respondent-perceived organizational AI readiness than strategies focused primarily on external pressures. In contrast, Environmental Factors (ENV) and Effort Expectancy (EE) demonstrated comparatively lower classification contribution patterns within the classification framework. One possible explanation is that external environmental pressure and perceived ease of use may become comparatively less important once respondents perceive their organizations to have progressed toward higher perceived levels of AI implementation readiness. Among respondents reporting greater exposure to digital-transformation initiatives, implementation capability and organizational readiness may therefore be more strongly associated with AI readiness-profile differentiation than initial technology-perception factors alone [73]. This does not negate the importance of environmental influences but suggests that their association with readiness-profile differentiation may vary across adoption stages.
A methodological consideration should be noted when interpreting the classification results. The readiness-profile labels used in supervised learning were generated through K-means clustering based on the same TOE–UTAUT construct space later used for classification. Consequently, the models were designed to reproduce internally derived readiness profiles rather than predict an independent adoption outcome. Therefore, the reported performance should be interpreted as evidence of internal consistency and profile differentiation rather than external classification validity. Future studies should validate the framework using independent performance indicators, longitudinal outcomes, or externally verified measures of AI implementation success.
It should be emphasized that the identified AI readiness profiles represent internally derived and respondent-perceived readiness patterns within the TOE–UTAUT feature space. These profiles should not be interpreted as externally validated organizational readiness patterns or independently verified categories of AI adoption readiness. Overall, the findings support the view of AI readiness as a multidimensional respondent-perceived organizational readiness phenomenon associated with technological, organizational, and behavioral dimensions. Beyond confirming the relevance of TOE–UTAUT dimensions, this study demonstrates the value of combining clustering, machine learning, and explainable AI to identify heterogeneous readiness patterns. By integrating theory-informed predictors with classification analytics, the proposed framework provides an exploratory and interpretable approach for identifying heterogeneous respondent-perceived AI readiness patterns and understanding respondent-perceived organizational readiness for AI implementation within logistics and supply chain environments [40].

6. Conclusions

This study developed a clustering-based framework for profiling perceived organizational AI readiness among logistics and supply chain professionals in Thailand by integrating clustering analysis, supervised machine learning classification, ensemble learning, and SHAP-based explainability analysis within a theory-informed TOE–UTAUT analytical structure. The findings demonstrated that respondent-perceived organizational AI readiness is heterogeneous rather than uniform across the sampled logistics and supply chain professionals. The clustering analysis revealed distinct respondent-perceived AI readiness profiles, indicating substantial differences in perceived technological readiness, implementation capability, organizational support, and behavioral acceptance among respondents operating within the same digital transformation environment [40].
The machine-learning analysis demonstrated that TOE–UTAUT feature representations were effective for differentiating internally derived AI readiness profiles. The results further illustrate how clustering, classification, and explainable artificial intelligence techniques can be integrated to support readiness profiling in organizational technology-adoption contexts. Because the readiness profiles were generated through clustering procedures within the same TOE–UTAUT feature space used for classification, the findings should be interpreted as evidence of readiness-profile differentiation rather than prediction of an independent or externally validated AI adoption outcome [35].
The study contributes to respondent-perceived organizational AI readiness literature by repositioning AI readiness as a data-driven respondent-perceived organizational readiness phenomenon rather than solely a behavioral adoption outcome. Rather than treating TOE–UTAUT exclusively as a causal explanatory structure, the study demonstrates how theory-informed organizational and behavioral dimensions can support the identification, differentiation, and interpretation of AI readiness profiles within a data-driven analytical framework [11].
The study demonstrates that TOE–UTAUT dimensions can serve as theory-informed feature representations for readiness-profile differentiation and interpretation. The integrated analytical framework further illustrates how clustering, classification, and explainable machine-learning techniques can be combined to support transparent AI readiness profiling within organizational technology-adoption contexts. Overall, the proposed framework provides a complementary data-driven respondent-perceived organizational readiness perspective for understanding respondent-perceived organizational AI readiness within logistics environments. Rather than serving as a classification model of externally validated AI adoption outcomes, the framework should be interpreted as a readiness-profile differentiation and classification approach that combines clustering, machine learning, and explainable artificial intelligence to improve transparency in AI readiness assessment. The framework may support future readiness assessment, digital transformation planning, and explainable profiling analytics research across broader technology adoption and organizational analytics contexts [70]. Furthermore, the framework may assist managers in identifying respondent-perceived readiness gaps, prioritizing capability-development needs associated with different readiness profiles, and providing a diagnostic lens for considering targeted AI implementation strategies based on distinct respondent-perceived readiness-profile characteristics.
It should also be emphasized that the identified readiness profiles were derived from individual respondents’ assessments of organizational conditions rather than objective organization-level audits or independently verified measures of AI readiness. Accordingly, the findings should be interpreted as internally distinguishable readiness patterns derived from the TOE–UTAUT feature space rather than externally derived profiles of organizational AI maturity.

7. Limitations and Future Research

This study has several limitations. First, the cross-sectional research design captured respondent-perceived organizational AI readiness profiles at a single point in time and may not reflect longitudinal changes in AI implementation behavior. Future research may employ longitudinal designs to examine the evolution of AI readiness perceptions and implementation practices over time.
Second, the study utilized purposive sampling within Thailand’s logistics and supply chain industry. Although appropriate for AI-related organizational analysis, the findings may not be fully generalizable to other industries or countries. Future studies may therefore apply the proposed framework in different industrial and cross-national contexts.
Third, the AI readiness profile groups were generated using clustering-based segmentation rather than externally validated organizational benchmarks. Consequently, the readiness profiles should be interpreted as internally derived respondent-perceived readiness classifications rather than definitive industry standards. Future research may incorporate external performance indicators, respondent-perceived AI readiness profile metrics, or expert validation procedures to strengthen readiness-profile assessment capability.
Fourth, an important methodological limitation relates to the analytical workflow used in this study. The AI readiness profile labels were generated through K-means clustering based on the same TOE–UTAUT construct space subsequently employed for supervised classification. Consequently, the machine learning models were evaluated on their ability to differentiate and reproduce internally derived readiness profiles rather than predict an independent or externally validated AI adoption outcome. The proposed framework should therefore be interpreted as a proof-of-concept readiness profiling and classification approach. Future research may perform clustering exclusively on training data and subsequently assign unseen observations to clusters in order to provide stronger out-of-sample validation.
Fifth, the analytical framework focused primarily on TOE–UTAUT dimensions associated with AI readiness and adoption. Additional factors such as organizational culture, AI governance, cybersecurity readiness, leadership capability, and regulatory uncertainty were not explicitly incorporated into the framework. Future studies may therefore extend the predictor structure to include broader organizational and institutional dimensions.
Sixth, although SHAP-based explainability analysis improved interpretive transparency, the feature contribution results should not be interpreted as evidence of causal relationships among TOE–UTAUT dimensions. Future research may integrate readiness profiling analytics with longitudinal or explanatory approaches to further investigate AI adoption dynamics.
Finally, all variables were collected from the same respondents using a single self-reported survey instrument. Although procedural and statistical remedies were implemented to reduce common method bias, the possibility of respondent perception bias and single-source bias cannot be completely eliminated. Future studies may strengthen external validity by incorporating multiple data sources, objective organizational performance indicators, archival records, independently verified AI implementation measures, or longitudinal observations of AI adoption practices.

Author Contributions

Conceptualization, W.S., K.W. and W.N.; methodology, W.S., K.W. and W.N.; software, W.S. and K.W.; validation, W.S., K.W. and W.N.; formal analysis, W.S.; investigation, W.S.; resources, W.S.; data curation, W.S.; writing-original draft preparation, W.S.; writing-review and editing, K.W. and W.N.; visualization, W.S.; supervision, W.S. and W.N.; project administration, W.S.; funding acquisition, K.W. and W.N. All authors have read and agreed to the published version of the manuscript.

Funding

This research project was financially supported by Mahasarakham Business School, Mahasarakham University, Thailand (Grant number: 690326/2569).

Institutional Review Board Statement

The study was conducted in accordance with the Declaration of Helsinki and approved by the Ethics Committee for Human Research of Mahasarakham University, Thailand (Ethics Approval No. 205-094/2026, approved on 4 March 2026).

Informed Consent Statement

Informed consent was obtained from all subjects involved in the study.

Data Availability Statement

Data are available on request from the corresponding author.

Acknowledgments

The authors would like to express their sincere gratitude to the anonymous reviewers and the Academic Editor for their constructive comments and valuable suggestions. Their insightful feedback has substantially improved the methodological rigor, clarity, and overall quality of this manuscript.

Conflicts of Interest

The authors declare no conflicts of interest.

Abbreviations

The following abbreviations are used in this manuscript:
AIArtificial Intelligence
AUCArea Under the Receiver Operating Characteristic Curve
AUActual Use
BIBehavioral Intention
EEEffort Expectancy
ENVEnvironmental Factors
FCFacilitating Conditions
F1-ScoreHarmonic Mean of Precision and Recall
K-meansK-means Clustering Algorithm
LightGBMLight Gradient Boosting Machine
MLMachine Learning
ORGOrganizational Factors
PEPerformance Expectancy
RFRandom Forest
SHAPSHapley Additive exPlanations
SISocial Influence
SVMSupport Vector Machine
TECTechnological Factors
TOETechnology–Organization–Environment
UTAUTUnified Theory of Acceptance and Use of Technology
XAIExplainable Artificial Intelligence
XGBoostExtreme Gradient Boosting

Appendix A. Measurement Constructs, Items, and Sources

All constructs were measured using a five-point Likert scale ranging from 1 = Strongly Disagree to 5 = Strongly Agree. The measurement items were adapted from established TOE and UTAUT literature and refined through expert review and pilot testing prior to the main survey.
Table A1. Measurement Constructs, Items, and Sources.
ConstructItem CodeMeasurement ItemSource
Technological Factors (TEC)TEC1Your organization has sufficient and appropriate information technology infrastructure to adopt artificial intelligence in operations.[55]
TEC2Your organization’s data systems are sufficiently complete, accurate, and reliable to support the application of artificial intelligence.[55]
TEC3Existing information technologies in your organization can be integrated with artificial intelligence without major system modifications.[55]
Organizational Factors (ORG)ORG1Top management demonstrates commitment and support for adopting artificial intelligence in logistics and supply chain operations.[55]
ORG2Your organization has sufficient human resources to invest in and implement artificial intelligence projects.[55]
ORG3Your organization has clearly defined plans, policies, or strategies for adopting artificial intelligence in work processes.[55]
Environmental Factors (ENV)ENV1Competitive pressure in the logistics and supply chain industry encourages your organization to adopt artificial intelligence.[55]
ENV2Expectations from customers, business partners, or external stakeholders influence your organization to adopt artificial intelligence.[55]
ENV3The adoption of artificial intelligence by other organizations in the same industry influences your organization’s decision to adopt such technology.[55]
Performance Expectancy (PE)PE1The use of artificial intelligence enhances my work efficiency.[56]
PE2Artificial intelligence improves my overall job performance in logistics and supply chain operations.[56]
PE3The application of artificial intelligence improves the quality, accuracy, and precision of logistics and supply chain tasks.[56]
Effort Expectancy (EE)EE1Learning to use artificial intelligence is not complicated for me.[56]
EE2The artificial intelligence technologies used by my organization are suitable and easy to use in logistics and supply chain processes.[56]
EE3I can learn how to use artificial intelligence quickly.[56]
Social Influence (SI)SI1Individuals who influence decision-making in my organization encourage the use of artificial intelligence at work.[56]
SI2My organization expects employees to use artificial intelligence in logistics and supply chain operations.[56]
SI3My supervisors emphasize and support the actual use of artificial intelligence in work practices.[56]
Facilitating Conditions (FC)FC1I have sufficient resources and tools to effectively use artificial intelligence in logistics and supply chain tasks.[56]
FC2My organization provides appropriate training or knowledge development to support working with artificial intelligence.[56]
FC3The artificial intelligence systems I use are supported by manuals, teams, or help centers that ensure continuous and effective use.[56]
Behavioral Intention (BI)BI1I intend to use artificial intelligence in logistics and supply chain operations in the near future.[56]
BI2I plan to continuously use artificial intelligence as part of logistics and supply chain operations.[56]
BI3I am willing to integrate artificial intelligence into my organization’s current work processes.[56]
Actual Use (AU)AU1Currently, my organization has already implemented artificial intelligence in logistics and supply chain operations.[56]
AU2Employees in my organization use artificial intelligence as part of their daily logistics and supply chain tasks.[56]
AU3Artificial intelligence has been systematically integrated into my organization’s logistics and supply chain processes.[56]

Appendix B. Pilot Test Summary

Prior to the main data collection, a pilot study was conducted with 30 professionals working in Thailand’s logistics and supply chain sector. The purpose of the pilot test was to evaluate questionnaire clarity, item comprehensibility, content relevance, and preliminary reliability before full-scale administration. Participants were selected based on the same inclusion criteria applied in the main survey, including experience in logistics and supply chain operations and familiarity with digital technologies used in organizational contexts. Respondents were asked to complete the questionnaire and provide feedback regarding wording clarity, item relevance, questionnaire structure, and overall ease of completion. The pilot-test results indicated that the questionnaire items were generally clear and understandable. Minor revisions were made to improve wording consistency and readability across several items. No items were removed during the pilot-testing phase because all indicators demonstrated acceptable content relevance and were considered appropriate for measuring the intended TOE–UTAUT constructs. Preliminary reliability analysis of the pilot data showed satisfactory internal consistency, with Cronbach’s alpha values for all constructs exceeding the recommended threshold of 0.70, indicating acceptable reliability for subsequent large-scale data collection.
Following pilot testing, the revised questionnaire was distributed in the main survey, resulting in 520 valid responses. Reliability and validity assessments conducted using the full sample demonstrated satisfactory psychometric properties. Cronbach’s alpha coefficients ranged from 0.747 to 0.877, Composite Reliability (CR) values ranged from 0.749 to 0.877, and Average Variance Extracted (AVE) values ranged from 0.499 to 0.704. Confirmatory factor analysis further supported measurement adequacy, with excellent model-fit statistics (χ2 = 289.915, df = 288, p = 0.457, CFI = 0.9997, TLI = 0.9997, RMSEA = 0.0036, SRMR = 0.0228).
These results provide evidence that the measurement instrument possessed satisfactory reliability, convergent validity, and construct validity, supporting its use for clustering analysis, machine learning classification, and explainable artificial intelligence analyses conducted in this study.

Appendix C. Construct Source Mapping

To enhance transparency and theoretical rigor, Table A2 summarizes the theoretical foundations and key references associated with each construct included in the measurement instrument. The constructs were derived from the Technology–Organization–Environment (TOE) framework and the Unified Theory of Acceptance and Use of Technology (UTAUT), which served as the conceptual basis for questionnaire development.
Table A2. Theoretical Origin of Measurement Constructs.
ConstructTheoretical FoundationKey References
Technological Factors (TEC)Technology–Organization–Environment (TOE) Framework[55]
Organizational Factors (ORG)Technology–Organization–Environment (TOE) Framework[55]
Environmental Factors (ENV)Technology–Organization–Environment (TOE) Framework[55]
Performance Expectancy (PE)Unified Theory of Acceptance and Use of Technology (UTAUT)[56]
Effort Expectancy (EE)Unified Theory of Acceptance and Use of Technology (UTAUT)[56]
Social Influence (SI)Unified Theory of Acceptance and Use of Technology (UTAUT)[56]
Facilitating Conditions (FC)Unified Theory of Acceptance and Use of Technology (UTAUT)[56]
Behavioral Intention (BI)Unified Theory of Acceptance and Use of Technology (UTAUT)[56]
Actual Use (AU)Unified Theory of Acceptance and Use of Technology (UTAUT)[56]

References

  1. Tan, L.; Chan, M. Artificial Intelligence Application In Supply Chain Management And Logistics. Innov. Technol. Stud. 2024, 1, 10–16. [Google Scholar] [CrossRef]
  2. Adesoga, T.O.; Ajibaye, T.O.; Nwafor, K.C.; Imam-Lawal, U.T.; Ikekwere, E.A.; Ekwunife, D.I. The rise of the “smart” supply chain: How AI and automation are revolutionizing logistics. Int. J. Sci. Res. Arch. 2024, 12, 790–798. [Google Scholar] [CrossRef]
  3. Balfaqih, H. Artificial Intelligence and Smart Logistics Systems in Industry 4.0. In Proceedings of the International Conference on Industrial Engineering and Operations Management; IEOM Society International: Southfield, MI, USA, 2023. [Google Scholar] [CrossRef]
  4. Liu, W. The Intelligent Evolution of the E-commerce Logistics Supply Chain System Driven by Artificial Intelligence. Adv. Econ. Manag. Political Sci. 2025, 212, 151–156. [Google Scholar] [CrossRef]
  5. Kedia, V.; Priyadarshini naik, P.; K, N. AI in Logistics and Supply Chain Optimization. REST J. Bank. Account. Bus. 2025, 4, 74–78. [Google Scholar] [CrossRef]
  6. Chayutthanabun, A.; Suanmali, S.; Chinda, T. The Adoption of Smart Warehouse Technology in Thailand. J. Eng. Proj. Prod. Manag. 2024, 14, 0025. [Google Scholar] [CrossRef]
  7. Wongwuttiwat, J.; Lawanna, T.; Tantontrakul, T. The state of digital technology and innovation development: The comparative position of Thailand in ASEAN. Electron. J. Inf. Syst. Dev. Ctries. 2024, 90, e12311. [Google Scholar] [CrossRef]
  8. Phong, B.H.; Hai, T.T.; Dan, N.L.; Chi, V.T.Y.; Bach, P.; Yen, C.T.; Giang, L.T. Applications of Artificial Intelligence (AI) In the Logistics Industry in Vietnam: Opportunities and Challenges. Int. J. Sci. Res. Manag. 2025, 13, 2202–2207. [Google Scholar] [CrossRef]
  9. Thanyawatpornkul, R. AI Literacy and Skills for Organizational Transformation in Thai Enterprises. Open J. Leadersh. 2025, 14, 723–748. [Google Scholar] [CrossRef]
  10. Abulail, R.N.; Badran, O.N.; Shkoukani, M.A.; Omeish, F. Exploring the Factors Influencing AI Adoption Intentions in Higher Education. Computers 2025, 14, 230. [Google Scholar] [CrossRef]
  11. Pinto, A.S.; Abreu, A.; Cota, M.P.; Paiva, J. A meta analysis of TOE factors driving organizational adoption of artificial intelligence across industries. Discov. Artif. Intell. 2025. Advance online publication. [Google Scholar] [CrossRef]
  12. Yadav, H.; Dhar, R.L. Rethinking Organizational AI Adoption: An Event-Based Perspective on Employee Responses. In Academy of Management Proceedings; Academy of Management: Valhalla, NY, USA, 2025; Volume 2025, p. 16596. [Google Scholar] [CrossRef]
  13. Kirivan, V.; Leelasantitham, A. An Integrated TOE–Institutional–Sustainability Conceptual Model for Digital Supply Chain Finance Adoption in Emerging Economies. J. Mob. Multimed. 2025, 21, 881–938. [Google Scholar] [CrossRef]
  14. Pinyanitikorn, N.; Atthirawong, W.; Chanpuypetch, W. Examining the Intention to Adopt an Online Platform for Freight Forwarding Services in Thailand: A Modified Unified Theory for Acceptance and Use of Technology (UTAUT) Model Approach. Logistics 2024, 8, 76. [Google Scholar] [CrossRef]
  15. Unnikrishnan, R. Understanding Antecedents of Artificial Intelligence adoption—A Machine Learning Approach. In International Conference on Data Science and Applications; Springer Nature: Cham, Switzerland, 2026; pp. 214–227. [Google Scholar] [CrossRef]
  16. Fang, X.; Zhou, J.; Pantelous, A.A.; Lu, W. A machine learning and clustering-based methodology for the identification of lead users and their needs from online communities. Expert Syst. Appl. 2024, 248, 123381. [Google Scholar] [CrossRef]
  17. Basu, A. Explaining ML predictions with SHAP. In Proceedings of the 24th Python in Science Conference; SciPy: Tacoma, WA, USA, 2025; pp. 14–37. [Google Scholar] [CrossRef]
  18. Mpanza, S.S. Revisiting the Technological-Organizational-Environmental (TOE) Framework and Diffusion of Innovation (DOI): A Theoretical Review for Artificial Intelligence (AI) Adoption. Int. J. Appl. Res. Bus. Manag. 2025, 6, 95–112. [Google Scholar] [CrossRef]
  19. Yuliani, P.N.; Suprapti, N.W.S.; K., I.G.J.A.W.; Piartrini, P.S. The Literature Review on UTAUT 2: Understanding Behavioral Intention and Use Behavior of Technology in the Digital Era. Int. J. Soc. Sci. Bus. 2024, 8, 208–222. [Google Scholar] [CrossRef]
  20. Panez, K.M.H.; Ramirez, D.B.C.; Valero, J.C.T.; Parejas, R.A.R. Artificial intelligence optimizes supply chains in search of predictive and sustainable logistics. In Proceedings of the 2025 International Symposium on Artificial Intelligence and Computational Social Sciences; ACM: New York, NY, USA, 2025; pp. 297–306. [Google Scholar] [CrossRef]
  21. Bhanumathi, M.; Swetha, M.; Sivasakthi, K.; T. P., A.; Subhash, S.; S. R., S.S. Transforming Logistics and Supply Chains with AI: Opportunities and Barriers. In Revolutionizing Quick Commerce with AI Tools and Technologies; IGI Global Scientific Publishing: Hershey, PA, USA, 2025; pp. 251–274. [Google Scholar] [CrossRef]
  22. Coşkun, İ.Y. Artificial Intelligence-Driven Logistics and Supply Chain Management: Industry Applications and Future Perspectives. Akıllı Ulaşım Sist. VE Uygulamaları Derg. 2025, 8, 217–236. [Google Scholar] [CrossRef]
  23. Burov, Y.; Kuliavets, A. Artificial Intelligence in Logistics: Opportunities and Challenges. Comput. Syst. Netw. 2024, 16, 1–10. [Google Scholar] [CrossRef]
  24. Cooper, M. Barriers to AI Adoption in Supply Chain Management: Perspectives from Industry Leaders. Preprints 2025, 2025040581. [Google Scholar] [CrossRef]
  25. Dung, N.N.; Duc, P.M. Digital Transformation Strategy in the Logistics Sector of Emerging Markets: A Case Study of Indotrans, Vietnam. Asian Bus. Res. J. 2025, 10, 60–66. [Google Scholar] [CrossRef]
  26. Parihar, A.S.; Singh, H.; Singh, V.V.; Gupta, A.K.; Kapur, P.K.; Kumar, A. The acceptance of generative artificial intelligence technology: An empirical study by applying structural equation modelling. Int. J. Syst. Assur. Eng. Manag. 2025. Advance online publication. [Google Scholar] [CrossRef]
  27. Uren, V.; Edwards, J.S. Technology readiness and the organizational journey towards AI adoption: An empirical study. Int. J. Inf. Manag. 2023, 68, 102588. [Google Scholar] [CrossRef]
  28. Gottumukkala, S.; Prasad, S.S. Decoding the Organisational AI Adoption: What Do Theories and Frameworks Reveal? J. Int. Commer. Law Technol. 2025, 6, 744–754. [Google Scholar] [CrossRef]
  29. Taherdoost, H.; Mohamed, N.; Madanchian, M. Navigating Technology Adoption/Acceptance Models. Procedia Comput. Sci. 2024, 237, 833–840. [Google Scholar] [CrossRef]
  30. Thomas, D.; Yao, Y. Technology-Organization-Environment Meta-Review and Construct Analysis: Insights for Future Research. In Proceedings of the Hawaii International Conference on System Sciences 2023 (HICSS-56), Maui, HI, USA, 3–6 January 2023. [Google Scholar] [CrossRef]
  31. Prayogi, D.W.; Safirin, M.T. Technology Adoption and User Satisfaction in Industrial Information Systems. Acad. Open 2025, 10, 10–14. [Google Scholar] [CrossRef]
  32. Hosmani, A.P.; Raghukant, P. Fintech Adoption in the Digital Age: A Study Using the Utaut Framework. Int. J. Adv. Res. Commer. Manag. Soc. Sci. 2025, 8, 83–92. [Google Scholar] [CrossRef]
  33. Permana, D.S.; Sayidah, N.; Adi, S.U. The Unified Theory of Acceptance and Use of Technology (UTAUT) Used on Mobile Application: Literature Review. Eduvest—J. Univers. Stud. 2024, 4, 120–141. [Google Scholar] [CrossRef]
  34. Maestro, S.; Rana, P. Variables Impacting the AI Adoption in Organizations. Int. J. Sci. Res. Arch. 2024, 12, 1055–1060. [Google Scholar] [CrossRef]
  35. Horani, O.M.; Al-Adwan, A.S.; Yaseen, H.; Hmoud, H.; Al-Rahmi, W.M.; Alkhalifah, A. The critical determinants impacting artificial intelligence adoption at the organizational level. Inf. Dev. 2025, 41, 1055–1079. [Google Scholar] [CrossRef]
  36. Muhyi, H.A.; Sukmadewi, R.; Chan, A.; Kahfi, A.A. Organizational Readiness For Artificial Intelligence With Systematic Mapping Study In Public And Private Sectors. Sosiohumaniora 2025, 26, 483–494. [Google Scholar] [CrossRef]
  37. Mkhonto, M.; Zuva, T. Review of Technology Adoption Models and Theories at Organizational Level. In Data Analytics in System Engineering; Springer: Cham, Switzerland, 2024; pp. 322–330. [Google Scholar] [CrossRef]
  38. Taha, K. Tree-based ensemble learning models for protein-protein interactions detection: A review and experimental evaluation. BioData Min. 2025, 19, 1. [Google Scholar] [CrossRef] [PubMed]
  39. Oyewole, G.J.; Thopil, G.A. Data clustering: Application and trends. Artif. Intell. Rev. 2023, 56, 6439–6475. [Google Scholar] [CrossRef] [PubMed]
  40. Hao, X.; Demir, E. Artificial intelligence in supply chain management: Enablers and constraints in pre-development, deployment, and post-development stages. Prod. Plan. Control. 2025, 36, 748–770. [Google Scholar] [CrossRef]
  41. Promsa-Ad, S.; Kittiphattanabawon, N. Unveiling Business Activity Patterns of Digital Transformation through K-Means Clustering with Universal Sentence Encoder in Transport and Logistics Sectors. J. Telecommun. Digit. Econ. 2024, 12, 222–241. [Google Scholar] [CrossRef]
  42. McPhillips, M. AI Adoption in Open Innovation Partnerships: Trends, Challenges, and Strategic Implications. In European Conference on Knowledge Management; Academic Conferences International Limited: Reading, UK, 2025; Volume 1, pp. 627–635. [Google Scholar] [CrossRef]
  43. Fan, Z.; Yu, Z.; Yang, K.; Chen, W.; Liu, X.; Li, G.; Yang, X.; Chen, C.L.P. Diverse Models, United Goal: A Comprehensive Survey of Ensemble Learning. CAAI Trans. Intell. Technol. 2025, 10, 959–982. [Google Scholar] [CrossRef]
  44. Martinović, M.; Dokic, K.; Pudić, D. Comparative Analysis of Machine Learning Models for Predicting Innovation Outcomes: An Applied AI Approach. Appl. Sci. 2025, 15, 3636. [Google Scholar] [CrossRef]
  45. Patel, P. Evaluating Ensemble Learning Strategies for Enhanced Medical Diagnostics: Insights from Real-World Datasets. In 2025 6th International Conference on Problems of Cybernetics and Informatics (PCI); IEEE: New York, NY, USA, 2025; pp. 1–4. [Google Scholar] [CrossRef]
  46. Kabir, S.; Hossain, M.S.; Andersson, K. A Review of Explainable Artificial Intelligence from the Perspectives of Challenges and Opportunities. Algorithms 2025, 18, 556. [Google Scholar] [CrossRef]
  47. Pelegrina, G.D.; Duarte, L.T.; Grabisch, M. A k-additive Choquet integral-based approach to approximate the SHAP values for local interpretability in machine learning. Artif. Intell. 2023, 325, 104014. [Google Scholar] [CrossRef]
  48. Tang, D.; Wei, J. Prediction and Characteristic Analysis of Enterprise Digital Transformation Integrating XGBoost and SHAP. J. Adv. Comput. Intell. Intell. Inform. 2023, 27, 780–789. [Google Scholar] [CrossRef]
  49. Xiong, H. Research on the Transformation Mechanism, Challenges, and Development Path of AI Empowering the Logistics Industry. J. Electron. Res. Appl. 2025, 9, 321–327. [Google Scholar] [CrossRef]
  50. Batool, F.; Afzal, M.H.; Raja, I.B.; Usmani, H.R.; Soomro, A. Intelligent Supply Chains 5.0: The Role of Artificial Intelligence in Building Predictive, Sustainable and Adaptive Logistics Systems. J. Asian Dev. Stud. 2026, 14, 45–58. [Google Scholar] [CrossRef]
  51. Oncioiu, I.; Mândricel, D.A.; Hojda, M.H. Artificial Intelligence-Enabled Digital Transformation in Circular Logistics: A Structural Equation Model of Organizational, Technological, and Environmental Drivers. Logistics 2025, 9, 102. [Google Scholar] [CrossRef]
  52. Sangsawang, T.; Tang, L.; Pasawano, T. Predicting AI Service Focus in Companies Using Machine Learning: A Data Mining Approach with Random Forest and Support Vector Machine. Int. J. Appl. Inf. Manag. 2024, 4, 111–126. [Google Scholar] [CrossRef]
  53. Zhu, C.; Liu, X.; Chen, D. Prediction of digital transformation of manufacturing industry based on interpretable machine learning. PLoS ONE 2024, 19, e0299147. [Google Scholar] [CrossRef] [PubMed]
  54. Breitenbach, T.; Dandekar, T. Adaptive sampling methods facilitate the determination of reliable dataset sizes for evidence-based modeling. Front. Bioinform. 2025, 5, 1528515. [Google Scholar] [CrossRef] [PubMed]
  55. Tornatzky, L.G.; Fleischer, M.; Chakrabarti, A.K. The Processes of Technological Innovation; Issues in Organization and Management Series; Lexington Books: Lanham, MD, USA, 1990; Available online: https://books.google.co.th/books?id=QWiwAAAAIAAJ (accessed on 6 April 2026).
  56. Venkatesh, V.; Morris, M.G.; Davis, G.B.; Davis, F.D. User Acceptance of Information Technology: Toward a Unified View. MIS Q. 2003, 27, 425–478. [Google Scholar] [CrossRef]
  57. Gaberson, K.B. Measurement reliability and validity. AORN J. 1997, 66, 1092–1094. [Google Scholar] [CrossRef] [PubMed]
  58. Gong, M.; Chen, S.; Yu, Z. An AI-Driven Behavioral Analysis and Decision Support System for Smart Tourism Mini-Programs: Integrating UTAUT2 with Machine Learning. In Proceedings of the 2025 International Conference on Management Science and Computer Engineering; ACM: New York, NY, USA, 2025; pp. 192–198. [Google Scholar] [CrossRef]
  59. Manta, E.-M.; Geambasu, M.C.; Birlan, I. Mapping AI Adoption across Europe: A Cluster Analysis of National Responsibility. In Proceedings of the International Conference on Business Excellence; Sciendo: Warsaw, Poland, 2025; Volume 19, pp. 1532–1545. [Google Scholar] [CrossRef]
  60. Lathifah, S.N.; Azzahra, Z.F. AI-Driven Customers Segmentation Using K-Means Clustering. G-Tech Jurnal Teknol. Terap. 2025, 9, 320–329. [Google Scholar] [CrossRef]
  61. Mohamed, M. Toward Smart Logistics: Hybrization of Intelligence Techniques of Machine Learning and Multi-Criteria Decision-Making in Logistics 5.0. Multicriteria Algorithms Appl. 2023, 1, 42–57. [Google Scholar] [CrossRef]
  62. Wang, Q.; Jin, Z. Machine Learning-Driven Social Network Analysis of Logistic Standardization Development. In Proceedings of the 2025 International Conference on Management Science and Computer Engineering; ACM: New York, NY, USA, 2025; pp. 100–107. [Google Scholar] [CrossRef]
  63. Boizard, E.; Chardon, G.; Pascal, F. Enhancing the Explainability of Gradient Boosting Classification Through Comparable Samples Selection. In 2024 32nd European Signal Processing Conference (EUSIPCO); IEEE: New York, NY, USA, 2024; pp. 2027–2031. [Google Scholar] [CrossRef]
  64. Noviandy, T.R.; Idroes, G.M.; Hardi, I. Enhancing Loan Approval Decision-making: An Interpretable MACHINE LEARNING Approach Using Lightgbm For Digital Economy Development. Malays. J. Comput. (MJOC) 2024, 9, 1734–1745. [Google Scholar] [CrossRef]
  65. Ergün, S. Explaining Xgboost Predictions With Shap Value: A Comprehensive Guide To Interpreting Decision Tree-based models. New Trends Comput. Sci. 2023, 1, 19–31. [Google Scholar] [CrossRef]
  66. Pathak, A.; Bansal, V. Factors Influencing the Readiness for Artificial Intelligence Adoption in Indian Insurance Organizations. In International Working Conference on Transfer and Diffusion of IT; Springer: Cham, Switzerland, 2024; pp. 43–55. [Google Scholar] [CrossRef]
  67. Akman, G.; Yorur, B.; Boyaci, A.I.; Chiu, M.-C. Assessing innovation capabilities of manufacturing companies by combination of unsupervised and supervised machine learning approaches. Appl. Soft Comput. 2023, 147, 110735. [Google Scholar] [CrossRef]
  68. Ngo, C.; Chi, O. AI Adoption Patterns in Banking: A PCA-Based K-Means Clustering Analysis Using Evident AI Index Rankings. Int. J. Data Sci. 2025, 6, 29–39. [Google Scholar] [CrossRef]
  69. Shatat, A.S. Artificial Intelligence Competencies in Logistics Management: An Empirical Insight from Bahrain. J. Inf. Knowl. Manag. 2024, 23, 2350059. [Google Scholar] [CrossRef]
  70. Pal, T.; Islam, M. Assessing Organizational AI Readiness in Critical Infrastructure: An Integrated Maturity Framework for Healthcare Systems and Supply Chain Management. Am. J. Sch. Res. Innov. 2025, 4, 613–621. [Google Scholar] [CrossRef]
  71. Zentner, A. Organizational AI Workforce Coverage and Maturity: A Framework for Responsible AI Adoption and Governance. SSRN Electron. J. 2026. [Google Scholar] [CrossRef]
  72. Sabharwal, R.; Miah, S.J.; Wamba, S.F.; Cook, P. Extending application of explainable artificial intelligence for managers in financial organizations. Ann. Oper. Res. 2025, 354, 309–339. [Google Scholar] [CrossRef]
  73. Yuen, S.; Wu, H. Smart Logistics and Artificial Intelligence Practices in Industry 4.0 ERA. Int. J. Manag. Value Supply Chains 2022, 13, 1–7. [Google Scholar] [CrossRef]
Figure 1. Conceptual Framework for AI Adoption Readiness Profile Classification Using TOE–UTAUT Predictors, Clustering Analysis, and Explainable Machine Learning.
Information 17 00672 g001
Figure 2. Mean ten-fold cross-validation F1-score (±SD) of the individual classifiers and the weighted soft-voting ensemble evaluated on the training subset. Note: Error bars represent one standard deviation across ten cross-validation folds.
Information 17 00672 g002
Figure 3. Confusion Matrix of the Best-Performing SVM Classification.
Information 17 00672 g003
Figure 4. Global SHAP Summary Plot (Beeswarm-Style) Showing Aggregated Mean Absolute SHAP Feature-Attribution Patterns across the Three Respondent-Perceived AI Readiness Profile Classes.
Information 17 00672 g004
Table 1. Synthesis of Prior Research and Identified Gaps in AI Readiness Profiling Research.
Research ThemeRepresentative Findings from Prior StudiesKey LimitationResearch Need Addressed in This Study
AI adoption and technology acceptanceStudies based on TOE and UTAUT demonstrate that technological, organizational, and behavioral factors significantly influence AI adoption and usage behavior. Performance expectancy, organizational support, and user attitudes consistently emerge as important adoption-related factors [49,50].Existing studies primarily employ explanatory statistical approaches and focus on adoption determinants, with limited attention to heterogeneous readiness conditions or organizational segmentation.Identification of heterogeneous respondent-perceived AI readiness profiles rather than assuming homogeneous adoption behavior.
Organizational AI readiness and digital transformationAI adoption and digital transformation readiness vary substantially across organizations, industries, and firm sizes. Organizational context, resource availability, and digital capability influence AI implementation outcomes [51].Limited application of profiling approaches capable of differentiating readiness conditions within the same industry environment.Clustering-based discovery of respondent-perceived AI readiness profiles within Thailand’s logistics industry.
AI-driven profiling analytics and decision supportAI-enabled profiling analytics improve forecasting accuracy, decision quality, risk management, employee assessment, and organizational performance across multiple domains [52].Existing studies provide limited empirical evidence regarding readiness profiling in logistics environments and rarely integrate explainable AI techniques.Development of a theory-informed readiness-profiling framework integrating organizational, technological, and behavioral dimensions.
Machine-learning and ensemble-learning applicationsEnsemble-learning frameworks improve model stability, robustness, and classification performance in complex analytical environments. Hybrid approaches frequently outperform individual learning models [53].Existing studies mainly emphasize predictive performance and operational forecasting rather than readiness-profile differentiation and organizational technology adoption analysis.Application of machine-learning classification and ensemble-learning techniques to differentiate internally derived AI readiness profiles.
Explainable artificial intelligence (XAI) and SHAPSHAP and related explainability techniques improve transparency, trust, accountability, and interpretability of machine-learning outcomes while supporting managerial decision-making [54,55].Explainability approaches remain underutilized in organizational AI readiness and technology-adoption research. Limited evidence exists regarding how organizational and behavioral dimensions contribute to readiness-profile differentiation.SHAP-based interpretation of feature-attribution patterns associated with AI readiness-profile differentiation.
Integrated AI readiness profiling frameworksPrior studies generally examine AI adoption, machine learning, clustering, ensemble learning, and explainable AI separately. Few studies combine these approaches within a unified analytical framework [49,50,51,52,53,54,55].Fragmented analytical approaches limit understanding of heterogeneous readiness conditions and reduce interpretability of AI adoption research.Development of an integrated AI readiness-profiling framework combining TOE–UTAUT feature representations, K-means clustering, supervised machine-learning classification, ensemble learning, and SHAP-based explainability.
Table 2. Experimental Design and Analytical Pipeline.
StageAnalytical ProcedurePurpose
1Data screening and cleaningRemove incomplete, duplicate, and invalid responses prior to analysis
2Construct score preparationGenerate TOE–UTAUT construct-level composite variables
3Feature normalizationApply Min–max scaling to ensure comparable feature ranges across analytical procedures
4K-means clustering analysisIdentify heterogeneous respondent-perceived AI readiness profiles
5Cluster label generationGenerate internally derived, respondent-perceived AI readiness profile labels from clustering outcomes
6Stratified data partitioningDivide the labeled dataset into 80:20 training and testing subsets
7Supervised model trainingTrain RF, SVM, XGBoost, and LightGBM classifiers using TOE–UTAUT predictors
8Cross-validation procedureApply 10-fold cross-validation on the training subset to assess model stability
9Weighted voting ensemble constructionDerive ensemble weights from cross-validation performance on the training subset
10Hold-out testing evaluationsEvaluate readiness-profile classification performance using unseen testing data while retaining cluster labels generated from the full dataset
11SHAP-based explainability analysisInterpret TOE–UTAUT predictor contributions to AI adoption readiness profile classification outcomes
Table 3. Parameter Configuration of Clustering and Machine Learning Models.
ModelParameterSetting
K-meansNumber of clusters ((k))3
Maximum iterations300
Convergence tolerance0.0001
Number of initializations10
RFNumber of trees200
Maximum depth10
Minimum samples split4
Minimum samples leaf2
Random state42
SVMRegularization parameter ((C))1.0
Gamma0.01
Tolerance0.001
Maximum iterations1000
Random state42
XGBoostNumber of estimators300
Learning rate0.05
Maximum depth6
Subsample ratio0.8
Colsample bytree0.8
Gamma0.1
Minimum child weight1
Lambda regularization1.0
Random state42
LightGBMNumber of estimators300
Learning rate0.05
Maximum depth8
Number of leaves31
Feature fraction0.8
Bagging fraction0.8
Bagging frequency5
Minimum data in leaf20
Lambda regularization1.0
Random state42
Note: Parameter settings were empirically configured for comparative multiclass classification evaluation. Multiclass probability estimates generated by the individual classifiers were subsequently incorporated into the weighted soft-voting ensemble framework described in Section 3.7.
Table 4. Reliability and Convergent Validity Results.
ConstructLoading RangeCronbach’s αCRAVE
TEC0.748–0.7810.8110.8110.589
ORG0.807–0.8100.8500.8500.653
ENV0.707–0.7500.7700.7690.526
PE0.728–0.7360.7750.7750.535
EE0.663–0.7300.7470.7490.499
SI0.728–0.7680.7950.7950.564
FC0.755–0.8440.8400.8420.640
BI0.754–0.7660.8050.8050.579
AU0.832–0.8430.8770.8770.704
Note: Recommended thresholds: standardized factor loading ≥ 0.60, Cronbach’s α ≥ 0.70, Composite Reliability (CR) ≥ 0.70, and Average Variance Extracted (AVE) ≥ 0.50. Although the AVE value for Effort Expectancy (EE) was marginally below the recommended threshold (AVE = 0.499), its CR exceeded 0.70, indicating acceptable convergent validity.
Table 5. Confirmatory Factor Analysis Model Fit Results.
Fit IndexValueRecommended Threshold
χ2289.915Lower is better
df288
p-value0.457>0.05
CFI0.9997>0.90
TLI0.9997>0.90
RMSEA0.0036<0.08
SRMR0.0228<0.08
Note: All model fit indices exceeded commonly recommended thresholds, indicating excellent model fit and supporting the construct validity of the measurement model.
Table 6. Cluster Validation Statistics Across Alternative Cluster Solutions.
kWCSSSilhouetteDavies–BouldinCalinski–Harabasz
2133.5320.3051.215335.043
3110.1200.2231.456257.704
4102.2890.1531.972197.763
597.4960.1432.043161.643
694.2490.1352.097137.052
Table 7. Cluster Distribution Results.
ClusterDescriptionFrequencyPercentage
Cluster 1Low AI Readiness Profile15630.0
Cluster 2Moderate AI Readiness Profile22142.5
Cluster 3Advanced AI Readiness Profile14327.5
Total 520100.0
Table 8. Mean TOE–UTAUT Construct Scores Across Internally Derived AI Readiness Profiles.
ConstructCluster 1 Low AdoptionCluster 2 Moderate AdoptionCluster 3 Advanced Adoption
TEC2.483.564.41
ORG2.613.634.38
ENV2.893.524.12
PE2.573.714.56
EE2.743.484.11
SI2.663.574.29
FC2.413.624.47
BI2.333.764.61
AU2.143.414.53
Table 9. ANOVA Comparison of TOE–UTAUT Construct Scores Across Readiness Profiles.
ConstructF-Valuep-ValueEta-Squared (η2)
TEC266.377<0.0010.508
ORG257.734<0.0010.499
ENV98.304<0.0010.276
PE187.898<0.0010.421
EE146.898<0.0010.362
SI159.324<0.0010.381
FC275.352<0.0010.516
BI280.592<0.0010.520
AU381.382<0.0010.596
Table 10. Comparative Performance of Machine Learning Classification Models.
ModelAccuracyPrecisionRecallF1-ScoreAUC
Random Forest (RF)0.8850.8810.8780.8790.963
Support Vector Machine (SVM)0.9230.9270.9240.9250.987
XGBoost0.9040.8990.8960.8970.978
LightGBM0.8940.8910.8880.8890.971
Weighted Voting Ensemble0.9040.9080.9020.9050.982
Table 11. Training and Testing Performance Comparison.
ModelTraining AccuracyTesting AccuracyDifference
Random Forest (RF)0.9130.8850.028
Support Vector Machine (SVM)0.9360.9230.013
XGBoost0.9280.9040.024
LightGBM0.9210.8940.027
Weighted Voting Ensemble0.9310.9040.027
Table 12. Mean Ten-Fold Cross-Validation F1-Score and Normalized Voting Weights Used for the Weighted Soft-Voting Ensemble.
Base ModelMean Ten-Fold Cross-Validation F1-ScoreAssigned Weight
Random Forest (RF)0.8370.250
Support Vector Machine (SVM)0.8530.255
XGBoost0.8200.245
LightGBM0.8340.249
Total 1.000
Table 13. Class-Specific Classification Performance of the Best-Performing SVM Classifier.
AI Adoption Readiness ProfilePrecisionRecallF1-ScoreSupport
Low Adoption0.8891.0000.94124
Moderate Adoption0.9360.8980.91749
Advanced Adoption0.9330.9030.91831
Macro Average0.9190.9340.925104
Disclaimer/Publisher’s Note: The statements, opinions and data contained in all publications are solely those of the individual author(s) and contributor(s) and not of MDPI and/or the editor(s). MDPI and/or the editor(s) disclaim responsibility for any injury to people or property resulting from any ideas, methods, instructions or products referred to in the content.