Article

A Quantitative Explainability Quality Index Framework for Visual XAI in Fuzzy Group Decision-Making for Supply Chain Facility Localization


Department of Aeronautical Engineering, Chaoyang University of Technology, Taichung 41349, Taiwan
Information 2026, 17(6), 519; https://doi.org/10.3390/info17060519
Submission received: 29 April 2026 / Revised: 17 May 2026 / Accepted: 21 May 2026 / Published: 23 May 2026

Abstract

Visual explainable artificial intelligence (XAI) is an important mechanism for connecting analytically complex decision models with practitioners who must interpret and act upon their outputs in industrial supply chains. In facility localization problems, wafer foundries and other capital-intensive manufacturers must evaluate geographically dispersed candidate sites against multiple uncertain criteria. The ability to communicate fuzzy group decision-making (FGDM) outcomes in a transparent, interpretable form has direct operational relevance. The literature has introduced hanging gradient bar charts, gradient bidirectional scatterplots, and traceable aggregation charts as visual XAI instruments for semiconductor supply chain localization that show substantial reductions in interpretation error versus conventional plots. However, the quantitative assessment of explanation quality itself remains underdeveloped. To address such a gap, this research proposes a quantitative explainability quality index (XQI) that formalizes visual explanation quality in FGDM as a composite measurable construct. XQI integrates two complementary layers: (1) An objective explainability layer (OEI), consisting of normalized fuzzy interpretation deviation, response time, ranking fidelity, and interpretation accuracy, and (2) a subjective explainability layer (SEI), consisting of perceived understanding, perceived transparency, decision confidence, and cognitive load. Trust, acceptance, and decision quality are downstream outcome constructs rather than components of the index. A weighted linear combination of OEI and SEI produces a single index for systematic, reproducible comparison across competing visualization designs. A structural equation model is specified as a planned validation mechanism for examining how explanation quality may relate to trust, acceptance, and downstream decision quality. The proposed validation framework includes a semiconductor facility localization scenario, three visualization conditions, and a planned participant pool of 150–240 supply chain managers, engineers, and graduate students. The XQI framework transforms visual XAI from a descriptive communication aid into a testable decision-support construct, thereby addressing a key evaluation gap in the FGDM visualization literature.

1. Introduction

The increasing incorporation of artificial intelligence (AI) in industrial and supply chains has improved prediction, optimization, and decision-making involving multiple criteria, but has accentuated a classic dilemma: as model capabilities increase, understanding their internal logic becomes more challenging, and practitioners, managers, engineers, and experts find it difficult to evaluate the reliability of any recommendation intended for implementation. In industrial and supply chain contexts, predictive power alone cannot address this dilemma. Decision support systems must provide explanations, or users will find it difficult to evaluate sensitivities, recognize outliers, or take final accountability for any decision [1,2,3].
Within the broader development of explainable AI (XAI), visual XAI occupies a particularly important role. Industrial decision makers often interpret explanations more effectively when model outputs are presented through charts, annotated graphs, or interactive visualizations rather than through numerical attribution scores alone. This spurs the development of visualization tools that make complex model outputs interpretable without requiring advanced statistical training. The Defense Advanced Research Projects Agency (DARPA) XAI program has recognized the importance of human-interpretable explanations and identified understandability and transparency as key design objectives for next-generation AI systems [4]. Studies on smart manufacturing argue that explainability should be treated as a human-facing capability, shaped not only by the faithfulness of an explanation to the underlying model, but also by whether users can understand, trust, and act upon the explanation in their operational context [5,6].
The semiconductor supply chain requires transparent explanations of facility investment decisions due to geopolitical disruptions, reshoring incentives, and supply chain resilience concerns [7,8]. In fuzzy group decision-making (FGDM), the decision information to be explained is more complex and uncertain. Decision makers must understand how pairwise comparisons are expressed in fuzzy numbers, how the fuzzy priorities of criteria are derived and adjusted, how aggregations of individual expert opinions are explained, and the impact on the ranking results when the spread of fuzzy membership values changes. Three new visual XAI tools (hanging gradient bar chart, gradient bidirectional scatterplot, and traceable aggregation chart) have been proposed in a group decision-making problem regarding facility location in the semiconductor supply chain, and their effectiveness at explaining fuzzy priorities quantitatively was demonstrated via a sum of absolute deviations (SADs) metric, such that they outperform the classical bar chart [9]. That study is the direct methodological predecessor of this present work. The present study intentionally uses the facility localization case and visual XAI instruments from [9] as a benchmark context, because they provide a published, reproducible basis for comparing visual explanation designs. However, the contribution of the present study differs from that of [9]. Whereas Chen et al. [9] proposed and evaluated visual instruments mainly through SAD-based interpretation error, the present study proposes a general evaluation framework that integrates objective interpretation performance, subjective explanation experience, and downstream decision outcomes into a unified XQI structure.
That study also acknowledged an important limitation: the proposed visual XAI approach does not directly quantify explanation quality, which is consequential for high-stakes industrial decision support. If visual explanations can help investment decisions in a possible multi-billion-dollar facility, then the explanations’ quality should not be evaluated by a passing impression. Indeed, black-box models should not inform such high-stakes decisions [10]. Researchers and designers require scientifically grounded answers for questions such as the following: Does the chart result in fewer interpretation errors? Does the chart exert less cognitive effort while yielding equally accurate results? Does the chart generate more trust and acceptance, resulting in better decisions? Research on XAI and decision support suggests that explainability is a multidimensional construct where transparency, understanding, trust, cognitive effort, and acceptance do not all increase together [11,12].
Motivated by these considerations, this paper presents a quantitative explainability quality index (XQI) for evaluating visual XAI in FGDM-based supply chain facility localization. XQI is not intended as an aesthetic rating scheme for visual attractiveness. It is a mathematical definition that combines objective explainability data in terms of accuracy and time on how well a chart is interpreted and subjective explainability data in terms of perceived understanding, transparency, decision confidence, and mental effort. Trust and willingness to adopt are modeled as downstream outcomes rather than internal components of XQI. The coupling of these two tiers of explainability data via XQI enables a rigorous, reproducible assessment across explanation designs, thereby elevating the evaluation of visual XAI to a testable scientific inquiry.
This paper makes four contributions to the literature. First, it extends visual XAI in FGDM from a descriptive interpretability aid to a formally operationalized and empirically testable construct. Second, it offers a mathematical index structure that integrates fuzzy visual interpretation error, response time, ranking fidelity, perceived understanding, transparency, decision confidence, and cognitive load into a unified measurement framework, while presenting trust, acceptance, and decision quality as the model’s downstream outcomes. Third, it specifies a replicable empirical validation design, including scenario, participants, visualization conditions, tasks, and analytical procedures. Fourth, it responds to recent calls for interpretable, human-centered, and operationally dependable AI-driven decision-support systems in manufacturing and supply chains [13]. This study proposes a methodological framework and a planned validation design for evaluating visual explanation quality in fuzzy group decision-making. The manuscript does not report completed participant-based empirical results. Instead, it specifies the index formulation, measurement structure, validation tasks, and planned analytical procedures required for future empirical assessment.

2. Literature Review

The literature can be divided into foundational and application-oriented contributions. Foundational XAI studies provide the conceptual basis for interpretability, transparency, and human-centered evaluation. Industrial and supply chain studies have extended these ideas to manufacturing, cyber resilience, facility localization, and fuzzy decision-support applications. This distinction is important, because the present study builds on foundational XAI evaluation principles while addressing a recent methodological need in visual XAI for fuzzy group decision-making.

2.1. Explainability Evaluation in Industrial AI Systems

Research on XAI in manufacturing and supply chain management has expanded rapidly since 2022, but has focused more deeply on developing explanation methods than on evaluating explanation quality [5,6,14]. Abhilash et al. [5] surveyed explainability approaches for next-generation smart manufacturing and highlighted the lack of standardized evaluation metrics as one of the most urgent open problems. Nikiforidis et al. [6] noted that while XAI in Industry 4.0/5.0 applications is expanding, assessing and comparing the quality of various XAI methods from a user perspective are not yet widely developed. Coussement et al. [11] have stated that, aside from objective accuracy, it is essential to evaluate XAI for the quality of decision support and proposed an integrated framework to evaluate both objective accuracy and subjective trust. Tjoa and Guan [15] called for multi-dimensional evaluation criteria in their comprehensive survey of XAI. Mohseni et al. [16] proposed a multidisciplinary framework for designing and evaluating XAI systems, considering evaluation from a user-centered perspective essential. Among the most widely adopted post hoc explanation techniques are Shapley additive explanations (SHAPs) [17] and local interpretable model-agnostic explanations (LIMEs) [18]. Both generate feature-level attribution scores that can be communicated visually. Kovari [19] published an accuracy–transparency–trust triangulation model in the journal Information, underscoring the multidimensional nature of explainability in decision-support contexts.
The theoretical foundation of the XQI framework draws on three complementary streams. First, human-centered XAI research suggests that explanation quality should be evaluated not only by technical fidelity, but also by whether users can understand and act upon the explanation. Second, the cognitive load theory implies that an explanation that is accurate yet mentally demanding may still be practically ineffective. Third, trust and acceptance models in human–AI interaction suggest that perceived understanding and transparency shape trust, while trust subsequently influences the willingness to use AI-supported recommendations. Therefore, XQI separates objective explanation performance, subjective explanation experience, and downstream human–AI outcomes.
Seminal XAI studies provide the conceptual foundation for the present framework by emphasizing interpretability, transparency, and user-centered evaluation as central requirements for responsible AI-supported decision-making. In parallel, decision-support research highlights that the usefulness of an analytical model depends not only on predictive accuracy, but also on whether users can understand, justify, and act on its recommendations. Having reviewed general XAI evaluation criteria, the next subsection focuses specifically on visual XAI and trust, because the proposed XQI is for evaluating visual explanation quality rather than algorithmic transparency alone.

2.2. Visual XAI and Trust

Alicioglu and Sun [20] reviewed visual analytics methods for XAI and emphasized that visualization-based explanation techniques can support model inspection, interpretation, and user understanding when they align with users’ analytical tasks. Cheung and Ho [21] have empirically showed that perceived explainability correlates to trust-related evaluations in AI contexts, suggesting that explanation quality shapes downstream trust formation. Although their study did not focus specifically on visual explanation formats, it supports the broader rationale for treating explainability perception as a measurable human-factor construct. These findings reinforce the theoretical rationale for treating visual explanation design as an independent research variable with measurable effects on downstream human–AI interaction outcomes. Liao et al. [22] have further documented that practitioners consistently raise questions about the reasoning process, output reliability, and uncertainty boundaries of AI recommendations—needs that numerical attribution methods like SHAP and LIME address only partially. Visual explanation instruments may better support practitioner interpretation when they are designed around the user’s actual decision workflow. This observation directly motivates the three visualization conditions compared in the present study and underscores the need for a systematic quality index that evaluates whether a given visual instrument actually meets those practitioner needs. After establishing the relevance of visual explanation and trust, the next subsection turns to fuzzy MCDM, because the present study evaluates visual explanations in a fuzzy group decision-making context.

2.3. Fuzzy Multi-Criteria Decision-Making (MCDM) and Visual Explainability

Chen et al. [23] originally proposed the underlying decision methodology for semiconductor supply chain facility localization. They developed the selectively calibrated derivation technique (SCDT) combined with generalized fuzzy TOPSIS (GFTOPSIS) as the algorithmic foundation for evaluating candidate locations under fuzzy judgment uncertainty. Building on this foundation, Chen et al. [9] introduced hanging gradient bar charts and gradient bidirectional scatterplots as dedicated visual XAI instruments for the same localization context, achieving SAD reductions of up to 90% versus standard bar charts. Lin and Chen [24] applied type-II fuzzy collaborative intelligence, drawing on the interval type-2 fuzzy set foundations of Mendel and John [25] with segmented distance diagrams for tourism destination selection under COVID-19 uncertainty, demonstrating that purpose-built visual tools can extend beyond supply chain contexts to other high-uncertainty group decision problems. Wang and Chen [26] demonstrated that partial-consensus aggregation in a fuzzy analytic hierarchy process (AHP) substantially reduces inter-expert inconsistency—a mechanism directly relevant to the traceable aggregation task evaluated in Task 3 of this study, where participants must interpret how multiple expert evaluations can be consolidated into a single group recommendation. Wang and Chen [27] developed gradient bar charts with a baseline for 3D printing facility selection in ubiquitous manufacturing, confirming the cross-domain applicability of gradient-based visual XAI instruments across different facility decision contexts. All three visualization studies [9,24,27], together with fuzzy weighted aggregated sum product assessment (WASPAS)-based decision models in broader operational decision settings [28], demonstrated the methodological relevance of fuzzy MCDM for uncertain industrial and policy decisions; none, however, have advanced a unified quality index for evaluating visual explanation quality. Because the proposed framework herein is developed for supply chain facility localization, the review turns to recent XAI studies in supply chain decision support.

2.4. Supply Chain XAI and Decision Support

Olan et al. [1] reviewed XAI capabilities in supply chain decision support and emphasized the transition from purely predictive AI to interpretable advisory AI. Sadeghi et al. [2] empirically found that XAI transparency positively relates to agile and higher-quality decision-making during supply chain cyber disruptions. Jauhar et al. [29] combined adaptive neuro-fuzzy inference system (ANFIS)-based demand prediction with SHAP analysis in perishable supply chains, illustrating how post-hoc explanation outputs can support interpretability in resilience-oriented supply chain applications. Bhatia and Albarrak [30] similarly applied XAI in food supply chain management by combining blockchain, QR codes, and an XAI-augmented faster region-based convolutional neural network (Faster R-CNN) architecture for product safety assessment, exhibiting how visual attribution outputs can support interpretability in supply chain applications.
Evaluation approaches remain fragmented. Error-based metrics such as SAD are useful for quantifying visual interpretation deviation, but they do not capture whether users perceive the visualization as transparent, trustworthy, or cognitively manageable. Conversely, survey-based measures of trust and acceptance capture subjective response, but are often detached from task-level interpretation accuracy and response time. This separation creates a methodological gap: studies evaluate either objective interpretation performance or subjective user response, but rarely both within a single index structure.
The reviewed papers collectively reveal a consistent pattern: visual XAI methods are developed and demonstrated in isolation, evaluated by ad hoc or single-dimension metrics, and seldom subjected to comparative quality assessment that integrates both objective interpretation performance and subjective user response. This gap is particularly consequential in FGDM-based facility localization, where the explanation chain spans pairwise judgment, criterion prioritization, closeness scoring, and multi-expert aggregation. Each step requires a distinct visual instrument and a corresponding evaluative lens. Table 1 maps six representative papers [1,2,9,11,24,27] against the principal methodological dimensions of the present study.
The mapping in Table 1 makes visible three structural gaps. First, studies that employ fuzzy decision methods [9,24,27] primarily evaluate visual interpretation through objective error-oriented metrics such as SAD or related visual estimation measures, while giving less attention to subjective trust, cognitive load, and acceptance. Second, supply chain XAI studies that address trust and acceptance [1,2,11] do so through general questionnaire surveys disconnected from any specific visual instrument design. Third, no study simultaneously covers all four columns (fuzzy method, visual XAI instrument, objective evaluation, and subjective evaluation) that the proposed XQI framework integrates.
The literature, taken together, lacks a unified metric that jointly evaluates objective interpretation performance, subjective explanation experience, and downstream decision relevance in fuzzy group decision-making. Fuzzy MCDM visualization studies mainly rely on error-oriented measures such as SAD, whereas human–AI interaction studies often emphasize trust or acceptance without any direct linkage to task-level visual performance. As a result, current methods do not provide a unified basis for determining whether a visual explanation is accurate, efficient, cognitively manageable, and decision-relevant at the same time. The proposed XQI addresses this gap by integrating objective and subjective explainability indicators into a single composite index, while modeling trust, acceptance, and decision quality as downstream outcomes.

3. Research Framework and Hypotheses

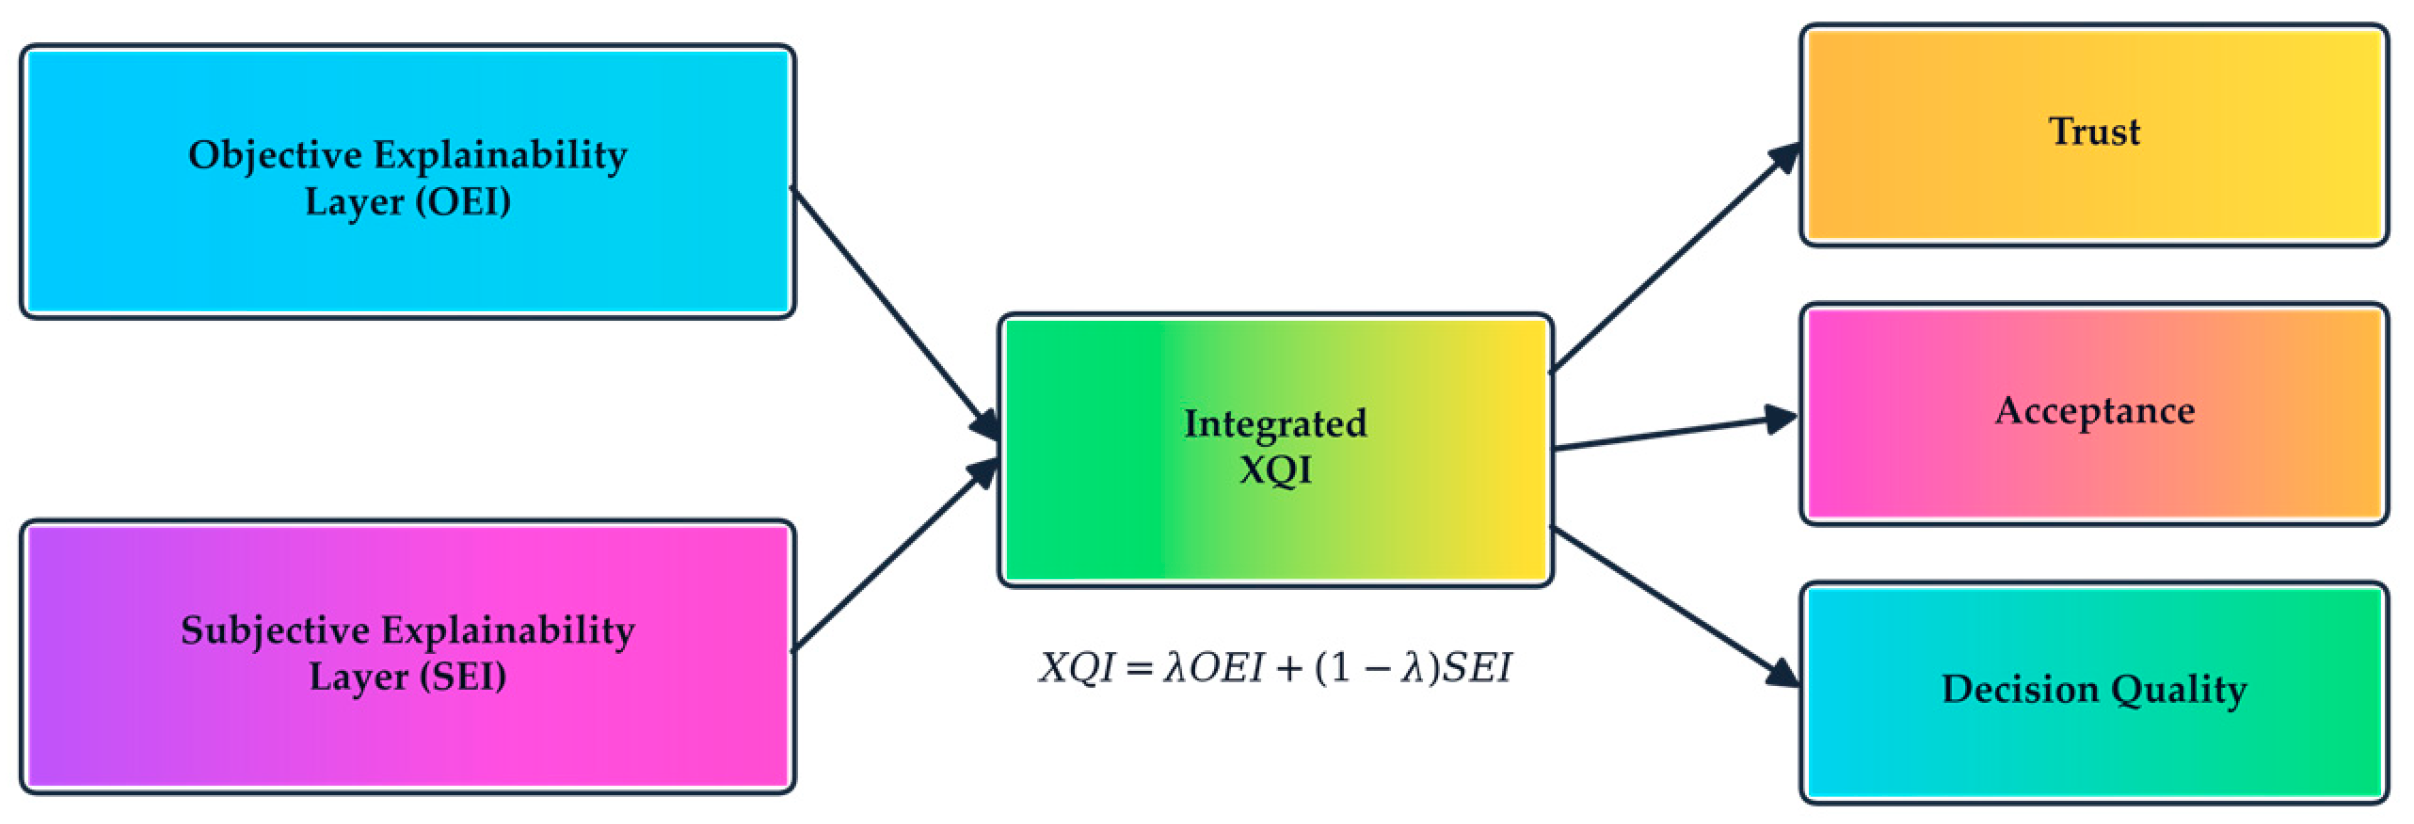
The conceptual model of this study posits that a visual explanation design influences explanation quality, which in turn affects human–AI interaction outcomes, including trust, acceptance, and decision quality. Explanation quality is decomposed into an objective layer determined by how accurately and efficiently a practitioner interprets the visual output and a subjective layer determined by how the practitioner perceives and responds to the explanation experience. The objective and subjective layers are not redundant; a chart can be visually appealing yet misleading, or accurate yet hard to read [31]. This paper’s primary contribution is separating these two layers and independently quantifying them for eventual integration into XQI. To avoid conceptual circularity, trust and acceptance are not incorporated as internal components of XQI; instead, they are modeled as downstream human–AI interaction outcomes influenced by explanation quality. Thus, OEI and SEI together form XQI, whereas trust, acceptance, and quality of the decisions are the subsequent outcomes of low or high explainability quality. Figure 1 shows the model.
Four research objectives guide the inquiry: (RO1) formalizing visual explanation quality in FGDM as a measurable composite construct; (RO2) comparing conventional charts, prior visual XAI charts, and enhanced quantified XAI dashboards in supply chain facility localization tasks; (RO3) examining how explanation quality influences trust, acceptance, and decision quality; and (RO4) developing a reusable evaluation framework for industrial supply chain AI systems.
Seven hypotheses are proposed, as follows.
H1. 
Higher objective explanation quality positively affects perceived understanding.
H2. 
Higher objective explanation quality positively affects perceived transparency.
H3. 
Higher perceived understanding and perceived transparency positively affect trust.
H4a. 
Higher cognitive load negatively affects trust.
H4b. 
Higher cognitive load negatively affects acceptance.
H5. 
Trust positively affects user acceptance of the visual XAI system.
H6. 
Integrated XQI positively predicts downstream decision quality.
H7. 
Enhanced quantified visual XAI dashboards outperform conventional charts and prior visual XAI charts in overall XQI.

4. Methodology

4.1. Research Design

The proposed validation framework forms three layers: a fuzzy facility localization scenario layer, a controlled visual comparison experiment layer, and a structural model validation layer. The three-layer design is adopted because neither a purely experimental nor a purely survey-based approach is sufficient for the purpose of this study. A purely experimental design could compare task accuracy and response time across visualization formats, but it would not explain how perceived understanding, transparency, and trust shape user response. Conversely, a purely survey-based design could measure perceived usefulness or trust, but it would not capture whether the visualization actually improves interpretation accuracy. The proposed design therefore combines a realistic fuzzy facility localization scenario, a controlled visual comparison experiment, and a structural model that links explanation quality to downstream human–AI outcomes.
In the proposed validation study, participants work through a supply chain facility localization case adapted from the semiconductor localization problem examined in another study [9]. The scenario involves eight candidate locations evaluated against five criteria: compliance with local needs, local government support and subsidies, total investment required, closeness to third-party partners, and low political and war risk under conditions of expert disagreement and fuzzy judgment uncertainty. Raw data for the scenario come from the published case to ensure ecological validity.
In the proposed experimental layer, participants are randomly assigned to one of three visualization conditions: Condition A (conventional bar charts and standard scatterplots), Condition B (the hanging gradient bar charts, gradient bidirectional scatterplots, and traceable aggregation charts introduced in [9]), and Condition C (an enhanced dashboard that augments Condition B instruments with numerical XQI feedback cues, task-level interpretive summaries, and color-coded confidence indicators). Within each condition, participants complete three task families that directly correspond to the three core visual instruments examined herein. Each task family targets a distinct step in the FGDM process and together cover the full explanation chain from pairwise judgment input to aggregated group decision output.
Table 2 summarizes each task’s design, its corresponding XAI instrument, objective performance measure, and assigned task weight π t . The experiment is set up as a between-subjects comparison. Each participant completes the task families under only one assigned visualization condition. This should avoid learning, fatigue, and carry-over effects if the same participant repeatedly interpreted all three visualization formats.
Participants first read the facility localization scenario and then complete three task families using the assigned visualization condition. For each task, they interpret the displayed fuzzy decision information, provide a numerical or ranking response, and then complete the related subjective questionnaire items. The system automatically records response time and task responses for the objective explainability layer.
In the third layer of the proposed validation study, the objective and subjective data are analyzed through reliability and validity testing, between-group comparison (ANOVA and MANOVA), and partial least squares structural equation modeling (PLS-SEM) to test H1 through H7. The participant recruitment, MANOVA comparison, PLS-SEM estimation, bootstrapping, and hypothesis testing described in this manuscript constitute a planned validation protocol. They are not reported as completed empirical procedures in the present paper.
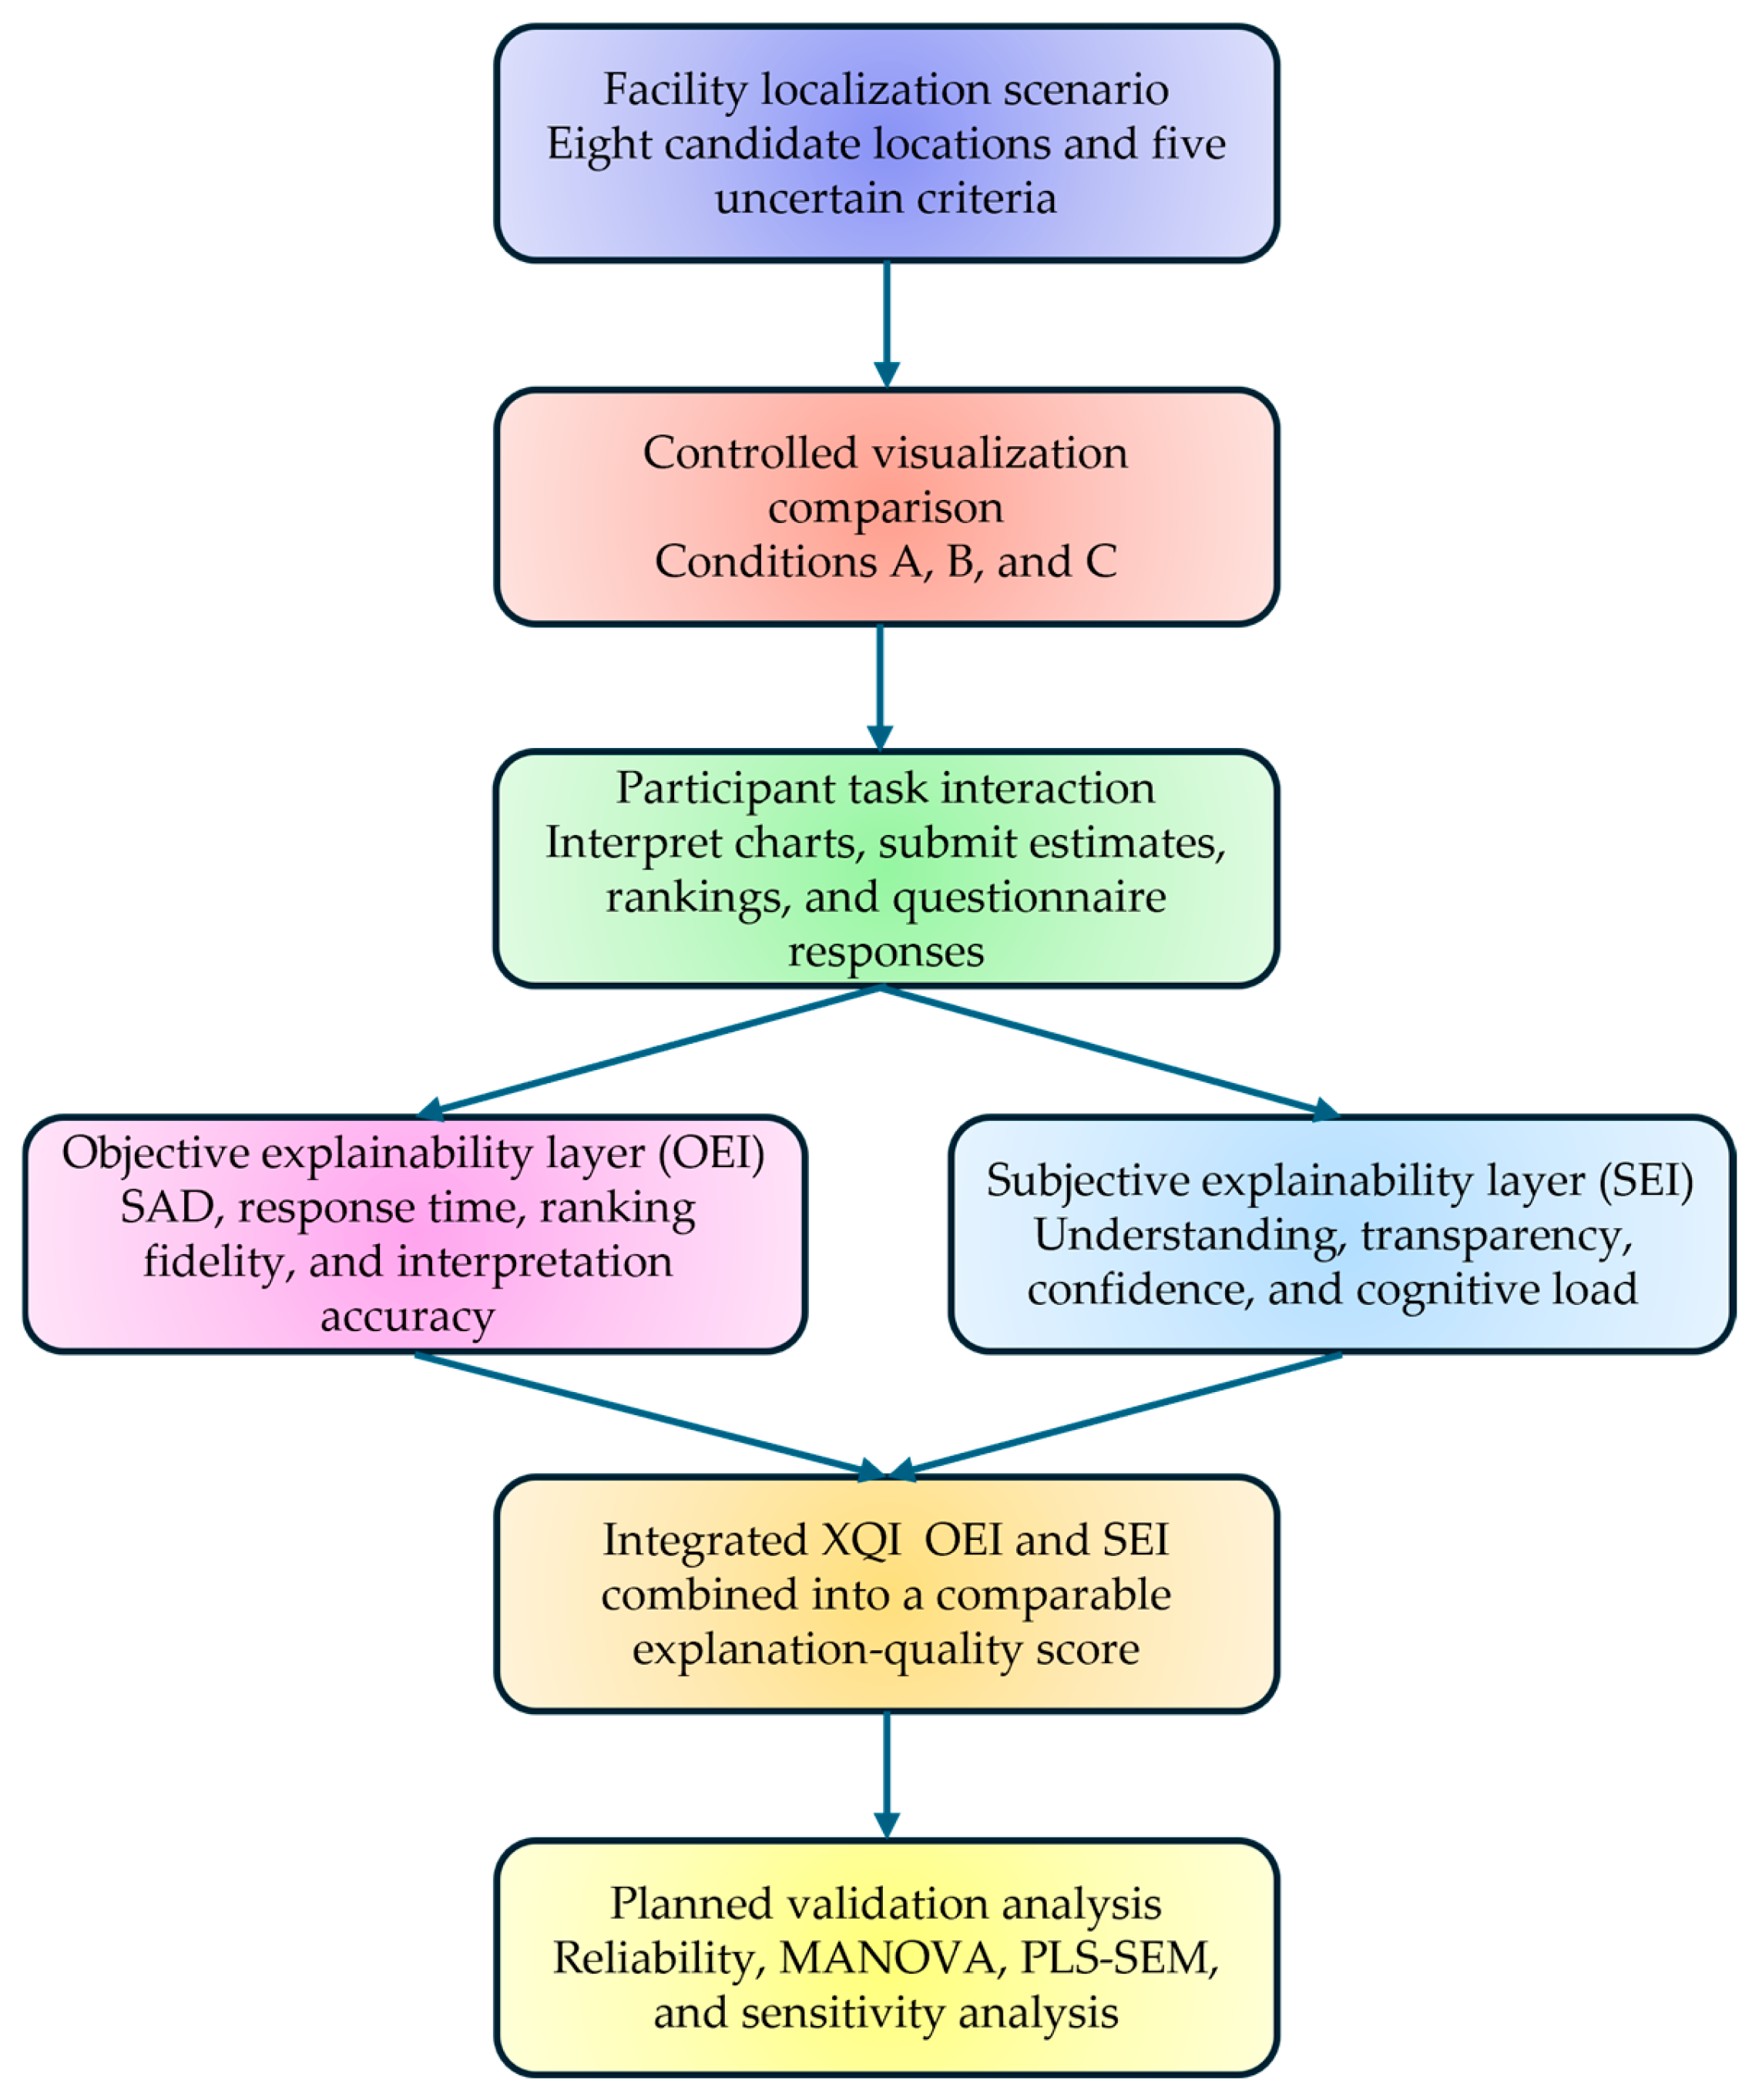
Figure 2 summarizes the methodological flow of the proposed XQI validation framework. It includes the facility localization scenario, controlled visualization comparison, objective and subjective explainability measurement, and planned structural validation.

4.2. Participants

The proposed validation study targets a sample of 150–240 participants in balanced proportions across the three conditions. Three participant groups are targeted for recruitment: supply chain or operations managers, industrial engineers or analysts, and graduate students with formal training in decision analysis. This participant composition reflects the practitioner communities likely to use FGDM-based facility decision support tools. Other XAI user studies have involved a comparable number of users [21,32]. The planned sample size of 150–240 participants should support both between-group comparison and PLS-SEM estimation. With three visualization conditions, this range provides approximately 50–80 participants per condition, allowing balanced comparison across conditions while remaining feasible for a controlled visual interpretation study. Before formal implementation, an a priori power analysis will be conducted to determine the minimum required sample size for detecting medium effects in MANOVA and the main structural paths.

4.3. Measurement

The study employs a dual-track measurement strategy that mirrors the two-layer architecture of XQI. In the proposed validation study, the first track measures objective behavioral data via automatic recording in the experimental interface: participants’ input fuzzy estimates are recorded and compared with the ground-truth values from the published semiconductor localization case [9]; response time is recorded in milliseconds from stimulus onset to participant response confirmation; and ranking results are compared with the correct expert ranking using Kendall’s tau coefficient. These objective records do not rely on self-reporting and are less susceptible to social desirability bias and recall error.
In the proposed validation study the second track collects subjective construct data using a questionnaire after each visualization condition. Six latent constructs are measured: perceived understanding, perceived transparency, cognitive load, decision confidence, trust, and acceptance. Perceived understanding, perceived transparency, decision confidence, and cognitive load constitute SEI, while trust and acceptance are modeled as two downstream outcome constructs in the structural model. Cognitive load is incorporated into the SEI formula via the transformed term ( 1 C L p j ) , so that lower cognitive load contributes positively to subjective explainability while higher cognitive load reduces the SEI contribution. Each construct is measured by three to four items on a seven-point Likert scale anchored by strongly disagree (1) and strongly agree (7). Items for understanding and transparency are adapted from the accuracy–transparency–trust instrument of Kovari [19]; trust items follow the human-factor trust scale validated by Cheung and Ho [21]; cognitive load items draw on a four-item condensed version of the National Aeronautics and Space Administration Task Load Index (NASA-TLX); and decision confidence and acceptance items are developed specifically for the proposed validation study. Table 3 summarizes the construct definitions, item counts, sample items, and scale sources for all six subjective constructs, together with the objective decision quality measure.
Because the subjective constructs are collected through questionnaire responses, the formal validation study will address possible common method bias. Procedurally, respondents will be assured of anonymity, predictor and outcome items will be separated in the questionnaire, and item wording will be kept specific and non-leading. Statistically, Harman’s single-factor test and a marker-variable approach will be used as diagnostic checks. If a single factor explains most of the covariance or the marker variable indicates substantial shared method variance, then interpretation of structural paths will be treated with caution.
The cognitive load component in Equation (6) is operationalized through the transformed term ( 1 C L p j ) . This formulation ensures that lower cognitive load increases the subjective explainability contribution, while higher cognitive load reduces it without allowing the SEI value to become negative. This is consistent with the theoretical expectation that explanation-induced cognitive burden degrades practical explanation quality even when objective accuracy is maintained [5,11]. Decision quality (DQ), listed in the final row of Table 3, is an outcome variable rather than a subjective construct. It is computed as the Kendall tau rank-correlation coefficient between the participant’s final facility location ranking and the expert consensus ranking derived from the ground-truth GFTOPSIS closeness values and therefore requires no questionnaire item.
Decision quality is further transformed into a [0, 1] scale using the following rescaled Kendall tau formulation:
D Q p j = τ p j D Q + 1 2 ,         1 τ p j D Q 1 .
This transformation places D Q p j on a [0, 1] scale, where higher values indicate stronger agreement with the expert consensus ranking.
This operationalization assumes that the expert consensus ranking derived from GFTOPSIS closeness values represents a valid performance benchmark in FGDM-based facility localization research [9,23]. However, this benchmark is model-derived rather than an objectively observed market or operational outcome. Therefore, DQ should be interpreted as aligning with the expert-supported decision model and not as proof of real-world facility performance. Future studies may supplement Kendall’s tau with decision regret, confidence-weighted accuracy, or longitudinal outcome indicators. The questionnaire is prepared in both English and traditional Chinese (characters) to accommodate the mixed participant pool. Before formal data collection, two bilingual researchers specializing in supply chain decision-making shall translate and back-translate the instrument.

5. Mathematical Formulation of XQI

5.1. Notation

XQI is constructed in three sequential layers: (1) OEI, which quantifies interpretation performance; (2) SEI, which quantifies user experience; and (3) an integrated index that combines both layers into a single comparable score. A structural equation model then connects the integrated index to downstream decision outcomes. Before presenting the layer-specific formulae, all symbols and parameters used throughout Section 5 are defined in a unified notation system to ensure that each equation can be read independently without cross-referencing earlier sections. Table 4 summarizes the complete notation, including participant and task indices, observed performance variables, latent construct scores, weighting parameters, and the final composite index.
First, all observed and latent variables are indexed by both participant p and visualization type j . Because the empirical design is a between-subjects comparison, each participant is observed under one assigned visualization condition. Index j therefore denotes the visualization condition assigned to participant p , and the visualization level index X Q I j is subsequently obtained by averaging across participants assigned to the same condition, as shown in Equation (8).
Second, the weighting parameters α r , π r , β s , and λ are treated as free parameters throughout the formulation. Their default values, listed in the rightmost column of Table 4, represent the equal-weighting benchmark case and are used in the primary analysis. Section 6 reports sensitivity analyses with alternative specifications.
Third, the SEI-related latent construct scores U p j , T R p j , D C p j , and C L p j are normalized to [0, 1] prior to entry into Equation (6). This ensures that SEI is dimensionally compatible with OEI despite the two layers having different raw measurement scales.

5.2. Objective Explainability Layer

The normalized fuzzy interpretation deviation for participant p , visualization type j , and task t is as follows:
S A D ^ p j t = k = 1 3 ω k | υ ^ p j k ( k ) υ j t ( k ) R j t k = 1 3 ω k
Here, ω k are weights assigned to the lower bound, modal value, and upper bound of the triangular fuzzy number (default: ω 1 = ω 3 = 1 , ω 2 = 2 , consistent with the SAD metric in [9]) and R j t is the normalization range for task t .
As originally formulated in [9], SAD was designed for type-1 triangular fuzzy numbers with three defining parameters. For more complex fuzzy representations, such as trapezoidal or type-2 fuzzy numbers, the weight vector ω k would need to be extended accordingly. Within the scope of the present study, which adopts type-1 TFN consistent with [9], the three-parameter SAD formulation is sufficient.
The normalized response time is as follows:
R T ^ p j t = R T p j t R T min , t R T max , t R T min , t .
For response-time normalization, R T min , t and R T max , t are respectively the minimum and maximum response times observed for task t across all participants and all visualization conditions in the formal validation dataset. Task-level normalization is used because different task families may have different cognitive demands. Condition-specific normalization is not used, because it would remove meaningful between-condition differences.
Ranking fidelity, transformed from Kendall’s tau to a [0, 1] scale, is as follows:
A C C p j t r a n k = τ p j t + 1 2 ,         1 τ p j t 1 .
The task-level objective explainability score integrates these four components, as follows:
O E I p j t = α 1 ( 1 S A D ^ p j t ) + α 2 ( 1 R T ^ p j t ) + α 3 A C C p j t r a n k + α 4 A C C p j t int .
Ranking fidelity and interpretation accuracy are conceptually related, but not identical. Ranking fidelity measures whether the participant preserves the correct ordinal ordering of alternatives, whereas interpretation accuracy measures whether the participant correctly answers task-specific comprehension questions about the displayed fuzzy information. A participant may correctly understand local chart elements, but still fail to reproduce the overall ranking, or may identify the ranking without fully understanding the visual explanation process.
The terms ( 1 S A D ^ p j t ) and ( 1 R T ^ p j t ) are used because lower interpretation deviation and shorter response time indicate better objective explainability, subject to α r 0 and r = 1 4 α r = 1 . The integrated objective explainability index across all task families is as follows:
O E I p j = t = 1 T π t O E I p j t ,         π t 0 ,         t = 1 T π t = 1 .
The weights α r and π t can be determined by analytic hierarchy process elicitation with supply chain domain experts or, alternatively, setting uniformly α r = 0.25 , π t = 1 / T for a benchmark version of the index.

5.3. Subjective Explainability Layer

The subjective explainability index is as follows:
S E I p j = β 1 U p j + β 2 T R p j + β 3 D C p j + β 4 ( 1 C L p j ) ,       β s 0 ,       s = 1 4 β s = 1 .
Here, C L p j is the normalized raw cognitive load score. The term 1 C L p j is used so that lower cognitive load contributes positively to subjective explainability, while higher cognitive load reduces the SEI contribution. As U p j , T R p j , D C p j , and C L p j are normalized to [0, 1] and the weights are non-negative and sum to one, S E I p j is bounded within [0, 1].

5.4. Integrated XQI

After deriving the objective explainability index and the subjective explainability index, the next step is to integrate the two layers into a single comparable score. The integrated XQI is defined as a convex combination of OEI and SEI, where the parameter λ controls the relative emphasis placed on objective task performance and subjective explanation experience.
X Q I p j = λ O E I p j + ( 1 λ ) S E I p j ,         0 λ 1 .
Because O E I p j [ 0 , 1 ] , S E I p j [ 0 , 1 ] , and 0 λ 1 , the integrated index X Q I p j is also bounded within [0, 1].
The contribution of XQI does not reside in mathematical complexity for its own sake. It is from the transparent integration of objective interpretation performance and subjective explanation experience into a reproducible index structure. The weighted-sum formulation is deliberately interpretable, allowing researchers and practitioners to inspect, adjust, and test the contribution of each component.
The default equal-weighting scheme is used only as a benchmark specification and not as a universal claim about the relative importance of the XQI components. In applied settings, the weights may be determined through expert elicitation, analytic hierarchy process procedures, entropy-based weighting, or data-driven optimization. Sensitivity analysis over alternative α r , β s , π t , and λ specifications is therefore necessary to evaluate whether the ranking of visualization conditions is robust to parameter choice.
The visualization-level average XQI is as follows:
X Q I j = 1 P p = 1 P X Q I p j .
A higher X Q I j indicates that visualization type j is superior in integrated explainability quality—not merely in aesthetic preference or casual understandability, but in the composite of accurate interpretation, efficient processing, perceived understanding, perceived transparency, decision confidence, and manageable cognitive demand. Parameter λ calibrates the relative weight of objective performance versus subjective experience; λ = 0.5 treats both dimensions equally, while λ > 0.5 prioritizes measurable task performance.
To assess the robustness of XQI rankings to parameter specification, sensitivity analysis is conducted by systematically varying λ { 0.3 , 0.5 , 0.7 } ,   α r uniform vs. accuracy-prioritizing vs. speed-prioritizing profiles, and π t proportional to task cognitive demand. A ranking would be considered robust if the ordinal position of Condition C relative to Condition B and Condition A remains stable across the predefined parameter combinations.

5.5. Structural Model

To specify the theoretical mechanism linking explanation quality to decision outcomes for future empirical validation, the following structural equations are proposed:
U p j = γ 1 O E I p j + γ 2 F a m i l i a r i t y p + ε 1
T R p j = γ 3 O E I p j + γ 4 F a m i l i a r i t y p + ε 2
T p j = γ 5 U p j + γ 6 T R p j γ 7 C L p j + ε 3
A p j = δ 1 T p j δ 2 C L p j + ε 4
D Q p j = θ 1 X Q I p j + θ 2 A p j + ε 5 .
Here, D Q p j denotes decision quality, operationalized as the rescaled Kendall tau agreement between a participant’s final facility-location ranking and the expert consensus ranking derived from the ground-truth GFTOPSIS closeness values, as follows:
D Q p j = τ p j D Q + 1 2 ,         1 τ p j D Q 1 .
This transformation places decision quality on a [0, 1] scale, where higher values indicate stronger agreement with the expert consensus ranking. F a m i l i a r i t y p is included as a control variable for prior experience with fuzzy decision tools, and ε 1 , ε 2 , ε 3 , ε 4 , ε 5 denote disturbance terms.

6. Planned Validation Protocol and Reporting Structure

This section specifies the planned validation protocol and reporting structure for future empirical assessment. It does not present empirical results. Table 5, Table 6 and Table 7 and Figure 3 are retained only to clarify the types of reliability checks, group comparisons, and structural relationships that should be reported when formal validation data become available. These tables and the figure should be read as reporting templates rather than as findings, estimates, or evidence.
The proposed empirical validation of the XQI framework proceeds in three analytical stages. The first stage establishes the psychometric foundation of the measurement model by verifying that the six latent constructs (understanding, transparency, cognitive load, decision confidence, trust, and acceptance) meet accepted thresholds for internal consistency, convergent validity, and discriminant validity before they are used in either the SEI computation or the structural model. Without this foundation, any path coefficient or XQI comparison result rests on measurement instruments of uncertain quality, undermining the interpretive value of the entire analysis. The psychometric evaluation follows standard PLS-SEM reporting conventions [33,34,35]: Cronbach’s alpha and composite reliability (CR) assess internal consistency; average variance extracted (AVE) assesses convergent validity; and the heterotrait–monotrait ratio (HTMT) assesses discriminant validity between construct pairs. All six constructs are expected to satisfy the benchmarks of Cronbach’s alpha ≥ 0.80, composite reliability (CR) ≥ 0.85, average variance extracted (AVE) ≥ 0.50, and heterotrait–monotrait ratio (HTMT) < 0.85, which are widely adopted in information systems and supply chain management research. Table 5 lists the planned reporting structure for assessing the measurement model in the future validation study.
Because this paper reports a proposed validation framework rather than completed empirical data collection, the reliability and validity statistics in Table 5 should be interpreted as planned reporting criteria rather than empirical findings. In the formal validation study, each reflective construct will be assessed using indicator outer loadings, Cronbach’s alpha, composite reliability, average variance extracted, and HTMT. Items with weak loadings will be reviewed or removed only when such removal is theoretically justified.
Table 5 is intended as a reporting template for future measurement model validation. In the formal validation study, the six reflective constructs will be assessed using Cronbach’s alpha, composite reliability, AVE, and HTMT. The adapted scales provide a reasonable basis for this validation procedure, but actual reliability and validity values must be determined from observed data. Any decision to retain, revise, or remove indicators will be based on both statistical evidence and theoretical justification.

6.1. Between-Group Comparison

Once psychometric adequacy of the subjective constructs has been evaluated, the second analytical stage addresses the central comparative question of the study—namely, whether the three visualization conditions differ significantly in their XQI scores and in the objective and subjective sub-components that constitute those scores. This comparison directly addresses Hypothesis H7 by testing whether Condition C, the enhanced quantified XAI dashboard, performs better than Condition B, the original visual XAI charts from [9], and Condition A, the conventional charts, in overall XQI. The hypothesis structure also compares Condition B with Condition A. The comparison further decomposes whether the advantage of enhanced visual XAI is driven primarily by the objective layer, the subjective explainability layer, or downstream response outcomes such as trust and acceptance.
In the proposed validation study, between-group differences are evaluated using one-way MANOVA with visualization condition (A, B, C) as the between-subjects factor and the full set of OEI sub-components, SEI constructs, and composite XQI as the dependent variable battery. Pairwise post-hoc contrasts are conducted using Tukey’s HSD to identify which specific condition pairs drive significant omnibus effects. Effect sizes are reported as partial η 2 , with η 2 0.14 indicating a large effect by Cohen’s convention. The λ parameter is set to its default value of 0.5 for the primary comparison, with λ { 0.3 , 0.7 } examined in sensitivity analyses to see whether the ranking of conditions is robust to objective subjective weighting. Table 6 provides the planned reporting structure for future between-group comparisons. It does not report observed group means or inferential statistics. In the formal validation study, the table will be populated with observed means, standard deviations, F-statistics, p-values, and effect sizes after data collection.
The actual comparison of OEI, SEI, and XQI across visualization conditions will be reported only after formal validation data are collected.
The formal validation study will interpret between-condition differences only after observed data are collected. At that stage, the analysis will examine whether any improvement in XQI is driven primarily by objective interpretation performance, subjective explanation experience, or both.

6.2. Planned Structural Model and Reporting Structure

The structural model is used as a parsimonious validation model rather than as a theoretically novel causal model. Its purpose is to examine whether the proposed XQI scores relate to theoretically relevant downstream outcomes, including trust, acceptance, and decision quality, after formal validation data are collected.
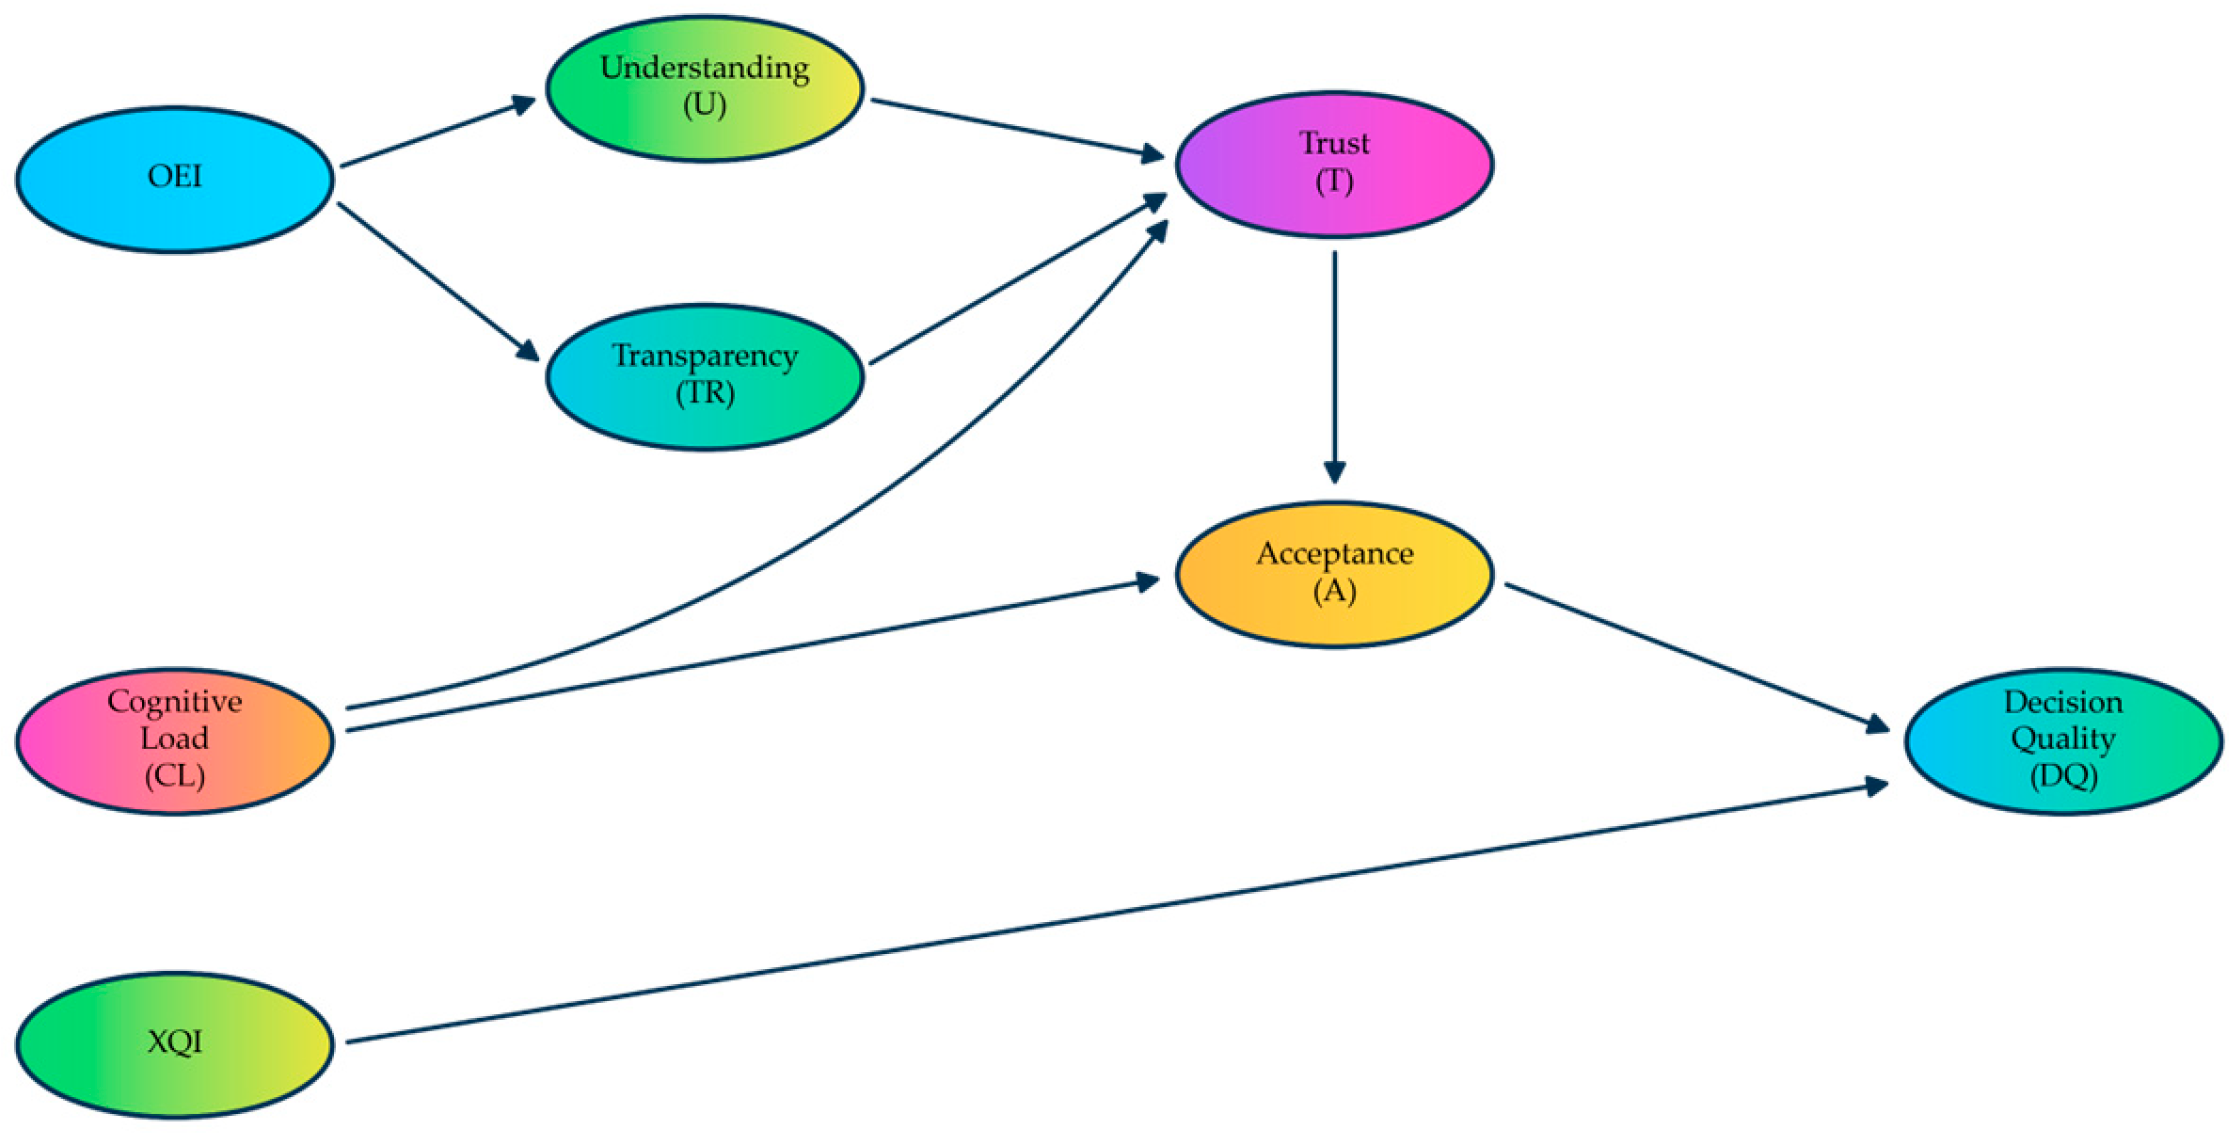
The structural model is estimated using PLS-SEM with SmartPLS 4, 5000 bootstrap resamples, two-tailed significance testing, and bias-corrected confidence intervals for direct and indirect effects. PLS-SEM is selected because the planned validation is prediction-oriented, includes a composite index structure, and combines weighted performance indicators with reflective subjective constructs. These features make PLS-SEM more suitable than CB-SEM for the proposed analytical purpose, whereas CB-SEM is more appropriate for strict covariance-based theory confirmation with an already established measurement model [33]. Figure 3 illustrates the hypothesized structural mechanism without reporting empirical or predicted path coefficients.
Path coefficients, bootstrapped t-statistics, p-values, and construct-level R 2 values are reported for the hypothesized structural paths. Direct effects are distinguished from indirect effects to clarify how objective interpretation quality shapes trust through understanding and transparency, as well as how trust subsequently influences acceptance. The direct path from XQI to decision quality evaluates whether integrated explanation quality contributes to downstream decision performance beyond subjective responses alone. The f2 effect size is also reported for each path to compare relative path strength independently of sample size. Table 7 specifies the planned reporting structure for the structural model. No path coefficient, significance level, effect size, or explained variance is reported as an empirical result in the present paper.
The formal validation study will interpret the structural paths only after observed data are collected. The analysis will focus on whether objective explainability is associated with perceived understanding and transparency, whether these subjective responses are associated with trust and acceptance, and whether XQI is associated with decision quality. This interpretation will be based on observed path coefficients, confidence intervals, effect sizes, and explained variance rather than on preset numerical expectations.

7. Discussion

The XQI framework proposed herein carries implications that extend beyond the specific case of semiconductor facility localization. At a theoretical level, the dual-layer architecture of OEI and SEI makes explicit a tension that pervades industrial XAI design, but is rarely formalized: objective interpretive correctness and subjective user experience are related yet distinct dimensions of explanation quality, and optimizing one without monitoring the other can produce systems that are accurate yet distrusted, or trusted yet misleading. By incorporating both dimensions into a single index, and by linking that index to downstream decision quality through a structural model, the proposed framework provides a more complete account of how explanation design shapes human–AI interaction than either purely technical or purely perceptual approaches alone can offer [11,12].
At a practical level, XQI gives supply chain system designers a defensible basis for comparing visualization alternatives before deployment. Rather than relying on informal usability feedback or single-item preference ratings, designers can execute the XQI protocol to run structured pre-deployment tests that generate comparable evidence across objective and subjective dimensions. The parametric flexibility of the index, particularly the α r , π t , β s , and λ weighting parameters, allows for adaptation to specific deployment contexts where, for instance, interpretation speed is more critical than cognitive comfort, or where subjective understanding is the primary adoption barrier.
Two notable limitations of the proposed framework are that the weighting parameters must be specified prior to index computation and the resulting XQI values may be sensitive to these parameter choices. Future research should investigate data-driven parameter estimation methods, such as entropy weighting or Bayesian optimization, to reduce reliance on expert-defined weights. In addition, expert elicitation or analytic hierarchy process procedures may help specify context-sensitive weights when the relative importances of accuracy, response time, ranking fidelity, confidence, and cognitive load differ across decision environments. Another limitation is that the structural model is specified using cross-sectional data, which limit causal inference. Longitudinal designs that track changes in user familiarity, trust, and decision performance across repeated interactions with visual XAI tools would strengthen future causal claims.

8. Conclusions

This paper proposes the quantitative explainability quality index (XQI) as a formal composite metric for evaluating visual explanation quality in fuzzy group decision-making for supply chain facility localization. XQI integrates an objective explainability layer, consisting of interpretation error, response time, ranking fidelity, and interpretation accuracy, with a subjective explainability layer, consisting of perceived understanding, perceived transparency, decision confidence, and cognitive load. Trust, acceptance, and decision quality are modeled as downstream outcomes through the proposed structural model. The validation design specifies the decision scenario, visualization conditions, participant groups, task structure, and analytical procedure required to empirically assess the proposed index in industrial supply chain decision contexts.
The study makes three principal contributions. Methodologically, it transforms visual XAI evaluation from an impressionistic assessment into a measurable, index-based research activity. Theoretically, it conceptualizes explanation quality as a dual-layer construct whose objective and subjective dimensions jointly influence trust, acceptance, and decision quality. Practically, it provides system designers with a structured protocol for comparing competing visualization designs before deployment.
Future research should pursue data-driven parameter estimation for XQI, longitudinal tracking of user trust and familiarity effects, an extension to type-2 fuzzy and interval-valued fuzzy decision contexts, and a validation in supply chain domains beyond semiconductor manufacturing. The tools and metrics introduced herein are domain-agnostic and can be readily adapted to any industrial multi-criteria group decision setting where visual explanation quality must be evaluated rigorously.

Funding

This research received no external funding.

Institutional Review Board Statement

Not applicable. This paper reports a methodological framework and a proposed validation design only. No formal participant-based study was conducted, and no human participant data were collected, analyzed, or reported in the present manuscript. Ethical review and approval will be obtained before implementation of the proposed participant-based validation study.

Informed Consent Statement

Not applicable for the present manuscript, because no formal participant data were collected, analyzed, or reported. Informed consent will be obtained from all participants before implementation of the proposed validation study.

Data Availability Statement

No empirical participant data were generated or analyzed in the present manuscript. Data from the proposed validation study will be made available from the author upon reasonable request after completion of the formal study, subject to ethical and privacy restrictions.

Conflicts of Interest

The author declares no conflicts of interest.

References

  1. Olan, F.; Spanaki, K.; Ahmed, W.; Zhao, G. Enabling explainable artificial intelligence capabilities in supply chain decision support making. Prod. Plan. Control 2025, 36, 808–819. [Google Scholar] [CrossRef] [Scilit]
  2. Sadeghi, K.; Ojha, D.; Kaur, P.; Mahto, R.V.; Dhir, A. Explainable artificial intelligence and agile decision-making in supply chain cyber resilience. Decis. Support Syst. 2024, 180, 114194. [Google Scholar] [CrossRef] [Scilit]
  3. Arrieta, A.B.; Díaz-Rodríguez, N.; Del Ser, J.; Bennetot, A.; Tabik, S.; Barbado, A.; García, S.; Gil-López, S.; Molina, D.; Benjamins, R.; et al. Explainable artificial intelligence (XAI): Concepts, taxonomies, opportunities and challenges toward responsible AI. Inf. Fusion 2020, 58, 82–115. [Google Scholar] [CrossRef] [Scilit]
  4. Gunning, D.; Stefik, M.; Choi, J.; Miller, T.; Stumpf, S.; Yang, G.-Z. XAI—Explainable artificial intelligence. Sci. Robot. 2019, 4, eaay7120. [Google Scholar] [CrossRef] [Scilit]
  5. Abhilash, P.M.; Luo, X.; Liu, Q.; Madarkar, R.; Walker, C. Towards next-gen smart manufacturing systems: The explainability revolution. npj Adv. Manuf. 2024, 1, 8. [Google Scholar] [CrossRef] [Scilit]
  6. Nikiforidis, K.; Kyrtsoglou, A.; Vafeiadis, T.; Kotsiopoulos, T.; Nizamis, A.; Ioannidis, D.; Votis, K.; Tzovaras, D.; Sarigiannidis, P. Enhancing transparency and trust in AI-powered manufacturing: A survey of XAI applications in smart manufacturing in the era of Industry 4.0/5.0. ICT Express 2025, 11, 135–148. [Google Scholar] [CrossRef] [Scilit]
  7. Moktadir, M.A.; Ren, J. Global semiconductor supply chain resilience challenges and mitigation strategies: A novel integrated decomposed fuzzy set Delphi, WINGS and QFD model. Int. J. Prod. Econ. 2024, 273, 109280. [Google Scholar] [CrossRef] [Scilit]
  8. Xiong, W.; Wu, D.D.; Yeung, J.H. Semiconductor supply chain resilience and disruption: Insights, mitigation, and future directions. Int. J. Prod. Res. 2025, 63, 3442–3465. [Google Scholar] [CrossRef] [Scilit]
  9. Chen, T.-C.T.; Wang, Y.-C.; Wang, Y.-C. An explainable decision model for selecting facility locations in supply chain networks. Supply Chain Anal. 2025, 11, 100148. [Google Scholar] [CrossRef] [Scilit]
  10. Rudin, C. Stop explaining black box machine learning models for high stakes decisions and use interpretable models instead. Nat. Mach. Intell. 2019, 1, 206–215. [Google Scholar] [CrossRef] [Scilit]
  11. Coussement, K.; Abedin, M.Z.; Kraus, M.; Maldonado, S.; Topuz, K. Explainable AI for enhanced decision-making. Decis. Support Syst. 2024, 184, 114276. [Google Scholar] [CrossRef] [Scilit]
  12. Salih, A.M.; Raisi-Estabragh, Z.; Galazzo, I.B.; Radeva, P.; Petersen, S.E.; Lekadir, K.; Menegaz, G. A perspective on explainable artificial intelligence methods: SHAP and LIME. Adv. Intell. Syst. 2025, 7, 2400304. [Google Scholar] [CrossRef] [Scilit]
  13. Dolgui, A.; Haddou Benderbal, H.; Sgarbossa, F.; Ivanov, D.; Thevenin, S. Editorial for the special issue: AI and data-driven decisions in manufacturing. J. Intell. Manuf. 2024, 35, 3599–3604. [Google Scholar] [CrossRef] [Scilit]
  14. Adadi, A.; Berrada, M. Peeking inside the black-box: A survey on explainable artificial intelligence (XAI). IEEE Access 2018, 6, 52138–52160. [Google Scholar] [CrossRef] [Scilit]
  15. Tjoa, E.; Guan, C. A survey on explainable artificial intelligence (XAI): Toward medical XAI. IEEE Trans. Neural Netw. Learn. Syst. 2021, 32, 4793–4813. [Google Scholar] [CrossRef] [Scilit] [PubMed]
  16. Mohseni, S.; Zarei, N.; Ragan, E.D. A multidisciplinary survey and framework for design and evaluation of explainable AI systems. ACM Trans. Interact. Intell. Syst. 2021, 11, 1–45. [Google Scholar] [CrossRef] [Scilit]
  17. Lundberg, S.M.; Lee, S.-I. A unified approach to interpreting model predictions. Adv. Neural Inf. Process. Syst. 2017, 30, 4765–4774. [Google Scholar] [CrossRef] [Scilit]
  18. Ribeiro, M.T.; Singh, S.; Guestrin, C. “Why should I trust you?”: Explaining the predictions of any classifier. In Proceedings of the 22nd ACM SIGKDD International Conference on Knowledge Discovery and Data Mining, San Francisco, CA, USA, 13–17 August 2016; ACM: New York, NY, USA, 2016; pp. 1135–1144. [Google Scholar] [CrossRef] [Scilit]
  19. Kovari, A. AI for decision support: Balancing accuracy, transparency, and trust across sectors. Information 2024, 15, 725. [Google Scholar] [CrossRef] [Scilit]
  20. Alicioglu, G.; Sun, B. A survey of visual analytics for Explainable Artificial Intelligence methods. Comput. Graph. 2022, 102, 502–520. [Google Scholar] [CrossRef] [Scilit]
  21. Cheung, J.C.; Ho, S.S. The effectiveness of explainable AI on human factors in trust models. Sci. Rep. 2025, 15, 23337. [Google Scholar] [CrossRef] [Scilit]
  22. Liao, Q.V.; Gruen, D.; Miller, S. Questioning the AI: Informing design practices for explainable AI user experiences. In Proceedings of the 2020 CHI Conference on Human Factors in Computing Systems, Honolulu, HI, USA, 25–30 April 2020; ACM: New York, NY, USA, 2020; pp. 1–15. [Google Scholar] [CrossRef] [Scilit]
  23. Chen, T.-C.T.; Wang, Y.-C.; Jiang, P.H. A selectively calibrated derivation technique and generalized fuzzy TOPSIS for semiconductor supply chain localization assessment. Decis. Anal. J. 2023, 8, 100275. [Google Scholar] [CrossRef] [Scilit]
  24. Lin, Y.-C.; Chen, T.C.T. Type-II fuzzy approach with explainable artificial intelligence for nature-based leisure travel destination selection amid the COVID-19 pandemic. Digit. Health 2022, 8, 20552076221106322. [Google Scholar] [CrossRef] [Scilit]
  25. Mendel, J.M.; John, R.I. Type-2 fuzzy sets made simple. IEEE Trans. Fuzzy Syst. 2002, 10, 117–127. [Google Scholar] [CrossRef] [Scilit]
  26. Wang, Y.-C.; Chen, T.C.T. A partial-consensus posterior-aggregation FAHP method—Supplier selection problem as an example. Mathematics 2019, 7, 179. [Google Scholar] [CrossRef] [Scilit]
  27. Wang, Y.-C.; Chen, T. New XAI tools for selecting suitable 3D printing facilities in ubiquitous manufacturing. Complex Intell. Syst. 2023, 9, 6813–6829. [Google Scholar] [CrossRef] [Scilit]
  28. Deveci, M.; Pamucar, D.; Gokasar, I.; Isik, M.; Coffman, D.M. Fuzzy Einstein WASPAS approach for the economic and societal dynamics of the climate change mitigation strategies in urban mobility planning. Struct. Change Econ. Dyn. 2022, 61, 1–17. [Google Scholar] [CrossRef] [Scilit]
  29. Jauhar, S.K.; Harinath, S.; Krishnaswamy, V.; Paul, S.K. Explainable artificial intelligence to improve the resilience of perishable product supply chains by leveraging customer characteristics. Ann. Oper. Res. 2025, 354, 103–142. [Google Scholar] [CrossRef] [Scilit]
  30. Bhatia, S.; Albarrak, A.S. A blockchain-driven food supply chain management using QR code and XAI-faster RCNN architecture. Sustainability 2023, 15, 2579. [Google Scholar] [CrossRef] [Scilit]
  31. Lipton, Z.C. The mythos of model interpretability: In machine learning, the concept of interpretability is both important and slippery. Queue 2018, 16, 31–57. [Google Scholar] [CrossRef] [Scilit]
  32. Puthanveettil Madathil, A.; Luo, X.; Liu, Q.; Walker, C.; Madarkar, R.; Qin, Y. A review of explainable artificial intelligence in smart manufacturing. Int. J. Prod. Res. 2025, 63, 8654–8697. [Google Scholar] [CrossRef] [Scilit]
  33. Hair, J.F.; Risher, J.J.; Sarstedt, M.; Ringle, C.M. When to use and how to report results of PLS-SEM. Eur. Bus. Rev. 2019, 31, 2–24. [Google Scholar] [CrossRef] [Scilit]
  34. Fornell, C.; Larcker, D.F. Evaluating structural equation models with unobservable variables and measurement error. J. Mark. Res. 1981, 18, 39–50. [Google Scholar] [CrossRef] [Scilit]
  35. Henseler, J.; Ringle, C.M.; Sarstedt, M. A new criterion for assessing discriminant validity in variance-based structural equation modeling. J. Acad. Mark. Sci. 2015, 43, 115–135. [Google Scholar] [CrossRef] [Scilit]
Figure 1. The dual-layer architecture of XQI, integrating OEI and SEI into downstream trust, acceptance, and decision quality.
Information 17 00519 g001
Figure 2. Methodological flow of the proposed XQI validation framework.
Information 17 00519 g002
Figure 3. Hypothesized structural mechanism linking objective explainability, understanding, transparency, cognitive load, trust, acceptance, XQI, and decision quality. No empirical or predicted path coefficient is reported in this figure.
Information 17 00519 g003
Table 1. Positioning of other studies relative to the proposed XQI framework.
ReferenceMethodXAI TypeFuzzy TypeSupply Chain FocusExplainability Metric
Chen et al. (2025) [9]SCDT-GFTOPSISVisual chartsType-1 TFNSemiconductor
location
SAD
Olan et al. (2025) [1]Decision
support XAI
Post-hoc
review
General supply chainQualitative
Sadeghi et al. (2024) [2]Survey-based XAITransparency indexCyber resilienceQuestionnaire
Lin & Chen (2022) [24]IT2F-VIKORSegmented distanceType-2 IT2FSTourism
destination
SAD
Wang & Chen (2023) [27]XAI-FGDMGradient bar chartsType-1 TFN3D printing
facilities
SAD
Coussement et al. (2024) [11]XAI-DSS
review
SHAP/LIMEGeneral DSSDecision
accuracy
Proposed (this study)XQI-FGDMOEI + SEI + XQIType-1 TFNSemiconductor
location
XQI (composite)
Table 2. Experimental tasks, corresponding XAI instruments, and objective performance metrics.
TaskCorresponding XAI ToolObjective MeasureGround-Truth SourceWeight π t
Task 1: Pairwise-comparison
interpretation
Hanging
gradient bar chart
S A D ^ p j 1 , R T ^ p j 1 Expert fuzzy judgment
matrix A ˜ ( 1 )
0.35
Task 2: Overall-performance
discrimination
Gradient
bidirectional scatterplot
A C C p j 2 r a n k , R T ^ p j 2 GFTOPSIS
closeness C ˜ q ( m )
0.35
Task 3: Traceable aggregation
comprehension
Traceable
aggregation chart
A C C p j 3 int , R T ^ p j 3 Aggregated closeness C ˜ q 0.30
Table 3. Construct definitions, measurement items, and scale sources.
ConstructAbbreviationLayerNo. of ItemsSample ItemSource
Perceived
understanding
USubjective4I clearly understand what this chart conveys.Kovari (2024) [19]
Perceived transparencyTRSubjective4This chart shows how the
recommendation was derived.
Kovari (2024) [19]
TrustTSubjective4I trust the recommendation shown in this chart.Cheung & Ho (2025) [21]
Cognitive loadCLSubjective4Reading this chart requires
significant mental effort.
NASA-TLX adapted
Decision
confidence
DCSubjective3I feel confident making a
decision based on this chart.
This study
AcceptanceASubjective3I would use this chart to
support real facility decisions.
This study
Decision qualityDQOutcomeKendall τ vs. expert consensus rankingObjective
Table 4. Notation and parameter definitions for the XQI mathematical framework.
SymbolDefinitionRangeDefault Value
p Participant index 1 , , P
j Visualization type index A , B , C
t Task family index1, 2, 3
S A D ^ p j t Normalized fuzzy interpretation
deviation
[ 0 , 1 ]
R T ^ p j t Normalized response time [ 0 , 1 ]
A C C p j t r a n k Ranking fidelity (Kendall τ
rescaled)
[ 0 , 1 ]
A C C p j t int Interpretation accuracy for task t, measured as the proportion of
Correctly answered task-specific
interpretation questions
[ 0 , 1 ]
α r OEI sub-component weight ( r = 1 , , 4 ) ≥0, sum = 10.25 each
π t Task weight≥0, sum = 10.35/0.35/0.30
β s SEI construct weight ( s = 1 , , 4 ) [ 0 , 1 ] 0.25 each
λ OEI–SEI blending weight [ 0 , 1 ] 0.5
Table 5. Planned reporting structure for measurement model validation.
ConstructItemsReliability CheckConvergent Validity CheckDiscriminant Validity Check
Understanding (U)4Cronbach’s alpha; CRAVEHTMT
Transparency (TR)4Cronbach’s alpha; CRAVEHTMT
Trust (T)4Cronbach’s alpha; CRAVEHTMT
Cognitive load (CL)4Cronbach’s alpha; CRAVEHTMT
Decision confidence (DC)3Cronbach’s alpha; CRAVEHTMT
Acceptance (A)3Cronbach’s alpha; CRAVEHTMT
Table 6. Planned reporting structure for the between-group comparison.
Analysis TargetPlanned
Comparison
Statistical TestReporting Item
Objective explainabilityCondition A vs. B vs. CMANOVA/ANOVAMean, SD ,   F , P ,
partial η 2
Subjective explainabilityCondition A vs. B vs. CMANOVA/ANOVAMean, SD ,   F , P ,
partial η 2
Integrated XQICondition A vs. B vs. CANOVAMean, SD ,   F , P ,
partial η 2
Pairwise differencesA–B, B–C, A–CTukey’s HSDMean difference,
adjusted P
Robustness of XQI rankingAlternative λ , α r , β s , π t settingsSensitivity analysisRank stability across parameter settings
Table 7. Planned reporting structure for structural model evaluation.
HypothesisStructural PathHypothesized DirectionPlanned Reporting Item
H1OEI → UnderstandingPositive β ,   t - value ,   p - value ,  
confidence interval, f 2
H2OEI → TransparencyPositive β ,   t - value ,   p - value ,  
confidence interval, f 2
H3Understanding/Transparency → TrustPositive β ,   t - value ,   p - value ,  
confidence interval, f 2
H4aCognitive Load → TrustNegative β ,   t - value ,   p - value ,  
confidence interval, f 2
H4bCognitive Load → AcceptanceNegative β ,   t - value ,   p - value ,  
confidence interval, f 2
H5Trust → AcceptancePositive β ,   t - value ,   p - value ,  
confidence interval, f 2
H6XQI → Decision QualityPositive β ,   t - value ,   p - value ,  
confidence interval, f 2 , R 2
Disclaimer/Publisher’s Note: The statements, opinions and data contained in all publications are solely those of the individual author(s) and contributor(s) and not of MDPI and/or the editor(s). MDPI and/or the editor(s) disclaim responsibility for any injury to people or property resulting from any ideas, methods, instructions or products referred to in the content.