Abstract
In recent years, the need for robotic fleets in large warehouse environments has constantly increased. The customers require faster services concerning the delivery of their products, making the use of systems such as robots and order-management software more than essential. Numerous researchers have studied the problem of robot routing in a warehouse environment, aiming to suggest an efficient model concerning the robotic fleet’s management. In this research work, a methodology is proposed, providing feasible solutions for optimal pathfinding. A novel algorithm is proposed, which combines Dijkstra’s and Kuhn–Munkers algorithms efficiently. The proposed system considers the factor of energy consumption and chooses the optimal route. Moreover, the algorithm decides when a robot must head to a charging station. Finally, a software tool to visualize the movements of the robotic fleet and the real-time updates of the warehouse environment was developed.
1. Introduction
Mobile robotics is becoming one of the most rapidly growing disciplines of scientific research. Mobile robots can replace humans in various industries due to their precise movements, low fatigue, and high repeatability operations. From commercial to private use and industrial automation to non-industrial applications, robots are utilized in many aspects of modern life. The design of robots depends on particular field requirements. There are plenty of different types of robots that can be developed, such as mobile/ fixed, or can be classified according to their application field: Industrial or service [1].
Service robots are increasingly being used in production contexts as well as other settings such as industrial sites, households, and institutions. The two dominant types of service robots are personal and professional service robots. Professional service robots, in particular, are robots that employees utilize to complete tasks, such as mobile robots [2].
The e-commerce business is currently experiencing its most prosperous phase. Various e-commerce enterprises have popped up, and people purchasing online has been an increasing trend during the last decade, posing several issues across the board [3]. The logistics business is one of them, and it is the basis and guarantee of e-commerce [4]. The logistics business will confront more severe issues as the number of online orders is projected to grow, thus, it is critical to maintain logistical efficiency. The effectiveness of warehouse storage and retrieval has the most significant impact on the efficiency of logistics operations. The logistic process of e-commerce initiates when a customer places an order. The next step is for an employee to start moving inside the warehouse to find the items and pick them up. The picking operation is a repetitive and routine process for humans and costs 55% of the total warehouse operating expense [5].
In modern large-volume businesses, robots are utilized to avoid the high expenses of logistics warehouses. These warehouses are built with discrete paths that are specifically designed for robot mobility. Utilizing these paths, mobile robots can act as a means of sorting, storing, and distributing goods inside the warehouse. The cost reduction related to the logistics of a business is directly connected to the nature of automation. If properly programmed, these robots can follow strict navigation orders when managing goods, leading to highly efficient sorting, storing, and distribution processes. Thus, the routes that the robots take on the rails within the warehouse where they are situated are essential to the efficiency of the robots’ delivery. Furthermore, in a modern warehouse, there is a need for more than one robot operating. In that case, the paths available to reach a specific location become more sparse and time-related. Using the same track by more than one robot may lead to conflicts, damage to the goods, and delays in the working process, incurring significant cost penalties. When these robots move into a warehouse to transport items, they run into the difficulty of having many branching pathways to choose from. Especially when there are multiple orders where the robots have to send and receive items, the problem of choosing the best path becomes increasingly complicated [6]. Therefore, an efficient strategy for correctly mapping the warehouse and the path a robot follows during the transportation process is of utmost importance.
In order to achieve the optimal result, energy consumption is a critical factor in the development of the algorithm. Energy-efficient operation is critical because it minimizes energy losses and transmission costs, increases the duty time of energy storage units, and allows them to be of less cost. Mobile robots must complete their assigned tasks promptly while utilizing the available limited energy resources. By efficiently dispersing the robot’s energy resource, the robot’s overall lifespan can be extended. Communication and mobility are the two most energy-intensive characteristics for energy consumption [7]. The algorithm should take the energy factor seriously, as it will have to charge the robot before running out of energy. The most well-known tactic is to navigate the robot to a charging station when the battery reaches a specific limit. This process requires great precision, and in fact, when the environment in which the robot operates changes, the algorithm must constantly recalculate the distance and the percentage of the battery in order to be able to charge safely. Alternatively, wireless charging is possible where the robot goes to a specific area, or there may be rails in the main corridors from where it can wirelessly charge. This way, it is not required to return to a specific charging point and continue its task while charging [8].
Mobile robots must navigate in an unfamiliar and dense area, ever-changing between different warehouses, and several sensors are used to gain an overview of the surrounding environment [9]. The navigation of mobile robots through the shortest path in a new domain has been a fundamental problem for robot movement. Localization offers significant benefits, but the rapid movement from one place to another, while taking into account obstacles in the area, further complicates the issue.
The need for the optimal path for robots is perceived. The visualization of movements of the group in space to locate and validate the exact position of the robots can play a significant role in this direction by confirming the correctness of the movements. In this article, we present a tool for simulating the movements made by the group of robots used in a warehouse and different areas of interest such as obstacles, shelves, selected product locations, refueling stations, storage stations, and charging stations. In addition, we implemented an automated system pathfinding algorithm and applied it to the visualization program in combination with a task-sharing algorithm.
Automation and robotic models have been applied to logistics for many years. However, lately, due to the rapid growth of the popularity of autonomous robots and systems, various philosophies have been developed to optimize and maximize their performance. At the same time, tools have been implemented to visualize the results of these models, trying to present an efficient and user-friendly environment.
Previous work on task allocation and navigation techniques uses numerous philosophies to approach the problem. Bolu et al. [10] proposed an Order Batch to Robot Task Conversion (OBRTC) algorithm, which manages a set of actions as one action instead of one by one. In addition, they developed an Adaptive Robot Task Selection (ARTS) method for distributing tasks to available robots. It was based on a heuristic model that considers factors such as distance and time. These methods and algorithms were executed by the basic Warehouse Execution System (WES) and visualized in a realistic environment developed by them. Emphasis was placed on calculating paths and reducing the distance that robots would travel.
Moreover, Xue et al. [11] propose an intelligent warehouse system with multiple robots that solves the task allocation problem by transforming it into a transportation problem. The dynamic factors that the methodology takes into account are task time window and power consumption. Then, an integer programming formulation is used to assign to each agent its restrictions, as the problem is solved by the table working method. This idea shows an increased performance of the system, but it does not analyze the dynamic factors of the environment. Moreover, the researchers proceed with the assumption that the energy consumption of a robot coincides with its driving distance.
Pinkam et al. [12] suggest a model that executes two different strategies for collecting items. Firstly, each robot is assigned to each station in an individual collection strategy. In the collaborative method, each robot is assigned to each nearest station using Manhattan distance, and Dijkstra’s algorithm decides its navigation. Moreover, a local search is applied to find nearby target items. However, this model shows critical weaknesses in the swarm-like behavior of the robots. Furthermore, the development team used the assumption that the energy consumption of a robot is proportional to its traveled distance. Their results showed that the collaborative behavior of the robots did not achieve the system’s reduced energy consumption, which may be counter-intuitive.
Wei et al. [13] proposed a dynamic distribution of tasks in a more general search and retrieval problem and presented a prediction-based approach to tackling the task division problem in robotic systems. Both approaches are evaluated in a simulated environment, called BW4T, and the experimental results show that both provide an effective solution to the problem. The forecasting approach has a better performance in terms of completion time, while their approach has satisfactory results. Although the researcher’s proposal reduces the completion time and minimizes energy consumption, their simulations do not include robot charging stations.
These methods may be functional and show increased efficiency in many different levels, but they also have some weaknesses. The disadvantages can be summarized as follows.
- The energy consumption factor usually coincides with the traveling distance of a robot, not considering other realistic factors such as losses, inclination, etc.
- The role of the charging stations is not discussed, and it is not explained how to maximize their performance.
- The visualization tools lack many features, both in exporting experimental results and in situations where a warehouse user operates them.
We propose a solution that considers many different factors energy-wise, such as the load of the cargo or further losses due to the battery or friction. Moreover, we discuss how we can optimize the charging stations’ positions and charging procedures. Later, visualization software is also presented, which is developed by our team and accepts a plethora of different parameters to visualize simply and friendly the environment needed and communicate appropriately with the warehouse’s different elements and its users.
The rest of the manuscript is structured as follows: Section 2, the research procedure and the proposed algorithm’s implementation are discussed. In Section 3, the visualization tool and its features are showcased. Later, Section 4 contains details of the proposed methodology and provides our results. Finally, the final thoughts and conclusions are given in Section 5.
2. Elements of the Smart-Warehouse Algorithm
This section describes the procedure of analyzing various routing and task-allocation algorithms. We also explain why we concluded with the ones we use in our proposed methodology later. Furthermore, some ideas around energy consumption optimization are discussed.
2.1. Routing Algorithms
For the tests, we considered the two factors of time and energy. At first, the grid is represented as an unweighted graph, and pathfinding algorithms in unweighted graphs such as BFS and DFS, are implemented. The primary assumption was the fact that the robots need the same time to move from one cell to another. Therefore, the time factor was aligned with the length of each path that the algorithm produced. Despite the efficiency of these two algorithms, it is concluded that they do not cover our needs as they do not consider the factor of energy.
Moreover, the experiments continued by adding the factor of energy. We achieved that by putting weights on each tile of the grid. These weights represented the energy each robot needed to arrive at the specific tile. In natural environments, the energy could represent factors like the ground’s surface or its inclination. Therefore, the solution is to utilize the weighted graphs, on which we could run pathfinding algorithms in weighted graphs, like Dijkstra’s and A*.
During the execution, the software checks the path compared with the available battery of the robots. In every new execution cycle, the routing algorithm takes into consideration obstacles like shelves or other robots. The list with the current obstacles is updated as the other robots have changed their position too. When the arrival to its destination has been confirmed, the path is exported in a JSON-encoded string and sent to the tool using a TCP socket.
The weight of the package is taken into account to calculate the residual energy. In this way, the required energy is calculated. More specifically, the entered parameters are set to the available energy and the consumption that robots have to move from one cell to another (1). The energy consumption is related to the weight of the robot’s load on it. The energy cost of each operation is taken into account in order to minimize the load on each robot’s battery. This minimizes the downtime of each robot (since recharging or battery swapping occurs less frequently) and results in higher values of uptime for the warehouse. The measured energy consists of four parts: (a) The energy requirements of the DC motor, (b) the energy losses of friction, (c) the kinetic energy (which is based on the sum of the number of straight grid tiles the robot has traversed in a straight line, and the number of turns it has performed), and finally (d) the energy loss of the electronic devices. According to our calculations and experiments, most of the required energy comes from the needs of the robots to traverse the environment. The second most energy-intensive source is the kinetic energy, then friction, and finally the loss of electronics. The equation of the energy model is presented as [14]:
where is the energy of the battery used for the robot, is the energy loss for the DC motor, is the kinetic energy losses, is the energy losses due to friction, is the energy losses in the electronics.
2.2. Task-Allocation Algorithms
Another problem came up during the experiment runs: The task allocation between the robots. We aimed to achieve a swarm-like behavior so collective decisions that result in a more efficient ensemble than independent units can be made. To solve the assignment problem, we used the Kuhn–Munkers algorithm, also known as the Hungarian algorithm, a fundamental combinatorial optimization algorithm. Its central concept is to have x number of agents and y number of tasks, and each agent demands a different cost to complete the task. The problem can be represented in a matrix of the costs of the agents completing the tasks. The Kuhn–Munkers algorithm would provide us with the minimum total cost when applied to the matrix, assigning each task to an agent.
To solve the specific problem of task assignment, we also analyzed other methods such as auction-based [11,15] algorithms that follow the idea that the entities are separated into auctioneers and agents, and the tasks are advertised and sold in various auction rounds. We concluded that the Kuhn–Munkers algorithm suits our problem and our warehouse environment more.
For the explanation of the Kuhn–Munkers algorithm, an example with four workers and four tasks is considered. Table 1 shows the cost of assigning a certain worker to a certain task.

Table 1.
Matrix with costs of each worker-task pair.
- Step 1: Subtract row minima.
- Step 2: Subtract column minima.
- Step 3: Cover all zeros with a minimum number of lines. Cover all zeros in the resulting matrix using a minimum number of horizontal and vertical lines. If n lines are required, an optimal assignment exists among the zeros. The algorithm stops. If less than n lines are required, continue with Step 4.
- Step 4: Create additional zeros. Find the smallest element that is not covered by a line in Step 3. Subtract it from all uncovered elements, and add it to all elements that are covered twice.
2.3. Energy Consumption Optimization
During the experiments, we focused on techniques that could minimize the energy consumption of the group during its runs. At first, the concept remained simple, as the robots used the charging stations inside the warehouse to charge their batteries whenever they could not complete a route. However, it was observed that the position of the charging stations does not always suit the problem, as they spend significant time during their re-route to reach them. Later, we considered placing charging stations in tiles with more traffic, such as the center of the warehouse or near the shelves. This showed an improvement in the system’s efficiency, both time-wise and energy-wise. We were able to test these two techniques regarding the position of the charging stations and compare the group’s performance.
Even though it has not been implemented, we also propose a different model on a theoretical level. Affected mainly by the problem of electric chargers on the transport network, we adopted the model of wireless charging for our warehouse. The specific environment allows us to use a simplified version of this solution compared to those used in transport networks. It is characterized mainly by static elements (shelves, walls, stations, etc.) and by less density of them. The works of different researchers were taken into account: [16] Present TeleWatt, a charging infrastructure over public lightning systems, and [17] use buses as mobile energy disseminators to dynamically wireless charge other electric vehicles that are part of the transport network. For our case, we thought of using static elements of the warehouse such as shelves or specific lanes of the grid, similar to the case of lighting systems used in traffic environments, or adding dynamic elements such as larger robots that could act as chargers next to the group, like the charging buses. It is important to mention that these dynamic techniques do not have to stand by themselves, but they can also be used combined with the currently implemented concept of stationary charging stations.
Our simulations have shown an increased efficiency in the swarm’s performance as the robots rarely run out of energy anymore or execute unnecessary routes. On the other hand, this new concept requires additional costs and infrastructure, which we consider a significant downside. This is the main reason we have not managed to implement this at our warehouse yet.
3. Visualization Software
Visualization software has been developed to represent the movements of robotics systems that routing algorithms export. Data are sent to the visualization tool using a TCP (Transmission Control Protocol), which offers the ability to create a peer-to-peer connection using the socket descriptor to identify the connection uniquely. The development of the tool is based on Python, combining the PyGame library with graphic design.
The main entities that are visualized are:
- Shelf: Shelves are divided into cells, and each cell can store a product. There is the capability to separate the shelves into groups and the representation of each group will be done with a different color.
- Product: The product entities represent the load that robots handle. The products can be picked by the robots at the replenishment station and placed in a shelf’s cell or collected from a shelf by the robots and deposited at the delivery station. The products can also be categorized in groups using colors.
- Robot: Moving at the warehouse environment, the robots are the entities that execute specific actions. They handle products and head to the three stations: Replenishment, delivery, or charging, depending on the actions they receive from the central system. On each robot, the battery level is displayed at a specific time using a colored box (green, orange, red).
- Replenishment Station (R.S.): The station that provides the products for the robots to collect and distribute to the shelves. We can have multiple replenishment stations represented with different colors (e.g., we can have different R.S. based on the type of products they provide). The cells that each R.S. occupies will be defined by their size.
- Delivery Station (D.S.): The station where the robots place the products. They share the same characteristics with the replenishment stations as there can be many of them, each occupying many cells.
- Charging Station (C.S.): When the indicator shows a low battery level, robots head to the charging stations to recharge it. Each C.S. can be compatible with every robot on the map or with specific ones. In the second case, the robot’s color is shown on the charging station.
- Movement Path: The tool visualizes the paths so the user can see each robot’s movement in the warehouse. Each robot executes a routing algorithm, which exports a path for the emulator. The color of the path matches its robot’s color.
The software receives JSON encoded type of data as input which contain the information surrounding each emulation. The communication of the routing algorithms with our visualization tool is also done using JSON. The tool operates as the server, and the clients use the predefined port to connect and send either data updating the environment of the warehouse or new movement paths that resulted from the algorithms they executed. This method allows the update of the environment in real-time and without terminating each emulation (Figure 1).
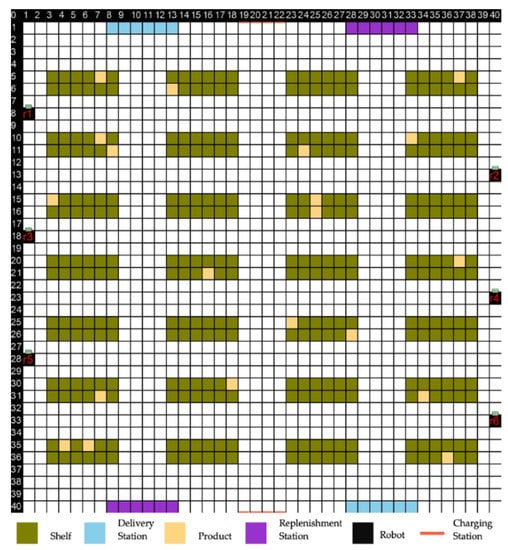
Figure 1.
Basic map with every entity.
Firstly, an initialization file is necessary. This file always includes the basic parameters of the grid (width, height, tile size). We also developed a tool that exports maps in JSON encoded data for our tests, considering actual warehouse layouts we have collected. The tool opens a window with the initial environment when the configuration values are given. Then, the program waits for new file inputs that provide data on entities that the user wants to import into the grid. A JSON with a true end flag is needed for the program’s termination.
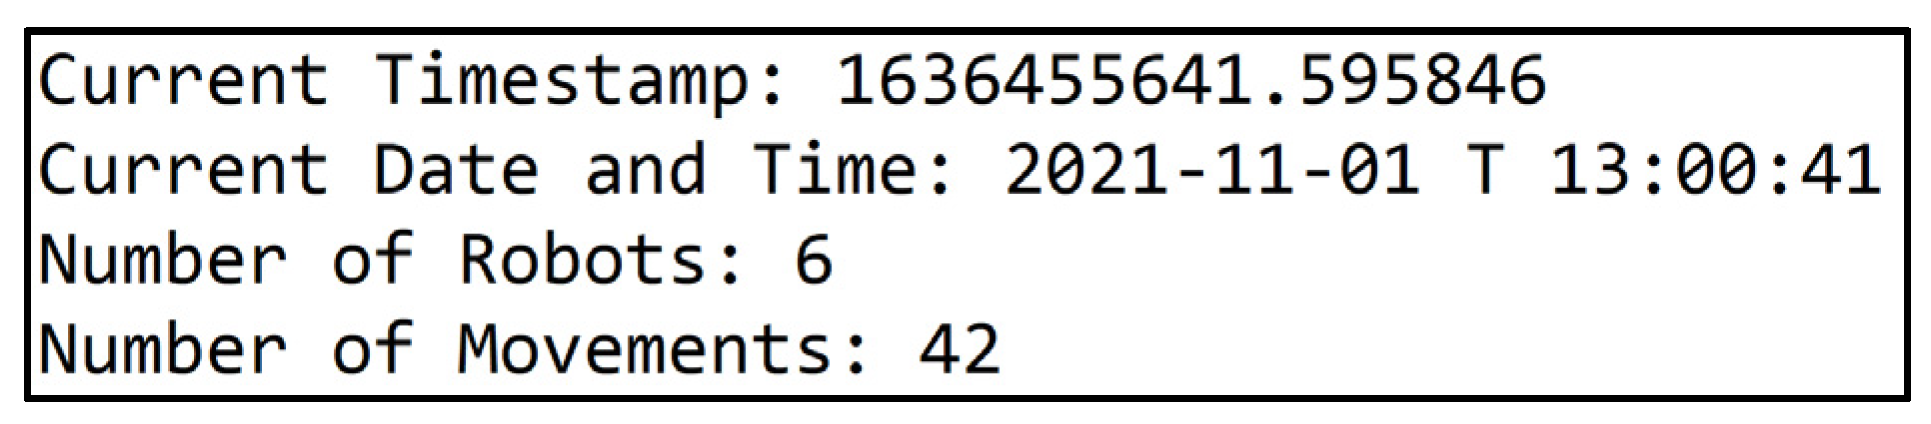
Our tool also has the capability to collect statistics, including the whole simulation that resulted from the JSON provided to it. An important statistic feature is the display of a heatmap that highlights the cells of the grid used more by the robots during the simulation. The development of this heatmap was done using Seaborn, which is a Python data visualization library based on matplotlib. Furthermore, the software exports a text file (Figure 2) that contains information like current time and date, current timestamp, robot count, and movement count on the grid. During the program’s execution from the terminal, command-line arguments can be used as parameters, something that allows the user to set the program in a specific mode (no-graphics mode, no-heatmap mode, multi-client mode, etc.). The execution functions are the display of the graphical environment or image storage, the display of the execution in steps and the communication ports of the TCP socket.
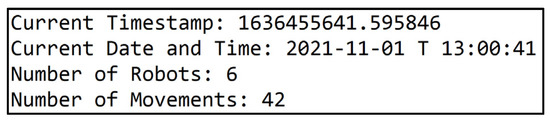
Figure 2.
Statistics exported by the visualizing tool.
Heatmap is an essential visual aid to the warehouse operator because highly intense areas indicate congested corridors and signal a more suitable product reallocation, if feasible, for better balance. Figure 3 shows the collection of data surrounding the positions of the group during our emulation. The cells that the robots visit more often are highlighted at the tiles where the color is more intense. Since the various warehouse products are stored based on the category to which they belong, we can draw some conclusions. In case (a), we can see that orders were made from many different items, resulting in the robots moving to a large part of the warehouse to serve the orders. In case (b), there is increased traffic in a specific warehouse area. This can be interpreted as ordering products containing products of similar categories.
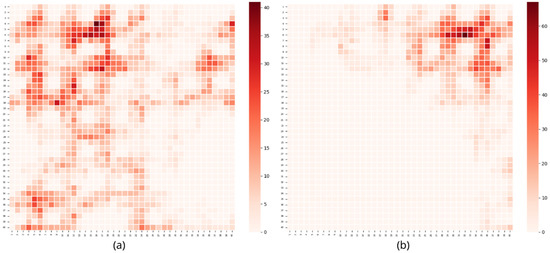
Figure 3.
Heatmap of two different simulations. Case (a) shows orders that provide a different of items. In case (b) there is an increased traffic at a specific area of the warehouse.
4. Methodology and Results
In the first step, the two main pathfinding algorithms (Dijkstra and A*) are tested on a weighted 40 × 40 grid with a random number of six robots and six tasks. Each algorithm is executed for every robot-task pair on our grid. Table 2 presents the results with the costs for A*.
Table 2.
A*’s cost results for emulation with six robots and six tasks. The optimal pairs are highlighted with bold.
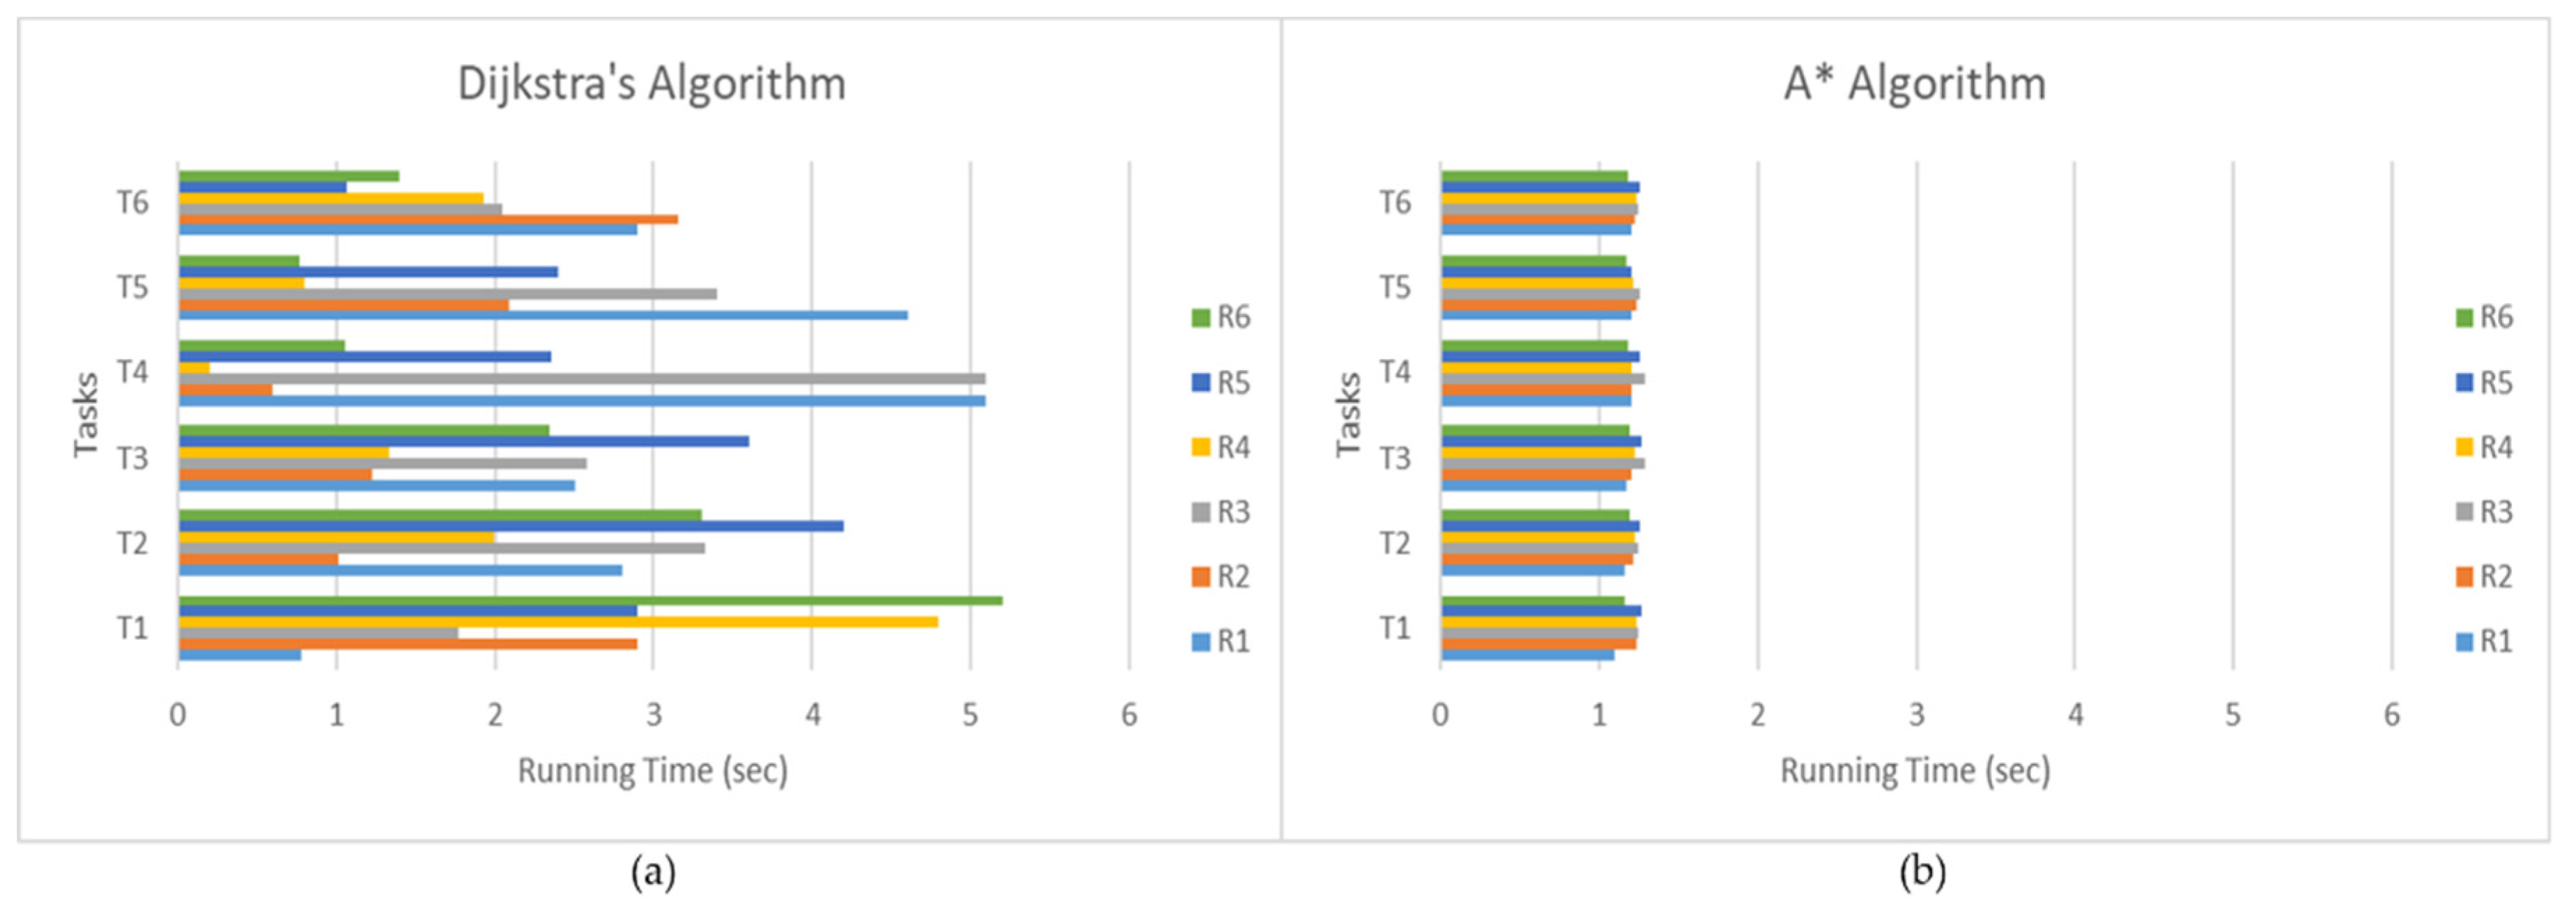
We also considered the time each algorithm needed to complete the pathfinding process. For our tests, both algorithms were executed 100 times for each robot-task pair. Figure 4 shows the recorded times.
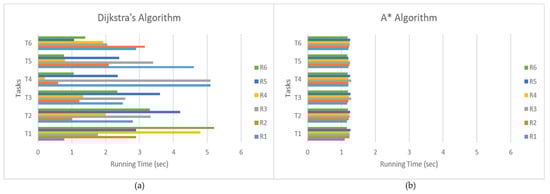
Figure 4.
Running time for Dijkstra (a) and A* (b) for robot-task pairs.
Therefore, it is understood that A* may be more stable and faster in overall performance time wise, as we can see in Figure 4. However, this advantage is insignificant compared to Dijkstra’s more efficient pathfinding capabilities. From the examples we have provided, the total cost of the path that Dijkstra produced is 794, compared to A*’s cost of 2.245.
Thus, our implementation proposes a model that combines Dijkstra’s pathfinding algorithm with the Kuhn–Munkers algorithm. The main steps of the process are:
- Our emulation has m number of robots that must execute n number of tasks. The positions of these entities are stored in a table.
- The cost of every robot-task pair is calculated using Dijkstra’s algorithm.
- Each distance is stored in an m*n matrix.
- The Kuhn–Munkers algorithm is executed on this matrix. Each task is assigned to a robot in the most optimal way.
- If a path is not feasible energy-wise, the match is discarded, the nearest charging station of the robot is assigned to the robot, and Step 4 is executed on the same matrix without the robot that must charge.
- Dijkstra’s path result for each robot-task is sent to our visualization tool in a JSON-encoded type.
- The values of the position table are updated with the new ones.
- New tasks are generated, and the algorithm repeats until no other tasks are generated.
These steps are converted into the novel Routing, and Task Allocation (RATA) algorithm proposed, as shown in Algorithm 1.
Furthermore, in Figure 5, a flow chart showcases the total procedure of the methodology to help visualize the different steps and explain the connection between them.
| Algorithm 1: Routing and Task Allocation (RATA) |
| 1. function RATA(Robots, Tasks, Grid): 2. while Tasks is not empty: 3. for each robot r in Robots: 4. for each task t in Tasks: 5. matrix[r, t], path[r, t] 🡨 Dijkstra(r, t) 6. create tuple set matches 7. do 8. not_feasible 🡨 false 9. matches 🡨 Hungarian(matrix) 10. for each r, t in matches: 11. if matches[r, t] not feasible: 12. remove r from matches, matrix 13. path[r, t] 🡨 FindNearestStation® 14. not_feasible 🡨 True 15. while not_feasible 16. for each r, t in path: 17. Visualize(path[r, t]) 18. Robots[r] 🡨 Task[t] 19. Tasks[t] 🡨 GenerateNewTasks() |
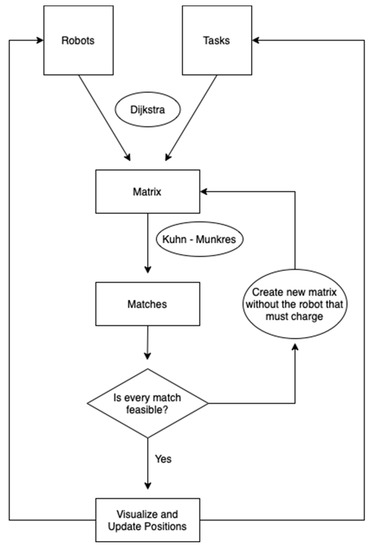
Figure 5.
Overall flow chart of the methodology.
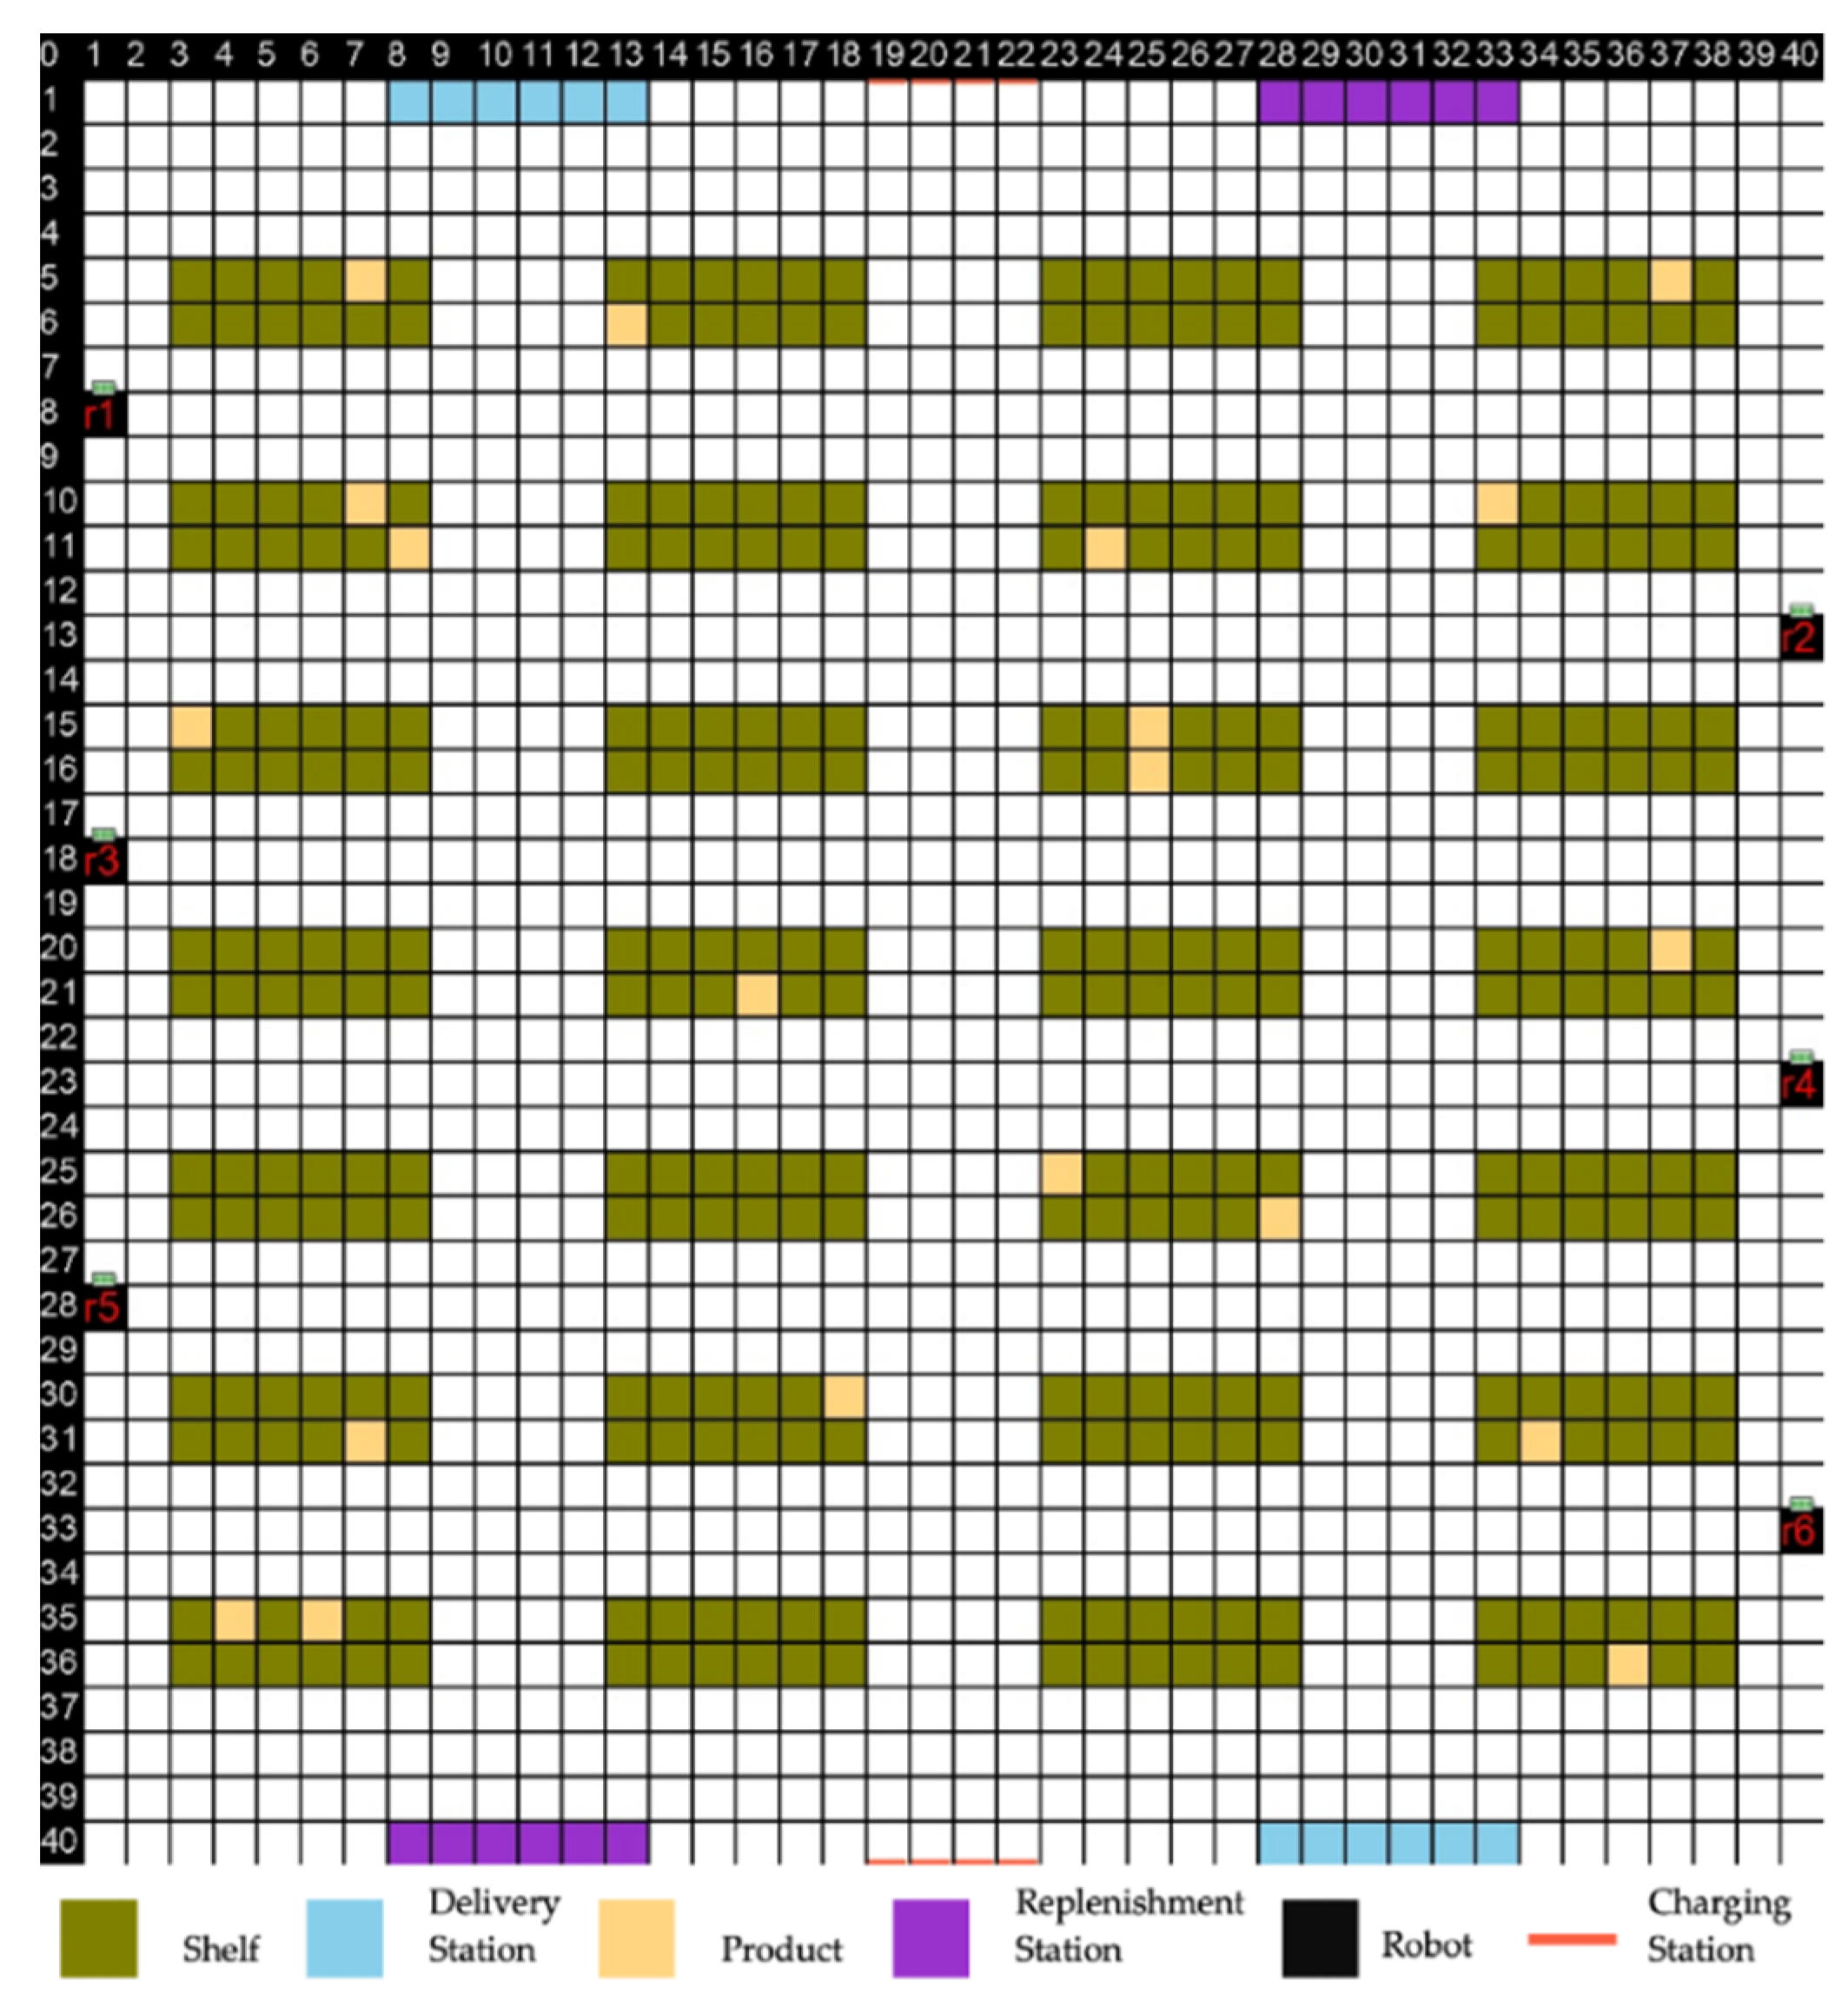
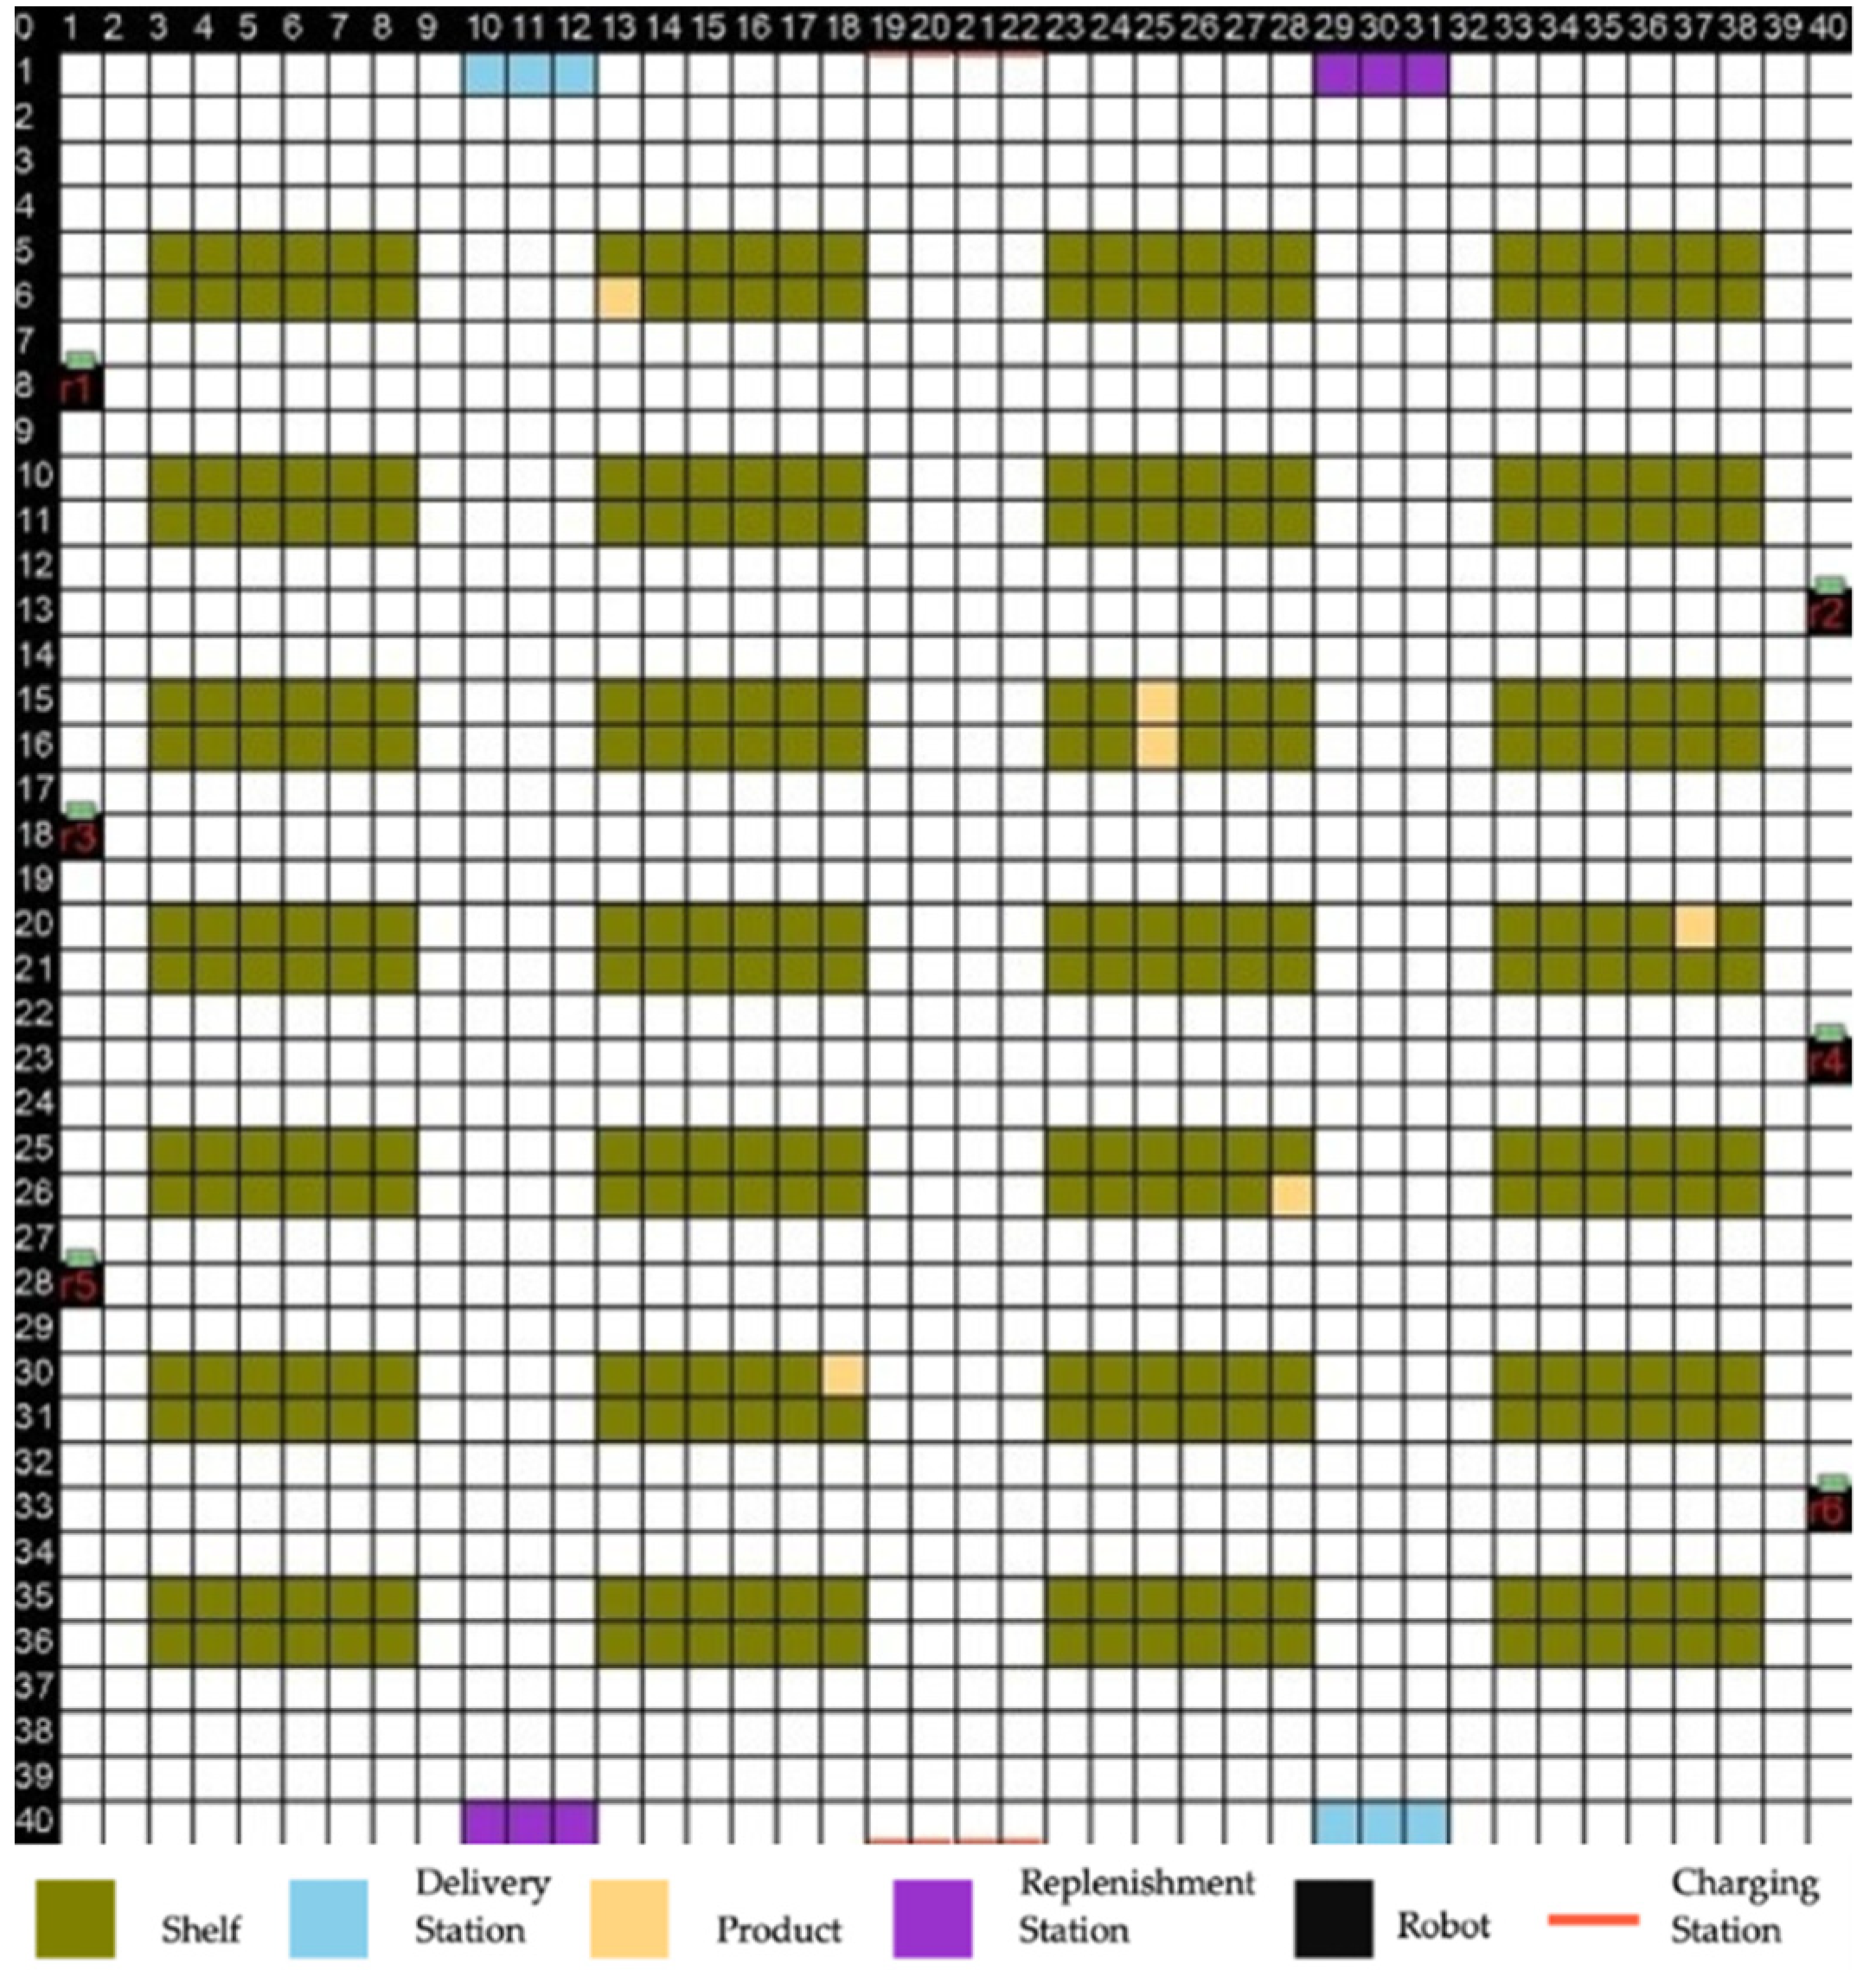
More specifically, our model is tested in a system with six robots with the same battery and six tasks in a 40 × 40 warehouse grid. The first two repeats of the main steps are analyzed in the following paragraphs. The initial state of the grid is shown in Figure 6, and the position tables for robots and tasks are shown in Table 3.
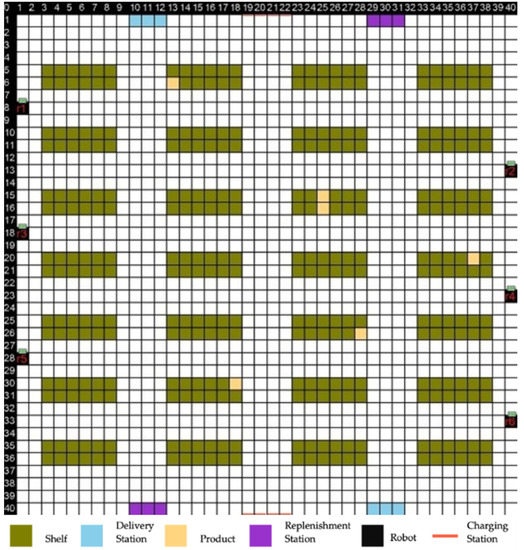
Figure 6.
Initial state of the grid.
Table 3.
Position table with each position represented by a (x,y) tuple.
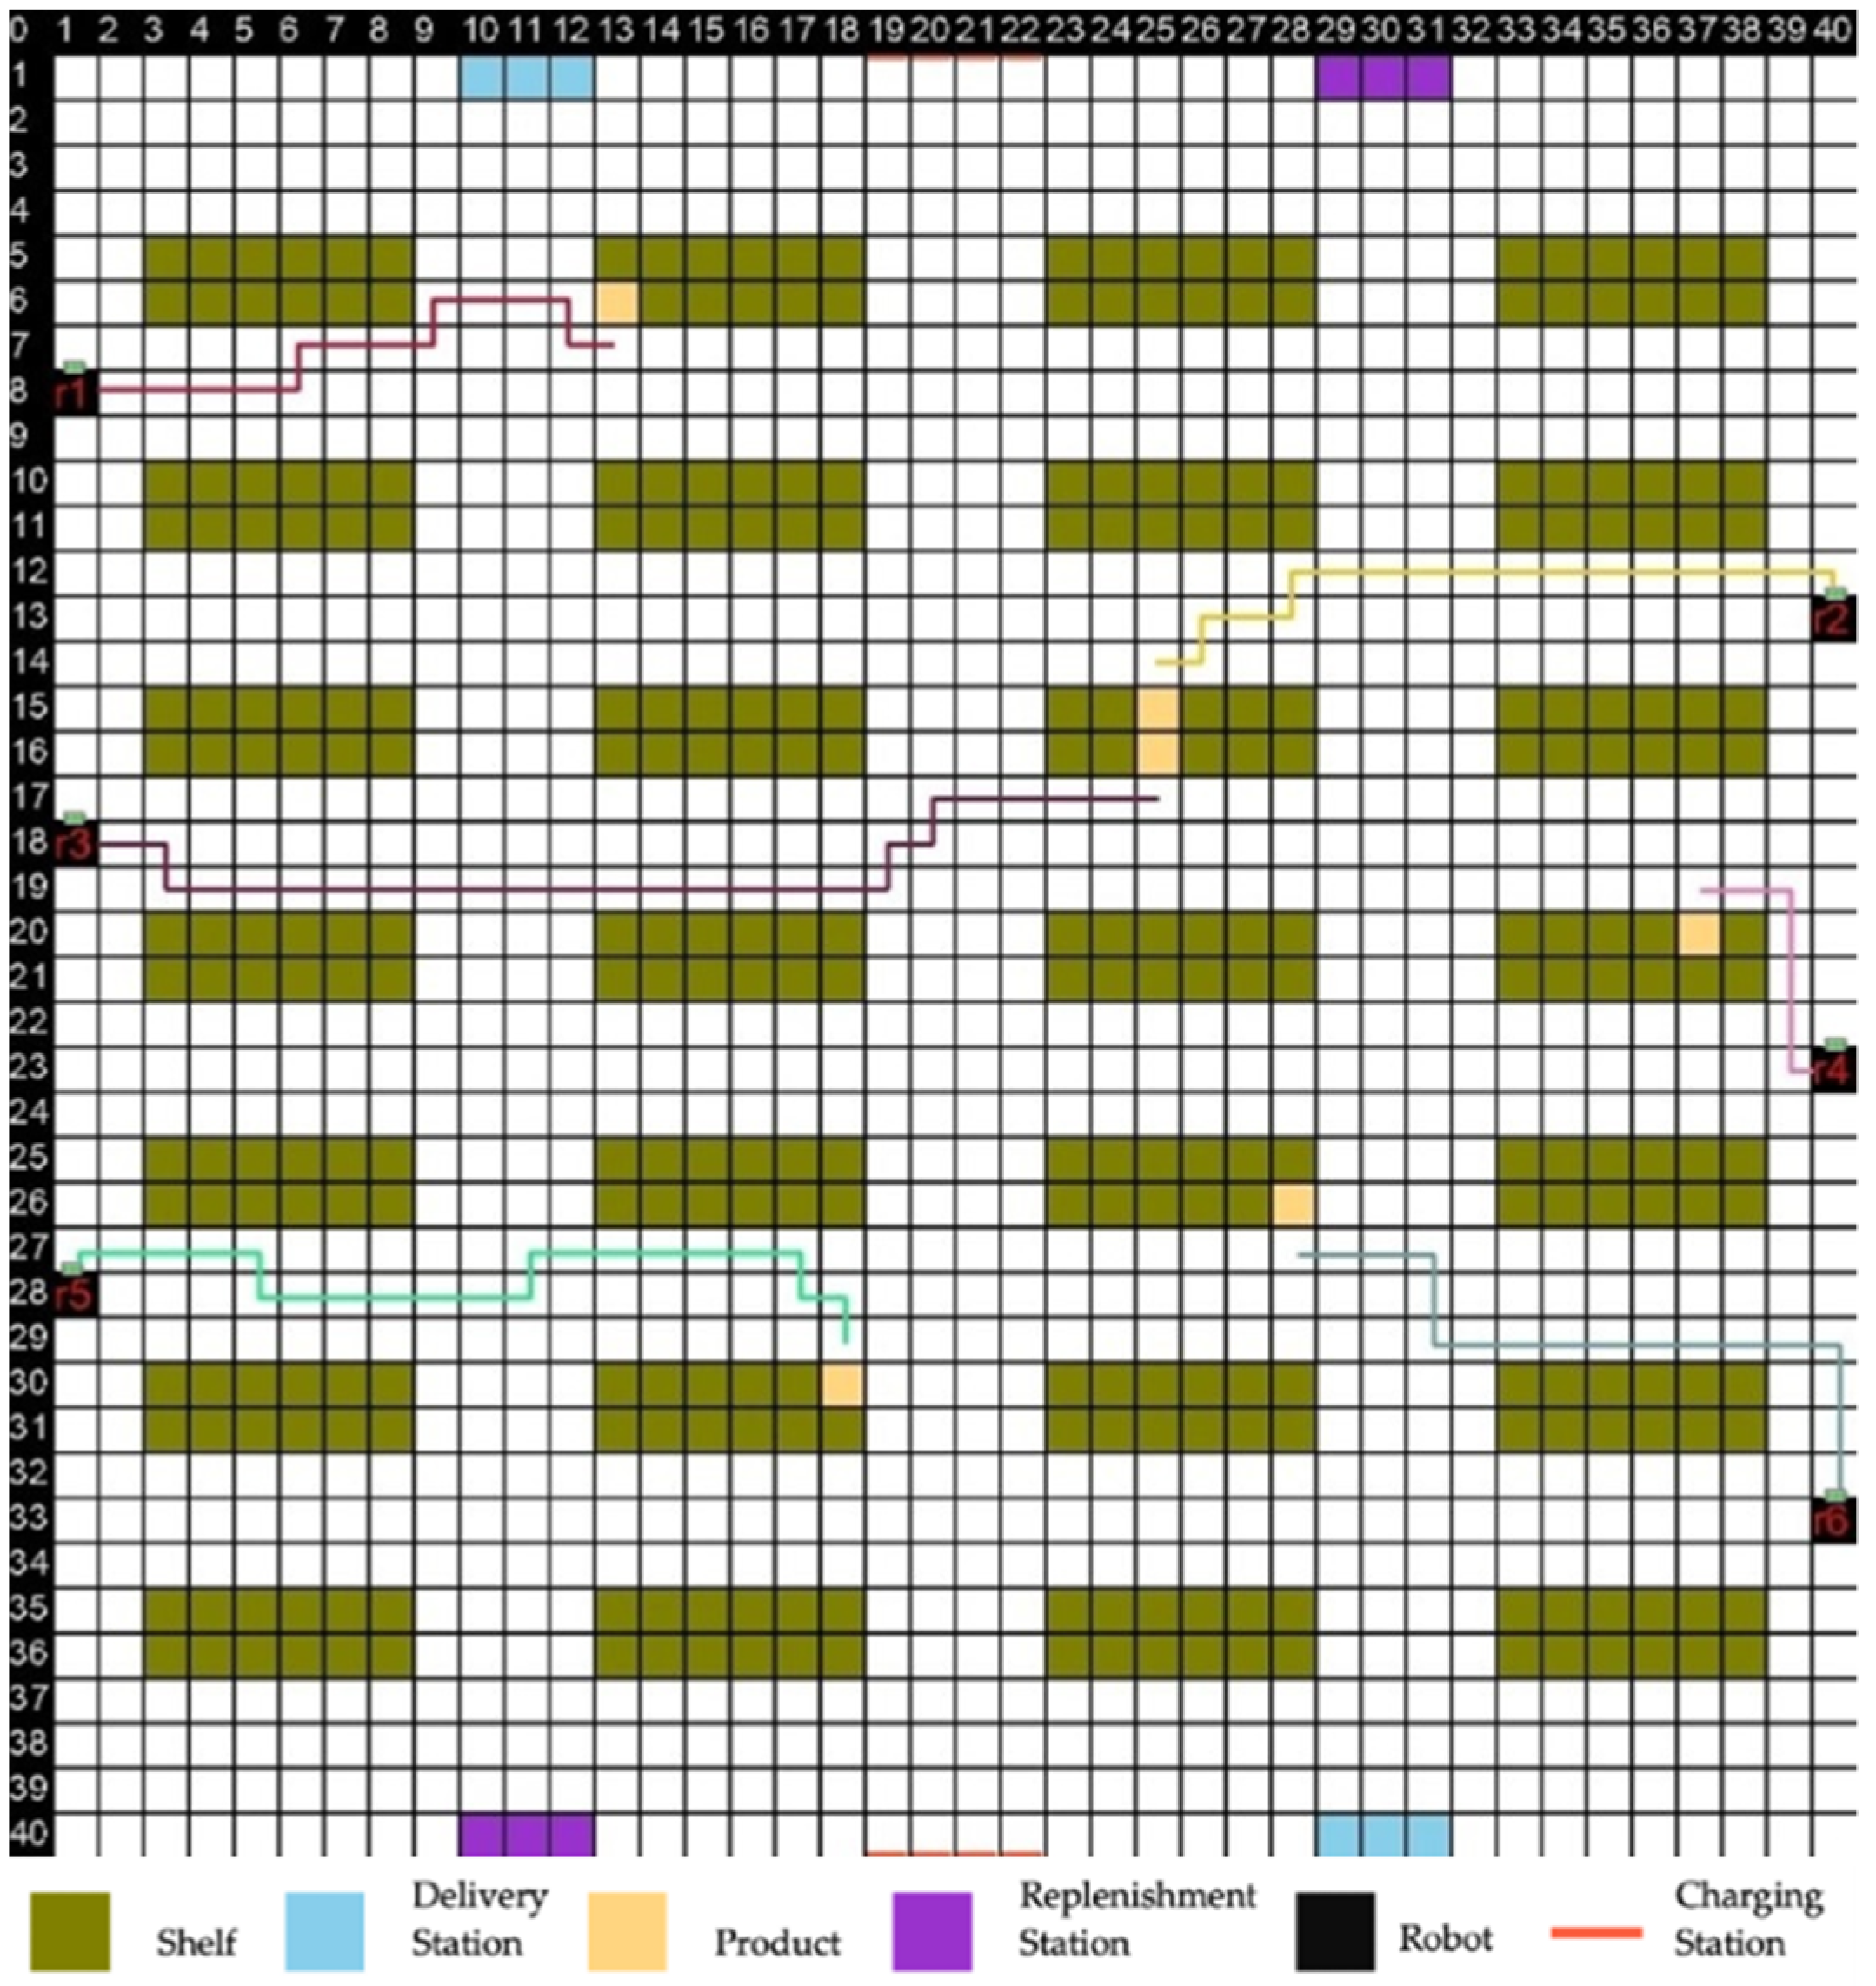
After having computed each pair’s path cost, they were stored in Table 4 which shows the results of Dijkstra’s algorithm. When the matrix became full, the Kuhn–Munkers algorithm was executed on it. Its results are highlighted on the matrix in bold.
Table 4.
Dijkstra’s cost results for emulation with six robots and six tasks. The bold numbers indicate the selected task for each robot.
The six paths that resulted from the assignment were sent to the visualization software, as shown in Figure 7.
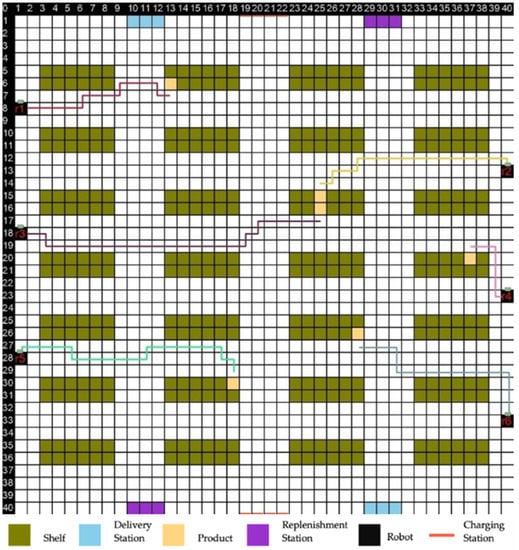
Figure 7.
Map after the first step of our method was executed.
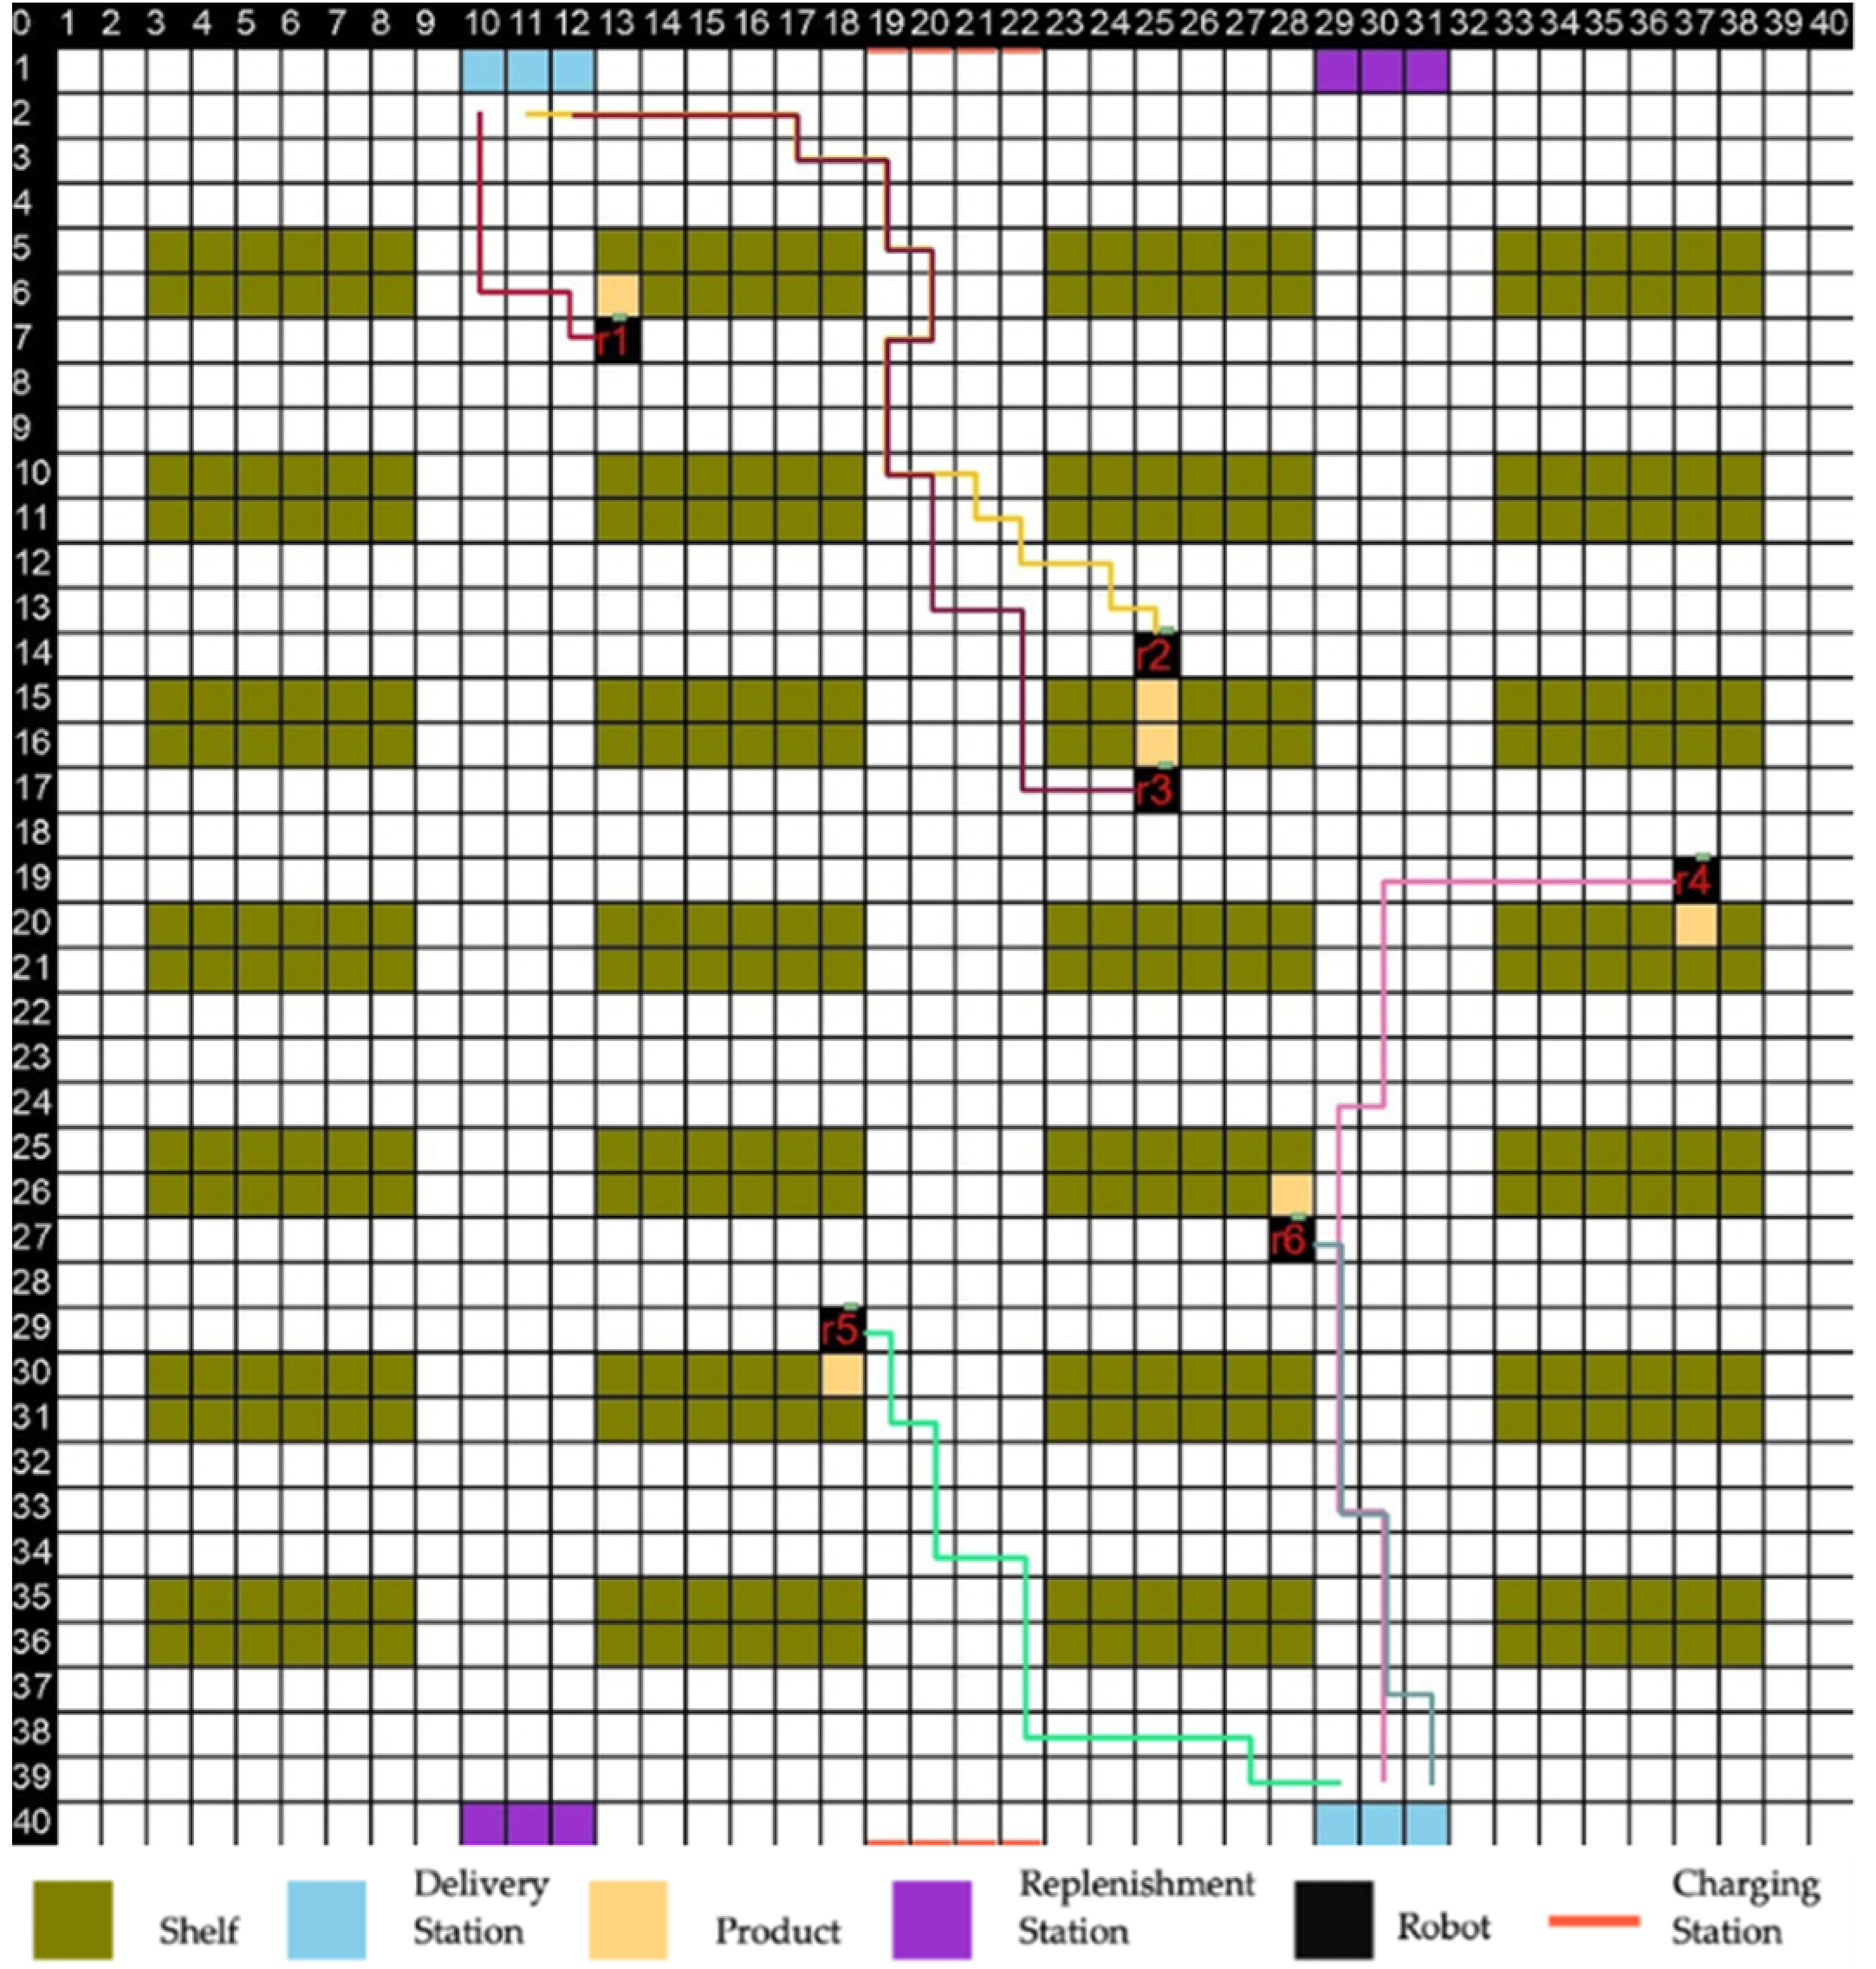
Table 5 shows the final positions of the robots, and Table 6 shows the costs from new robot positions. Furthermore, Figure 8 depicts the environment after the execution of the last step. As we can see, the paths may cover one another. However, in reality, there are no robot collisions as we calculate each path at different executing cycles, considering that a robot could be an obstacle for other robots.
Table 5.
Updated position table after the final step was executed.
Table 6.
New matrix showing the optimal pairs with bold, from new robot positions to delivery station tasks.
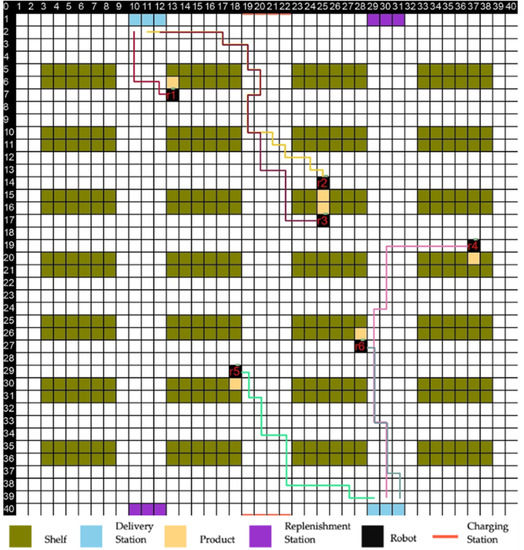
Figure 8.
Map after the second step of our method was executed.
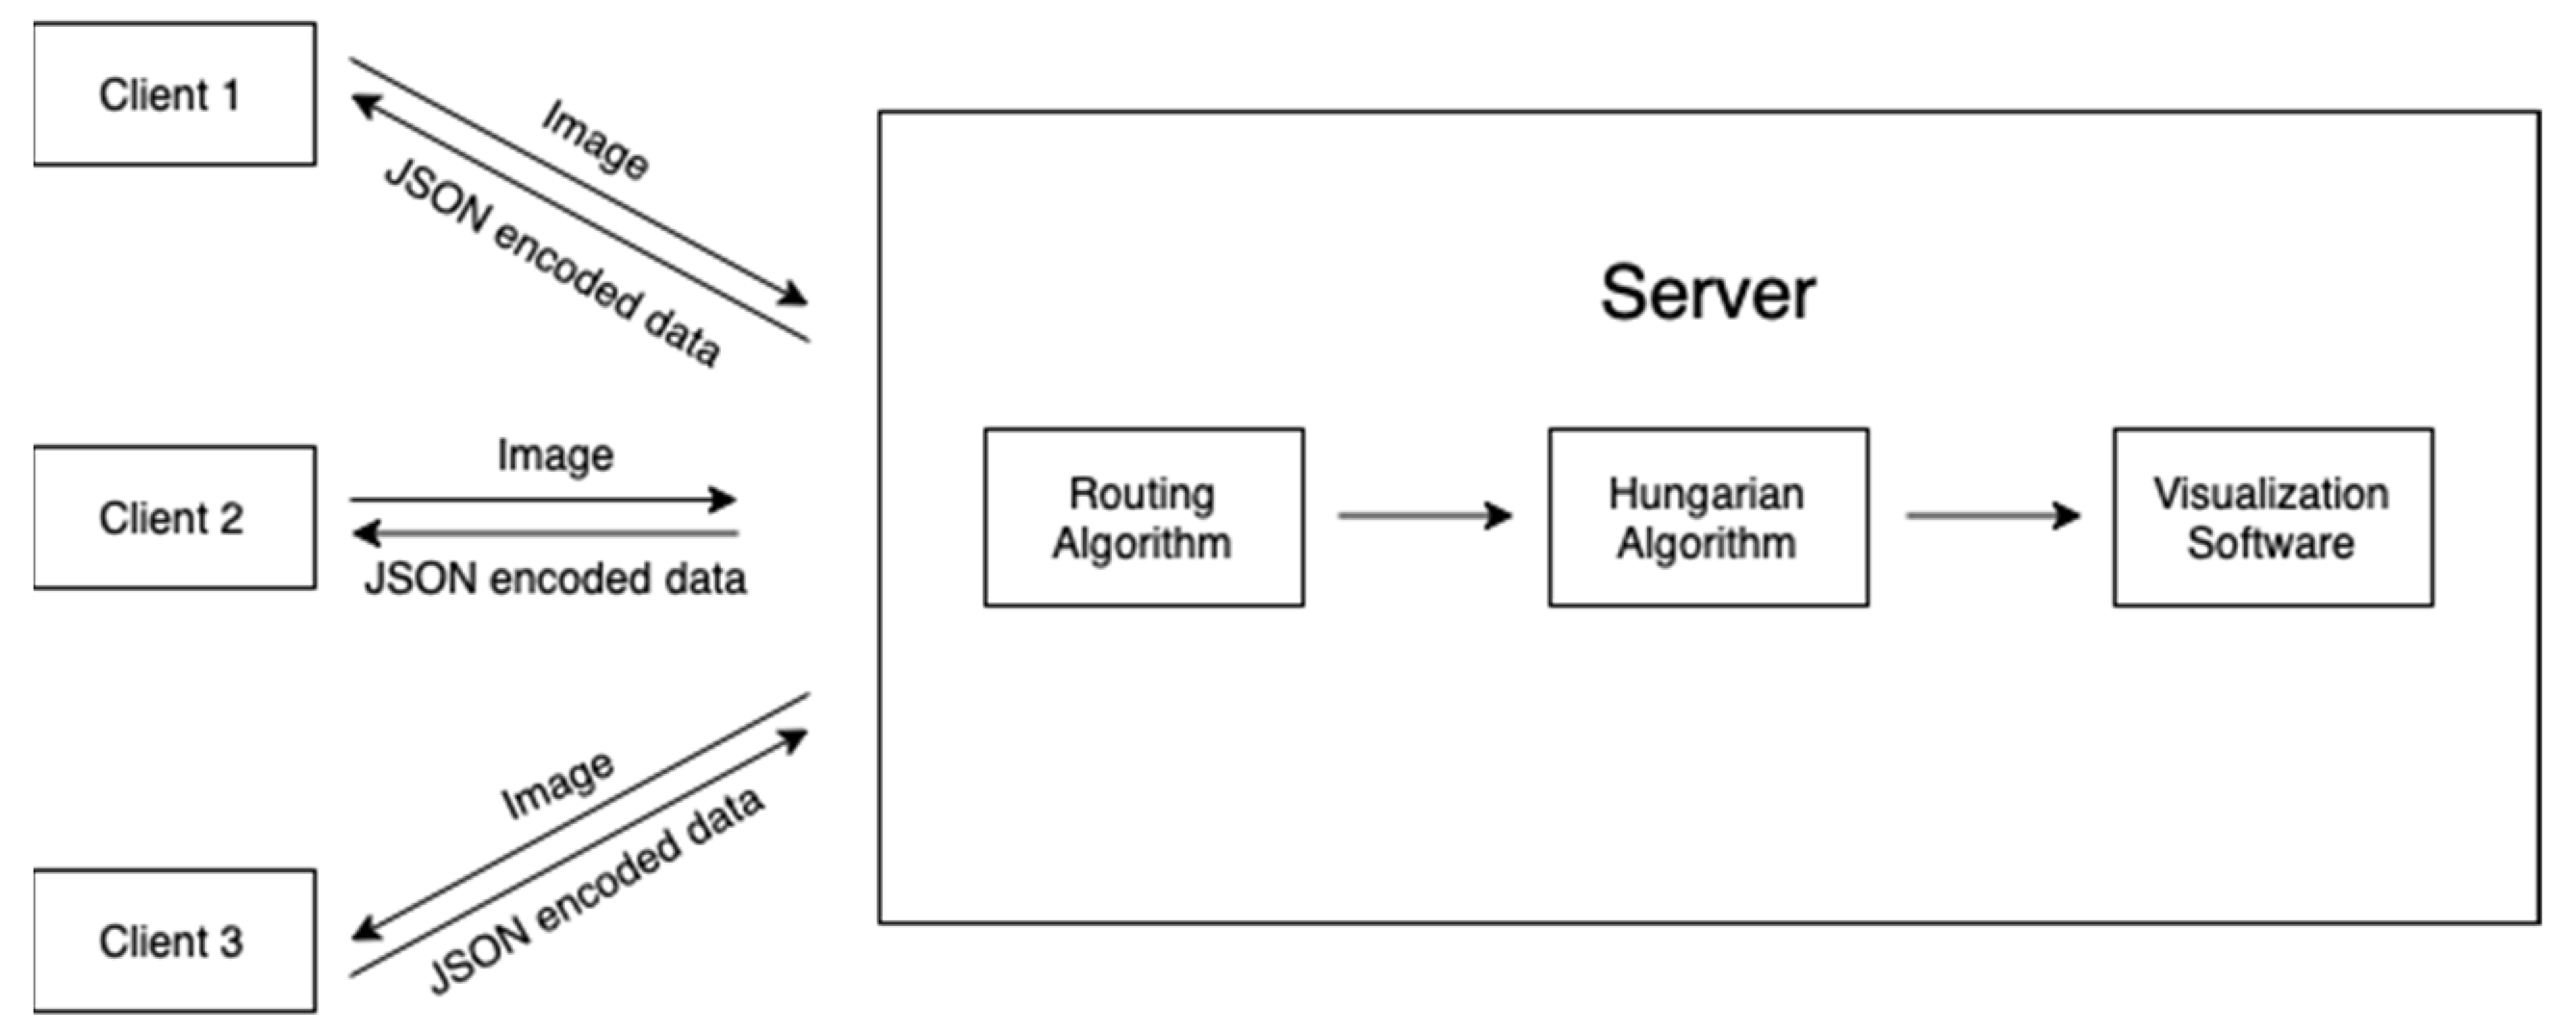
To sum up, the proposed methodology is shown in Figure 9 as a multi-client system with a server that receives the data, executes the procedure steps, and returns the client’s images as output.
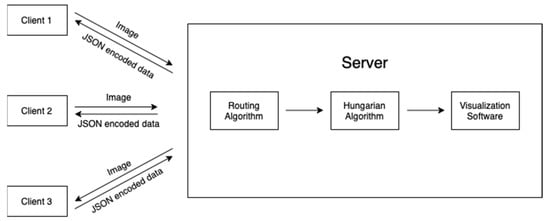
Figure 9.
Total procedure of the methodology.
5. Conclusions and Future Work
This article deals with the increasing need for robotic fleets inside warehouse environments and presents ideas that improve efficiency in a smart-warehouse environment. Various pathfinding and task-allocation algorithms are studied, and our research elaborates more on Dijkstra’s and Kuhn–Munkers algorithms. The proposed model contains a hybrid combination of these two algorithms. This model plans to provide robots with fast and intelligent navigation inside the warehouse’s map and efficiently complete every task requested. Furthermore, our team developed a visualization software that accepts JSON encoded data from the preceding method and provides a user-friendly visualization of the warehouse’s map.
The experiments that we conducted using the simulated warehouse environment were positive. However, due to the nature of our experimental setup and the implementation of our algorithm, we could not accurately measure the scalability of the system. More specifically, we have not yet simulated more complex environments, consisting of hundreds of robots and possibly thousands of simultaneously running tasks. Therefore, we cannot yet present metrics and numbers regarding our algorithm’s performance in these complex yet important environments.
Although this work gives significant insight into how a warehouse and its entities operate, there are always open areas for more research. In future work, our routing and task-allocation algorithms can be developed and proposed, allowing us to cover the needs we specifically want. Moreover, another idea is to predict possible future tasks, and not with a linear method like this study’s philosophy. Finally, the research team aims to expand its interests to the field of wireless charging and how this technology can be used in a smart-warehouse system.
Author Contributions
Methodology, A.C.; software, A.C. and P.C.; formal analysis, A.C.; investigation, P.C.; resources, M.D.; writing—original draft preparation, A.C., P.C. and D.Z.; writing—review and editing, A.C., P.C. and D.Z.; visualization, P.C.; supervision, M.D.; project administration, A.C.; funding acquisition, M.D. All authors have read and agreed to the published version of the manuscript.
Funding
This research received no external funding.
Institutional Review Board Statement
Not applicable.
Informed Consent Statement
Not applicable.
Conflicts of Interest
The authors declare no conflict of interest.
References
- Ben-Ari, M.; Mondada, F. Elements of Robotics; Springer: Berlin/Heidelberg, Germany, 2017. [Google Scholar]
- Belanche, D.; Casaló, L.V.; Flavián, C.; Schepers, J. Service Robot Implementation: A Theoretical Framework and Research Agenda. Serv. Ind. J. 2020, 40, 203–225. [Google Scholar] [CrossRef] [Green Version]
- Bogue, R. Growth in E-Commerce Boosts Innovation in the Warehouse Robot Market. Ind. Robot. 2016, 43, 583–587. [Google Scholar] [CrossRef]
- Zhou, L.; Liu, J.; Fan, X.; Zhu, D.; Wu, P.; Cao, N. Design of V-Type Warehouse Layout and Picking Path Model Based on Internet of Things. IEEE Access 2019, 7, 58419–58428. [Google Scholar] [CrossRef]
- de Koster, R.; Le-Duc, T.; Jan Roodbergen, K.; Koster, D. Design and Control of Warehouse Order Picking: A Literature Review. Eur. J. Oper. Res. 2007, 182, 481–501. [Google Scholar] [CrossRef]
- Lavalle, S.M. Planning Algorithms; Cambridge University Press: Cambridge, UK, 2006. [Google Scholar]
- Grünewald, M.; Rückert, U.; Schindelhauer, C.; Volbert, K. Directed Power-Variable Infrared Ommunication for the Mini Robot Khepera. In Proceedings of the 2nd International Conference on Autonomous Minirobots for Research and Edutainment, Brisbane, Australia, 18–20 February 2003. [Google Scholar]
- Wang, J.; Hu, M.; Cai, C.; Lin, Z.; Li, L.; Fang, Z. Optimization Design of Wireless Charging System for Autonomous Robots Based on Magnetic Resonance Coupling. AIP Adv. 2018, 8, 055004. [Google Scholar] [CrossRef] [Green Version]
- Sifa, R.; Bauckhage, C.; Drachen, A. The Playtime Principle: Large-Scale Cross-Games Interest Modeling. In Proceedings of the IEEE Conference on Computatonal Intelligence and Games, CIG, Dortmund, Germany, 26–29 August 2014. [Google Scholar]
- Bolu, A.; Korcak, O. Adaptive Task Planning for Multi-Robot Smart Warehouse. IEEE Access 2021, 9, 27346–27358. [Google Scholar] [CrossRef]
- Xue, F.; Tang, H.; Su, Q.; Li, T. Task Allocation of Intelligent Warehouse Picking System Based on Multi-Robot Coalition. KSII Trans. Internet Inf. Syst. 2019, 13, 3566–3582. [Google Scholar] [CrossRef] [Green Version]
- Pinkam, N.; Bonnet, F.; Chong, N.Y. Robot Collaboration in Warehouse. In Proceedings of the International Conference on Control, Automation and Systems, Gyeongju, Korea, 16–19 October 2016; pp. 269–272. [Google Scholar]
- Wei, C.; Hindriks, K.V.; Jonker, C.M. Dynamic Task Allocation for Multi-Robot Search and Retrieval Tasks. Appl. Intell. 2016, 45, 383–401. [Google Scholar] [CrossRef]
- Stefek, A.; van Pham, T.; Krivanek, V.; Pham, K.L. Energy Comparison of Controllers Used for a Differential Drive Wheeled Mobile Robot. IEEE Access 2020, 8, 170915–170927. [Google Scholar] [CrossRef]
- Berggren, M.; Vester, S.; Villadsen, J. LNAI 7217—Implementing a Multi-Agent System in Python with an Auction-Based Agreement Approach. In International Workshop on Programming Multi-Agent Systems; Springer: Berlin/Heidelberg, Germany, 2011. [Google Scholar]
- Alberto, M.; Ruiz, A. An Innovative System for Electrical Vehicular Charging in Urban Zone: Conception, Dimensioning, and Performance Evaluation. Doctoral Dissertation, Télécom ParisTech, Palaiseau, France, 2015. [Google Scholar]
- Kosmanos, D.; Maglaras, L.A.; Mavrovouniotis, M.; Moschoyiannis, S.; Argyriou, A.; Maglaras, A.; Janicke, H. Route Optimization of Electric Vehicles Based on Dynamic Wireless Charging. IEEE Access 2018, 6, 42551–42565. [Google Scholar] [CrossRef]


Publisher’s Note: MDPI stays neutral with regard to jurisdictional claims in published maps and institutional affiliations. |
© 2022 by the authors. Licensee MDPI, Basel, Switzerland. This article is an open access article distributed under the terms and conditions of the Creative Commons Attribution (CC BY) license (https://creativecommons.org/licenses/by/4.0/).