Coastal Climate Adaptation Literatures of the Southeast and Northeast U.S.: Regional Comparisons among States and Document Sources

Abstract
1. Introduction
2. Methods
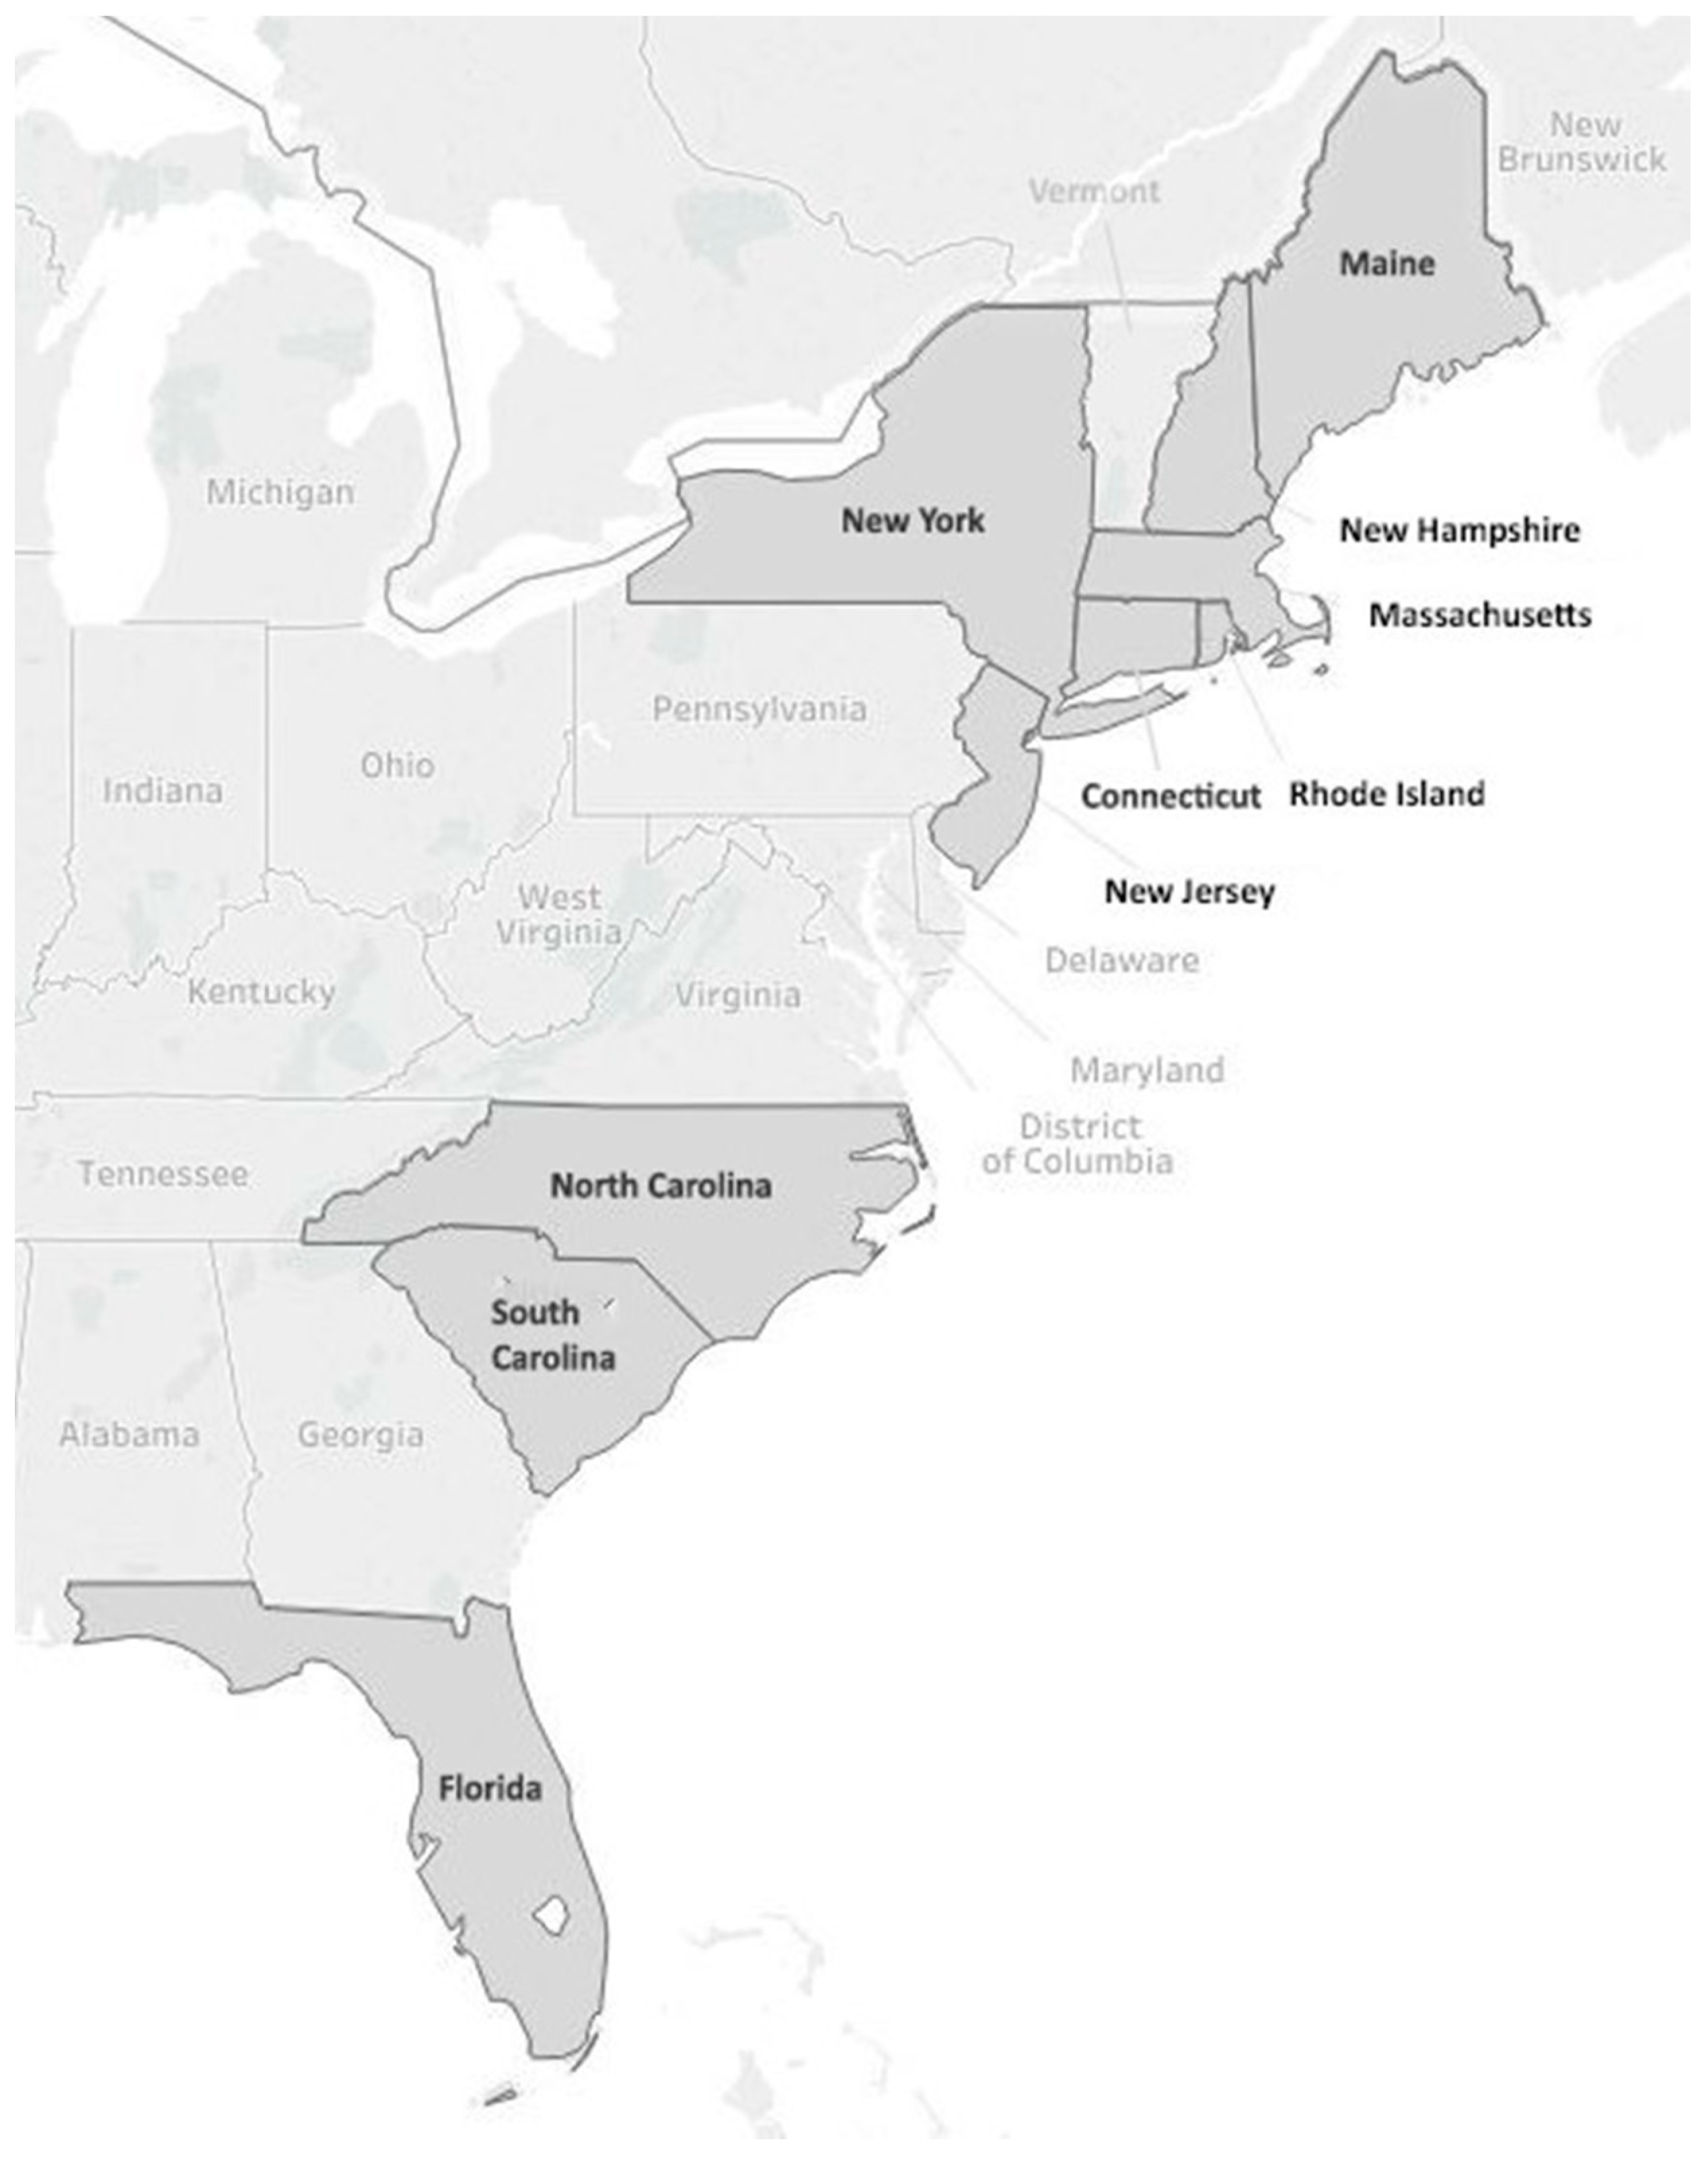
2.1. Study Areas
2.2. Databases and Processing Protocols
2.3. Adaptation Reports by Spatial Scale and Type of Database
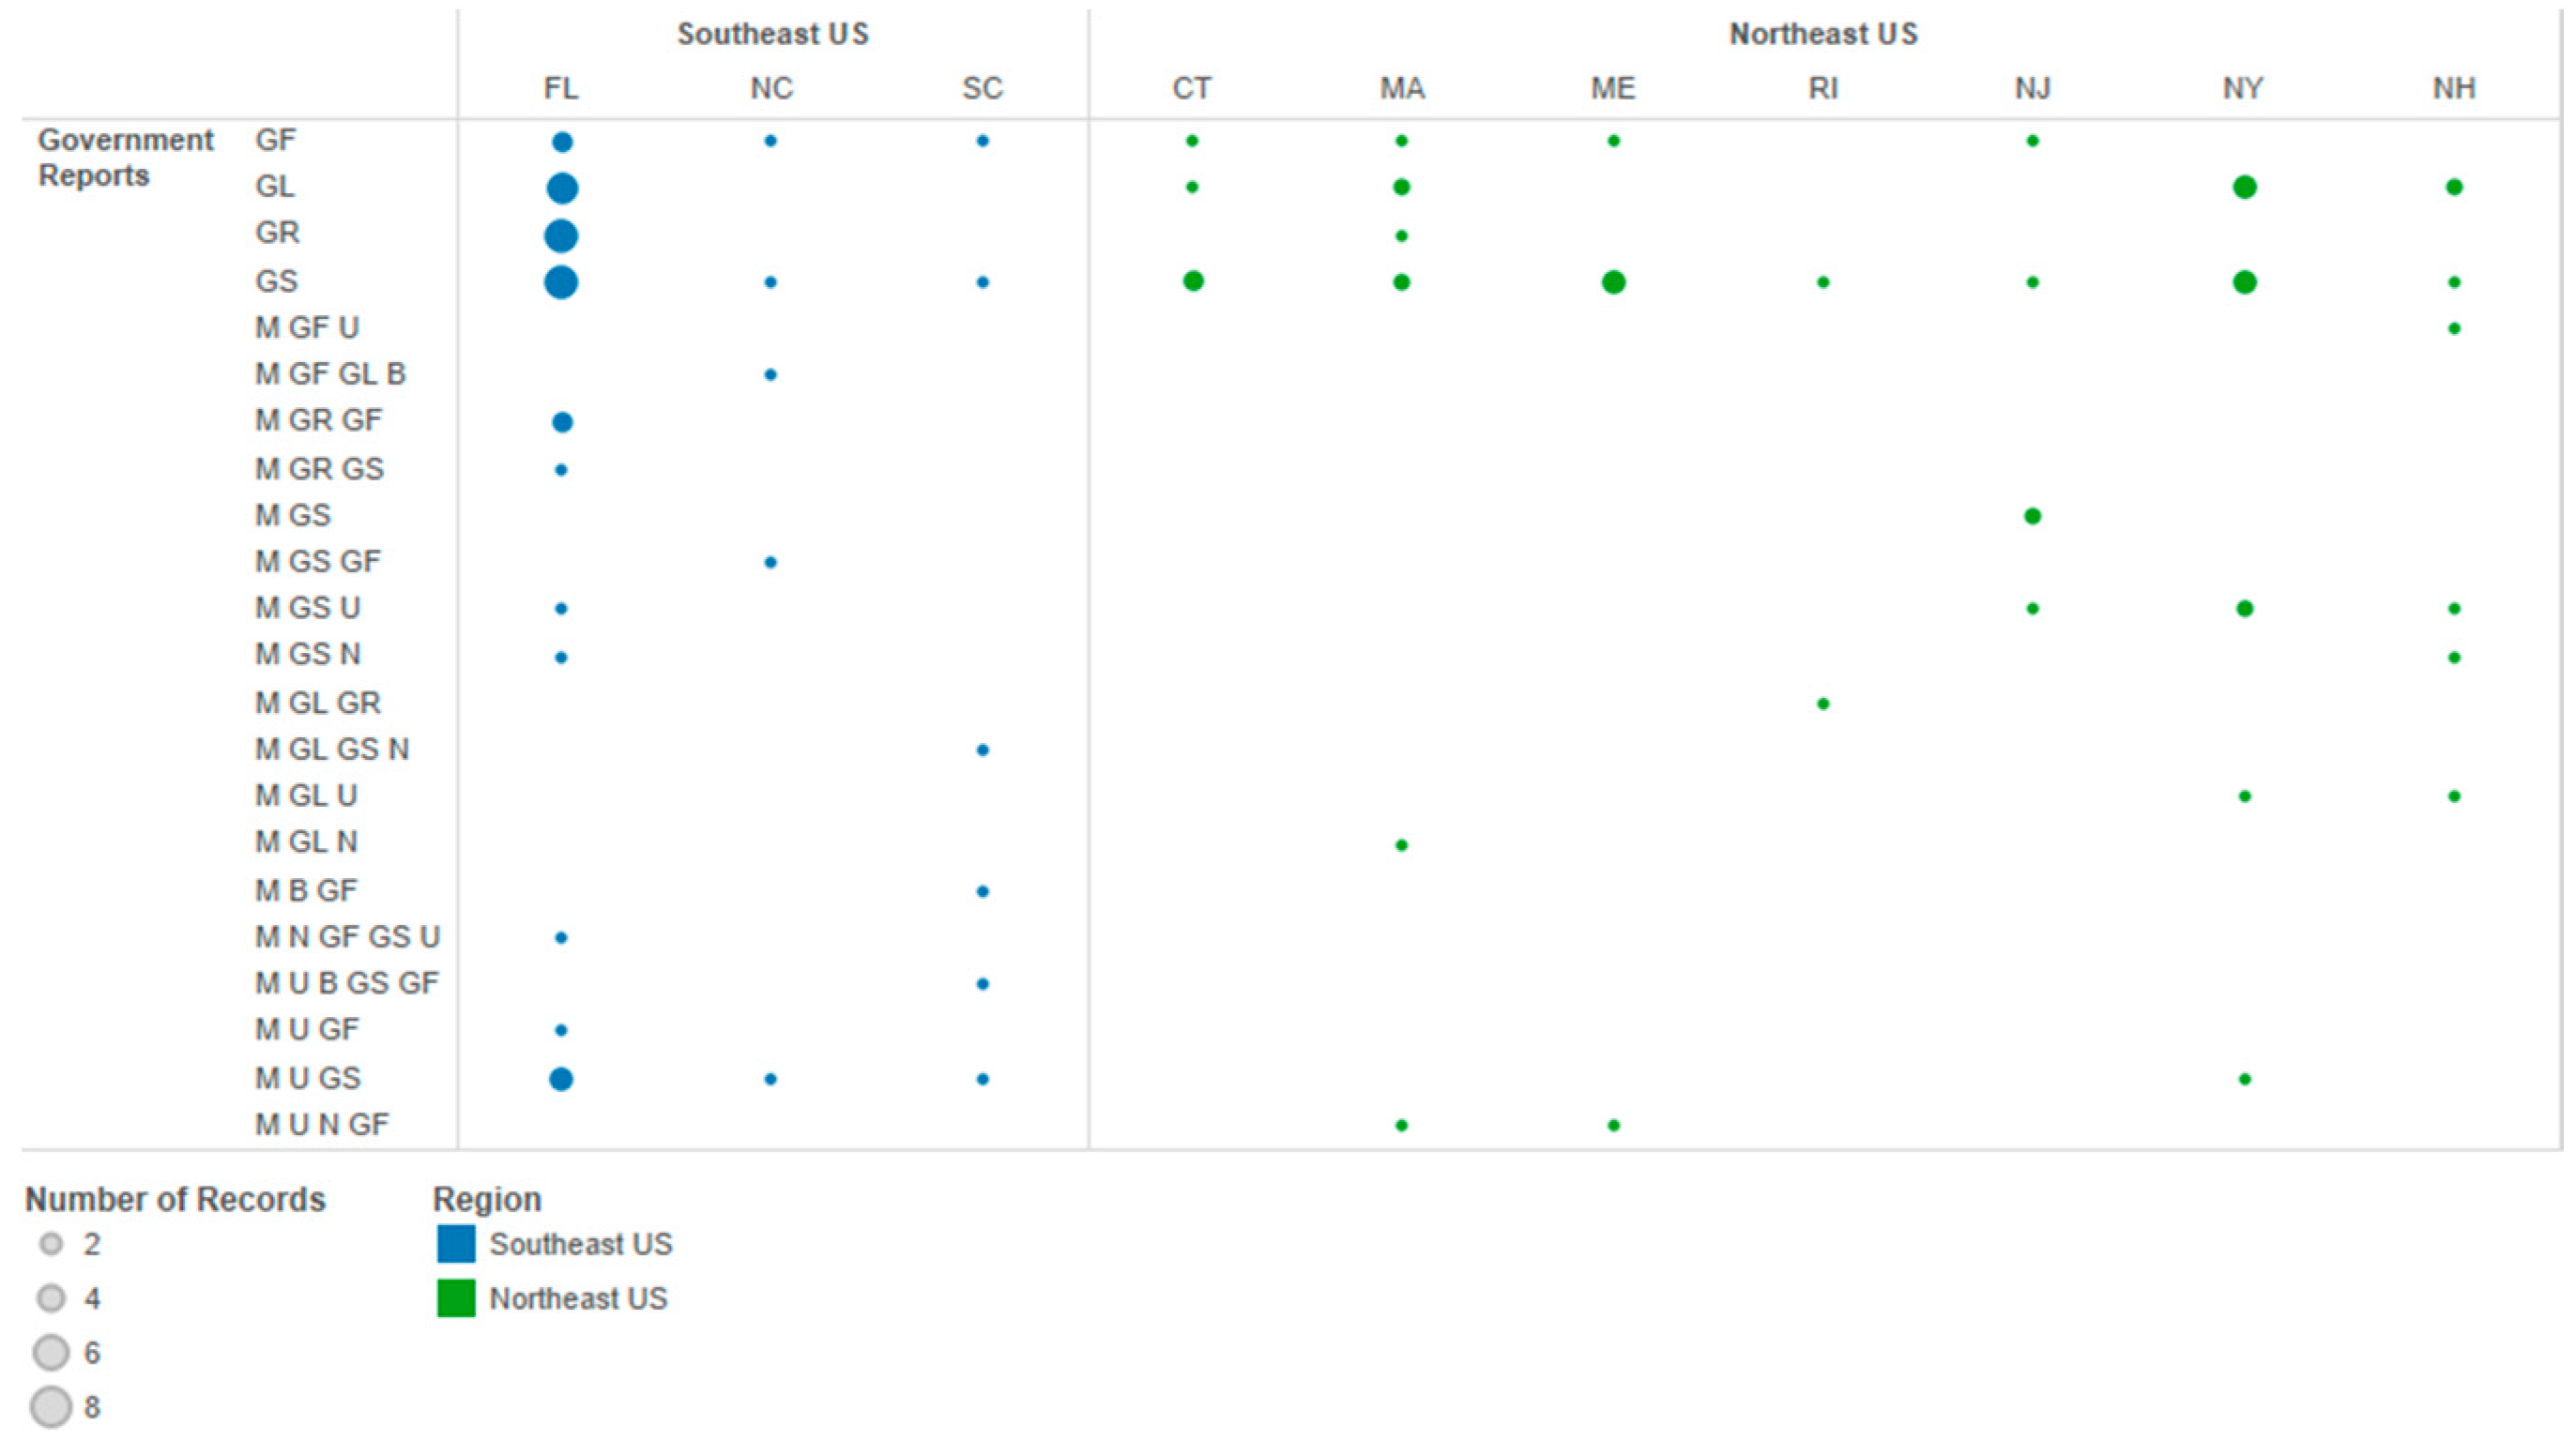
2.4. Adaptation Reports by Spatial Scale and Document Source
- Journals (J): peer-reviewed academic journals (J).
- Government (GF, GS, GR, GL): policy reports prepared by or primarily funded by public sector entities, including local, state, and federal agencies. This category has at least four important governance subcategories: GF: Government Federal, federal planning and science agencies; GS: Government State, state planning and science agencies; GR: Government Regional, regional planning initiatives; GL: Government Local, city or county planning and administrative agencies.
- NGOs (=nonprofits) (N): reports prepared by or primarily funded by NGO/non-profit organizations, typically not formally peer-reviewed as in academic journal publications.
- Universities (U): reports prepared by universities, typically as contractors, often for other funding sources (e.g., GF, GS, N).
- Mixed reports (M): Many combinations of sources can occur in the literature on adaptation and many reports are co-produced in writing, funding, or both by multiple institutional collaborators. For example, M: U, GS, when a university works with state government to produce a report.
2.5. Data Analysis
3. Results
3.1. Spatial Scales
3.2. Temporal Patterns and Adaptation Literatures
3.3. Adaptation Reports by Spatial Scale and Document Source
4. Discussion
4.1. Climate Adaptation and Roles of Grey Literature
4.2. U.S. Atlantic Coast Geographic Comparisons
4.2.1. Southeast U.S.
4.2.2. Northeast U.S.
4.3. Limitations on Geographic Comparisons
4.4. Coastal Adaptation Policy among Institutional Sectors
5. Conclusions
Supplementary Materials
Author Contributions
Funding
Acknowledgments
Conflicts of Interest
References
- Tebaldi, C.; Strauss, B.H.; Zervas, C.E. Modelling sea level rise impacts on storm surges along US coasts. Environ. Res. Lett. 2012, 7, 014032. [Google Scholar] [CrossRef]
- Hsiang, S.; Kopp, R.; Jina, A.; Rising, J.; Delgado, M.; Mohan, S.; Rasmussen, D.J.; Muir-Wood, R.; Wilson, P.; Oppenheimer, M.; et al. Estimating economic damage from climate change in the United States. Science 2017, 356, 1362–1369. [Google Scholar] [CrossRef] [PubMed]
- International Monetary Fund. Report for Selected Country Groups and Subjects; World Econ. Outlook; International Monetary Fund: Washington, DC, USA, April 2016. [Google Scholar]
- Kulp, S.; Strauss, B.H. Rapid escalation of coastal flood exposure in US municipalities from sea level rise. Clim. Chang. 2017, 142, 477–489. [Google Scholar] [CrossRef]
- Jones, L.; Champalle, C.; Chesterman, S.; Cramer, L.; Crane, T.A. Constraining and enabling factors to using long-term climate information in decision-making. Clim. Policy 2017, 17, 551–572. [Google Scholar] [CrossRef]
- Snover, A.K.; Binder, L.C.W.; Lopez, J.; Willmott, E.; Kay, J.E.; Howell, D.; Simmonds, J. Preparing for Climate Change: A Guidebook for Local, Regional, and State Governments; University of Washington: King County, WA, USA; ICLEI: Seattle, WA, USA, 2007. [Google Scholar]
- Kunreuther, H.C.; Michel-Kerjan, E.O. At War with the Weather: Managing Large-Scale Risks in a New Era of Catastrophes; MIT Press: Cambridge, MA, USA, 2009. [Google Scholar]
- Moser, S.C.; Williams, S.J.; Boesch, D.F. Wicked challenges at lands’ end: Managing coastal vulnerability under climate change. Annu. Rev. Environ. Res. 2012, 37, 51–78. [Google Scholar] [CrossRef]
- Hauer, M.E.; Evans, J.M.; Mishra, D.R. Millions projected to be at risk from sea-level rise in the continental United States. Nat. Clim. Chang. 2016, 6, 691–695. [Google Scholar] [CrossRef]
- Sullivan Sealey, K.S.; Binder, P.M.; Burch, R.K. Financial credit drives urban land-use change in the United States. Anthropocene 2018, 21, 42–51. [Google Scholar] [CrossRef]
- Lemos, M.C.; Kirchhoff, C.J.; Ramprasad, V. Narrowing the climate information usability gap. Nat. Clim. Chang. 2012, 2, 789–794. [Google Scholar] [CrossRef]
- Dilling, L.; Lackstrom, K.; Haywood, B.; Dow, K.; Lemos, M.C.; Berggren, J.; Kalafatis, S. What stakeholder needs tell us about enabling adaptive capacity: The intersection of context and information provision across regions in the United States. Weather Clim. Soc. 2015, 7, 5–17. [Google Scholar] [CrossRef]
- Berrang-Ford, L.; Pearce, T.; Ford, J.D. Systematic review approaches for climate change adaptation research. Reg. Environ. Chang. 2015, 15, 755–769. [Google Scholar] [CrossRef]
- Vink, M.J.; Dewulf, A.; Termeer, C. The role of knowledge and power in climate change adaptation governance: A systematic literature review. Ecol. Soc. 2014, 18, 46. [Google Scholar] [CrossRef]
- Sierra-Correa, P.C.; Kintz, J.R.C. Ecosystem-based adaptation for improving coastal planning for sea-level rise: A systematic review for mangrove coasts. Mar. Policy 2015, 51, 385–393. [Google Scholar] [CrossRef]
- McDowell, G.; Ford, J.; Jones, J. Community-level climate change vulnerability research: Trends, progress, and future directions. Environ. Res. Lett. 2016, 11, 033001. [Google Scholar] [CrossRef]
- Räsänen, A.; Juhola, S.; Nygren, A.; Käkönen, M.; Kallio, M.; Monge, A.M.; Kanninen, M. Climate change, multiple stressors and human vulnerability: A systematic review. Reg. Environ. Chang. 2016, 16, 2291–2302. [Google Scholar]
- Ford, J.D.; Berrang-Ford, L.; Paterson, J. A systematic review of observed climate change adaptation in developed nations. Clim. Chang. 2011, 106, 327–336. [Google Scholar] [CrossRef]
- Antwi-Agyei, P.; Dougill, A.J.; Stringer, L.C. Barriers to climate change adaptation: Evidence from northeast Ghana in the context of a systematic literature review. Clim. Dev. 2014, 7, 297–309. [Google Scholar] [CrossRef]
- Ford, J.D.; Pearce, T. What we know, do not know, and need to know about climate change vulnerability in the western Canadian Arctic: A systematic literature review. Environ. Res. Lett. 2010, 5, 014008. [Google Scholar] [CrossRef]
- Porter, J.J.; Dessai, S.; Tompkins, E.L. What do we know about UK household adaptation to climate change? A systematic review. Clim. Chang. 2014, 127, 371–379. [Google Scholar] [CrossRef]
- Sanderson, H.; Hilden, M.; Russel, D.; Dessai, S. Database support for adaptation to climate change: An assessment of web-based portals across scales. Integr. Environ. Assess. Manag. 2016, 12, 627–631. [Google Scholar] [CrossRef]
- Mitchell, C.L.; Burch, S.L.; Driscoll, P.A. (Mis) communicating climate change? Why online adaptation databases may fail to catalyze adaptation action. Wiley Interdiscip. Rev. Clim Chang. 2016, 7, 600–613. [Google Scholar] [CrossRef]
- Lawrence, A.; Thomas, J.; Houghton, J.; Weldon, P. Collecting the evidence: Improving access to grey literature and data for public policy and practice. Aust. Acad. Res. Libr. 2015, 46, 229–249. [Google Scholar] [CrossRef]
- Adams, R.J.; Smart, P.; Huff, A.S. Shades of grey: Guidelines for working with the grey literature in systematic reviews for management and organizational studies. Int. J. Manag. Rev. 2017, 19, 432–454. [Google Scholar] [CrossRef]
- Pearce, T.; Ford, J.D.; Duerden, F.; Smit, B.; Andrachuk, M.; Berrang-Ford, L.; Smith, T. Advancing adaptation planning for climate change in the Inuvialuit Settlement Region (ISR): A review and critique. Reg. Environ. Chang. 2011, 11, 1–17. [Google Scholar] [CrossRef]
- Bloetscher, F.; Meeroff, D.E.; Heimlich, B.N. Improving the Resilience of a Municipal Water Utility Against the Likely Impacts of Climate Change: A Case Study: City of Pompano Beach Water Utility; Florida Atlantic University: Boca Raton, FL, USA, 2009. [Google Scholar]
- Melillo, J.M.; Richmond, T.; Yohe, G.W. (Eds.) Climate Change Impacts in the United States: The Third National Climate Assessment; US Global Change Research Program: Washington, DC, USA, 2014; p. 841. [Google Scholar] [CrossRef]
- Haywood, B.K.; Brennan, A.; Dow, K.; Kettle, N.P.; Lackstrom, K. Negotiating a mainstreaming spectrum: Climate change response and communication in the Carolinas. J. Environ. Policy Plan. 2014, 16, 75–94. [Google Scholar] [CrossRef]
- Berkes, F.; Colding, J.; Folke, C. (Eds.) Navigating Social-Ecological Systems: Building Resilience for Complexity and Change; Cambridge University Press: Cambridge, UK, 2008. [Google Scholar]
- Jamil, T.; Ly, A.; Morey, R.D.; Love, J.; Marsman, M.; Wagenmakers, E.J. Default “Gunel and Dickey” Bayes factors for contingency tables. Behav. Res. Methods 2015, 49, 638–652. [Google Scholar] [CrossRef] [PubMed]
- Cohen, J. Statistical Power Analysis for the Behavioral Sciences, 2nd ed.; Psychology Press: New York, NY, USA, 1988. [Google Scholar]
- Barth, M.C.; Titus, J.G. Greenhouse Effect and Sea Level Rise: A Challenge for this Generation; Van Nostrand Reinhold Co.: New York, NY, USA, 1984; 325p. [Google Scholar]
- Noss, R.F. Between the devil and the deep blue sea: Florida’s unenviable position with respect to sea level rise. Clim. Chang. 2011, 107, 1–16. [Google Scholar] [CrossRef]
- Haddaway, N.R.; Bayliss, H.R. Shades of grey: Two forms of grey literature important for reviews in conservation. Biol. Conserv. 2015, 191, 827–829. [Google Scholar] [CrossRef]
- Ariza, E.; Lindeman, K.C.; Mozumder, P.; Suman, D.O. Beach management in Florida: Assessing stakeholder perceptions on governance. Ocean Coast. Manag. 2014, 96, 82–93. [Google Scholar] [CrossRef]
- Susskind, D.; Rumore, D.; Hulet, C.; Field, P. Managing Climate Risks in Coastal Communities: Strategies for Engagement, Readiness and Adaptation; Anthem Environment and Sustainability; Anthem Press: London, UK, 2015; 464p. [Google Scholar]
- Lindeman, K.C.; Dame, L.E.; Avenarius, C.B.; Horton, B.P.; Donnelly, J.P.; Corbett, D.R.; Kemp, A.C.; Lane, P.; Mann, M.E.; Peltier, W.R. Science needs for sea-level adaptation planning: Comparisons among three U.S. Atlantic coastal regions. Coast. Manag. 2015, 43, 555–574. [Google Scholar] [CrossRef]
- Martin, J.; Fackler, P.L.; Nichols, J.D.; Lubow, B.C.; Eaton, M.J.; Runge, M.C.; Stith, B.M.; Langtimm, C.A. Structured decision making as a proactive approach to dealing with sea level rise in Florida. Clim. Chang. 2011, 107, 185–202. [Google Scholar] [CrossRef]
- Boda, C.S. Power and rationality in coastal planning: Effects on participation and possibility in the management of barrier island dunes in Flagler Beach, Florida, USA. J. Coast. Conserv. 2015, 19, 561–576. [Google Scholar] [CrossRef]
- Mozumder, P.; Flugman, E.; Randhir, T. Adaptation behavior in the face of global climate change: Survey responses from experts and decision makers serving the Florida Keys. Ocean Coast. Manag. 2011, 54, 37–44. [Google Scholar] [CrossRef]
- Southeast Florida Regional Climate Change Compact (SFRCCC). Analysis of the Vulnerability of Southeast Florida to Sea Level Rise; SFRCCC Inundation Mapping and Vulnerability Assessment Work Group: Miami, FL, USA, 2012. [Google Scholar]
- USGS; FAU; FSG. Predicting Ecological Changes in the Florida Everglades under a Future Climate Scenario; Florida Sea Grant, and Florida Atlantic University Report; U.S Geological Survey: Reston, VA, USA, 2013.
- Butler, W.H.; Deyle, R.E.; Mutnansky, C. Low-regrets incrementalism: Land use planning adaptation to accelerating sea level rise in Florida’s Coastal Communities. J. Plan. Educ. Res. 2016, 36, 319–332. [Google Scholar] [CrossRef]
- Calil, J.; Newkirk, S. Aligning Natural Resource Conservation, Flood Hazard Mitigation, and Social Vulnerability Remediation in Florida. J. Ocean Coast. Econ. 2017, 4, 1–29. [Google Scholar] [CrossRef]
- Poulter, B.; Feldman, R.L.; Brinson, M.M.; Horton, B.P.; Orbach, M.K.; Pearsall, S.H.; Reyes, E.; Riggs, S.R.; Whitehead, J.C. Sea-level rise research and dialogue in North Carolina: Creating windows for policy change. Ocean Coast. Manag. 2009, 52, 147–153. [Google Scholar] [CrossRef]
- Dow, K.; Haywood, B.K.; Kettle, N.P.; Lackstrom, K. The role of ad hoc networks in supporting climate change adaptation: A case study from the Southeastern United States. Reg. Environ. Chang. 2013, 13, 1235–1244. [Google Scholar] [CrossRef]
- Lackstrom, K.; Kettle, N.P.; Haywood, B.; Dow, K. Climate-sensitive decisions and time frames: A cross-sectoral analysis of information pathways in the Carolinas. Weather Clim. Soc. 2014, 6, 238–252. [Google Scholar] [CrossRef]
- North Carolina Interagency Leadership Team (NCILT). Climate Ready North Carolina: Building a Resilient Future; North Carolina Interagency Leadership Team: Raleigh, NC, USA, 2012. [Google Scholar]
- CH2MHILL; EPA. Community Resilience Project in Wilmington, NC; EPA Office of Community Sustainability: Wilmington, NC, USA, 2013; 50p. [Google Scholar]
- Rosenzweig, C.; Solecki, W. Introduction to climate change adaptation in New York City: Building a risk management response. Ann. N. Y. Acad. Sci. 2010, 1196, 13–18. [Google Scholar] [CrossRef] [PubMed]
- Hamin, E.M.; Gurran, N.; Emlinger, A.M. Barriers to municipal climate adaptation: Examples from coastal Massachusetts’ smaller cities and towns. J. Am. Plan. Assoc. 2014, 80, 110–122. [Google Scholar] [CrossRef]
- Becker, A. Using boundary objects to stimulate transformational thinking: Storm resilience for the Port of Providence, Rhode Island (USA). Sustain. Sci. 2016, 12, 477–501. [Google Scholar] [CrossRef]
- Hauer, M.E.; Evans, J.M.; Alexander, C.R. Sea-level rise and sub-county population projections in coastal Georgia. Popul. Environ. 2015, 37, 44–62. [Google Scholar] [CrossRef]
- Wise, R.M.; Fazey, I.; Smith, M.S.; Park, S.E.; Eakin, H.C.; Van Garderen, E.A.; Campbell, B. Reconceptualising adaptation to climate change as part of pathways of change and response. Glob. Environ. Chang. 2014, 28, 325–336. [Google Scholar] [CrossRef]
- Kantamaneni, K.; Phillips, M.; Thomas, T.; Jenkins, R. Assessing coastal vulnerability: Development of a combined physical and economic index. Ocean Coast. Manag. 2018, 158, 164–175. [Google Scholar] [CrossRef]
- Kahan, D.M.; Peters, E.; Wittlin, M.; Slovic, P.; Ouellette, L.L.; Braman, D.; Mandel, G. The polarizing impact of science literacy and numeracy on perceived climate change risks. Nat. Clim. Chang. 2012, 2, 732–735. [Google Scholar] [CrossRef]
- Van der Linden, S.; Maibach, E.; Leiserowitz, A. Improving public engagement with climate change: Five “best practice” insights from psychological science. Perspect. Psychol. Sci. 2015, 10, 758–763. [Google Scholar] [CrossRef] [PubMed]


© 2018 by the authors. Licensee MDPI, Basel, Switzerland. This article is an open access article distributed under the terms and conditions of the Creative Commons Attribution (CC BY) license (http://creativecommons.org/licenses/by/4.0/).
Share and Cite
Lindeman, K.C.; Giannoulis, C.; Beard, B.R. Coastal Climate Adaptation Literatures of the Southeast and Northeast U.S.: Regional Comparisons among States and Document Sources. J. Mar. Sci. Eng. 2018, 6, 152. https://doi.org/10.3390/jmse6040152
Lindeman KC, Giannoulis C, Beard BR. Coastal Climate Adaptation Literatures of the Southeast and Northeast U.S.: Regional Comparisons among States and Document Sources. Journal of Marine Science and Engineering. 2018; 6(4):152. https://doi.org/10.3390/jmse6040152
Chicago/Turabian StyleLindeman, Kenyon C., Christos Giannoulis, and Bryce R. Beard. 2018. "Coastal Climate Adaptation Literatures of the Southeast and Northeast U.S.: Regional Comparisons among States and Document Sources" Journal of Marine Science and Engineering 6, no. 4: 152. https://doi.org/10.3390/jmse6040152
APA StyleLindeman, K. C., Giannoulis, C., & Beard, B. R. (2018). Coastal Climate Adaptation Literatures of the Southeast and Northeast U.S.: Regional Comparisons among States and Document Sources. Journal of Marine Science and Engineering, 6(4), 152. https://doi.org/10.3390/jmse6040152