Article

Partial Stator Overlap in a Linear Generator for Wave Power: An Experimental Study

Division of Electricity, Department of Engineering Science, Uppsala University, Box 534, 75121 Uppsala, Sweden
*
Author to whom correspondence should be addressed.
These authors contributed equally to this work.
J. Mar. Sci. Eng. 2017, 5(4), 53; https://doi.org/10.3390/jmse5040053
Submission received: 27 September 2017 / Revised: 13 November 2017 / Accepted: 16 November 2017 / Published: 22 November 2017
(This article belongs to the Section Ocean Engineering)

Abstract

:
This paper presents a study on how the power absorption and damping in a linear generator for wave energy conversion are affected by partial overlap between stator and translator. The theoretical study shows that the electrical power as well as the damping coefficient change quadratically with partial stator overlap, if inductance, friction and iron losses are assumed independent of partial stator overlap or can be neglected. Results from onshore experiments on a linear generator for wave energy conversion cannot reject the quadratic relationship. Measurements were done on the inductance of the linear generator and no dependence on partial stator overlap could be found. Simulations of the wave energy converter’s operation in high waves show that entirely neglecting partial stator overlap will overestimate the energy yield and underestimate the peak forces in the line between the buoy and the generator. The difference between assuming a linear relationship instead of a quadratic relationship is visible but small in the energy yield in the simulation. Since the theoretical deduction suggests a quadratic relationship, this is advisable to use during modeling. However, a linear assumption could be seen as an acceptable simplification when modeling since other relationships can be computationally costly.

1. Introduction

Many different concepts for wave power extraction are being studied and evaluated, both regarding how to best capture power from the ocean waves, and how to transfer the capture of power to electricity [1,2,3]. In this paper, a point absorbing buoy connected to a linear permanent magnet generator is considered. The point absorbing buoy is small, relative to the wavelength, and can capture power from any wave direction. Due to the high forces and the slow and highly variable speed in alternating directions, the power captured by the point absorber cannot be connected to any conventional rotating generator, without adding an intermediate conversion step, which will add to system complexity and system loss. A linear generator can take advantage of the heave motion of the wave and therefore linear generators are used in several different wave energy converters [4,5,6,7]. Drawbacks with linear generators for wave power is that they become very large due to the high forces and low velocities [8,9] and that the induced voltage varies in both frequency and amplitude [10,11,12,13]. Another drawback with linear generators is the partial stator overlap that can occur depending on the design [14].
Power transfer from the translator to the stator occurs where the translator and stator overlaps (see Figure 1). The fraction of the stator that momentarily is covered by the translator is denoted relative stator overlap or relative active area A f r a c and is 1 when the stator has full overlap with the translator and is 0 when the translator is completely pulled out of the stator. A varying partial stator overlap will affect the power take-off (PTO) damping of the generator, and thus the dynamical behavior of the wave energy converter (WEC) during operation. This will have consequences on both power production and forces acting on the WEC, one of the most important being the upper end-stop force in high waves. The decreased power absorption is important to understand when designing the generator, while the end-stop forces are important to know for the structural design of end-stop.
There is no conclusive approach as to how to include partial stator overlap in the PTO modeling, which is reviewed in the background section. To the authors’ knowledge, partial stator overlap in permanent magnet linear generators is a topic for the concept from Uppsala University [15,16], the Archimedes Wave Swing [17,18], the Berkeley Wedge [5] and the linear generator developed at Oregon State University [6].
This study aims to verify theory about power take-off (PTO) forces and power production for partial stator overlap with data from onshore testing of a point absorber wave energy converter. By evaluating how partial stator overlap, i.e., partial active area, influences the power transfer, a relationship between electrical power and relative stator overlap is identified.
The paper begins with the Background, including how partial stator overlap has been modeled and measured in previous studies, and a description of the generator used for this study. It then continues, in the Method section, by describing the experimental setup, data processing and a case study. The Results section contains experimental results from onshore tests and a simulation case-study assessing what consequence different A f r a c dependencies will have on the offshore behavior of the full WEC. The results of the onshore tests include inductance measurements, some general results of the onshore tests and results on which dependency the data suggests between relative stator overlap and power production.

2. Background

This section provides the derivation of a simplified expression to predict how the damping force should vary with partial stator overlap in theory. It also discusses how partial stator overlap has been accounted for previously in linear generators for wave energy conversion. The section ends with a description of the generator used in the onshore experiments.

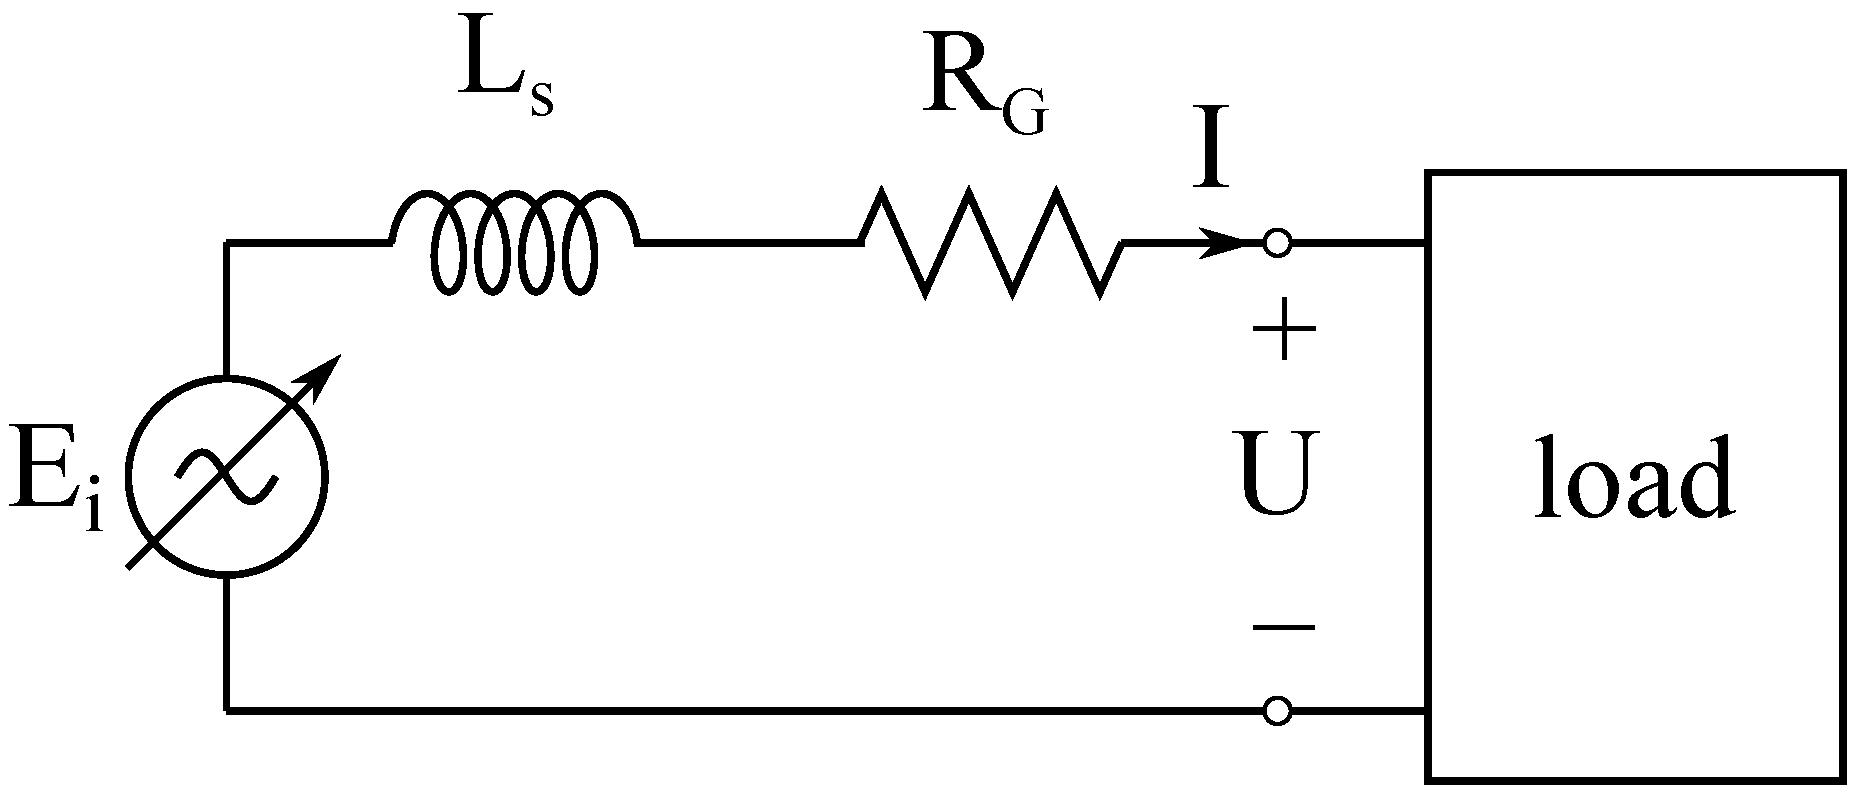
2.1. Theoretical Background

A linear force analysis of translator motion inside the generator gives:
m t x ¨ = F l i n e F P T O m t g
where m t is the mass of the translator, x ¨ is the acceleration of the translator, F l i n e is the force in the line connected to the translator, F P T O is the power take-off force and g is earth’s gravitational acceleration. F P T O includes electromagnetic forces and friction. F P T O is also referred to as a damping force since it dampens the motion of the translator.
From the power take-off, a damping coefficient γ for the generator can be defined:
γ = F P T O x ˙
where x ˙ is the velocity of the translator. γ is often assumed to be independent of speed, but there are studies showing that it is not independent of speed [19,20]. Both Refs. [19,20] show that γ depends on the speed and the impedance, making γ less speed-dependent when the generator is connected to a load with higher resistance. Friction and iron losses are also included in F P T O , which both depend on the speed of the translator.
The power transfer between buoy and generator is
P a b s o r b e d = γ x ˙ 2
where P a b s o r b e d is the instantaneous power absorbed by the WEC-unit as both electrical power and losses. Furthermore, all absorbed power will not be converted into electrical power:
P e = κ e P a b s o r b e d
where P e is electrical power and resistive losses while κ e is a positive value less than one. κ e is less than one due to friction and iron losses. When γ is calculated from P e , and therefore does not include friction and iron losses, it can be called γ e l .
P e , P a b s o r b e d and γ will be assumed to depend on the partial stator overlap A f r a c . If the position x is defined such as x = 0 when the translator is in its mid position (see Figure 1b), A f r a c is
A f r a c = 0 if | x | 1 2 ( l t + l s ) 1 if | x | 1 2 ( l t l s ) 1 l s 1 2 ( l t + l s ) | x | otherwise
l t and l s is the length of the translator and the stator, respectively. This means that A f r a c [ 0 , 1 ] . When A f r a c ( 0 , 1 ) , A f r a c is linearly proportional to the translator’s position relative the stator.
Faraday’s law is the starting point for finding the relation between P e and A f r a c :
e ( t ) = N d Φ d t
It is recognized that e ( t ) is the induced voltage in the generator, t is time, N is the number of turns in the stator windings and Φ is the magnetic flux. If Φ is sinusoidal, the root mean square (RMS) of the induced phase voltage for full stator overlap becomes:
E R M S = 1 2 Φ ^ N ω
ω is the angular frequency, which is proportional to the speed of the translator and Φ ^ is the maximum value of the magnetic flux Φ .
A voltage is induced in the stator windings when the stator and the translator are overlapping, which means that the induced voltage depends on the stator overlap. The time derivative d d t comes from the change in magnet polarity and from the speed of the translator. The number of turns in the stator windings N is constant and current will flow in the whole winding. The magnetic flux Φ depends on the magnetic properties of the magnets and their alignment in the translator, but will only induce voltage when overlapping the translator. Since the overlapping part is linearly changing with changing relative stator overlap (see Equation (5)), Φ is linearly dependent on A f r a c .
From the circuit equivalent of the generator in Figure 2, and by expressing the load as R l o a d + j X l o a d , the RMS of P e , if there are three phases, can be expressed as
P e , R M S = 3 E R M S 2 2 R G + R l o a d ( R G + R l o a d ) 2 + ( ω L S + X l o a d ) 2 = 3 N 2 Φ ^ 2 ω 2 4 R G + R l o a d ( R G + R l o a d ) 2 + ( ω L S + X l o a d ) 2 A f r a c 2
where R G is the internal resistance of the generator, R l o a d is the resistance of the load, X l o a d is the reactance of the load and L S is the inductance of the generator. The magnetic flux Φ has been assumed to be sinusoidal. L S is here assumed independent of A f r a c , which will be discussed later on.
In a complete system, active rectifiers can regulate the relationship between the current I and the voltage U (see Figure 2), but, in this analysis, no active control system has been included. This means that the load is independent of A f r a c .
A similar reasoning with the Lorentz’ force can also be used. The electromagnetic force, F e m , exerted on a conductor in a magnetic field can be described as
F e m = I l × B
where I is the current, l is the conductor and B is the magnetic flux density. Here, the total electromagnetic forces in the generator are investigated, and therefore l = l G , which is the total length of all conductors in the generator and B = B G , which is the magnetic flux density in the air gap.
The generator has nine sides and can be approximated as tubular, with l G mainly in the angular direction and B G mainly in the radial direction, giving F e m = F z z ^ . Using first Ohm’s law and then Faraday’s law gives
F e m , R M S = l G B G , R M S I R M S = l G B G , R M S E R M S ( R G + R l o a d ) 2 + ( ω L S + X l o a d ) 2 = l G B G , R M S ω N Φ ^ 2 ( ( R G + R l o a d ) 2 + ( ω L S + X l o a d ) 2 )
Just as before, Φ ^ is proportional to A f r a c . On top of that, the flux density B G is negligible where there is no stator overlap, which means that B G also is proportional to A f r a c . This gives that
F e m , R M S = l G B G , R M S ω N Φ ^ 2 ( ( R G + R l o a d ) 2 + ( ω L S + X l o a d ) 2 ) A f r a c A f r a c = A f r a c 2
Since P e = F e m x ˙ , both P e and F e m are quadratically dependent on A f r a c .
If iron losses and friction losses are negligible, γ can be calculated by dividing P e with x ˙ 2 , which is equivalent to dividing F e m with x ˙ , and it can be assumed that also
γ A f r a c 2
In the experimental study, it is investigated if the assumptions are acceptable and thereby if the quadratic relationship between P e and A f r a c is valid. On top of assuming constant inductance, this derivation is ignoring possible effects partial stator overlap has on friction and iron losses. Frictional losses and iron losses are likely dependent on A f r a c , but this would be difficult to study experimentally since both frictional losses and iron losses are difficult to measure and separate from each other. Iron losses only occur where the translator is overlapping the stator and are proportional to the volume of the stator where the stator is overlapped by the translator. Iron losses can therefore be assumed to be linearly dependent on A f r a c . In a generator with negligible frictional losses and iron losses, the relationship between P e and A f r a c should be quadratic.

2.2. Previous Work

Several authors, studying different linear generator concepts, acknowledge the effect partial stator overlap has on power absorption and damping force, e.g., [5,17,21], but without including the effect of it in their studies. A linear generator for wave energy conversion can be constructed so that there is full stator overlap during normal operation [17,18]. To achieve full stator overlap at all times, the stator needs to be substantially shorter than the translator, which could lead to lower performance during normal wave climates [9].
For the Uppsala University linear generator, P e was assumed to be linearly proportional to A f r a c by Eriksson et al. [20], which has been reprinted by several other references, e.g., [22,23,24,25] and reused by e.g., [26,27,28]. Tyrberg et al. [29] studies how the energy absorbed from the waves is affected by the active length of the stator, where the active length is the length of the stator that is overlapped by the translator. The theoretical maximum of relative absorbed power is assumed to be linearly proportional to the active length divided by the stator length. The active length divided by the stator length is equal to A f r a c , and thereby Tyrberg et al. also assume that P e is linearly proportional to A f r a c . The choice of a linear relationship might have been an active choice to simplify the modeling.
Lejerskog et al. [30] derive a differential equation for the translator speed from a force analysis of the translator when it moves downward, for a constant speed. The contribution from the electromagnetic damping to the translator speed is then assumed to be proportional to the relative stator overlap squared.
Danielsson [31] studied the generator design numerically, using finite element methods (FEM) as well as through experimental studies. He concluded that longitudinal end effects were to be expected, which has not yet been fully understood and needs more studies.
An experimental study of how the generator line force and the PTO damping depend on the translator position has been presented in [32]. The onshore tests, similar to those presented in this paper, were performed on a surface mounted Nd 2 Fe 14 B magnet generator after the generator was fully assembled. Since fully assembled, the partial stator overlap was limited by end-stops to approximately 75% of full stator overlap. Despite the attempts to keep a constant speed throughout the full stroke, the translator speed increased as the damping force decreased. For this reason, it was better to study the damping coefficient γ e l . The partial stator overlap dependence was concluded as linear, even though a quadratic relationship could not be excluded due to the short range studied. It could also be seen that the damping for a specific value of A f r a c differs depending on if the translator is moving into or out from the stator, with higher damping force when leaving full stator overlap.
The studies on longitudinal end effects as well as experimental results showing different behavior when the translator moves into respectively out of full stator overlap motivate this study, as it indicates that reality might differ from the expected theory [31,32].

2.3. Generator Description

The onshore experiments were done on a L12 generator, which is a three-phase ferrite magnet generator developed at Uppsala University, described further in [33]. Parameters for the generator can be found in Table 1. Inductance and internal resistance is measured during the experiments and can be found in Section 4.1. The voltage given in Table 1 is given as a peak to peak value based on measurement results. The voltage was measured at a lower speed and adjusted to the rated speed since the speed dependency is linear at no load.
The linear generators developed at Uppsala University consist of a translator with permanent magnets moving vertically inside a three-phase stator, as illustrated in Figure 3. The translator is guided by wheels and has a limited stroke length, after which it will hit the upper or lower end-stop. As illustrated in Figure 1, the generator has a varying stator overlap.
The L12 differs from earlier generator prototypes from Uppsala University mainly by the translator design. The earlier generators, for example the L10, for which similar studies have been performed [32], are built with surface mounted Nd 2 Fe 14 B-magnets, while the L12 uses ferrite magnets mounted in a sandwich structure. Both concepts are illustrated schematically in Figure 4. By using the concept of sandwich mounted magnets, the vertical magnetization of the ferrite magnets is concentrated by the steel pole shoes. This way, the low remanence of the ferrite magnets, compared to the more expensive Nd 2 Fe 14 B-magnets, can be compensated with a higher amount of magnets. The sandwich structure of the translator will give the translator a small saliency. However, in this study, the generator is considered to be non-salient.
Another important design choice for the L12 generator is that the stator windings are separated into three separate stator packages: one for each phase. For earlier prototypes from Uppsala University, the phases have been spread out throughout the whole stator. With the phases separated in different stator packages, the 120 phase shift is achieved by a physical shift in the vertical placement of the stator packages. More detailed descriptions of the differences in design and the consequences for the WEC behavior are found in [32,33].
The air gap can vary ± 17 % just due to tolerances, which could lead to up to a 36% difference in electrical power [33]. Tolerances and displacement in the generator will make the experimental results deviate from the expected values and previously measured values in other linear generators.
In order to increase the power absorbed by a wave energy conversion unit, different control and damping strategies can be used [4,34]. The L12 is designed to be installed together with a passive resonance-rectifier, which is an electrical damping circuit. The passive resonance-rectifier is described in detail in [35]. The passive resonance-rectifier creates resonance between the generator and the rectifier. Resonance in electrical circuits occurs when the inductive reactance is equal to the capacitive reactance and causes high currents and high voltages if the resistance is low. Previous experiments as well as simulations show that the power absorption can be increased with the resonance rectifier circuit compared to connecting the generator to a passive diode-rectifier [11,36]. Figure 5 shows a single-phase electrical circuit model of the generator connected to the resonance rectifier as well as how the generator was connected during the onshore experiment.

3. Method

This section describes the process of collecting and analyzing experimental data for how the generator damping correlates with stator overlap. It begins with describing the experimental setup for the onshore measurements and a description of complementary measurements made to assess the inductance of the generator. The section then continues with a description of the post-processing of the data including the linear regression analysis performed in this study. Thereafter follows a description of a case study on the potential impact of simulating different dependence of partial stator overlap.

3.1. Experimental Setup

The generator was tested onshore using a mobile crane to move the translator, while the generator was connected to different resistive loads. The experiment is similar to those previously performed on the L10 generator [32]. During the onshore evaluation of the L10, measurements were done of line force, phase voltages and phase currents while the generator was connected to different resistive loads. To improve the study further, compared to [32], accelerometer measurements were added in the experiment presented in this paper. In addition, a stronger crane was used in order to obtain higher translator speeds. To allow for a longer distance of partial stator overlap, the experiment was performed with the upper part of the generator disassembled. Consequently, there was no upper end-stop limiting the translator’s upward movement. In contrast to previous onshore measurement done on the generator L10, where the upper end-stop limited the partial stator overlap range. Figure 3 shows a schematic of the WEC generator when fully assembled and in the state it was tested. Figure 5b shows a one-phase equivalent circuit of the generator, load and some of the measurement equipment during the onshore experiment.
The measurement equipment used during the onshore tests with a mobile crane is presented in Table 2. All signals were logged on the same unit with a 1 kHz sampling frequency. The force sensor was connected between the translator and the crane connection point. The accelerometer, placed directly on the translator, was used to determine acceleration, speed as well as position of the translator. The data was tuned against zero crossings in the voltage data in order to remove signal drift. A draw wire position sensor was used to validate the position derived from the accelerometer. Phase voltage and currents were measured at the external resistive loads.
The measurements were done with seven different load cases: no load, 0.7 Ω , 1.1 Ω , 2.2 Ω , 4.4 Ω , 6.6 Ω and short circuit. For each load, the translator was moved upward and downward for twelve different crane settings, resulting in a wide range of translator speeds. Resistive loads might not be the best option for maximum power extraction, but offers a straightforward and transparent approach for evaluation of the generator’s behavior.
The generator is designed to be connected to a resonance-rectifier during operation. Since it is not connected to the resonance-rectifier during these tests, lower power is expected compared to when using the resonance-rectifier. Electrical circuit models for the generator connected to the resonance-rectifier and during the onshore measurements can be seen in Figure 5.

3.2. A Study of the Inductance at Partial Overlap

A separate experimental study was made for the generator impedance. As stated in connection with Equation (8), the quadratic relationship between the P e and A f r a c assumes that the impedance Z is independent of A f r a c . For the circuit presented in Figure 5b, the circuit impedance is
Z = ( R G + R l o a d ) + j ω L S
To validate the assumption that Z is independent of A f r a c , inductance measurements were made for different values of A f r a c .
The inductance was determined via impedance measurements by determining the phase shift between voltage and current measurements over each stator phase when the generator was connected to an external AC current source. Tests were performed at frequencies f = [ 1 , 5 , 10 ] Hz, and with the translator held still at different positions, from full stator overlap to 60% stator overlap. To avoid any influence of generator saliency, the translator was adjusted to the same local position within each pole pair width, matching stator teeth against the top pole shoe of the translator, at each position. It should be noted that simpler instrumentation, such as an LCR-meter, will not provide a sufficient current to magnetize the machine, which would lead to an underestimation of the inductance [38].

3.3. Post Processing of Data

The electrical power for each phase P e , i is calculated from the generated electricity and copper losses:
P e , i = R G I i 2 + U i I i
where i is the phase (1, 2 or 3). The total electrical power is also used:
P e = i = 1 3 P e , i
The power produced in each phase, P e , i is expected to oscillate sinusoidally, with a 120 shift between the phases, which follows from a physical shift in the vertical position of each stator package. Assuming a perfectly balanced generator, the total power output P e is constant when the speed of the translator is constant. In reality, some fluctuations are to be expected due to irregularities. When analyzing the relationship between stator overlap and produced power, studies were performed on both the total power production P e and on the power production in each phase P e , i . For P e , all data was used, while, for P e , i , only the peak values were used.
The electromagnetic damping γ e l is calculated by taking the total electrical power P e divided by the speed squared:
γ e l = P e x ˙ 2
The speed has been calculated from the measured acceleration and from detecting zero-crossings in the generated voltage in each phase. Any irregularities in P e will be visible in the experimental values of γ e l . As can be seen in Section 2.1, γ can also be calculated from the measured line force but does then also include iron losses and friction. The subscript ”el” is added to show that the damping coefficient is calculated from the measured current and voltage.

3.4. Linear Regression Analysis

Linear regression analysis was performed on the experimental data to determine what relationships the data shows between electrical power and relative stator overlap as well as between damping and relative stator overlap. Each linear regression analysis is done with a least square fits of the data in MATLAB R2016b (Mathworks, Natick, MA, USA) with the command fitlm. The linear regressions are evaluated by using the coefficient of determination R 2 , which is a measurement of how well the model predicts the data. R 2 [ 0 , 1 ] and when the linear regression predicts the data well R 2 1 .
The cases are divided depending on if the translator is moving upward or downward and depending on which load is connected to the generator. The linear regression is applied to data for all loads except for no load, giving 144 cases in total for the linear regressions and 12 cases per load and direction.
Firstly, the logarithmic values are used and linear regressions are done on
ln P e , i c ln A f r a c
and
ln γ e l c ln A f r a c
where c is a constant. If c = 1 , which is equivalent to a linear relationship between P e , i respectively, γ e l and A f r a c ; c = 2 is equivalent to a quadratic relationship etc. See also Equations (19) and (20).
For Equations (17) and (18), c is found from the linear regression and not assumed, and the values of P e , i and A f r a c are derived from the collected data. If the assumptions in Section 2.1 are valid, c should be approximately 2. The linear regression with Equation (17) is done on the data for all three phases as well as on the total electrical power. When the analysis is done for the total electrical power P e , all data points are used. When the analysis is done for each phase P e , i i , only the peak values are used since the electrical power per phase oscillates heavily due to the nature of alternating current.
After the linear regression analysis on Equations (17) and (18), linear regression analysis is performed on
P e , i A f r a c c
and
γ e l A f r a c c
for a range of assumed values of c. Based on the theory and previous studies, several values of c between 0 and 5 are tested in the linear regression analysis. The linear regressions of Equations (19) and (20) are performed with the intercept forced to be zero. In [39], linear regression analysis was performed on (19) for P e but not per phase.
The advantage of doing the linear regression analysis on the logarithmic values, as in Equations (17) and (18), is that the best fit of c is part of the result from the regression analysis, whereas the linear regression analysis of Equations (19) and (20) requires running the algorithm over several different values of c. The advantage of using Equations (17) and (18) is that the data is less manipulated and that no issues due to the data manipulation will arise, e.g., negative values on P e , i .
The linear regressions are done exclusively on positions above the stator’s midpoint since it is the change in overlapping area that is studied and the forces on the translator from the spring at the bottom may interfere with the analysis the influence of the relative stator overlap on P e . The values are chosen so that A f r a c [ 0.57 , 1 ) for all linear regression analysis. The lower limit for A f r a c is chosen so that an even the number of magnets has passed without the range being too narrow. For lower values on A f r a c , the crane begins to decelerate the translator for safety reasons, which could affect the data analysis.

3.5. Case Study: Impact Analysis

A case study was performed to analyze how a decrease in damping due to partial stator overlap may affect the dynamical behavior of the WEC. Simulations were done in the open source software OpenFOAM v.2.4.0, with a fully nonlinear Reynolds-averaged Navier–Stokes model in the time domain. The WEC is modeled as a cylindrical buoy moving with six degrees of freedom, restrained by a force in the connection line, directed towards an anchoring point on the seabed. The translator position and speed is calculated as a function of the buoy position and connection line force. Regular incident waves with a wave height of 5.9 m and a period of 10 s were used, which corresponds to a high storm wave at the Lysekil test site. The numerical wave tank is 300 m long, 75 m high and 60 m wide, and the water depth is 26 m. A more detailed description of the case study method and the modeling of buoy and generator is given in [19], where a similar case-study was made to study the generator’s dynamical behavior with different assumptions of the speed dependence of γ e l . The model has been verified with physical wave tank experiments and the complete model description is found in [40].
Five different cases were studied, with values of c = [ 0 , 1 , 1.5 , 2 , 2.5 , 3 ] , where c = 0 assumes full stator overlap at all translator positions and c = 3 assumes a cubic relationship between A f r a c and F P T O . There are less studied values of c than in the linear regression analysis, but a sufficient amount to show possible trends on how the chosen value of c affects the simulated power and forces.
A constant damping of γ = 28 kNs/m was used for all cases. As pointed out in Section 2.1, γ is not always constant, but it is considered out of the scope of this study to have a speed-dependent γ . The value 28 kNs/m was chosen because it has been observed for this generator [19] and the same value or approximately the same value has been used in other studies [20,21,24,27].
The objective of the case study was to determine what influence the exponent of A f r a c can have on the end-stop forces. An accurate estimation of the highest expected end-stop force is crucial when designing the mechanical strength of the WEC. For the simulations performed, waves corresponding to high storms at the Lysekil research site, where the WEC is designed to operate, were chosen. More information about the Lysekil research site can be found in e.g., [15].
By integration of the resulting PTO force, the simulations can also be used to calculate the relative difference in power production for the different cases. Although such results are only valid for the specific waves studied, they give an indication of how big an impact the damping at partial stator overlap could have on power production in general. This case study focuses, however, only on one type of waves and not a full spectrum of waves.

4. Results

This section begins by presenting the results from the inductance measurements, after which some general results from the experiments are shown before going into the results of the linear regression analysis and finishing with the case study.

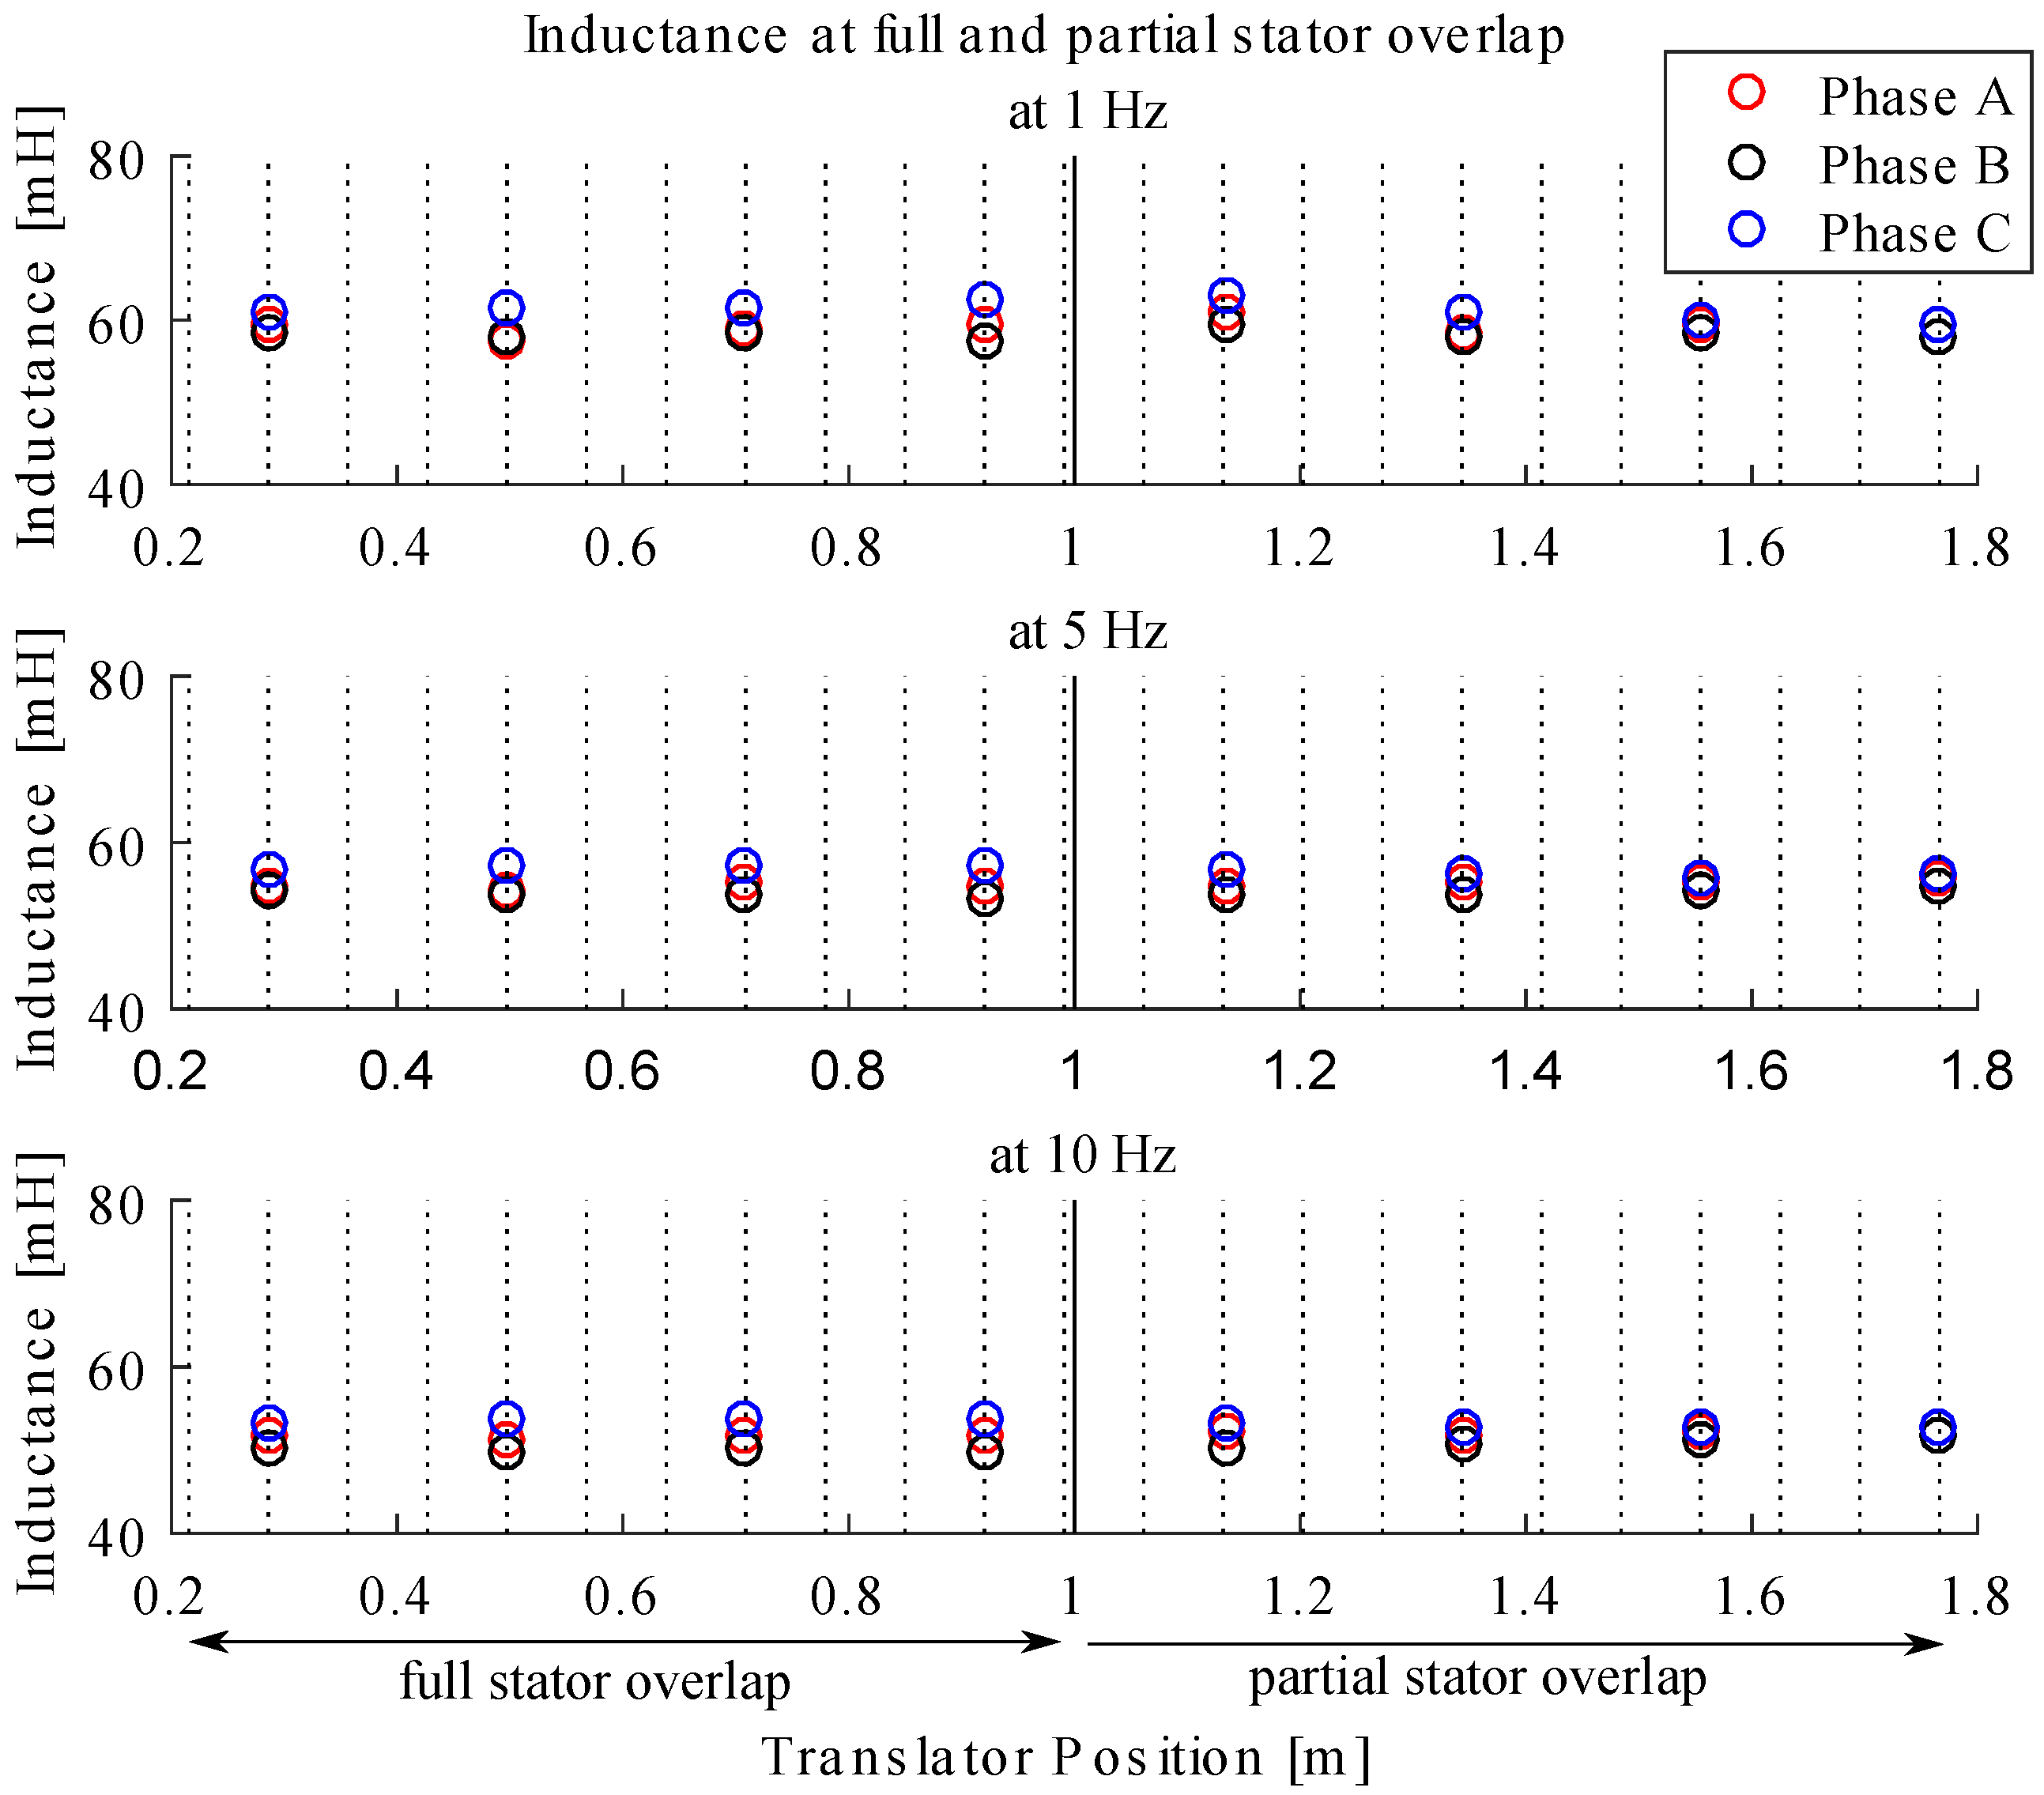
4.1. Inductance Measurements

The inductance measurements at full and partial stator overlap are presented in Figure 6. The DC resistance was measured to 0.9 Ω . The measured inductance shows no strong declining trend as the translator leaves full stator overlap. This justifies the assumption that Z = R G + j ω L S is independent of A f r a c since R G does not depend on translator position.

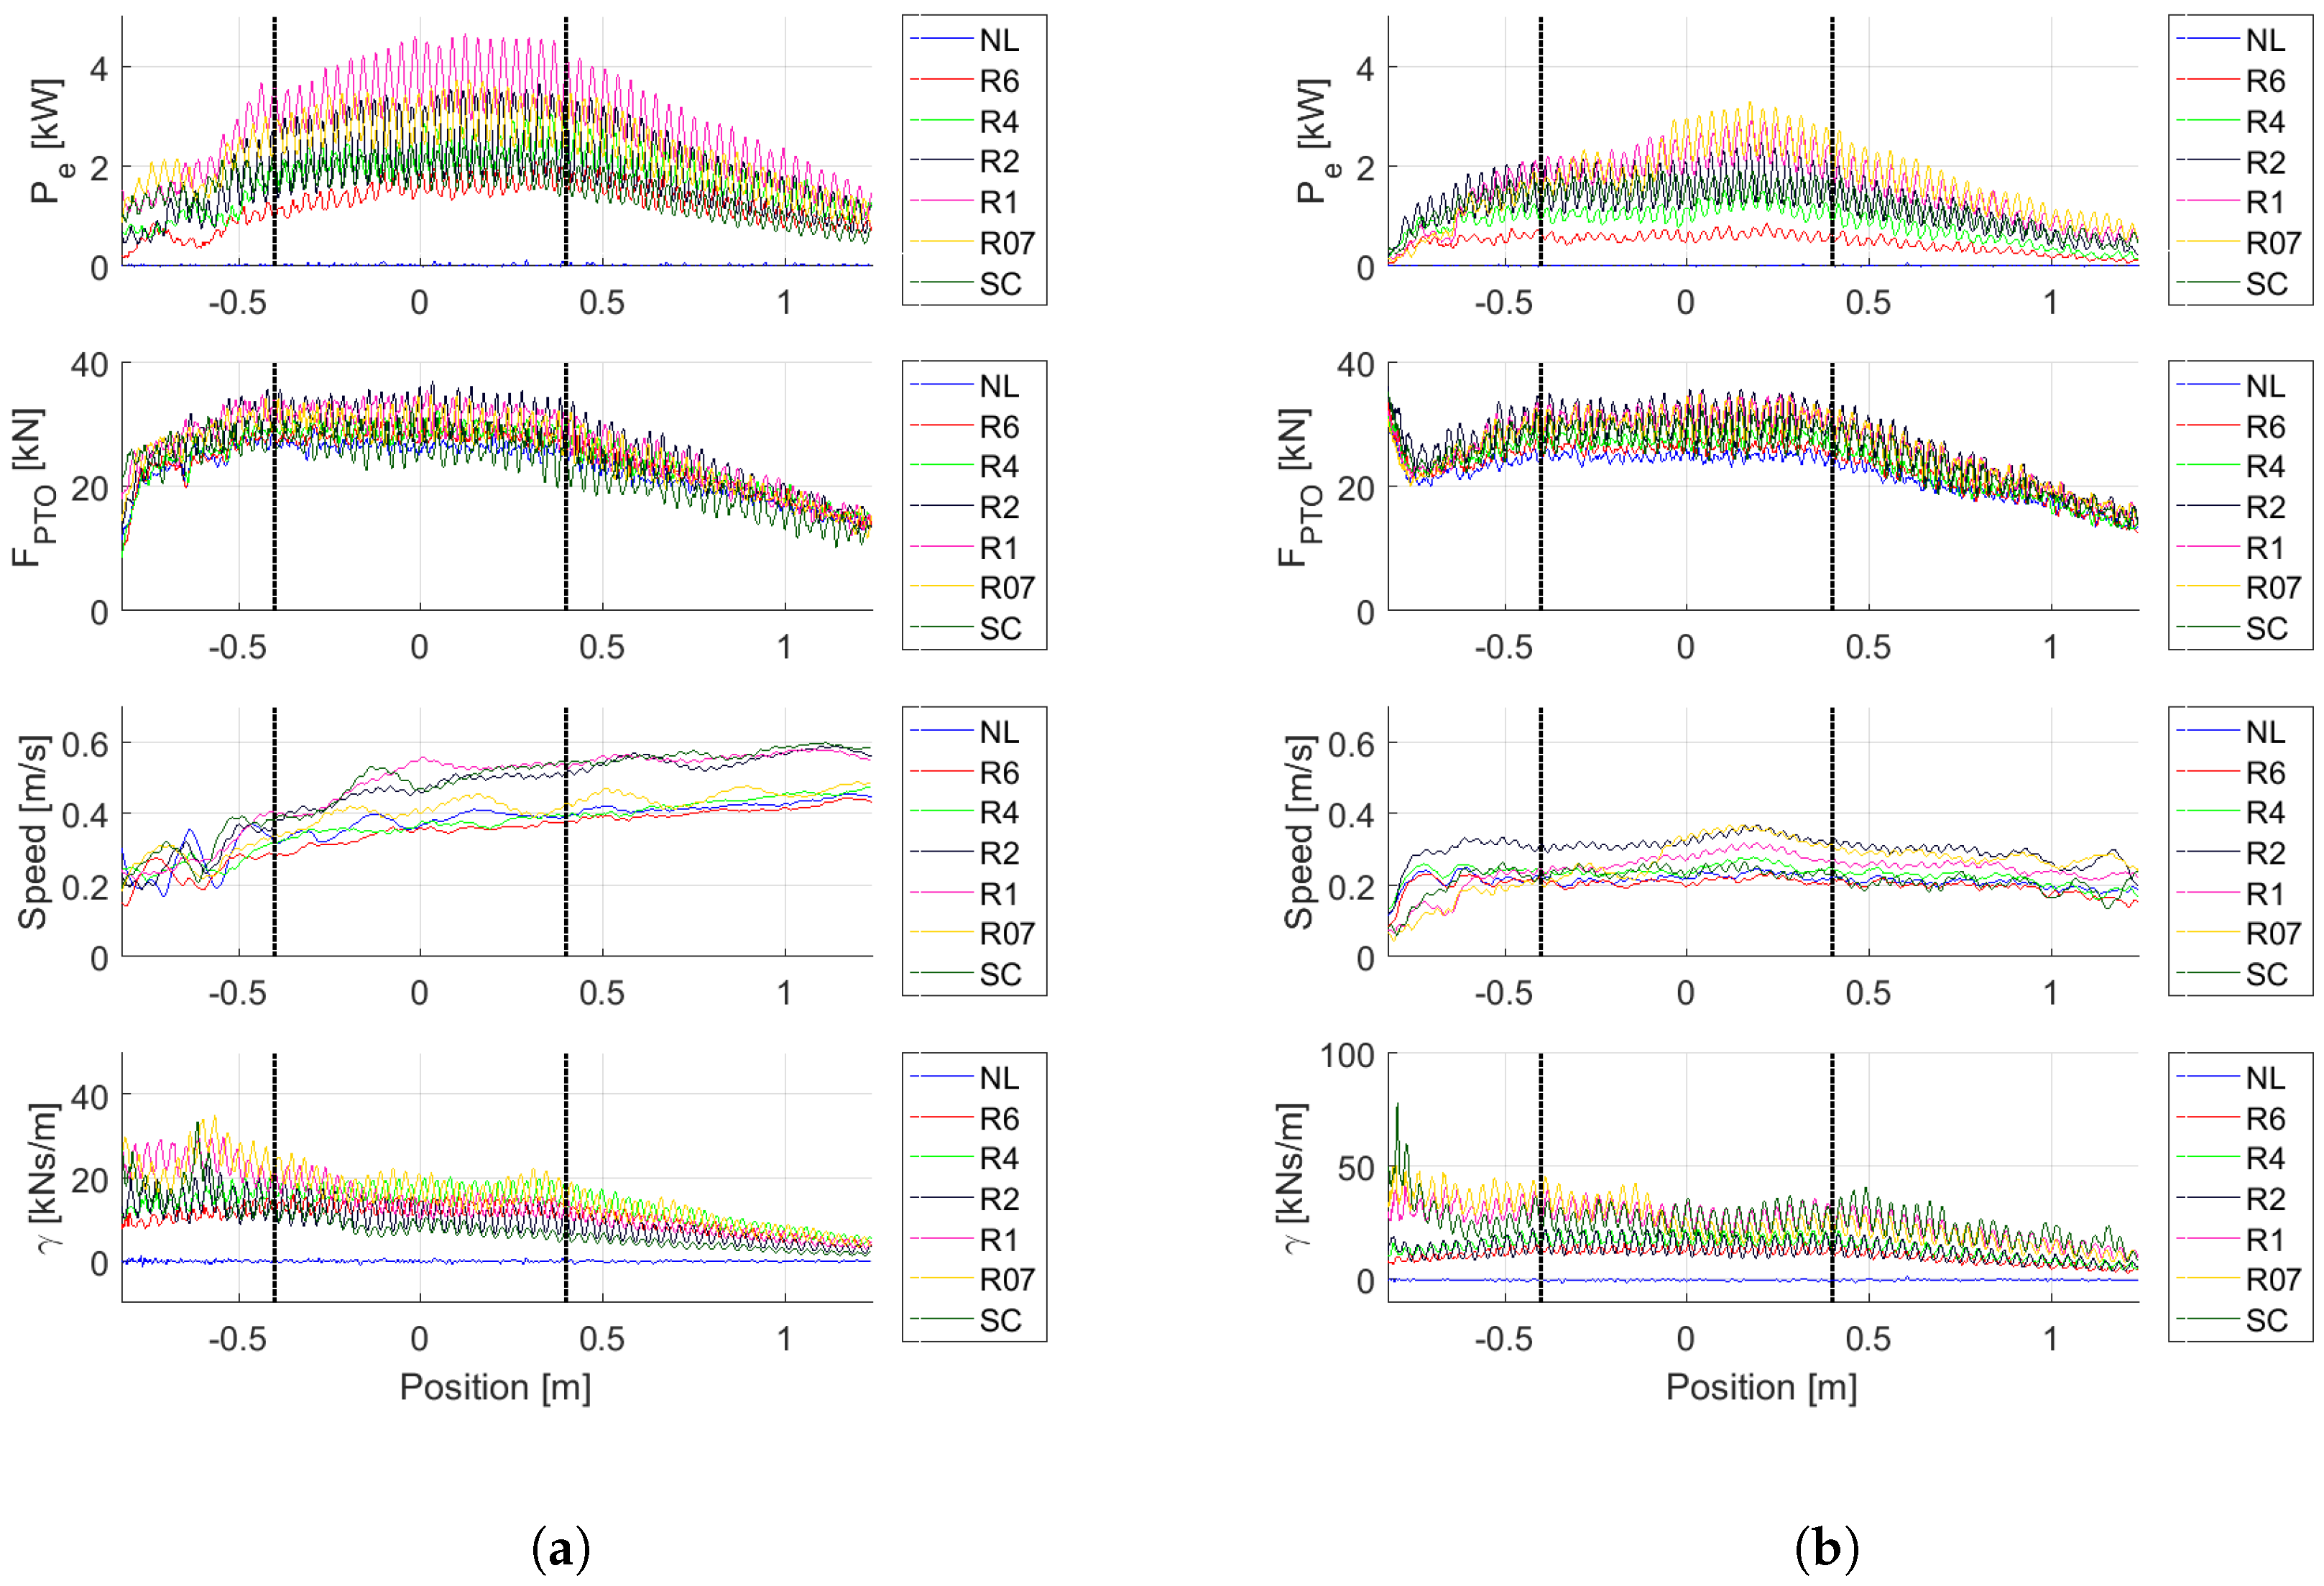
4.2. Data Collected during Onshore Experiments

The top speed during the onshore tests within full stator overlap was 0.61 m/s. The top speed for each load and direction can be seen in Table 3. For all loads except short-circuited, the top speed for when the translator goes down exceeds the top speed for when it moves up.
Electrical power, PTO force, speed and damping coefficient for 14 out of 168 measured cases can be seen in Figure 7a,b. Figure 7a shows seven cases for one crane setting when the translator moves up and Figure 7b shows seven cases for another crane setting when the translator moves down. All cases are not displayed due to clarity and space. For some of the cases that are not displayed, the translator speed varies a lot, making figures such as Figure 7a,b difficult to interpret. Figure 7a shows some of the cases with the highest speeds for when the translator moves up, while Figure 7b shows more representative cases. The electrical power and PTO force oscillate heavily during the strokes. Some oscillations are visible for the speed as well.
The electrical power clearly decreases with decreasing A f r a c since A f r a c is linearly proportional to the position outside the dotted black lines. This is seen most clearly in the upper half of the translator stroke, where there is no end-stop spring (see Figure 7a,b).

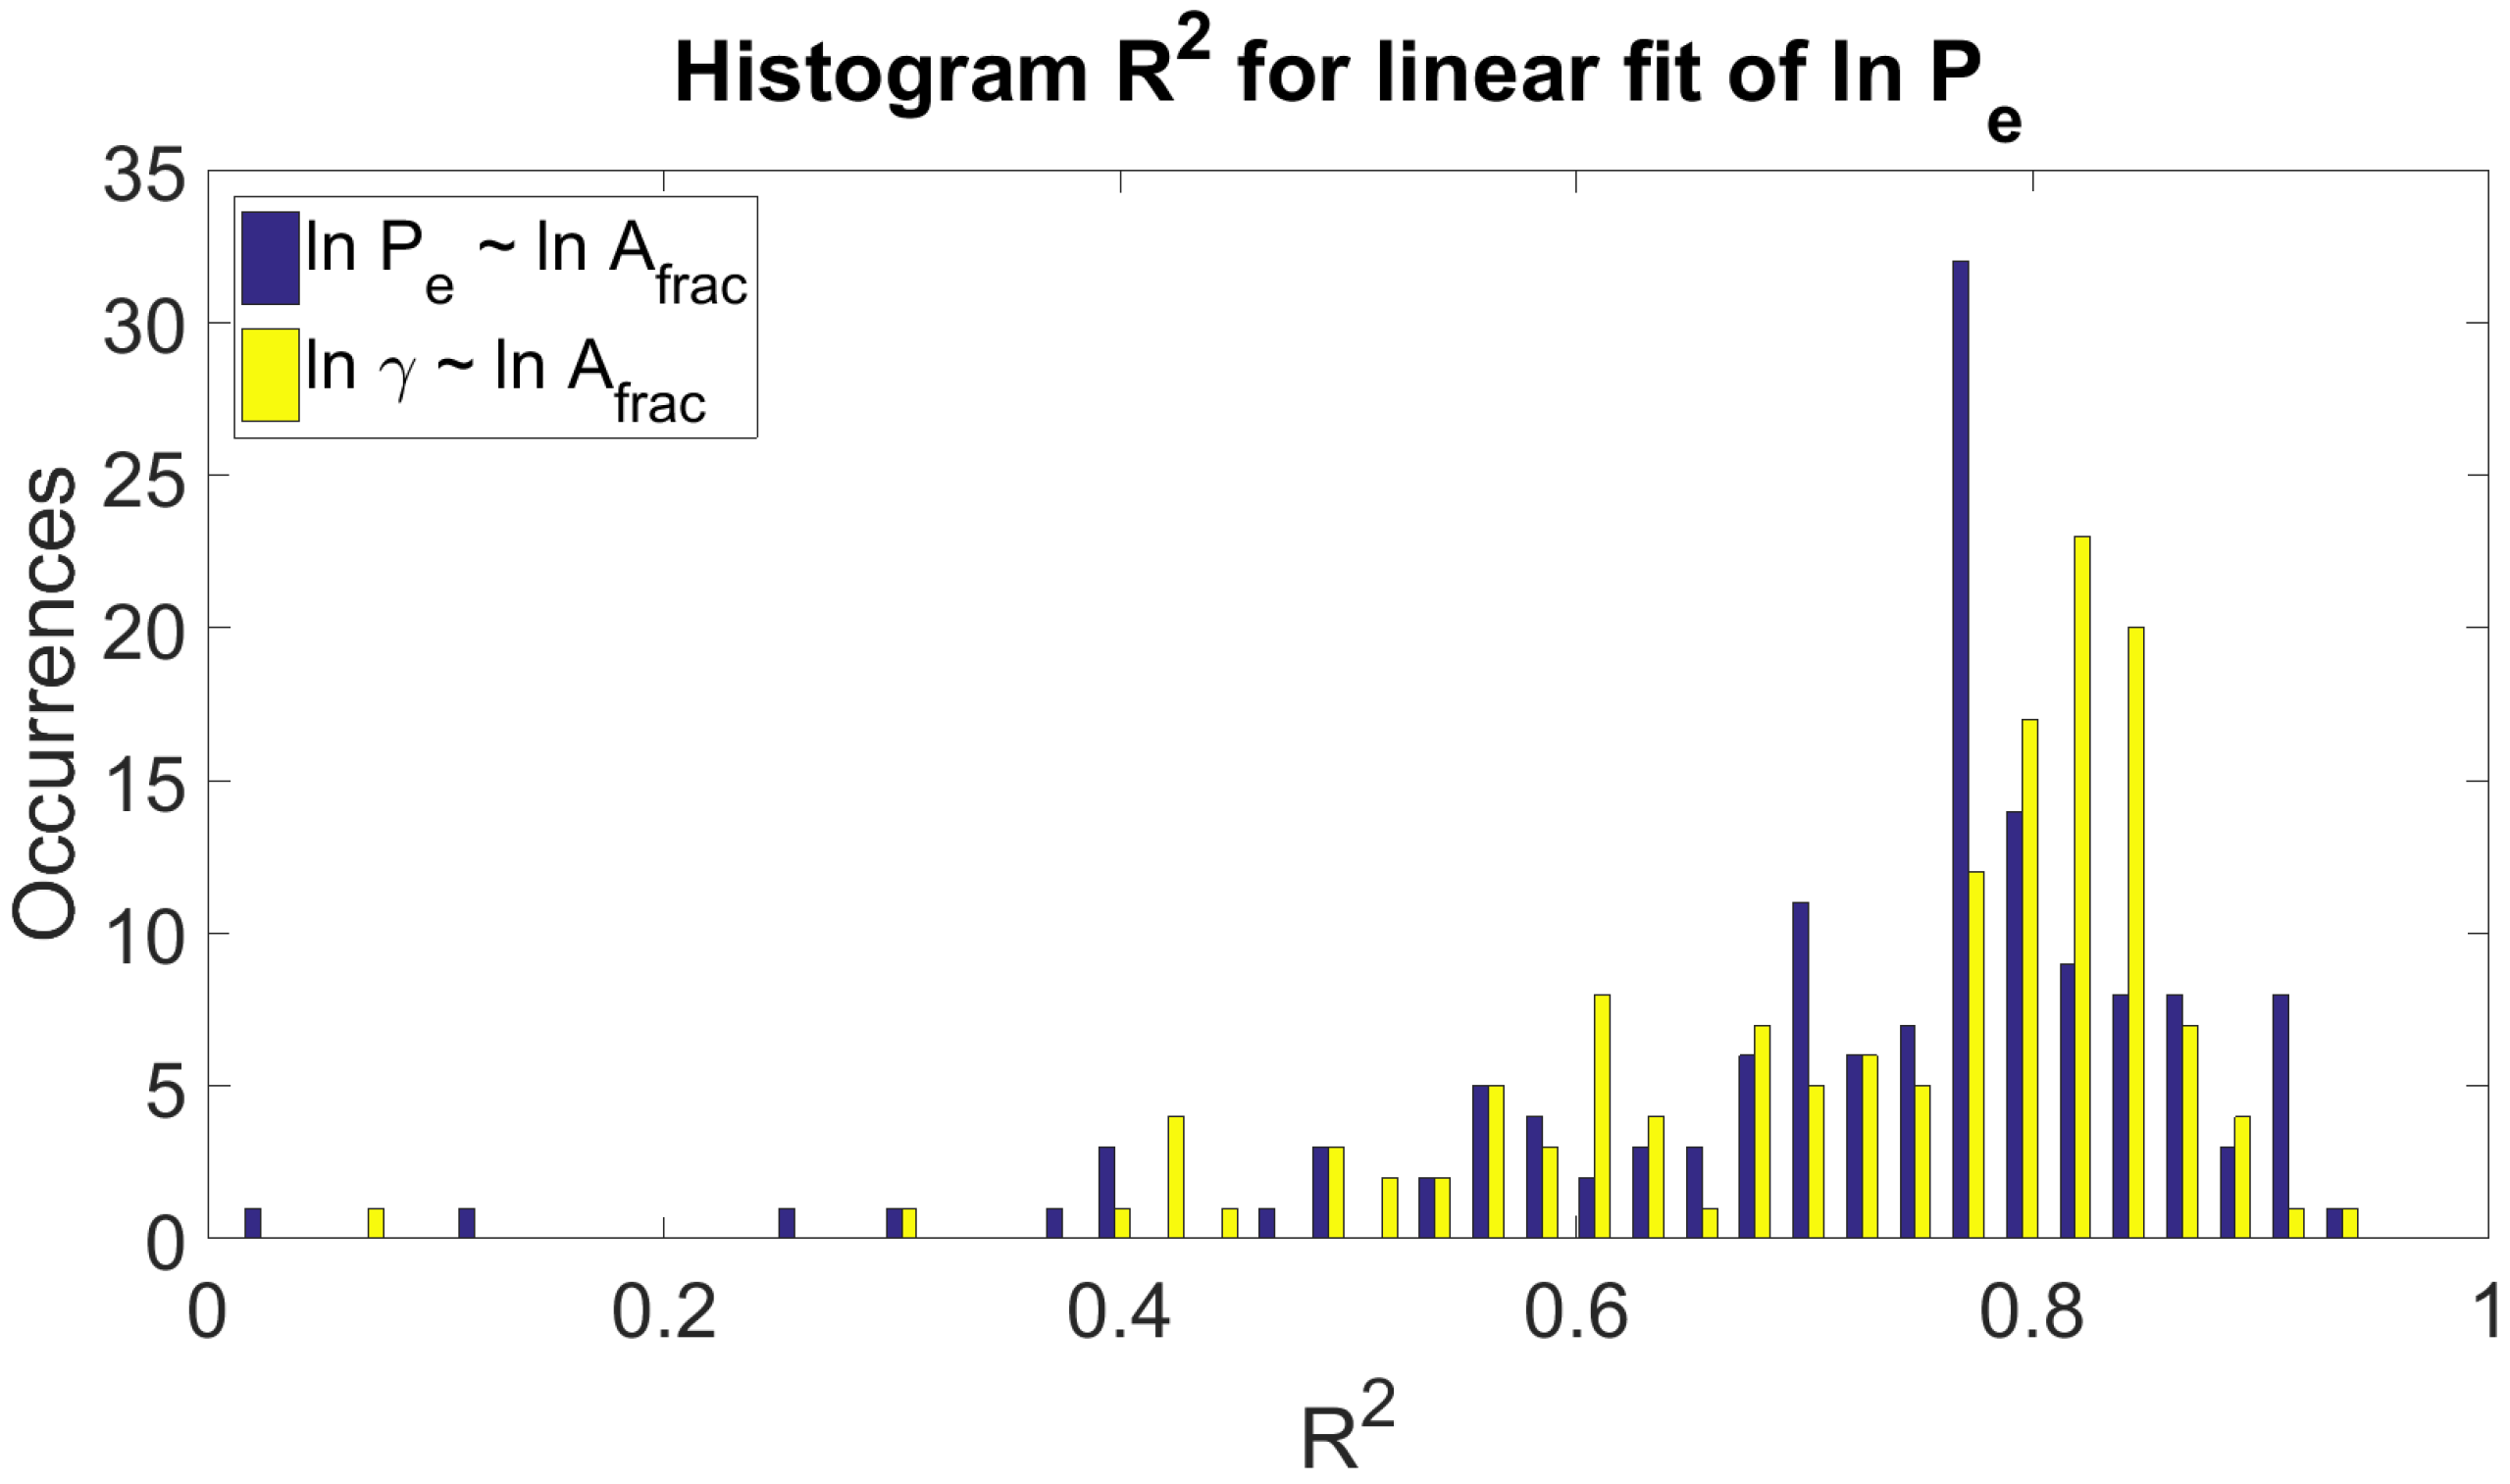
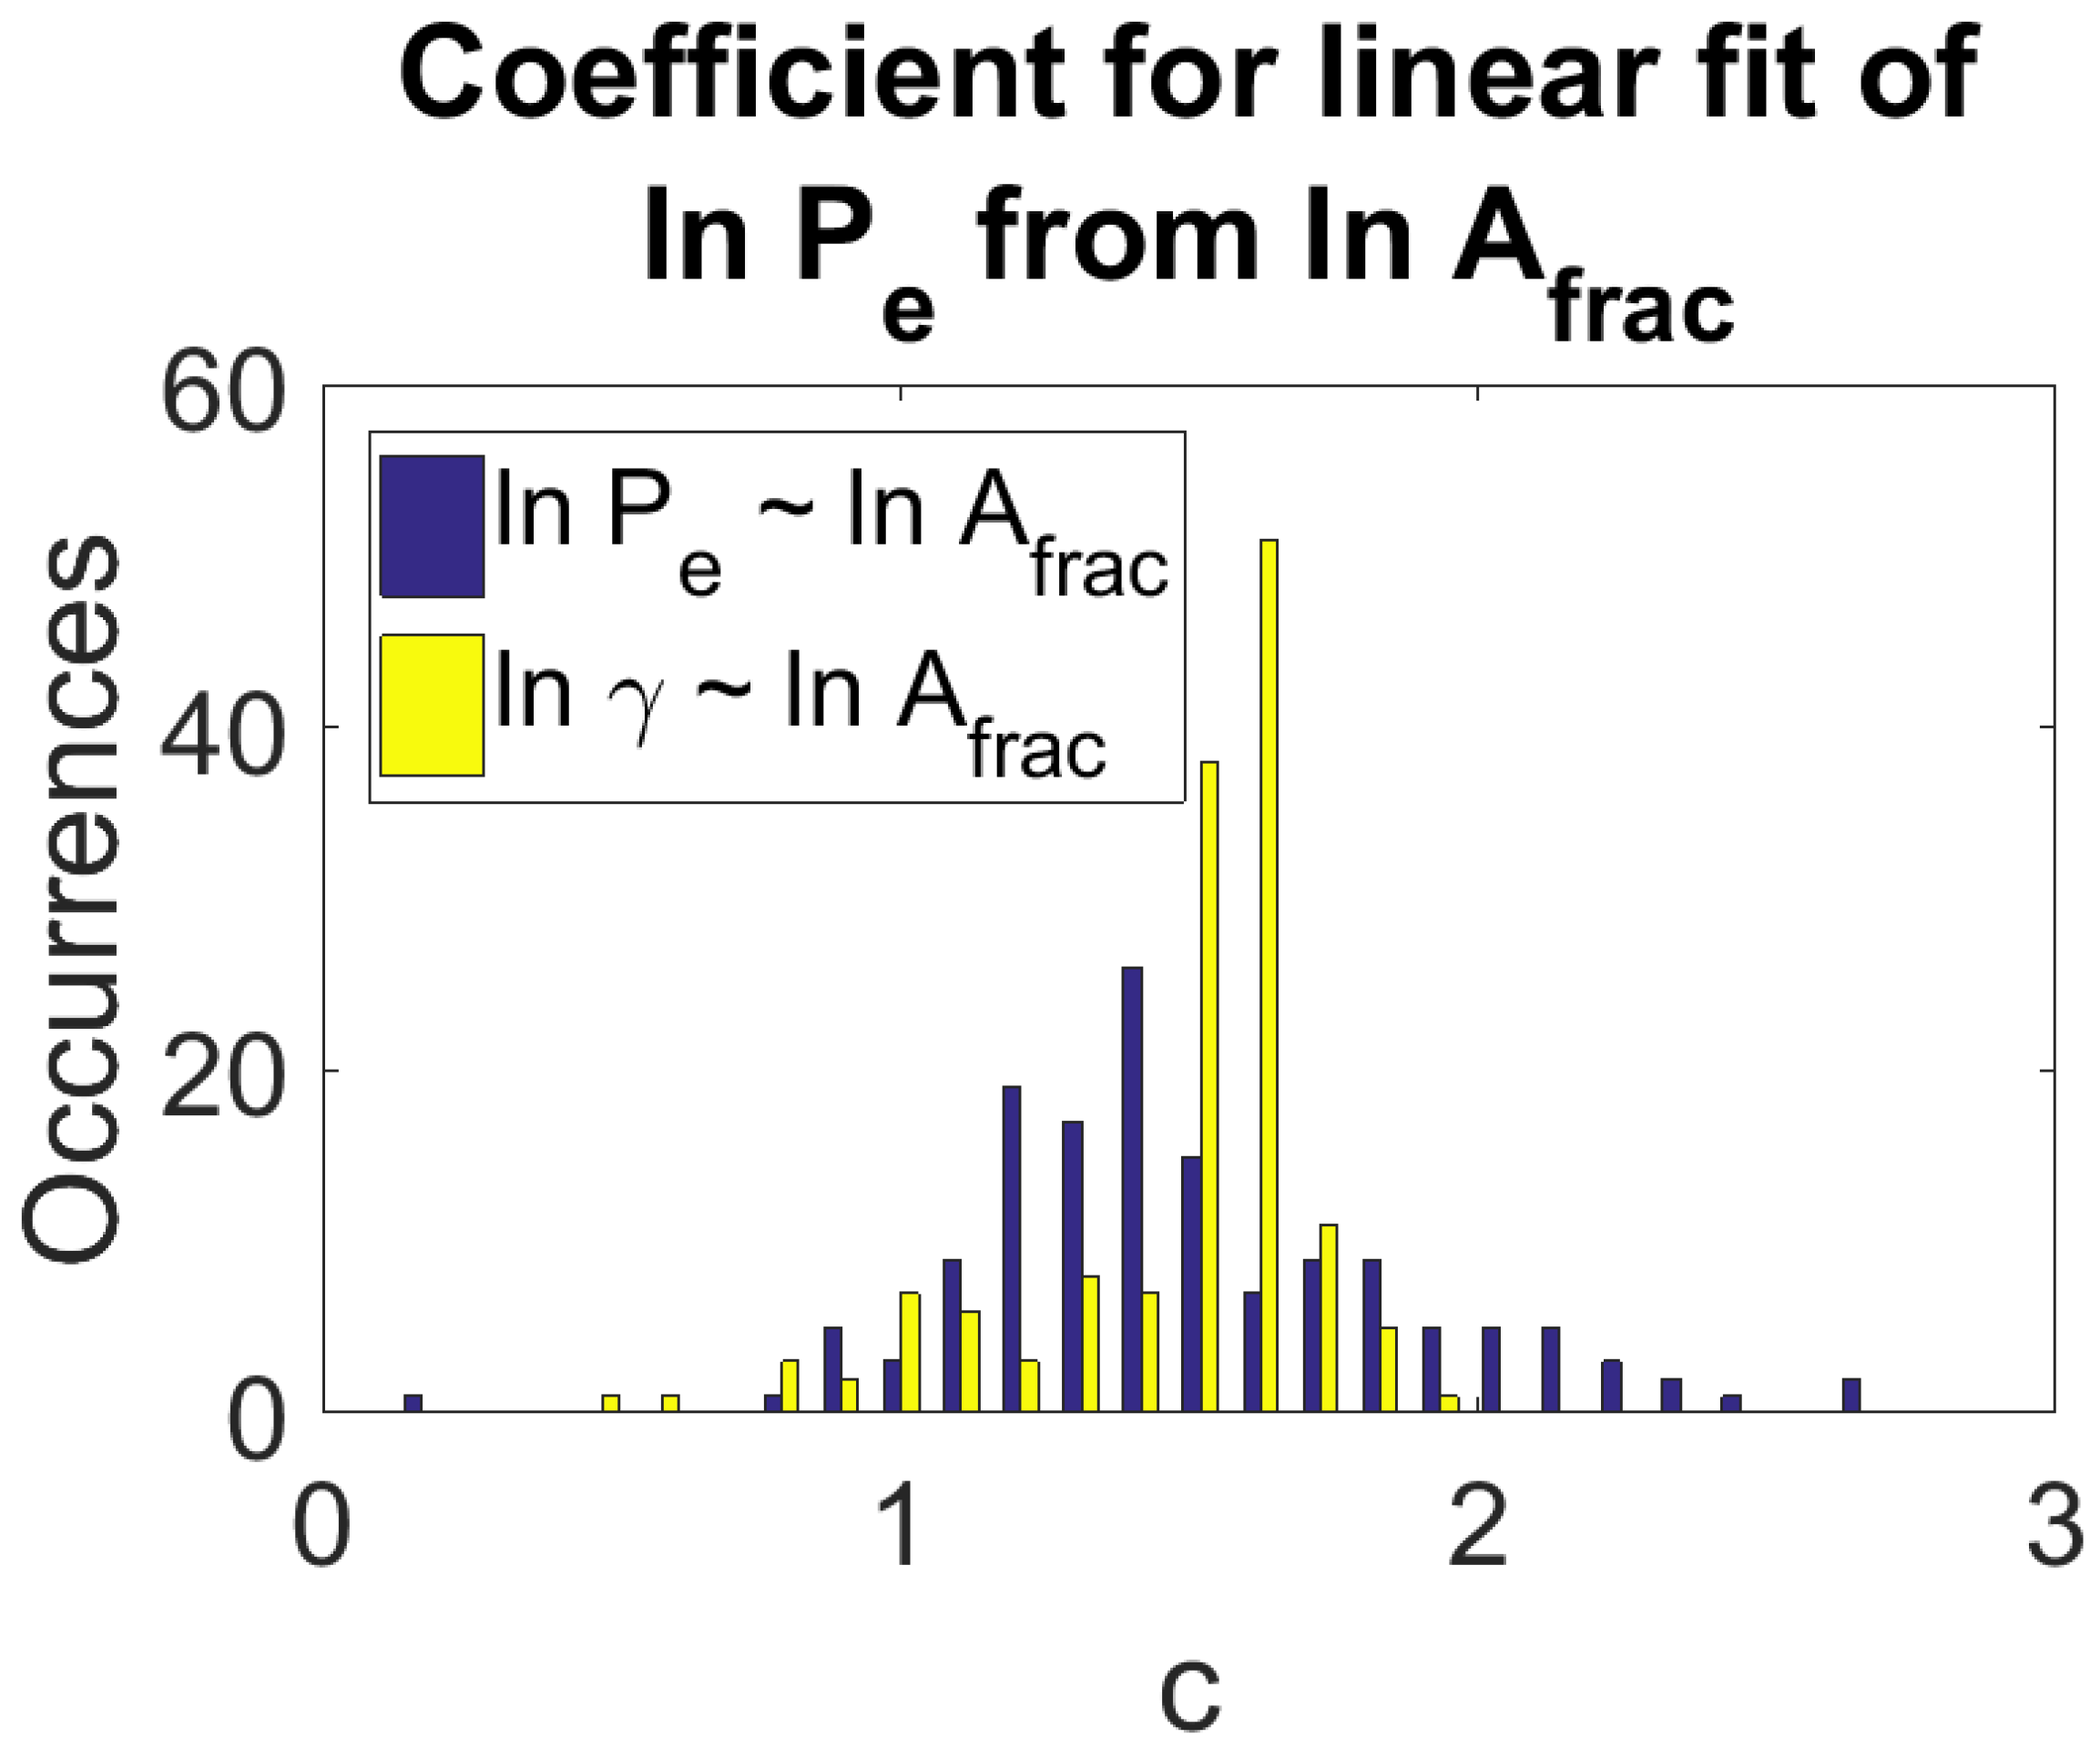
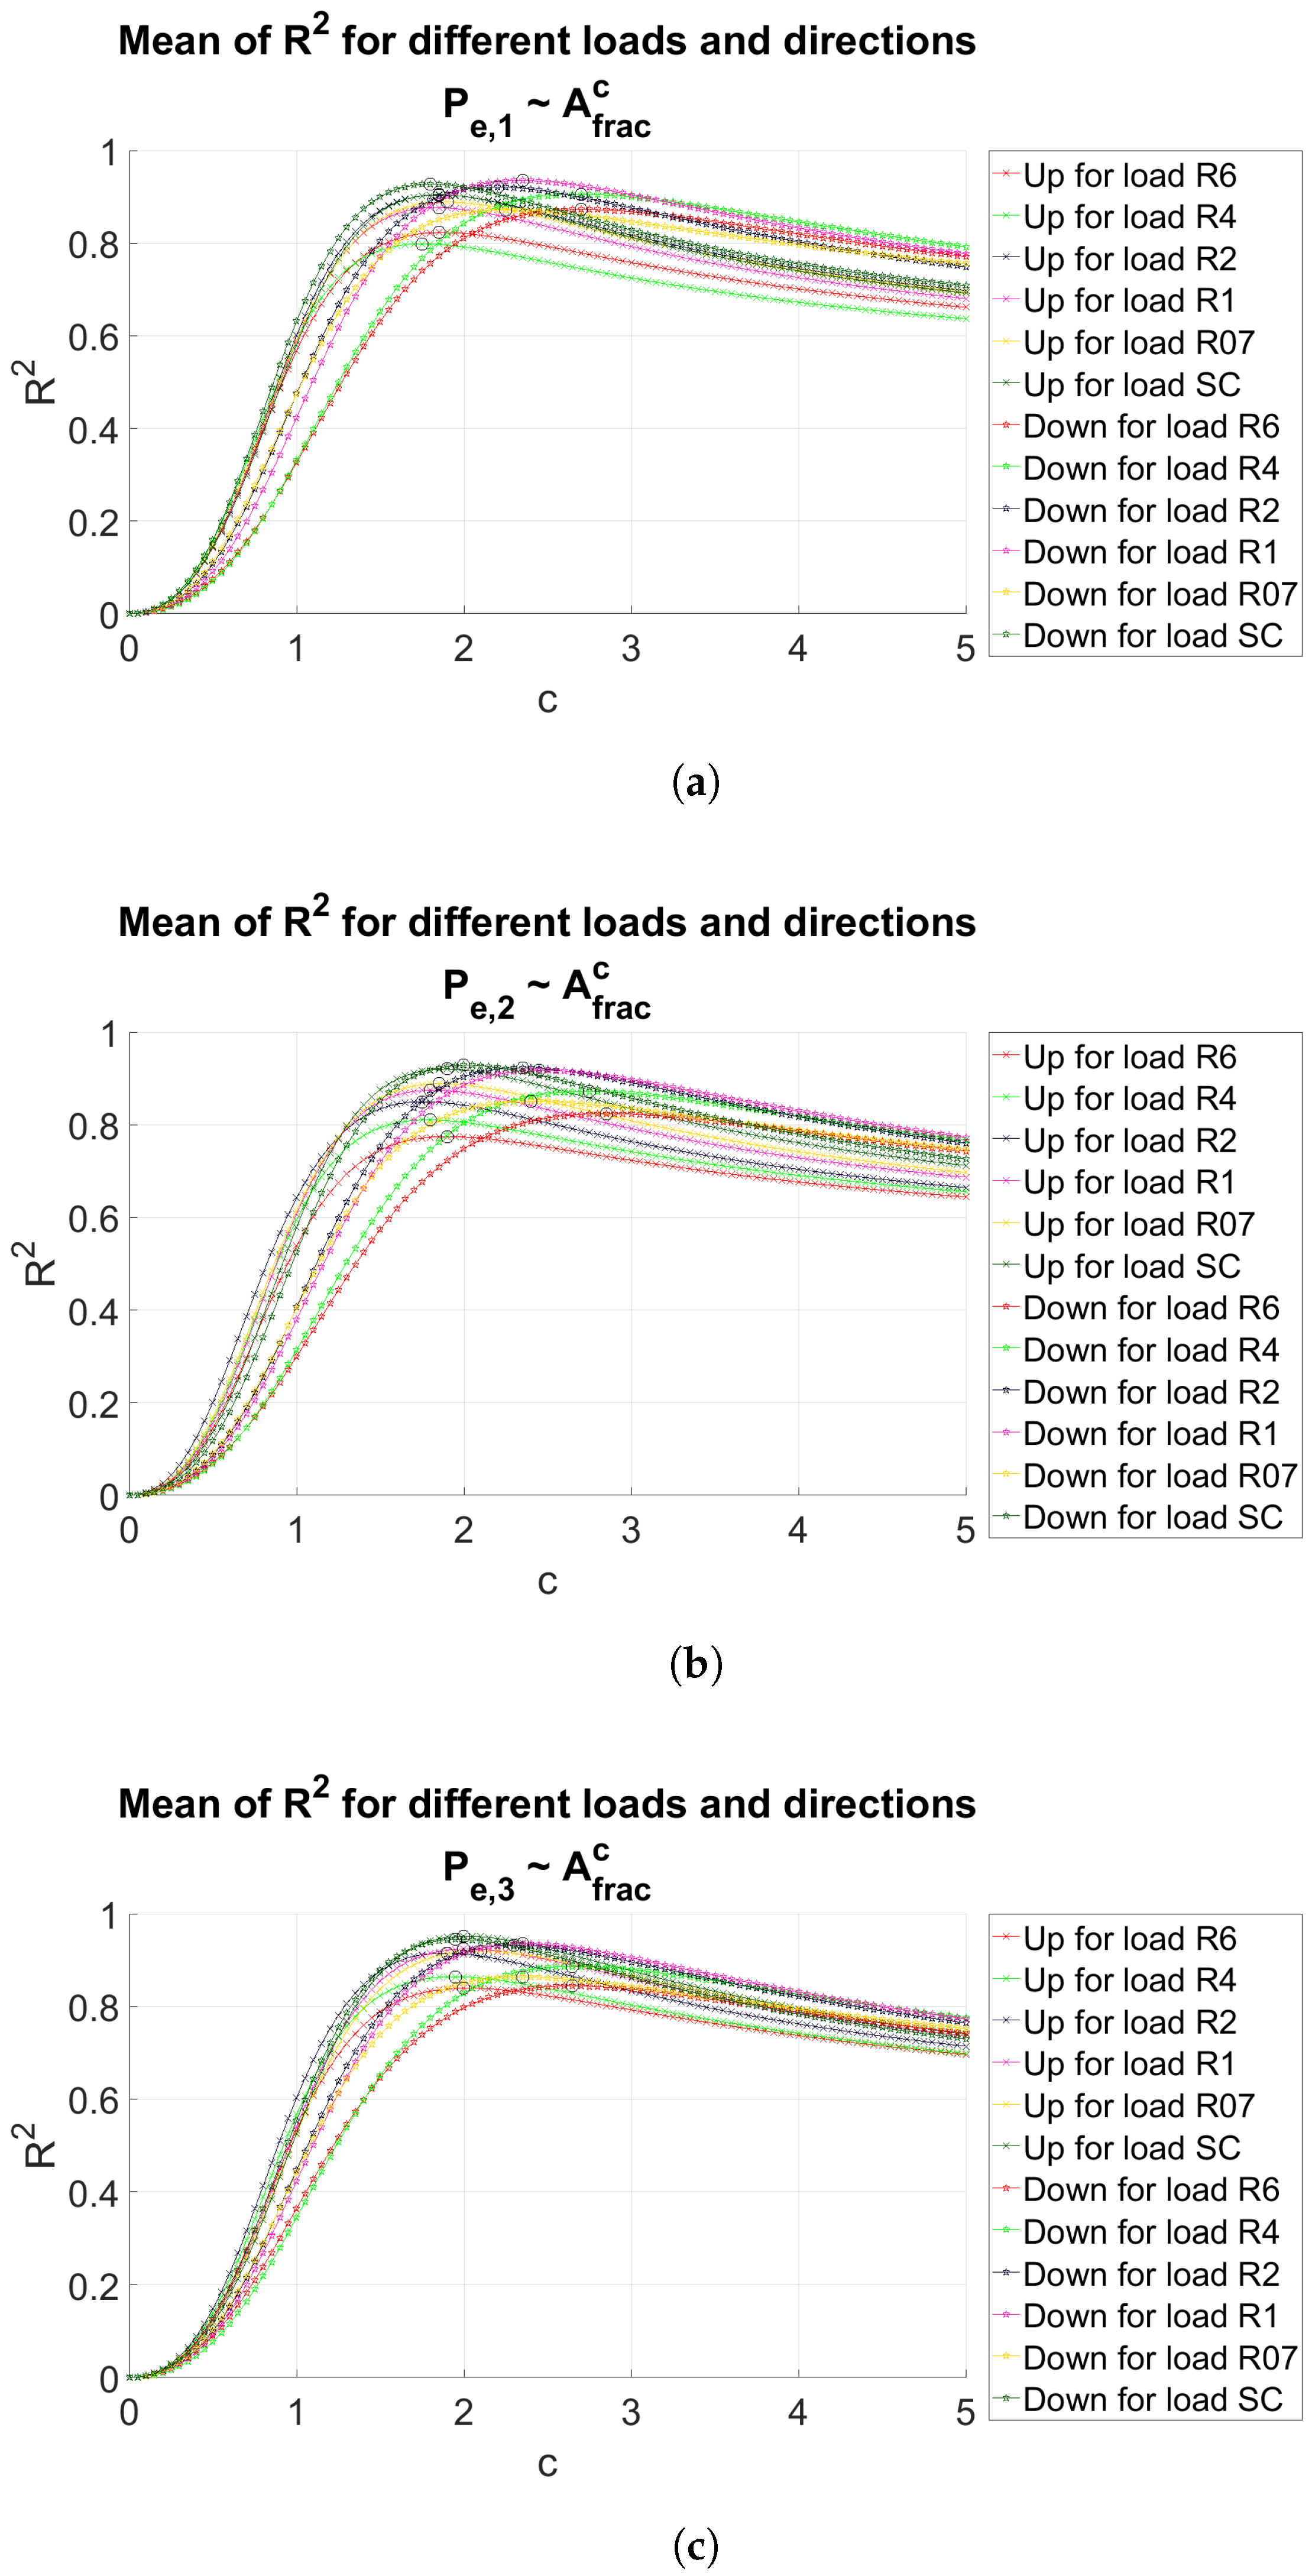
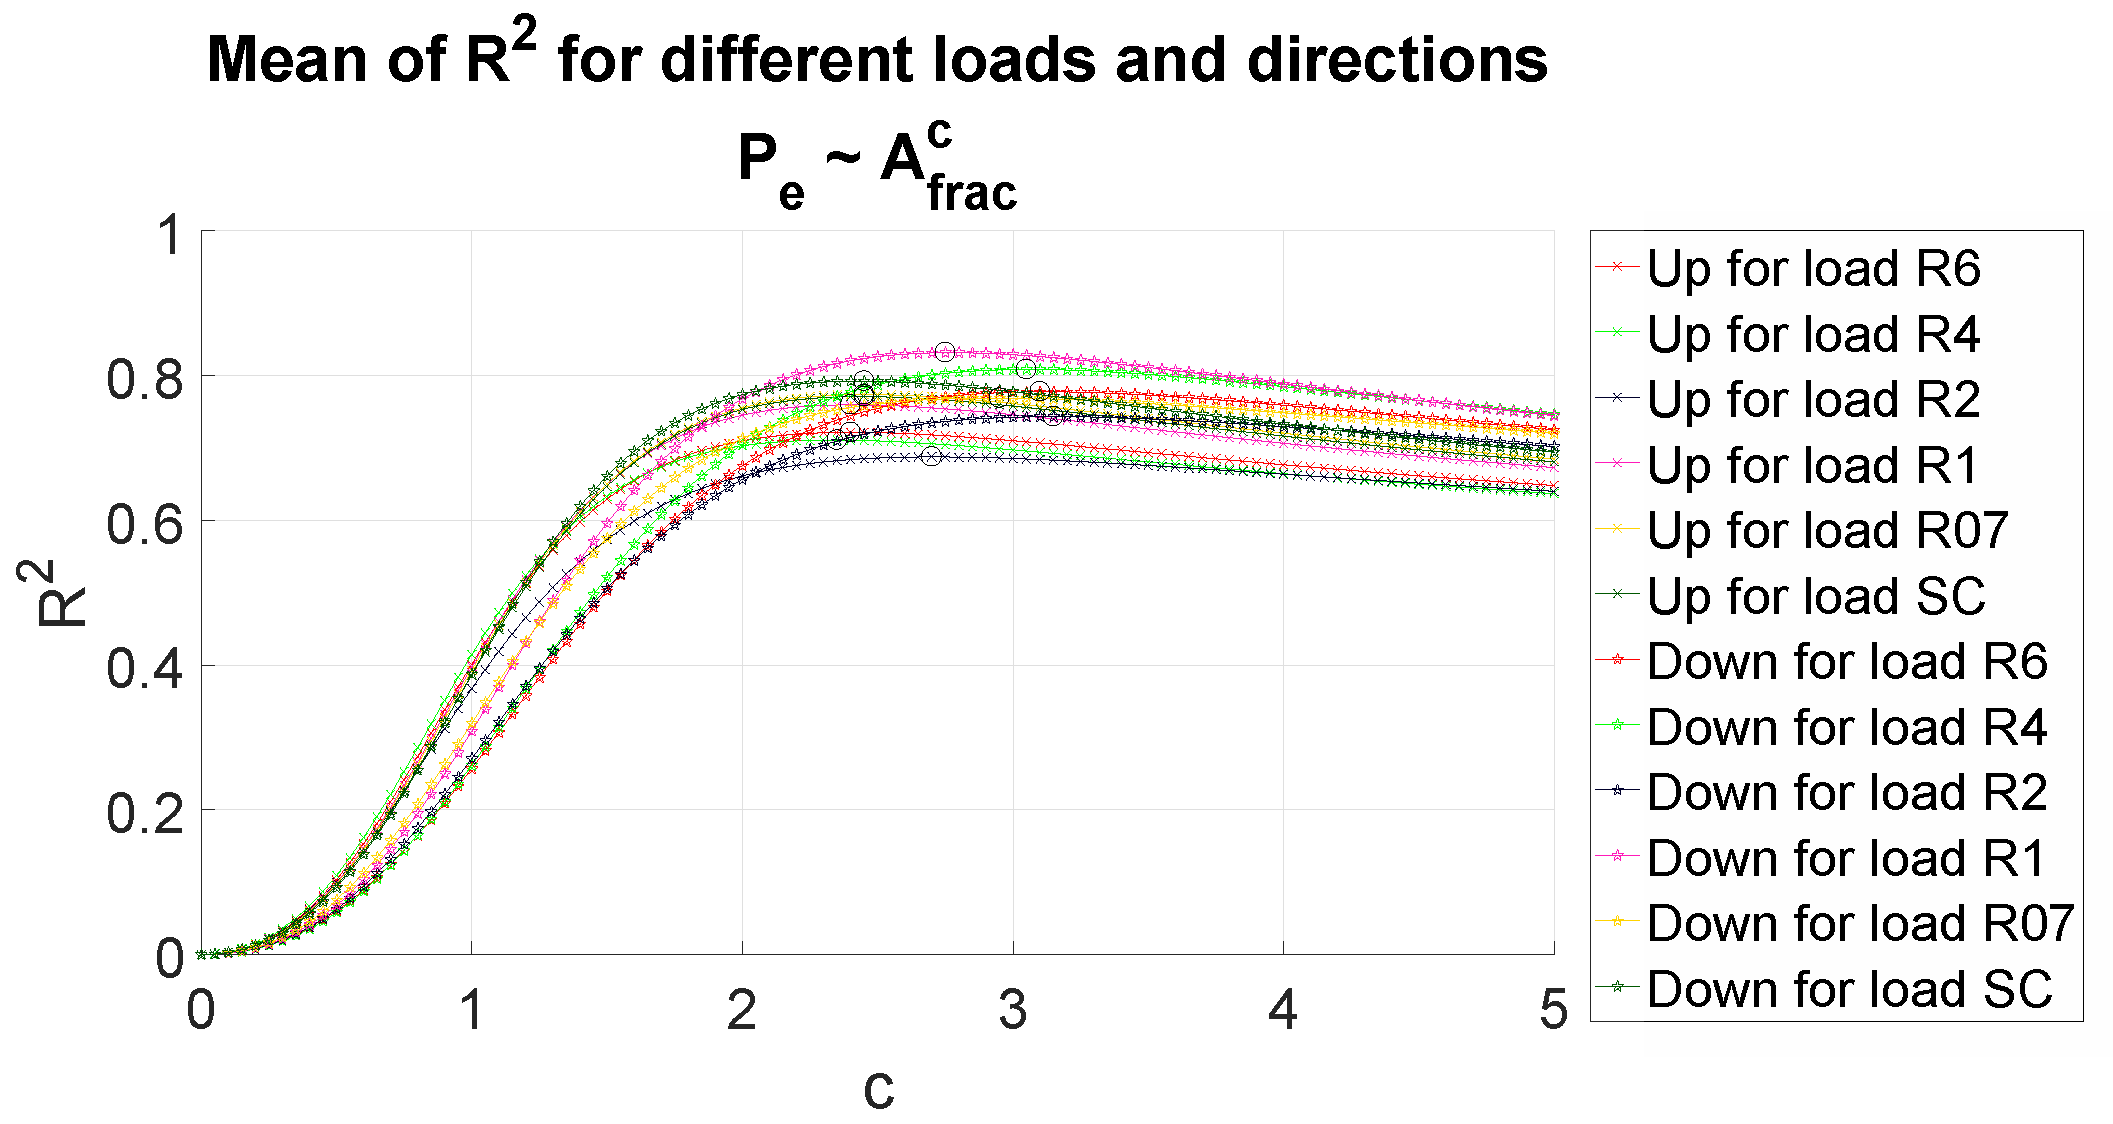
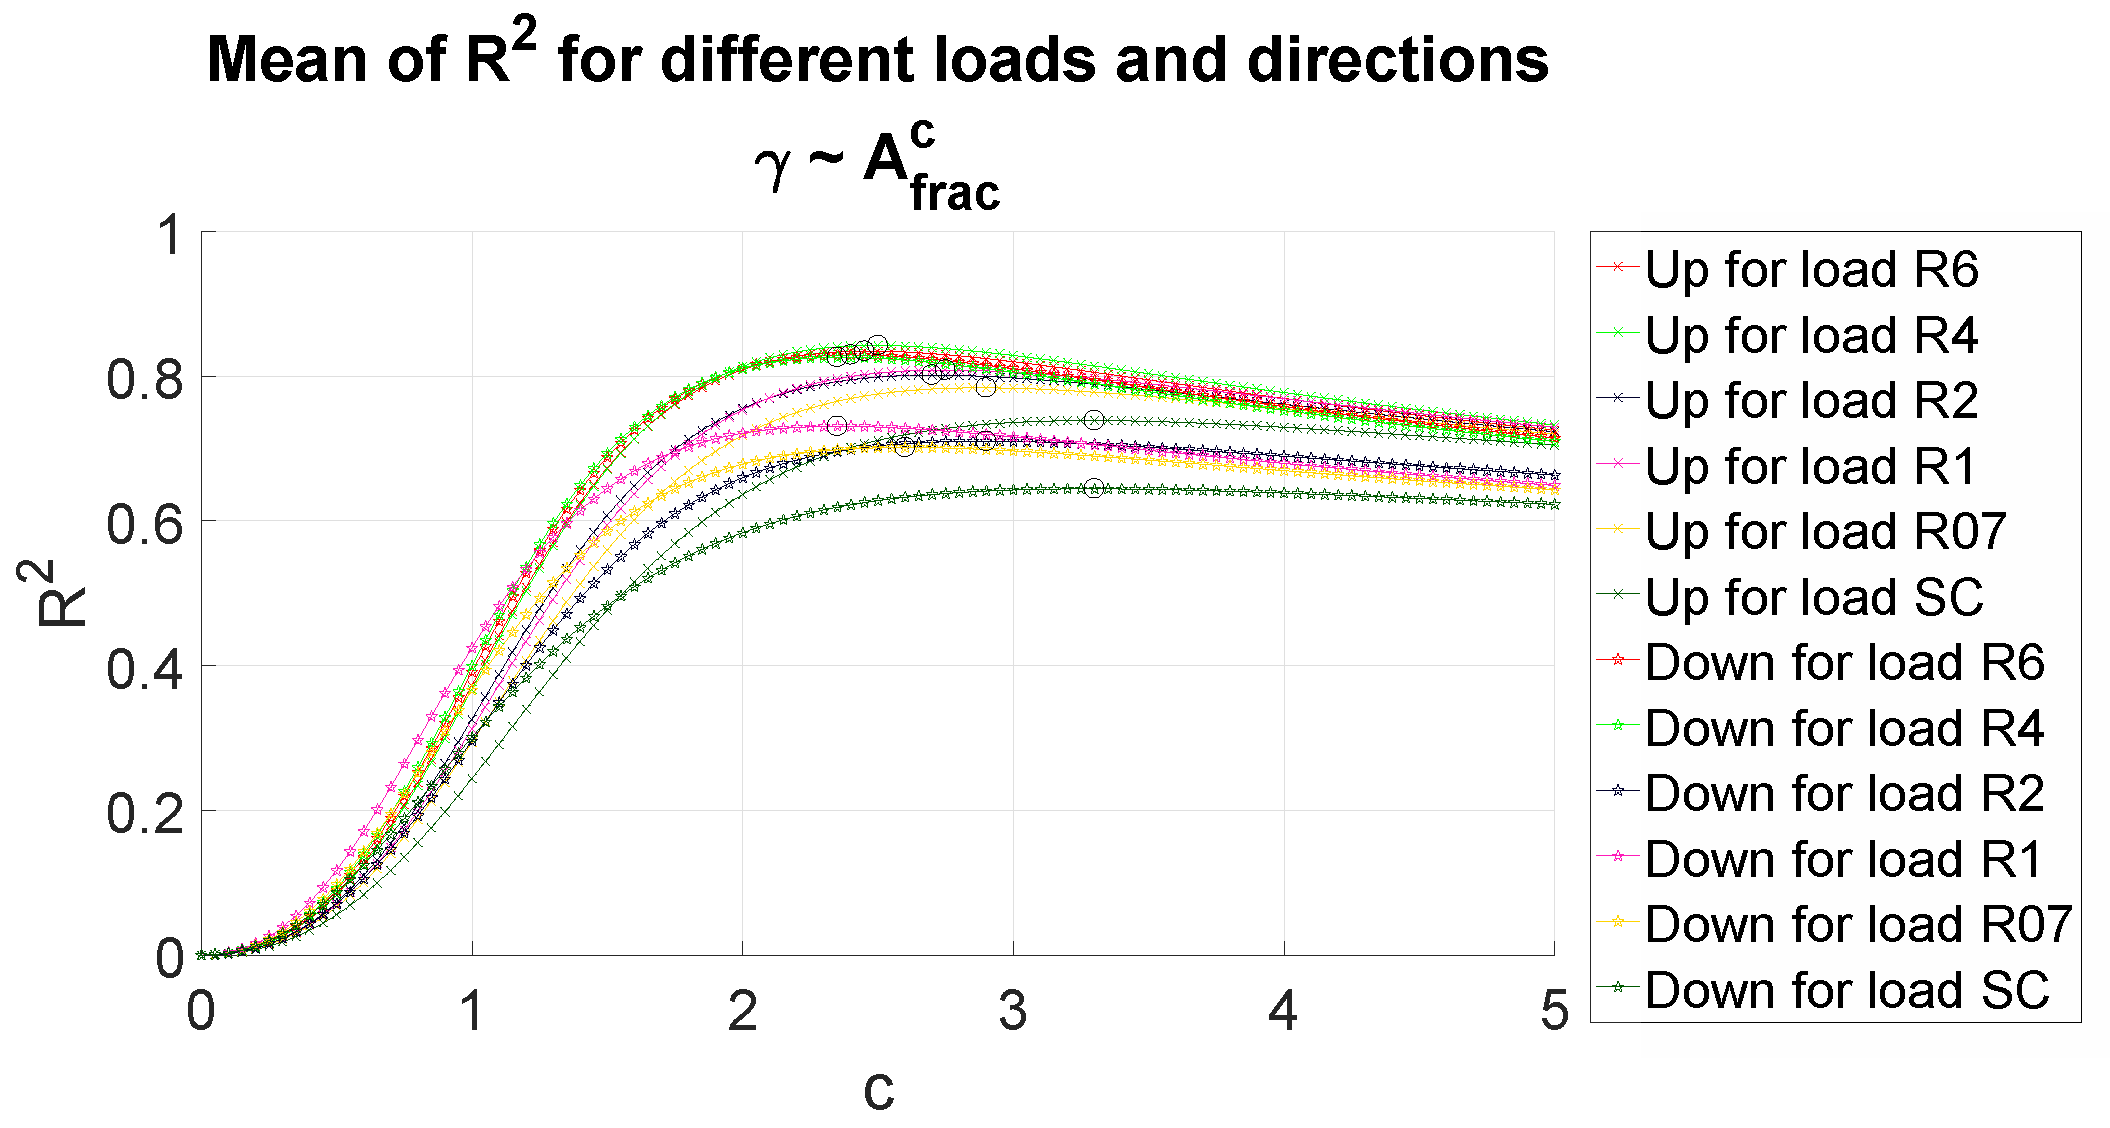
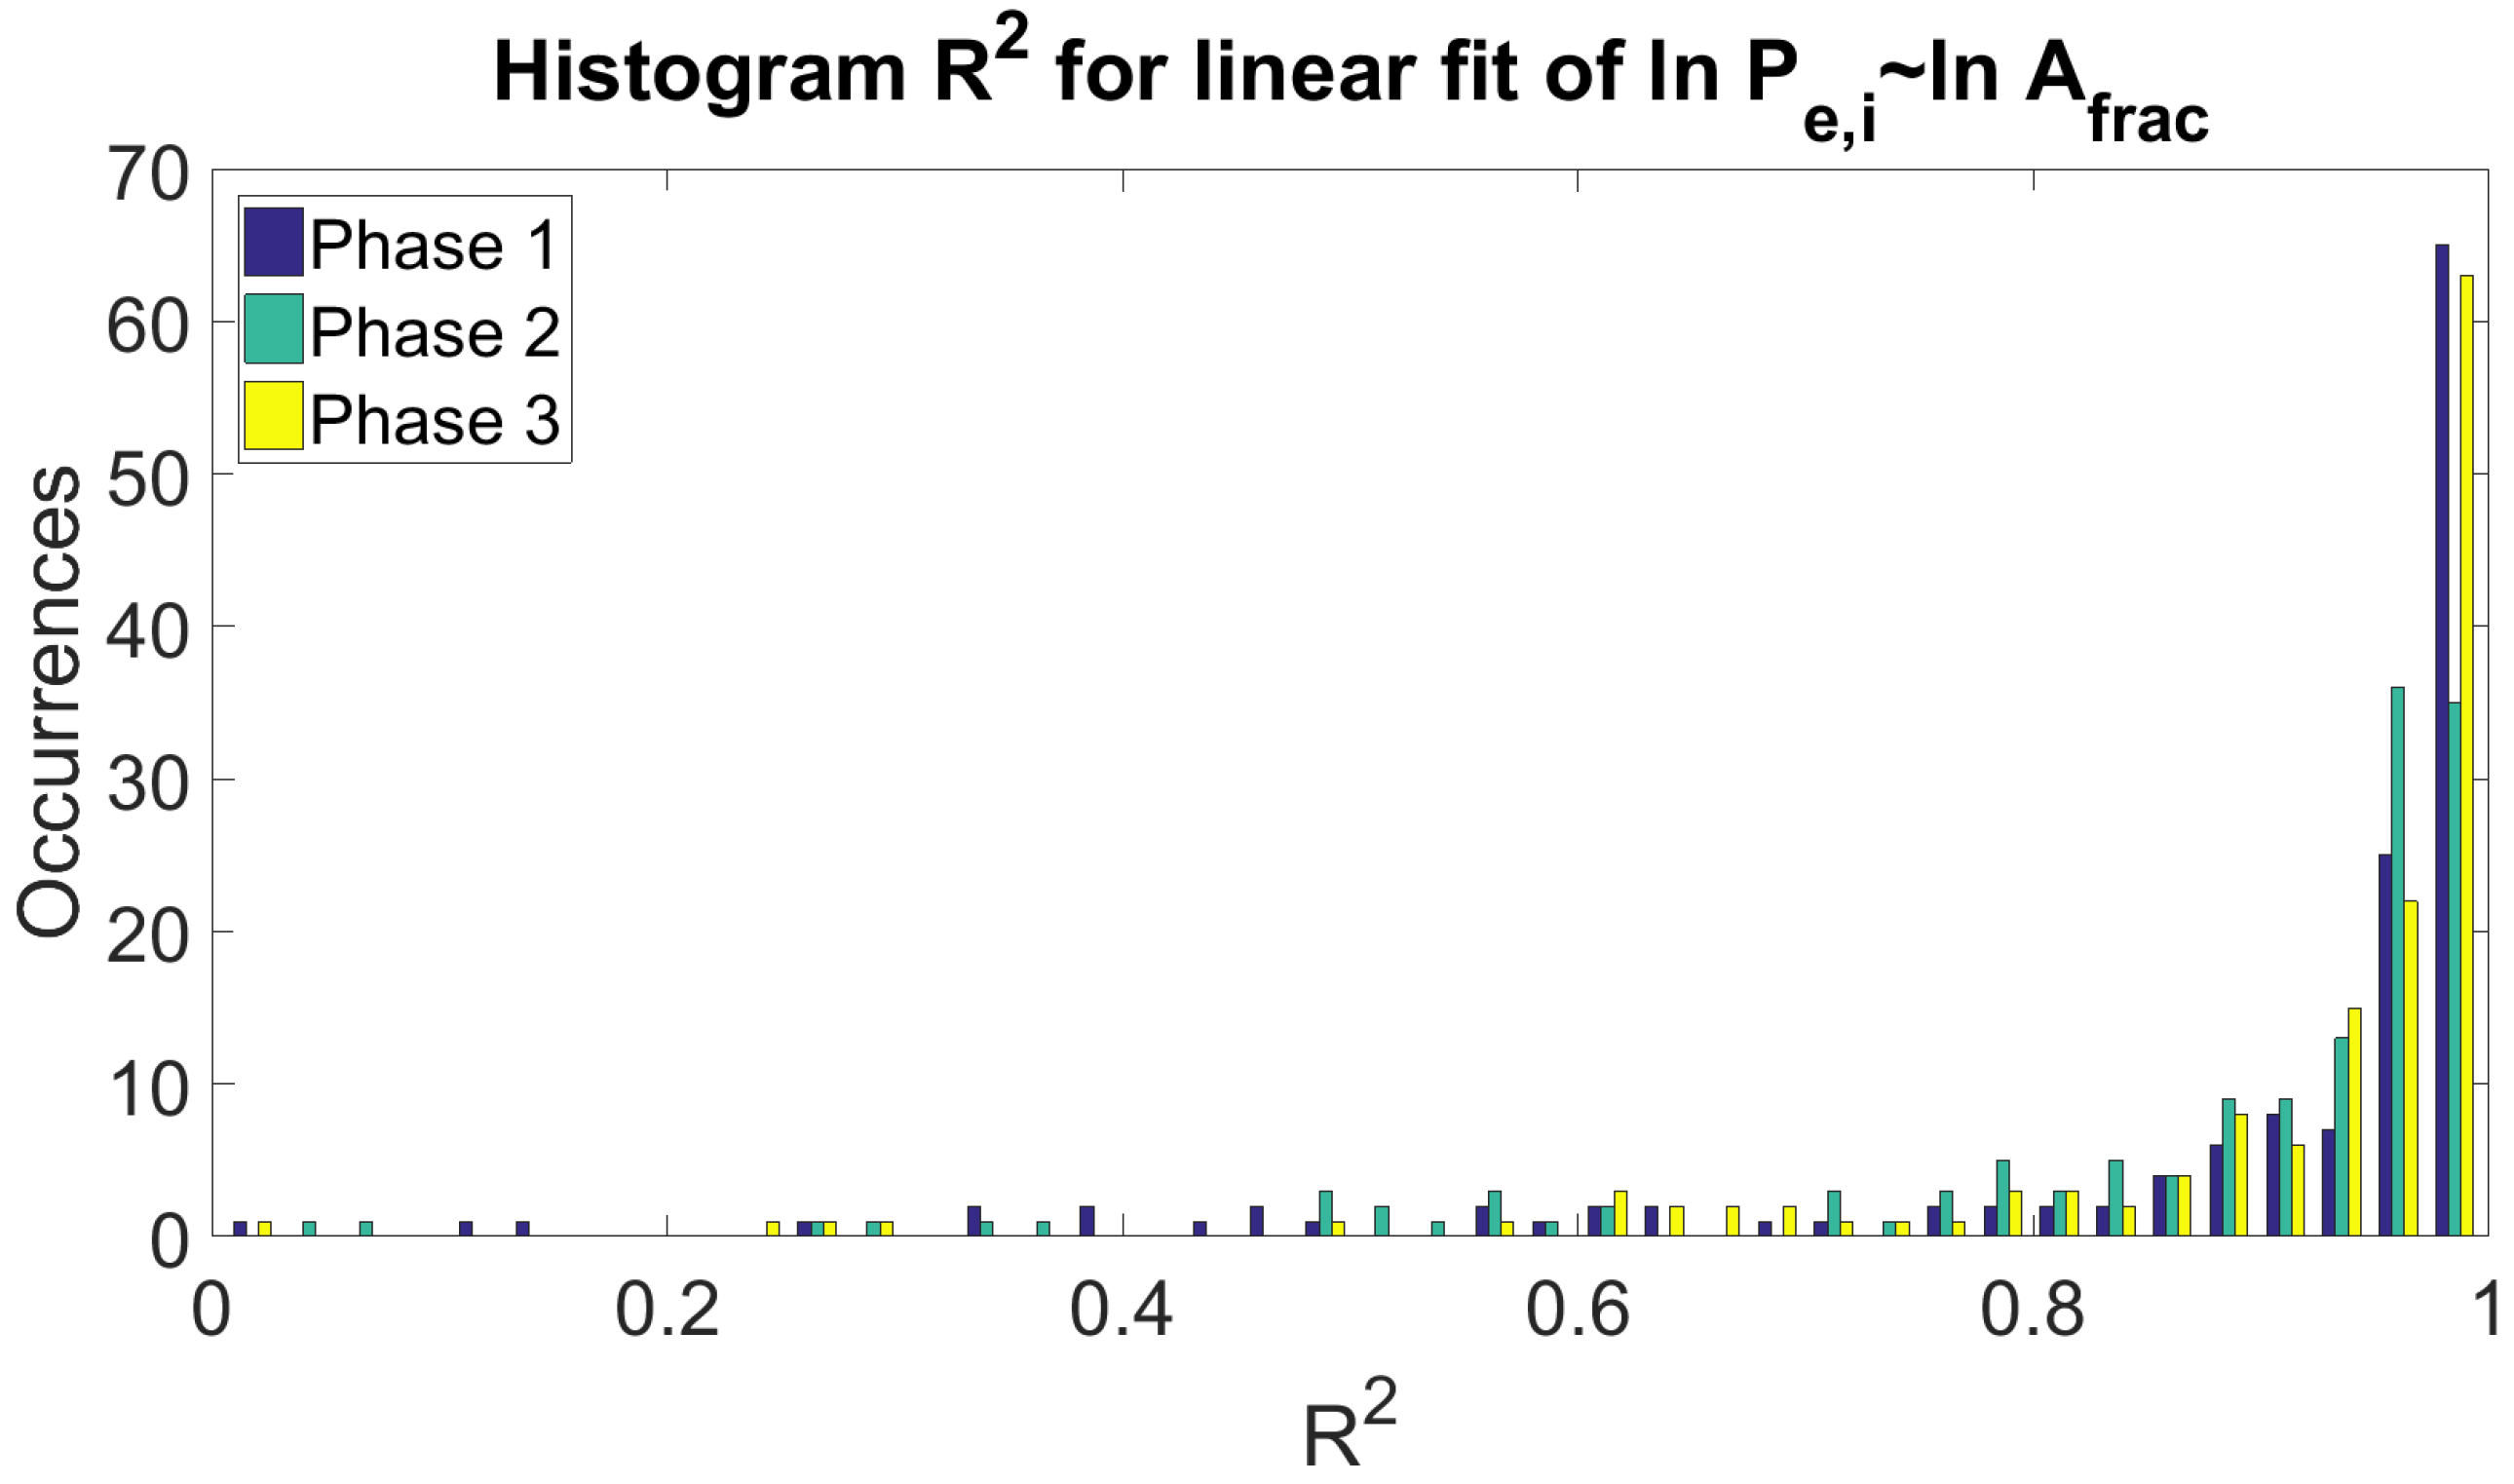
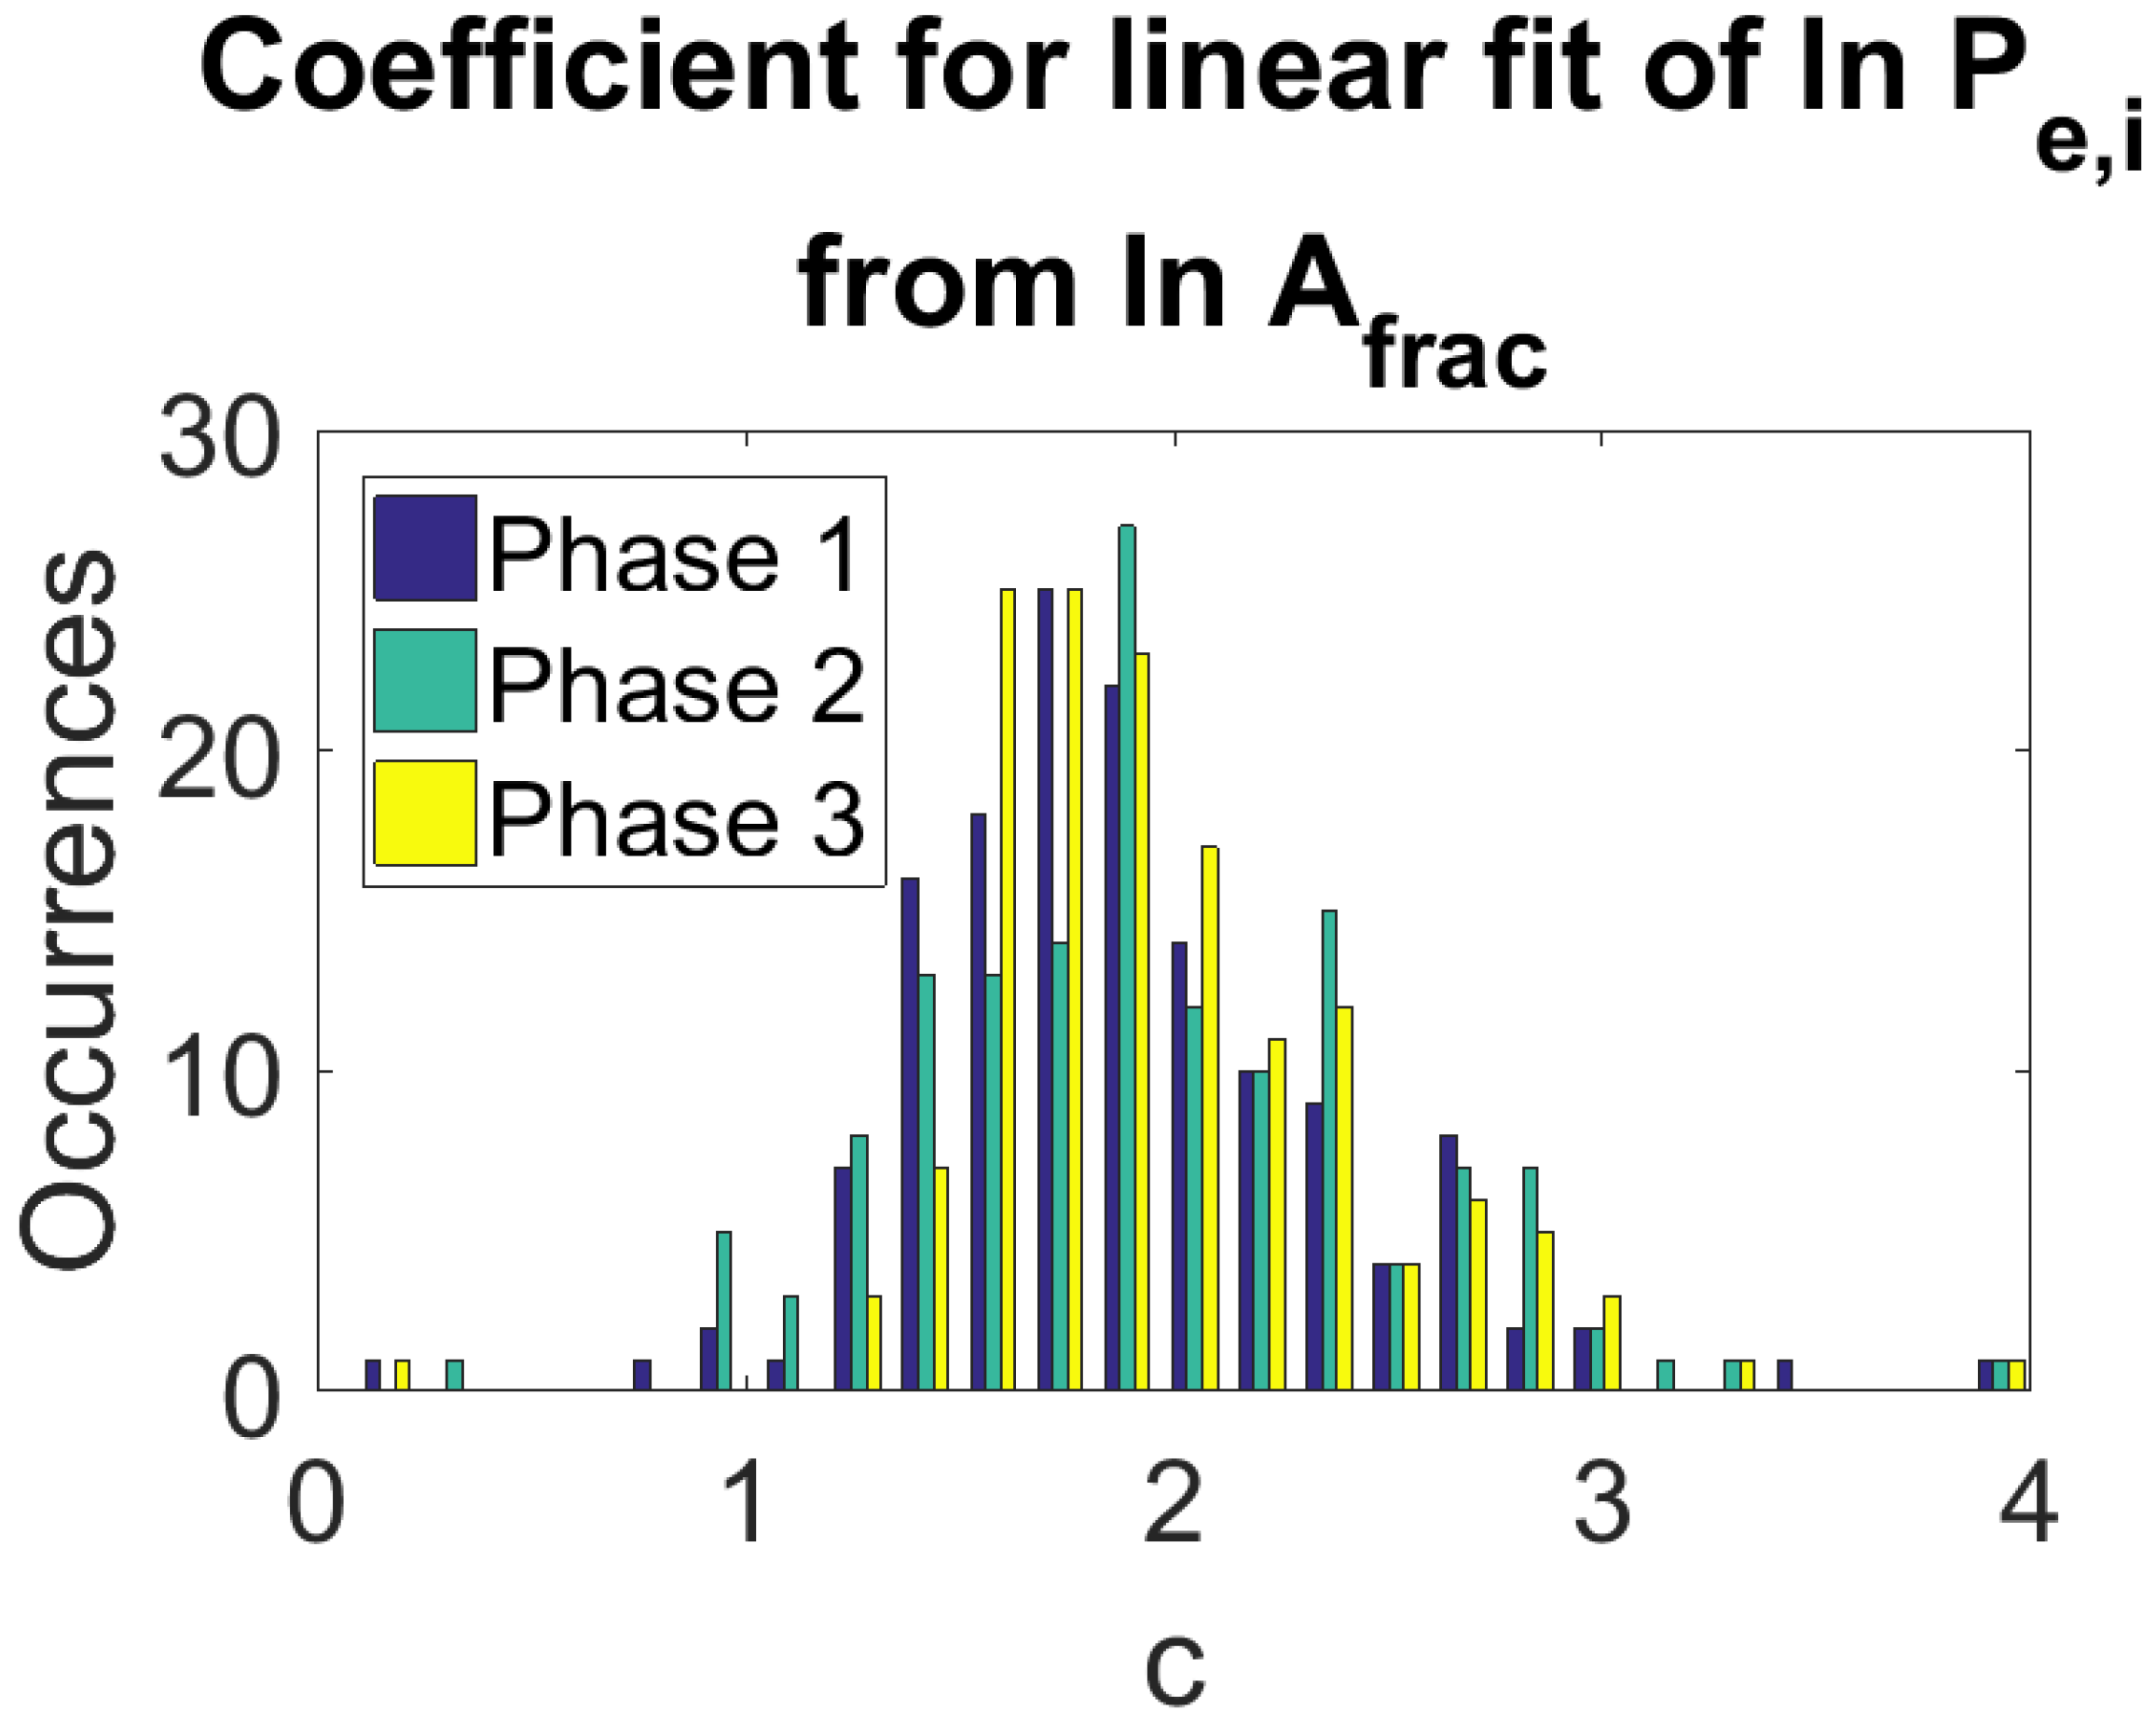
4.3. Linear Regression Analysis
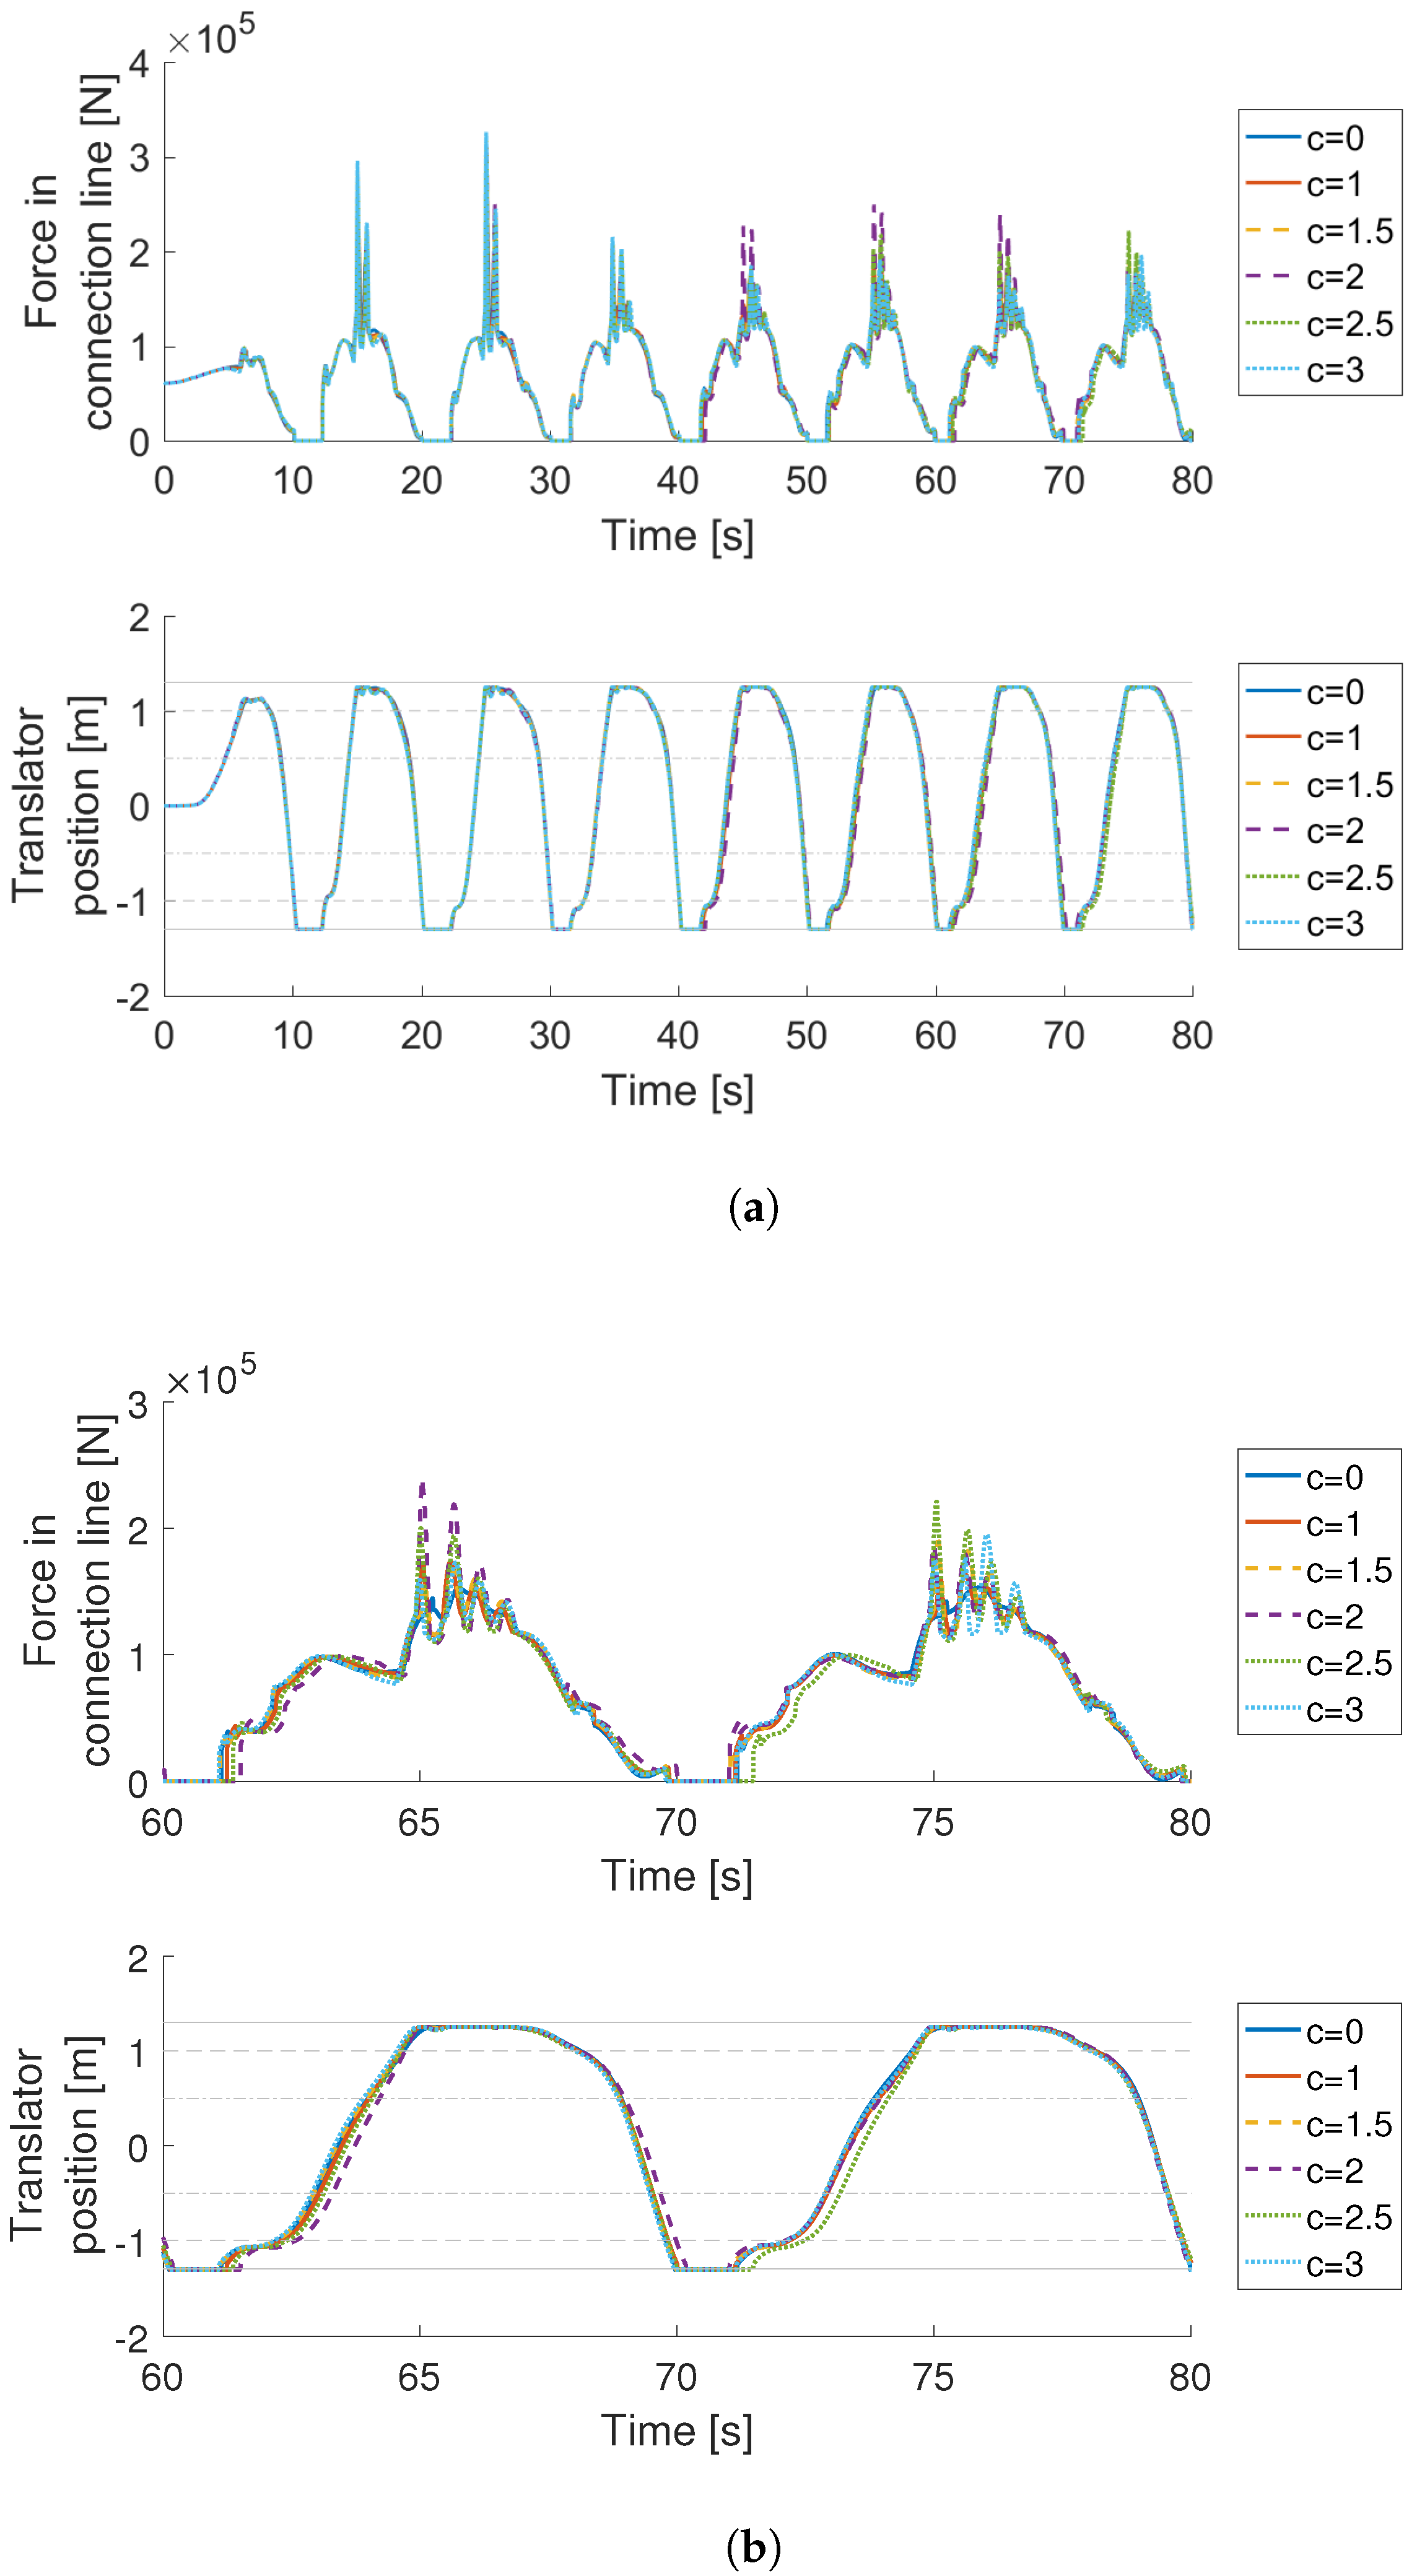
The coefficient of determination R 2 is sufficiently high in most cases for the linear fit for logarithmic values of Equations (17) and (18) (see Figure 8 and Figure 9). Especially for the linear regression analysis for each phase, R 2 is above 0.9 in most cases.
For the linear regression analysis for total electrical power, the coefficient of determination R 2 is lower (see Figure 9) compared to the linear regression for only one phase (see Figure 8). Figure 9 shows that the distribution of R 2 is narrower for l n P e than for l n γ e l , but the average value on R 2 is slightly higher for l n γ e l .
The linear regression analysis of logarithmic values of Equations (17) and (18) gives c as the slope or coefficient in the result. When l n P e , i is fitted against l n A f r a c , according to Equation (17), it is a nearly Gaussian distribution around c = 1.8 (see Figure 10), especially for phases 1 and 3. When the total electrical power is fitted instead of per phase, the value of c becomes lower, closer to 1.4 (see Figure 11). When l n γ e l is fitted against l n A f r a c , according to Equation (18), c is around 1.7.
The results for linear regression of Equation (19) can be seen in Figure 12 for phases 1, 2 and 3. The results for each phase are very similar, with the highest value on R 2 for c between 1.7 and 2.7. The results for the total electrical power can be seen in Figure 13, which has the highest value of R 2 when c is between 2.4 and 2.7. No major difference was expected between each phase since the difference between them should only be the phase shift, which does not affect the linear regression analysis.
The results for linear regression of Equation (20) can be seen in Figure 14. The highest value of R 2 is for c between 2.3 and 3.3. When doing a linear regression analysis for total electrical power according to Equation (19) or for γ e l according to Equation (20), the optimal values of c are higher than for the linear regression analysis for each phase according to Equation (19). It could be noted that the R 2 -values generally are higher when doing linear regression analysis per phase than for total electrical power, which, in turn, generally are higher than when the linear regression analysis is done on γ e l .
For all of the linear regression analysis, the general behavior of R 2 for each direction and load are similar. A summary of the approximate optimal values of c can be found in Table 4.

4.4. Case Study

The forces are simulated for c = [ 0 , 1 , 1.5 , 2.0 , 2.5 , 3.0 ] , considering the theoretical background, previous studies and the results from the data analysis. The line force depending on which value of c is used can be seen in Figure 15.
The highest value on the (peak) force is found for the highest tested value on c; c = 3 (see Table 5). However, for c = 0 , the forces are much smoother and have lower peaks than all other tested values on c. The timing of the line force peaks varies for different values on c, but, for c = 0 , the peak force is significantly lower than for the other simulated cases. The differences in the translator position are minor. Assuming c = 0 instead of c = 2 or c = 1 gives an underestimation of the peak force by 24% and 14%, respectively.
The absorbed energy during the simulation was also calculated (see Table 5). Assuming c = 0 instead of c = 2 or c = 1 gives on overestimation of the energy yield by 5.6% and 3.9%, respectively. Using c = 1 instead of c = 2 overestimates the energy by 1.7%.

5. Discussion

From the experimental results, it cannot be rejected that P e and γ e l depend quadratically on A f r a c , as suggested by theory. The data analysis of experimental measurement data gives an approximate number, suggesting that A f r a c affects P e and γ e somewhere between linearly and cubically. Some deviations are always expected when dealing with experimental data, but when good values on R 2 for c between 1.1 and 3.2 are found, it becomes difficult to make a solid statement.
It should be noted that none of the results support that c should be less than 1. When the logarithmic values are used for linear regression analysis, c < 1 only in very few cases (see Figure 10 and Figure 11). When the logarithmic values are used, there are also very few cases where the results give c > 3 . When the linear regression analysis is done on l n γ , a majority of the cases give good results for c [ 1.5 , 1.7 ] , which is less than the expected value 2, but high enough to determine that A f r a c has a major impact on calculations and simulations.
When the linear regression analysis is done for a range of c, it is especially visible that c > 1 gives higher values on R 2 . However, the value of R 2 does not drop significantly for increasing values of c and is only marginally lower for c = 5 compared to c = 2 (see Figure 12, Figure 13 and Figure 14). Compared to when the logarithmic values are used, higher values of c are favored. Weighing this in, a quadratic relationship between P e and A f r a c as well as between γ and A f r a c seems like an appropriate approximation. However, linear or cubic relationships, including relationships in between linear and cubic, cannot be excluded. As implicated in Section 2.1, this could also depend on the choice of control mechanism and the design of the linear generator.
There are several reasons why the experimental results deviate from the expected results. In Section 2.1 it is mentioned that the impedance, friction and iron losses are assumed negligible or independent of A f r a c to get the quadratic relation. During the measurements, the frictional losses and iron losses together are not negligible in the experiments. Through additional measurements of inductance, it was determined that inductance is not dependent on partial stator overlap. The influence from friction and iron losses can have affected the results from the linear regression analysis.
The speed is not constant and the acceleration of the translator could affect the linear regression analysis. Since the electrical output dampens the motion of the translator, acceleration easily occurs when the partial stator overlap is changing, which could affect the results of the linear regression analysis.
One of the reasons for studying γ e l is that it is expected to be less dependent on speed than P e . The analysis based on γ e l generally resulted in approximately the same values for c. Considering that γ e l also has a speed dependence, cases with high load resistance should be the least speed dependent [19]. There is a weak trend of better fits for higher load resistance (see Figure 14).
There are also more sources of error when doing experiments on a full-scale device outdoors than if a similar test would have been done on e.g., a small prototype. If only lower velocities would have been studied, it would also have been easier to control the speed with the crane. Fairly high velocities were used here, with the drawback of having less constant speed. It could, however, be noted, that, in real waves, speeds of up to 2 m/s might be present, but it is difficult to achieve these speeds with traverses or mobile cranes.
The air-gap between the stator and the translator varies depending on position since it is more difficult to get an exact air-gap width with the sandwich mounted magnets, compared to with surface mounted magnets. The expected deviation is ± 17 % , which will affect the magnetic flux and thereby the measured currents and voltages.
The electrical power and the damping coefficient oscillate heavily both during full stator overlap and partial stator overlap. Some oscillations are also visible at times in the speed measurements. If this is purely due to the fluctuations in electrical power and power-take off (PTO) force is the subject of further studies since it might also be due to cogging or frictional forces. It can also be due to imprecision in the vertical displacement between the stator packages, which would mean that it is not precisely 120 between each phase. A varying air gap, displacement of the translator and harmonic distortions can also cause the fluctuations.
Since oscillations are visible in so many parts of the data, it is likely that the oscillations have affected the results in the linear regression analysis. This could explain why only analyzing one phase gives better fits, because during those analyses, only the peak values of the electrical power are used in the linear regression analysis. It can also explain the minor differences between each phase in the results of the linear regression analysis.
From a short review of previous studies, it was found that the relationship between γ e l and A f r a c is most often assumed linear, if not neglected entirely. The simulated energy yield in the case study is only slightly different depending on which value of c is chosen (see Section 4.4). This is a major explanation of why previous experimental studies can match the results from simulations [20], even if c = 1 is used instead of c = 2 . The major differences in the case study are found when ignoring the partial stator overlap, e.g., c = 0 , when compared to all the other tested relationships, among those linear, quadratic and cubic. This is an indication of the importance of taking the partial stator overlap into account when simulating linear generators. However, the peak force is significantly different for different values of c.
Since the theoretical deduction suggests a quadratic relationship, this is advisable to use during modeling. There are, however, models that are easier to implement if linear relationships are used. Assuming a linear relationship between γ e l and A f r a c or P e l and A f r a c could be acceptable, depending on the circumstances, for example, if assuming other relationships are computationally costly.

6. Conclusions

A linear generator for wave power conversion and how its electricity generation and damping is affected by partial stator overlap have been studied. Theory suggests a quadratic relationship, i.e., P e A f r a c 2 , if simplifications and assumptions are made. The theoretical deduction that P e A f r a c 2 is based on the assumption that the generator inductance does not change with A f r a c , which was confirmed through measurements. From the experimental study, it has been concluded that P e A f r a c 2 , suggesting that the relationship is somewhere between linear and cubic.
A simulation case study was performed to assess the consequences that different values of c will have on the motion and end-stop forces on the WEC during operation in high waves. It was seen that neglecting partial stator overlap, c = 0 , will overestimate the power production and underestimate the end-stop forces, while the difference between assuming a linear relationship instead of a quadratic is visible but small. Since the theoretical deduction suggests a quadratic relationship, this is advisable to use when modeling.

Acknowledgments

The authors would like to thank the Centre for Natural Disaster Science (CNDS) in Sweden, Seabased Industry AB, StandUp for Energy strategic government initiative, the Swedish Energy Agency and Vargön’s Research Foundation for their support of this paper.

Author Contributions

L.U. conceived and designed the experiments; L.U., A.E.F. and L.S. performed the experiments; A.E.F. did the linear regression analysis; L.S. did the simulations in the case study; L.U. and A.E.F. wrote the paper; A.E.F. and S.E. did the theoretical derivations; S.E. and M.L. contributed with important comments and advice in the development of the paper.

Conflicts of Interest

The authors declare no conflict of interest.

Abbreviations

The following abbreviations are used in this manuscript:
DCDirect Current
FEMFinite Element Methods
LCR-meterInductance (L), Capacitance (C) and Resistance (R) meter
NLNo Load
PTOPower Take-Off
RMSRoot Mean Square
SStator
SCShort Circuit
TTranslator
WECWave Energy Converter

References

  1. Falcao, A.F.d.O. Wave energy utilization: A review of the technologies. Renew. Sustain. Energy Rev. 2010, 14, 899–918. [Google Scholar] [CrossRef]
  2. Drew, B.; Plummer, A.R.; Sahinkaya, M.N. A review of wave energy converter technology. Proc. Inst. Mech. Eng. Part A J. Power Energy 2009, 223, 887–902. [Google Scholar] [CrossRef]
  3. Cruz, J. Ocean Wave Energy: Current Status and Future Perspectives; Springer: Berlin/Heidelberg, Germany, 2008. [Google Scholar]
  4. Ozkop, E.; Altas, I.H. Control, power and electrical components in wave energy conversion systems: A review of the technologies. Renew. Sustain. Energy Rev. 2017, 67, 106–115. [Google Scholar] [CrossRef]
  5. Tom, N.; Yeung, R.W. Performance Enhancements and Validations of a Generic Ocean-Wave Energy Extractor. J. Offshore Mech. Arct. Eng. 2013, 135, 041101. [Google Scholar] [CrossRef]
  6. Prudell, J.; Stoddard, M.; Amon, E.; Brekken, T.K.; Von Jouanne, A. A permanent-magnet tubular linear generator for ocean wave energy conversion. IEEE Trans. Ind. Appl. 2010, 46, 2392–2400. [Google Scholar] [CrossRef]
  7. Polinder, H.; Damen, M.E.; Gardner, F. Linear PM generator system for wave energy conversion in the AWS. IEEE Trans. Energy Convers. 2004, 19, 583–589. [Google Scholar] [CrossRef]
  8. Mueller, M.; Zavvos, A. Electrical generators for direct drive systems: A technology review. In Electrical Drives for Direct Drive Renewable Energy Systems; Mueller, M., Polinder, H., Eds.; Woodhead Publishing Limited: Oxford, UK, 2013; Chapter 1; pp. 3–29. [Google Scholar]
  9. Danielsson, O.; Thorburn, K.; Leijon, M. Direct Drive—Linear Generators. In Ocean Wave Energy; Cruz, J., Ed.; Springer: Berlin/Heidelberg, Germany, 2008; Chapter 6; pp. 220–240. [Google Scholar]
  10. Ekström, R.; Leijon, M. Control of offshore marine substation for grid-connection of a wave power farm. Int. J. Mar. Energy 2014, 5, 24–37. [Google Scholar] [CrossRef]
  11. Boström, C.; Ekergård, B.; Waters, R.; Eriksson, M.; Leijon, M. Linear Generator Connected to a Resonance-Rectifier Circuit. IEEE J. Ocean. Eng. 2013, 38, 255–262. [Google Scholar] [CrossRef]
  12. Boström, C.; Waters, R.; Lejerskog, E.; Svensson, O.; Stålberg, M.; Strömstedt, E.; Leijon, M. Study of a wave energy converter connected to a nonlinear load. IEEE J. Ocean. Eng. 2009, 34, 123–127. [Google Scholar] [CrossRef]
  13. Leijon, M.; Boström, C.; Danielsson, O.; Gustafsson, S.; Haikonen, K.; Langhamer, O.; Strömstedt, E.; Stålberg, M.; Sundberg, J.; Svensson, O.; et al. Wave energy from the North Sea: Experiences from the Lysekil research site. Surv. Geophys. 2008, 29, 221–240. [Google Scholar] [CrossRef]
  14. Prado, M.; Polinder, H. Direct drive wave energy conversion systems: An introduction. In Electrical Drives for Direct Drive Renewable Energy Systems; Mueller, M., Polinder, H., Eds.; Woodhead Publishing Limited: Oxford, UK, 2013; Chapter 8; pp. 175–194. [Google Scholar]
  15. Parwal, A.; Remouit, F.; Hong, Y.; Francisco, F.; Castellucci, V.; Hai, L.; Ulvgård, L.; Li, W.; Lejerskog, E.; Baudoin, A. Wave Energy Research at Uppsala University and the Lysekil Research Site, Sweden: A Status Update. In Proceedings of the 11th European Wave and Tidal Energy Conference, Nantes, France, 6–11 September 2015; pp. 1–10. [Google Scholar]
  16. Leijon, M.; Danielsson, O.; Eriksson, M.; Thorburn, K.; Bernhoff, H.; Isberg, J.; Sundberg, J.; Ivanova, I.; Sjöstedt, E.; Ågren, O.; et al. An electrical approach to wave energy conversion. Renew. Energy 2006, 31, 1309–1319. [Google Scholar] [CrossRef]
  17. Prado, M.; Polinder, H. Case study of the Archimedes Wave Swing (AWS) direct drive wave energy pilot plant. In Electrical Drives for Direct Drive Renewable Energy Systems; Mueller, M., Polinder, H., Eds.; Woodhead Publishing Limited: Oxford, UK, 2013; Chapter 9; pp. 195–218. [Google Scholar]
  18. Prado, M. Archimedes wave swing (AWS). In Ocean Wave Energy; Cruz, J., Ed.; Springer: Berlin/Heidelberg, Germany, 2008; Chapter 7; pp. 297–304. [Google Scholar]
  19. Ulvgård, L.; Sjökvist, L.; Göteman, M.; Leijon, M. Speed Dependent PTO Damping in a Linear Generator for Wave Power—Measured Damping and Simulated WEC Behaviour. J. Mar. Sci. Eng. 2017. in revision. [Google Scholar]
  20. Eriksson, M.; Waters, R.; Svensson, O.; Isberg, J.; Leijon, M. Wave power absorption: Experiments in open sea and simulation. J. Appl. Phys. 2007, 102. [Google Scholar] [CrossRef]
  21. Sjökvist, L.; Krishna, R.; Rahm, M.; Castellucci, V.; Anders, H.; Leijon, M. On the optimization of point absorber buoys. J. Mar. Sci. Eng. 2014, 2, 477–492. [Google Scholar] [CrossRef]
  22. Hai, L. Modelling Wave Power by Equivalent Circuit Theory. Ph.D. Thesis, Uppsala University, Uppsala, Sweden, November 2015. [Google Scholar]
  23. Hong, Y.; Eriksson, M.; Castellucci, V.; Boström, C.; Waters, R. Linear generator-based wave energy converter model with experimental verification and three loading strategies. IET Renew. Power Gener. 2015, 10, 349–359. [Google Scholar] [CrossRef]
  24. Boström, C.; Leijon, M. Operation analysis of a wave energy converter under different load conditions. IET Renew. Power Gener. 2011, 5, 245–250. [Google Scholar] [CrossRef]
  25. Rahm, M. Ocean Wave Energy: Underwater Substation System for Wave Energy Converters. Ph.D. Thesis, Uppsala University, Uppsala, Sweden, February 2010. [Google Scholar]
  26. Anderlini, E.; Forehand, D.L.; Bannon, E.; Abusara, M. Control of a Realistic Wave Energy Converter Model using Least-Squares Policy Iteration. IEEE Trans. Sustain. Energy 2017. [Google Scholar] [CrossRef]
  27. Chen, W.; Dolguntseva, I.; Savin, A.; Zhang, Y.; Li, W.; Svensson, O.; Leijon, M. Numerical modelling of a point-absorbing wave energy converter in irregular and extreme waves. Appl. Ocean Res. 2017, 63, 90–105. [Google Scholar] [CrossRef]
  28. Jung, S.; Yoo, Y.; Kim, H.; Lee, J.H.; Yoon, M.; Jang, G. Development of an active power reserve management method for DC applied wave-wind combined generation systems. Energies 2015, 8, 12488–12504. [Google Scholar] [CrossRef]
  29. Tyrberg, S.; Waters, R.; Leijon, M. Wave Power Absorption as a Function of Water Level and Wave Height: Theory and Experiment. IEEE J. Ocean. Eng. 2010, 35, 558–564. [Google Scholar] [CrossRef]
  30. Lejerskog, E.; Strömstedt, E.; Savin, A.; Boström, C.; Leijon, M. Study of the operation characteristics of a point absorbing direct driven permanent magnet linear generator deployed in the Baltic Sea. IET Renew. Power Gener. 2016, 10, 1204–1210. [Google Scholar] [CrossRef]
  31. Danielsson, O. Wave energy conversion: Linear Synchronous Permanent Magnet Generator. Ph.D. Thesis, Uppsala University, Uppsala, Sweden, October 2006. [Google Scholar]
  32. Ulvgård, L.; Sjökvist, L.; Göteman, M.; Leijon, M. Line Force and Damping at Full and Partial Stator Overlap in a Linear Generator for Wave Power. J. Mar. Sci. Eng. 2016, 4, 81. [Google Scholar] [CrossRef]
  33. Ekergård, B. Full Scale Applications of Permanent Magnet Electromagnetic Energy Converters. Ph.D. Thesis, Uppsala University, Uppsala, Sweden, October 2013. [Google Scholar]
  34. Ekström, R.; Ekergård, B.; Leijon, M. Electrical damping of linear generators for wave energy converters—A review. Renew. Sustain. Energy Rev. 2014, 42, 116–128. [Google Scholar] [CrossRef]
  35. Leijon, M.; Boström, C.; Eriksson, M. Electric Device and a Method for a Wave Power Plant. U.S. Patent 9048725 B2, 2 June 2015. [Google Scholar]
  36. Boström, C.; Ekergård, B.; Leijon, M. Electric resonance-rectifier circuit for renewable energy conversion. Appl. Phys. Lett. 2012, 100, 043511. [Google Scholar] [CrossRef]
  37. Ekergård, B.; Boström, C.; Hagnestål, A.; Waters, R.; Leijon, M. Experimental results from a linear wave power generator connected to a resonance circuit. Wiley Interdiscip. Rev. Energy Environ. 2013, 2, 456–464. [Google Scholar] [CrossRef]
  38. Soong, W. Inductance measurements for synchronous machines. Power Eng. Brief. Note Ser. 2008. Available online: http://www.eleceng.adelaide.edu.au/research/power/pebn/ (accessed on 22 November 2017).
  39. Frost, A.; Ulvgård, L.; Sjökvist, L.; Eriksson, S.; Leijon, M. Experimental Study of Generator Damping at Partial Stator Overlap in a Linear Generator for Wave Power. In Proceedings of the 12th European Wave and Tidal Energy Conference Series (EWTEC), Cork, Ireland, 27 August–1 September 2017. [Google Scholar]
  40. Sjökvist, L.; Wu, J.; Ransley, E.; Engström, J.; Eriksson, M.; Göteman, M. Numerical models for the motion and forces of point-absorbing wave energy converters in extreme waves. Ocean Eng. 2017, 145, 1–14. [Google Scholar] [CrossRef]
Figure 1. Illustration of different translator positions and partial stator overlap. In the mid position the stator is fully overlapped by the translator ( A f r a c = 1 ), whereas, when the translator is at its bottom or top position, the stator is not completely overlapped by the translator ( A f r a c < 1 ). (a) Bottom Position; (b) Mid Position; (c) Top Position.
Jmse 05 00053 g001
Figure 2. One-phase circuit model of the generator, connected to an external load. Here, a non-salient generator is assumed.
Jmse 05 00053 g002
Figure 3. Sketch of the fully assembled generator (to the left) and experimental setup for the onshore tests (to the right).
Jmse 05 00053 g003
Figure 4. Schematics of the surface mounted translator design used for the L10 (a) and the sandwich mounted translator design used for the L12 (b). Red arrows show the direction of the magnetization of the permanent magnets. The dashed lines show some of the magnetic flux paths, and it could be noted that they are similar in the stator for both designs.
Jmse 05 00053 g004
Figure 5. Single-phase electrical circuits for the generator connected to the resonance-rectifier [37] (a) and the experimental setup (b). E i is induced voltage; i is current; R G is the generator’s internal resistance; L s is the inductance of the generator; R l o a d is the resistive dump load during the measurements; A is the current meter; V is the voltage meter; V 1 is the voltage over the generator; D 1 to D 4 are diodes; C 1 and C 2 are capacitors; V 2 is the voltage over capacitor 2; V D C is the voltage over the load, which is a direct current (DC) voltage.
Jmse 05 00053 g005
Figure 6. Inductance measurements on the three stator phases of the generator at 1 Hz, 5 Hz and 10 Hz, during full and partial stator overlap.
Jmse 05 00053 g006
Figure 7. Electrical power and damping force as well as speed and damping coefficient for seven cases when the translator is moving upward (a) and for seven cases when the translator is moving downward (b). Dotted black lines mark beginning and end of full stator overlap, i.e., A f r a c = 1 inside the dotted black lines. In the legends, NL stands for No Load; R6 stands for load 6.6 Ω ; R4 stands for load 4.4 Ω ; R2 stands for load 2.2 Ω ; R1 stands for load 1.1 Ω ; R07 stands for load 0.73 Ω ; SC stands for Short Circuit.
Jmse 05 00053 g007
Figure 8. Histogram of the coefficient of determination R 2 for the linear regression of l n P e , i l n A f r a c for phases 1, 2 and 3.
Jmse 05 00053 g008
Figure 9. Histogram of the coefficient of determination R 2 for the linear regression of l n P e l n A f r a c as well as l n γ e l l n A f r a c .
Jmse 05 00053 g009
Figure 10. Histogram of the coefficients from the linear regression of l n P e , i l n A f r a c for phases 1, 2 and 3. The coefficients correspond to c.
Jmse 05 00053 g010
Figure 11. Histogram of the coefficients for the linear regression of l n P e l n A f r a c as well as l n γ e l l n A f r a c . The coefficients correspond to c.
Jmse 05 00053 g011
Figure 12. Mean of the coefficient of determination R 2 for different values of c for different loads and directions for the linear regression of P e , i A f r a c c for phase 1 (a), phase 2 (b) and phase 3 (c) ,when the intercept is set to zero. In the legends, NL stands for No Load; R6 stands for load 6.6 Ω ; R4 stands for load 4.4 Ω ; R2 stands for load 2.2 Ω ; R1 stands for load 1.1 Ω ; R07 stands for load 0.73 Ω ; SC stands for Short Circuit.
Jmse 05 00053 g012
Figure 13. Mean of the coefficient of determination R 2 for different values of c for different loads and directions for the linear regression of P e A f r a c c when the intercept is set to zero. In the legend, NL stands for No Load; R6 stands for load 6.6 Ω ; R4 stands for load 4.4 Ω ; R2 stands for load 2.2 Ω ; R1 stands for load 1.1 Ω ; R07 stands for load 0.73 Ω ; SC stands for Short Circuit.
Jmse 05 00053 g013
Figure 14. Mean of the coefficient of determination R 2 for different values of c for different loads and directions for the linear regression of γ e l A f r a c c when the intercept is set to zero. In the legend, NL stands for No Load; R6 stands for load 6.6 Ω ; R4 stands for load 4.4 Ω ; R2 stands for load 2.2 Ω ; R1 stands for load 1.1 Ω ; R07 stands for load 0.73 Ω ; SC stands for Short Circuit.
Jmse 05 00053 g014
Figure 15. The simulated force in the line of the wave power unit as well as translator position for different values of c used in the simulation; for the whole simulation, which goes from 0 to 80 s of simulated waves (a) and zoomed in from 60 to 80 s (b) in order to visualize the differences for different values on c better.
Jmse 05 00053 g015
Table 1. Generator parameters for the L12 used during the onshore tests. Description of the first L12 can be found in [33].
ParameterValueUnit
Height of the hull600cm
Length of the translator277cm
Length of the stator178cm
Number of phases3-
Number of sides9-
Pole width35mm
Height of pole shoe19mm
Height of permanent magnet15mm
Remanence of permanent magnets0.45T
Air gap3mm
Rated Speed0.7m/s
Voltage peak-to-peak at rated speed, no load, L-L663V
Table 2. Measurement equipment.
Equipment Unit
Force transducerDynaLink 7200
- Range25tonne
- Accuracy:0.1% F.S.
Signal amplifierGSV-1A
- Output signal4–20mA
- Bandwidth (−3 dB)10kHz
AccelerometerMurata SCA620
- Range±1.7g *
- Accuracy:±4% F.S.
- Bandwidth (−3 dB)50Hz
Signal amplifierXTR115UA
- Output signal4–20mA
- Input CR filtering775Hz
Voltage probesTESTEC TT-SI 9001
- Range±700V
- Accuracy±2% of F.S.
Current probesTektronix 622
- Range±100A
- Accuracy±4% of F.S.
Data acquisitionNI cRIO 9012
ModuleNI 9203
- Sampling frequency1kHz
- Range±10mA
- Resolution16bit
- Accuracy1.05% of F.S.
* Measured relative to earth’s gravitational acceleration of 9.8 m/s 2 .
Table 3. Top speed in m/s during full stator overlap for different loads. The labels are used in Figure 7, Figures 12, 13 and 14.
LoadNo Load6.6 Ω 4.4 Ω 2.2 Ω 1.1 Ω 0.73 Ω Short Circuit
LabelNLR6R4R2R1R07SC
Up:0.530.380.490.560.560.530.54
Down:0.590.580.590.590.600.610.53
Table 4. Approximate optimal value of c according to different analysis and parts of the data.
Logarithmic ValuesRange of c
ln γ el lnP e γ el P e
Phase 1-1.4–2.6-1.7–2.7
Per phase:Phase 2-1.3–2.7-1.7–2.8
Phase 3-1.5-2.6-1.9–2.7
Total power:1.1–1.71.1–2.12.3–3.32.4–3.2
Table 5. Simulated energy yield and maximum force in connection line during 80 s for different c.
c01.01.52.02.53
Energy yield (Wh)384.1369.7365.2363.7352.4352.4
Maximum end-stop force (kN)240.0279.5293.8317.4317.5325.9

