Article

Risk Assessment of Dynamic Positioning Operations: Modelling the Contribution of Human Factors

1
School of Maritime Studies, Fisheries and Marine Institute of Memorial University of Newfoundland, St. John’s, NL A1C 5R3, Canada
2
Ocean Safety Research, School of Maritime Studies, Fisheries and Marine Institute of Memorial University of Newfoundland, St. John’s, NL A1C 5R3, Canada
3
Centre of Excellence in Marine and Offshore Engineering, Rivers State University, Port Harcourt 5080, Nigeria
*
Author to whom correspondence should be addressed.
J. Mar. Sci. Eng. 2026, 14(5), 462; https://doi.org/10.3390/jmse14050462
Submission received: 23 December 2025 / Revised: 29 January 2026 / Accepted: 26 February 2026 / Published: 28 February 2026
(This article belongs to the Special Issue Maritime Transportation Safety and Risk Management)

Abstract

Dynamic positioning (DP) systems are essential to maritime operations, as they ensure precise station keeping. Yet human error remains a major contributor to DP incidents, often interacting with technical failures and environmental conditions. This study proposes an adaptive probabilistic framework to characterise human-error contributions to DP risk and support targeted mitigation. We compare integrated Bayesian network (BN)/fuzzy analytic hierarchy process (AHP) and Bayesian network (BN)/Dempster–Shafer (D-S) theory to model causal relationships, aggregate uncertain expert judgements, and prioritise risk factors. Historical incident narratives, accident reports, and expert elicitation inform the model to analyse failure propagation and quantify factor contributions. In a representative DP case application, insufficient training, operator fatigue, and reduced situational awareness—together with software anomalies and adverse environmental loads—emerge as dominant contributors; BN backward analysis corroborates their diagnostic relevance. The approach yields actionable insights for risk reduction, including tailored training programmes, strengthened safety protocols, and integration of real-time monitoring. It provides an auditable, updateable basis for scenario-based training, software/maintenance assurance, and environment-aware operating envelopes, and is readily extendable as new evidence becomes available. Overall, the framework offers practical value for improving safety, operational continuity, and system resilience in DP operations.

1. Introduction

Dynamic positioning (DP) systems are integral to maritime operations, particularly where precise station keeping is required without mooring or anchoring. These systems integrate power, thruster, and control subsystems, coordinated by control algorithms to counteract wind, wave, and current loads. Using inputs from motion reference units, gyrocompasses, and wind sensors, the DP controller maintains position or follows a predefined track with high accuracy to meet operational demands [1].
In offshore operations, DP is essential to critical tasks such as subsea installation, drilling support, and offshore loading [2]. It is indispensable in deep water or near sensitive infrastructure where anchoring is infeasible or impractical. The precision and automation of DP have made it a technological cornerstone for the offshore energy sector, which relies on safe and efficient operations under continuously changing environmental conditions [3].
Despite significant advances in DP reliability, technical, human, and environmental failures still pose substantial risk [2,4,5]. A key concern is positional excursions or collisions arising from DP malfunctions, potentially leading to downtime, environmental harm, and significant economic loss [3]. These risks are exacerbated by equipment failures, human error, and severe weather, underscoring the need for comprehensive risk assessment and mitigation strategies. Traditional methods such as failure mode and effects analysis (FMEA) remain valuable but can struggle with complex subsystem interactions, multi-failure scenarios, and dynamic uncertainty—motivating more robust probabilistic approaches [6,7,8]. Wang et al. [6] explore various probabilistic approaches and their merits in DP reliability assessment. However, no study has explored the integration of these methods for human-factor assessment in DP operation failure.
Human factors are central to DP safety. The dynamic positioning operator (DPO) monitors system performance and executes corrective actions under time pressure and variable workload [5]. Variations in situational awareness, decision making, and adherence to procedures can materially affect outcomes. In modern, highly automated DP environments, demands for specialised training and experience increase, while fatigue, stress, and automation-related phenomena (e.g., automation bias and alarm fatigue) can elevate risk [9]. Strengthening training, decision-support tools, and human reliability analysis within the safety framework is therefore essential to improving safety and operational efficiency [9,10].
In this study, we operationalise human factors in DP as organisational and individual contributors that shape how DP tasks are planned, monitored, and controlled. Specifically, we consider (i) management and organisational controls (e.g., safety management system implementation, maintenance planning, and risk assessment), (ii) training and competence (e.g., training adequacy, competence, and procedural compliance), (iii) operator performance (e.g., decision making, situational awareness, and response to anomalies), and (iv) crew conditions (e.g., fatigue). These aspects influence DP performance by affecting the detection and interpretation of system states and alarms, adherence to activity-specific operating guidelines, and the timeliness and quality of corrective actions, particularly during equipment degradation and elevated environmental loads.
Understanding how human performance interacts with technical states and environmental conditions offers practical leverage: better-targeted training programmes, improved decision support, and refined operating procedures. Addressing these interactions reduces the likelihood of accidents and improves safety standards, thereby minimising safety, environmental, and economic risks associated with offshore operations. This research area is relevant both for advancing safety science and for enhancing system resilience in the offshore industry.
This study aims to propose an adaptive framework that enhances the understanding of the impact of human error on DP operations by integrating advanced probabilistic methods and human reliability analysis.
The novelty of this study is that it combines Bayesian networks with two uncertainty-handling expert aggregation approaches (DST and Fuzzy AHP) to support human-factor risk assessment in DP operations when incident-specific quantitative data are limited or unavailable. The framework provides an auditable pathway from incident narratives to a causal BN structure and enables scenario-based prioritisation of dominant contributors under explicit uncertainty treatment.
This study applies integrated probabilistic methods—Bayesian networks (BNs), Dempster–Shafer theory (DST), and fuzzy analytic hierarchy process (Fuzzy AHP)—to investigate human-related accidents in DP operations. These methods have been widely applied in safety and risk assessment under uncertainty, including maritime/offshore contexts [8,9,11,12]. The integrated approach quantifies uncertainty and synthesises expert judgements to evaluate the likelihood of accident scenarios, model causal relationships, and prioritise risk factors. We provide an adaptive framework that yields actionable insights for mitigation (e.g., tailored training programmes, enhanced safety protocols, and integration of real-time monitoring technologies) and demonstrate how probabilistic reasoning can improve DP safety by more accurately assessing and managing risks.

2. Methodology

2.1. Methodology Steps

This methodology employs a hybrid approach, integrating both qualitative and quantitative techniques to analyse risk factors and their contribution to accidents in DP operations. Logic models and Bayesian networks (BNs) are utilised to represent and quantify the relationships between risk factors and failure events [7,8].
The following steps outline the methodological approach.
1. 
Data Collection
The initial step involves gathering historical data on DP accidents, including accident reports, performance records, and expert judgements [2,3,5]. In addition to data collection, the step identifies causal factors, including human, equipment, and environmental influences [4]. These factors are segmented and described to ensure comprehensive analysis and risk categorisation. These data provide a foundation for identifying critical risk factors and serve as input for the subsequent modelling process. Additionally, a logic diagram is developed to identify human factors contributing to operational failures, offering a structured visualisation of the interconnections among risk elements. The logic diagram was developed by the authors by translating causal statements from the screened IMCA narratives (e.g., “led to”, “contributed to”, and “as a result of”) into precursor–outcome links. The initial structure was then checked for consistency with DP operational practice and refined during expert elicitation to ensure that the causal links were plausible for the case context.
2. 
Modelling
A Bayesian network (BN) was constructed based on the logic diagram to model interdependencies among risk factors, including environmental conditions, technical aspects of the DP system, and human-related factors. The BN framework enables probabilistic representation of these dependencies and helps model failure propagation leading to major accidents [7,10]. To build the BN, expert data were used to compute
  • Prior probabilities for individual risk factors.
  • Conditional probability tables (CPTs) to define relationships between variables.
The BN model can be updated iteratively as new data are collected. This dynamic refinement ensures that the model remains accurate and relevant.
3. 
Fuzzy Logic
Expert opinions on risk factors were gathered through structured surveys. Experts rated the likelihood of various risks, and their judgements were converted into Fuzzy AHP to address the inherent vagueness and subjectivity of human judgement. Fuzzy logic provides a robust mechanism for quantifying uncertainties in qualitative expert assessments [8,11].
4. 
Dempster–Shafer Theory
Inputs from multiple experts were aggregated using Dempster–Shafer theory (DST), which resolves conflicts and combines evidence to calculate a unified belief function. This approach accounts for varying degrees of confidence among experts, offering a more reliable and comprehensive risk assessment, even when expert opinions diverge [13].
5. 
Probability calculation
This step integrates Fuzzy AHP and DST methodologies to calculate probabilities for identified risks. It also evaluates the level of risk for each factor based on these probabilities and their potential impacts [9,13].
6. 
Risk estimation
Risk estimation focuses on applying calculated probabilities to evaluate the likelihood and impact of top events. Using backward analysis, this step identifies the most critical contributing factors to high-risk events and assigns probabilities to these outcomes for prioritisation [8].
7. 
Refinement and feedback
The methodology incorporates an iterative feedback loop to refine BN models, Fuzzy AHP, and DST calculations. As new data become available, the models are updated to improve accuracy and adapt to changing system conditions. This iterative process ensures that risk assessments remain relevant and reliable over time [8].
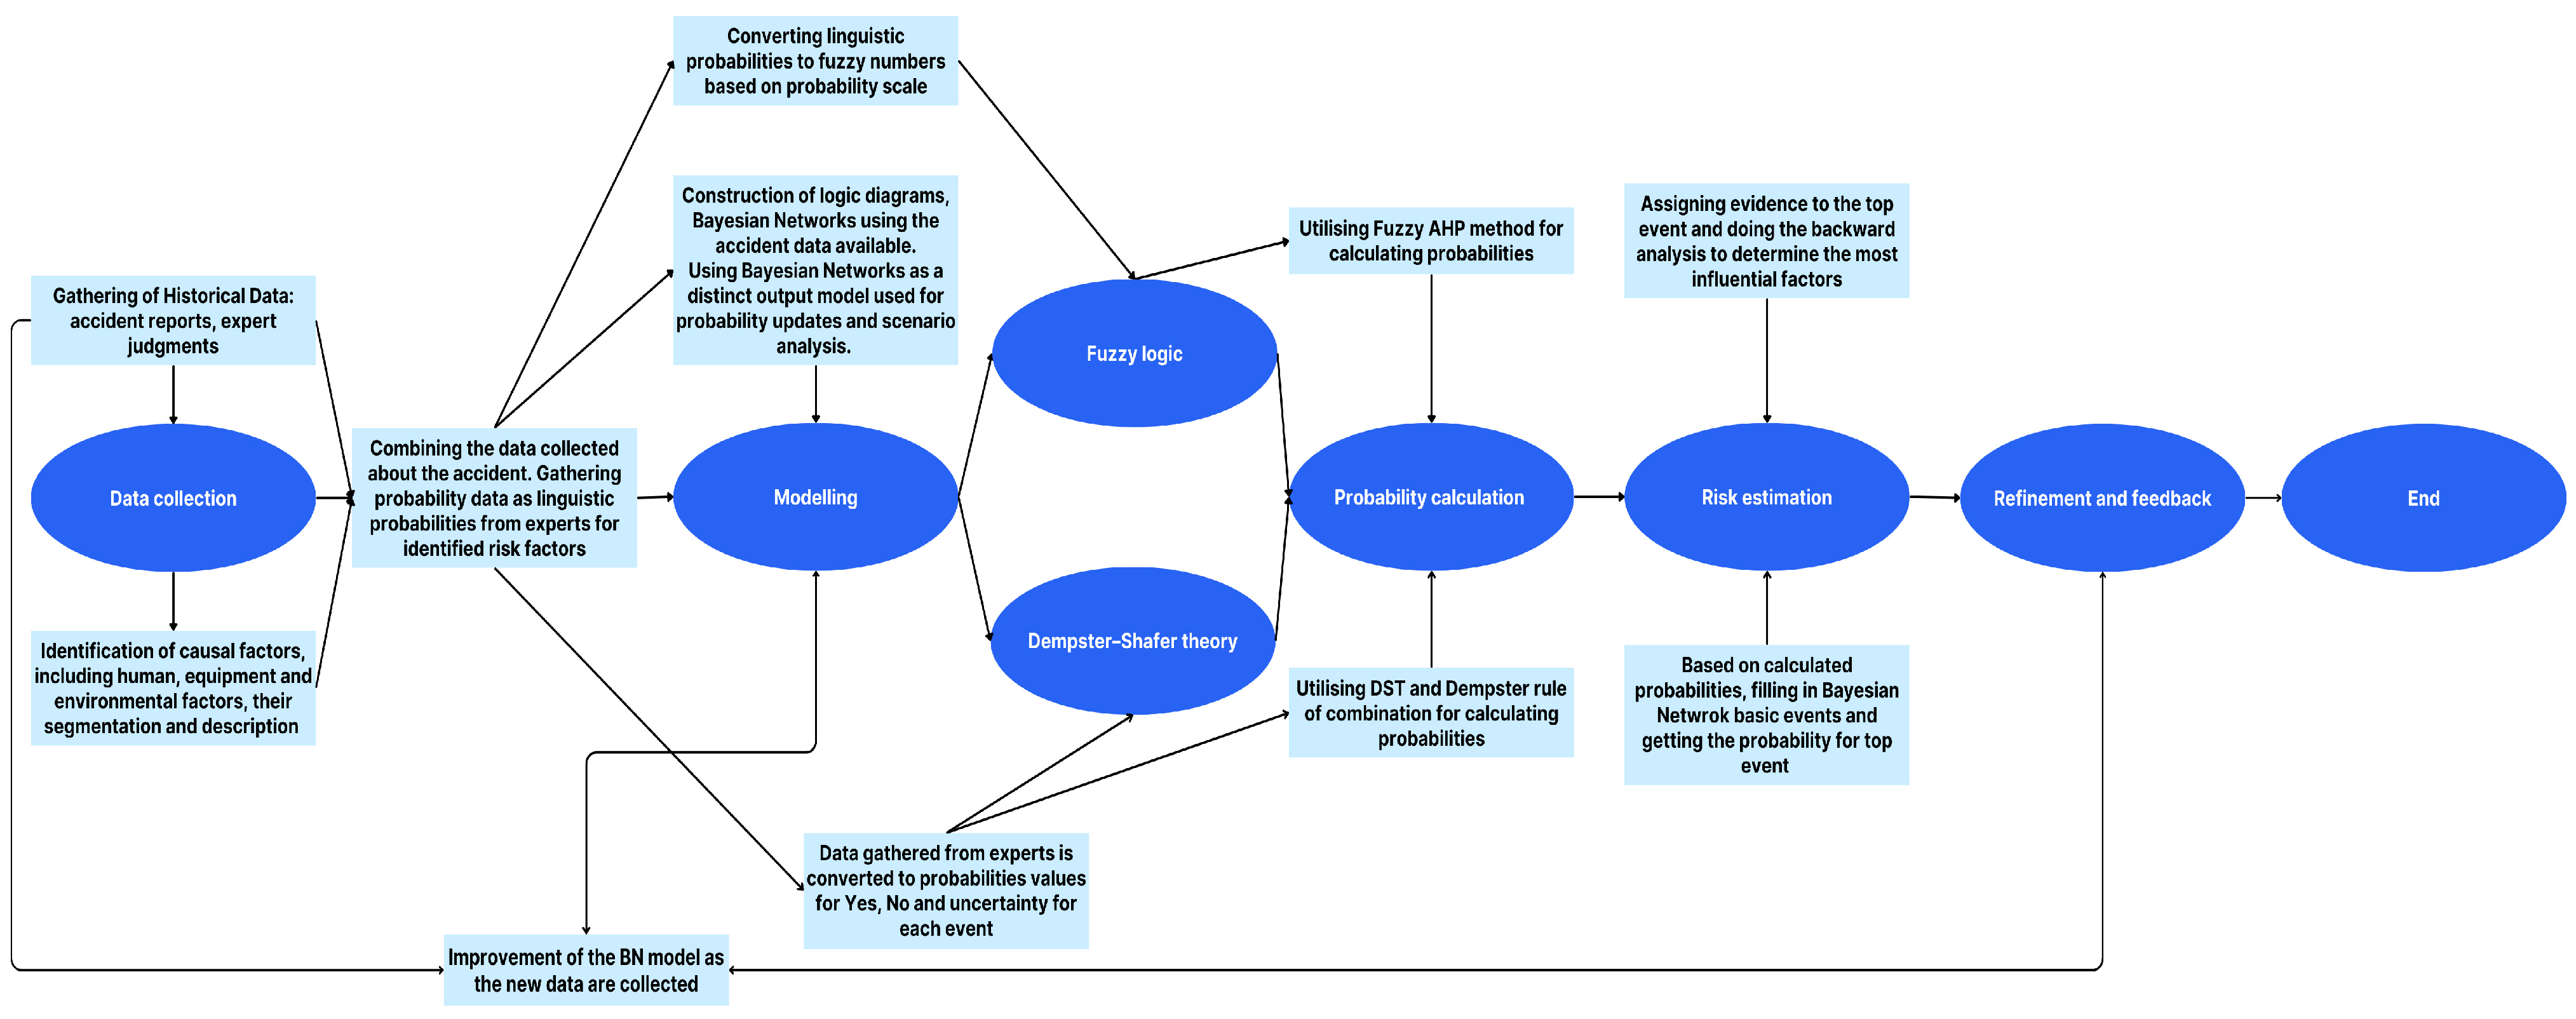
Figure 1 summarises the workflow used in this study, showing how incident screening and factor extraction inform the logic/BN structure, how expert elicitation is aggregated using DST and Fuzzy AHP, and how BN inference is used for risk estimation and backward analysis.

2.1.1. Data Collection

To assess human factors in DP accidents, data about the accidents and accident description were gathered from the IMCA DP Incidents database [3]. The IMCA DP Event Bulletins published between 2018 and 2024 were reviewed, covering over 20 DP incidents in which human error was identified as a primary contributor. These narratives were screened for relevance to DP operational failures and retained for qualitative extraction of contributing factors and causal links. One representative personnel-transfer case was then selected for the worked BN case application presented in Section 3. Contributing factors were extracted by the structured reading of each event narrative, recording stated causal statements and operational deviations (e.g., procedural non-compliance, equipment state/maintenance issues, environmental loading) and mapping them to the factor definitions. These were complemented by a structured elicitation protocol instantiated with six expert profiles representing DP operations and systems roles [9]. Given limited event-specific quantitative data, proxy expert judgements were used to estimate the likelihood of contributing events [2,4,5].
Data note. All quantitative inputs (expert ratings, priors, and CPT entries) are case-application inputs derived from structured expert elicitation; they are not fleet-level statistics. Six expert profiles were instantiated to reflect role diversity relevant to DP assurance and operations, with profile attributes reported transparently in Table 1. The intent is not statistical representativeness of the wider offshore DP industry, but a worked methodological case application under limited event-specific quantitative data, where proxy expert judgements are used to initialise BN priors and CPT inputs. To support transparency and reproducibility, incident narratives are used primarily to define the causal structure (logic diagram and BN topology), while expert elicitation provides quantitative inputs (linguistic ratings, priors, and CPT entries) required for probabilistic inference. Because the inputs are elicited using linguistic ratings, they reflect epistemic uncertainty and subjectivity. This uncertainty is handled explicitly through DST aggregation and is additionally examined by comparing outcomes against a Fuzzy AHP-derived prior treatment as a robustness-oriented sensitivity check. Table A2 reports their linguistic assessments, and Table A3 provides the derived initial probabilities used in the BN case application. While the current study demonstrates the methodology with a limited set of incident narratives and expert inputs, the framework is designed to be updated as additional operational evidence becomes available.
The expert profile attributes definitions (Table 1) are shown below.
Factors were identified by analysing the screened incident narratives into human/organisational, equipment, and environmental contributors and by retaining only factors that could be connected through a plausible causal sequence leading to the top event. Contributing factors were identified and grouped into the following:
  • Personnel factors: Factors affecting management and organisational controls (e.g., SMS implementation, maintenance planning, and spare part management), training/competence, operator performance, and crew conditions.
  • Equipment factors: Factors including technical, control and positioning factors; influencing equipment reliability; software functionality; and vessel condition.
  • Environmental factors: External factors such as weather conditions, sea currents, and waves.
Organisational contributing factors are treated as part of the personnel factors group because they shape operational decisions and human performance conditions.
For each expert profile, probability estimates for basic events were specified on a 0–1 scale. The likelihood of each event was rated using a linguistic scale for fuzzy probability analysis. Table 2 represents the scale, consisting of 11 points representing different levels of likelihood [9,12].
The 11-point 0–1 scale (0.05–0.10 increments) was selected to provide a simple, interpretable mapping from linguistic likelihood to trapezoidal fuzzy numbers for this methodological case application. Linguistic ratings were then converted into fuzzy numbers to capture the inherent uncertainty and variability in human judgement. By using Fuzzy AHP, we can model the vagueness associated with linguistic terms, thereby improving the reliability of probability estimates.

2.1.2. Modelling Using Bayesian Networks

Bayesian networks (BNs) are advanced probabilistic graphical models increasingly employed in the domains of system reliability, risk management, and safety analysis [8]. They are particularly effective in representing and reasoning with uncertain and probabilistic knowledge [8]. Structurally, BNs are directed acyclic graphs (DAGs) where each node represents a random variable, and directed arcs denote causal dependencies between variables [8]. These dependencies are quantitatively defined using conditional probability tables (CPTs), which capture the strength of the relationship between parent and child nodes [11,14].
The independencies implied by a BN follow the local Markov property: each node is conditionally independent of its non-descendants given its parents. More generally, d-separation provides a graphical criterion for reading conditional independencies from the DAG. Using the chain rule of probability, the joint probability distribution P ( U ) for the set of variables U = { A 1 , , A n } within the network can be expressed as
P U = i = 1 n P ( A i | P a A i ) ,
where P a A i are the parents of A i in the BN and P U reflects the properties of the BN [7].
In accident analysis, BNs serve as inference engines, allowing for dynamic updates to event probabilities when new evidence becomes available [8,14,15]. This is achieved through Bayes’ theorem, which combines prior probabilities with observed data (evidence E) to compute posterior probabilities. The updated joint probability distribution is given by:
P U E = P ( U , E ) P ( E ) = P ( U , E ) U P ( U , E ) .
This framework supports two critical types of analysis: predictive analysis, where probabilities of accidents given precursor events (e.g., P ( a c c i d e n t e v e n t ) ) are calculated, and diagnostic analysis, which determines the likelihood of underlying causes given an observed accident (e.g., P ( e v e n t a c c i d e n t ) ).
For example, a Bayesian network could model the probability of a DP accident given the presence of factors leading to that accident. Each node in the network would be assigned a conditional probability, representing the likelihood of one variable influencing another. By updating the network with observed data or expert input, the probability of various outcomes can be calculated dynamically [2,4,5].
These capabilities make BNs invaluable tools for modelling complex systems, enabling the systematic quantification of risk, identification of critical factors, and prioritisation of mitigation strategies. Their integration of causal reasoning with probabilistic inference provides a robust foundation for improving safety and reliability in dynamic and uncertain operational environments [8,11].
Non-human factors are represented explicitly as technical and environmental nodes in the BN and linked to human-factor nodes through conditional dependencies. This structure allows human-factor influence to be interpreted while accounting for interacting technical/environmental drivers. Where isolation is required for interpretation, non-human nodes can be conditioned to typical or observed states and posterior changes in human-factor nodes can be compared under comparable operating conditions.

2.1.3. Fuzzy Logic

In this study, the Fuzzy AHP method was employed for expert weighting due to its advantages over other techniques, particularly in addressing common limitations. Traditional methods often fail to fully utilise fuzzy comparison matrices and may yield illogical zero weights for selection criteria. Fuzzy AHP effectively overcomes these issues by providing a structured framework for pairwise comparisons and weight calculations, ensuring more reliable and consistent results [9,12]. Figure 2 outlines the Fuzzy AHP workflow used to convert expert judgements into probabilities.
The Fuzzy AHP method follows a four-stage process [9]:
  • Pairwise Comparison Matrices: Pairwise comparison matrices are constructed within the framework of the hierarchy procedure across all defined criteria. Experts’ judgements are incorporated by assessing the relative importance of each criterion through pairwise comparisons. An example is the high superiority in each of the two criteria:
M ~ = 1 b ~ 12 b ~ 1 n 1 / b ~ 21 1 b ~ 2 n 1 / b ~ n 1 1 / b ~ n 2 1
When criterion i is more important than criterion j , b i j = 1 ~ , 3 ~ , 5 ~ , 7 ~ . And when criterion j is more important than i , b i j =   1 ~ 1 , 3 ~ 1 , 5 ~ 1 , 7 ~ 1 , where the triangular fuzzy numbers are determined as shown in Table 3.
2.
Calculation of Fuzzy Weights: The geometric mean method is applied to compute fuzzy weights for each criterion, represented as lower, middle, and upper values.
r ~ i = b i 1 b i 2 b i n 1 / n ,
3.
Defining Weights for Each Criterion: Each criterion’s fuzzy weight is calculated for each lower, middle, and upper values:
w ~ i = r i r 1 r 2 r n 1 ,
4.
Defuzzification: The centre of area (CoA) approach is used to determine the best non-fuzzy performance (BNP) value, converting fuzzy weights into precise numerical values:
B N P = u w i l w i + m w i l w i 3 + l w i ,
The Fuzzy AHP method also incorporates a data aggregation process to account for diverse expert opinions [9]. Techniques such as voting, Delphi methods, and arithmetic averaging are considered; however, Fuzzy AHP ensures a balanced approach by integrating varying expert inputs while maintaining consistency and reliability. This method’s adaptability and precision make it a valuable tool for addressing complex decision-making scenarios [9]. The steps for the data aggregation are summarised as follows [8]:
  • Transfer linguistic terms to the fuzzy triangular corresponding numbers.
  • Compute the degree of similarity between two kinds of expert for each basic event:
S A ~ ,   B ~   = 1 1 J i = 1 J | a i b i | ,
3.
Compute the degree of agreement between two kinds of expert:
A A ( E u ) = 1 J 1 v = 1 , u v J S ( R ~ u R ~ v ) ,
4.
Compute the relative degree of agreement between two kinds of expert:
R A ( E u ) = A A ( E u ) u = 1 J A A ( E u ) ,
5.
Compute the consensus degree of the coefficient:
C C ( E u ) = β W ( E u ) + ( 1 β ) R A ( E u ) ,
where W ( E u ) is the weight of each expert and the coefficient β is the relaxation factor and ranges between 0 and 1. This factor controls the influence of an expert’s weight compared with their consensus degree. Its value is taken as 0.5 [8].
6.
Compute the aggregation result based on expert opinions:
R ~ a g = C C ( E 1 ) R ~ 1 C C ( E 2 ) R ~ 2 C C ( E m ) R ~ m
7.
Defuzzification procedure of a trapezoidal fuzzy number using centre of gravity:
X = 1 / 3 ( a 4 + a 3 2 a 4 a 3 a 1 + a 2 2 + a 1 a 2 ( a 4 + a 3 a 1 a 2 ) )
As proposed in this study, the probability of each basic event is computed as follows:
P = 1 10 K
K = 1 C F P 1 1 / 3 2.301

2.1.4. Dempster–Shafer Theory

Dempster–Shafer theory (DST) is a mathematical framework for handling uncertainty and combining evidence, extending classical probability theory. Unlike traditional approaches, which assign probabilities to single events, DST allows probabilities to be associated with sets of events, accommodating uncertainty and ambiguity at a higher level of abstraction. This flexibility makes it particularly useful in scenarios with incomplete or imprecise information. The implementation of evidence theory in this study, including the definition of BPAs, belief and plausibility functions, and the use of Dempster–Shafer/Yager combination rules and pignistic probabilities, is adapted from Ferdous et al. [6], with theoretical background from Sentz and Ferson [13].
DST uses three key functions:
  • Basic Probability Assignment (BPA): This assigns a value (m) to subsets of the universal set, reflecting the proportion of evidence supporting a claim. Importantly, BPA does not distribute values among subsets, making no assumptions about evidence not explicitly provided.
  • Belief Function (Bel): It calculates the total support for a set by summing the BPAs of all its subsets, representing a lower bound on the probability of the set.
  • Plausibility Function (Pl): This upper bound represents the maximum possible support for a set by summing BPAs for all overlapping subsets.
The interval between belief and plausibility defines the uncertainty, capturing the imprecision of evidence. When sufficient evidence is available, DST reduces to classical probability theory, maintaining compatibility with traditional approaches.
In this study, Dempster’s rule of combination was applied as a critical component of DST to aggregate evidence from multiple sources. This rule combines BPAs derived from independent bodies of evidence within the same frame of discernment. It operates as a conjunctive pooling method, focusing on agreement between evidence sources while redistributing conflicting evidence through normalisation [7,13].
Mathematically, Dempster’s rule combines BPAs as follows:
m 1 2 p i = 0                                                 f o r p i = Φ p a p b = Φ m 1 ( p a ) × m 2 ( p b ) 1 k     f o r   p i Φ
where K represents the conflict, calculated as
k = papb = Φm1(pa) × m2(pb)
The pignistic probability is derived to provide a decision-making framework by transforming the belief structure into a probabilistic distribution, particularly when DST is used for decision-making purposes. This helps to resolve situations where DST produces intervals of uncertainty, turning them into actionable probabilities for risk analysis.
The formula used to determine pignistic probability Bet(P) is
B e t ( P ) = p i P m ( p i ) | p i |
This rule effectively integrates evidence supporting common hypotheses while excluding conflicting mass, attributing it to the null set. The commutative and associative properties of Dempster’s rule facilitate consistent combination regardless of the order of evidence sources. However, significant conflict between evidence sources can lead to counterintuitive results, as highlighted by critiques such as Zadeh’s example of contradictory medical diagnoses [6]. These challenges underline the importance of assessing the level and relevance of conflict before applying Dempster’s rule.
In the context of DST, expert judgements were categorised into three groups: “Yes” (the event occurred), “No” (the event did not occur), and “Yes/No” (uncertainty regarding the event’s occurrence). These categories formed the basis for assigning probabilistic values to the events, with the “Yes” and “No” values being derived from the data obtained by the experts. Experts provide linguistic assessments, which are then converted into certain values according to the linguistic probability scale, enabling the representation of uncertainty in the evaluation process. The uncertainty regarding the occurrence of an event was quantified by calculating the difference between 1 and the sum of the “Yes” and “No” values. This approach supports the structured handling of ambiguity by producing probabilities for BN initialisation while retaining explicit representation of uncertainty through belief and plausibility. By integrating these values with the DST framework, this study could aggregate expert opinions and model the uncertainty and conflict inherent in risk assessments related to DP operations.
The application of DST provided a formal mechanism to combine expert judgements, ensuring a coherent aggregation of evidence for risk assessment in DP operations. By addressing uncertainties and integrating diverse expert perspectives, the method contributed to a comprehensive and robust framework for understanding and mitigating risks.

2.1.5. Risk Quantification

Bayesian networks were utilised to model the causal relationships between fundamental events and DP incidents, providing a structured and dynamic framework for analysing the likelihood of incidents arising from human errors and operational conditions. This approach facilitates a deeper understanding of complex interdependencies and enhances predictive accuracy [8,11].
The aggregated evidence from Dempster–Shafer theory was converted into probabilities via the pignistic transformation and used to initialise prior probabilities for BN basic events. In parallel, fuzzy judgements were defuzzified and, using the adopted possibility-to-probability mapping, yielded an alternative set of priors. BN inference was performed under each prior set separately [9]. Fuzzy AHP also produced defuzzified importance weights used for prioritisation and to guide sensitivity probes. Here, “weights” refer to event-specific values derived from expert judgements (after aggregation/defuzzification) assigned to each basic event for BN initialisation and ranking; they are not treated as a single pool divided across all factors. Conditional probability tables (CPTs) were specified for each node, with logical relationships (e.g., OR/AND) implemented through the CPTs to reflect dependencies among events. For nodes representing logical combinations of precursors, CPTs were specified using deterministic OR and AND relationships to define which parent-state configurations activate the child node. We did not employ noisy logic gates; instead, when the logical condition was satisfied, the probability of the child node being active was assigned using the expert-elicited value for that node, and the inactive probability was set as its complement. Parent-state configurations that did not satisfy the logic were assigned zero probability. This CPT specification is a construction rule for logic-type nodes and does not, by itself, imply statistical independence among parent variables; dependencies are represented where explicitly specified in the network structure. For nodes with three or more parents, this approach reduces CPT parameterisation while preserving transparency and interpretability consistent with the fault-tree-style representation used in this study.
The BN model was designed to capture the interactions among critical factors, including human errors, equipment failures, and environmental conditions. The network structure, informed by expert knowledge and historical data, illustrated causal pathways, demonstrating how one event could influence another. This model allowed for the initial calculation of the probability of major events based on expert judgements without additional data. As new data become available (e.g., DP logs, equipment failure statistics, simulator datasets, updated incident observations, or refreshed expert assessments), these probabilities can be updated and the BN re-queried to refine event likelihoods.
Sensitivity analysis was conducted to identify the most influential factors and operational conditions contributing to the risk of incidents. This analysis provided valuable insights into prioritising mitigation strategies by highlighting critical areas of vulnerability.
The integration of Bayesian networks with DST and Fuzzy AHP creates a comprehensive and robust framework for event probability assessment. This methodology enables the incorporation of both probabilistic data and linguistic assessments, allowing for a nuanced evaluation of uncertainty and risk. The resulting model improves the accuracy of probability estimates when the available data are not sufficient. It also provides insights into the interactions among human factors, operational conditions, and technical systems in DP operations that can lead to an accident [4,5,15].
By updating the model as new data become available, the BN model supports dynamic risk management [14]. This adaptability ensures that the model remains relevant and effective, offering a powerful decision-making tool for identifying critical risk factors, predicting potential incidents, and implementing targeted mitigation strategies to enhance the safety and reliability of DP operations.

3. Application

3.1. Case Study

3.1.1. Event Description

During a personnel-transfer operation, a vessel was approaching an offshore platform using DP [3]. As the vessel neared the platform, with its Personnel Access Platform (PAP) almost connecting to the platform’s gangway, an unexpected failure occurred. The vessel’s DP system suddenly rejected control of the starboard azimuth thruster without any prior alarm, causing a destabilisation of the vessel’s position.
Despite the loss of the “ready” signal for the thruster, the DP system still displayed it as “ready”, misleading the crew. The DPO, seeing the thruster’s “ready” status, re-selected it in an attempt to regain position-keeping capabilities. However, this action violated the activity-specific operating guidelines (ASOGs), which specify that re-selection of failed equipment must only occur when the vessel is in a safe position.
The vessel began to drift backward, with the stern slowly rotating to starboard. The DP system could no longer compensate for the environmental forces, which were typical for the region but still challenging. The remaining thrusters were insufficient to counteract the drift, and the DP system could not regain control.
The DPO attempted to correct the vessel’s drift using the DP joystick, but the response was unusually slow, indicating a critical failure in the system’s joystick control. This issue, along with the initial thruster failure, could be traced to software faults and defective equipment, both linked to poor maintenance and delayed repairs.
The operator’s inability to maintain a safe distance from the platform and the vessel operating beyond its capabilities led to a collision. This incident was exacerbated by the operator’s lack of competence, failure to follow operational procedures, and insufficient training. The operator’s inadequate risk assessment and ineffective situation analysis led to the insufficient planning of the personnel-transfer activity.

3.1.2. Analysis and Results

For the above-described event, Table 4 shows the causal factors that were determined and their description. Human factors influence DP outcomes throughout the operational lifecycle: during pre-job preparation (activity planning and risk assessment), system readiness assurance (maintenance, repairs, and spare part availability), and real-time DP console operation (procedural compliance, situational awareness, decision making, and response to emergencies). In the present incident, these human-related contributors interacted with non-human drivers to result in loss of position and collision. Table 4 lists the factor set used to parameterise the BN for the case application. Not every factor is necessarily stated verbatim in the (often brief) IMCA narrative; several represent latent organisational/maintenance precursors that are commonly associated with the described failure mechanisms and were confirmed as plausible contributors during expert elicitation.
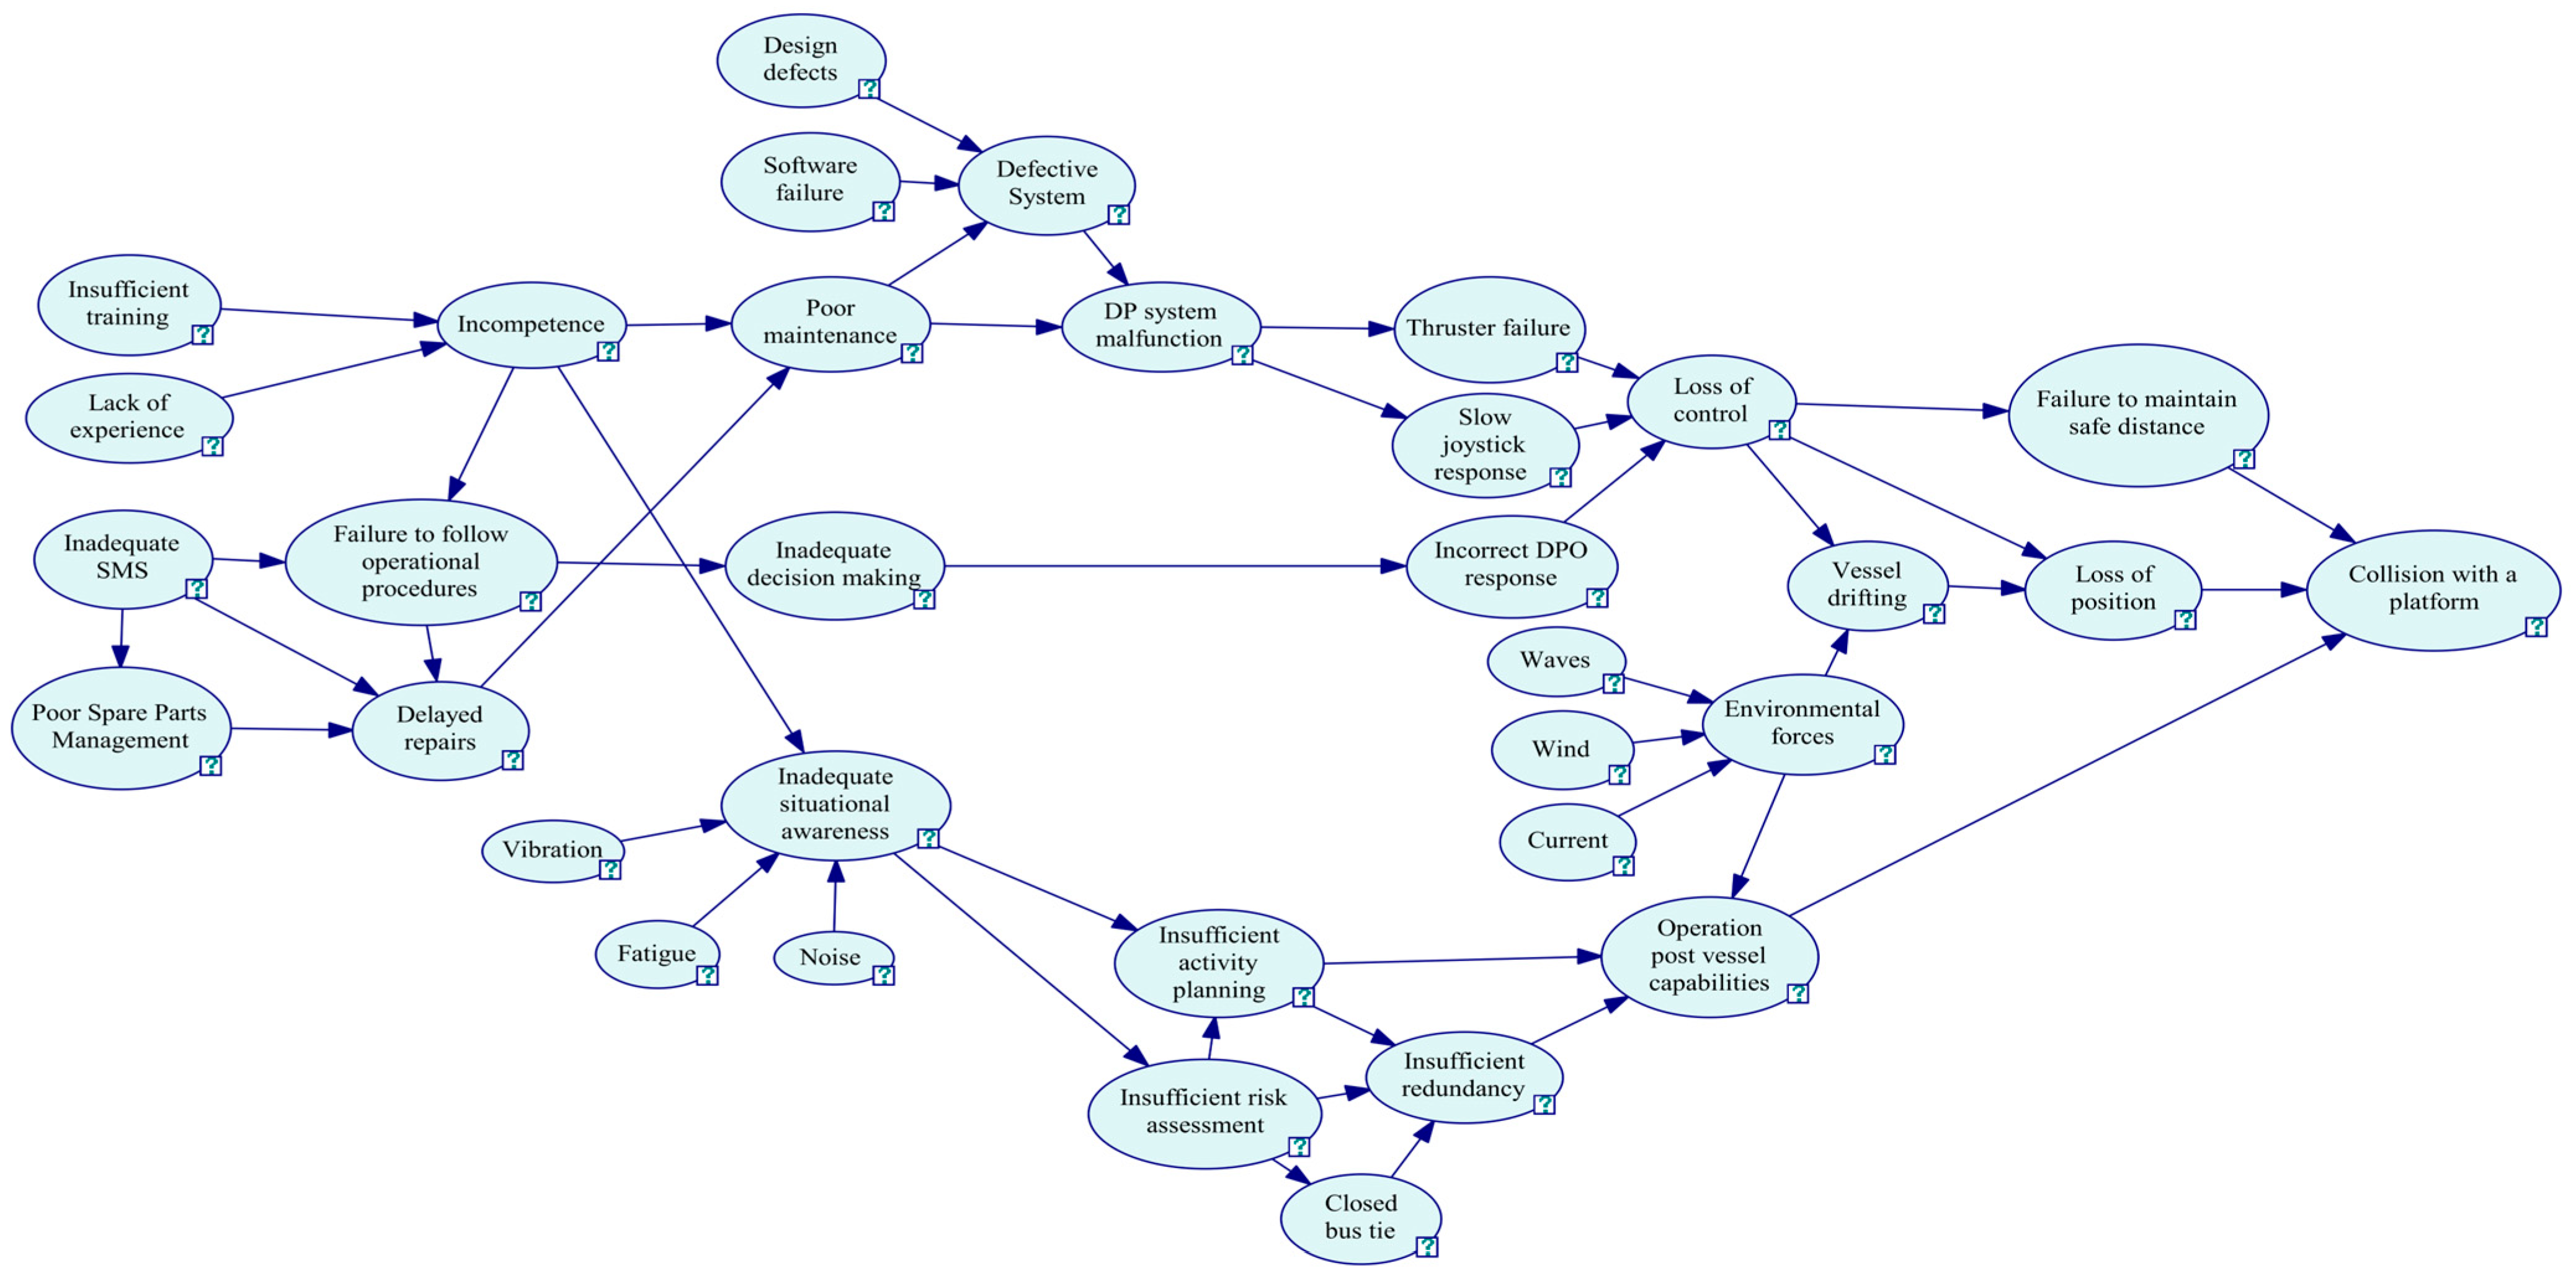
Based on the logic diagram and the factor set in Table 4, a BN was constructed in GeNIe Academic (v4.1.4109.0) (BayesFusion, LLC, Pittsburgh, PA, USA) by representing each factor as a node and encoding precursor–outcome links from the narrative as directed arcs. Figure 3 shows the resulting BN structure used for inference.
To determine the initial probabilities of the basic events, linguistic probability data from six expert profiles were taken. The information about the experts is reported in Table 5.
The linguistic probabilities from the provided experts are provided in Table A2 (Appendix A).
After gathering the data from experts and filling in the table for Fuzzy AHP and DST methods, respective calculations were conducted. The results can be seen in Table A3 (Appendix A).
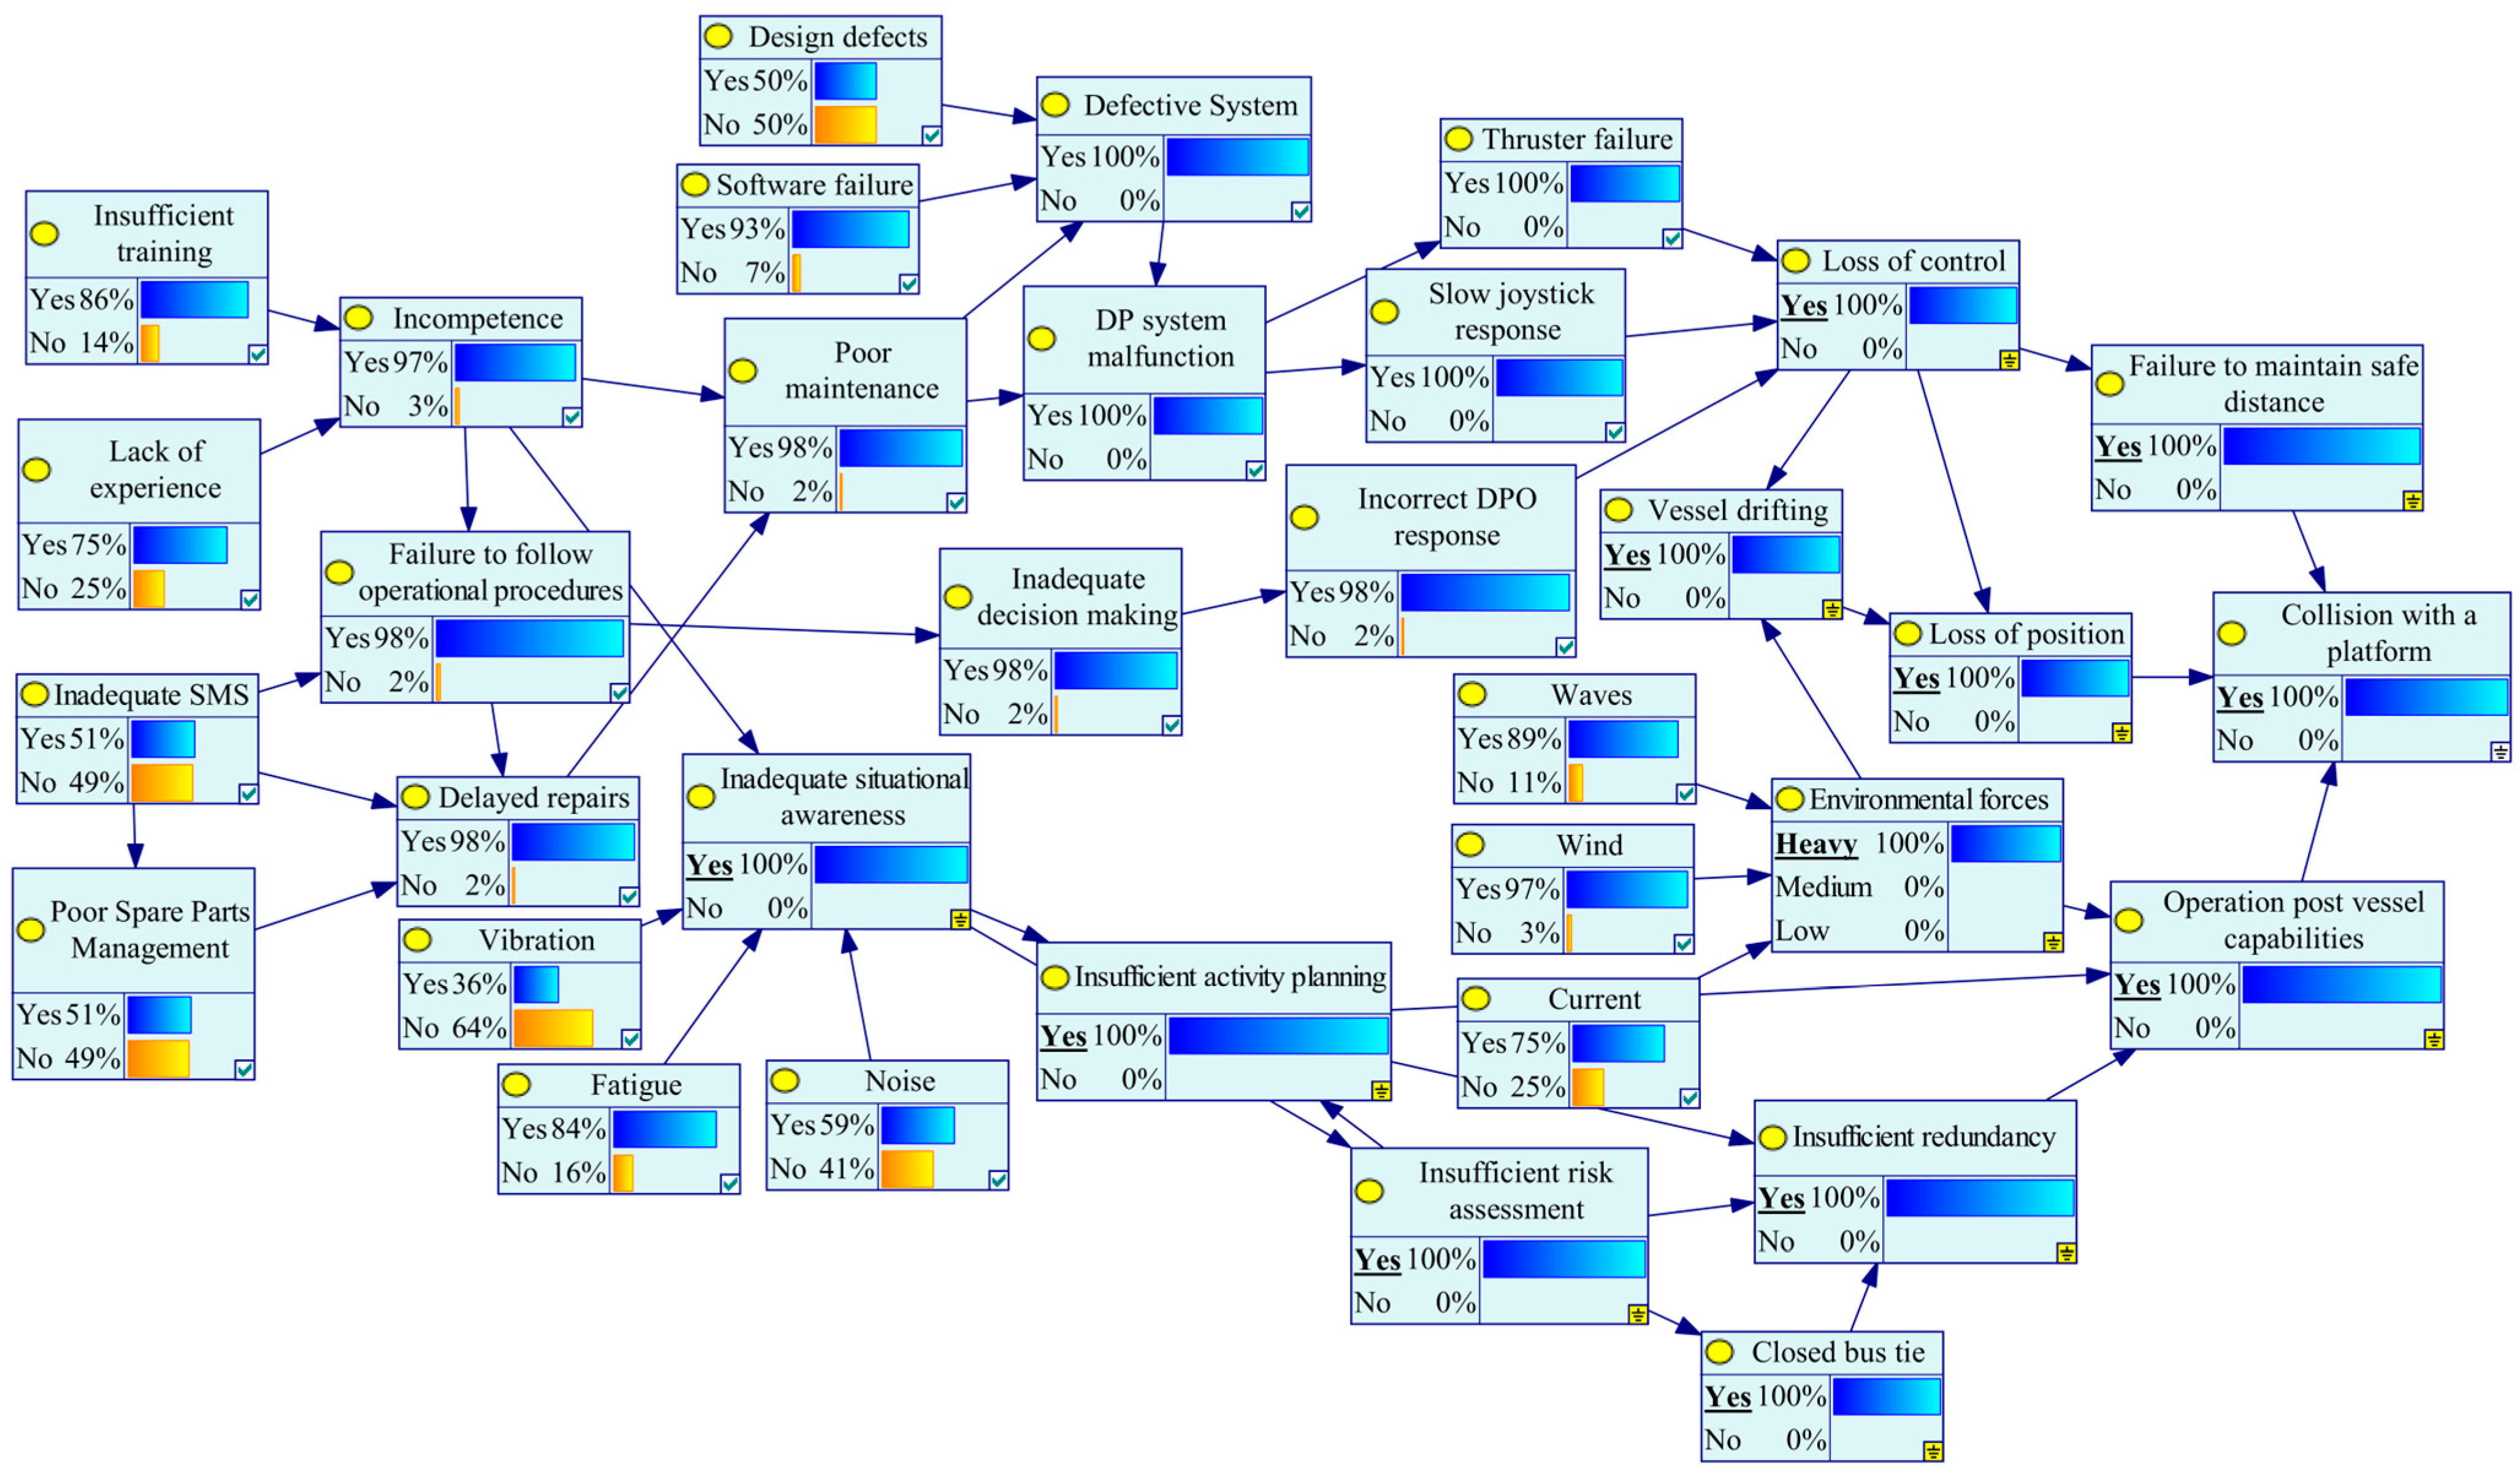
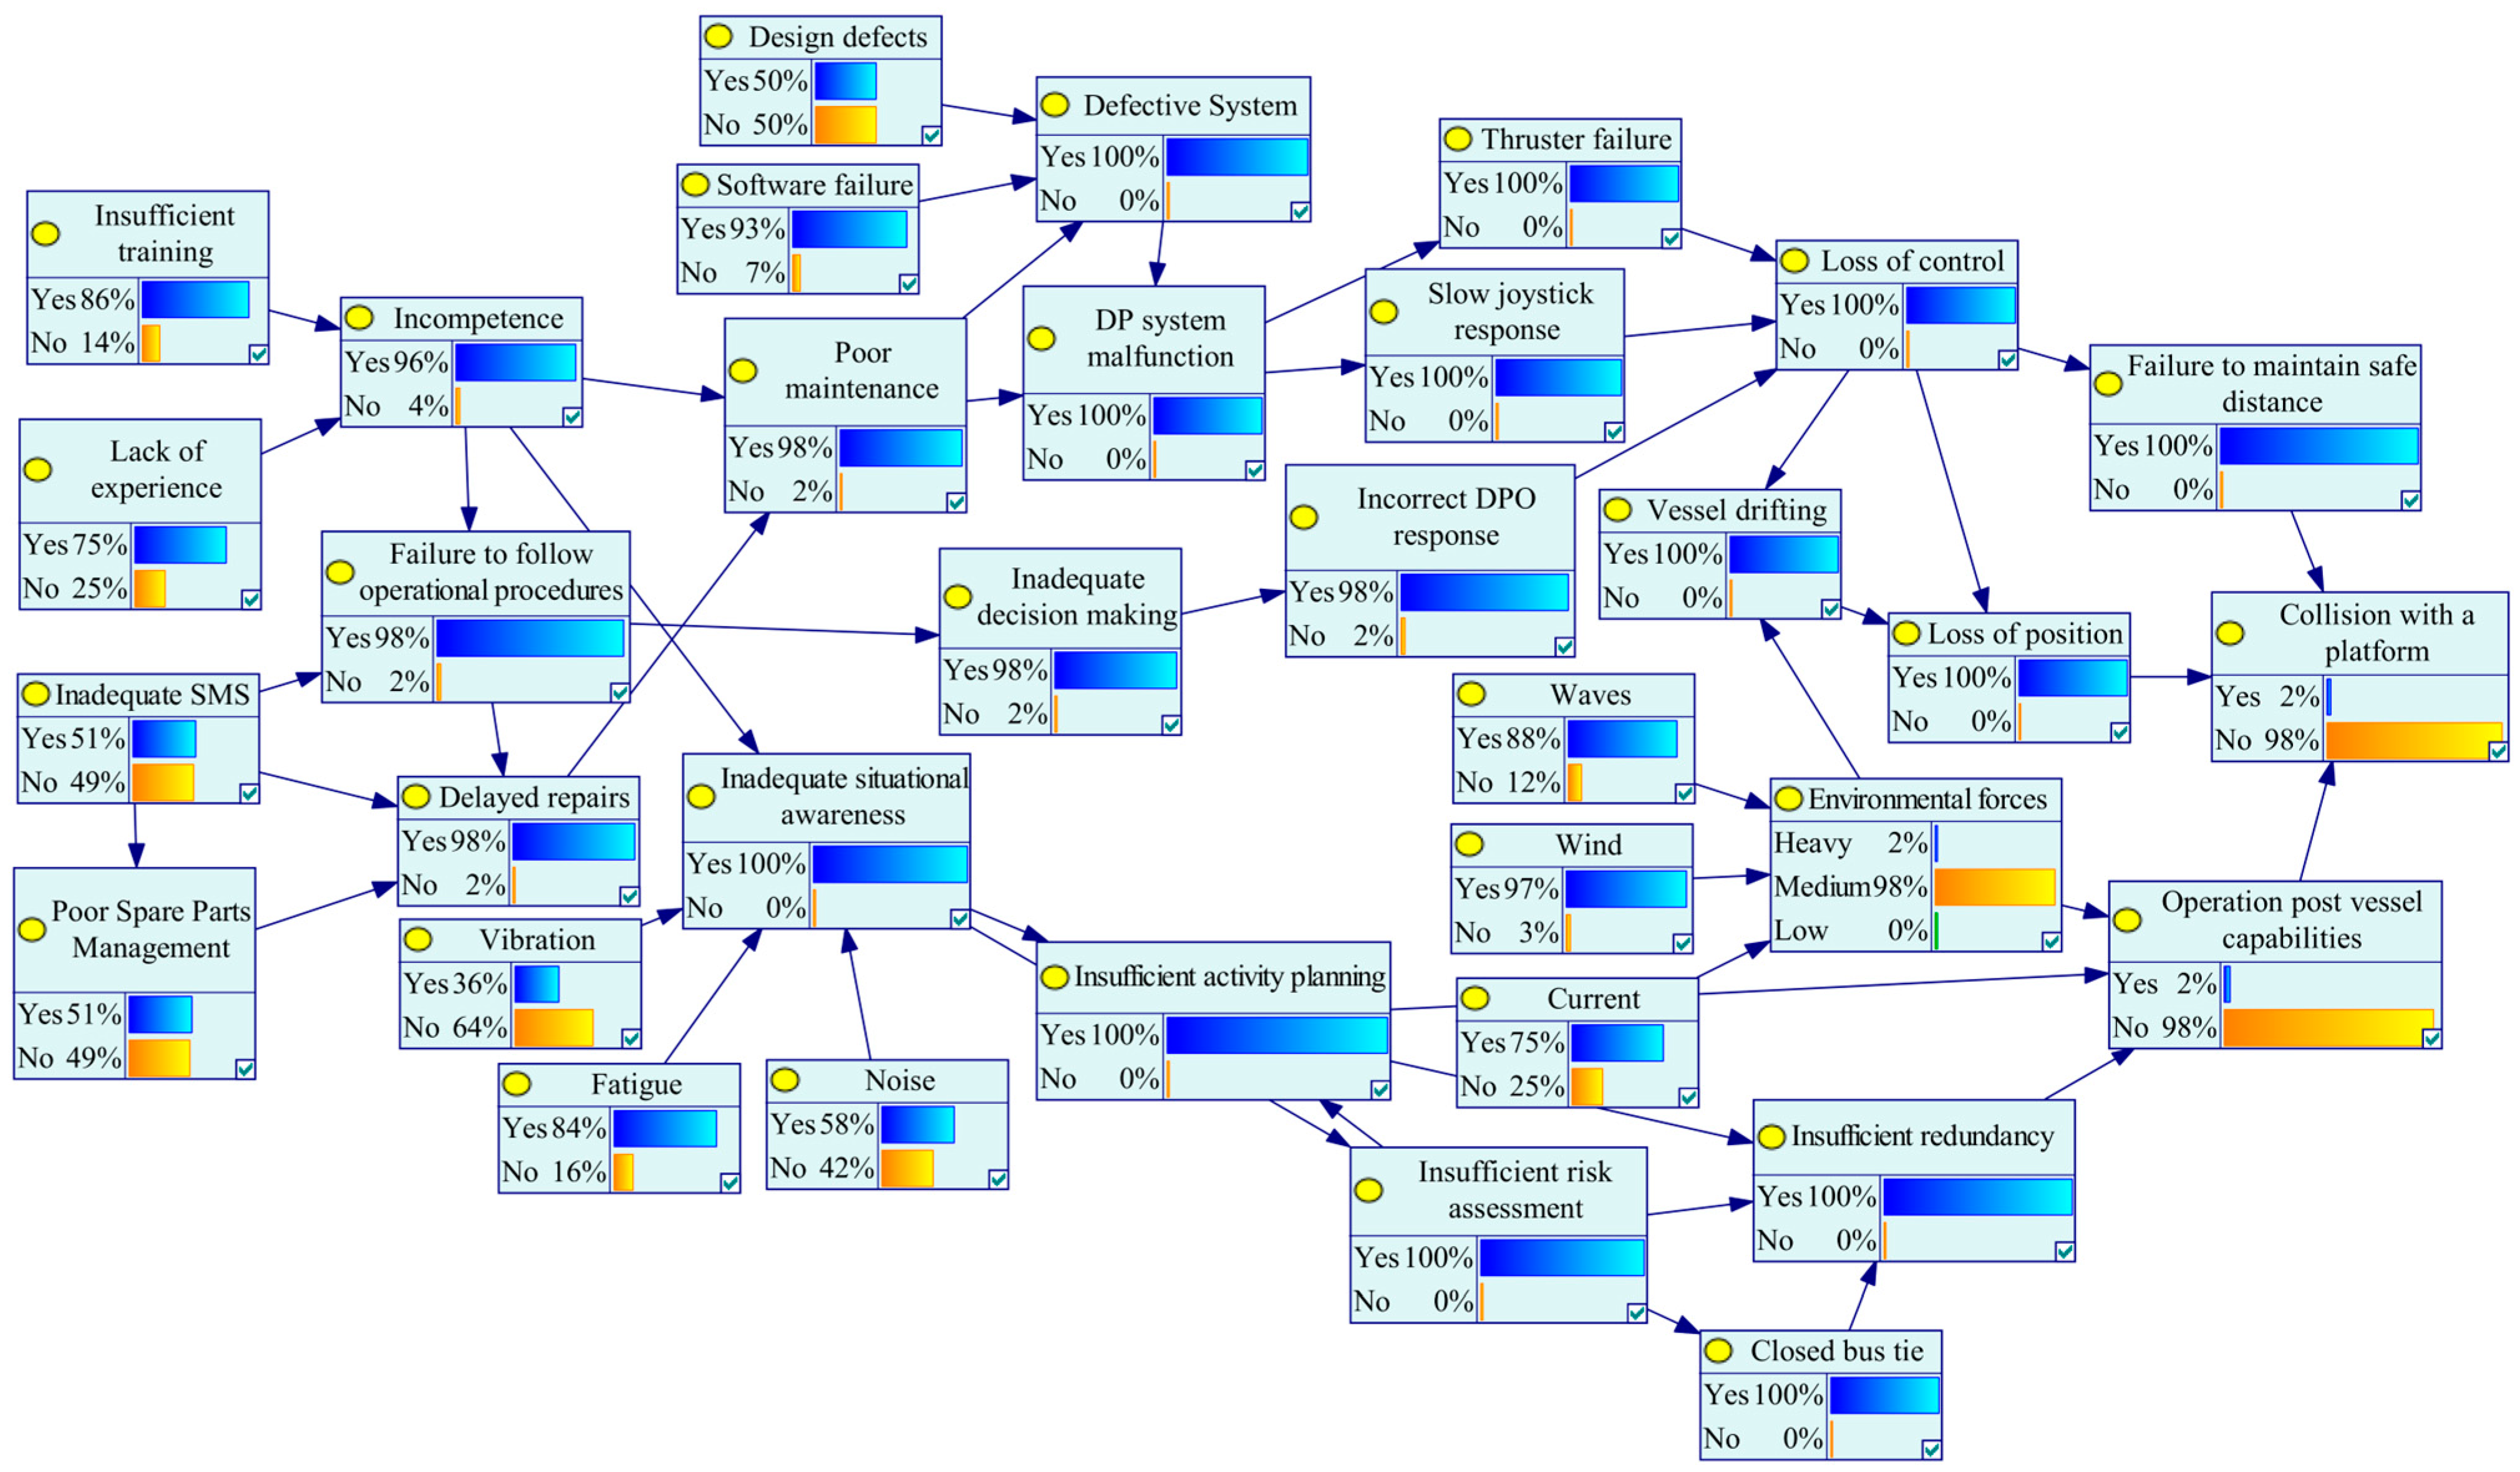
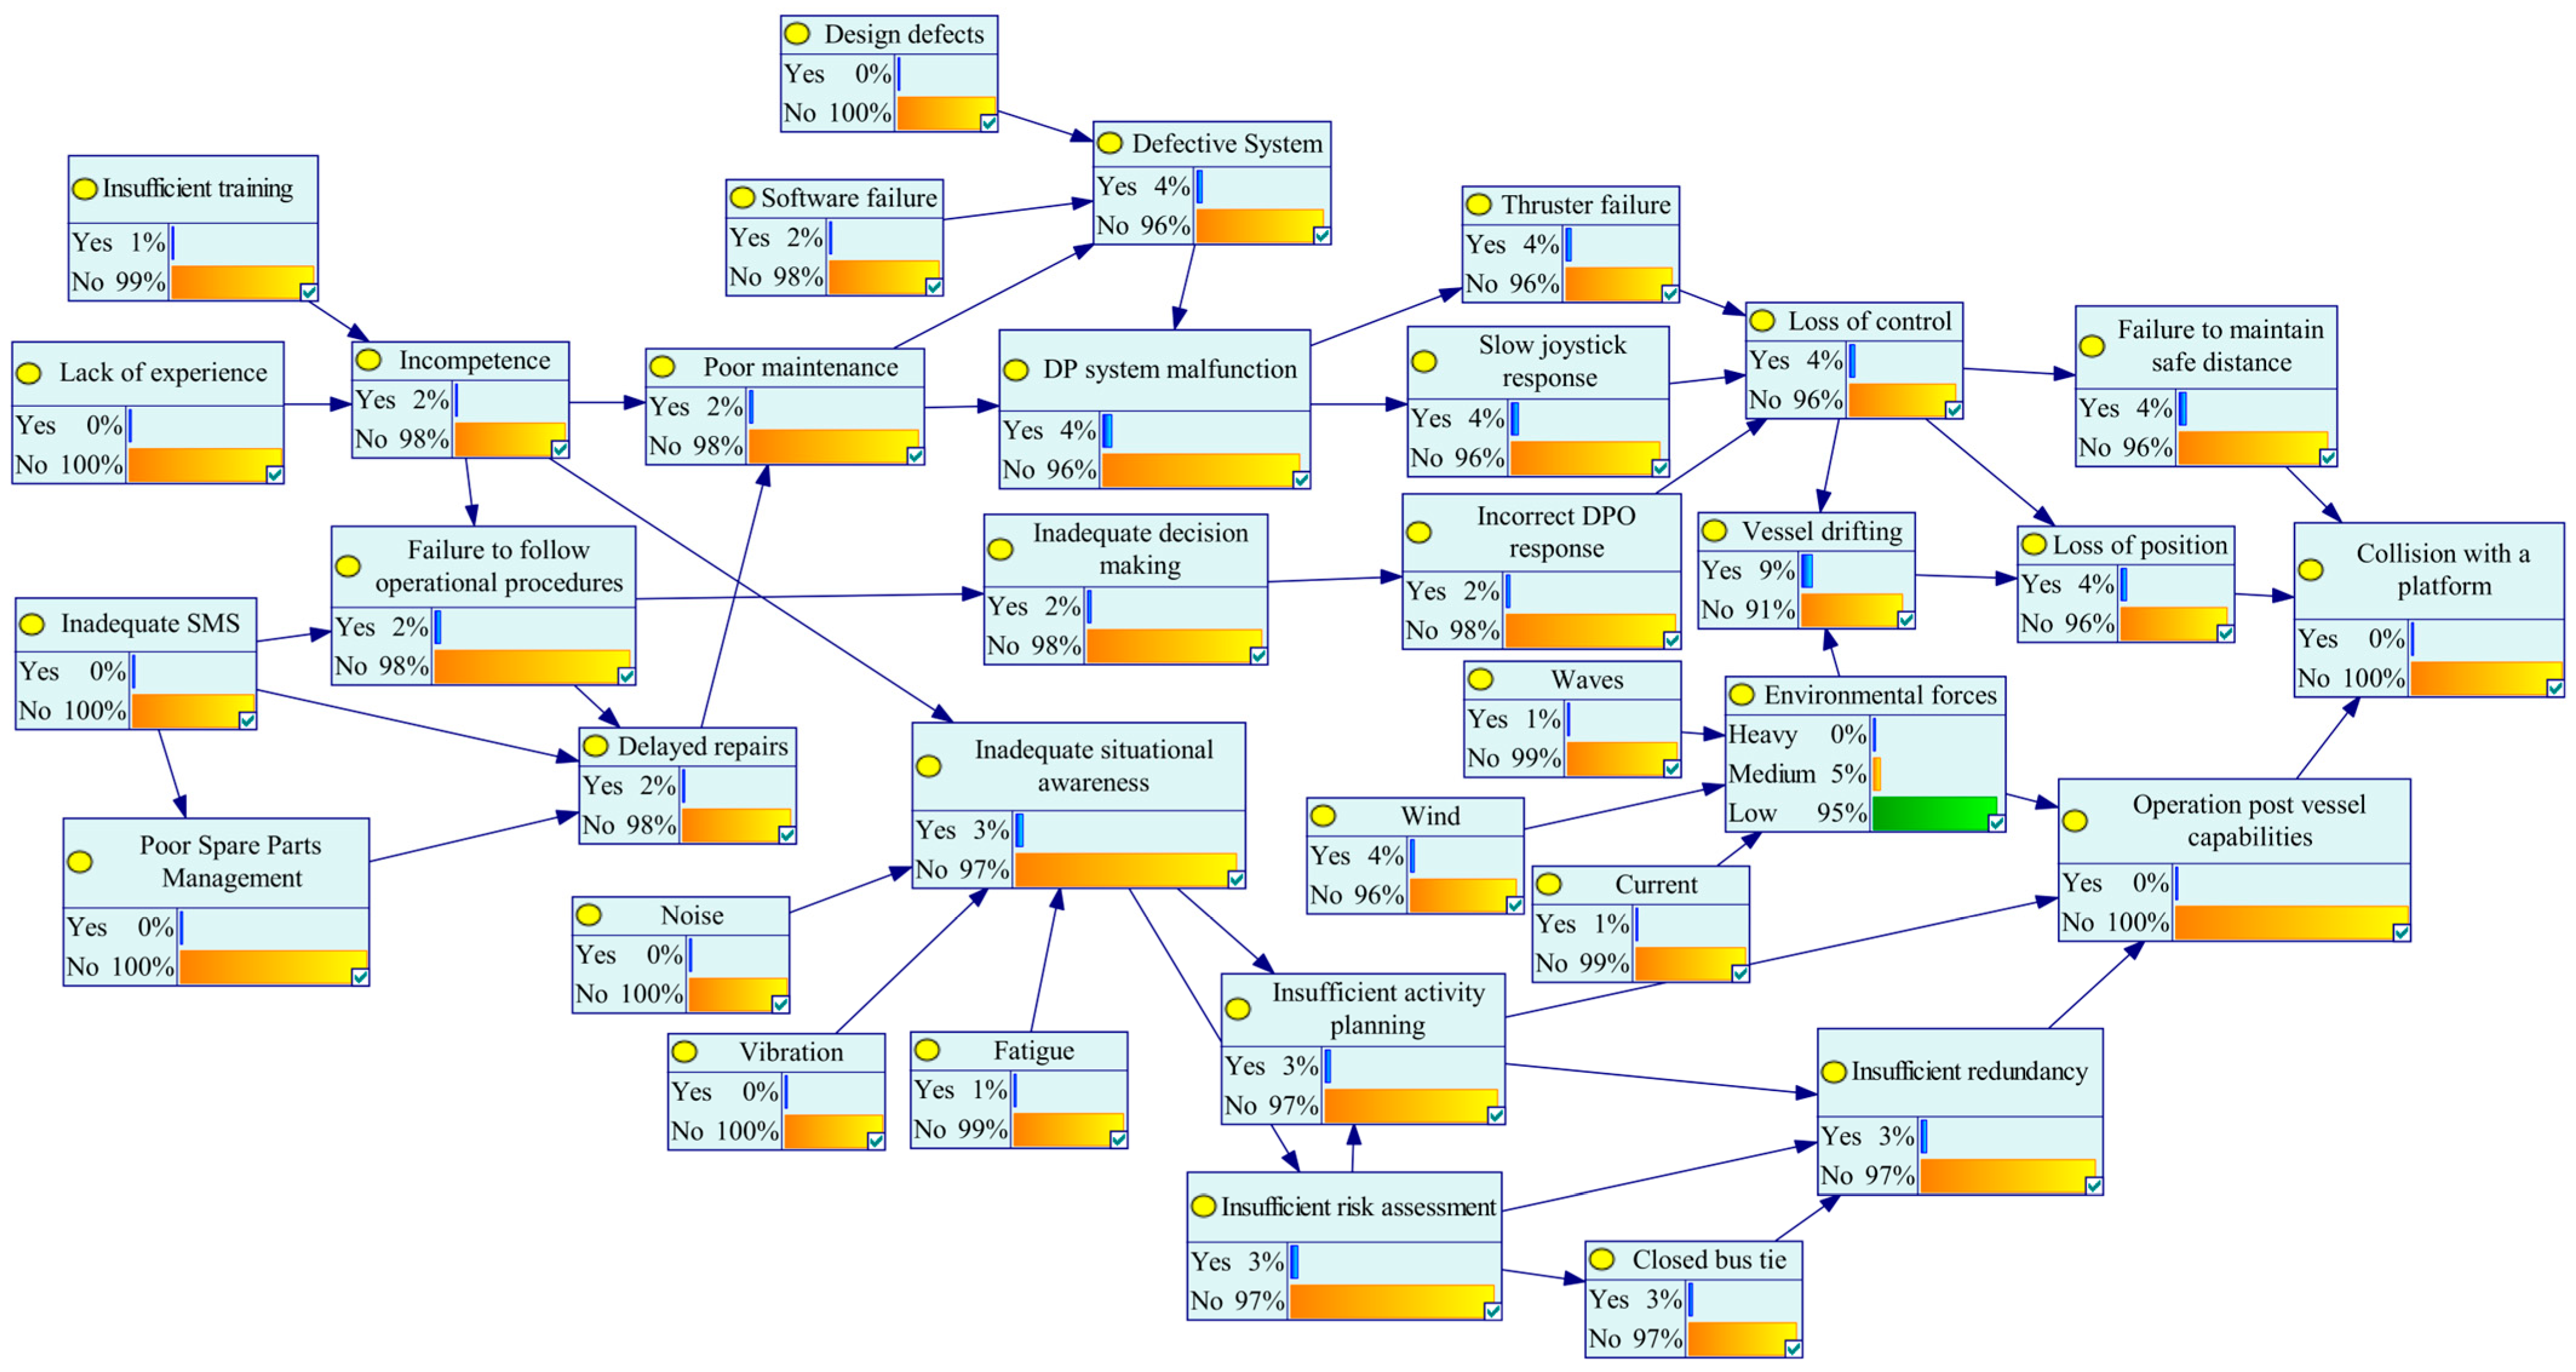
Figure 4 and Figure 5 summarise BN initialisation under each aggregation approach. Figure 4 shows the basic event prior values populated in the BN using DST, while Figure 5 shows the corresponding prior values populated using Fuzzy AHP. The corresponding GeNIe model files used for these calculations are provided in the Supplementary Materials (Models S1 and S2).
The BN basic event nodes were populated according to the method used, and the results are reported below.
For the DST calculation, refer to Figure 4.
Using the DST-derived priors, the Bayesian network estimated a top-event (“collision with a platform”) probability of 0.023232778 (Yes), corresponding to 0.97676722 (No). This value is used as a comparative scenario indicator alongside the contributor ranking and diagnostic inference results.
For Fuzzy AHP calculation, refer to Figure 5.
Using the Fuzzy AHP-derived priors, the Bayesian network estimated a top-event probability of 2.3147381 × 10⁻⁵ (Yes), corresponding to 0.99997685 (No). As above, this probability is interpreted comparatively within the model outputs rather than as a fleet-level frequency estimate.
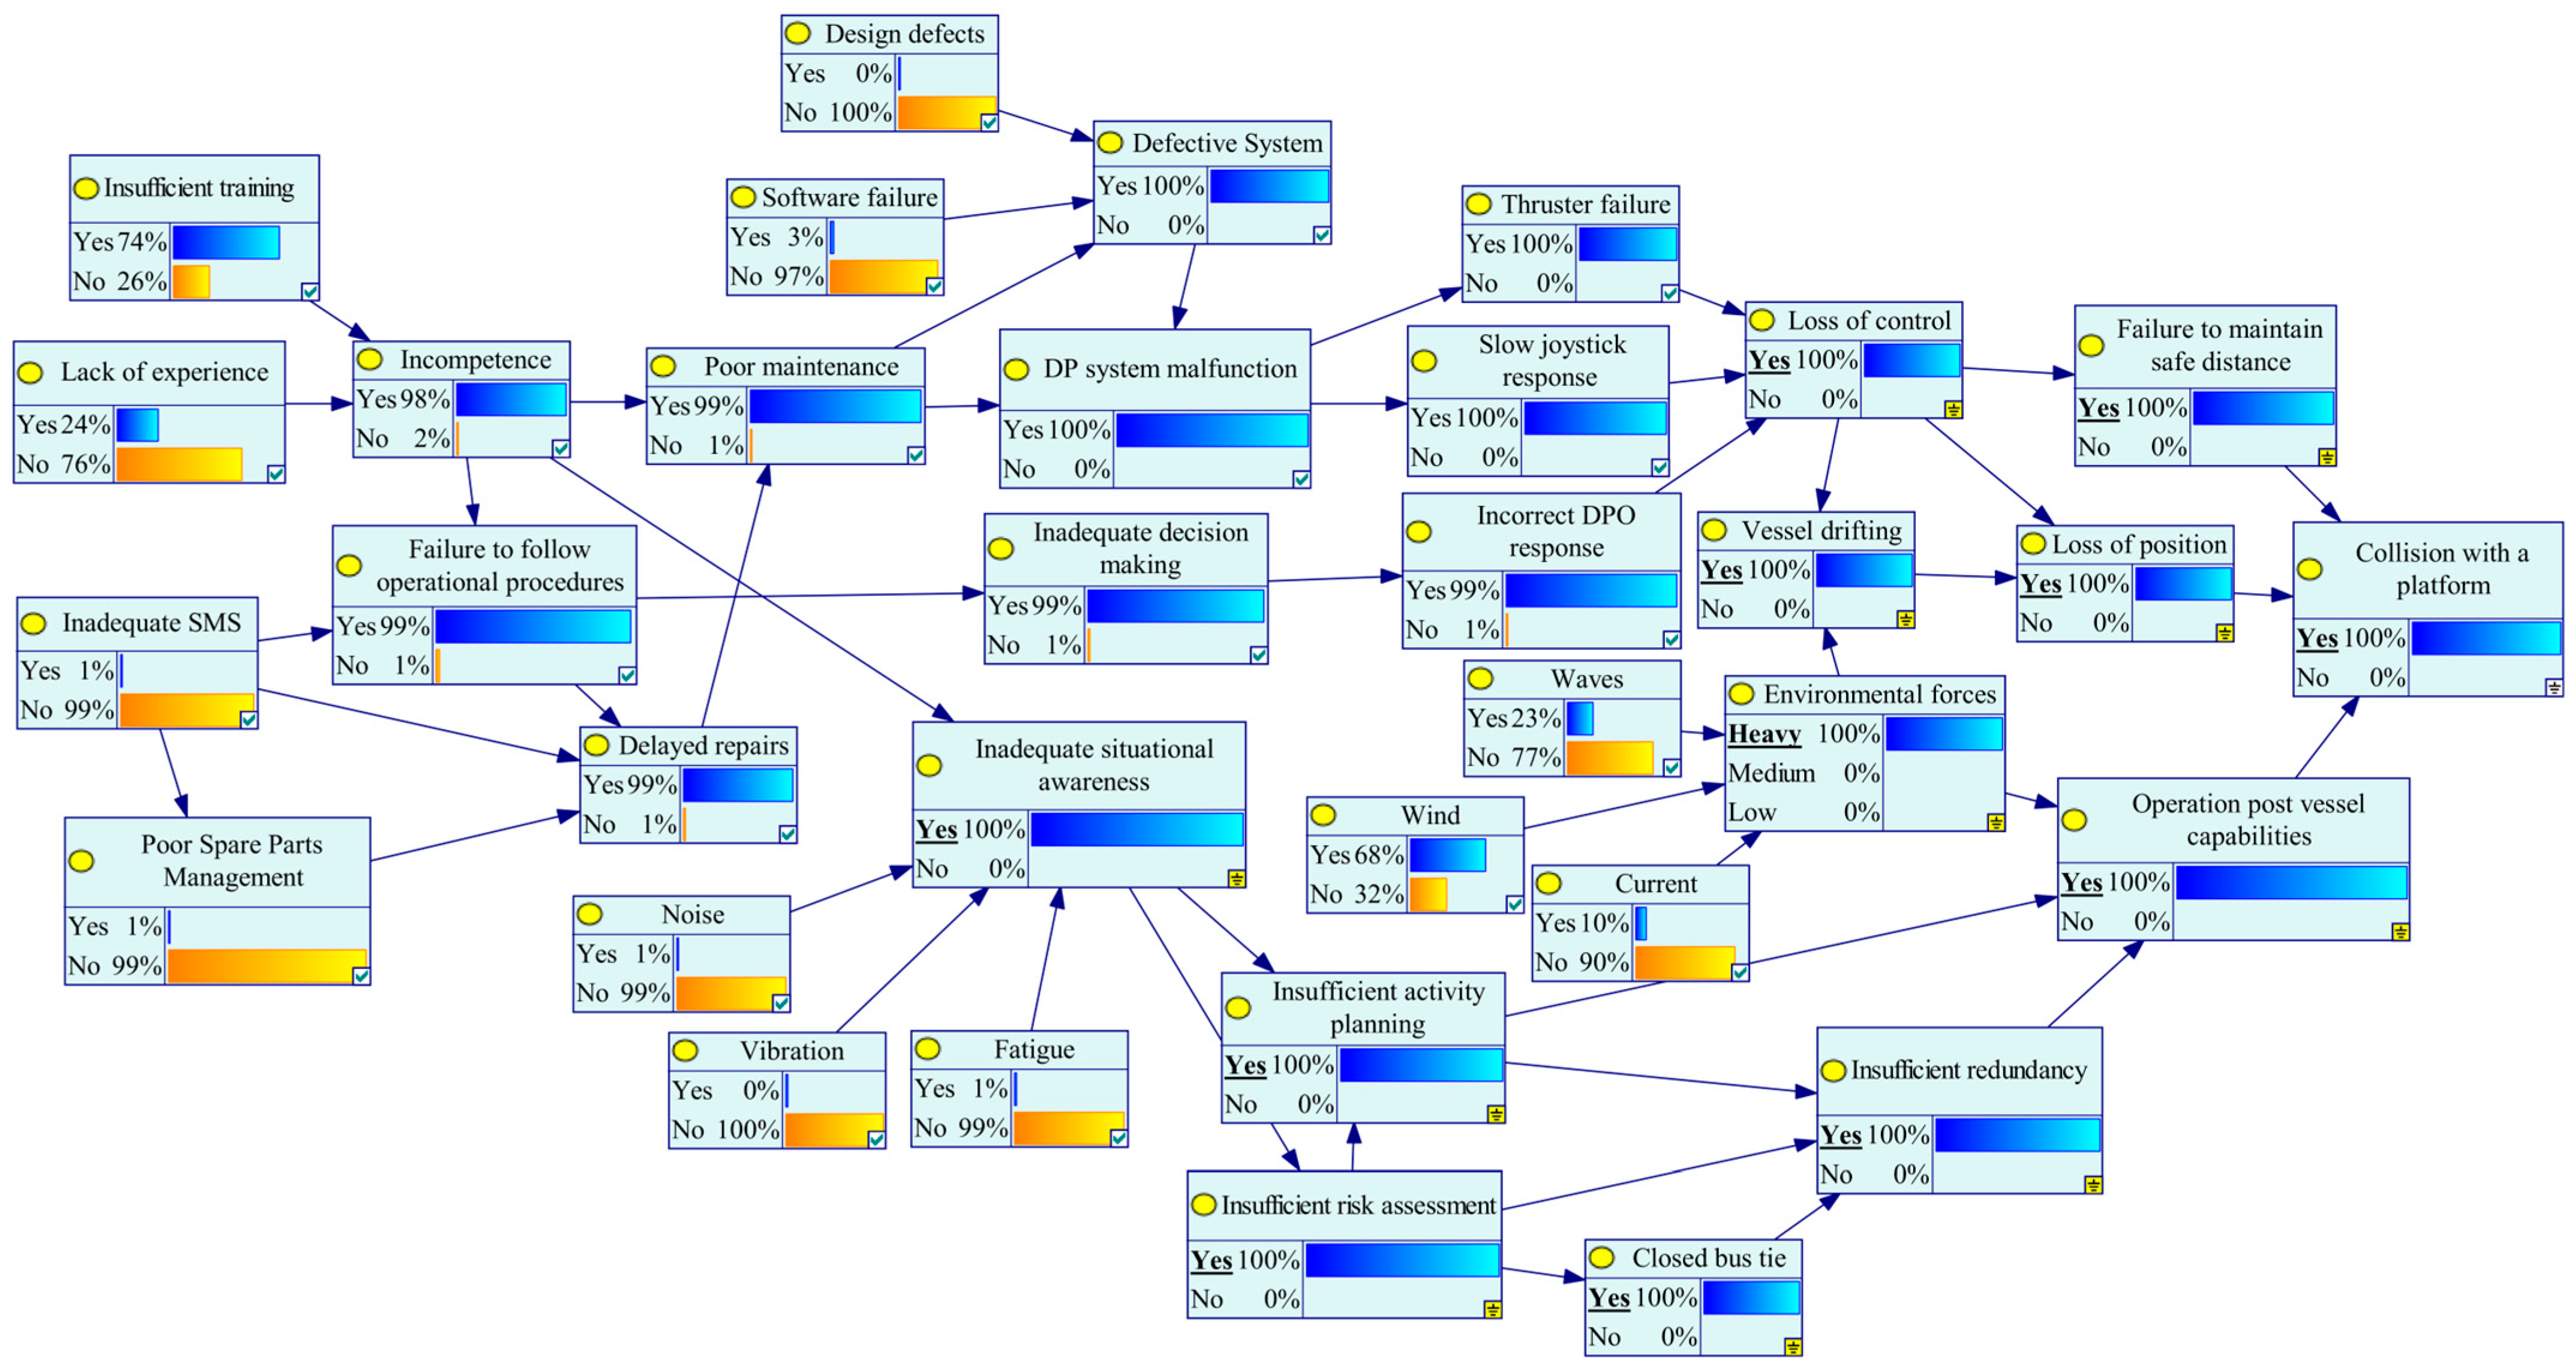
Figure 6 and Figure 7 present the diagnostic (backward) inference results obtained by setting the top event to 100% evidence and observing posterior increases in contributing basic events, highlighting the most diagnostically influential contributors under DST and Fuzzy AHP priors. After this, backward analysis was conducted, assigning evidence to the top event as it happened with probability 100%.
For DST (Figure 6), the analysis shows the following.
For the Fuzzy AHP method (Figure 7), the analysis shows the following.

4. Discussion

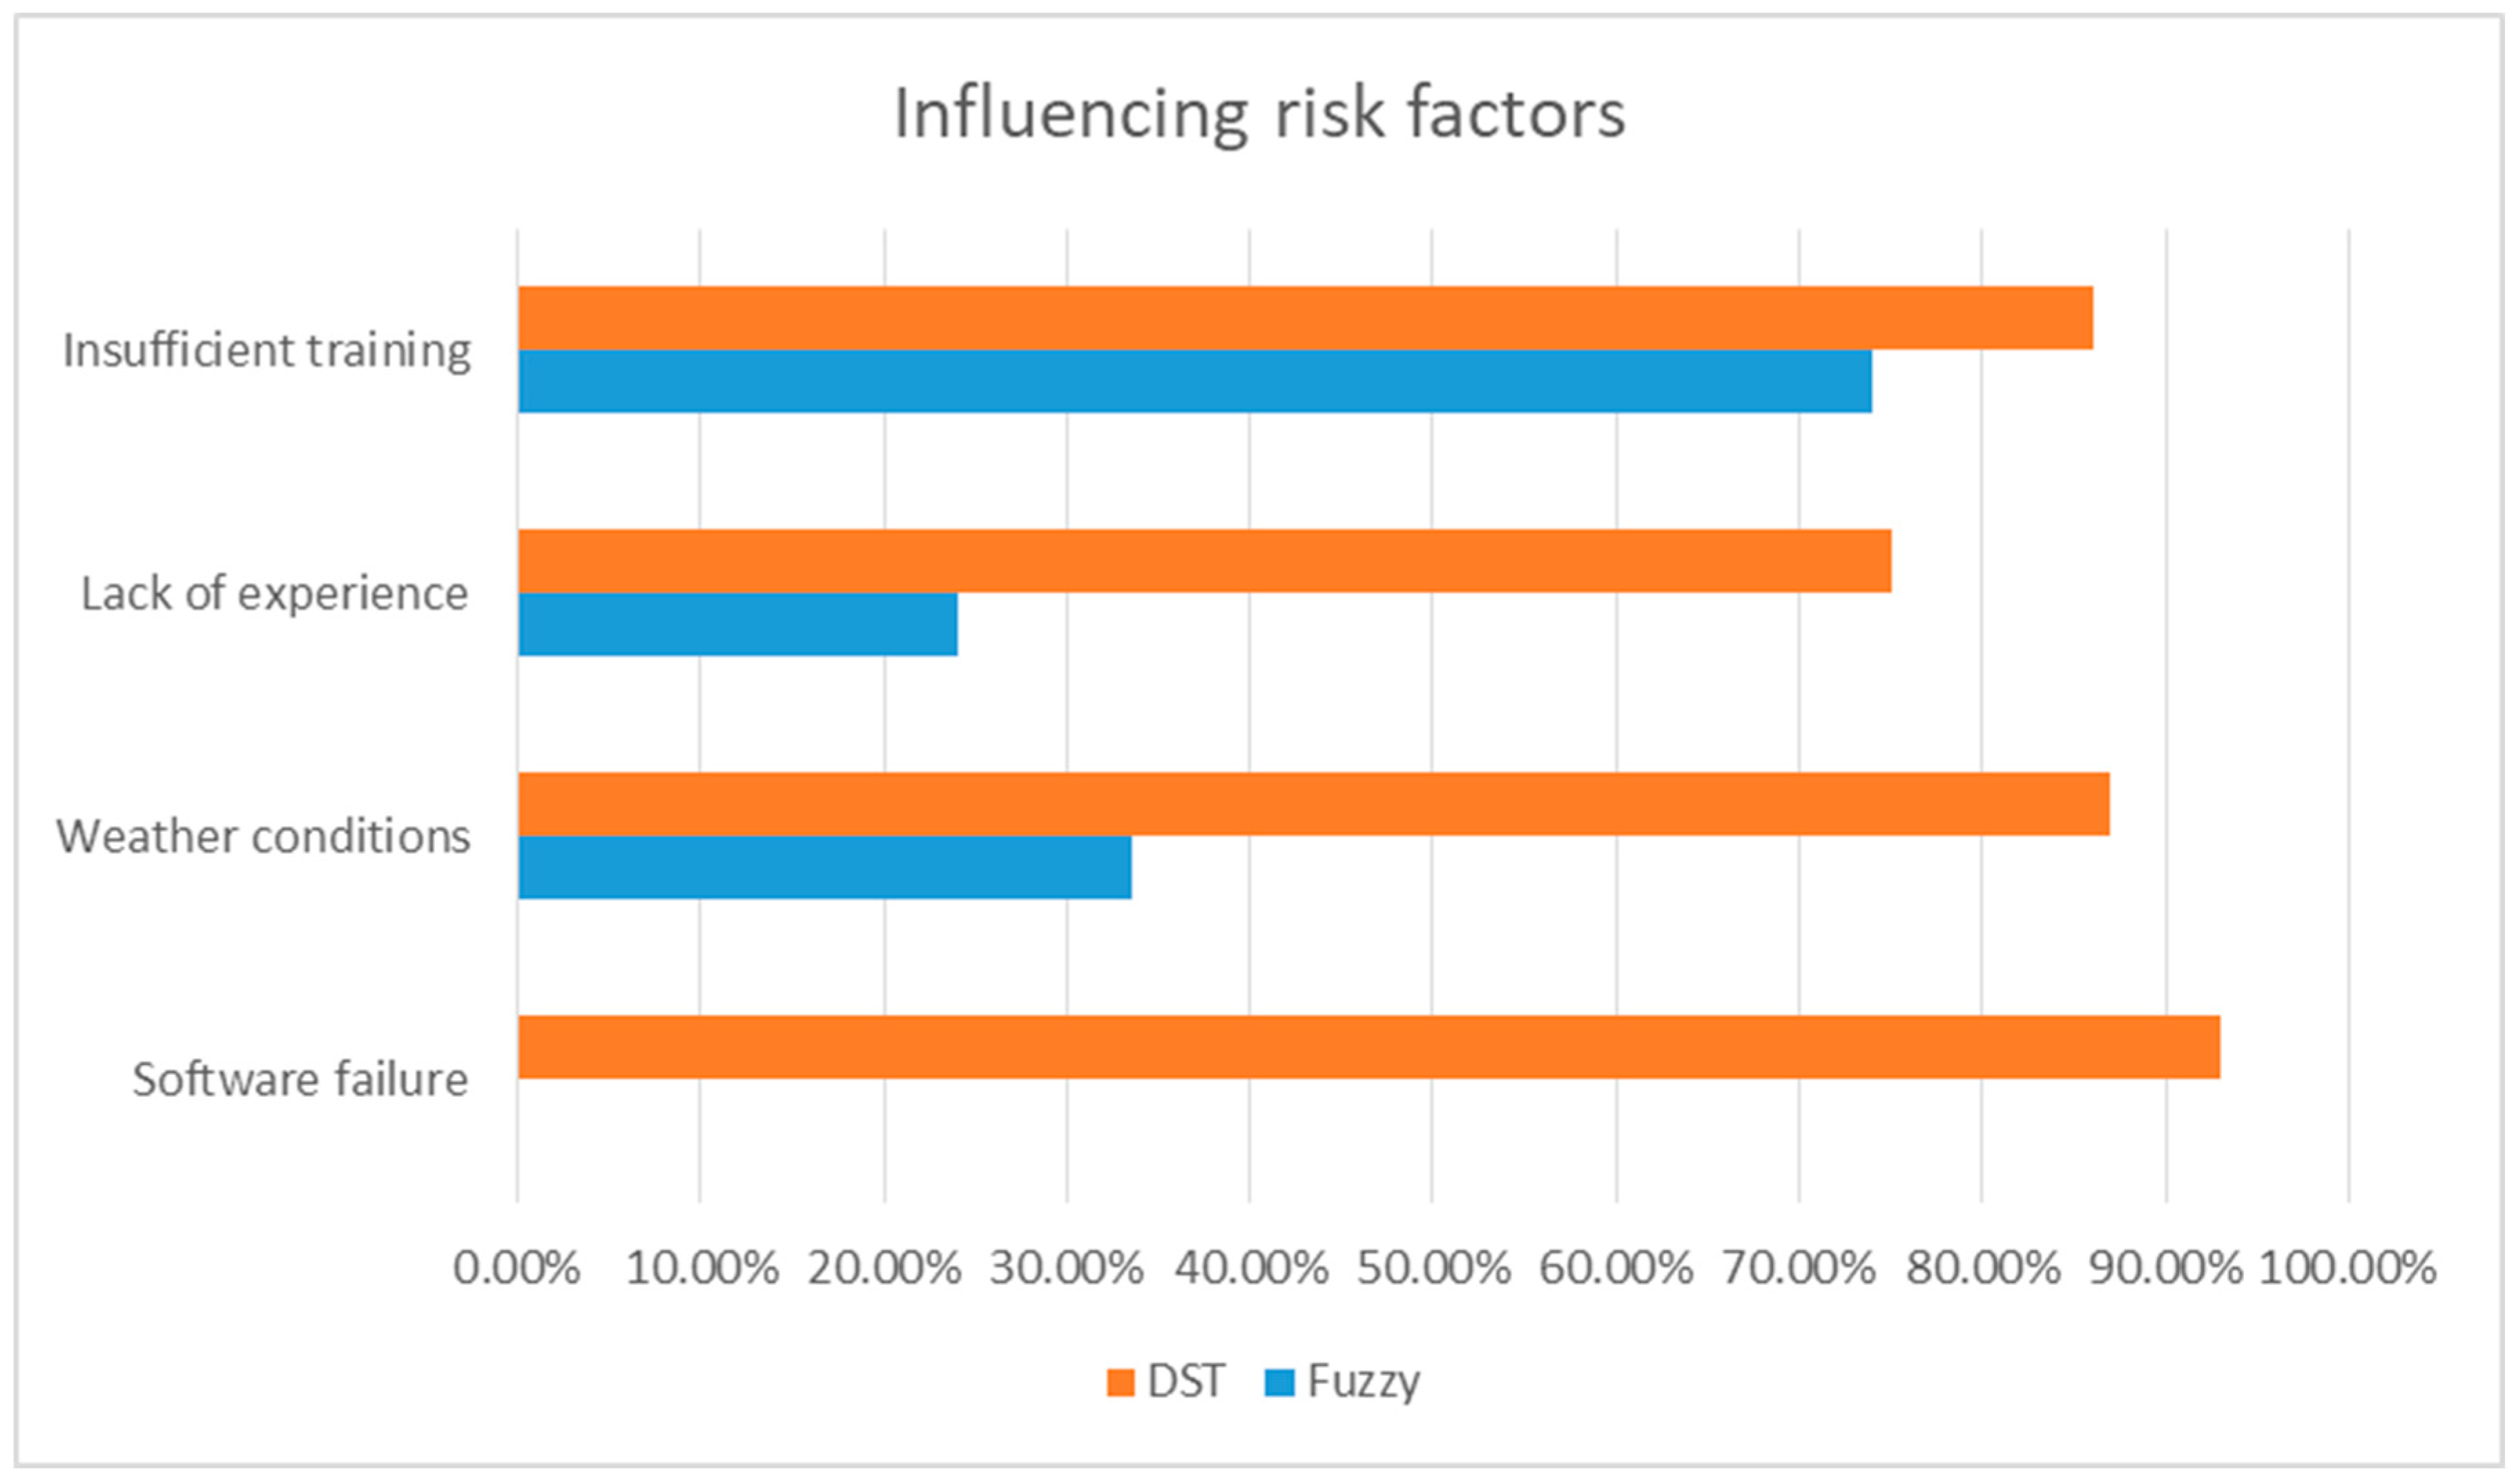
In this work, backward analysis was employed to trace the root causes of critical events in DP operations. By analysing the factors contributing to these top-level events, the analysis identified the most influential drivers of failure, such as insufficient training, lack of experience, adverse weather conditions, poor SMS implementation, working environment factors and equipment failures. This supported the prioritisation of mitigation strategies by focusing on high-impact factors.
For example, the analysis using the DST method revealed how personnel incompetence, the possibility of equipment failures and poorly implemented SMS could propagate through the system and lead to major incidents. By contrast, the Fuzzy AHP method highlighted human-centred contributors, with insufficient training, operator experience, and adverse weather conditions emerging as dominant factors. In DP operations, fatigue can reduce vigilance and situational awareness (i.e., the perception/comprehension of system and environmental state), increasing the likelihood of delayed or inappropriate operator actions.
The main contributing factors are summarised in Table 6 below.
Figure 8 visualises the dominant contributors identified with backward analysis and ranking across both methods.
Backward analysis can support the validation of the probabilistic models, such as Bayesian networks, by confirming that key contributing factors aligned with historical data and expert opinion. Conceptually similar to sensitivity analysis, backward analysis in this context evaluated how individual factors influenced the final outcomes and traced the pathways and dependencies leading to the events. This approach enhanced the robustness of the risk assessment and provided actionable insights for reducing DP operational risks.
These findings are consistent with previous analyses of DP incidents and offshore human performance, which report training/competence gaps, environmental loading, and software/maintenance issues as recurrent drivers of loss-of-position events [2,4,5]. The results therefore align with the broader evidence base while adding a transparent, updateable probabilistic framing.
Differences in rankings and top-event probability estimates between DST and Fuzzy AHP reflect their distinct uncertainty semantics and aggregation mechanisms. DST combines evidence through basic probability assignments and yields pignistic probabilities that retain explicit mass for ignorance and can be more conservative when evidence strongly supports a hypothesis [13]. By contrast, Fuzzy AHP derives relative importance through pairwise comparisons and defuzzification, and the adopted possibility-to-probability mapping can lead to different effective prior probabilities for BN initialisation [9]. Accordingly, we interpret the absolute top-event probability values as method-dependent scenario indicators while placing greater emphasis on the consistent identification and ranking of dominant contributors across methods. Therefore, we treat absolute probability values as method-dependent and interpret consistent dominant contributors across both methods as the most robust finding for prioritisation.
Expert elicitation can be affected by cognitive and organisational biases (e.g., anchoring, availability, and overconfidence) and by the limited number of experts available for specialised DP operations. To mitigate these effects, we intentionally included experts with diverse roles and backgrounds (regulators, academics, and operators), used a standardised linguistic probability scale, and applied uncertainty-handling aggregation (DST) that explicitly represents disagreement and ignorance rather than forcing precise point estimates. Additionally, we report results under both DST- and Fuzzy AHP-derived priors; agreement in dominant contributors across these two uncertainty treatments provides a pragmatic sensitivity check for the case application.
Given the reliance on expert-derived priors, the absolute value of the top-event probability should be interpreted as scenario- and assumption-dependent. In practice, the framework is most robust for comparative purposes—identifying dominant contributors, comparing mitigation options, and supporting diagnostic inference—while the model can be progressively calibrated as additional empirical evidence (e.g., DP logs or simulator datasets) becomes available.
This study has several limitations. It demonstrates the proposed framework using a single representative case application and a small expert panel; therefore, the results remain sensitive to elicitation subjectivity, potential expert biases (e.g., anchoring, availability, and overconfidence), and simplified CPT assumptions (canonical OR/AND parameterisation). In addition, the uncertainty treatments introduce method-specific constraints: DST outcomes depend on how basic probability assignments are specified and combined, and the pignistic transformation used to initialise the BN can yield method-dependent absolute probability levels (particularly when evidence is conflicting or imprecise). Likewise, Fuzzy AHP relies on subjective pairwise judgements and defuzzification choices, which can influence relative weighting and downstream priors. The BN structure is grounded in incident narratives, which vary in completeness and may not explicitly state latent organisational precursors. Accordingly, the reported absolute probability levels should be interpreted as scenario-specific indicators until the framework is calibrated and validated using larger multi-incident datasets and operational evidence (e.g., DP logs or simulator data).
Future work could integrate real-time operational data streams (e.g., DP logs and environmental feeds) with expert judgement to refine priors and CPTs, validate the framework across multiple scenarios and vessel classes, and extend the BN with additional human-reliability detail, contributing to the broader goal of improving maritime safety systems. In addition, future work could make use of data from near-real-world (e.g., ship bridge simulators) and real-world (i.e., onboard ships) studies to collect data for use in validating the model presented.
The framework offers practical value for DP safety management by highlighting which human and organisational contributors should be prioritised (e.g., training and competence, procedural compliance, and SMS/maintenance assurance). It also enables scenario-based diagnostic inference, which can be used to support training design, incident learning, and operational decision support. In theoretical terms, this study contributes an auditable BN-based approach that integrates two uncertainty-handling elicitation treatments (DST and Fuzzy AHP) under limited-data conditions, and it clarifies how method-dependent priors influence inference while preserving causal interpretability.
Artificial intelligence (AI) can further strengthen this line of work by enabling the data-driven updating of Bayesian network parameters and the timelier detection of emerging risk patterns. For example, machine learning models can be used to learn prior and conditional probabilities from DP logs, alarm histories, and simulator datasets while remaining compatible with the causal structure captured in the BN. AI-based anomaly detection could provide the early warning of abnormal thruster or sensor behaviour, and natural language processing could assist in extracting structured causal factors from incident narratives to accelerate model updates. These AI capabilities are best viewed as complementary to rather than replacements for expert judgement and causal modelling—particularly in safety-critical contexts where interpretability and auditability are essential.
Although this paper demonstrates the approach using a single personnel-transfer DP incident, the framework is scenario-agnostic and can be transferred to other DP operations by re-defining the causal structure, updating the BN topology/CPTs, and re-running the elicitation for scenario-specific factors. The adaptive BN formulation supports progressive validation across multiple incidents and vessel classes as further evidence is incorporated. Model results should be used to inform future development of DP training programmes for seafarers in order to reduce the incidence of DP operational failures.

5. Conclusions

This work provides a comprehensive analysis of human factors contributing to DP operational failures through a hybrid methodology integrating Fuzzy AHP, Dempster–Shafer theory, and Bayesian networks. By leveraging these advanced probabilistic tools, we captured the inherent uncertainties in expert judgements, quantified risks, and modelled complex interdependencies among contributing factors.
The analysis of the case study highlighted the multifaceted nature of DP incidents. The event demonstrates the critical role of environmental and training-related factors such as insufficient operator training and insufficient experience. These deficiencies propagated through the DP system, significantly increasing the likelihood of position loss and eventual collision.
Key findings revealed that human factors—including insufficient training, poor decision making, and fatigue—remain primary contributors to DP failures. Technical issues such as software defects and delayed repairs exacerbated these risks, particularly in challenging environmental conditions. The integration of Fuzzy AHP and DS theory allowed for the quantification of uncertainty between experts’ opinions, while Bayesian networks provided dynamic probability assessments and predictive capabilities.
To mitigate these risks, recommended measures include (i) targeted, scenario-based DP training to address competence gaps and improve situational awareness; (ii) strengthening SMS practices to ensure timely maintenance and activity-specific risk assessment; and (iii) integrating real-time environmental monitoring and decision support to maintain environment-aware operating envelopes.
This study’s methodology offers a robust framework for analysing DP-related incidents, emphasising the importance of integrating probabilistic methods with human reliability analysis. Future research should focus on expanding datasets, incorporating real-time operational data, and refining models to further enhance the predictive accuracy and reliability of DP risk assessments. Such efforts may contribute to safer and more efficient maritime operations, reducing the economic, environmental, and safety impacts of DP incidents.


Supplementary Materials

The following supporting information can be downloaded at: https://www.mdpi.com/article/10.3390/jmse14050462/s1: Model S1: Model_S1_BN_Fuzzy (GeNIe .xdsl); Model S2: Model_S2_BN_DST (GeNIe .xdsl).

Author Contributions

Conceptualisation, F.O.; methodology, M.C. and F.O.; validation, M.C.; formal analysis, M.C., F.O., S.A. and R.B.; investigation, M.C., F.O., S.A. and R.B.; data curation, M.C.; writing—original draft, M.C.; writing—review and editing, F.O., S.A. and R.B.; supervision, F.O. All authors have read and agreed to the published version of the manuscript.

Funding

This research received no external funding.

Data Availability Statement

The original contributions presented in this study are included in the article/Supplementary Materials. Further inquiries can be directed to the corresponding author.

Acknowledgments

The authors acknowledge the support of the ERASMUS+ Programme. We thank Constanta Maritime University as the sending institution and the Fisheries and Marine Institute of Memorial University of Newfoundland as the receiving organisation for facilitating mobility and institutional support related to this work.

Conflicts of Interest

The authors declare no conflicts of interest.

Abbreviations

The following abbreviations are used in this manuscript:
AIArtificial Intelligence
AHPAnalytic Hierarchy Process
ASOGsActivity-Specific Operating Guidelines
BPABasic Probability Assignment
BNBayesian Network
BNPBest Non-Fuzzy Performance
CoACentre of Area
CPTConditional Probability Table
DAGDirected Acyclic Graph
DPDynamic Positioning
DPODynamic Positioning Operator
DSTDempster–Shafer Theory
FMEAFailure Mode and Effects Analysis
IMCAInternational Marine Contractors Association
PAPPersonnel Access Platform
PlPlausibility Function
SMSSafety Management System

Appendix A

Table A1. Linguistic probability scale for DS theory.
Linguistic ProbabilityNumerical Probability
NH (not happening)0
CL (certainly low probability)0.1
VL (very low probability)0.2
L (low probability)0.3
ML (medium–low probability)0.4
M (medium probability)0.5
MH (medium–high probability)0.6
H (high probability)0.7
VH (very high probability)0.8
CH (certainly high probability)0.9
HA (event happening)1
Table A2. Linguistic probability table for DS theory.
CodeName of the EventExpert 1Expert 2Expert 3Expert 4Expert 5Expert 6
P1Inadequate SMSMLMLMLM
P2Poor spare part managementMHMMLMHM
P3Delayed repairsHMHMHMHMH
P4Poor maintenanceLMLMLL
P5Insufficient activity planningHMHMHMHHH
P6Insufficient risk assessmentHHLMHML
P7Insufficient trainingMHHMMHMH
P8IncompetenceLMLVLMML
P9Failure to follow operational proceduresMMHMLLMH
P10Incorrect DPO responseMHHHMHMM
P11Failure to maintain safe distanceHMHMHMMH
P12Inadequate decision makingMMMHMHMH
P13Inadequate situational awarenessMHHMMHMHM
P14FatigueHHLLMMH
EQ1Software failureMHMHVHHMM
EQ2Defective systemLMMLMLVL
EQ3Design defectsMMLLMLML
EQ4DP system malfunctionMHMMLL
EQ5Thruster failureMHMMHMMHM
EQ6Slow joystick responseLMLMLMLVL
EQ7Insufficient redundancyVLMLLLVLML
EQ8Closed bus tieMLMMLLM
EQ9Loss of controlMMLMMLM
EQ10Loss of positionLMLMLMVL
V1Collision with a platformMLLMLML
V2Operation beyond vessel capabilitiesMLMMLMM
V3Vessel driftingMMHHMHH
Env1WindHHVHMHMHVH
Env2CurrentMMHMMMM
Env3WavesMHMHMHHM
Env4Environmental forcesVHHMHHMHMH
Env5NoiseMLMLMLH
Env6VibrationLMLMLML
Table A3. Initial probability results.
MethodFuzzy AHPDST
Factors Bet (P) YesBet (P) NoBet (P) Y/N
P10.0031550.5070820.4929180.00283286
P20.0045890.8016530.1983470.00826446
P30.0111320.9172660.0827340.00359712
P40.0015650.3278240.6721760.00275482
P50.0119770.9160580.0839420.00364964
P60.0038340.837270.162730.00262467
P70.008670.8646790.1353210.00229358
P80.0010760.2589290.7410710.00892857
P90.0044440.7474490.2525510.00255102
P100.0120130.9265010.0734990.0010352
P110.0100440.9048580.0951420.00202429
P120.0070810.7036140.2963860.00481928
P130.0074850.8665160.1334840.00226244
P140.0036120.837270.162730.00262467
EQ10.0156030.9332630.0667370.00105932
EQ20.0022320.5849510.4150490.00970874
EQ30.002030.50.50.00970874
EQ40.0044910.7941990.2058010.00138122
EQ50.0073930.8123520.1876480.0023753
EQ60.0019970.4540680.5459320.00524934
EQ70.0009720.2196260.7803740.0046729
EQ80.0034170.5070820.4929180.00283286
EQ90.0026960.5849510.4150490.00970874
EQ100.0021080.443850.556150.00534759
V10.0018050.3622050.6377950.00524934
V20.003640.6281410.3718590.00502513
V30.0118350.88330.11670.00402414
Env10.022460.9704890.0295110.00084317
Env20.0054340.7474490.2525510.00255102
Env30.0092680.8849210.1150790.00396825
Env40.013720.9609510.0390490.00169779
Env50.0037790.5849510.4150490.00970874
Env60.0015110.3622050.6377950.00524934

References

  1. Fernandez, C.; Kumar, S.B.; Lok Woo, W.; Norman, R.; Kr Dev, A. Dynamic Positioning Reliability Index (DP-RI) and Offline Forecasting of DP-RI During Complex Marine Operations. In ASME 2018 37th International Conference on Ocean, Offshore and Arctic Engineering, Proceedings of the Volume 1: Offshore Technology, Madrid, Spain, 17–22 June 2018; American Society of Mechanical Engineers: New York, NY, USA, 2018; p. V001T01A061. [Google Scholar]
  2. Dong, Y.; Vinnem, J.E.; Utne, I.B. Improving Safety of DP Operations: Learning from Accidents and Incidents during Offshore Loading Operations. EURO J. Decis. Process. 2017, 5, 5–40. [Google Scholar] [CrossRef] [Scilit]
  3. International Marine Contractors Association (IMCA). International Marine Contractors Association (IMCA) DP Event Bulletin 02/22-August 2022; International Marine Contractors Association (IMCA): London, UK, 2022. [Google Scholar]
  4. Olubitan, O.; Loughney, S.; Wang, J.; Bell, R. An Investigation and Statistical Analysis into the Incidents and Failures Associated with Dynamic Positioning Systems. In Safety and Reliability—Safe Societies in a Changing World; CRC Press: London, UK, 2018; pp. 79–85. [Google Scholar]
  5. Sanchez-Varela, Z.; Boullosa-Falces, D.; Larrabe-Barrena, J.L.; Gomez-Solaeche, M.A. Determining the Likelihood of Incidents Caused by Human Error during Dynamic Positioning Drilling Operations. J. Navig. 2021, 74, 931–943. [Google Scholar] [CrossRef] [Scilit]
  6. Wang, F.; Zhao, L.; Bai, Y. Survey on reliability analysis of dynamic positioning systems. Ships Offshore Struct. 2024, 19, 999–1009. [Google Scholar] [CrossRef] [Scilit]
  7. Ferdous, R.; Khan, F.; Sadiq, R.; Amyotte, P.; Veitch, B. Fault and Event Tree Analyses for Process Systems Risk Analysis: Uncertainty Handling Formulations. Risk Anal. 2011, 31, 86–107. [Google Scholar] [CrossRef] [Scilit] [PubMed]
  8. Khakzad, N.; Khan, F.; Amyotte, P. Safety Analysis in Process Facilities: Comparison of Fault Tree and Bayesian Network Approaches. Reliab. Eng. Syst. Saf. 2011, 96, 925–932. [Google Scholar] [CrossRef] [Scilit]
  9. Yazdi, M. Hybrid Probabilistic Risk Assessment Using Fuzzy FTA and Fuzzy AHP in a Process Industry. J. Fail. Anal. Prev. 2017, 17, 756–764. [Google Scholar] [CrossRef] [Scilit]
  10. Pillay, A.; Wang, J. Human Error Assessment and Decision Making Using Analytical Hierarchy Processing. In Technology and Safety of Marine Systems; Elsevier Ocean Engineering Series; Elsevier: Amsterdam, The Netherlands, 2003; Volume 7, pp. 213–242. [Google Scholar] [CrossRef] [Scilit]
  11. Zhang, D.; Yan, X.P.; Yang, Z.L.; Wall, A.; Wang, J. Incorporation of Formal Safety Assessment and Bayesian Network in Navigational Risk Estimation of the Yangtze River. Reliab. Eng. Syst. Saf. 2013, 118, 93–105. [Google Scholar] [CrossRef] [Scilit]
  12. Yazdi, M.; Korhan, O.; Daneshvar, S. Application of Fuzzy Fault Tree Analysis Based on Modified Fuzzy AHP and Fuzzy TOPSIS for Fire and Explosion in the Process Industry. Int. J. Occup. Saf. Ergon. 2020, 26, 319–335. [Google Scholar] [CrossRef] [Scilit] [PubMed]
  13. Sentz, K.; Ferson, S. Combination of Evidence in Dempster-Shafer Theory; Semantic Scholar: Seattle, WA, USA, 2002; 96p. [Google Scholar] [CrossRef] [Scilit]
  14. Obeng, F.; Domeh, V.; Khan, F.; Bose, N.; Sanli, E. Capsizing Accident Scenario Model for Small Fishing Trawler. Saf. Sci. 2022, 145, 105500. [Google Scholar] [CrossRef] [Scilit]
  15. Obeng, F.; Domeh, D.; Khan, F.; Bose, N.; Sanli, E. An Operational Risk Management Approach for Small Fishing Vessel. Reliab. Eng. Syst. Saf. 2024, 247, 110104. [Google Scholar] [CrossRef] [Scilit]
Figure 1. Methodology diagram.
Jmse 14 00462 g001
Figure 2. Fuzzy AHP framework [9].
Jmse 14 00462 g002
Figure 3. Bayesian network.
Jmse 14 00462 g003
Figure 4. Calculation of risk probability using DST.
Jmse 14 00462 g004
Figure 5. Calculation of risk probability using Fuzzy AHP.
Jmse 14 00462 g005
Figure 6. Backward analysis using DST.
Jmse 14 00462 g006
Figure 7. Backward analysis using Fuzzy AHP.
Jmse 14 00462 g007
Figure 8. Influencing risk factors.
Jmse 14 00462 g008
Table 1. Definition of expert profile attributes.
ExpertProfession (P)Job Experience (J)Education (E)Age (A)
EiJob RoleYears of ExperienceCertification LevelAge in Years
Table 2. Linguistic probability scale for Fuzzy AHP.
NH0000
CL0.050.10.10.15
VL0.150.20.20.25
L0.250.30.30.35
ML0.350.40.40.45
M0.450.50.50.55
MH0.550.60.60.65
H0.650.70.70.75
VH0.750.80.80.85
CH0.850.90.90.95
HA1111
Table 3. Triangular fuzzy numbers.
9 1 ~ 7 1 ~ 5 1 ~ 3 1 ~ 1 ~ 3 ~ 5 ~ 7 ~ 9 ~
(1/9, 1/9, 1/7)(1/9, 1/7, 1/5)(1/7, 1/5, 1/3)(1/5, 1/3, 1)(1, 1, 1)(1, 3, 5)(3, 5, 7)(5, 7, 9)(7, 9, 9)
Table 4. Causal factors.
Major Factors of Human ErrorFactorFactor Description
PeopleManagement
Inadequate SMSInsufficient or poorly implemented safety management system, including relevant protocols and procedures.
Poor spare part managementIneffective and poorly implemented spare part inventory control and availability of critical replacement components.
Delayed repairsPostponement and untimely execution of necessary and overdue maintenance, potentially compromising system safety and reliability.
Poor maintenanceInadequate upkeep of engine room and DP system components, leading to degraded performance or failures.
Insufficient activity planningInadequate safety and operational preparation and planning for DP operations.
Insufficient risk assessmentFailure to properly identify and evaluate potential risk and hazards related to equipment and activity execution during DP operations.
Training and competence
Insufficient trainingInsufficient or inadequate training and instructions, required for operator to perform his duties, provided to vessel operating personnel in all stages of employment.
IncompetenceLack of necessary skills or knowledge to properly operate DP systems and vessel machinery.
Failure to follow operational proceduresNon-adherence to established protocols and guidelines for DP operations by deck and engine personnel.
Operator performance
Incorrect DPO responseImproper actions taken by the dynamic positioning operator in response to operational and environmental changes or system alerts.
Failure to maintain safe distanceFailure of vessel operator to maintain distance that can lead to collision to fixed structures or other vessels in case of vessel drifting towards it.
Inadequate decision makingPoor or incorrect choices made by vessel personnel or management regarding DP operations that can lead to undesired consequences.
Inadequate situational awarenessLack of comprehensive understanding of current operational conditions and potential risks associated with it.
Crew conditions
FatiguePhysical or mental exhaustion that can affect operator’s decision making and reaction time, reducing situational awareness.
EquipmentTechnical factors
Software failureMalfunction or error in the DP system’s software, leading to faults and control issues.
Defective systemInherent flaws or malfunctions in the vessel’s systems, including DP hardware or design.
Design defectsFlaws in the original engineering or architecture of the vessel’s DP systems.
DP system malfunctionAny failure or error in the dynamic positioning system during its operation.
Thruster failureMalfunction or shutdown of one or more of the vessel’s thrusters that leads to the stopping of thruster operation.
Slow joystick responseDelayed or sluggish reaction of the DP system to manual control inputs.
Insufficient redundancyLack of backup systems or components to safely maintain operations in case of failures.
Closed bus tieRunning the vessel’s power system with interconnected bus ties, potentially reducing redundancy.
Control and positioning factors
Loss of controlInability to maintain desired vessel position, movement or heading during DP system operation.
Loss of positionInability of the DP system and operator to maintain the vessel’s intended location.
Vessel factors
Collision with a platformPhysical contact between the vessel and a fixed offshore structure.
Operation beyond vessel capabilitiesOperation of the vessel beyond its designed or rated capacities.
Vessel driftingUnintended movement of the vessel from its desired position, usually forced by environmental forces.
EnvironmentEnvironmental factors
WindForce exerted on the vessel by air movement, affecting positioning.
CurrentMovement of water affecting the vessel’s position.
WavesSurface water movement impacting vessel stability and position.
Environmental forcesCollective term for all the external forces created by nature acting on the vessel and affecting its positioning.
NoiseUnwanted sound that can interfere with communication or operator concentration.
VibrationMechanical oscillations that can affect equipment performance or operator comfort.
Table 5. Information about experts.
ExpertProfession (P)Job Experience (J)Education (E)Age (A)
E1Regulator5 yearsMasters37 years
E2Academic10 yearsPhD35 years
E3Academic40 yearsMasters75 years
E4Regulator20 yearsHigher Diploma50 years
E5Operator7 yearsBachelors73 years
E6Regulator15 yearsHigher Diploma43 years
Table 6. Main contributing factors.
MethodDSTFuzzy AHP
FactorsSoftware failure (93%)Insufficient training (74%)
Insufficient training (86%)Lack of experience (24%)
Lack of experience (75%)Weather conditions
(68%, 23%, 10%)
Weather conditions
(97, 89, 75%)
Disclaimer/Publisher’s Note: The statements, opinions and data contained in all publications are solely those of the individual author(s) and contributor(s) and not of MDPI and/or the editor(s). MDPI and/or the editor(s) disclaim responsibility for any injury to people or property resulting from any ideas, methods, instructions or products referred to in the content.