Article

Frequency-Tracking-Based Resonance Control for a Variable-Stiffness Point-Absorber Wave Energy Converter


1
Faculty of Mechanical and Electrical Engineering, Kunming University of Science and Technology, Kunming 650500, China
2
Yunnan Key Laboratory of Intelligent Control and Application, Kunming University of Science and Technology, Kunming 650500, China
*
Author to whom correspondence should be addressed.
J. Mar. Sci. Eng. 2026, 14(11), 1040; https://doi.org/10.3390/jmse14111040
Submission received: 15 March 2026 / Revised: 26 April 2026 / Accepted: 11 May 2026 / Published: 1 June 2026
(This article belongs to the Special Issue Control and Optimization of Marine Renewable Energy Systems)

Abstract

To improve the energy capture efficiency of wave energy converters (WECs), various control strategies based on adjustable power take-off (PTO) systems have been developed. However, such approaches often impose stringent requirements on PTO structural design and generator performance. To address this issue, this paper proposes a novel variable-stiffness point-absorber wave energy converter (VSPAWEC). In the proposed system, a stiffness regulator (SR) composed of a magnetorheological damper (MRD) and a spring mechanism is introduced as a frequency-tuning device, enabling stiffness compensation of the point absorber within a certain operating range. Based on the SR mechanism, a frequency-tracking resonance control strategy is further developed. Specifically, a sliding mode control algorithm is employed to regulate the MRD in real time, allowing the piston rod to track a reference position signal generated from the known dominant wave frequency. In this way, the spring force applied to the buoy can be adjusted adaptively, so that resonance between the buoy and the incident waves can be achieved. Finally, numerical simulations are conducted to evaluate the variable-stiffness characteristics of the proposed VSPAWEC and to verify the effectiveness of the developed frequency-tracking control strategy. The results demonstrate the feasibility of the proposed concept for resonance tuning and wave energy capture enhancement.

1. Introduction

In recent years, the development and utilization of renewable energy have become an important research target. Wave energy, due to its wide distribution and high energy density, has attracted much attention in the development of various clean energy sources. According to statistics, the theoretical potential of wave energy resources is estimated to be approximately 32,000 Twh/year, which exceeds global electricity consumption [1]. Efficient utilization of wave energy can also solve the power supply problems for some offshore equipment and island areas [2]. Therefore, the efficient development and utilization of wave energy resources not only can address the power supply shortcomings in remote sea areas and island regions, but also holds extremely significant strategic importance for promoting the global energy transition to a green model and optimizing the layout of clean energy.
The research on the utilization of wave energy by humans has a history of over two hundred years. Nevertheless, achieving the commercial application of wave energy converters (WECs) remains a challenge. The reason is that the levelized cost of energy (LCOE) resulting from wave energy generation has not yet reached the commercial standard [3]. To reduce the development and power generation costs of individual WECs, studies have been conducted from two aspects: the structural optimization and control strategies of WECs.
Wave energy usually needs to pass through three subsystems—the capture device, power take-off (PTO), and the generator—before it can be converted into electricity for human use. Current research on WECs mainly focuses on five configurations: oscillating water column devices [4,5], wave overtopping devices [6,7], duck-type devices [8], raft-type devices [9], and point absorbers [10,11,12]. Although these concepts have been widely investigated, their large-scale practical deployment remains limited because of economic constraints and technical reliability issues. Among them, point-absorber wave energy converters (PAWECs) have attracted particular attention due to their simple structure, relatively low maintenance cost, and omnidirectional wave energy absorption capability [13].
Although there has been significant progress in continuously optimizing the configuration of WECs, the problem of low power generation efficiency persists in real marine environment tests. To enhance the power generation performance of WECs, researchers in recent years have turned their attention to the design of advanced control strategies. From the perspectives of time domain and frequency domain, the control strategies of WECs can be classified into two types: real-time control of PTO force and natural frequency adjustment.
At the theoretical level, numerous algorithms based on real-time control of PTO force have emerged. A representative example is the optimal control that regards the maximization of the energy converted by wave energy as an optimization problem. Optimal control relies entirely on precise mathematical models to solve the optimal solution of performance indicators [14,15,16,17]. However, in actual modeling work, the nonlinear terms of the system are usually ignored to reduce model complexity and computational load, which will cause the optimal solution to deviate from the true optimum and lead to a significant decline in control performance or system instability. Model Predictive Control (MPC) can compensate for its model errors through a feedback correction mechanism in real-time measurement feedback, and has certain robustness [18,19,20]. However, when applied to wave prediction, MPC has the problem of a large computational load, making it difficult to be practically applied. In contrast, the reinforcement learning controller, which is not constrained by the model, enables it to effectively adjust the system in any sea condition to maximize power generation efficiency [21,22]. However, compared with the former two, it can only provide a suboptimal adjustment result, and a longer learning period is required in the initial stage.
Studies have shown that when the movement of the buoy resonates with the waves, the theoretical maximum capture efficiency will be achieved [23,24]. Compared with the PTO force control strategy, the natural frequency adjustment does not have complex theoretical issues. This scheme achieves resonance by using the frequency adjustment mechanism to match the natural frequency of the WEC system with the dominant frequency of the waves. Due to the low energy loss during the long-distance transmission of waves, it has become possible to effectively predict the wave height and dominant frequency of the waves based on statistical data in advance [25]. Therefore, natural frequency adjustment of WEC becomes another solution to address the low power generation efficiency of WEC.
In the natural frequency adjustment strategy, researchers have also investigated mass-adjustment methods for WECs [26,27]. The results indicate that a small change in the target wave frequency may require a relatively large variation in the adjustable mass, which makes this method difficult to implement in practice. In addition, mass adjustment may cause the WEC to overload or even sink [28]. Compared with directly increasing or decreasing the buoy mass, adjusting the rotational inertia of a rotating device is easier to implement [29,30]. Moreover, adjusting the restoring stiffness is also an effective way to tune the natural frequency. In the literature [31], using the Edinburgh duck-type WEC as the research object, the effectiveness of using the moving mass method to change the recovery stiffness of the capture device was discussed. The results showed that appropriate adjustment of the position of the moving mass could, to a certain extent, counteract the inherent impedance of the system and optimize the performance of the duck in wave energy capture. This method has still received much attention in recent years. A dual-resonance WEC composed of two groups of mass-spring-damper units was proposed [32]. It achieves the adjustment of the system stiffness characteristics through the automatic transmission to provide different transmission ratios. However, this solution can only provide limited and discrete resonant frequency characteristics. In contrast, an active resonance C-type WEC that controls the recovery stiffness by setting a height adjustment mechanism within the capture device has advantages in irregular sea conditions and can adjust the system stiffness characteristics continuously within a certain range [33]. However, adjusting the center of gravity of a large-scale capture device also poses certain challenges.
To address the existing technical deficiencies and in response to the current weak points in the research on the stiffness regulation mechanism of PAWEC, this paper proposes a variable stiffness point-absorbing wave energy converter (VSPAWEC), and for this structure, a frequency tracking control strategy is proposed. Based on the known wave information, the stiffness regulator (SR) is controlled in real time to adjust the stiffness required for system compensation, thereby enabling the buoy to resonate with the waves and enhancing the power generation performance of the WEC.
The structure of this paper is as follows: Section 2 elaborates on the structural design and working principle of VSPAWEC. Section 3 conducts dynamic modeling of VSPAWEC based on linear potential flow theory and dynamic analysis. Section 4 designs a frequency tracking control strategy based on the stiffness adjustment mechanism of SR. Section 5 uses Ansys/Aqwa in conjunction with Matlab/Simulink to conduct simulation verification of the variable stiffness characteristics of SR, as well as frequency tracking control under regular and irregular sea conditions. Finally, Section 6 provides a summary.

2. Structural Design

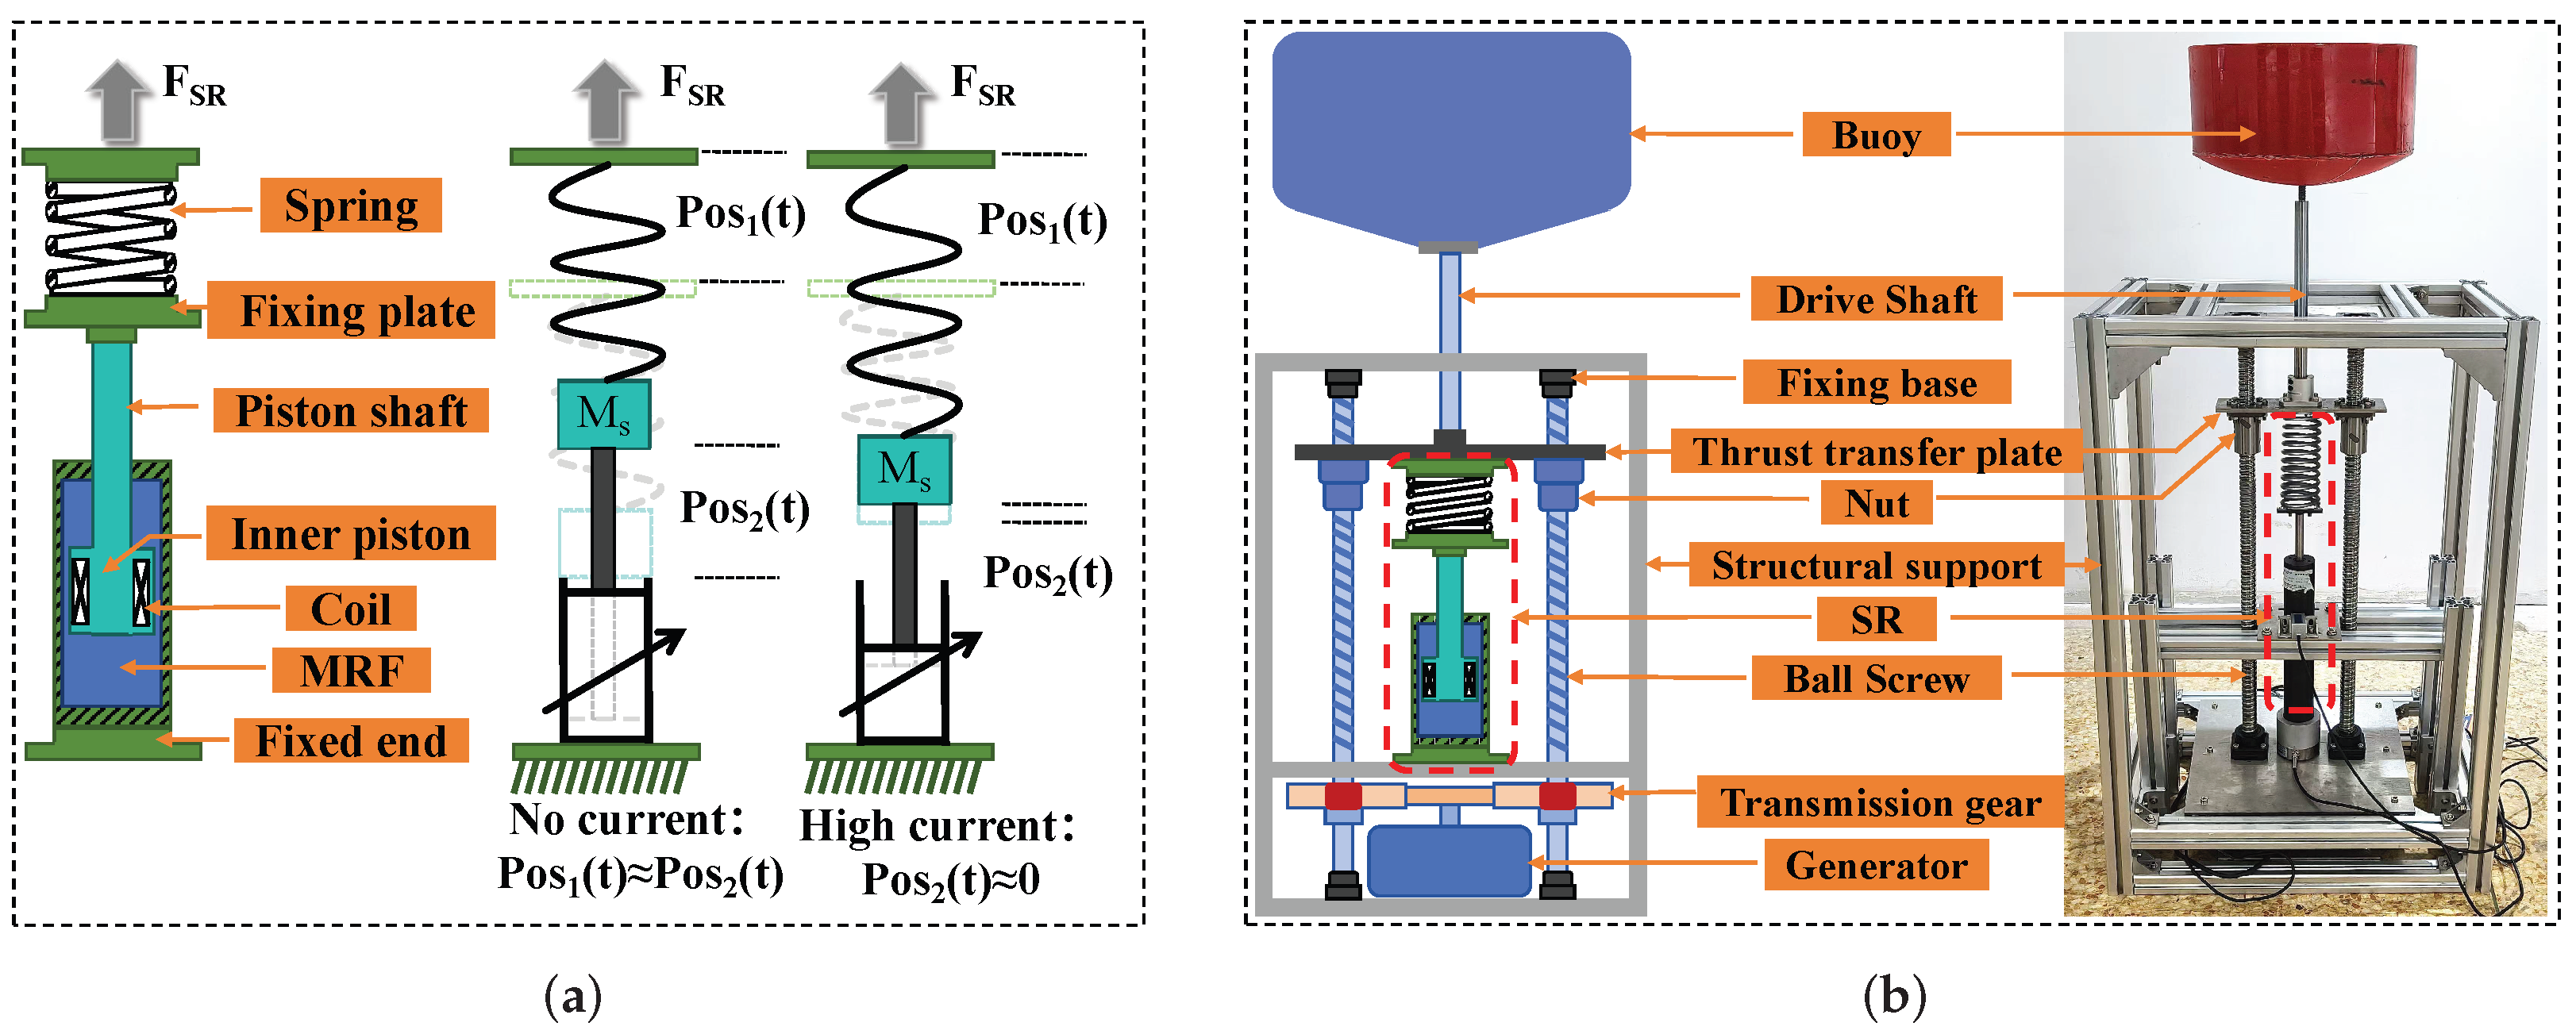
Unlike traditional PAWEC, VSPAWEC not only includes buoys, PTO and generators, but also adds a SR based on valve-type magnetorheological damper [34] and spring design. The structure and working principle of SR are shown in Figure 1a.
Based on this principle, the bottom end of the spring is fixedly installed at the top end of the piston rod. Different control currents are applied to the MRD to adjust the magnitude of the damping force, thereby indirectly exerting different constraints on the displacement of the bottom end of the spring. Under the same amplitude displacement excitation of the float, the spring can generate different amplitudes of spring force, thus presenting different equivalent stiffness characteristics. As the current increases, the displacement of the bottom end of the spring gradually decreases, and therefore the equivalent stiffness of the system increases with the increase in the output spring force.
The overall structure design of VSPAWEC is shown in Figure 1b. According to the research results in reference [36], the design of the outer float as an axisymmetric structure can significantly reduce the sensitivity to the wave direction, while the bottom design of the buoy is conical to reduce the viscous force during the movement. PTO is composed of the ball screw mechanism at both ends and the transmission gear set installed at the bottom of the screw. SR is installed in parallel with PTO. The power of the buoy is transmitted to the thrust plate installed at the bottom of the drive shaft through the drive shaft. The spring of SR is fixedly connected below the thrust plate, and the screw nut at both ends of the bottom is fixedly installed. During the movement of the buoy, it is always subjected to the spring force of SR. The screw nut cooperates with the ball screw to convert the reciprocating linear motion into reciprocating rotational motion, and finally the power is transmitted to the generator for power generation through the transmission gear installed at the bottom of the screw.

3. System Modeling

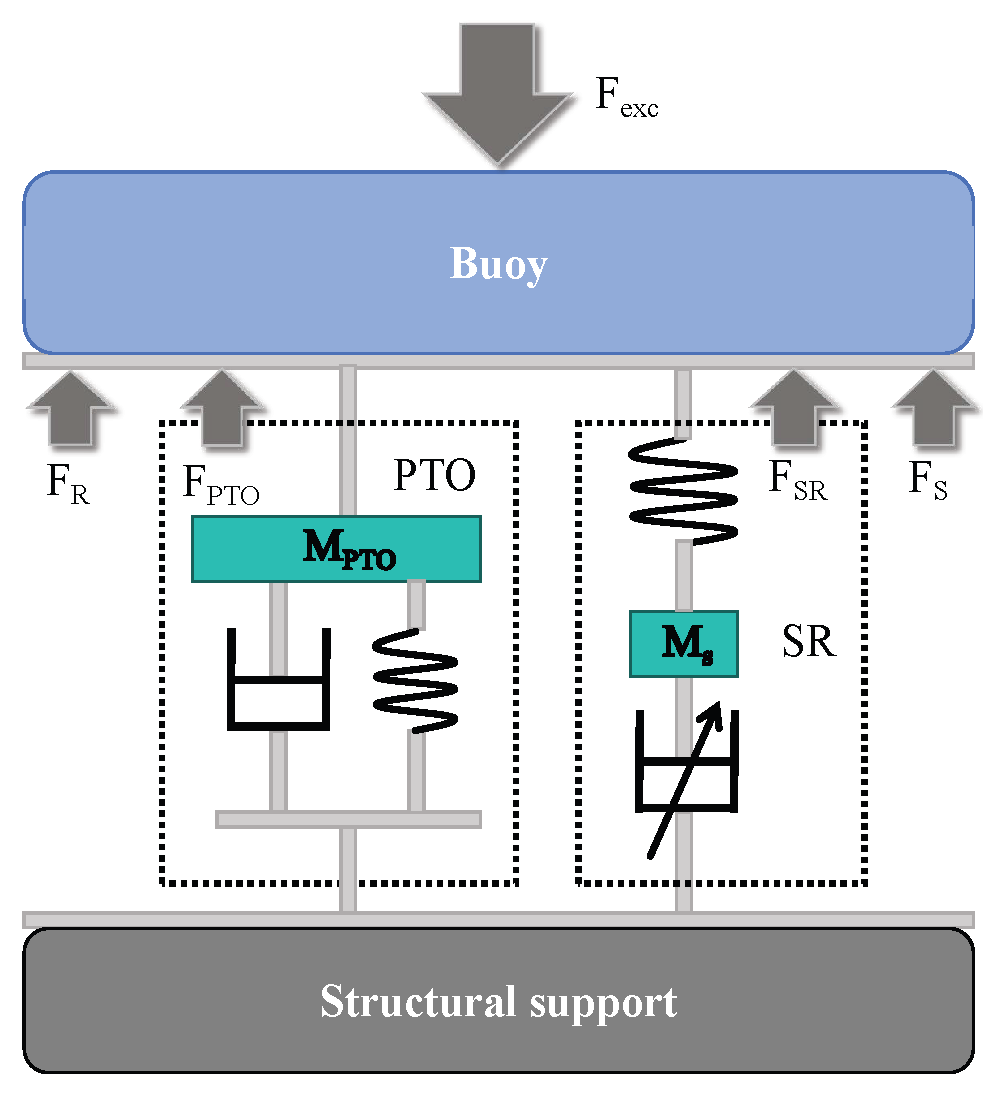
Under the combined effect of PTO and SR, the force analysis results of the buoy are shown in Figure 2. Here, PTO is equivalently regarded as a spring-damper system, and SR is equivalently regarded as a spring-mass-variable-damping series system. The modeling work of VSPAWEC is divided into three steps: buoy hydrodynamic modeling, PTO dynamics modeling, and SR dynamics modeling.
Based on the assumption of inviscid and irrotational ideal fluid and the linear potential flow theory, the buoy is only subjected to the Froude–Krylov force, diffraction force, radiation force and hydrostatic force during the interaction between waves and structures. Therefore, the differential equation of the buoy’s motion can be established as
M + M z ¨ b t + 0 t K t τ z ˙ b τ d τ + K w z b t = F e x c t + F p t o t + F S R t
where M and M ( ) represent the mass of the buoy and the additional mass at infinite frequency, respectively. z b , z ˙ b and z ¨ b denote the vertical displacement, velocity, and acceleration of the float, respectively. K ω is the static water stiffness. F e x c , F p t o and F S R are the excitation force of the ocean waves and the PTO force and the force represents the wave excitation force, PTO force and spring force, respectively. K t represents the radiation load impulse response function. Generally, the convolution term that characterizes the radiation damping load is approximated using a state-space model:
x ˙ r = A r x r + B r z ˙ b 0 t K τ z ˙ b t τ d τ = C r x r
where A r , B r , C r , respectively, represent the dynamic matrices, input matrix and output matrix of the finite-order approximation of the radiation damping force. These matrices determine the internal radiation state dynamics, the mapping from buoy velocity to the radiation state, and the mapping from the radiation state to the radiation damping force. Therefore, they affect how accurately the radiation-memory effect is represented in the time-domain model, which in turn influences the predicted buoy motion and the subsequent control-performance evaluation.
The PTO usually exerts a hindering effect on the buoy. Since the axial acceleration of the screw nut and the axial acceleration of the buoy are equal, the relationship between the PTO force and the PTO torque, as well as the buoy acceleration and the angular acceleration of the screw, can be given by the following formulas, respectively,
F p t o t = 2 π l T s t
z ¨ b t = l 2 π θ ¨ s t
where l represents the pitch of the ball screw, and T s ( t ) represents the torque of the screw, θ ¨ s Indicate the angular acceleration of the ball screw.
In this article, the ball screw and the transmission gear set are used as the transmission components. After overcoming their own friction torque, motion rigidity torque and inertia torque, the remaining torque drives the generator to generate electricity. Therefore, the generator and the PTO are analyzed as a whole, and a dynamic model can be established as follows:
J s θ ¨ s t = T s t C f + C g θ ˙ s t K p θ s t
where J s represents the total rotational inertia of the PTO, C f is the friction coefficient of the PTO, C g is the electromagnetic damping coefficient, and it is a constant when the transmission ratio and generator parameters are determined [37]. K p is the motion rigidity coefficient of the PTO. θ ˙ s and θ s represent the angular velocity and angular displacement of the screw, respectively.
From Equations (3) to (5), the PTO mathematical model can be obtained:
F p t o t = M p t o z ¨ b t C P z ˙ b t K P z b t
where M p t o = 4 π 2 l 2 J s is the equivalent mass of the PTO, C p = 4 π 2 l 2 C g + C f is the total motion damping coefficient of the PTO and the generator, and K P = 4 π 2 l 2 K p .
According to Newton’s second law, the resultant force acting on the equivalent particle of the moving component in SR and the reaction force of the spring on the float can be expressed as
M s z ¨ v t = K s z b t z v t F m r d t , I c
F S R t = K s z b t z v t
where M s represents the equivalent mass of the moving components in SR. z ¨ v and z v represent the displacement and axial acceleration of the equivalent mass (that is, the displacement and acceleration at the bottom of the spring). K s represents the stiffness coefficient of the spring in the SR, and F m r d is the MRD damping force. This paper selects to use the hyperbolic tangent model as the parameter model for MRD [38]:
F m r d t , I c = f y ( I c ) tan h α z ˙ v t + v h ( I c ) sign z v t + c p o ( I c ) z ˙ v t + k 0 z v t + f 0
where f y represents the hysteresis proportional factor, I c is the current control. α represents the hysteresis slope proportional factor, v h represents the half-width of the hysteresis loop, and c p o represents the damping coefficient after yielding. k 0 represents the stiffness coefficient, and f 0 is the offset force. The fitting relationship between f y , v h , c p o and the current is
f y = d 0 + d 1 I c v h = b 0 + b 1 I c c p o = c 0 + c 1 I c
where b i , c i and d i (i = 0, 1) are all fitting coefficients. Usually, the parameter v h has a relatively minor impact on the model’s output. Considering that the actual control current can be calculated subsequently, the parameter v h in Equation (10) is regarded as the constant b 0 . The MRD reverse model can be expressed as
I c = F m r d f 0 + d 0 Z + c 0 z ˙ v t + k 0 z v t d 1 Z + c 1 z ˙ v t
where Z = tan h α z ˙ v t + b 0 s i g n z v t . Due to the possibility of variable Z crossing zero, which could result in an infinitely large control current, the following constraint condition is set:
Z = Z lim s i g n Z , Z lim < Z < Z lim Z , O t h e r
To characterize the tunable stiffness effect of the SR at the system level, an equivalent stiffness coefficient K n is defined:
K s z b t z v t = K n z b t
It should be noted that K n does not represent a change in the intrinsic spring stiffness K s . Instead, it reflects the effective stiffness transmitted to the buoy under the coupled action of the constant spring and the controllable MRD. Since the minimum damping force of MRD is not zero, when the control current of the damper is zero, its equivalent stiffness is equal to a non-zero minimum value. Similarly, when the applied current is at its maximum value, since the damping force depends on velocity, the displacement at the bottom of the spring is always non-zero, meaning that the maximum equivalent stiffness can only approach K s rather than be equal to K s . Further,
lim z v z b K n = K n   min 0 I c = 0 lim z v 0 K n = K n   max K s I c = I max
Substituting Equations (6) and (13) into Equation (1) yields the relationship between the natural frequency of the system and the equivalent stiffness K n :
f ω = 1 2 π K w + K n + K P M a l l
where M a l l = M + M ( ) + M p t o .
For the purpose of facilitating the research, the state variable x 1 = z b , x 2 = z ˙ b , x 3 = z v , x 4 = z ˙ v was selected. The final total mathematical model of VSPAWEC can be expressed as
x ˙ 1 = x 2 x ˙ 2 = K a l l M a l l x 1 C P M a l l x 2 1 M a l l 0 t K t τ x 2 d τ + K s M a l l x 3 + 1 M a l l F e x c x ˙ 3 = x 4 x ˙ 4 = K s M s x 3 + K s M s x 1 1 M s F m r d
where K a l l = K ω + K s + K P .

4. Frequency Tracking Control Strategy

4.1. Derivation of Frequency Tracking Control Reference Signal

In order to enable WEC to operate in all sea conditions in the maximum energy capture state, this section proposes a frequency tracking controller based on VSPAWEC. This controller can perform real-time control of SR to compensate for the required stiffness for PAWEC according to the dominant frequency characteristics of the incident waves, keeping the buoy in resonance with the incident waves continuously and enhancing the power generation efficiency of WEC.
Equation (15) indicates that the natural frequency of the WEC can be adjusted by changing the equivalent stiffness value of the stiffness regulator compensation, so that the WEC can achieve resonant responses between the buoy and the waves in different sea conditions. At this time, the dominant frequency of the waves f p is equal to the system’s natural frequency f ω . By combining Equations (13) and (15), the reference signal function for achieving frequency tracking can be derived:
x 3 r e f t , i = x 1 t K w + K P 4 π 2 M a l l f p 2 i K s + 1
It should be noted that the applicability of the reference signal in Equation (17) is constrained by the stiffness-adjustment capability of the SR and the parameterization of the baseline PAWEC. According to Equation (15), increasing the equivalent stiffness K n increases the natural frequency of the system and thus shortens its natural period. Since the present SR can only provide positive stiffness compensation, the current design is mainly suitable for wave conditions whose target period is not longer than the initial natural period of the uncontrolled WEC. For longer-period waves, the reference displacement generated by Equation (17) may exceed the physically achievable motion range of the semi-active SR/MRD subsystem, making the corresponding tracking task unrealizable under the current configuration. Therefore, extending the present method to such sea states would require either a redesigned baseline PAWEC with a shorter initial natural period or an SR mechanism capable of providing effective negative stiffness compensation.
It can be observed that the reference signal function contains the discrete frequency information of the incoming waves in the future time, f p ( i ) ( i = 1 , 2 , ) . In recent years, effective wave prediction methods have been extensively studied, making it possible to predict the dominant frequency information of waves in advance [39,40,41]. It should be noted that, under regular wave conditions, the wave height and dominant frequency remain essentially constant. Therefore, even if the dominant-frequency information obtained by applying fast Fourier transform (FFT) to the predicted wave data in practical engineering is discrete, the reference signal function still remains continuous.
To enhance the continuity of the reference signal and avoid the problem of controller performance degradation or instability in practical applications due to severe jumps between frequency points, a smoothing function for smooth switching of frequency points was designed:
g t k , i = f p i 1 + f p i f p i 1 1 1 + e m 1 t k m 2
t k = t k , t k 0 , T 0 , t k = T
where t k is the internal time variable of the smoothing function, the step size depends on the sampling step size, and the width is determined by the FFT period T of the wave data. m 1 and m 2 are both positive constants that can adjust the frequency switching slope and time. By replacing f p ( i ) in Equation (17) with g ( t k , i ) in Equation (18), a smoother reference signal can be obtained.

4.2. Design of Reference Signal Tracking Control Algorithm

To achieve reference signal tracking, a fixed-time sliding mode control algorithm will be designed for the SR system. Based on the modeling work in Section 3, the mathematical model of the SR system can be rewritten as
x ˙ 3 = x 4 x ˙ 4 = f + b u + d
where d represents the bounded interference, which includes disturbances caused by the MRD reverse model error as well as external disturbances. The remaining items are
f = K s M s x 3 c 0 M s x 4
b = 1
u = c 0 M s x 4 + K s M s x 1 1 M s F m r d _ r e f
where F m r d _ r e f represents the desired damping force. By substituting it into Equation (11), the actual control current can be solved for.
Firstly, a piecewise nonlinear function was defined [42]:
f x = K a x r s i g n x + K b δ x x if x < δ x α s i g n x if x δ
where x is the variable of the function, and r = α + 1 , where α and δ are both normal design constants and satisfy α = 1 δ , δ 0 , e 1 . Choosing the appropriate K a and K b ensures the continuity of the nonlinear function f ( x ) and its derivative at x = δ :
K a = 1 ln δ α δ ln δ , K b = δ 2 α 2 α δ ln δ
From this, we can obtain the derivative of the nonlinear function f ( x ) with respect to the variable x:
h x = K a r x r 1 + K b x ln δ + 1 δ x if x < δ α x α 1 if x δ
It should be noted that the parameters K a and K b not only ensure the continuity of the function f ( x ) and its derivative h ( x ) , but also guarantee the existence of upper bounds k f x and k h for the two functions, respectively. Through derivation, these two upper bounds can be obtained as follows:
k f = δ 2 α 2 1 ln δ α δ ln δ , k h = δ α δ α 2 r r + δ α 1 δ α ln δ α δ ln δ
The proof of the boundedness of functions f ( x ) and h ( x ) can be found in reference [42]. Based on the nonlinear functions proposed in the previous text, a fixed-time sliding surface without singular points was designed [43]:
S = e ˙ + C 1 f e + C 2 e β s i g n e
where C 1 and C 2 are positive constants. The parameter δ > 1 , and it affects the convergence time. e = x 3 x 3 r e f represents the tracking error, and e ˙ is the derivative of the tracking error.
Taking the derivative of the sliding surface with respect to time yields
S ˙ = e ¨ + C 1 h e e ˙ + C 2 β e β 1 e ˙
Substituting Equation (26) into model (19) yields the error closure dynamic equation for S:
S ˙ = b u + η + d
where the nominal part η = f x ¨ 3 r e f + C 1 h e e ˙ + C 2 β e β 1 e ˙ , the uncertain elements concentrated therein only include external disturbances.
For the sliding mode variables in Equation (25), in order to make them converge to the origin S = 0 within a fixed time, a fixed-time sliding mode control that satisfies the bounded external disturbance constraint should be designed first. Then, the non-singular fixed-time sliding mode control (SFSMC) can be defined as
u = b 1 η + u 0 + u 1
u 0 = K 1 S v 1 sign S + K 2 S v 2 sign S
u 1 = w ψ ρ w , S
where u 0 ensures the fixed-time convergence of the controller. K 1 and K 2 are two normal numbers, and v 1 > 1 while 0 < v 2 < 1 . u 1 handles the concentrated uncertain terms, and ω represents the estimated upper bound of the concentrated uncertainty. To reduce the jitter phenomenon of the controller, a boundary layer method is adopted instead of the traditional switching function [44]:
ψ ρ w , S = e ρ w S 1 e ρ w S + 1
where ρ w is a positive constant. Finally, by combining Equations (11)–(12), (20), and (28)–(30), the MRD control current under the actual control system can be obtained.

5. Simulation Analysis

5.1. Analysis of WEC Hydrodynamic Characteristics

In this section, ANSYS/Aqwa 2023 R2 is used together with Matlab/Simulink R2023a to evaluate the hydrodynamic characteristics of the proposed VSPAWEC and to verify the effectiveness of the natural-frequency regulation and frequency-tracking control strategy. The main parameters of the WEC adopted in the simulation are listed in Table 1.
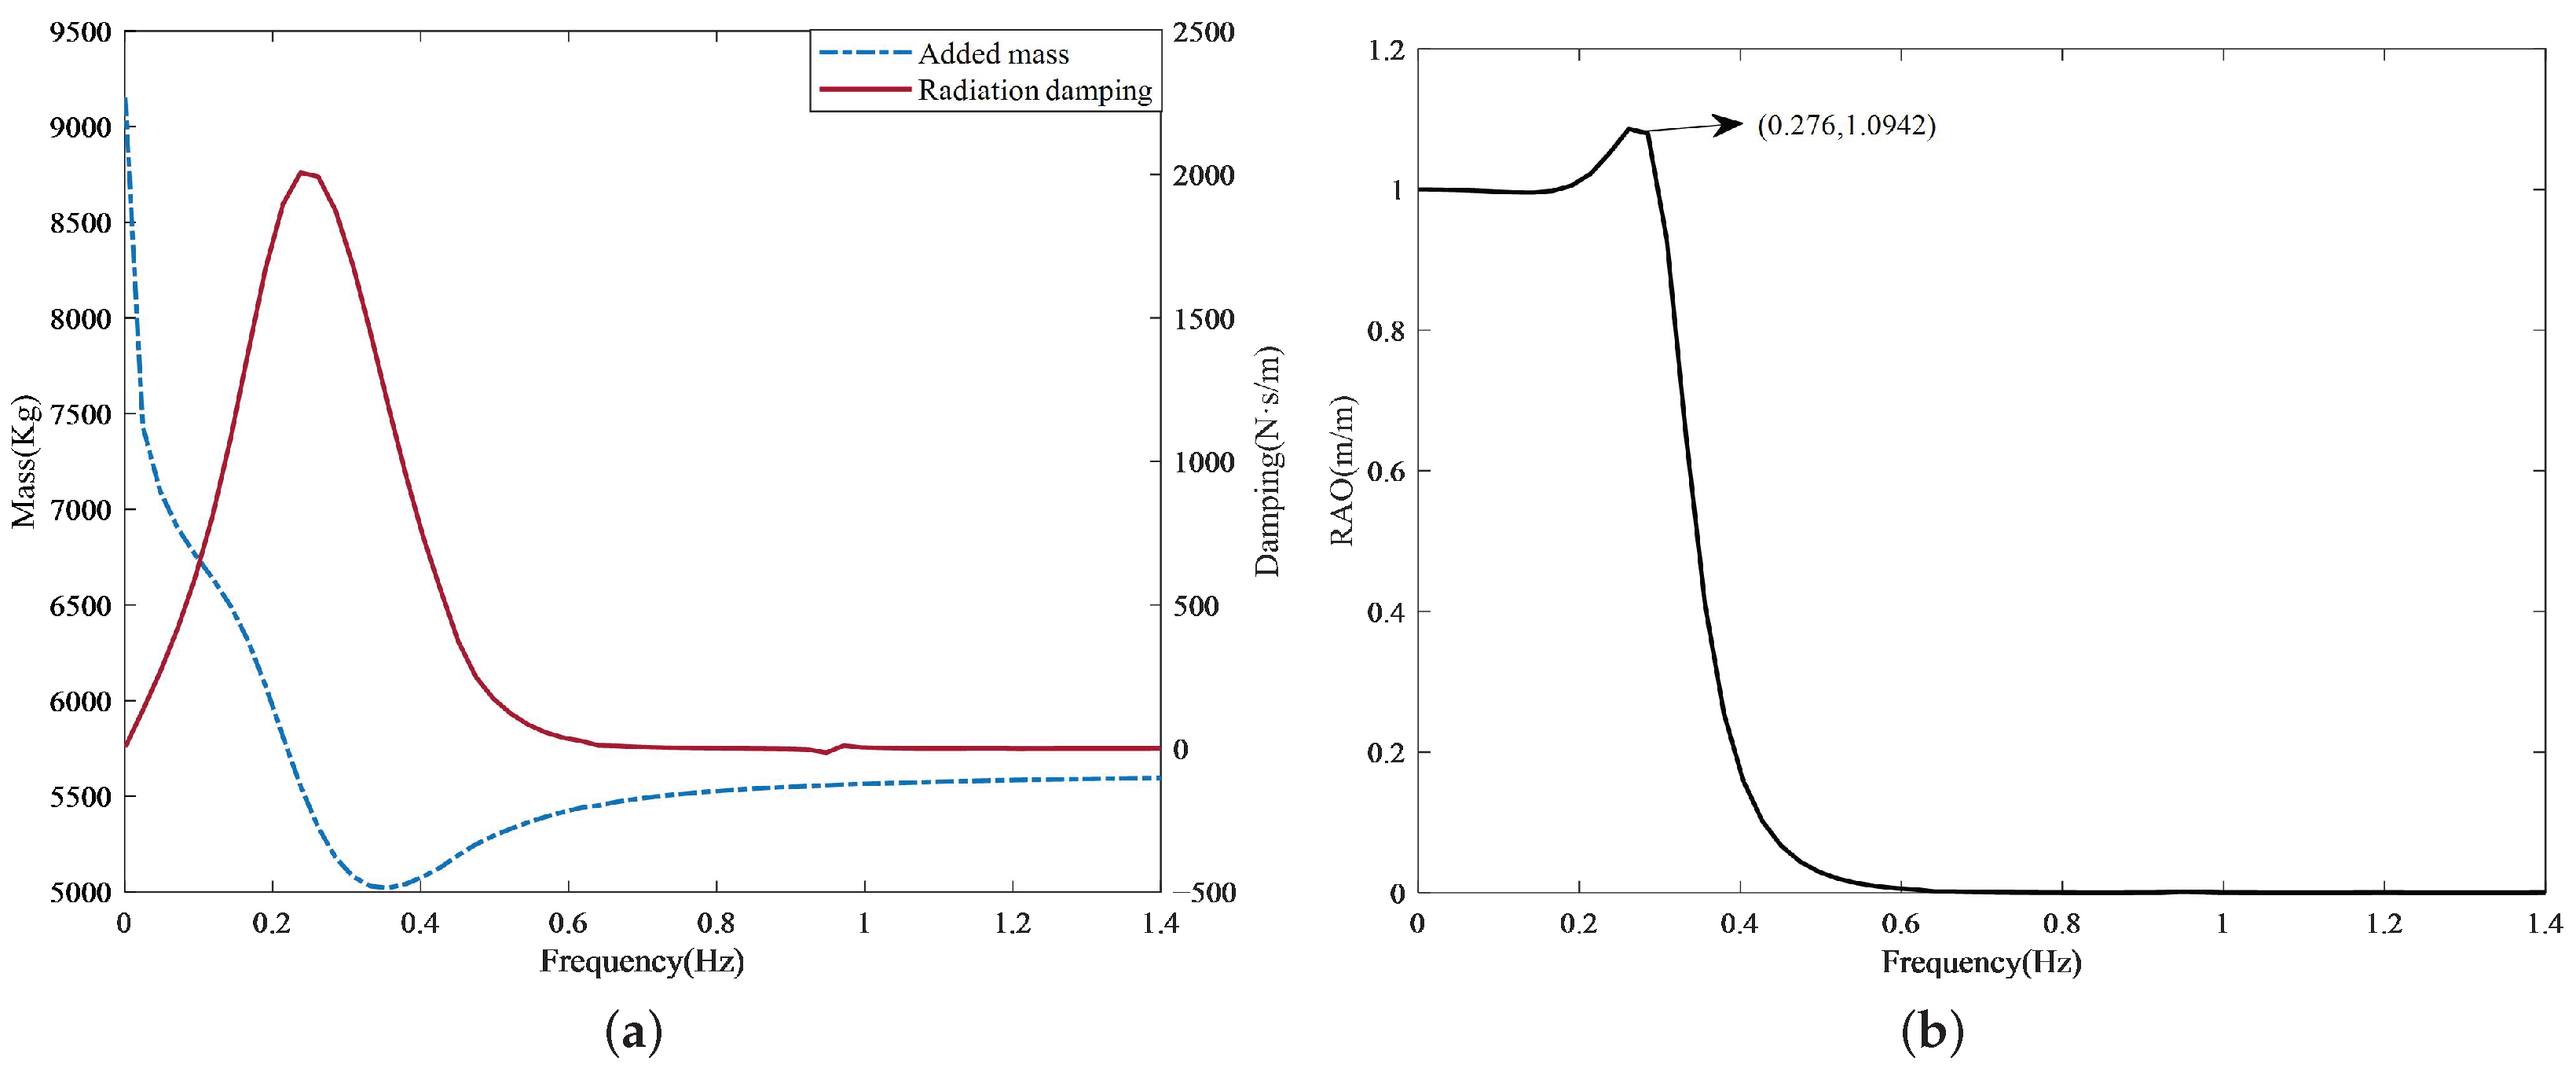
Specifically, the hydrodynamic analysis in ANSYS/Aqwa is carried out within the standard frequency-domain framework based on three-dimensional linear potential-flow theory, in which the wave radiation and diffraction problems are solved by the boundary element method. Accordingly, the present numerical model is a potential-flow hydrodynamic model rather than a CFD model with viscous turbulence closure. Therefore, the present hydrodynamic model is mainly intended for mechanism analysis and control-oriented numerical evaluation within the investigated operating range, while viscous and nonlinear wave-body interaction effects are not explicitly considered. In the Aqwa analysis, the water depth is set to 15 m, the horizontal computational extent is 80 m× 80 m, and the buoy surface is discretized with a grid size of 0.01 m. On this basis, the added mass, radiation damping, and RAO characteristics of the WEC are obtained, as shown in Figure 3.
To construct the time-domain numerical model in Simulink, the radiation-load coefficients within the frequency range of 0.01–1.445 Hz are selected for state-space identification, and the added mass at infinite frequency is obtained as M ( ) = 5625 kg. Then, the state-space model in Equation (2) is identified using the FOAMM toolbox in Matlab [45], and the identified matrices are subsequently used to reconstruct the radiation-force term in the Simulink model. In this way, the hydrodynamic results obtained from Aqwa are incorporated into the time-domain simulation of the VSPAWEC system. The identification results are as follows:
A r = 0.0753 0.1794 0.0753 0.0753 0.1287 0.0246 0.0246 0.0246 2.8860 2.8860 2.8860 5.7436 5.1442 5.1442 3.4854 5.1442 , B r = 0.0753 0.0246 2.8860 5.1442 , C r = 314.1963 136.7434 260.0280 260.1236
Furthermore, numerous studies have shown that the peak frequencies of high-energy-density waves are mainly distributed within 0.5 Hz [46]. According to Figure 3b, it can be observed that the peak point of the RAO response without introducing SR corresponds to a frequency of 0.276 Hz . To achieve the stiffness compensation effect within 0.5 Hz , the value of the spring stiffness coefficient K s in the SR is selected as 150 kN / m . Then, based on the identified state-space model and the WEC parameters, a VSPAWEC numerical model for simulation analysis is built in Simulink.

5.2. Analysis of the Variable Stiffness Characteristics of SR and Verification of the MRD Reverse Model

Furthermore, based on previous studies on MRD, it is known that the output damping force is determined jointly by the excitation amplitude, frequency, and control current. Therefore, the variable stiffness characteristics of SR were discussed in relation to these three influencing factors. The SR parameters used in the simulation are shown in Table 2.
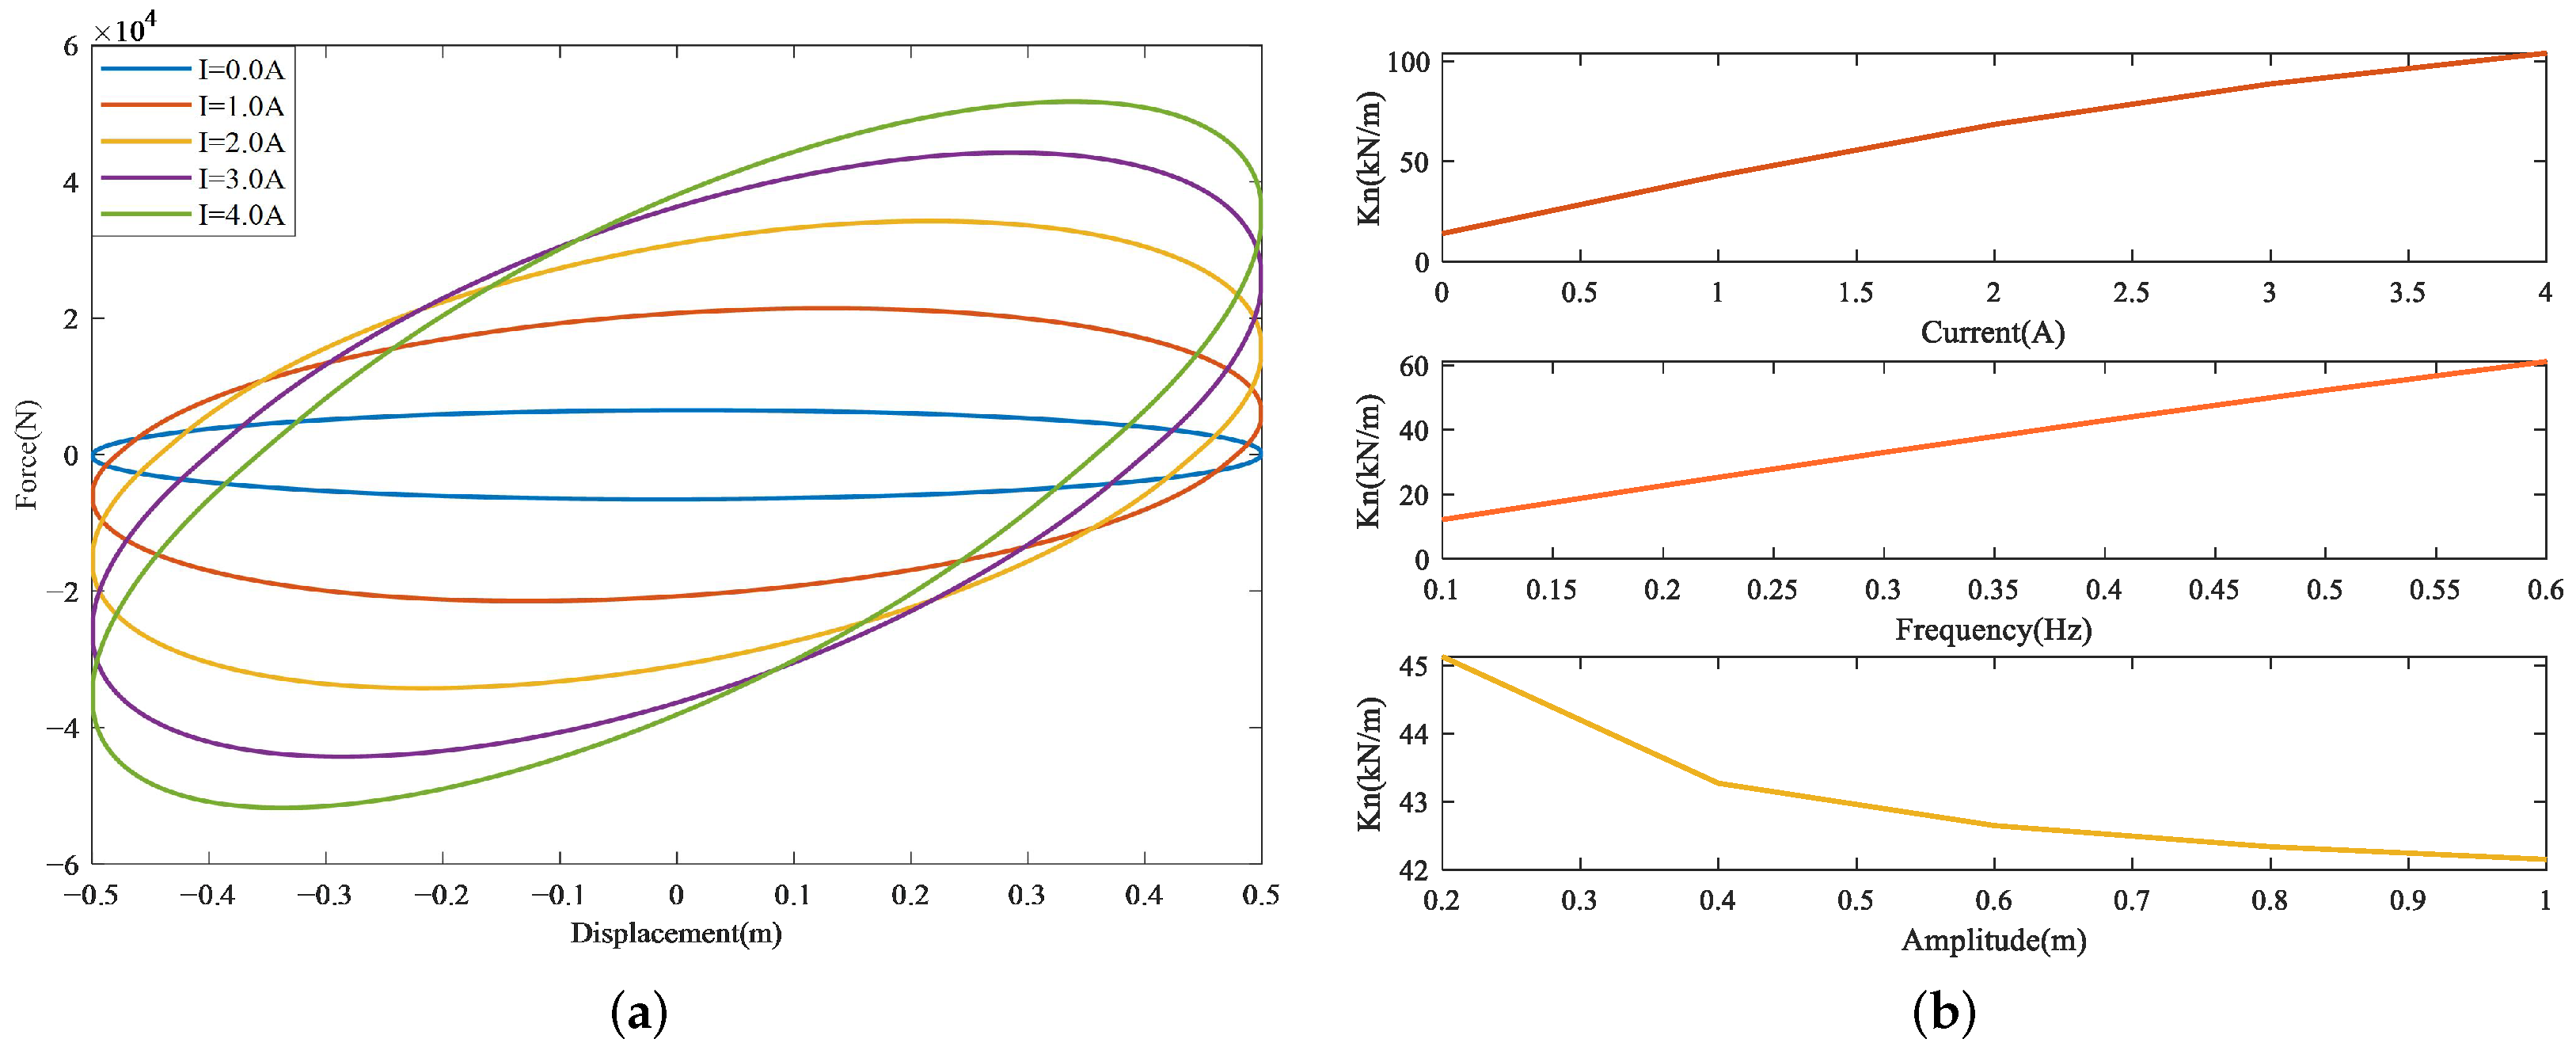
From Figure 4a, it can be observed that when a sinusoidal displacement excitation with a frequency of 0.5 Hz and an amplitude of 0.5 m is applied, the slope of the force-displacement curve gradually increases, indicating that the equivalent stiffness of SR increases with the increase in the control current. Figure 4b shows the changes in the equivalent stiffness with different currents, excitation frequencies, and excitation amplitudes. It can be found that when the current increases from 0 to 4 A , the equivalent stiffness increases from 14.026 kN / m to 104.02 kN / m , an increase of 7.4 times. Similarly, when the frequency increased from 0.1 Hz to 0.6 Hz , due to the increase in speed, the resistance of MRD to the movement of the spring’s lower end intensified. The equivalent stiffness increased from 12.185 kN / m to 61.157 kN / m , increased by 5 times. However, when the amplitude increased from 0.2 m to 1 m , the equivalent stiffness decreased from 45.129 kN / m to 42.149 kN / m , only reducing by 1.07 times. The results show that controlling the current, the excitation frequency of displacement, and the amplitude can all have varying degrees of influence on the variable stiffness characteristic of SR. Among them, the former two have a positive gain on the equivalent stiffness. Moreover, the results also indicate that when the excitation amplitude remains unchanged, the higher the working frequency of SR, the smaller the control current required to obtain the same equivalent stiffness. Therefore, it can be inferred that at higher sea conditions, the control energy required for natural frequency regulation by VSPAWEC is smaller.

5.3. Simulation Verification and Analysis of Frequency Tracking Control Under Regular Wave Conditions

To discuss the variable stiffness characteristics of VSPAWEC and the effectiveness of the frequency tracking controller proposed in this paper, simulations were conducted under regular wave conditions. To avoid resonance caused by the original natural frequency of PAWEC without SR, the wave frequencies used for verification were not set near the frequency point of the RAO response peak. The parameters of the sliding mode controller, which is used to ensure the tracking performance, are listed in Table 3. Specifically, δ , α , and r are used to define the piecewise nonlinear function. C 1 , C 2 and β are associated with the sliding surface design. K 1 , K 2 , v 1 , and v 2 determine the convergence characteristics of the control law. ω and ρ ω are introduced to address lumped uncertainty and boundary-layer smoothing, respectively.
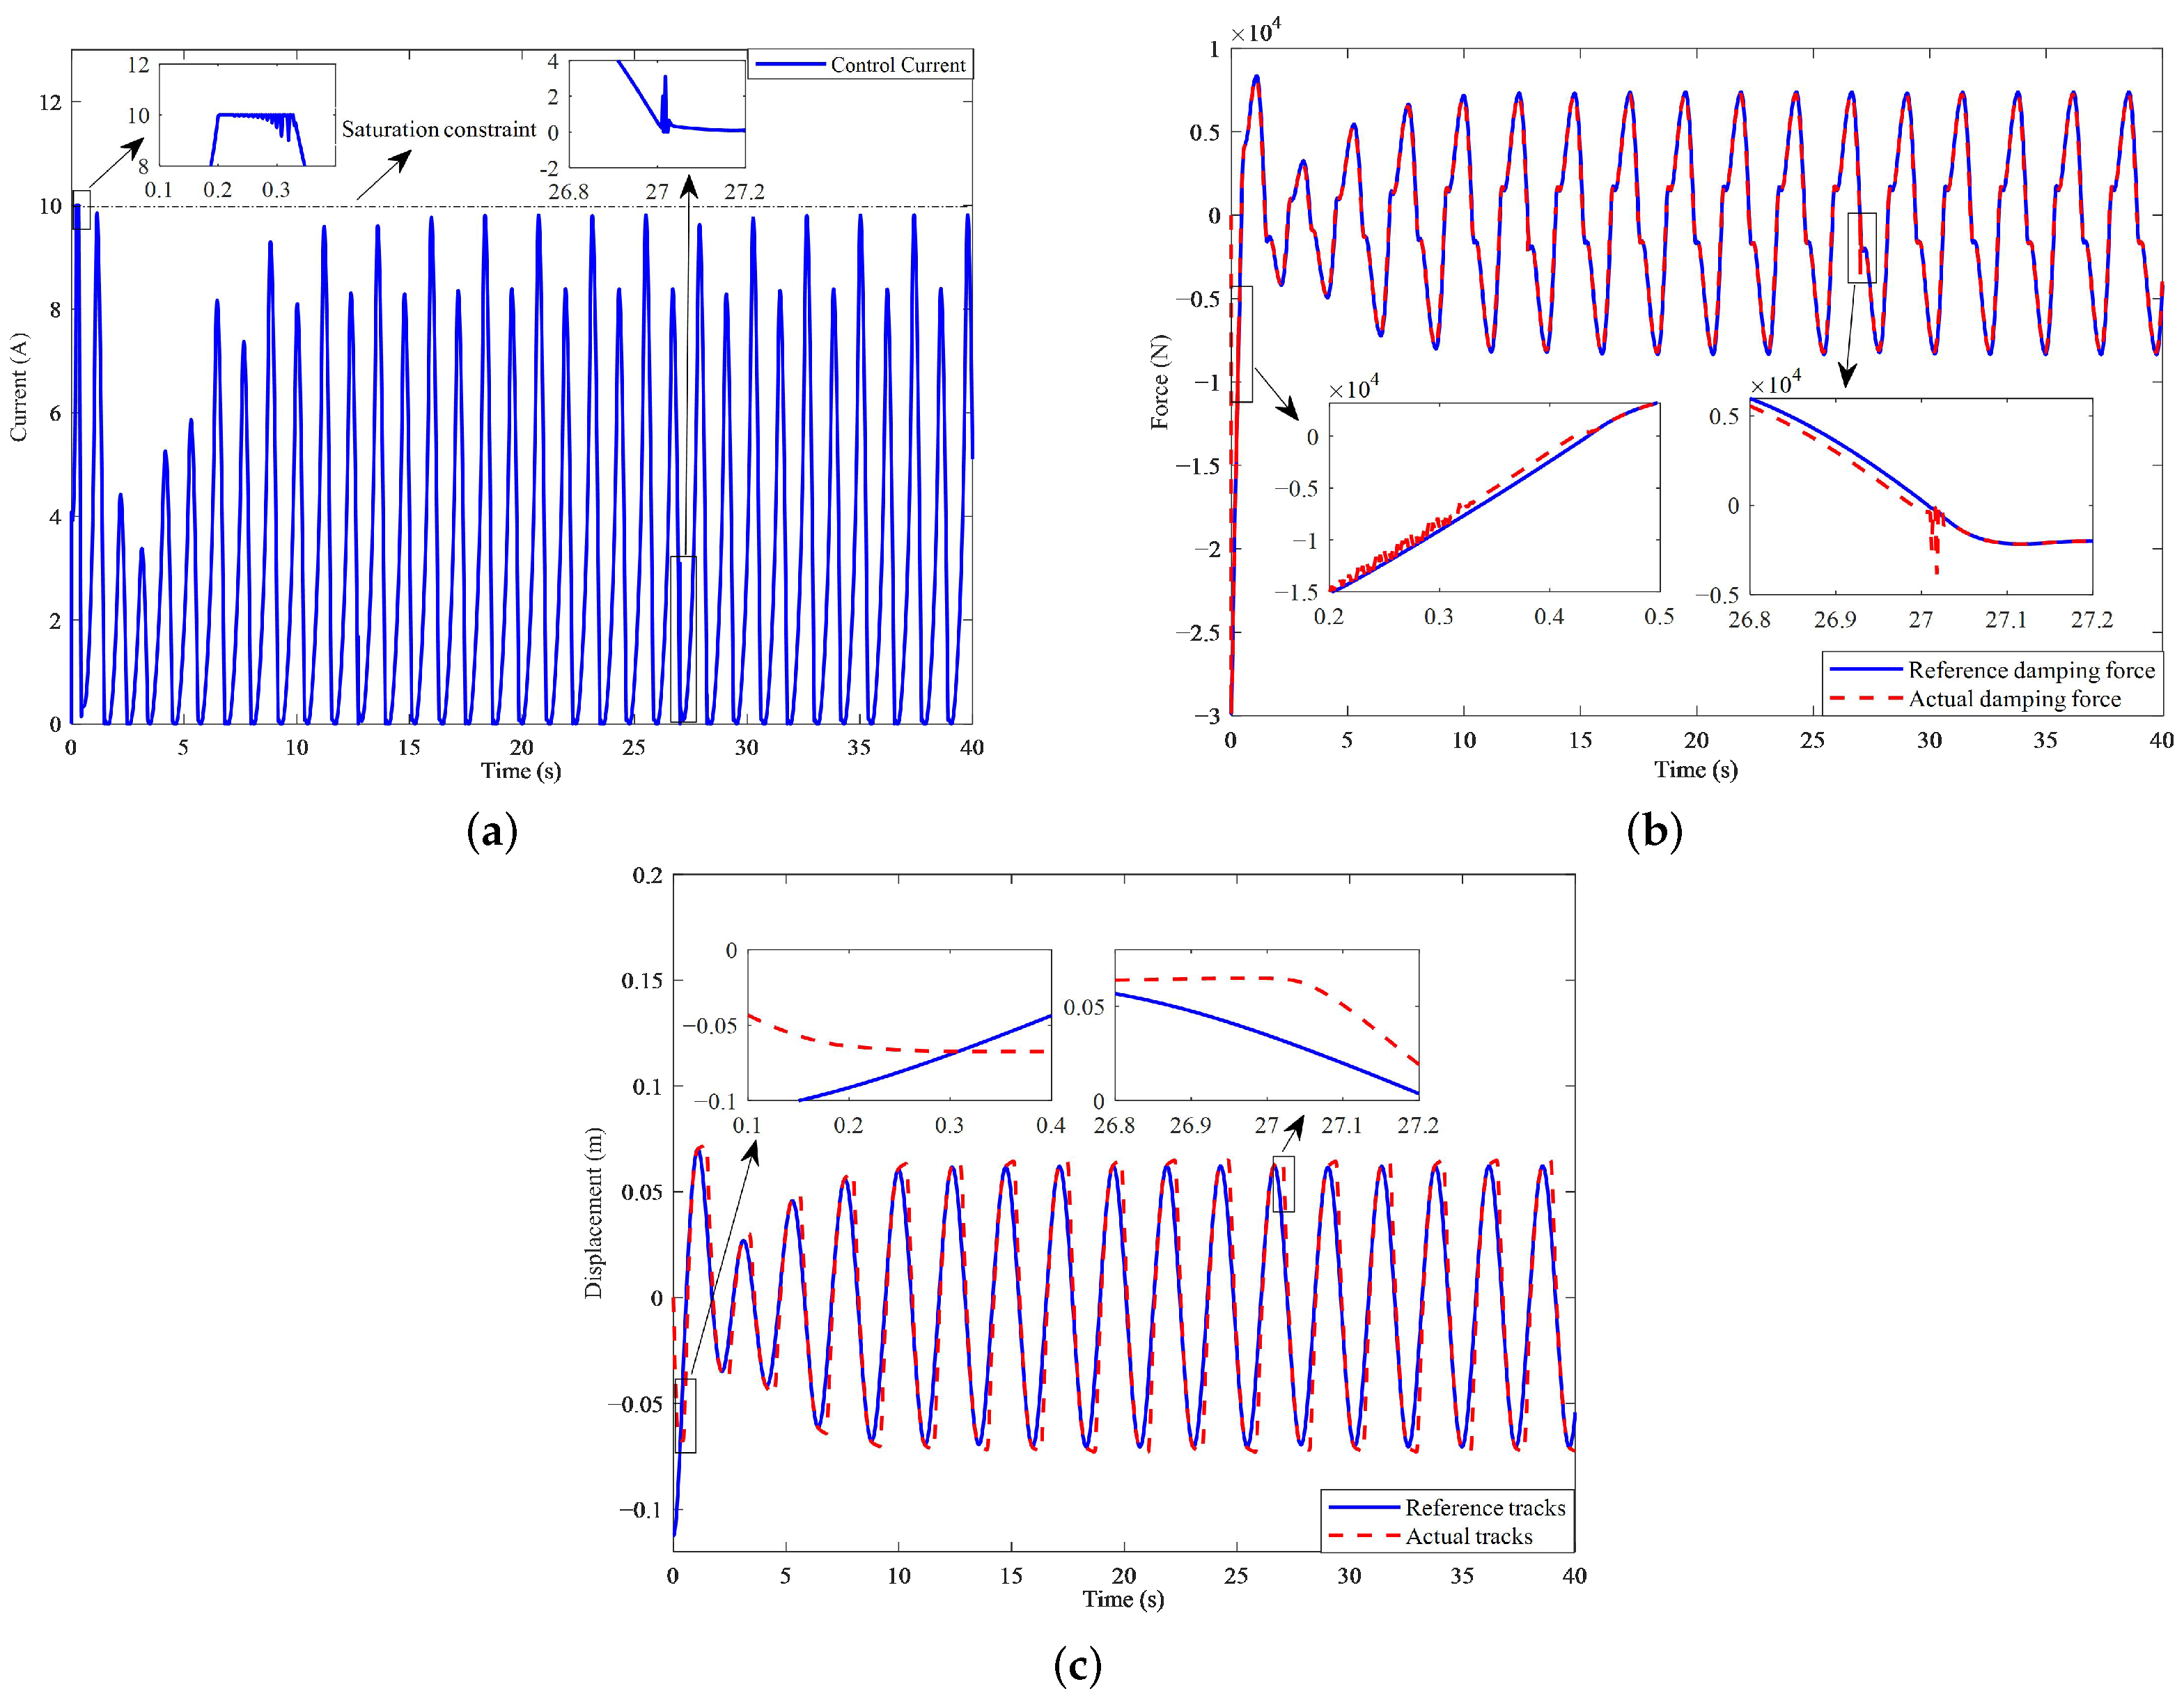
Before discussing the WEC power generation performance, the reference signal tracking performance under the condition where the control system has feedforward errors due to the MRD reverse model was analyzed. Figure 5a shows the MRD control current calculated based on the controller (30) and the reverse model (11) under a regular wave sea condition with a frequency of 0.42 Hz . Constraints were imposed on the control current to ensure it always remains within the range of 0 , 10 . Figure 5b shows the MRD damping force tracking effect under the influence of the constrained control current. It can be observed that when the control current reaches the constraint boundary, there is a slight fluctuation and tracking error in the actual MRD damping force. When the current moves away from the boundary, even if there is an error in the MRD reverse model, the controller (30) can handle it and achieve good tracking performance. The reference signal tracking effect in Figure 5c also confirms the controllability of the proposed sliding mode control algorithm for systems with uncertain characteristics.
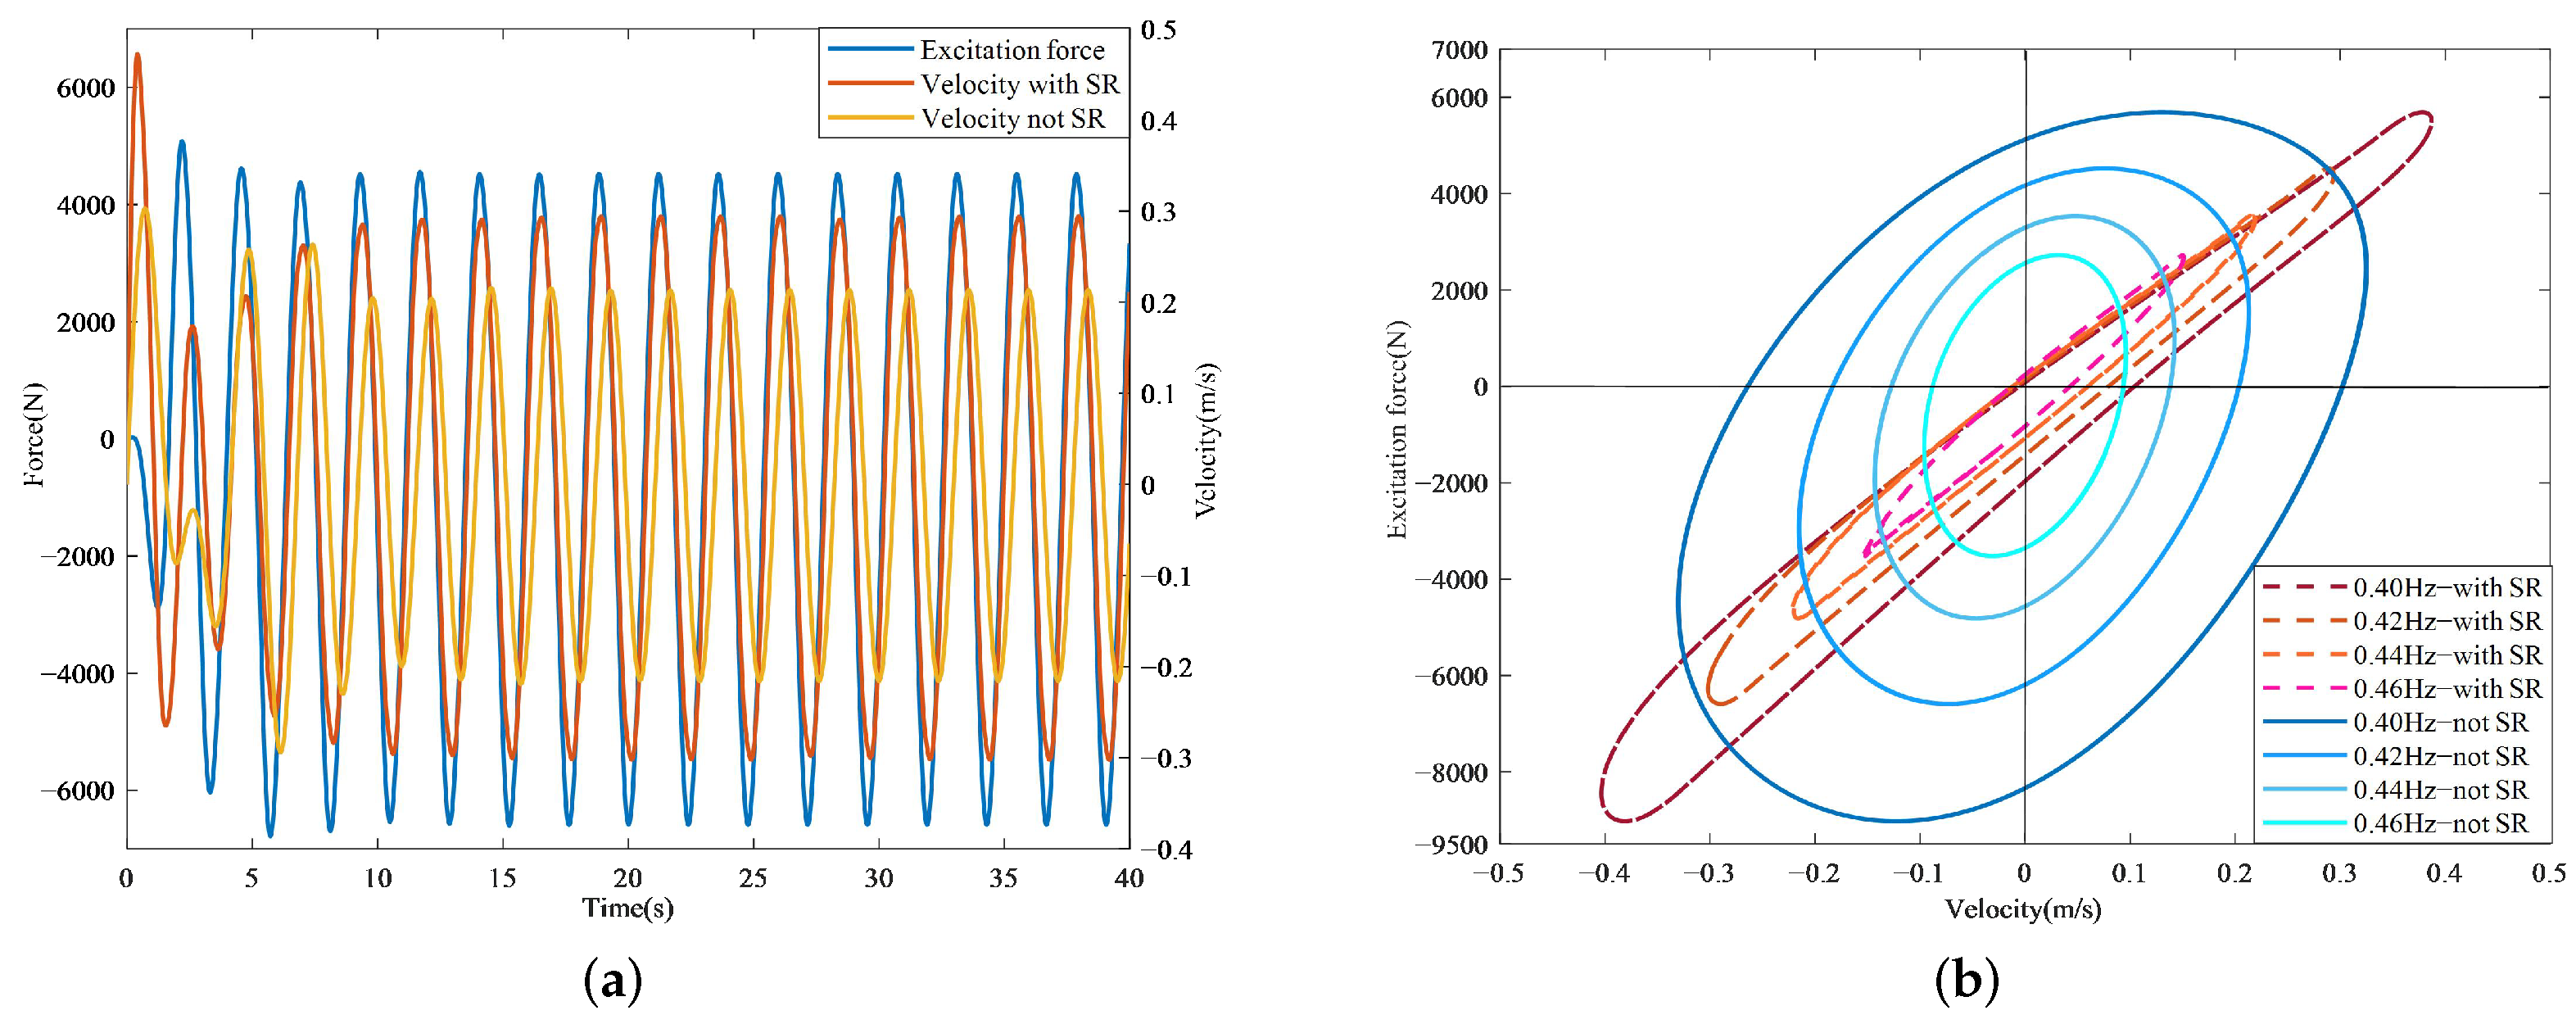
From the perspective of system response characteristics, Figure 6a shows the buoy velocity of PAWEC and the VSPAWEC buoy velocity curve under the excitation of 0.42 Hz regular wave sea conditions, as well as the effect of the frequency tracking controller. It can be observed that the buoy velocity of VSPAWEC achieved phase matching with the excitation force, indicating that the buoy and the waves have resonance. The amplitude of the buoy velocity significantly increased, while PAWEC did not exhibit a similar phenomenon. Further, Figure 6b shows the phase relationship between the buoy velocity and the wave excitation force under regular wave sea conditions ranging from 0.42 to 0.46 Hz . It should be noted that when the buoy velocity and the excitation force are in the 1st and 3rd quadrants, it means that the excitation force and the velocity direction are the same, and the waves do positive work on the buoy, allowing the WEC to capture wave energy. Conversely, when they are in the 2nd and 4th quadrants, it indicates that the force and the velocity direction are opposite, and the waves will inhibit the buoy movement, thereby dissipating the mechanical energy of the WEC. The results show that under the control of the frequency tracking controller, SR can provide certain stiffness characteristic compensation for PAWEC, enabling the buoy to resonate with the incident waves. The buoy velocity and the excitation force hardly appear in the 2nd and 4th quadrants, and the WEC will continuously capture energy from the waves.
From the perspective of energy, in order to conduct a quantitative discussion on the improvement effect of the frequency tracking controller on the power generation performance of VSPAWEC, the following energy calculation equations are defined:
W M R D = 0 t I c 2 R m r d d t
W P A W E C = 0 t C P x 2 * 2 d t
W V S P A W E C = 0 t C P x 2 2 d t W M R D
where W M R D represents the MRD control loss, W P A W E C represents the power generation of the wave energy conversion device without SR, and x 2 * represents the buoy speed without SR. W V S P A W E C represents the net power generation of VSPAWEC. Meanwhile, the power generation improvement ratio η g = W V S P A W E C W P A W E C W P A W E C is defined to evaluate the improvement effect of WEC power generation.
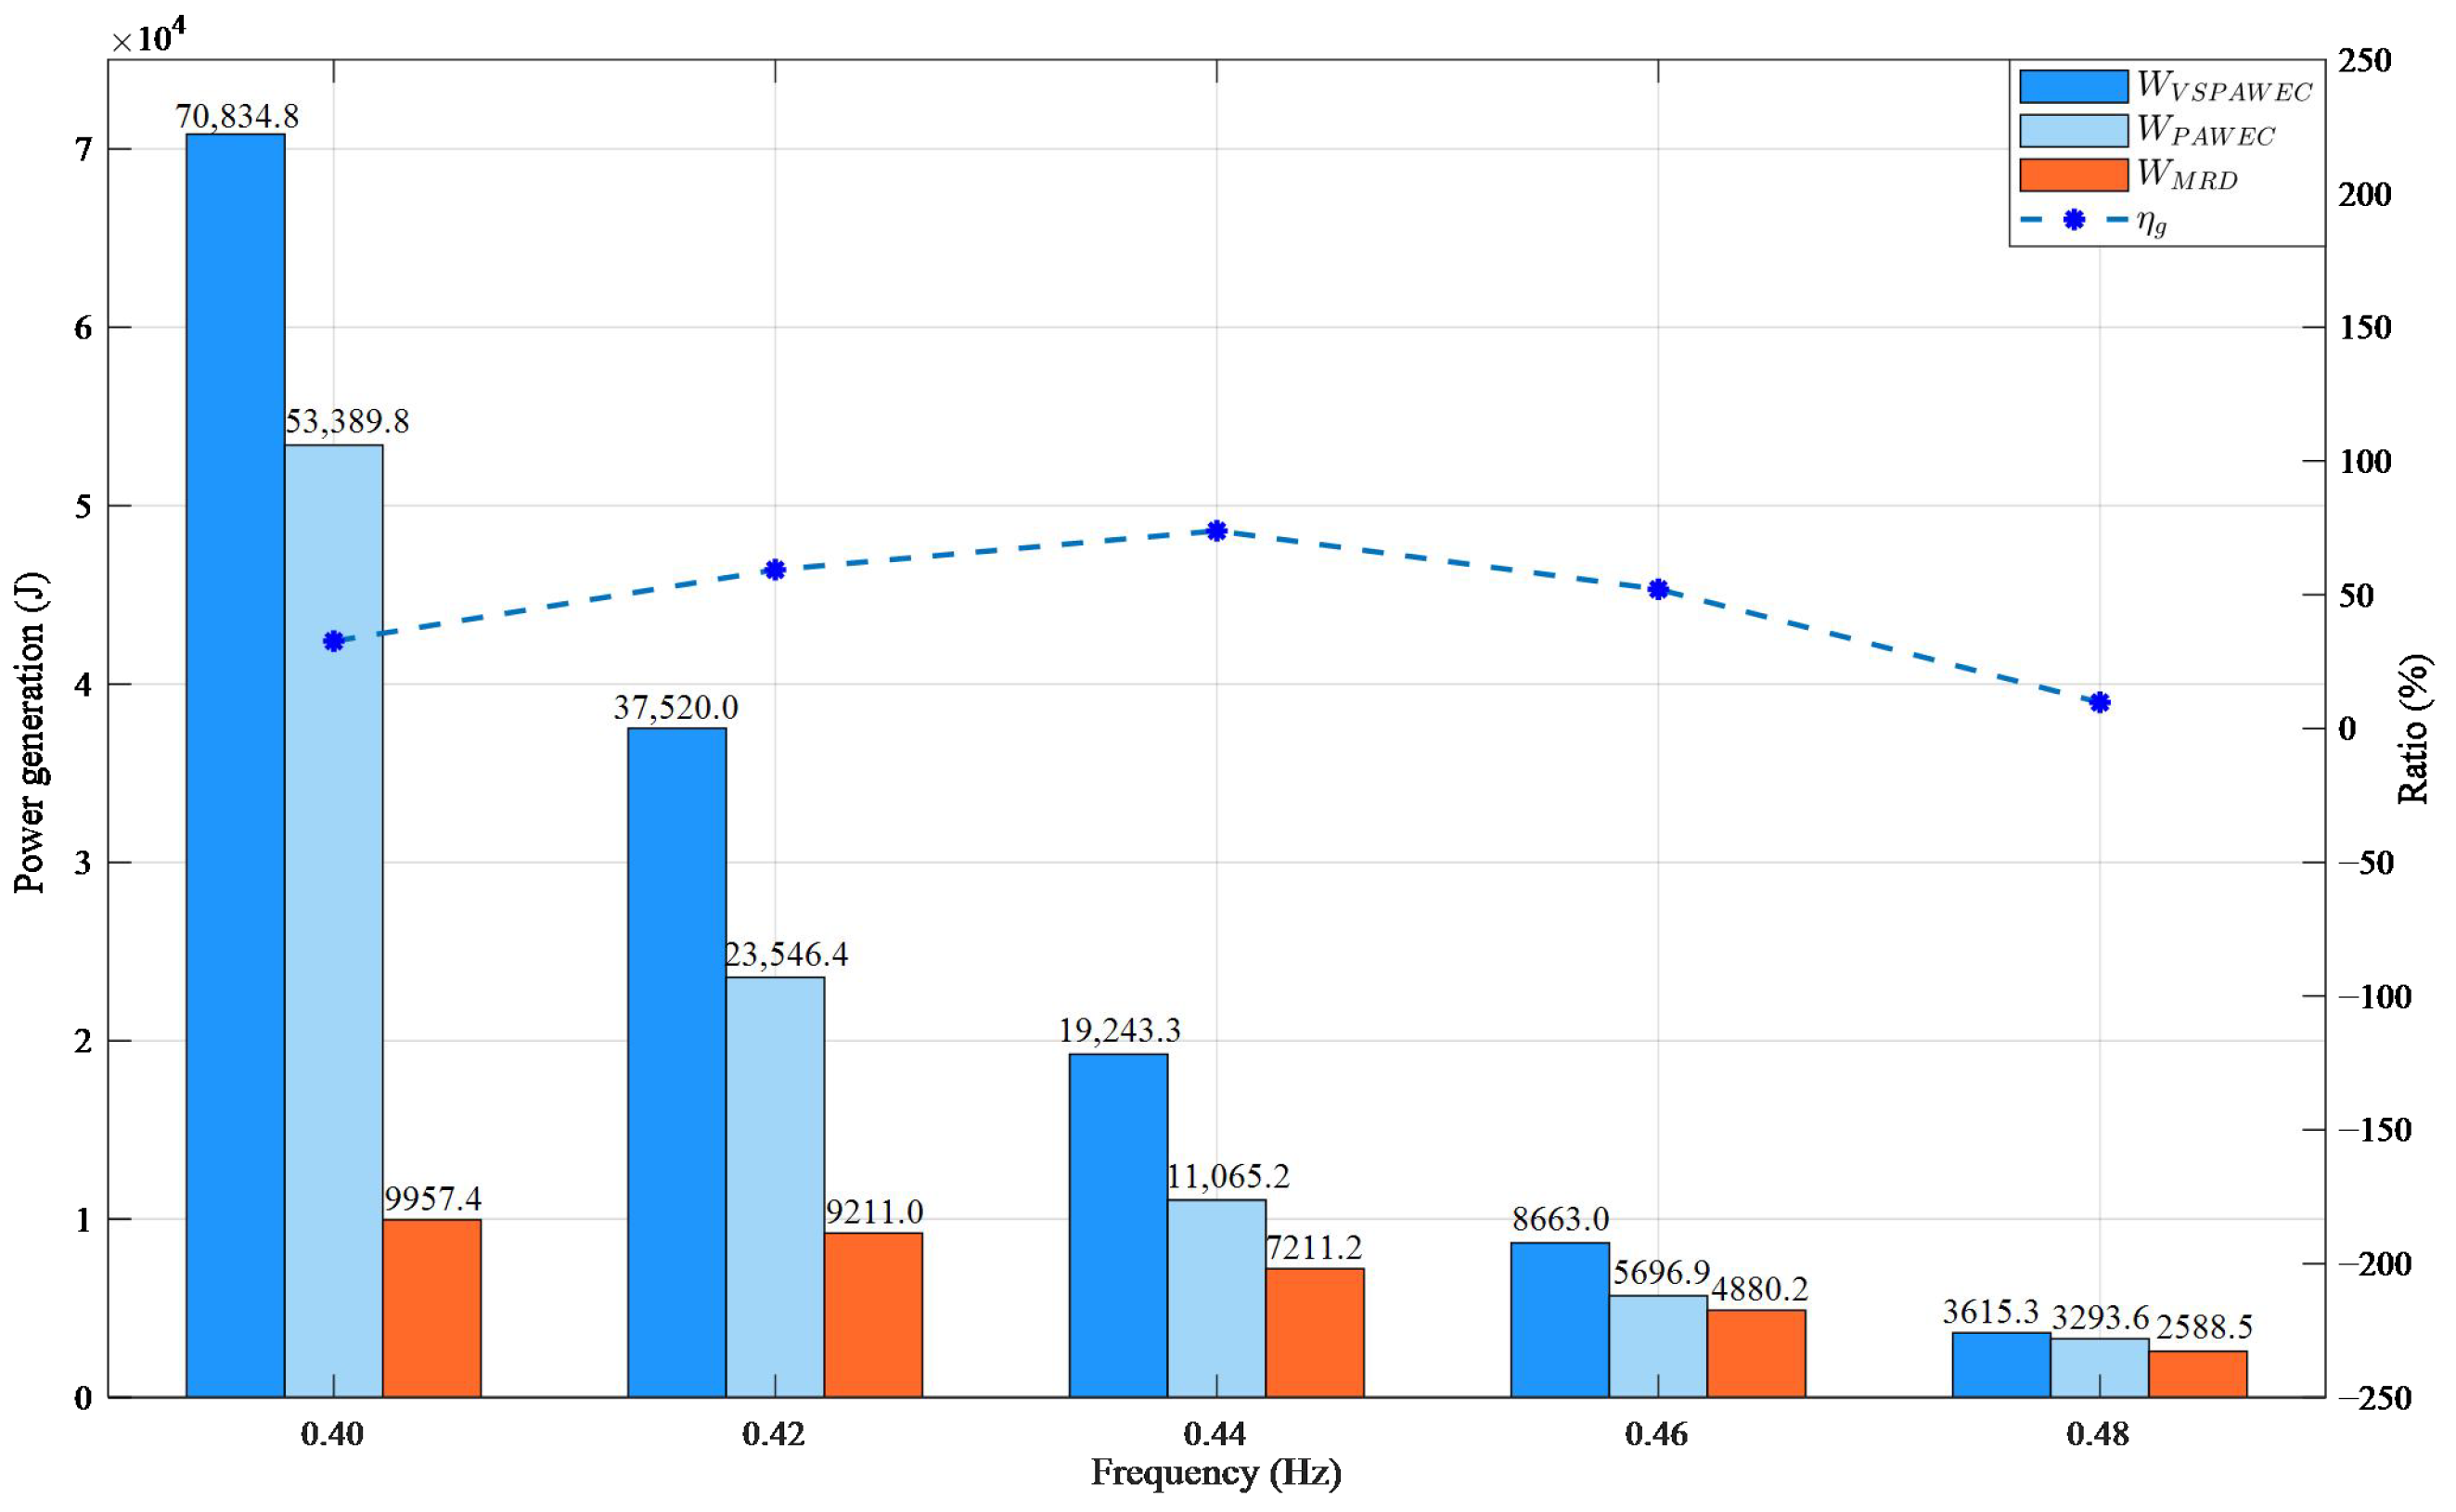
Figure 7 shows the comparison results of the total power generation of VSPAWEC and traditional PAWEC under a regular wave condition of 0.40 to 0.48 Hz , as well as the energy loss generated by controlling MRD. It is well known that waves with higher energy density are mainly distributed in the low-frequency region. Therefore, as can be seen from Figure 7, the total power generation gradually decreases as the wave frequency increases. However, regardless of the wave sea conditions at any frequency, the net power generation of VSPAWEC is always greater than that of PAWEC. This is due to the compensation of the system’s stiffness characteristics by generating appropriate spring forces in SR under the frequency tracking control, enabling the buoy to maintain resonance response at waves with frequencies higher than the original system’s natural frequency and improving the energy capture efficiency of PAWEC. In addition, the energy enhancement ratio η g shows a phenomenon of increasing first and then decreasing. It reaches the maximum value of 73.9 % at 0.44 Hz . The reason for this phenomenon is that as the frequency of the test sea conditions gradually approaches the low-frequency region, PAWEC can also gradually enter the resonance state, thereby enhancing its power generation. For VSPAWEC, due to the continuous presence of MRD control and damping effects, the power generation performance is weakened. While moving towards higher-frequency sea conditions after 0.44 Hz , the rapid decrease in wave energy density leads to the failure of fully demonstrating the power generation performance of both types of WEC, but the power generation improvement ratio still reaches 9.8 % . As concluded from the analysis of SR in the previous text, the increase in wave frequency and the decrease in wave height will enhance the stiffness compensation performance of SR, resulting in reduced energy loss required for controlling MRD. This phenomenon is more obvious in sea conditions with higher wave frequencies.

5.4. Simulation Analysis of Frequency Tracking Control in Irregular Sea Conditions

In the real marine environment, wave heights are constantly changing and the frequency components contained in the waves are quite complex. However, within the framework of linear potential flow theory, irregular waves can be regarded as a linear combination of a finite number of regular waves with different wave heights and frequencies. Therefore, the wave force data of a certain length can be subjected to the Fast Fourier Transform (FFT) to extract the dominant frequency within this length. When conducting verification of irregular sea conditions, the excitation force generated based on the JONSWAP spectrum is used to simulate the actual load of waves on the buoy in the marine environment. The period for performing the FFT transformation on the excitation force data is set at 25 s. The Aqwa calculation step size is 0.002 s. Since it has been assumed that accurate wave predictions can be made, the FFT calculation of the excitation force data is offline. Therefore, the irregular-wave simulations in this study are conducted under the ideal assumption of exact dominant-frequency information, and the influence of prediction errors or measurement noise is not considered in the present validation framework.
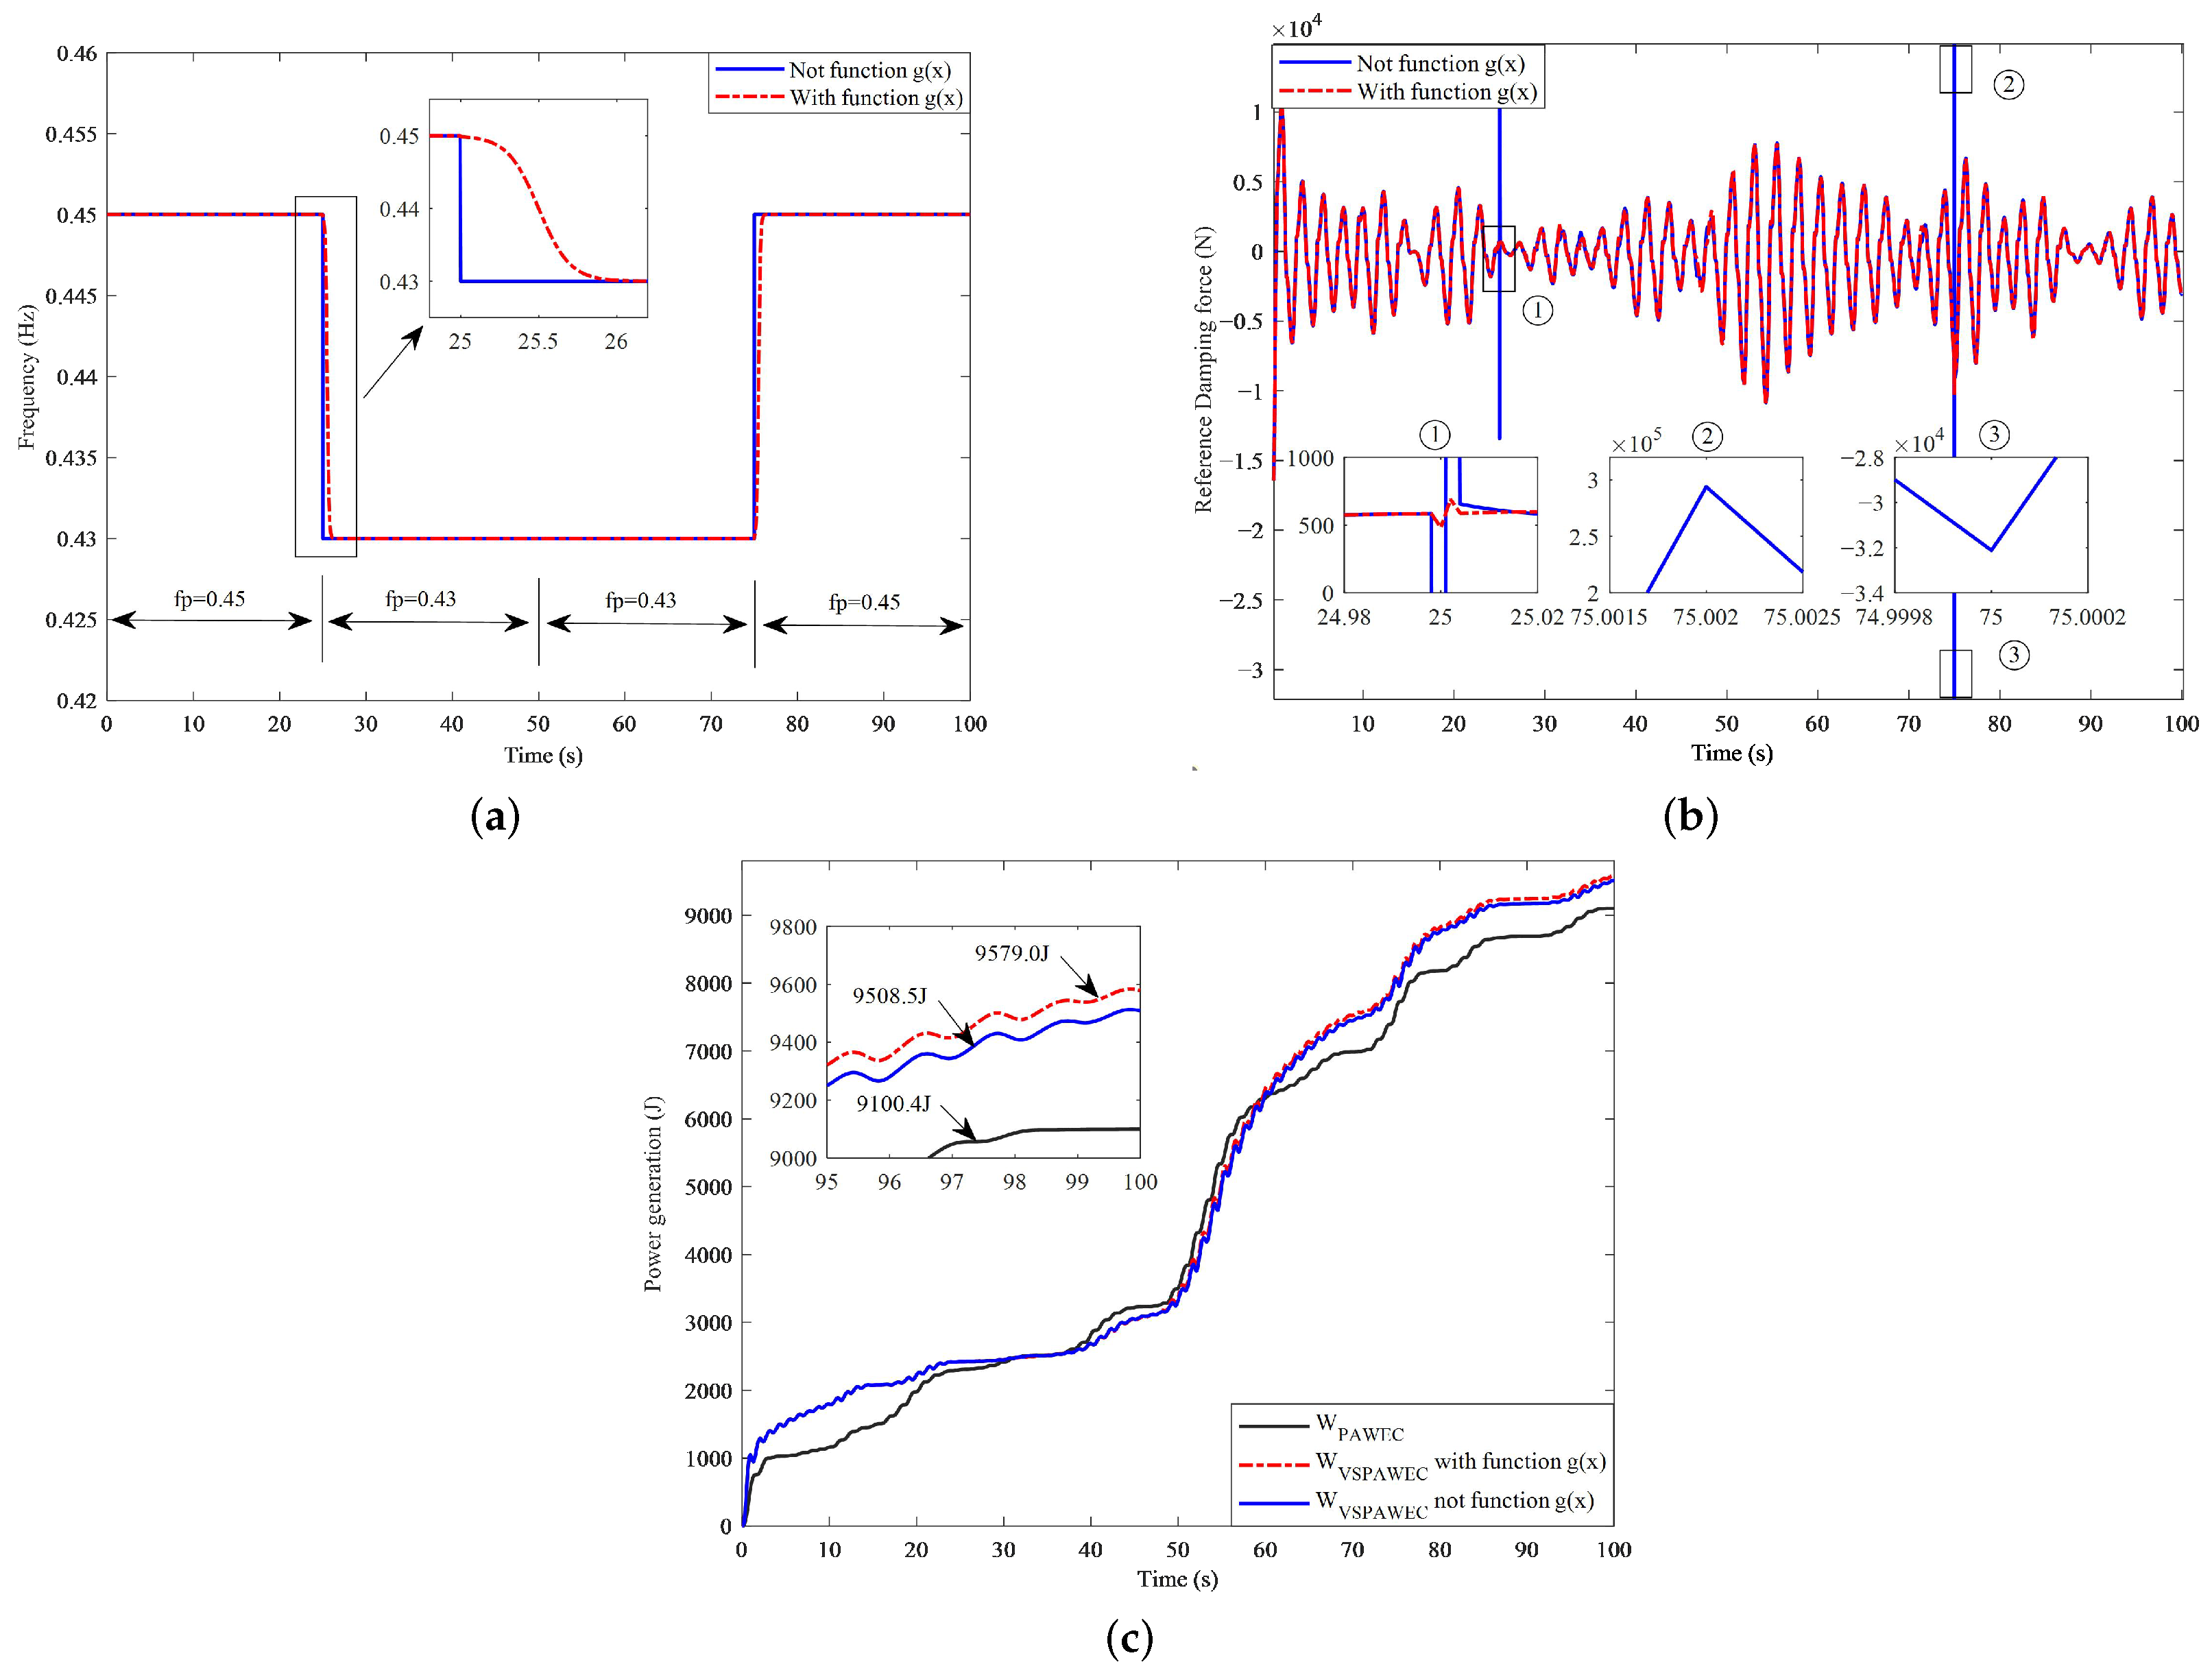
Unlike the regular wave sea conditions with a constant dominant frequency, the frequency signals extracted from the irregular excitation force data are discontinuous. Therefore, the reference signal calculated based on Equation (17) is discontinuous at the frequency switching points. When applied in practical situations, this property may cause the system to crash due to a too small control step size. Thus, the performance of the system after introducing the smoothing function (18) was discussed. Figure 8a shows the smoothing effect of the smoothing function at the frequency switching point. It can be observed that the frequency signal after processing by the smoothing function transitions slowly to the next frequency point, with a duration of approximately 1 s. The smoothing processing of the signal avoids numerical problems that occur when the sliding mode controller calculates the reference damping force. As shown in Figure 8b, the reference damping force calculated from the reference position signal without smoothing processing generates severe spikes at the frequency switching point, while the reference damping force obtained after smoothing processing is more stable, which clearly indicates that the introduced smoothing function can avoid the unstable phenomenon of the system caused by discrete frequency switching in the frequency tracking controller. Additionally, Figure 8c also discussed the power generation performance after introducing the smoothing function. The results show that the system power generation has slightly improved after introducing the smoothing function. This can be explained as using the expected damping force without abnormal spikes at the frequency switching point to calculate a more reasonable control current, avoiding the occurrence of abnormal spikes in the control current. And reducing the tracking error of the reference signal.
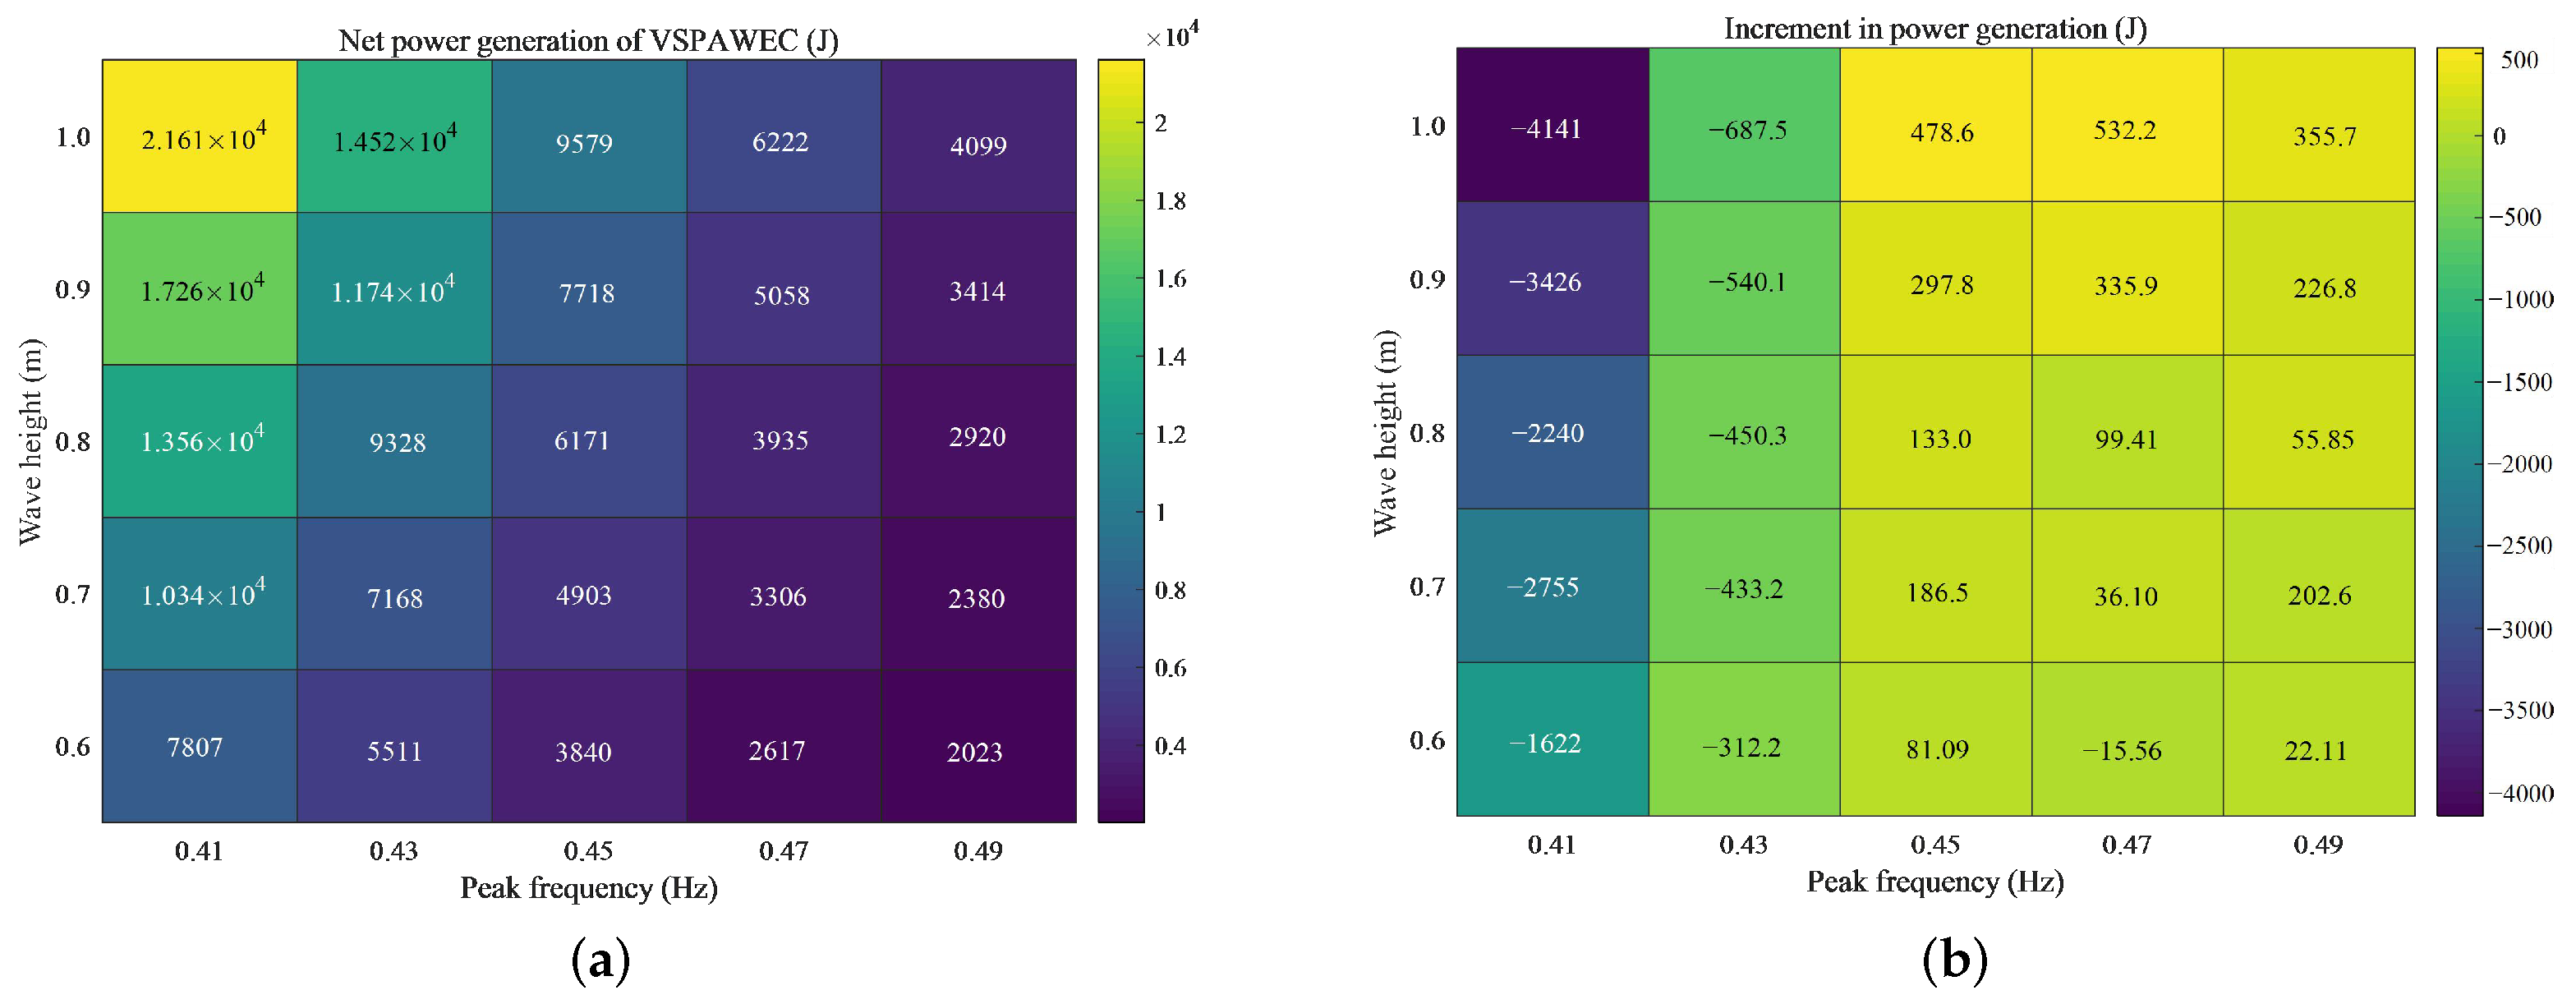
To further evaluate the simulation-based performance of the proposed frequency-tracking control strategy for VSPAWEC, numerical simulations were conducted under irregular sea conditions with peak frequencies ranging from 0.41 to 0.49 Hz and significant wave heights ranging from 0.6 to 1.0 m . As shown in Figure 9a, the net power generation of VSPAWEC increases with the significant wave height, which is consistent with the increase in available wave energy. At the same time, due to the enrichment of wave energy in the low-frequency region, the net power generation of VSPAWEC gradually decreases as the peak frequency increases. Figure 9b compares the net power generation of VSPAWEC and PAWEC. The results show that, in sea conditions with peak frequencies lower than 0.45 Hz , the power generation of VSPAWEC is slightly lower than that of PAWEC, which is consistent with the conclusion under regular-wave conditions. In low-frequency sea conditions, PAWEC gradually approaches resonance. In addition, the frequency components of irregular waves are complex, and only one dominant frequency can be extracted within one FFT analysis period, which cannot fully represent all frequency characteristics within that interval and may lead to frequency-identification errors due to spectral leakage. This further prevents VSPAWEC from achieving optimal resonance in some sea conditions, which is the main reason why its net power generation is lower than that of PAWEC in the case with a significant wave height of 0.6 m and a peak frequency of 0.47 Hz . Although there are some individual exceptions, in most of the remaining irregular sea conditions, the net power generation of VSPAWEC is higher than that of PAWEC. These results indicate that the proposed frequency-tracking control strategy can provide effective stiffness compensation for PAWEC based on the dominant wave-frequency information and can improve the power-generation performance of the system within the investigated simulation conditions.
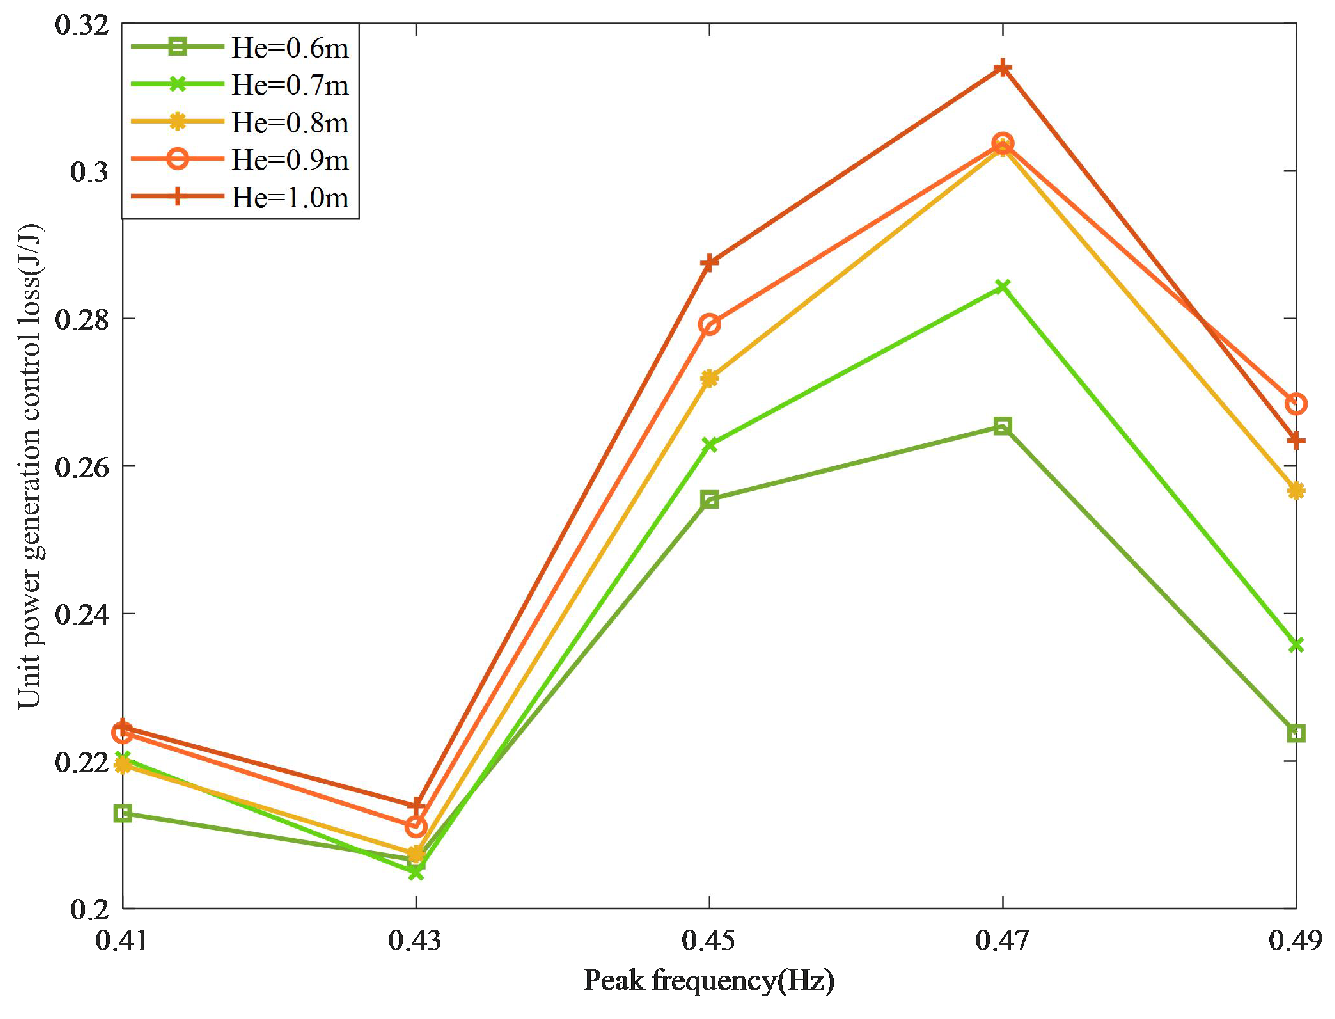
Furthermore, the control-energy cost associated with the introduction of the semi-active SR during frequency-tracking control was analyzed. Figure 10 evaluates the control loss per unit of generated power. The results show that, over the investigated operating conditions, the unit control loss remains within 0.20 to 0.31 J / J , with the maximum appearing near 0.47 Hz . In the other sea conditions, especially in the low-frequency range of 0.41 to 0.43 Hz , the unit loss is generally lower than 0.23 J / J . In addition, as the significant wave height increases, the unit control loss only changes slightly, indicating that the control-energy consumption does not increase proportionally with the generated power. These simulation results suggest that the energy cost introduced by frequency tracking and stiffness adjustment is relatively low compared with the captured wave energy, and that the proposed strategy has potential for further engineering-oriented investigation.

6. Conclusions

For the WEC power generation system, a wave energy conversion device with a stiffness regulator was designed and the dynamic model of the system was established. At the same time, a frequency tracking controller was designed for the VSPAWEC system based on the mechanism of SR. Firstly, in response to the problem that traditional WEC relies on a complex PTO structure, a double-screw direct-drive PTO was designed. Different from traditional WEC, the PTO no longer serves as a force execution device, but is replaced by a simple and responsive SR. By controlling the damping force of MRD in the SR, the natural frequency of the WEC can be adjusted, allowing the buoy to resonate as much as possible with the incident waves. Secondly, for the designed wave energy conversion device, the VSPAWEC was systematically modeled based on the linear potential flow theory and dynamic analysis. Further, the optimization problem of the power generation of the wave energy conversion device was studied. According to the mechanism of SR on PAWEC, a frequency tracking control strategy was designed. Assuming that the wave information in the future is known, the dominant frequency of the waves is extracted using FFT, and the reference position signal of the MRD piston rod is calculated based on the position information of the buoy. Then, a sliding membrane control algorithm was designed to control the MRD to track the reference signal in real time, thereby providing stiffness compensation for PAWEC. This enables the buoy to resonate with the incident waves, improving the energy capture efficiency. Numerical simulations were conducted to evaluate the variable-stiffness characteristics of the proposed VSPAWEC and the simulation-based performance of the frequency-tracking control strategy.
The simulation results under regular wave conditions show that the variable stiffness characteristic of the SR designed in this paper is simultaneously influenced by the control current, the amplitude and the frequency of the external displacement excitation. The stiffness compensation characteristic of the SR is positively correlated with the control current and the excitation frequency. In addition, when the SR is used as the stiffness adjustment mechanism of the traditional PAWEC, and appropriate control current is applied according to the wave frequency, resonance between the buoy and the incident wave can be achieved, thereby enhancing the power generation performance of PAWEC. Furthermore, the simulation results under irregular wave conditions indicate that under the control of the frequency tracking controller proposed in this paper, VSPAWEC can still achieve an increase in net power generation within a certain peak frequency range of the sea conditions, while maintaining a low level of control costs. Proving the feasibility of the frequency tracking control strategy proposed in this paper. In the future, the extraction scheme for the dominant wave frequency and the system parameters of SR can be optimized to further expand the application scope of VSPAWEC.
Overall, the present results demonstrate the numerical feasibility of using the proposed SR-based frequency-tracking strategy to improve resonance tuning and power-generation performance of PAWEC within the investigated operating range. However, the present study is still limited to a simulation-based validation framework, and broader benchmark comparison with existing methods as well as experimental validation will be important next steps. In addition, since the proposed VSPAWEC adopts a semi-active stiffness-regulation architecture with physical separation between the control unit and the PTO generation unit, the present manuscript mainly focuses on the proposed mechanism, its modeling, and its simulation-based net-energy characteristics, while a broader cross-method benchmark comparison is left for future investigation.

Author Contributions

Conceptualization, H.H. and Y.H.; methodology, J.P. and H.H.; software, J.P.; validation, J.P., H.H. and Y.H.; formal analysis, J.P.; investigation, J.P. and H.H.; resources, H.H. and Y.H.; data curation, J.P.; writing—original draft preparation, J.P.; writing—review and editing, H.H. and Y.H.; visualization, J.P.; supervision, H.H.; project administration, Y.H.; funding acquisition, H.H. and Y.H. All authors have read and agreed to the published version of the manuscript.

Funding

This research is supported by the National Key Research and Development Program of China under Grant 2023YFE0204700; in part by the National Natural Science Foundation of China under Grants 62403220 and 62373174; in part by Yunnan Fundamental Research Projects under Grants 202601CI070073.

Data Availability Statement

No new data were created or analyzed in this study.

Conflicts of Interest

The authors declare no conflicts of interest.

References

  1. Cornett, A.M. A global wave energy resource assessment. In Proceedings of the ISOPE International Ocean and Polar Engineering Conference, Vancouver, BC, Canada, 6–11 July 2008; ISOPE: Cupertino, CA, USA, 2008. [Google Scholar]
  2. Gao, Y.; Shao, S.; Zou, H.; Tang, M.; Xu, H.; Tian, C. A fully floating system for a wave energy converter with direct-driven linear generator. Energy 2016, 95, 99–109. [Google Scholar] [CrossRef]
  3. Lavidas, G.; Blok, K. Shifting wave energy perceptions: The case for wave energy converter (WEC) feasibility at milder resources. Renew. Energy 2021, 170, 1143–1155. [Google Scholar] [CrossRef]
  4. Delmonte, N.; Barater, D.; Giuliani, F.; Cova, P.; Buticchi, G. Oscillating water column power conversion: A technology review. In Proceedings of the 2014 IEEE Energy Conversion Congress and Exposition (ECCE); IEEE: Piscataway, NJ, USA, 2014; pp. 1852–1859. [Google Scholar]
  5. Falcão, A.d.O. The shoreline OWC wave power plant at the Azores. In Proceedings of the 4th European Wave Energy Conference, Aalborg, Denmark, 4–6 December 2000; pp. 42–47. [Google Scholar]
  6. Kofoed, J.P.; Frigaard, P.; Friis-Madsen, E.; Sørensen, H.C. Prototype testing of the wave energy converter wave dragon. Renew. Energy 2006, 31, 181–189. [Google Scholar] [CrossRef]
  7. Evans, D.V.; Falcao, A.F.d.O. Hydrodynamics of Ocean Wave-Energy Utilization: IUTAM Symposium Lisbon/Portugal 1985; Springer Science & Business Media: Berlin, Germany, 2012. [Google Scholar]
  8. Serman, D.D.; Mei, C.C. Note on Salter’s energy absorber in random waves. Ocean Eng. 1980, 7, 477–490. [Google Scholar] [CrossRef]
  9. Dalton, G.J.; Alcorn, R.; Lewis, T. Case study feasibility analysis of the Pelamis wave energy convertor in Ireland, Portugal and North America. Renew. Energy 2010, 35, 443–455. [Google Scholar] [CrossRef]
  10. Falnes, J.; Hals, J. Heaving buoys, point absorbers and arrays. Philos. Trans. R. Soc. A Math. Phys. Eng. Sci. 2012, 370, 246–277. [Google Scholar] [CrossRef]
  11. Ahamed, R.; McKee, K.; Howard, I. A review of the linear generator type of wave energy converters’ power take-off systems. Sustainability 2022, 14, 9936. [Google Scholar] [CrossRef]
  12. Beatty, S.J.; Hall, M.; Buckham, B.J.; Wild, P.; Bocking, B. Experimental and numerical comparisons of self-reacting point absorber wave energy converters in regular waves. Ocean Eng. 2015, 104, 370–386. [Google Scholar] [CrossRef]
  13. Guo, B.; Wang, T.; Jin, S.; Duan, S.; Yang, K.; Zhao, Y. A review of point absorber wave energy converters. J. Mar. Sci. Eng. 2022, 10, 1534. [Google Scholar] [CrossRef]
  14. Na, J.; Li, G.; Wang, B.; Herrmann, G.; Zhan, S. Robust optimal control of wave energy converters based on adaptive dynamic programming. IEEE Trans. Sustain. Energy 2018, 10, 961–970. [Google Scholar] [CrossRef]
  15. Zhan, S.; Na, J.; Li, G. Nonlinear noncausal optimal control of wave energy converters via approximate dynamic programming. IEEE Trans. Ind. Inform. 2019, 15, 6070–6079. [Google Scholar] [CrossRef]
  16. Faedo, N.; Peña-Sanchez, Y.; Ringwood, J.V. Receding-horizon energy-maximising optimal control of wave energy systems based on moments. IEEE Trans. Sustain. Energy 2020, 12, 378–386. [Google Scholar] [CrossRef]
  17. Yassin, H.; Demonte Gonzalez, T.; Nelson, K.; Parker, G.; Weaver, W. Optimal control of nonlinear, nonautonomous, energy harvesting systems applied to point absorber wave energy converters. J. Mar. Sci. Eng. 2024, 12, 2078. [Google Scholar] [CrossRef]
  18. Li, D.; Patton, R. Model predictive energy-maximising tracking control for a wavestar-prototype wave energy converter. J. Mar. Sci. Eng. 2023, 11, 1289. [Google Scholar] [CrossRef]
  19. O’Sullivan, A.C.; Lightbody, G. Co-design of a wave energy converter using constrained predictive control. Renew. Energy 2017, 102, 142–156. [Google Scholar] [CrossRef]
  20. Li, G.; Belmont, M.R. Model predictive control of sea wave energy converters—Part I: A convex approach for the case of a single device. Renew. Energy 2014, 69, 453–463. [Google Scholar] [CrossRef]
  21. Bruzzone, L.; Fanghella, P.; Berselli, G. Reinforcement learning control of an onshore oscillating arm wave energy converter. Ocean Eng. 2020, 206, 107346. [Google Scholar] [CrossRef]
  22. Bani Hani, O.R.; Khafagy, Z.; Staber, M.; Gaffar, A.; Abdelkhalik, O. Control of Wave Energy Converters Using Reinforcement Learning. J. Mar. Sci. Eng. 2026, 14, 211. [Google Scholar] [CrossRef]
  23. Zheng, S.; Zhang, Y.; Sheng, W. Maximum theoretical power absorption of connected floating bodies under motion constraints. Appl. Ocean Res. 2016, 58, 95–103. [Google Scholar] [CrossRef]
  24. Sheng, W. Wave energy conversion and hydrodynamics modelling technologies: A review. Renew. Sustain. Energy Rev. 2019, 109, 482–498. [Google Scholar] [CrossRef]
  25. Sun, P.; Xu, B.; Wang, J. Long-term trend analysis and wave energy assessment based on ERA5 wave reanalysis along the Chinese coastline. Appl. Energy 2022, 324, 119709. [Google Scholar] [CrossRef]
  26. Qiu, S.Q.; Ye, J.W.; Wang, D.J.; Liang, F.L. Experimental study on a pendulum wave energy converter. China Ocean Eng. 2013, 27, 359–368. [Google Scholar] [CrossRef]
  27. Fu, X.; Lecchini-Visintini, A. Optimisation of restricted complexity control for wave energy conversion. In Proceedings of the 2016 UKACC 11th International Conference on Control (CONTROL); IEEE: Piscataway, NJ, USA, 2016; pp. 1–5. [Google Scholar]
  28. Guo, B. Study of Scale Modelling, Verification and Control of a Heaving Point Absorber Wave Energy Converter. Ph.D. Thesis, University of Hull, Hull, UK, 2017. [Google Scholar]
  29. Budar, K.; Falnes, J. A resonant point absorber of ocean-wave power. Nature 1975, 256, 478–479. [Google Scholar] [CrossRef]
  30. Costa, P.R.; Garcia-Rosa, P.B.; Estefen, S.F. Phase control strategy for a wave energy hyperbaric converter. Ocean Eng. 2010, 37, 1483–1490. [Google Scholar] [CrossRef]
  31. Wu, J.; Yao, Y.; Li, W.; Zhou, L.; Göteman, M. Optimizing the performance of solo Duck wave energy converter in tide. Energies 2017, 10, 289. [Google Scholar] [CrossRef]
  32. Chen, Z.; Zhou, B.; Zhang, L.; Li, C.; Zang, J.; Zheng, X.; Xu, J.; Zhang, W. Experimental and numerical study on a novel dual-resonance wave energy converter with a built-in power take-off system. Energy 2018, 165, 1008–1020. [Google Scholar] [CrossRef]
  33. Cai, Y.; Huo, Y.; Liu, J.; Shi, X. Active Resonance C-Type Buoyant Flap Wave Energy Converter. U.S. Patent 11,624,346, 11 April 2023. [Google Scholar]
  34. Rahman, M.; Ong, Z.C.; Julai, S.; Ferdaus, M.M.; Ahamed, R. A review of advances in magnetorheological dampers: Their design optimization and applications. J. Zhejiang Univ.-Sci. A 2017, 18, 991–1010. [Google Scholar] [CrossRef]
  35. Jin, T.; Liu, Z.; Sun, S.; Ren, Z.; Deng, L.; Ning, D.; Du, H.; Li, W. Theoretical and experimental investigation of a stiffness-controllable suspension for railway vehicles to avoid resonance. Int. J. Mech. Sci. 2020, 187, 105901. [Google Scholar] [CrossRef]
  36. Jin, S.; Patton, R. Geometry influence on hydrodynamic response of a heaving point absorber wave energy converter. In Proceedings of the European Wave and Tidal Energy Conference, Cork, Ireland, 27 August–1 September 2017. [Google Scholar]
  37. Li, X.; Chen, C.; Li, Q.; Xu, L.; Liang, C.; Ngo, K.; Parker, R.G.; Zuo, L. A compact mechanical power take-off for wave energy converters: Design, analysis, and test verification. Appl. Energy 2020, 278, 115459. [Google Scholar] [CrossRef]
  38. Kwok, N.; Ha, Q.; Nguyen, T.; Li, J.; Samali, B. A novel hysteretic model for magnetorheological fluid dampers and parameter identification using particle swarm optimization. Sens. Actuators A Phys. 2006, 132, 441–451. [Google Scholar] [CrossRef]
  39. Zhao, G.; Cheng, Y.; Jia, Y.; Li, S.; Si, J. A Transfer-Learning-Based STL–LSTM Framework for Significant Wave Height Forecasting. J. Mar. Sci. Eng. 2026, 14, 146. [Google Scholar] [CrossRef]
  40. Zhang, L.; Jiang, F.; Huang, L.; Silva, D.; Duan, W.; Guedes Soares, C. Long-Term Significant Wave Height Forecasting in the Western Atlantic Ocean Using Deep Learning. J. Mar. Sci. Eng. 2025, 13, 1968. [Google Scholar] [CrossRef]
  41. Xie, M.; Sun, W.; Han, Y.; Ren, S.; Li, C.; Ji, J.; Yu, Y.; Zhou, S.; Dong, C. Causal Matrix Long Short-Term Memory Network for Interpretable Significant Wave Height Forecasting. J. Mar. Sci. Eng. 2025, 13, 1872. [Google Scholar] [CrossRef]
  42. Zhang, L.; Su, Y.; Wang, Z. A simple non-singular terminal sliding mode control for uncertain robot manipulators. Proc. Inst. Mech. Eng. Part I J. Syst. Control Eng. 2019, 233, 666–676. [Google Scholar] [CrossRef]
  43. Zhang, L.; Wang, Y.; Hou, Y.; Li, H. Fixed-time sliding mode control for uncertain robot manipulators. IEEE Access 2019, 7, 149750–149763. [Google Scholar] [CrossRef]
  44. Li, H.; Cai, Y. On SFTSM control with fixed-time convergence. IET Control Theory Appl. 2017, 11, 766–773. [Google Scholar] [CrossRef]
  45. Pena-Sanchez, Y.; Faedo, N.; Penalba, M.; Giuseppe, G.; Mérigaud, A.; Windt, C.; Violini, D.G.; LiGuo, W.; Ringwood, J. Finite-Order hydrodynamic Approximation by Moment-Matching (FOAMM) toolbox for wave energy applications. In Proceedings of the European Tidal and Wave Energy Conference Proceedings, Naples, Italy, 1–6 September 2019; Volume 2019. [Google Scholar]
  46. Hu, J.; Zhou, B.; Vogel, C.; Liu, P.; Willden, R.; Sun, K.; Zang, J.; Geng, J.; Jin, P.; Cui, L.; et al. Optimal design and performance analysis of a hybrid system combing a floating wind platform and wave energy converters. Appl. Energy 2020, 269, 114998. [Google Scholar] [CrossRef]
Figure 1. The structural design of SR and PAWEC. (a) The structure of SR and its working principle: Without applying current to the MRD, the displacement of the bottom end of the spring, P o s 2 , is approximately equal to the displacement of the top end, P o s 1 . The output spring force, F S R , is at its minimum at this point, and the equivalent stiffness is also at its minimum. As the current increases until the displacement of the bottom end of the spring, P o s 2 , is approximately zero, the output spring force, F S R , reaches its maximum, and at this point, the equivalent stiffness is at its maximum [35]. (b) The assembly of VSPAWEC.
Jmse 14 01040 g001
Figure 2. Equivalent physical model.
Jmse 14 01040 g002
Figure 3. WEC frequency domain analysis results. (a) WEC radiation coefficient. (b) RAO response characteristics.
Jmse 14 01040 g003
Figure 4. The variable stiffness characteristics of SR under different working conditions. (a) SR spring force-displacement relationship. (b) Equivalent stiffness varies with current, excitation frequency, and excitation amplitude.
Jmse 14 01040 g004
Figure 5. Analysis of control performance under current constraints in a 0.42 Hz regular wave sea condition. (a) Controlled by constraints to regulate the current. (b) Damping force tracking. (c) Reference signal tracking.
Jmse 14 01040 g005
Figure 6. Verification of frequency tracking control in regular wave conditions. (a) 0.42 Hz wave force and buoy velocity time history curve. (b) The phase relationship between the buoy velocity and the excitation force under different frequency sea conditions.
Jmse 14 01040 g006
Figure 7. Comparison of power generation performance under 0.40 0.48 Hz regular wave conditions.
Jmse 14 01040 g007
Figure 8. Peak frequency 0.45 Hz . In an irregular sea condition with significant waves of 1.0 m height, the influence of the smoothing function g ( x ) introduced to mitigate the impact on power generation performance. (a) Frequency switching effect comparison. (b) The influence of the smooth function on the expected damping force. (c) The influence of smooth functions on power generation performance.
Jmse 14 01040 g008
Figure 9. Performance analysis of VSPAWEC under irregular sea states with peak frequencies of 0.41 0.49 Hz and significant wave heights of 0.6 1.0 m . (a) VSPAWEC’s net power generation. (b) W V S P A W E C W P A W E C .
Jmse 14 01040 g009
Figure 10. Controlled losses in terms of unit power generation under different sea conditions.
Jmse 14 01040 g010
Table 1. Simulation parameters of WEC.
ParameterValues
Diameter of the buoy d 3.00 m
Height of the buoy h 3.00 m
The height of the bottom cone h r 0.50 m
Equivalent total mass M a l l 13,937.54 kg
Draught d t 1.10 m
Equivalent total PTO damping C B 10.00 kN · s / m
Center-of-mass coordinate m c ( 0 , 0 , −0.2)
Table 2. SR simulation parameters.
ParameterValues
Hysteresis ratio constant d 0 4.25 N
Hysteresis ratio coefficient d 1 747.4 N / A
Hysteresis width constant b 0 3.02 mm 1
Hysteresis width coefficient b 1 2.23 ( mm · A ) 1
Damping constant c 0 5.175 N · s / mm
Damping coefficient c 1 11.863 N · s / ( mm · A )
Hysteresis slope ratio factor α 0.061 s / mm
Damping coefficient of the damper k 0 0 N / mm
Offset damping force f 0 0 N
Equivalent resistance of the coil R m r d 4.5 Ω
Equivalent mass of spring and piston M s 120 kg
Coefficient of spring stiffness K s 150 kN / m
Table 3. Parameters of the sliding mode control algorithm.
ParameterValuesParameterValues
δ 0.2 α 0.8
r 1.8 β 1.1
C 1 5 C 2 1.5
K 1 3 K 2 5
v 1 1.1 v 2 0.8
ω 1 ρ ω 100
Disclaimer/Publisher’s Note: The statements, opinions and data contained in all publications are solely those of the individual author(s) and contributor(s) and not of MDPI and/or the editor(s). MDPI and/or the editor(s) disclaim responsibility for any injury to people or property resulting from any ideas, methods, instructions or products referred to in the content.