Article

Numerical Investigation of Hydrodynamic–Power Take-Off Coupling in a Modified FOWC Using an Orifice-Based Turbine Surrogate

by
A. H. Samitha Weerakoon
1,*,
Ali Alkhabbaz
2 and
Mohsen Assadi
1
1
Faculty of Science and Technology, University of Stavanger, 4021 Stavanger, Norway
2
Sustainable Energy Engineering Department, College of Engineering, University of Mosul, Mosul 41002, Iraq
*
Author to whom correspondence should be addressed.
J. Mar. Sci. Eng. 2026, 14(10), 934; https://doi.org/10.3390/jmse14100934
Submission received: 19 April 2026 / Revised: 12 May 2026 / Accepted: 13 May 2026 / Published: 18 May 2026
(This article belongs to the Special Issue Wave-Driven Ocean Modelling and Engineering)

Abstract

This study presents a comprehensive numerical investigation of a modified backward bent duct buoy (BBDB) floating oscillating water column (FOWC) system, with emphasis on coupled hydrodynamic response and power take-off (PTO) representation. A fully integrated computational framework is developed using SIEMENS STAR-CCM+, ANSYS AQUA and ANSYS CFX, and three-dimensional CFD, incorporating free-surface wave modeling (VOF), six-degree-of-freedom (6-DOF) body motion, and mooring system interaction under realistic offshore wave conditions (Hs = 3.0 m, T = 9.0 s). A key contribution of this work is the development of an orifice-based PTO surrogate calibrated to replicate turbine-equivalent pressure-drop behavior. Comparative analysis demonstrates that the selected 0.30D orifice reproduces turbine response with deviations below 10% in pressure and flow characteristics, while maintaining superior numerical stability. Hydrodynamic analysis confirms that the modified BBDB-FOWC exhibits stable and bounded motion, with dominant heave-driven response and controlled pitch behavior. The influence of viscous damping is quantified through free-decay analysis and incorporated into the coupled simulations. Results show that damping enhances pressure development by ~25% and flow throughput by ~20%, leading to a significant increase in energy extraction potential. Dimensionless analysis further reveals that the system operates in a turbulent, inertia-dominated regime, governed by nonlinear oscillatory flow dynamics. The combined results demonstrate that the proposed methodology enables accurate, stable, and computationally efficient modeling of floating OWC systems with realistic PTO behavior. The findings provide a scalable framework for future optimization and support the development of high-performance offshore wave energy converters.

1. Introduction

Climate change and geopolitical issues are posing immense threats to civilization more than ever before. “Carbon neutrality by 2050” is currently the global urgent mission [1]. Key to achieving this goal is empowering the global renewable energy resources [2]. Other than commercially viable renewables such as solar (PV) and wind, “wave energy” shows great prospective in covering the gap between carbon reduction and increasing energy demand, being a relatively untapped resource [3]. In contrast to aforementioned two forms of renewable energy, solar and wind power, wave power offers numerous benefits: (i) wave power boasts a high-energy density, surpassing that of wind and solar power by more than ten (10) times; (ii) availability of wave power is notably high, reaching 90%, whereas wind and solar range from 20% to 30%; (iii) it imposes minimal environmental impact; (iv) wave energy output can be seamlessly integrated into existing wind or solar power facilities, serving as a complementary resource to stabilize power output and mitigate variability; (v) wave power exhibits greater predictability, enhancing flexibility in regional or national power management and planning [4]. Ocean waves accumulate a substantial renewable energy source, in particular wave power, that constitutes a significant global wave resource of 1–10 TW from the ocean energy domain [5]. Theoretical assessment shows that global wave power accumulates 32,000 TWh/year (with a mean power of 3.65 TW) [6]. For usable wave resources, excluding areas with wave power levels < 5 kW/m, the global estimate is around 3 TW [7]. This dense wave resource is found in off-shore locations [8]. Wave energy converters (WECs) are designed to transform wave energy into electrical or mechanical power by extracting energy from incoming waves [9]. K. Rezanejad et al. (2017) [10] reported that over a thousand WEC patents were registered by 1980 and this number has been steadily rising, with the Oscillating Water Column (OWC) being a popular choice due to its simple design and construction. This popularity is further confirmed by the prevalence of OWCs among deployed full-scale WECs (Refer A. H. Samitha Weerakoon et al. (2021) [11]), where they constitute a large portion of operational prototypes [11]. However, with increasing interest in deploying WECs, they play a major role in near-shore environments (water depths < 30 m), as shown in the EU 2023 report on Ocean Energy about the EU and Global [12]. But the opposite is seen with offshore WEC deployment [13], especially due to severe and hash ocean conditions prevailing in deep sea states [14]. But this common excuse and misconception acts as a drought for the progress of active research and development of offshore WECs. Off-shore wave energy harnessing is a challenging process, at initial stages of Technology Readiness Levels of 0~2 (TRL), but with TRL offshore technology is expected to be uplifted (>4) [6,15,16,17,18,19], and thus offshore WEC technology is expected to gain exponential growth in the near future combined with offshore oil rigs and retrofitted platforms [20,21], with deep sea mining soon becoming the global active project [22,23,24]. Maturity of offshore floating WEC types for elevated TRL growth were further identified in Refs. [25,26] as the Floating Oscillating Water Column (FOWC) [27] devices through numerical and real-world testing (tank tests, scale down prototype…, etc.) [28,29,30].
To facilitate the development and serve as benchmarks for wave energy converters, the National Renewable Energy Laboratory (NREL) and Sandia National Laboratory, with financial support from the U.S Department of Energy (DoE), have established reference models for marine renewable energy, encompassing wave and tidal energy [31]. Among these, a BBDB has been designated as one of the 03 reference wave energy converters, denoted as RM6 [32]. The other two reference models include the floating-point absorber, RM3, and the bottom-fixed oscillating surging wave energy converter, RM5 [33]. This research focuses on conducting a systematic examination of the reference BBDB-FOWC-WEC to enhance understanding of its hydrodynamic and power performance by modifying the fluid column to evaluate the wave hydro power extraction capability under simulated off-shore sea states. The primary emphasis of this work lies in the hydrodynamics of the RM6 BBDB as FOWC, addressing fundamental issues such as numerical convergence, motion coupling and decoupling, and crucially, methods for identifying and optimizing the device to enhance motion performance for more efficient wave energy conversion.

1.1. Literature Survey

Wave energy conversion has continued to evolve toward more integrated, offshore-capable, and hydrodynamically sophisticated systems. Among the major WEC classes, OWC devices remain one of the most extensively investigated due to their structural simplicity, survivability, and adaptability to both fixed and floating applications. Recent research has expanded from conventional fixed OWCs toward floating OWCs, hybrid platforms, array configurations, and wave-to-wire frameworks, with increasing emphasis on hydrodynamic coupling, PTO control, and numerical fidelity. In this context, the BBDB has emerged as a particularly important floating OWC concept due to its ability to exploit both rigid-body motion and internal water-column oscillation for wave energy capture. Recent review work has further shown that BBDB research has grown sufficiently to justify dedicated meta-analysis, with one review compiling 102 publications, identifying an optimal wavelength-to-device-length ratio of about 2.2, an 32% average reduction in efficiency under irregular waves, and nozzle opening ratios clustering near 1.0% [28].
A first major research direction concerns high-fidelity hydrodynamic modeling of floating and moored WEC systems. Oronzo Dell’Edera et al. (2024) [34] developed a coupled high-fidelity framework integrating STAR-CCM+ and MoorDyn to simulate wave interaction with moored floating bodies and validated the model against experimental data for ISWEC and PeWEC devices. Their work demonstrated that CFD–mooring coupling can reproduce kinematics, mooring tensions, and pressure loads with good accuracy, highlighting the importance of resolving fluid–structure–mooring interactions in floating WEC design. Yong Cheng et al. (2024) [35] extended this perspective to a system of multiple OWCs integrated with a very long floating breakwater, showing that hydroelastic coupling, gap resonance, and spatial chamber interaction strongly affect both wave attenuation and energy conversion. Their parametric study showed that the highest energy conversion occurred near the end OWCs for medium-period waves and near the middle OWCs for long-period waves, while the constructive resonant gap effect amplified conversion peaks but could also trigger sudden deterioration in transmission-coefficient curves. Yinong Hu et al. (2026) [36] likewise examined a multi-module flexible pontoon breakwater integrated with OWCs and identified favorable design ranges such as a chamber width ratio of b/h = 0.4, 4–5 OWC chambers, a chamber spacing ratio of l0/h = 2.0, and a bottom-opening ratio of c/h = 0.2–0.3. These studies collectively demonstrate that floating WEC performance is governed by strong coupling between hydrodynamics, structural response, hydroelasticity, and station-keeping.
A second research stream focuses on hybrid offshore systems combining WECs with other marine structures, especially offshore wind platforms and breakwaters. Yu Zhou et al. (2023) [37] experimentally investigated an OWC integrated into a floating offshore wind turbine (FOWT) foundation and reported that the OWC improved heave stability by up to 54.1%, while an air-chamber opening ratio of 3.0% yielded the maximum relative capture width. Zhao Liu et al. (2024) [38] proposed an annular OWC integrated with a bottom-standing offshore wind turbine and showed that piston-mode resonance could yield wave-power absorption exceeding 80% of the incident wave energy over a width of 2B, when the chamber breadth and draft were set to 1.0 and 1.5 times the monopile radius, respectively. Dahai Zhang et al. (2022) [39] established a coupled dynamic framework for FOWT–OWC hybrid platforms and showed that PTO control can simultaneously affect wave power production and platform motion suppression; for example, one control strategy reduced platform pitch by 15%, while another reduced tower-base fatigue loads by 6%. More recently, G. S. Machado et al. (2026) [40] assessed a semi-submersible FOWT integrated with OWCs and found that OWC integration increased pitch motion by approximately 28–70% near rated wind speed, while the additional wave-energy contribution at low wind speeds remained relatively small, around 0.65% of wind-turbine output. These studies confirm that hybridization can improve functionality, but they also reveal that wave energy conversion, body motion, and platform stability must be treated as a strongly coupled design problem.
A third major body of literature addresses OWC chamber design, geometry optimization, and hydrodynamic performance enhancement. Lixian Wang et al. (2024) [41] investigated a dual-chamber OWC with a horizontal bottom plate and showed that the added plate enhanced energy extraction, with an optimal plate length of 1.5 times the total chamber breadth and an optimal slot opening ratio of 1.0%. T.A. Harikrishnan et al. (2025) [42] experimentally studied an L-OWC integrated with cylindrical floating breakwaters and reported a maximum efficiency of approximately 30% under optimal model-scale conditions (wave period ≈ 1.8 s, wave height = 0.06 m) using three breakwaters. S. Sohrabi et al. (2024) [43] considered a hybrid floating breakwater–WEC based on overtopping and showed that a 30° slope provided the best balance between overtopping power and wave attenuation, producing a maximum power of 1.98 kW/m and a hydraulic efficiency of 11.2%. Z. Liu et al. (2024) I [44] investigated a multi-level CROWN overtopping device and found that the optimal slope ratio was 1:2.00, with 12 guide vanes providing the best overtopping performance. M.M. Goulart et al. (2024) [45] experimentally studied an onshore overtopping device using construtal design and confirmed that lower ramp aspect ratios maximized water accumulation in the reservoir, with numerical predictions validated to within a maximum relative error of 3.92%. These studies show that geometry optimization remains central to WEC development, but the optimum configuration is highly device-specific and often depends on the targeted wave regime and power conversion pathway.
A fourth research direction is the continued development of BBDB-specific hydrodynamics and performance analysis. Z. Liu et al. (2024) II [46] experimentally studied a BBDB OWC under different motion constraints and demonstrated that pitching and heaving motions affect energy capture differently; the peak capture width ratios (CWR) for fixed, pitch-only, heave-only, and combined heave–pitch conditions were 0.57, 0.51, 0.10, and 0.26, respectively, while their corresponding average values were 0.19, 0.19, 0.03, and 0.11. H. Xu et al. (2025) I [47] numerically investigated the contribution of individual and combined motion modes to floating pneumatic BBDB performance and showed that yaw, sway, and roll have minimal influence compared with surge, heave, and pitch. Their work also showed that the dominant contributor to energy conversion shifts from surge at short wave periods (about 4 s) to heave at longer periods (up to 9 s). H. Xu et al. (2025) II [48] further examined BBDB arrays and found that lateral spacing has a stronger influence than longitudinal spacing, with array CWR increasing by up to 15.6% relative to isolated devices and reaching a maximum of 1.405 in a 3 × 3 array. W. Zhu et al. (2026) [49] experimentally enhanced a floating BBDB by adding a damping plate and demonstrated that selective attenuation of heave and pitch can improve pneumatic power output and broaden the capture bandwidth, with a maximum CWR of 1.43 for a damping-plate ratio of d1/d2 = 0.10, at a wave amplitude of 0.015 m and a period of 1.3 s. Meng Li et al. (2019) [50] earlier showed that a pentagonal BBDB with reciprocating airflow could reach a mean CWR of 121.91% in regular waves, while a unidirectional-airflow version still achieved 100.94% in regular waves and 62.83% under irregular waves. Huanbin Yang et al. (2026) [51] later reviewed 102 BBDB-related publications and identified several general design trends, including an optimal wavelength-to-device-length ratio near 2.2, nozzle opening ratios clustering near 1.0%, and clear discrepancies between turbine- and orifice-based assessments. These findings are particularly relevant to the present study because they confirm that BBDB performance depends strongly on coupled motion, damping, and PTO representation.
A fifth important area concerns PTO systems, wave-to-wire modeling, and control strategies. Zhen-yu Ding et al. (2025) [52] developed a wave-to-wire numerical model coupling an OWC chamber, an impulse turbine, and a permanent magnet synchronous generator, and showed that full system coupling can accurately predict power output and stage-wise conversion efficiency; under one experimental condition with an incident wave height of 0.075 m, the average electrical output reached 11.2 W and the reported wave-to-wire efficiency reached 98% for that specific scaled configuration. A. T. Asiikkis et al. (2024) [53] optimized hydraulic PTO designs for a dense point-absorber array and showed that distributed accumulator placement can significantly improve power production. Ben McGilton et al. (2025) [54] investigated optimal PTO sizing across different WEC archetypes and concluded that near-optimal PTO sizing may reduce costs substantially without significant energy loss, and that this trend may even be partly independent of device type and deployment location. A.A.D. Carrelhas et al. (2026) [55] introduced a complete floating OWC model in WEC-Sim with turbine-generator performance and mooring integration, demonstrating that a meaningful floating OWC can be simulated in a reduced-order wave-to-wire environment. Bo Yang et al. (2024) [56] provided a broad review of PTO systems and control strategies, while MD. Shajratul Alam Towhid et al. (2026) [57] reviewed recent advances in OWC chamber design, turbines, and adaptive control, highlighting unresolved challenges in turbine–chamber interaction, airflow losses, and nonlinear control under irregular waves. Hao Qin et al. (2025) [58] extended this direction further by coupling CFD and deep reinforcement learning for latching control of a point absorber, achieving more than 30% conversion efficiency under irregular waves. Together, these studies show that PTO representation and control are now central to WEC research, but most such work remains device-specific and often separated from full offshore CFD treatment.
A sixth strand of literature focuses on hybrid and non-conventional WEC concepts. M. Masoomi et al. (2023) [59] investigated a hybrid OWC–point absorber configuration and showed that, although efficiency decreased in some conditions, several cases produced improved performance relative to standalone systems. Wenbin Lai et al. (2024) [60] proposed a built-in WEC integrated into a floating platform and demonstrated dual resonance frequencies and favorable conversion behavior, with an experimentally measured average mechanical efficiency of 49.17% and a total conversion efficiency of 36.43%. Yang Yi et al. (2025) [61] developed a fully coupled wave-to-wire model for a floating point-absorber array with a hydraulic system and permanent magnet synchronous motor, reporting efficiencies up to 62.86% after optimization, while active motor-displacement control raised high-frequency efficiency to 55.1% at 1.5 rad/s. S.K Dash et al. (2026) [62] studied a nearshore hybrid WEC combining a piezoelectric device with a pile-supported OWC and showed that the hybrid system outperformed standalone devices under both regular and irregular waves, especially in long and intermediate wave regimes. Xiangyu Zhang et al. (2026) [63] numerically studied arrayed OWCs adjacent to an improved parabolic breakwater and showed that while a single OWC did not always benefit significantly from the enhanced focal wave amplitude, an array configuration could achieve pronounced performance gains, including a maximum increase of 46% for the primary chamber and 37% for the secondary chambers. These studies confirm that current WEC development increasingly favors hybridization and integration, but they also reinforce the complexity of simultaneously resolving hydrodynamics, PTO behavior, and structural response.
At the review level, the recent literature has also clarified the numerical-methodological landscape. Ming Zhao et al. (2024) [64] reviewed analytical, potential-flow, CFD, and SPH approaches for OWC hydrodynamics and concluded that potential-flow methods remain useful for preliminary studies, while CFD is necessary for detailed nonlinear analysis. They also highlighted that artificial damping coefficients commonly introduced in simplified OWC models are typically calibrated for specific experimental cases and are not generally transferable to other devices or conditions. This observation is highly relevant to floating BBDB concepts, where motion-induced coupling and nonlinear chamber dynamics make it difficult to rely on overly simplified PTO representations. Y. Sasahara et al. (2025) [65] reinforced this point by applying the moving particle simulation (MPS) method to floating OWCs and explicitly accounting for PTO damping in estimating natural period, damping ratio, and added mass.
Although recent studies have substantially advanced floating OWC hydrodynamics, BBDB performance analysis, PTO control, and hybrid offshore integration, most investigations remain focused on either hydrodynamic response or PTO behavior separately rather than resolving their mutual interaction within a unified CFD framework. Previous BBDB and floating OWC studies have mainly emphasized chamber geometry optimization, rigid-body motion effects, hydro-elastic interaction, array behavior, or wave-to-wire control strategies [34,35,36,37,38,39,40,41,42,43,44,45,46,47,48,49,50,51,52,53,54,55,56,57,58,59,60,61,62,63,64,65]. Similarly, several PTO-focused investigations have implemented reduced-order turbine models, empirical damping coefficients, or external control representations [52,53,54,55,56,57,58], while recent reviews have highlighted the limited transferability of simplified damping approaches across different OWC configurations [51,64]. In particular, turbine-equivalent surrogate modeling using an oscillatory-flow hydraulic orifice within a fully coupled 6-DOF offshore CFD environment remains largely unexplored for modified BBDB systems. Table 1 therefore summarizes the key differences between representative previous studies and the present work, highlighting that the current study uniquely combines floating-body hydrodynamics, mooring effects, oscillatory hydraulic PTO resistance, and CFD-resolved coupling within a single integrated numerical framework.

1.2. Research Gap, Motivation, and Novelty

Recent WEC research has advanced significantly in hydrodynamic modeling, PTO development, and hybrid offshore system integration. However, three important gaps remain. First, most floating WEC studies still treat hydrodynamic response and PTO behavior in a partially decoupled manner, rather than resolving them within a unified high-fidelity CFD framework. Second, although BBDB-based systems have received growing attention, the majority of existing studies remain focused on conventional pneumatic BBDB operation, with very limited investigation of modified hydraulic BBDB concepts. Third, while simplified damping models and reduced-order PTO representations are widely used, turbine-equivalent hydraulic surrogate modeling under oscillatory offshore flow conditions remains largely underexplored, particularly for floating systems with strong motion–fluid coupling. These limitations are especially significant for emerging floating OWC concepts, where the device response is governed by the combined effects of wave–structure interaction, six-degree-of-freedom body motion, hydrodynamic damping, mooring restraint, and PTO-induced flow resistance. For such systems, simplified or decoupled approaches are often insufficient to capture the actual system-level behavior, especially when the intended PTO concept involves bidirectional hydraulic flow under realistic offshore conditions.
The present study addresses this gap by introducing and assessing a modified BBDB-FOWC concept featuring a catamaran hull and a hydraulic oscillatory-flow pathway, departing from the conventional pneumatic BBDB architecture. Instead of explicitly resolving the intended cross-flow turbine within a fully coupled offshore CFD model, which would impose substantial computational complexity, the study adopts a calibrated orifice-based PTO surrogate to reproduce turbine-equivalent pressure–flow behavior while maintaining numerical tractability.
The main novelty of this work therefore lies in the development of a fully coupled, physics-consistent CFD framework that integrates (Refer Section 2.1.2 and Section 2.1.3):
  • Hydrostatic stability assessment;
  • Free-decay-based damping identification;
  • 6-DOF floating-body hydrodynamics under offshore wave forcing;
  • Turbine-equivalent PTO resistance modeling through an orifice surrogate;
  • Within a single simulation and evaluation strategy.
Accordingly, this paper does not aim to resolve blade-scale turbine physics. Instead, it establishes a first-order system-level understanding of the modified BBDB-FOWC concept and its coupled hydrodynamic–PTO behavior at an early technology readiness level. In doing so, it provides an underexplored but necessary step toward the realistic assessment, optimization, and future development of next-generation floating wave energy converters.


2. Methodology

2.1. Modified BBDB-FOWC Concept and Device Description

2.1.1. Reference RM6 BBDB Configuration

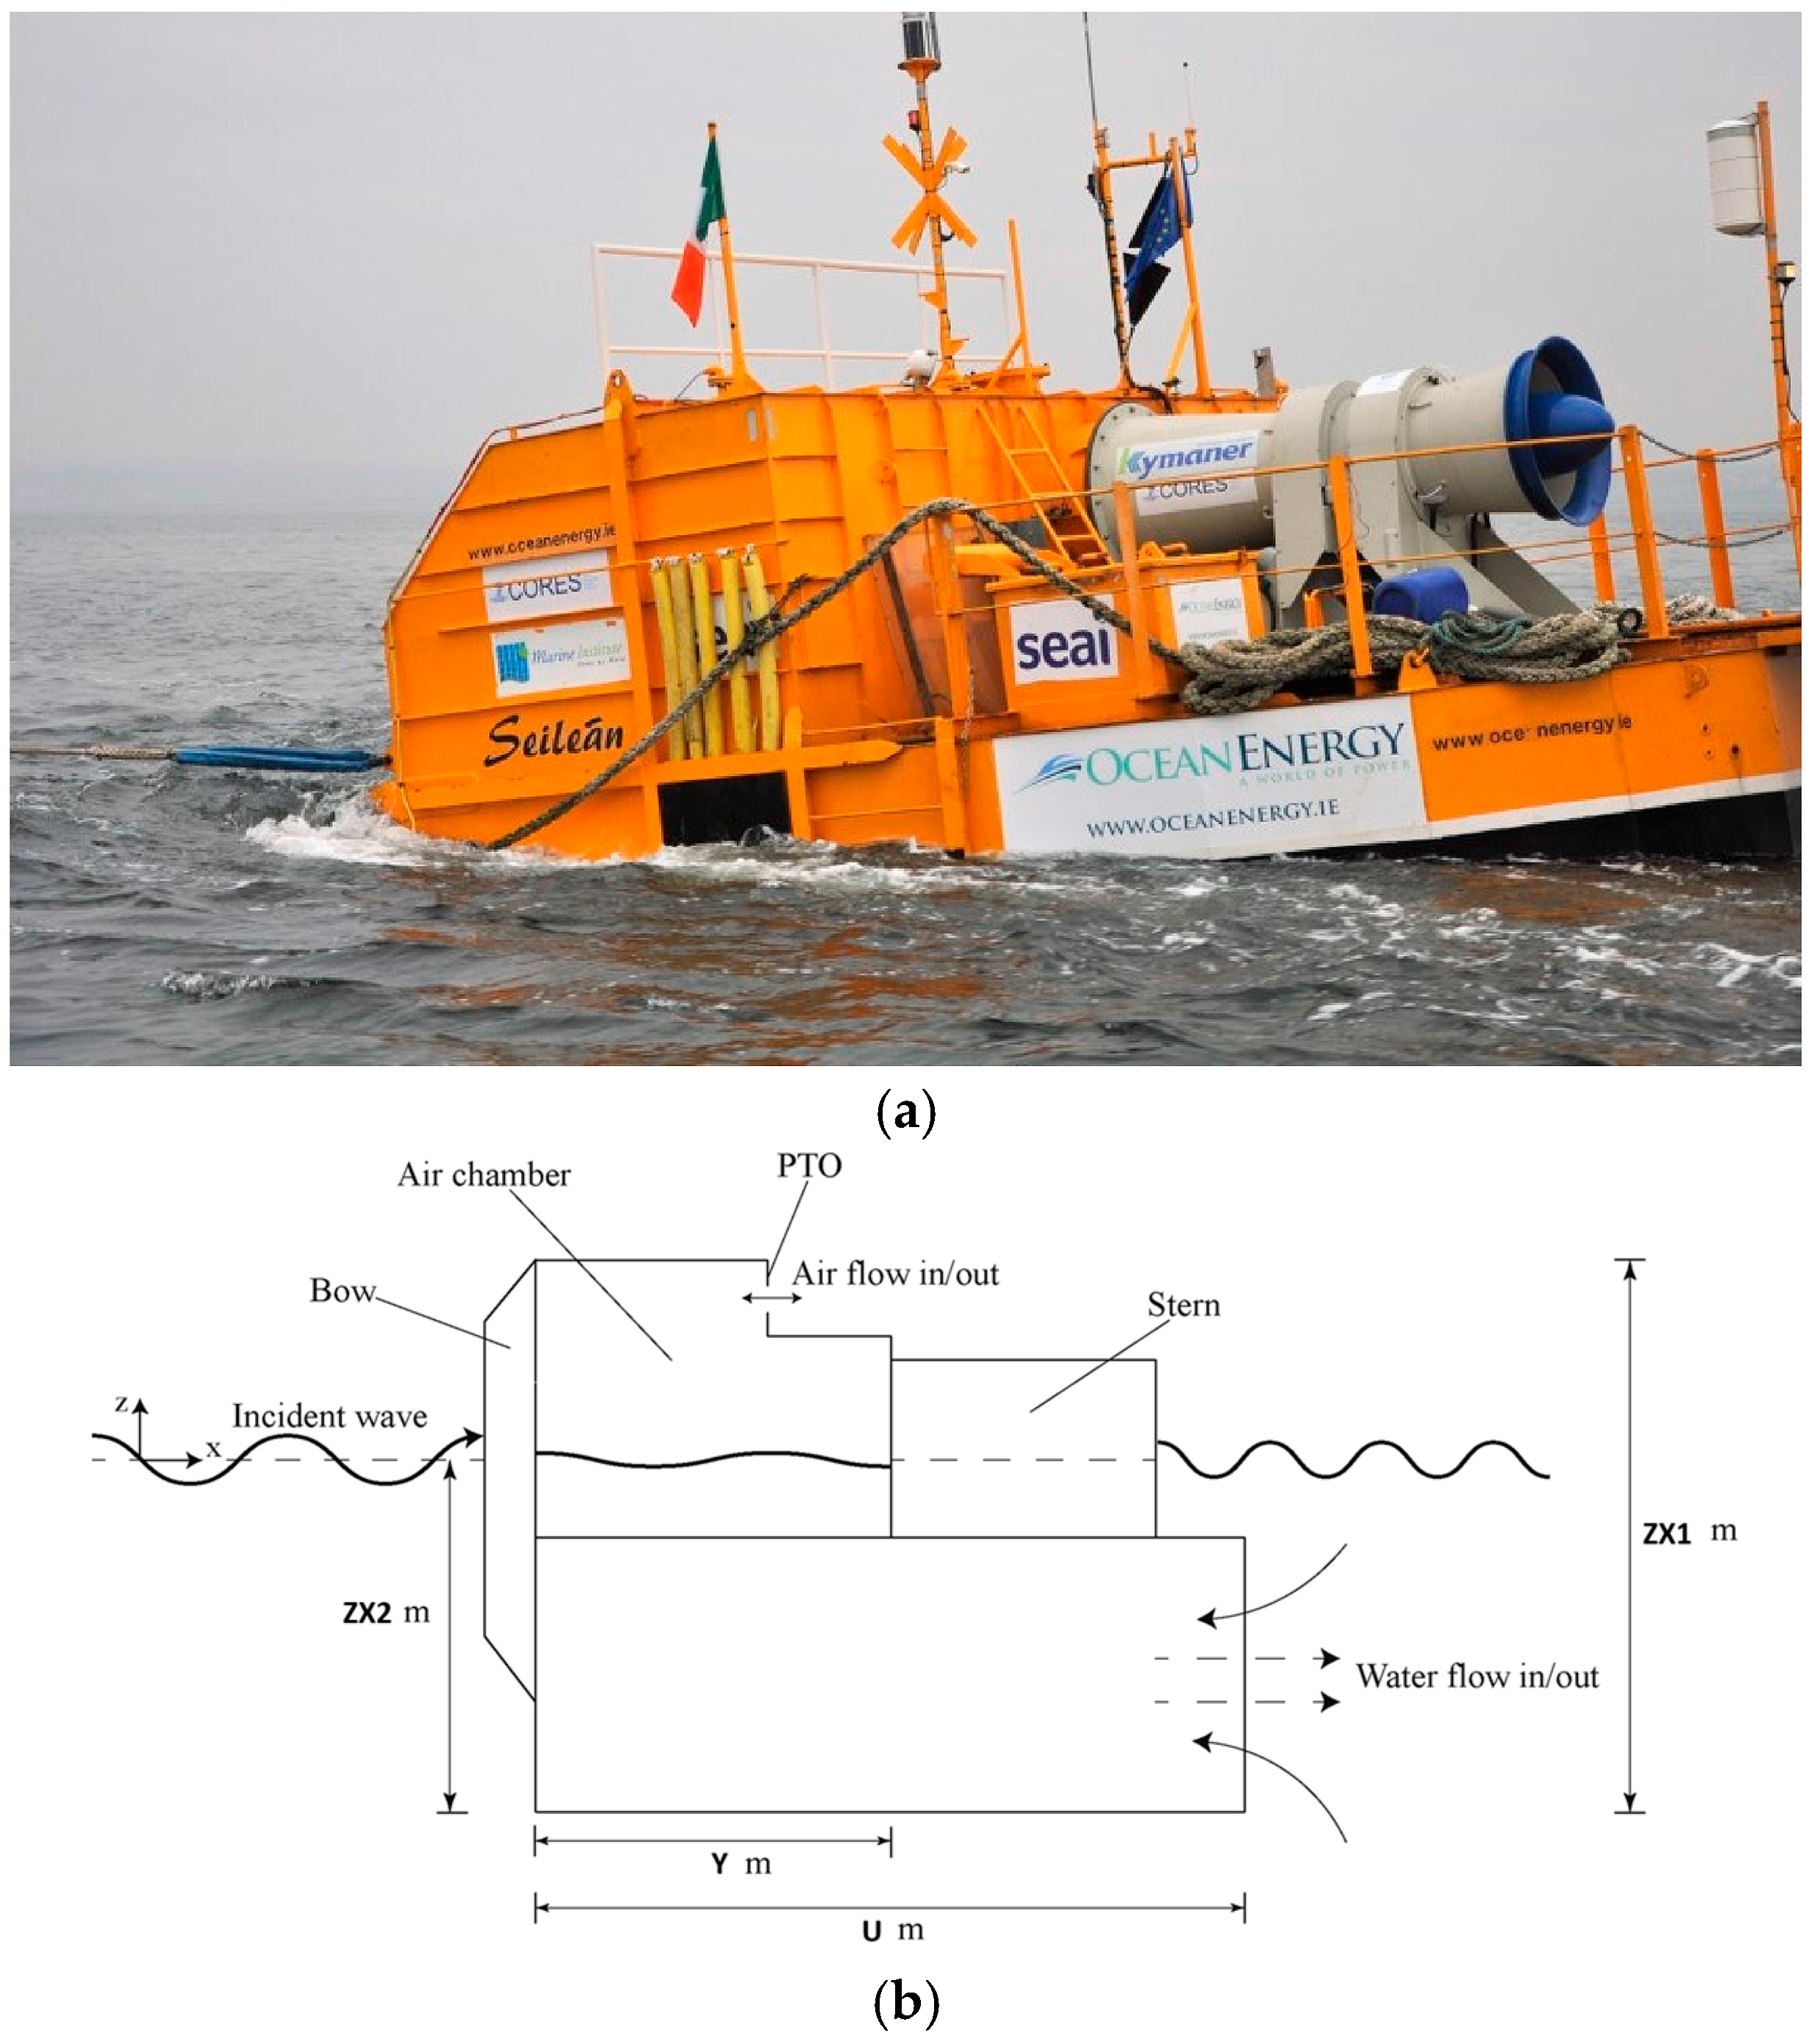
The Reference Model 6 (RM6) backward bent duct buoy (BBDB), originally proposed by Masuda [66,67], is adopted as the baseline configuration. The device consists of an oscillating water column (OWC) chamber, an L-shaped duct, buoyancy modules, and a Wells turbine-based PTO (Figure 1). Energy conversion is driven by wave-induced oscillations of the internal free surface, which generate cyclic air pressure differentials across the turbine. The L-shaped duct enhances wave–structure interaction, while the coupling between rigid-body motions (surge, heave, pitch) and internal oscillations broadens the operational frequency range and improves efficiency. The RM6 is designed for offshore operation with a characteristic width of ~27 m, enabling interaction with moderate-to-high energy waves [68].

2.1.2. Clarification of Concept and Scope of the Present Study

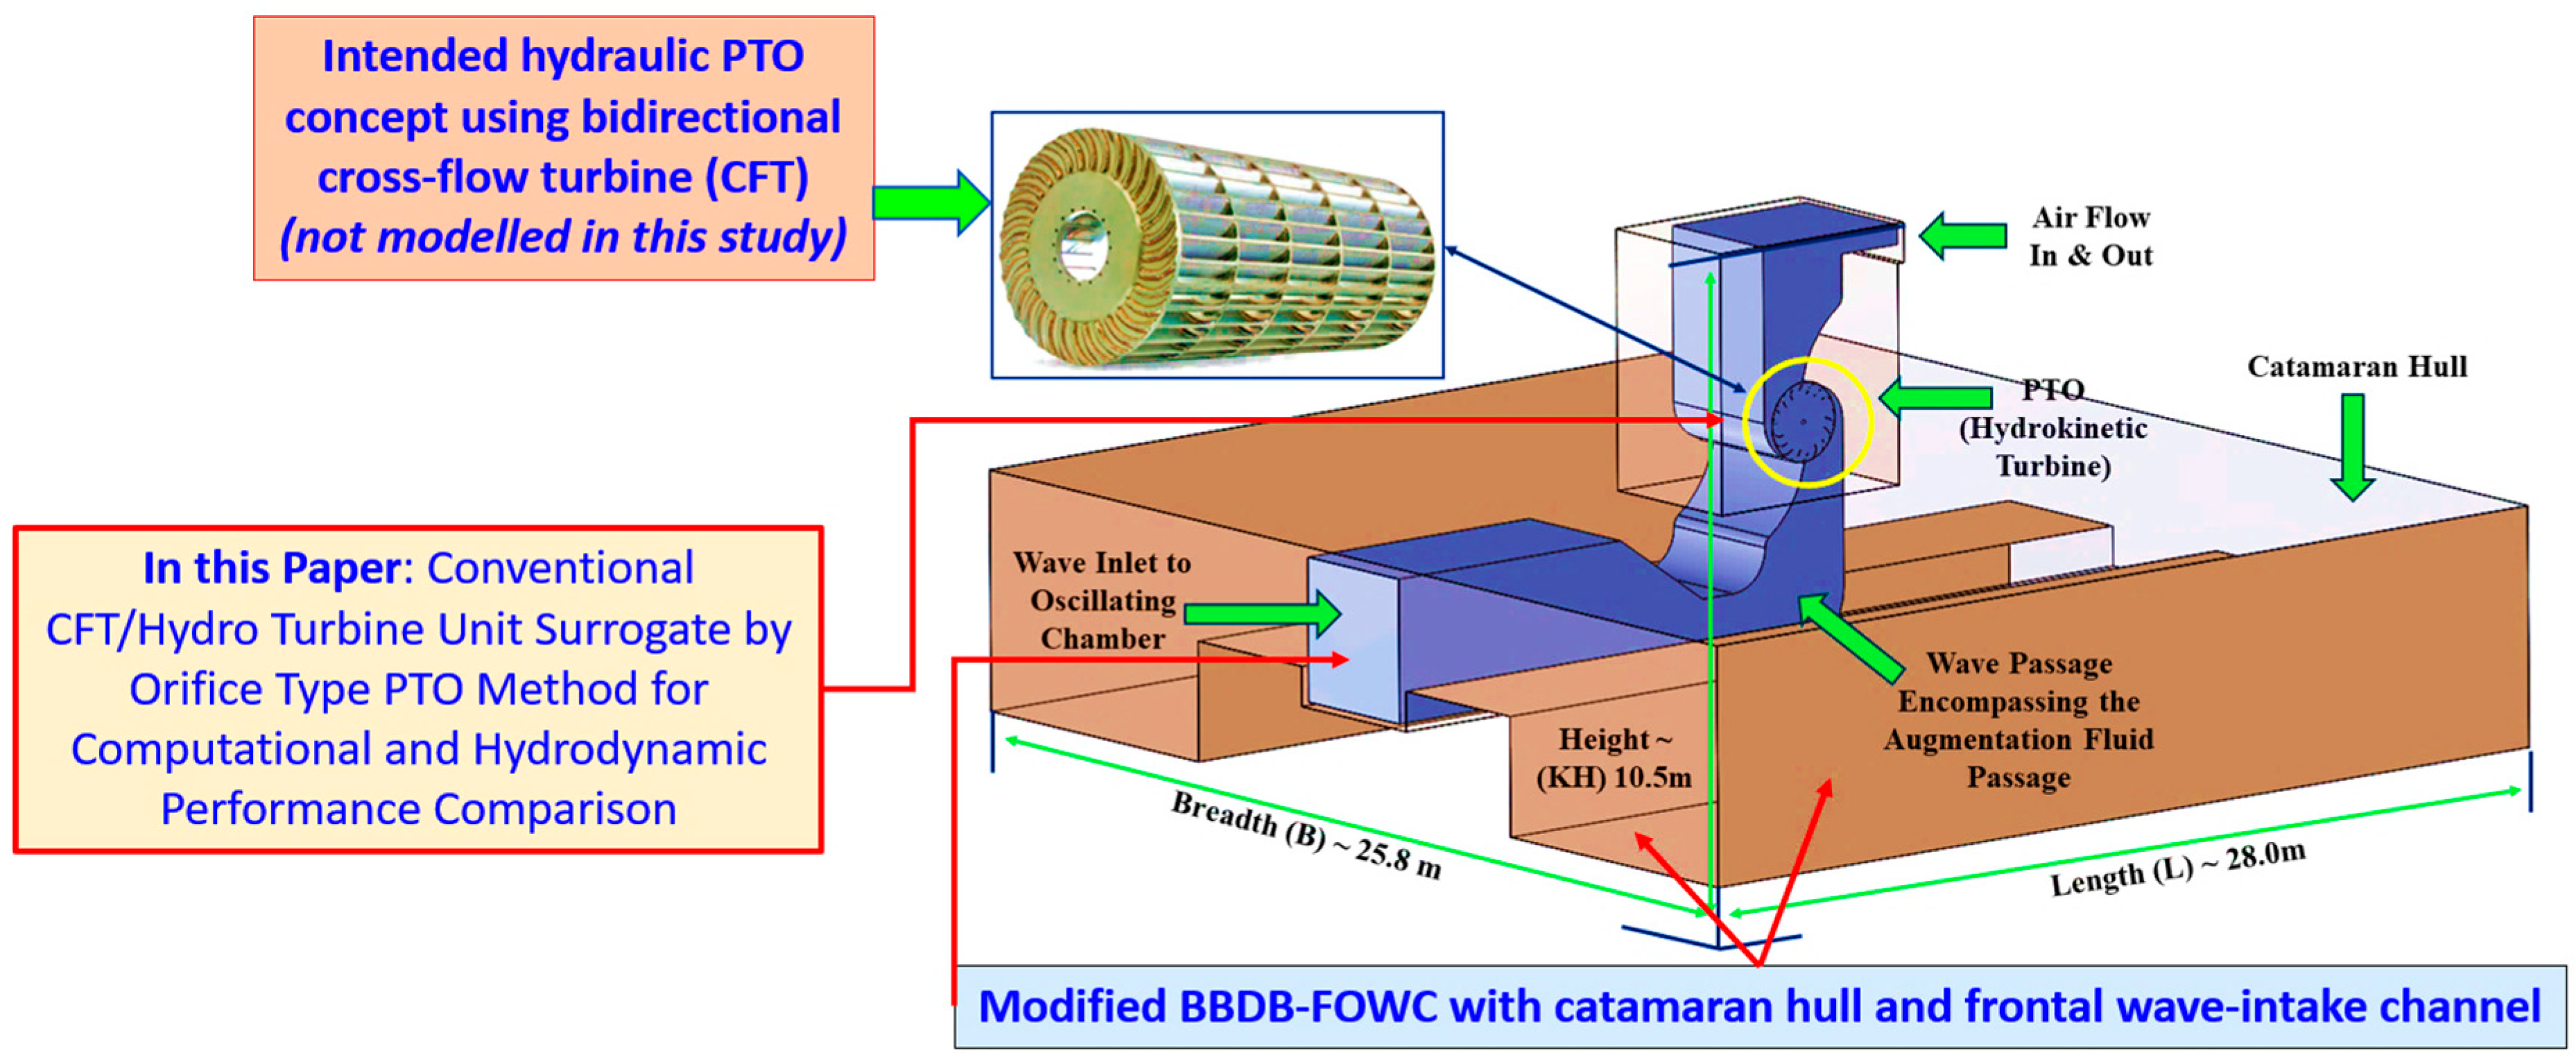
The BBDB-FOWC wave energy converter considered in this work is based on the existing Reference Model 6 (RM6), which serves as the baseline configuration [68]. In the present study, this reference model is structurally modified into a new floating concept featuring a catamaran-type hull and an augmented frontal channel designed to directly capture and guide incoming waves through the device. Unlike conventional BBDB systems, which rely on an air chamber and a pneumatic power take-off (PTO) such as a Wells turbine, the modified concept is intended to operate with a hydraulic energy conversion mechanism, where wave-induced flow passes through the internal channel. The ultimate PTO concept associated with this configuration is a bidirectional cross-flow turbine (CFT) operating under oscillatory flow conditions, refer [69] for details. However, resolving turbine-scale rotational physics within a fully coupled offshore CFD framework—incorporating free-surface flow, overset mesh motion, 6-DOF body dynamics, and mooring interactions—is computationally prohibitive at this stage. Therefore, the present study focuses specifically on the hydrodynamic–PTO coupling at the system level, rather than turbine-resolved flow physics. To achieve this, the turbine is not explicitly modeled. Instead, its hydraulic resistance is represented using an equivalent orifice-based PTO surrogate, which reproduces the pressure-drop–flow-rate characteristics of the target turbine. This approach removes rotational complexity while preserving the dominant energy-conversion mechanism, enabling robust and computationally efficient simulation of the full floating system. Accordingly, this paper investigates the integrated hydrodynamic response of the modified BBDB-FOWC, including wave–structure interaction, body motion, chamber flow dynamics, and PTO-equivalent loading under realistic offshore conditions. The objective is to establish a first-order, physics-consistent assessment of the proposed concept (TRL ~1–2), providing fundamental insight into its feasibility and performance potential prior to higher-fidelity turbine-coupled modeling.

2.1.3. Modified Geometry and PTO Concept

To overcome the limitations of air-based PTO systems, the present study replaces the compressible air medium with water as the working fluid, exploiting its significantly higher density (~1023 kg/m3) and energy transfer capability. The conventional Wells turbine [70] or Cross Flow Turbine (CFT) [69,71] is substituted with a hydrokinetic PTO operating under bidirectional flow. The modified BBDB adopts a catamaran hull configuration to enhance stability and reduce undesirable pitch and roll motions (Figure 2). A vertical water column chamber is integrated at the center, enabling direct wave interaction and generating oscillatory flow through the PTO. The principal dimensions are: L = 28 m, B = 25.8 m, KH = 10.5 m, with an effective chamber width of ~3.5 m. The system is designed for representative offshore conditions (Hs = 3.0 m, T = 9.0 s). The PTO is positioned at 6.96 m above the keel to satisfy stability criteria and optimize interaction with the oscillating flow.

2.1.4. Integrated Numerical Framework and Workflow Description

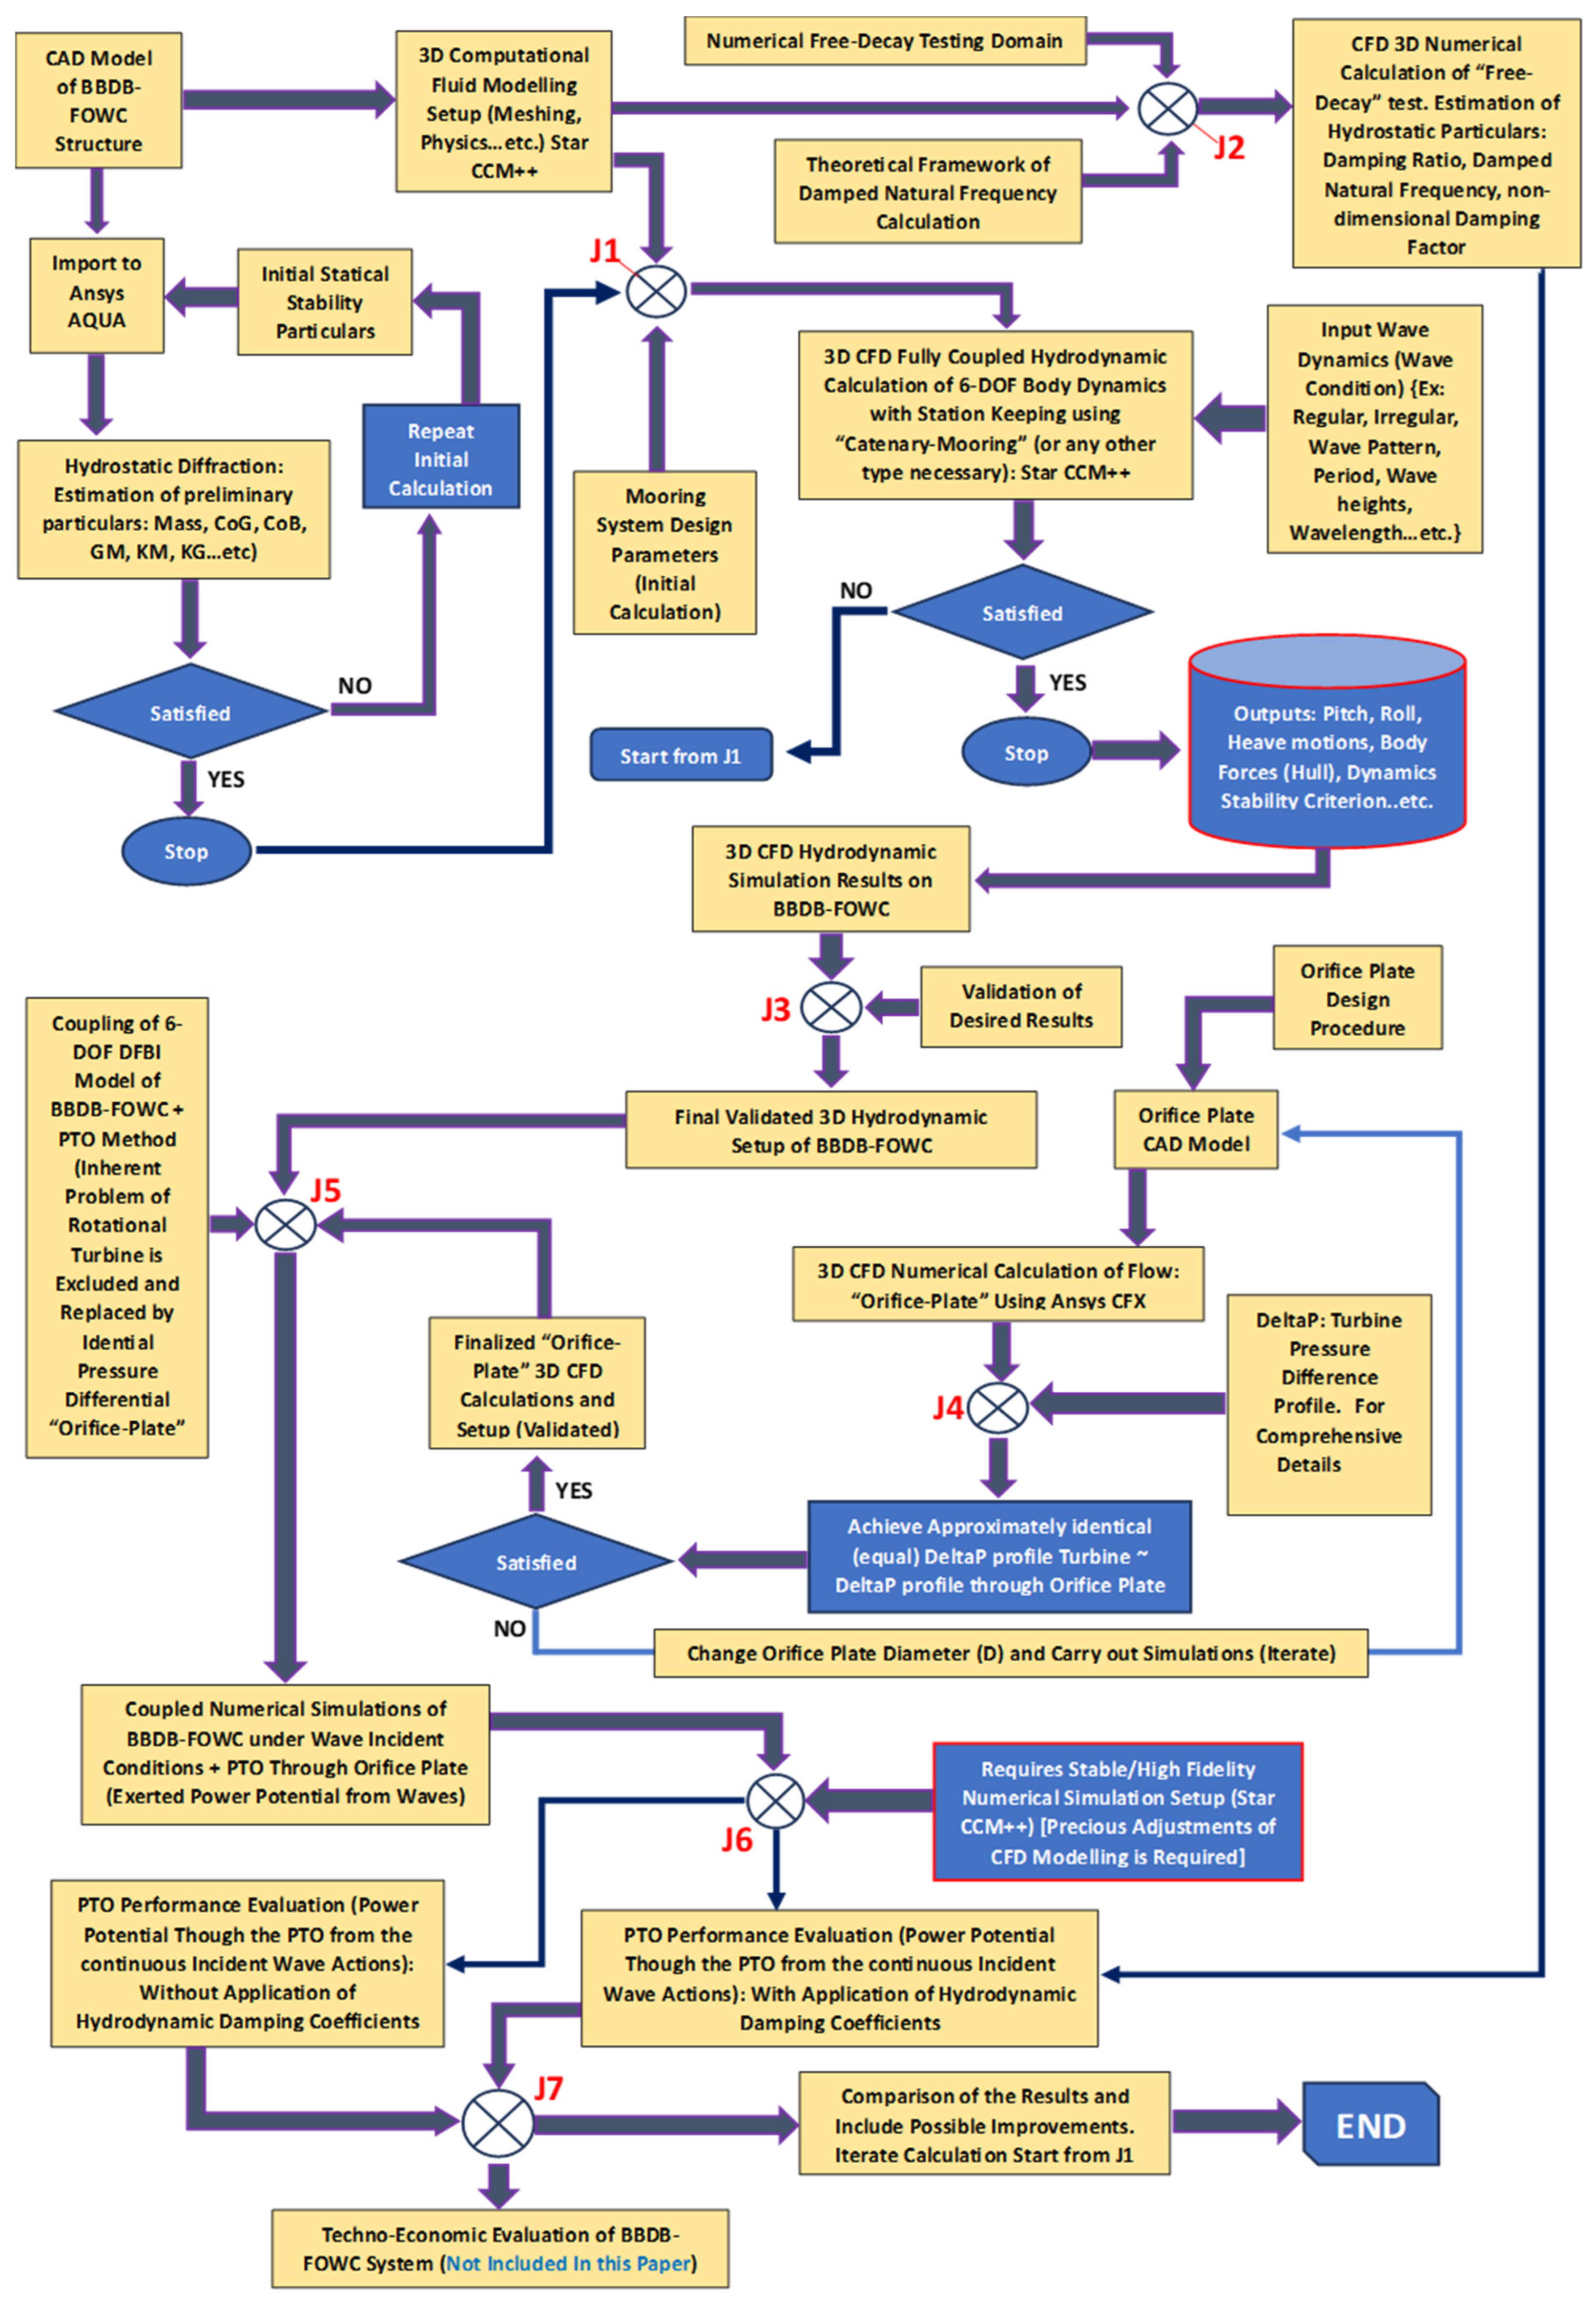
Following the structural and stability design, the BBDB-FOWC system is integrated into a comprehensive numerical framework for hydrodynamic and performance evaluation. The hydrostatic analysis is first conducted using ANSYS AQUA v17.2® [72], where parameters such as mass, CoG, CoB, and stability characteristics are obtained. These values are then used as input for hydrodynamic simulations. The 3D hydrodynamic analysis is performed using SIEMENS STAR-CCM+ v20.0 [73], incorporating six-degree-of-freedom (6-DOF) body motion, wave–structure interaction, and mooring system effects. Simulations are conducted for a physical time duration of 60 s, requiring approximately 8 days of computational time due to the complexity of the coupled model. A major challenge in such simulations is the coupling of rotating turbine dynamics with 6-DOF motion. To overcome this limitation, the present study introduces an orifice-plate-based PTO surrogate, which reproduces the pressure-drop behavior of a turbine without explicitly modeling rotating components. The complete computational workflow is illustrated in Figure 3.
The workflow consists of the following key stages:
  • J1 (Hydrostatic–Hydrodynamic Coupling): Validation of hydrostatic properties and transfer to CFD simulations with 6-DOF and mooring integration.
  • J2 (Free-Decay Analysis): Numerical free-decay test to estimate damping characteristics.
  • J3 (Hydrodynamic Validation): Assessment of floating-body response under wave loading.
  • J4 (Orifice plate Design): Iterative design of orifice plate (β = 0.25–0.45) to match turbine pressure-drop characteristics.
  • J5 (PTO Coupling): Replacement of turbine with optimized orifice plate in CFD simulations.
  • J6 (Performance Evaluation): Simulation under wave conditions with and without damping effects.
  • J7 (Final Comparison): Evaluation and comparison of system performance.

2.1.5. Orifice-Based PTO Representation

The orifice plate is designed as a surrogate for the turbine by matching the pressure differential (ΔP) across the PTO domain [74]. The orifice diameter ratio is varied within the range β = 0.25–0.45, corresponding to diameters between 0.25 m and 0.45 m.

2.2. Numerical Methodology

2.2.1. Overview of the Computational Framework

The numerical methodology adopted in this study was developed to evaluate the hydrodynamic response and power extraction potential of the modified BBDB-FOWC under offshore wave conditions using a staged, fully coupled computational framework. The overall procedure, previously introduced in Figure 3, integrates hydrostatic analysis, CFD-based free-decay damping estimation, hydrodynamic wave–structure interaction, and an equivalent PTO representation based on an orifice plate. The methodology was structured to address 03 principal numerical challenges. First, the floating-body response had to be resolved under realistic offshore wave loading while preserving 6-DOF motion and free-surface fidelity. Second, the dynamic damping characteristics of the floating structure had to be quantified in a physically meaningful manner for later inclusion in the coupled simulations. Third, the PTO-induced pressure resistance had to be represented without explicitly resolving a rotating turbine inside a moving free-surface CFD simulation, which would have introduced excessive computational cost and numerical stiffness. Accordingly, the computational workflow was divided into 04 main stages:
(i)
Hydrostatic analysis and initialization using ANSYS AQUA® v17.2;
(ii)
CFD-based free-decay analysis in STAR-CCM+® v20.0 for damping estimation;
(iii)
Transient CFD calibration of orifice-plate PTO surrogate using ANSYS CFX® v17.2;
(iv)
Fully coupled 3D hydrodynamic simulation of the BBDB-FOWC in STAR-CCM+ with the validated orifice and damping parameters.

2.2.2. Numerical Schemes and Solution Strategy

The governing equations were discretized using the finite volume method. In STAR-CCM+, a segregated pressure-based flow solver was employed with SIMPLE-type pressure–velocity coupling. Second-order spatial discretization was adopted for the convective terms, while second-order implicit time integration was used for transient calculations. The VOF method was used to capture the water–air interface, and the Dynamic Fluid Body Interaction (DFBI) approach was used to resolve rigid-body motion under hydrodynamic and mooring forces [73]. In ANSYS CFX, the SST-turbulence model was retained for all transient internal-flow calculations involving the orifice plate, owing to its reliable performance in flows with adverse pressure gradients and localized separation. Convergence in the transient simulations was assessed using both local and global measures [74]. Local convergence was monitored through residual reduction in the continuity and momentum equations, whereas global convergence was evaluated from the stabilization of integral quantities such as body forces, moments, heave and pitch response, chamber pressure, and pressure-drop history across the PTO region.

2.2.3. Hydrostatic Analysis and Initial Conditions

Hydrostatic Modeling in ANSYS AQUA
The hydrostatic properties of the modified BBDB-FOWC were first evaluated using ANSYS AQUA v17.2. The objective of this step was to establish a reliable set of initial hydrostatic parameters for the subsequent dynamic CFD simulations. The quantities extracted at this stage included the total displacement, mass properties, center of gravity (CoG), center of buoyancy (CoB), metacentric height (GM), hydrostatic stiffness terms, and preliminary restoring coefficients. The hydrostatic diffraction environment was defined over a range of wave directions from −180° to 180°, including the principal headings at regular angular intervals, in order to confirm the floating system stability under directional offshore loading [75]. The hydrostatic solution was iteratively refined until the computed mass and buoyancy balance converged with the target design point. These hydrostatic outputs served two purposes. First, they verified that the modified catamaran-type BBDB-FOWC satisfied the required static stability criteria [76]. Second, they provided the initial conditions and inertial inputs for the 6-DOF hydrodynamic simulations in STAR-CCM+.
Hydrostatic Discretization and Convergence Check
Although ANSYS AQUA is not a CFD code in the same sense as STAR-CCM+ or CFX, the panel discretization and wetted-surface representation still affect the quality of hydrostatic and diffraction outputs. For this reason, a panel (mesh)-convergence assessment performed during the hydrostatic setup stage using 03 successively refined wetted-surface discretizations: coarse, medium, and fine [77]. The coarse mesh model contained ~1.8 × 10³ panels, the medium model ~3.6 × 10³ panels, and fine model ~7.2 × 10³ panels. The differences between the medium and fine discretizations in the principal hydrostatic outputs, namely displacement, CoB, and GM, were within approximately 1–2%, which was considered acceptable for transfer of the hydrostatic properties into the CFD stage.
Table 2 summarizes the hydrostatic initialization procedure in ANSYS AQUA. A panel-sensitivity check was carried out before transfer of the mass, buoyancy, and restoring characteristics into the CFD environment. The selected hydrostatic discretization provided stable displacement and metacentric-height estimates while keeping the preprocessing burden moderate.

2.2.4. CFD-Based Hydrodynamic Modeling of the Floating BBDB-FOWC

Governing Equations and Numerical Model
The wave–structure interaction of the BBDB-FOWC was modeled in SIEMENS STAR-CCM+ v20.0 using a 3-D, transient, incompressible, free-surface CFD framework. The model combined the Volume of Fluid (VOF) method for air–water interface capturing, the DFBI/6-DOF motion solver for rigid-body motion, and a catenary mooring representation for station keeping. The floating BBDB-FOWC was restrained using a simplified 4-line catenary mooring arrangement distributed symmetrically around the floating structure to provide horizontal station-keeping while allowing realistic wave-induced motion response. Each mooring line was modeled with an equivalent nonlinear catenary formulation representative of offshore chain–rope systems typically used for medium-scale floating marine structures [23,24,27]. The unstretched line length was ~85–100 m per line, with an equivalent line diameter of ~0.08–0.12 m and an initial pre-tension in the range of 40–60 kN to maintain hydrostatic equilibrium under the selected offshore condition. The mooring lines were attached near the outer catamaran hull sections and anchored to the seabed boundary of the numerical domain. The objective of the mooring representation was not detailed structural design optimization, but rather the inclusion of realistic restoring and motion-limiting effects within the coupled hydrodynamic simulations and the k ω   S S T turbulence model for turbulence closure [73].
The flow field was governed by the continuity and Reynolds-averaged Navier–Stokes equations [78]:
· u = 0
ρ u t + u · · u = p + · μ e f f u + u T + ρ g
where u is the velocity vector, p is the pressure, ρ is the density, and μ e f f is the effective viscosity including turbulence contributions [78].
The transport of the phase fraction filed in the VOF formulation is given by [79]:
a t + u · α = 0
where α is the water volume fraction.
Rigid-body motion was resolved through the translational and rotational equations of motion [80]:
m d V d t = F
I ·   d ω d t + ω × I ω = M
where V is the translational velocity, ω is the angular velocity, I is the inertia tensor, and ∑F and ∑M are the resultant external forces and moments, including wave loading, buoyancy, gravity, and mooring contributions [80].

2.2.5. Wave and Boundary Conditions

The hydrodynamic simulations were conducted under the design wave condition corresponding to wave height H = 3.0 m and wave period T = 9.0 s [11,69]. The simulation time for each coupled run was 60 s, which allowed the body response, internal oscillation, and pressure behavior to evolve through several wave cycles and approach a dynamically representative oscillatory state. The inlet boundary was assigned the regular wave profile, while the outlet region was treated as an opening/wave damping region to reduce reflection. The numerical domain was defined with sufficient upstream and downstream lengths to allow wave establishment before interaction with the floating structure [11,69].

2.2.6. STAR-CCM+ Solver Setup

Table 3 summarizes the final production settings used for the fully coupled simulations. The selected setup was designed to simultaneously capture wave propagation, body motion, free-surface dynamics, and the internal chamber flow while maintaining stable overset interpolation throughout the simulation duration [73].
The selected transient time-step range (0.01–0.02 s) was chosen to ensure stable resolution of the free-surface evolution, rigid-body motion, overset-mesh interpolation, and oscillatory PTO pressure response within each wave cycle. For the investigated wave period (T = 9 s), the adopted discretization provided several hundred temporal increments per cycle, which was considered sufficient to preserve phase accuracy and transient hydrodynamic stability while maintaining acceptable computational cost for the long-duration coupled simulations.

2.2.7. Mesh Strategy for the Floating-Body Simulations

A hybrid meshing strategy was adopted for the fully coupled hydrodynamic simulations, with local refinement at 04 critical regions [81]:
  • The free surface;
  • The floating-body surfaces;
  • The frontal chamber opening and internal water-column region;
  • The overset mesh interfaces.
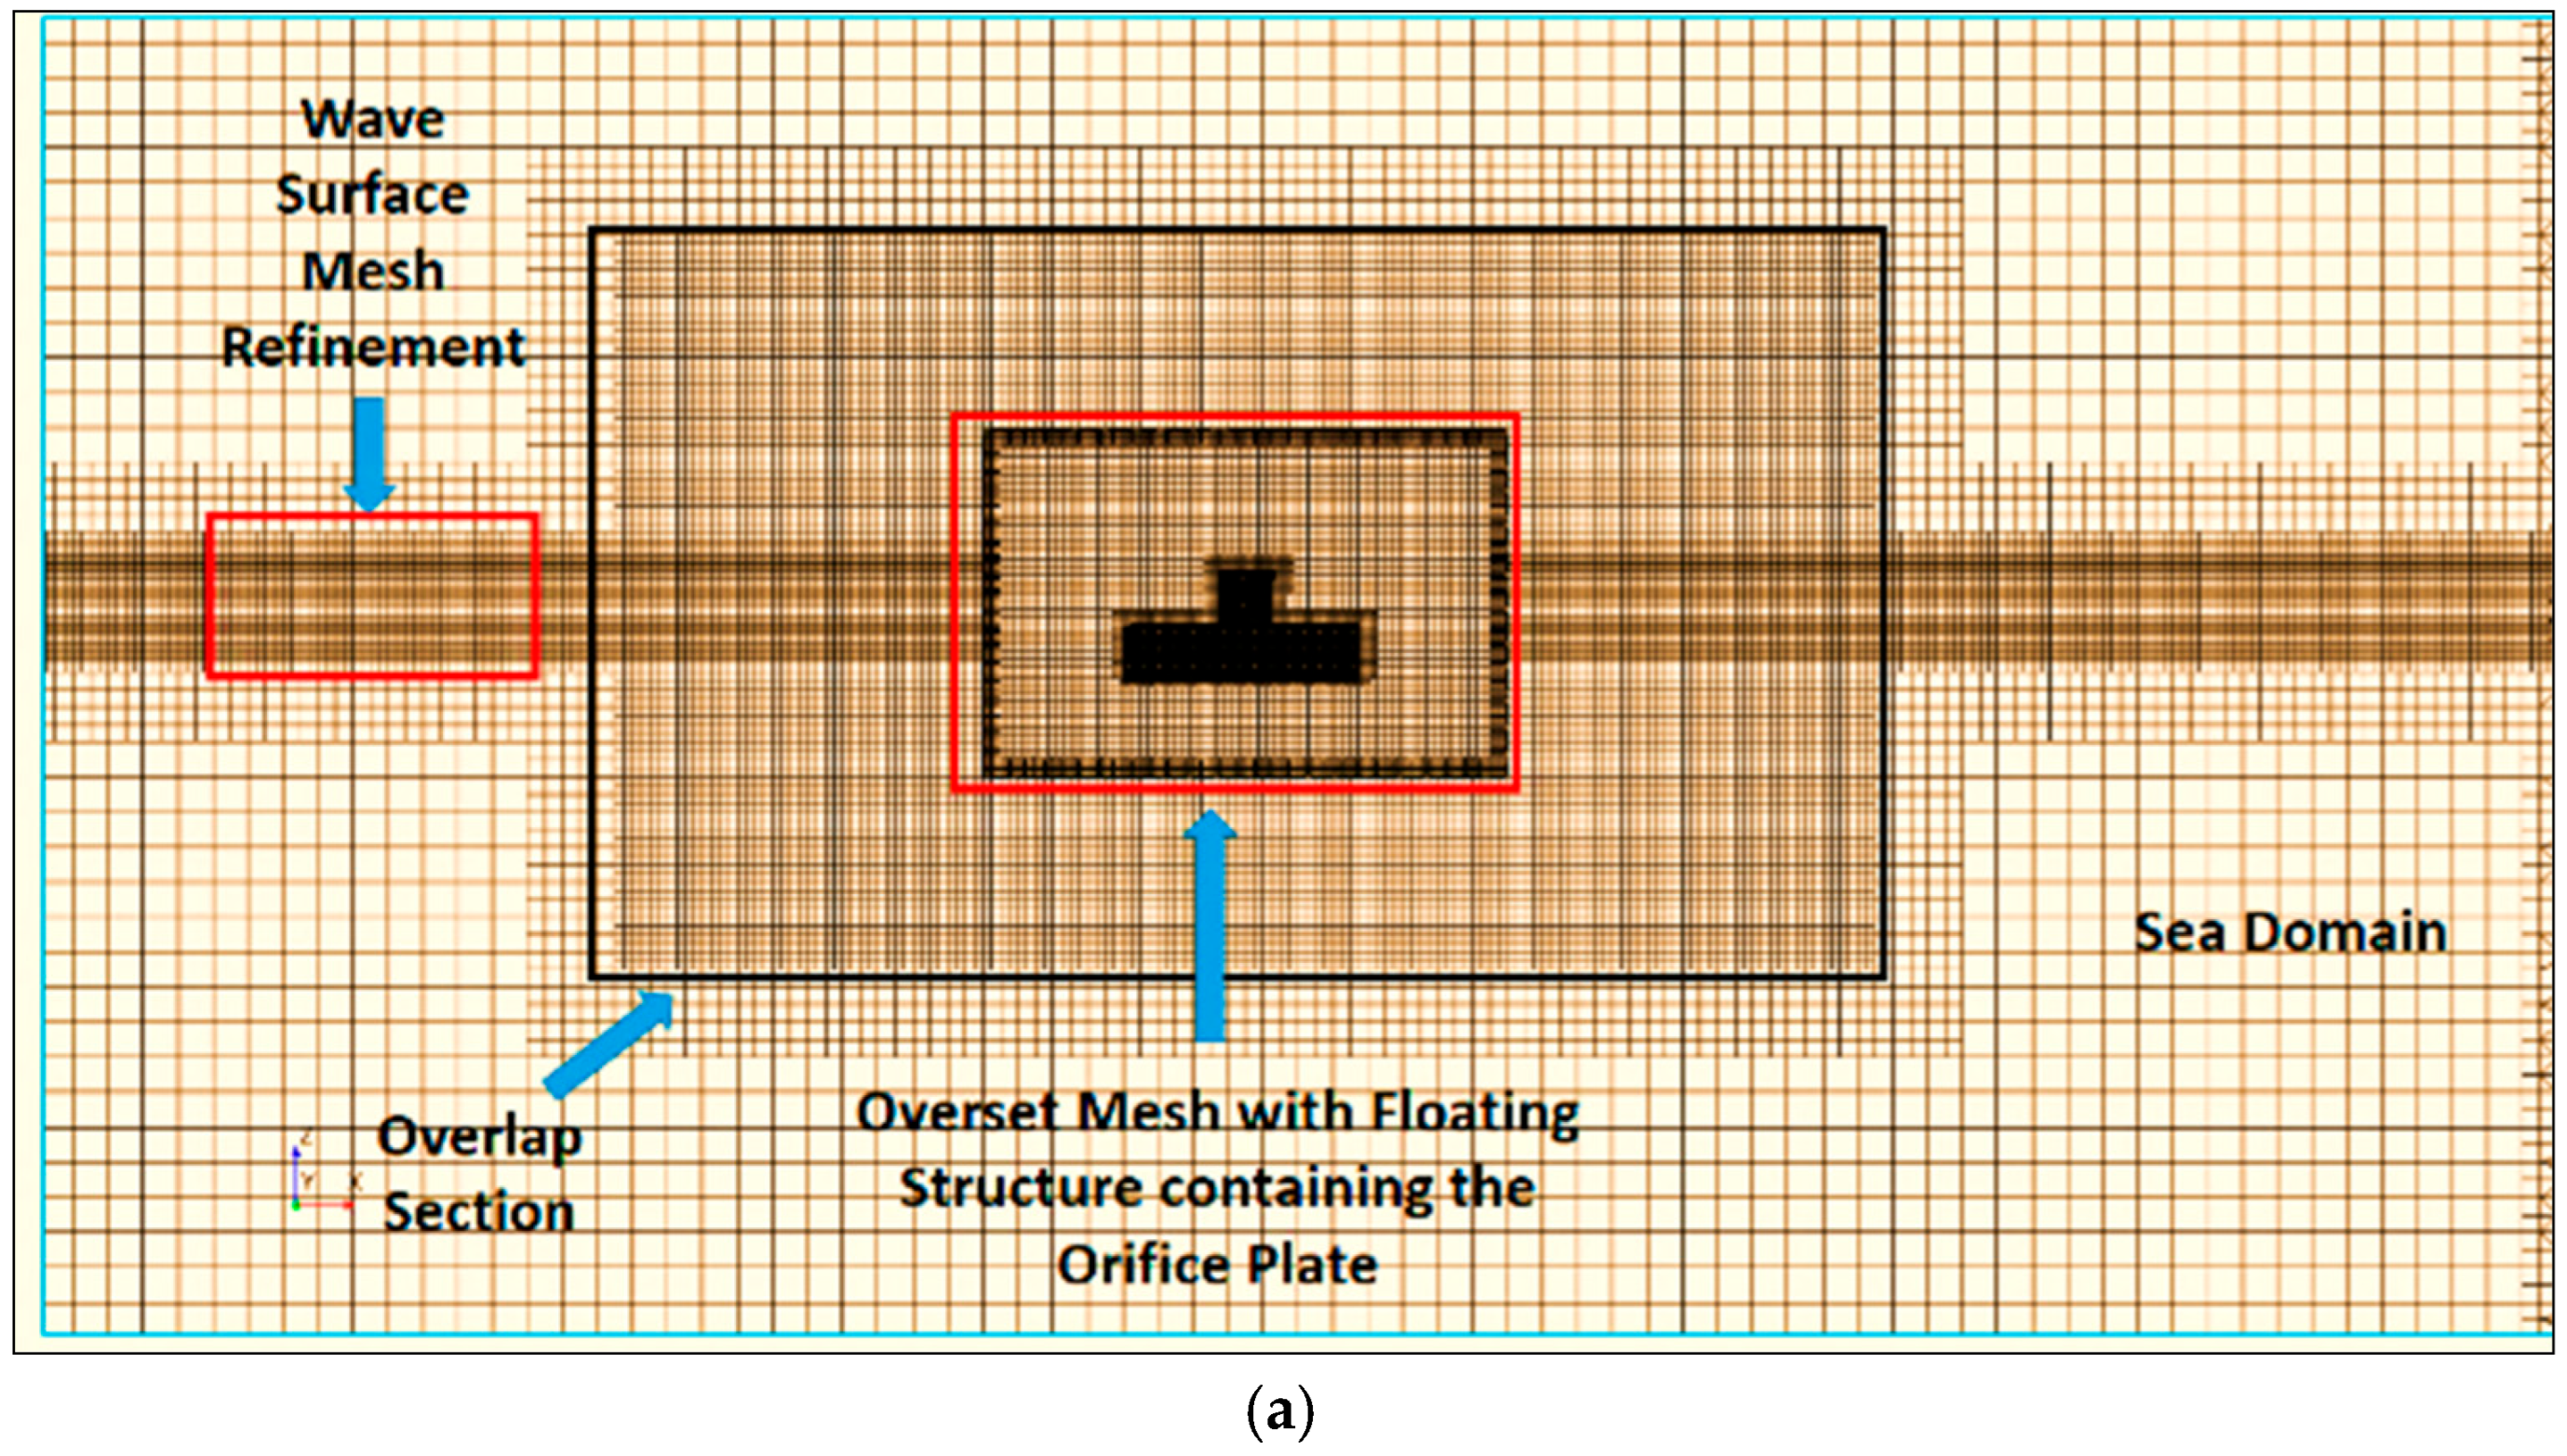
The final production mesh contained ~ 5.0 million cells, which was necessary because the problem simultaneously involved wave propagation, VOF free-surface tracking, rigid-body motion, and flow constriction through the PTO region [81,82]. Figure 4a shows the extra-fine mesh of the full simulation domain. The figure highlights the wave-surface mesh refinement zone, the floating overset region, and the overlap section between the overset and background domains. This arrangement is critical because the moving-body DFBI model requires stable interpolation between stationary and moving mesh blocks. Figure 4b presents the uniform hexahedral discretization of the floating structure and surrounding sea domain, illustrating the structured resolution used to reduce numerical diffusion in the propagating wave field. Figure 4c shows the 3D mesh of the floater, where the internal chamber and passage geometry are discretized more densely than the outer sea domain. Figure 4d focuses on the frontal opening section, which is particularly important because it governs the initial entry of wave-induced flow into the water-column chamber and strongly affects the downstream pressure dynamics.

2.2.8. Mesh-Independence Assessment for STAR-CCM+

Mesh-sensitivity was performed using coarse, medium and fine/extra-fine discretizations (Table 4). The comparison was based on the heave amplitude, pitch amplitude, peak chamber pressure, and the phase consistency of the internal oscillatory flow over the same wave condition [81,82].
The coarse mesh showed noticeable damping of the free surface near the chamber opening and underpredicted the peak chamber-pressure response. Medium mesh improved the body-motion response but still showed slight smoothing of the pressure peaks. Difference between medium and fine meshes in the principal monitored variables was within ~3–5%, while the fine mesh showed the most stable overset behavior and best preservation of the wave-front geometry. Therefore, extra-fine mesh was selected for the final production simulations.

2.3. Numerical Free-Decay Test and Estimation of Damping Characteristics

2.3.1. Role of Free-Decay Testing in the Present Framework

The free-decay test was introduced to quantify the viscous damping behavior of the floating BBDB-FOWC in a controlled manner before performing the fully coupled wave-driven simulations [83]. In floating OWC systems, the response amplitude is highly sensitive to damping, especially in heave, because heave directly alters the relative motion between the body and the internal water column. An accurate estimate of damping is therefore important not only for structural stability assessment but also for stabilizing the pressure signal across the PTO domain [84]. In this test a flat wave front was created, and using analytical equations then estimates the damping coefficient and non-dimensional damping constant were determined from the numerical simulations [84]. First, a free decay test in still water will be considered. After a vertical displacement upwards, the structure will be released, and the motions can die out freely [83,84].

2.3.2. Governing Equation of Free-Heave Motion

The free-decay test was performed numerically in 1-DOF heave mode in STAR-CCM+, with the structure initially displaced and then released in still water. For linearized free-heave response, the governing equation is [81,84];
m + a z ¨ + b z ˙ + c z = 0
where m is the structural mass, a is the hydrodynamic added mass, b is the viscous damping coefficient, c is the hydrostatic restoring coefficient, and z is the heave displacement. The restoring coefficient is given by [84];
c = ρ g A w
where A w is the effective waterplane area. And Equation (6) divided by m + a yields [84];
z ¨ + 2 ν z ˙ + ω o 2 z = 0
With
2 ν = b m + a
And
ω o 2 = c m + a
The underdamped free-decay solution is [84]:
z t = z a e v t · [ cos ω z t + v ω z sin ω z t ]
where
ω z = ω o 2 v o 2

2.3.3. Logarithmic Decrement Formulation

The decay characteristics were extracted from the CFD response using the logarithmic decrement method. If two successive positive peaks are z i and z i + 1 , then [83,84]
δ = ln ( z i z i + 1 )
For n cycles [83,84];
δ n = 1 n · ln ( z i z i + 1 )
The damping ratio becomes [83,84];
ζ = δ 4 π 2 + δ 2
And for lightly damped motion [83,84];
ζ δ 2 π
The non-dimensional damping constant written as [83,84];
k = 1 2 π ln z t z t + T z
And, for small damping [83,84];
ω 0 T z ω z T z = 2 π
Figure 5 presents the formulation of logarithmic decrement. The figure shows the exponentially decaying envelope and the successive maxima used to extract the damping information from the oscillation signal.

2.3.4. Free-Decay CFD Setup and Extracted Dynamic Parameters

The floating structure was initially displaced upward by 1.0 m from its equilibrium position and released numerically in still water [81,83]. The simulation duration was 60 s, which allowed several oscillation cycles to be captured. Figure 5 shows the computed decay response. Although the title in the current graphic refers to “Pitch Decay Curve,” the plotted response and governing theory correspond to heave decay [84]. The principal parameters extracted from the CFD free-decay response are summarized in Table 5. These quantities were obtained from the heave-decay signal using the logarithmic decrement method and were subsequently used in the coupled hydrodynamic simulations [83,84].
The values listed in Table 5 indicate a lightly damped heave response, which is consistent with the expected motion characteristics of a moored floating wave energy device. The extracted damping parameters were therefore adopted in the subsequent coupled simulations to improve the stability and realism of the predicted system response.

2.3.5. Mesh and Time-Step Sufficiency for the Free-Decay Test

Because the free-decay test was later used to supply damping parameters to the full coupled model, a synthesized numerical sufficiency check was also performed for this sub-problem [83,84]. Three local heave-decay meshes were considered, ~1.2 million, 2.0 million, and 2.8 million cells. The extracted values of T z and ζ changed only marginally between the two finest cases, with differences below approximately 2%. In addition, reduction in the physical time step from 0.02 s to 0.01 s produced negligible change in the extracted decay ratio (Table 6). This behavior confirmed that the selected temporal discretization was sufficiently small to capture the decay-envelope evolution and oscillatory motion characteristics without introducing significant numerical damping or phase distortion.
The selected free-decay setup was therefore considered numerically sufficient for parameter extraction.

2.4. Turbine Replacement by an Orifice Plate PTO Surrogate

2.4.1. Physical Motivation

Direct simulation of a rotating turbine within a 6-DOF free-surface wave–structure interaction framework is computationally expensive and often difficult to converge for long transient runs. Therefore, the turbine was replaced by an orifice plate designed to reproduce the same order of flow resistance and pressure-drop behavior under oscillatory internal flow. Refer [11,69] for detailed information. Figure 6 illustrates this concept. On the left side, the original turbine location is shown inside the water-column section. On the right side, the turbine is replaced by an orifice section with equivalent damping behavior. The goal of this replacement is not to capture blade-resolved hydrodynamics, but rather to preserve the dominant hydraulic action of the PTO—namely, cyclic pressure resistance against the oscillating water-column flow.

2.4.2. Analytical Framework for the PTO Surrogate

The pressure-drop/flow-rate relation of the orifice was interpreted using a reduced hydraulic framework. The orifice flow equation is [85];
Q = C d A 2 Δ P ρ
where Q is the volumetric flow rate, Cd is the discharge coefficient, A is the orifice area, ΔP is the pressure difference across the orifice, and ρ is the fluid density [85].
The diameter ratio is defined as
β = d D
where d is the orifice diameter and D is the reference nozzle diameter. For the oscillating chamber, the equivalent PTO power may be expressed as [85];
P ¯ P T O = 1 T 0 T Δ P t Q t d t
These relations were used later in the performance-evaluation stage.

2.5. Orifice Geometry, Meshing, and CFX Numerical Setup

2.5.1. Parametric Orifice Design

Five orifice geometries were examined, with diameter ratios spanning 0.25D to 0.45D, in order to identify the configuration that best reproduced the turbine pressure-drop behavior (Table 7).
Figure 7a,b shows the CAD profile of the 0.25 m orifice plate, including the front section and the 3D view. This figure is representative of the design concept applied to all 05 cases.

2.5.2. Orifice Mesh Generation

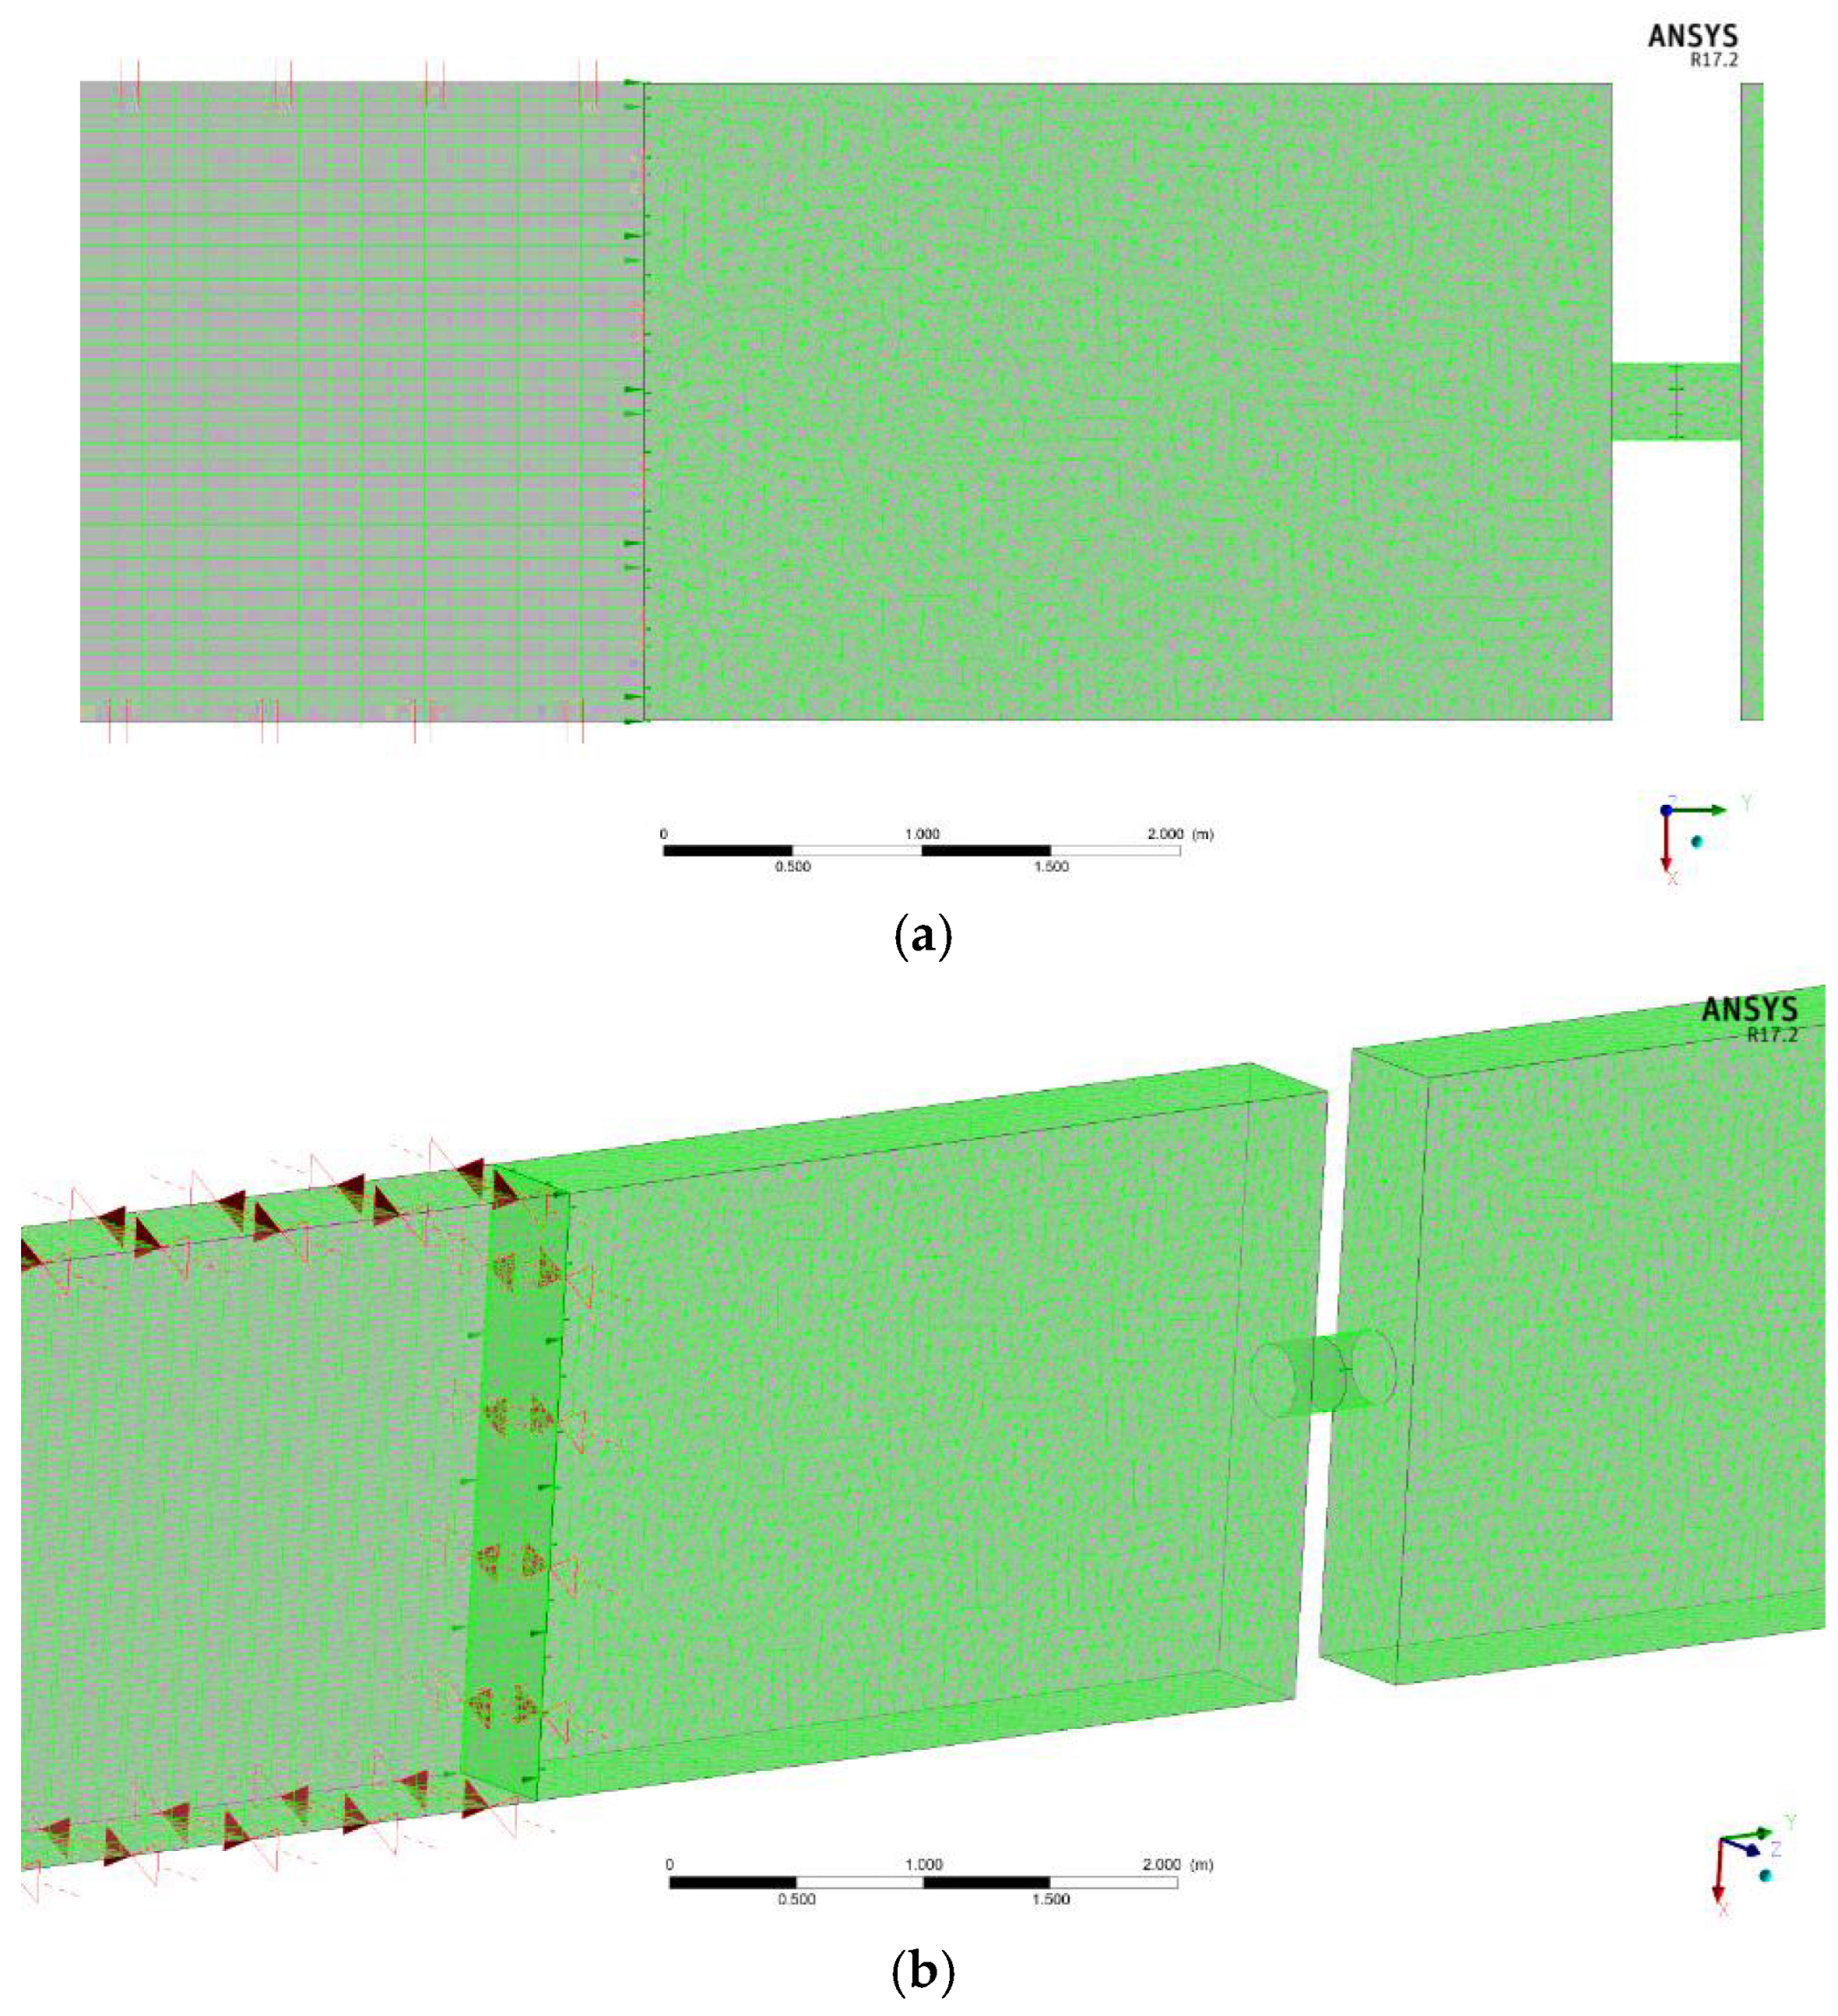
The orifice simulations were carried out in ANSYS CFX 17.2, while the mesh was generated using ANSYS ICEM CFD [69,74]. The domain consisted of the inlet passage, the orifice section, and the outlet passage, arranged in a straight-through transient oscillatory-flow configuration. Figure 8a shows the mesh elements of the orifice plate combined with the water passage. Figure 8b presents the full 3D mesh generated in ICEM CFD. Local refinement was introduced in the vicinity of the orifice throat and interface sections to capture the steep pressure gradient, vena contracta development, and flow acceleration through the restriction.
The mesh in Table 8 shows that the inlet and outlet chamber sections were discretized symmetrically, which is important for unbiased bidirectional oscillatory-flow predictions. The total mesh size provided a reasonable balance between computational tractability and local flow accuracy at the restriction.

2.5.3. CFX Domain Setup and Boundary Conditions

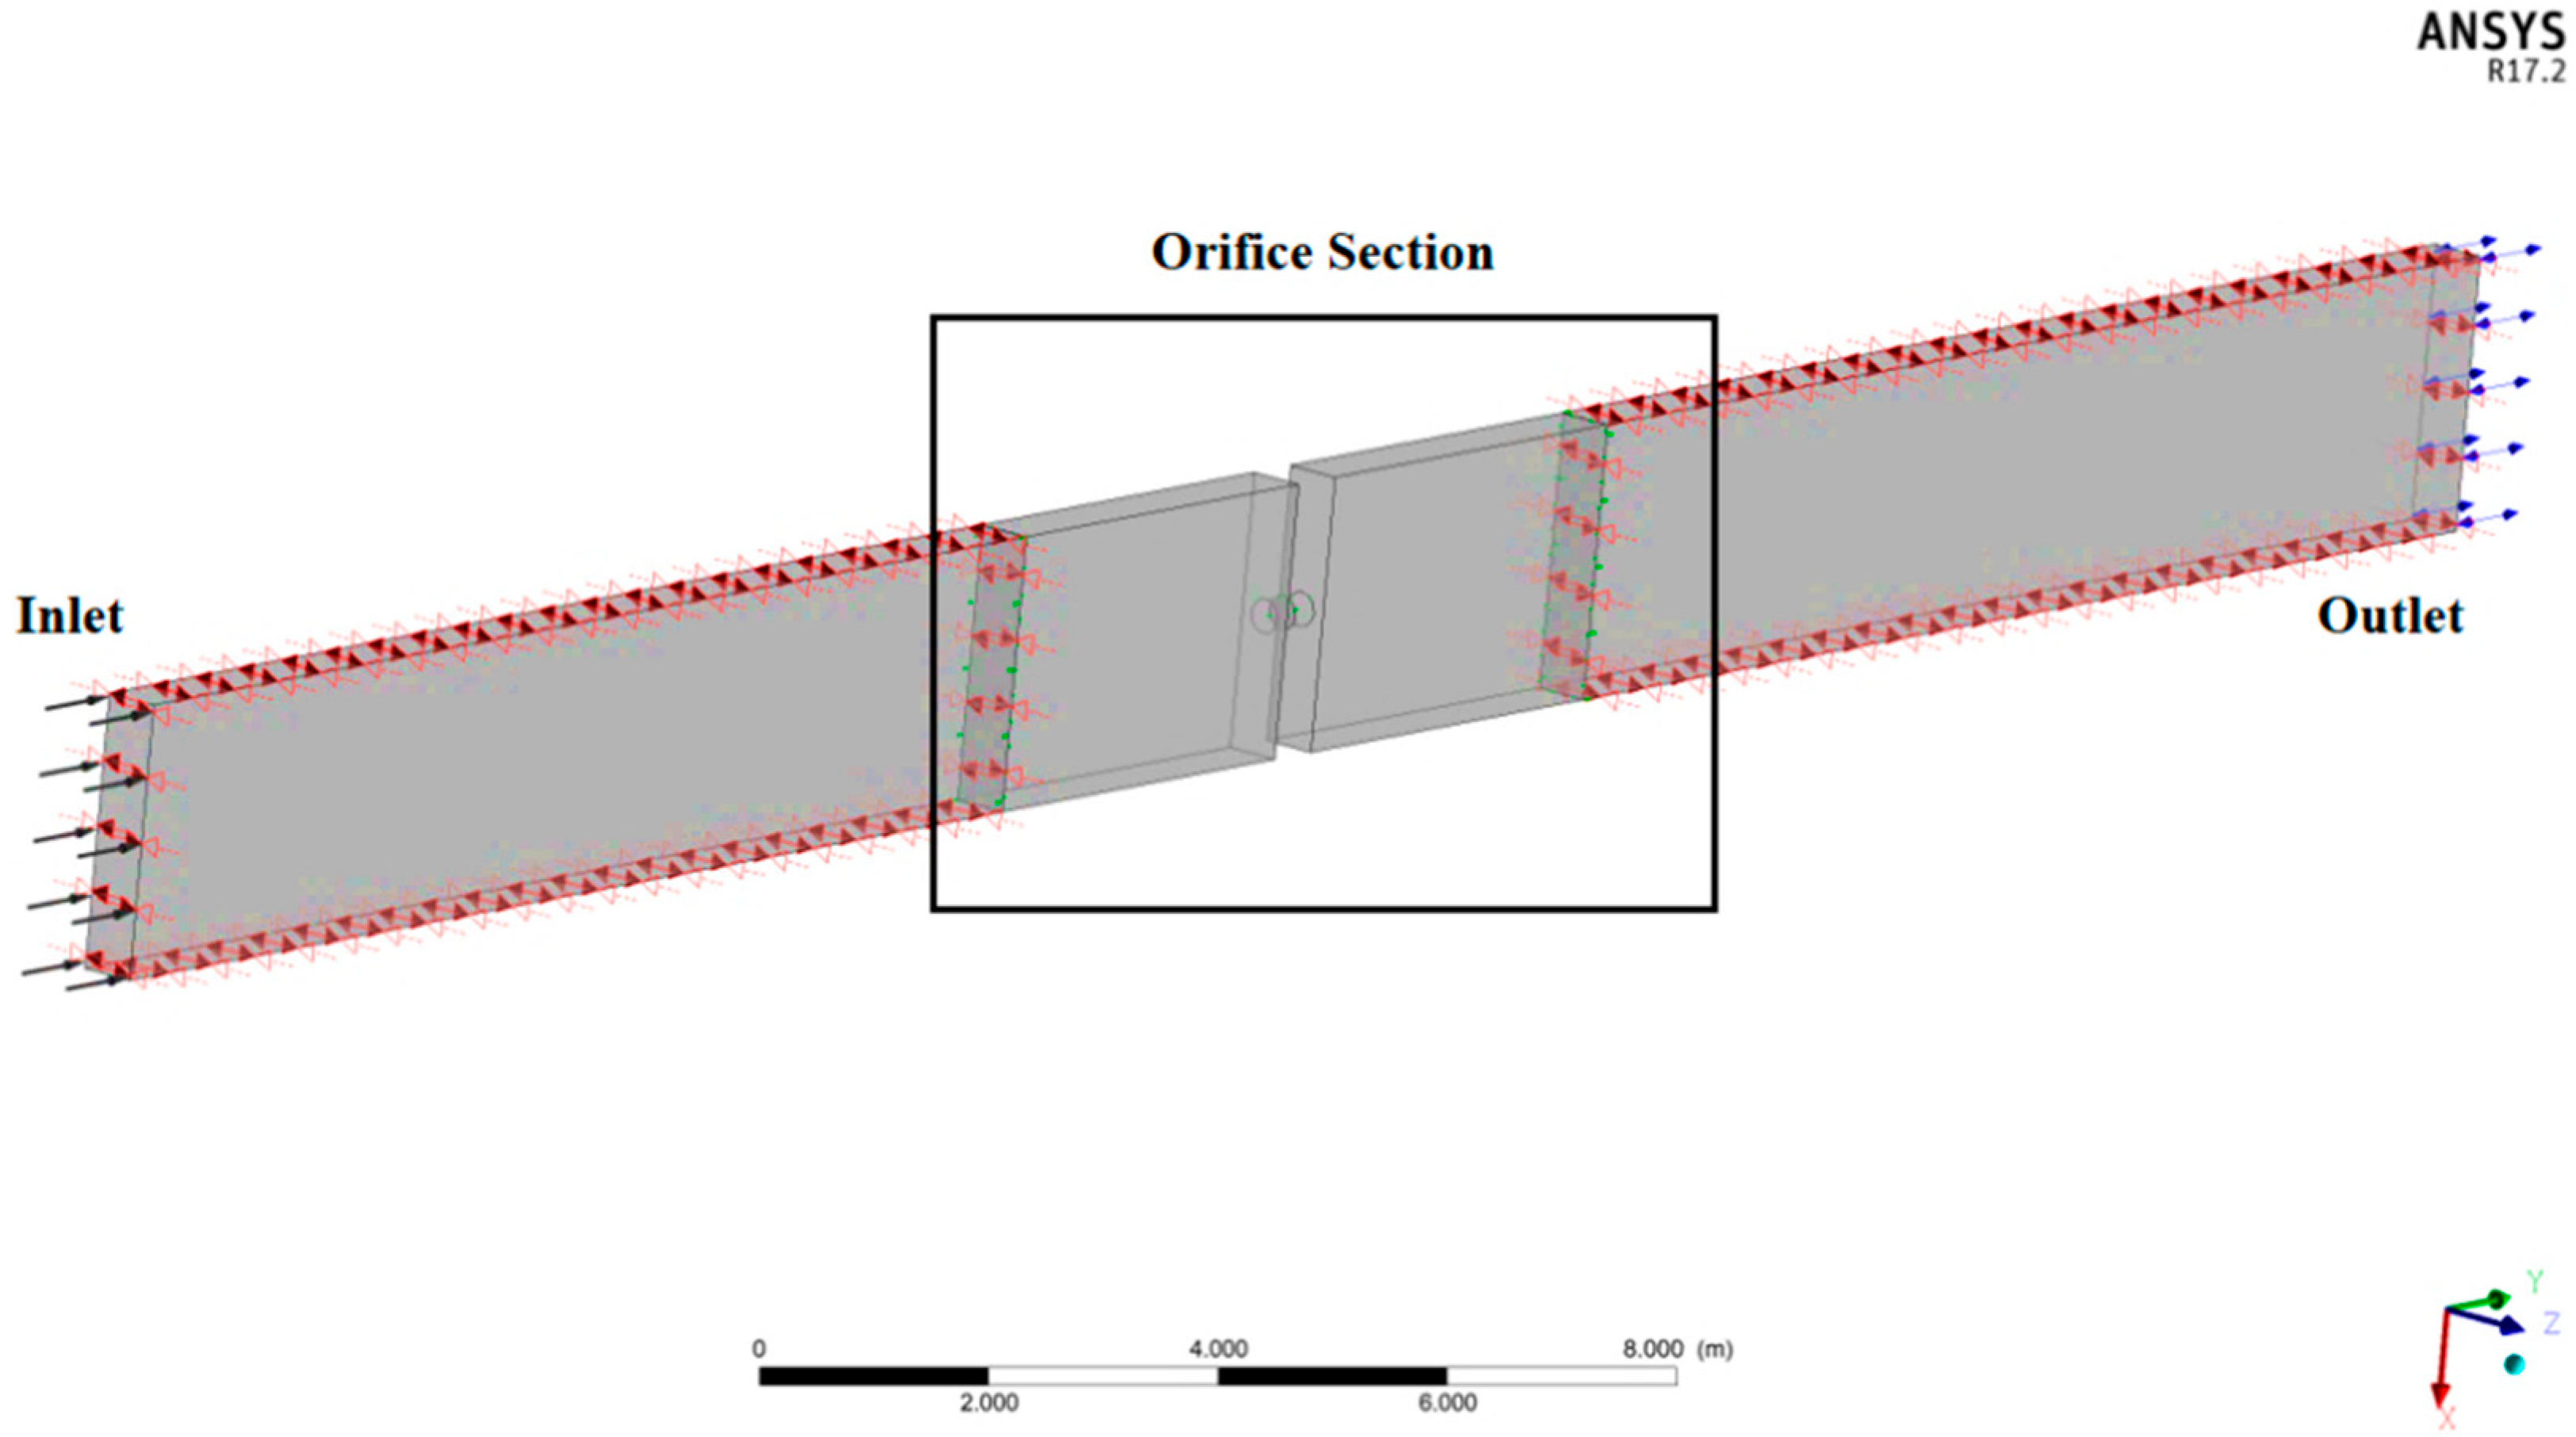
Figure 9 shows the numerical setup used in ANSYS CFX 17.2, including the inlet, outlet, and central orifice section. Refer Table 9 for setup details [69,74]. The transient oscillatory flow was imposed such that the flow direction periodically reversed, thereby reproducing the two-way flow pattern typical of OWC operation.
The numerical setup in Table 9 was intentionally chosen to mirror the turbine simulations as closely as possible. This ensured that differences in pressure-drop response attributed primarily to the orifice geometry.

2.5.4. Mesh-Independence Check for the Orifice Model

Mesh-sensitivity test was carried out for the orifice-only problem using coarse, medium, and fine meshes (Table 10). The comparison focused on the peak ΔP, phase-averaged flow rate, and the shape of the ΔPQ loop under the same imposed oscillatory forcing [11,69].
The coarse mesh slightly underpredicted peak pressure drop due to insufficient throat resolution. The difference between the medium and fine meshes was within ~2–4% for the peak pressure difference and cycle-averaged flow rate. Therefore, the medium mesh corresponding to Table 10 retained for full parametric study of all orifice diameters.

2.6. Coupled Hydrodynamic and PTO Simulations

After the orifice calibration stage, the validated orifice geometry was integrated into the complete BBDB-FOWC model for the final coupled simulations in STAR-CCM+. The following elements were included simultaneously:
  • Floating BBDB-FOWC structure;
  • Catenary mooring system;
  • Orifice-based PTO representation;
  • Wave-induced free-surface motion;
  • Hydrodynamic damping effects.
02 main simulation conditions were considered:
  • Undamped condition, without imposing the damping coefficient extracted from the free-decay test;
  • Damped condition, with the damping parameters incorporated into the system response framework.
The internal water-column motion generated cyclic bidirectional flow through the PTO region. Based on the later simulation outputs, peak mass flow rates were found to be in the range of 2000–2200 kg/s, while RMS-based pressure fluctuations reached approximately 1.8 MPa under the damped condition. These values confirm that the PTO region operates in a strongly oscillatory, high-energy hydraulic regime.

2.7. Performance Evaluation Metrics

The hydrodynamic-to-PTO performance of the BBDB-FOWC was evaluated by comparing the incident wave power with the power transferred through the PTO restriction. The incident wave power per unit crest width was calculated as [86,87,88,89,90];
P w a v e = ρ g 2 64 π H s 2 T e
where Hs is the significant wave height and Te is the representative wave period.
The instantaneous PTO power is defined as [86,87,88,89,90];
P o r i f i c e t = Δ P t Q t
To account for the cyclic oscillatory response, RMS-based averaging was used over the evaluated time series [86,87];
P a v g = 1 n i = 1 n ( Δ P i Q i ) 2
The overall conversion efficiency was then computed as [87];
η = P o r i f i c e P w a v e × 100 %
These metrics enabled direct comparison between the damped and undamped system behavior and provided the quantitative basis for evaluating the effectiveness of the orifice-based PTO surrogate.

2.8. Methodological Reliability and Scope

The methodology developed in this work is intentionally hierarchical. The hydrostatic model provides the initial equilibrium and restoring properties. The free-decay model isolates and identifies the viscous damping characteristics. The orifice model isolates and calibrates the PTO-equivalent pressure-drop response. The final coupled model integrates all these elements under realistic offshore wave forcing. This layered strategy improves both the physical transparency and the numerical stability of the overall framework.
From a numerical perspective, mesh sufficiency was assessed at each major stage:
  • AQUA hydrostatic panel convergence for hydrostatic parameters;
  • STAR-CCM+ mesh sensitivity for floating-body hydrodynamics and free-surface interaction;
  • Free-decay mesh/time-step sufficiency for damping extraction;
  • CFX mesh sensitivity for the orifice pressure-drop model.
Although the conducted sensitivity checks indicate that the adopted discretizations lie within a practically mesh-independent regime for the principal variables of interest.

2.9. Summary of the Methodology

In summary, the present numerical methodology established a coupled computational route for evaluating the modified BBDB-FOWC under offshore wave loading. The hydrostatic characteristics were first extracted in ANSYS AQUA and used to initialize the CFD model. A CFD-based free-decay test in STAR-CCM+ then yielded a damped period of 16.583 s, a damped natural frequency of 0.378885 rad/s, an undamped natural frequency of 0.380643 rad/s, a damping ratio of 0.096, and a non-dimensional damping factor of 0.067735. A parametric family of five orifice geometries was then developed and calibrated in ANSYS CFX, with the pressure-drop response compared against the reference turbine. Finally, the validated orifice surrogate and damping parameters were integrated into the fully coupled STAR-CCM+ simulations of the BBDB-FOWC. This methodology provides a numerically efficient and physically meaningful means of representing PTO-induced hydraulic damping in a floating OWC device without explicitly resolving turbine rotation, and it forms the basis for the results and discussion presented in the next section.

3. Results and Discussion

3.1. Hydrostatic and Hydrodynamic Response of the Floating BBDB-FOWC

3.1.1. Hydrostatic Characteristics and Static Stability

The hydrostatic characteristic from ANSYS AQUA analysis (Table 11) values confirm a buoyancy-dominated, statically stable floating platform suitable for offshore deployment and subsequent dynamic wave-loading simulations.
The vertical positions of the center of gravity and buoyancy are computed as CoG: z = −9.34 m and CoB: z = −5.02 m, resulting in a separation of Δz ≈ 4.32 m. This positive buoyancy offset (CoB above CoG) establishes a strong restoring moment under angular perturbations and ensures stable equilibrium under both small and moderate inclinations [81]. The metacentric heights are evaluated as GMx = 4.33 m and GMγ = 4.34 m, indicating a structurally stiff but not over-constrained floating body. These values fall within the optimal range for wave energy converters, where sufficient rotational stiffness is required to prevent excessive roll and pitch while preserving the ability to undergo productive heave motion [77,86]. The magnitude of GM suggests that restoring moments are strong enough to suppress instability, yet not large enough to damp out the dynamic response necessary for oscillatory water-column excitation. The total displacement of 3536.7 m3 confirms substantial buoyant capacity consistent with offshore-scale deployment. The cut-waterplane area (22.41 m2) and second moments of area (Ix = 29.54 m4, Iγ = 58.60 m4) provide moderate hydrostatic leverage, directly influencing the natural periods of oscillation [91]. These values indicate that the structure possesses sufficient waterplane stiffness to resist large angular deviations while maintaining responsiveness to wave-induced excitation. The hydrostatic stiffness matrix further supports this interpretation. The dominant diagonal terms in heave, roll, and pitch confirm that restoring forces are primarily governed by direct stiffness contributions [91]. The off-diagonal coupling terms are at least one to two orders of magnitude smaller, indicating weak cross-mode interaction. This decoupling is advantageous, as it minimizes the risk of coupled instability between surge–heave or roll–pitch modes under irregular wave loading [92]. From a system-level perspective, the hydrostatic configuration results in a buoyancy-dominated restoring regime, where stability is achieved through geometric and mass distribution rather than excessive structural constraint. The ratio of metacentric height to draft (GM/D ≈ 0.22) further confirms that the platform operates in a stable yet dynamically responsive regime, suitable for wave energy extraction [77]. The overall combination of low CoG, elevated CoB, metacentric heights (~4.3 m), and weak cross-coupling stiffness terms demonstrates that the BBDB-FOWC is statically stable and appropriately tuned for hydrodynamic excitation. These characteristics provide a robust foundation for subsequent dynamic response and energy conversion analysis.

3.1.2. Numerical Convergence of the Coupled Hydrodynamic Model

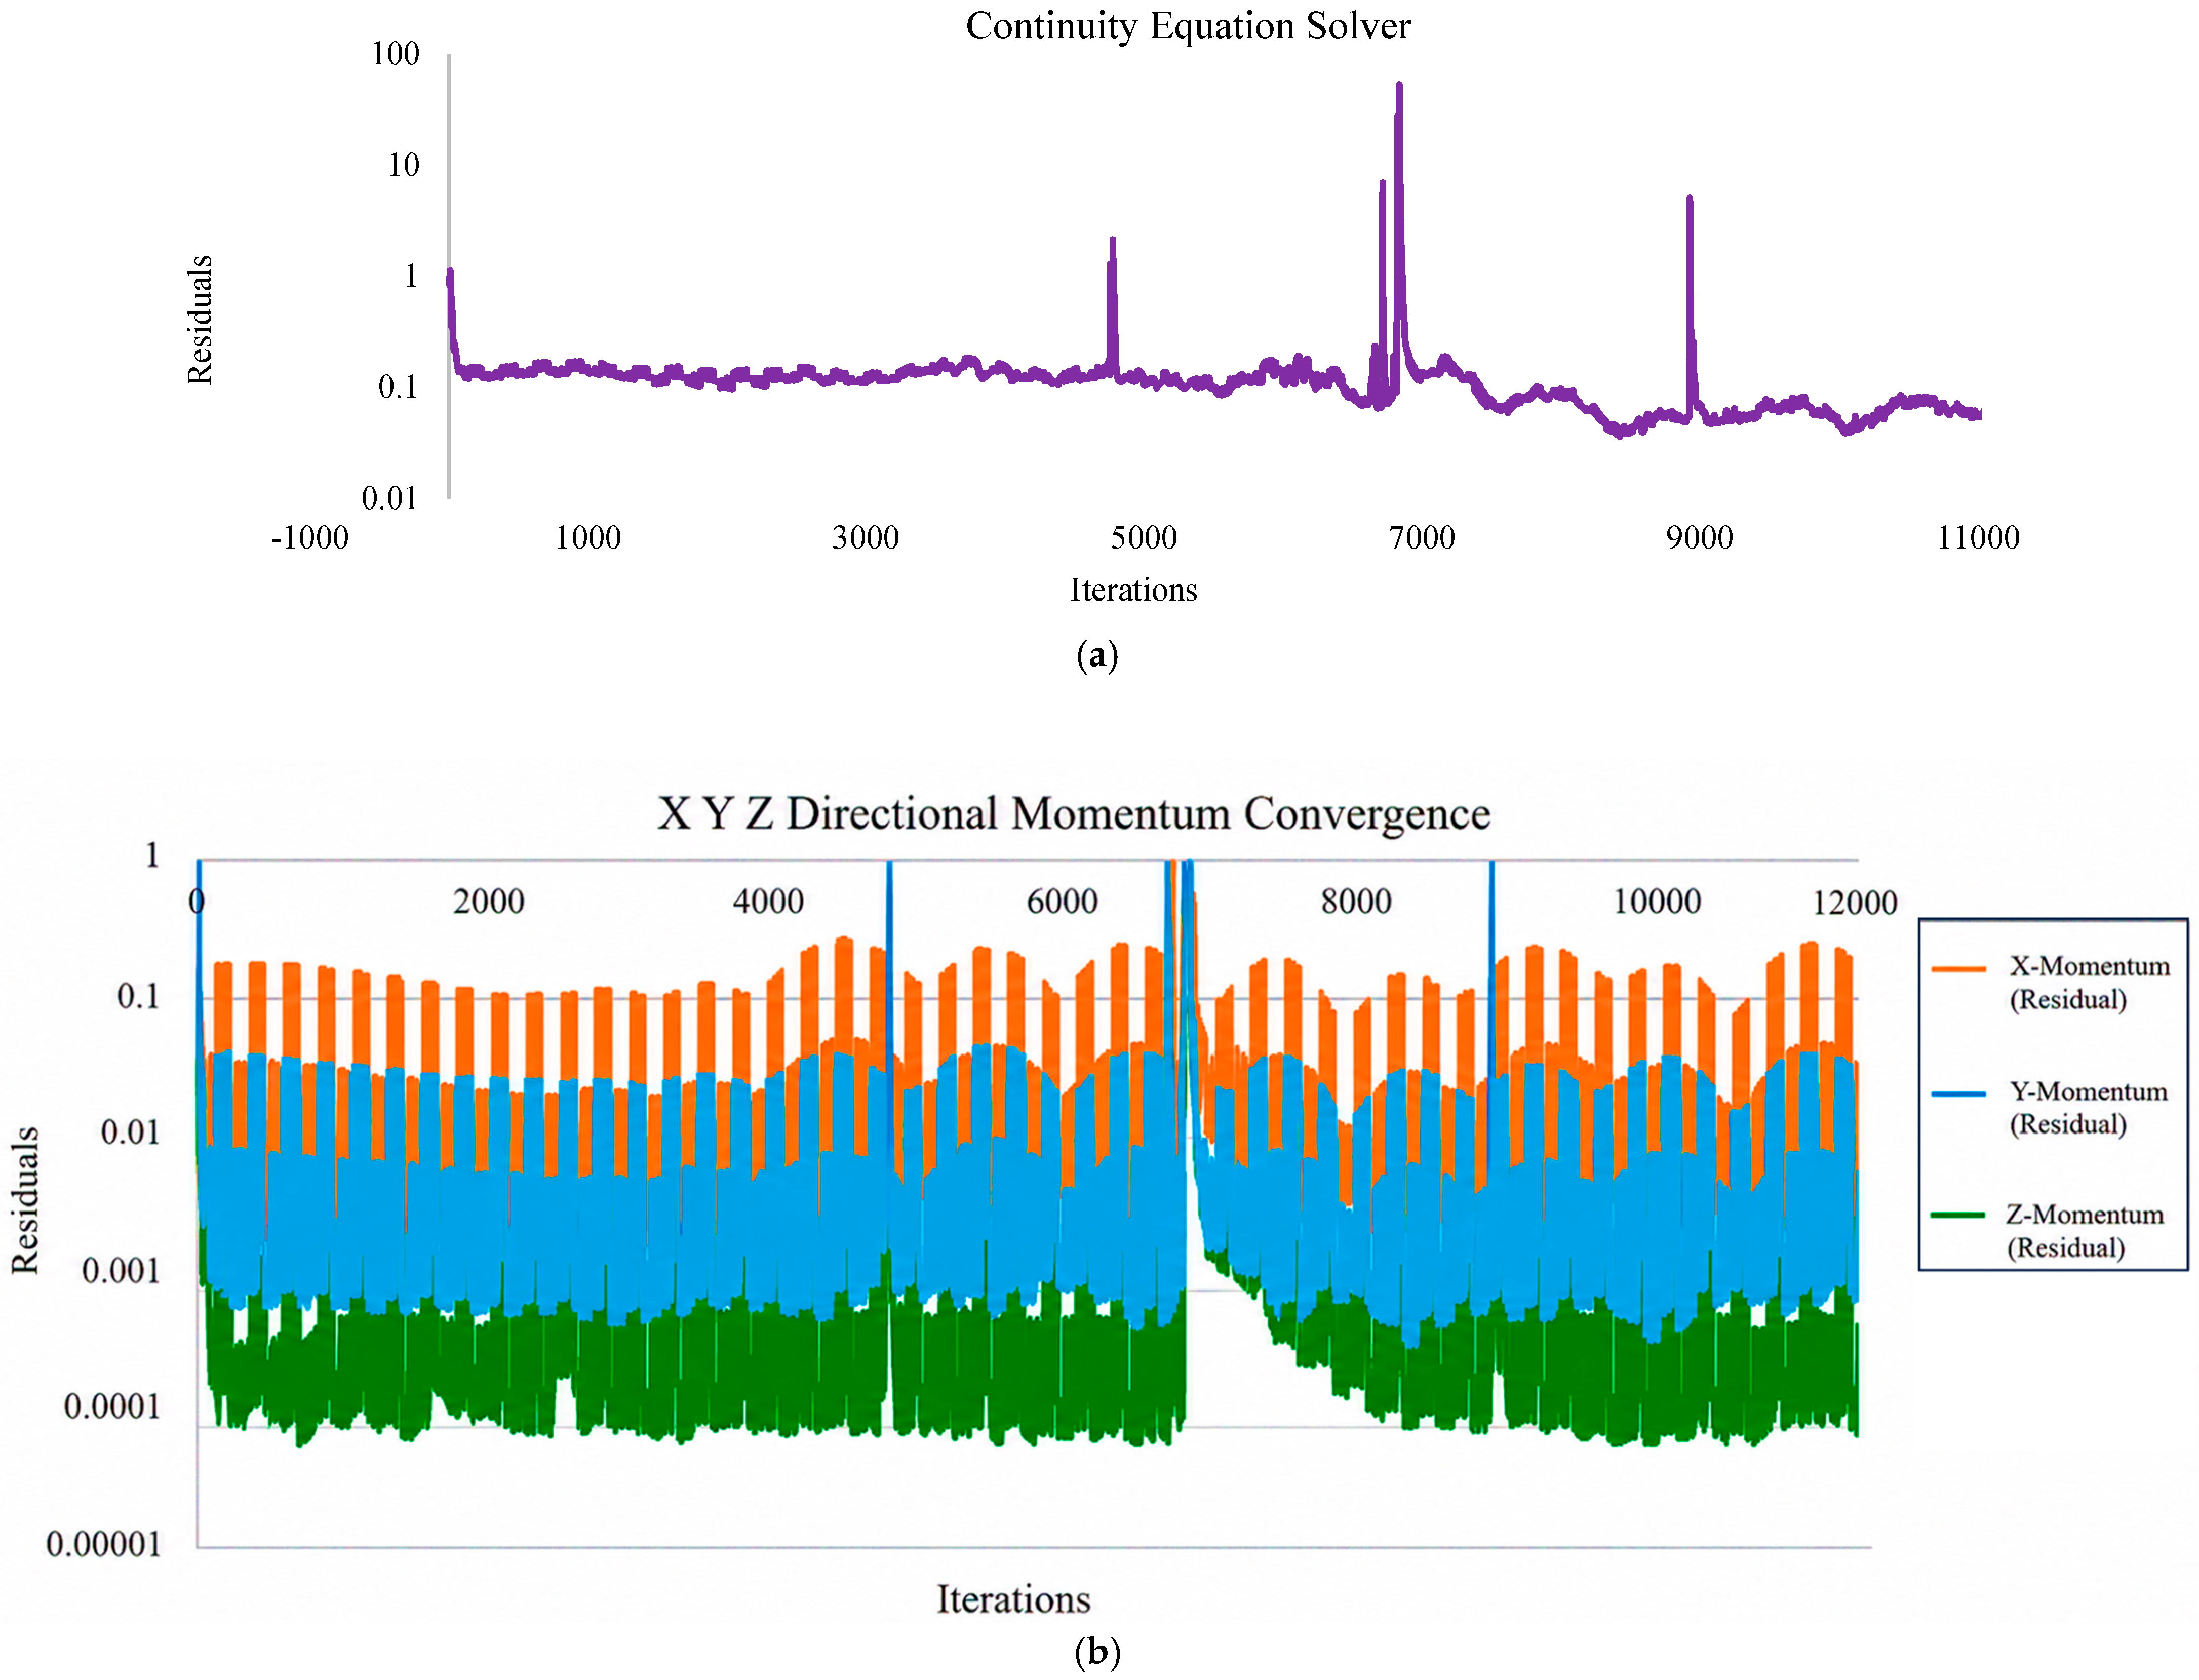
The convergence characteristics of the coupled STAR-CCM+ simulations are presented in Figure 10a,b. The numerical model integrates multiple strongly coupled physics, including Volume of Fluid (VOF) free-surface tracking, overset mesh interpolation, six-degree-of-freedom (6-DOF) rigid body motion (DFBI), and nonlinear mooring-line forces [81,82,93]. This combination introduces significant numerical stiffness and prevents classical steady residual convergence; therefore, convergence must be assessed using both residual trends and physical solution stability.
The continuity residual history (Figure 10a) shows an initial rapid decay followed by stabilization within a bounded range of approximately O(10−1) over ~11,000 iterations. Superimposed on this baseline are intermittent spikes reaching up to O(100–101). These excursions are directly correlated with transient physical events, including wave impact on the structure, rapid changes in free-surface topology, and periodic updates of the overset mesh interpolation region. In VOF-based simulations with moving interfaces and deforming control volumes, such residual spikes are expected and do not indicate numerical divergence [93,94]. The critical observation is that the residual consistently returns to its baseline band after each spike, confirming that the solver maintains stability and dissipates local numerical disturbances. The momentum residuals (Figure 10b) exhibit directional anisotropy consistent with the hydrodynamic forcing. The dominant component remains within O(10−2–10−1), while the lowest residual band reaches O(10−4–10−3). This variation reflects the directional nature of wave excitation, where surge and heave components are strongly coupled to wave propagation, while the lateral (sway) component remains weakly excited [95]. The periodic residual oscillations follow the imposed wave frequency (T = 9 s), indicating that the solver is resolving physically meaningful transient behavior rather than numerical noise. The isolated residual spikes observed around iterations ~4800, ~7000, and ~9000 were associated with temporary solver restart/checkpoint events during the long-duration HPC execution of the coupled simulations (~8–9 days runtime). These transient peaks were numerical restart artifacts rather than indications of physical instability or solution divergence, as the monitored global quantities and hydrodynamic responses remained stable after each restart stage.

3.1.3. Global Force Balance and Floating-Body Stability

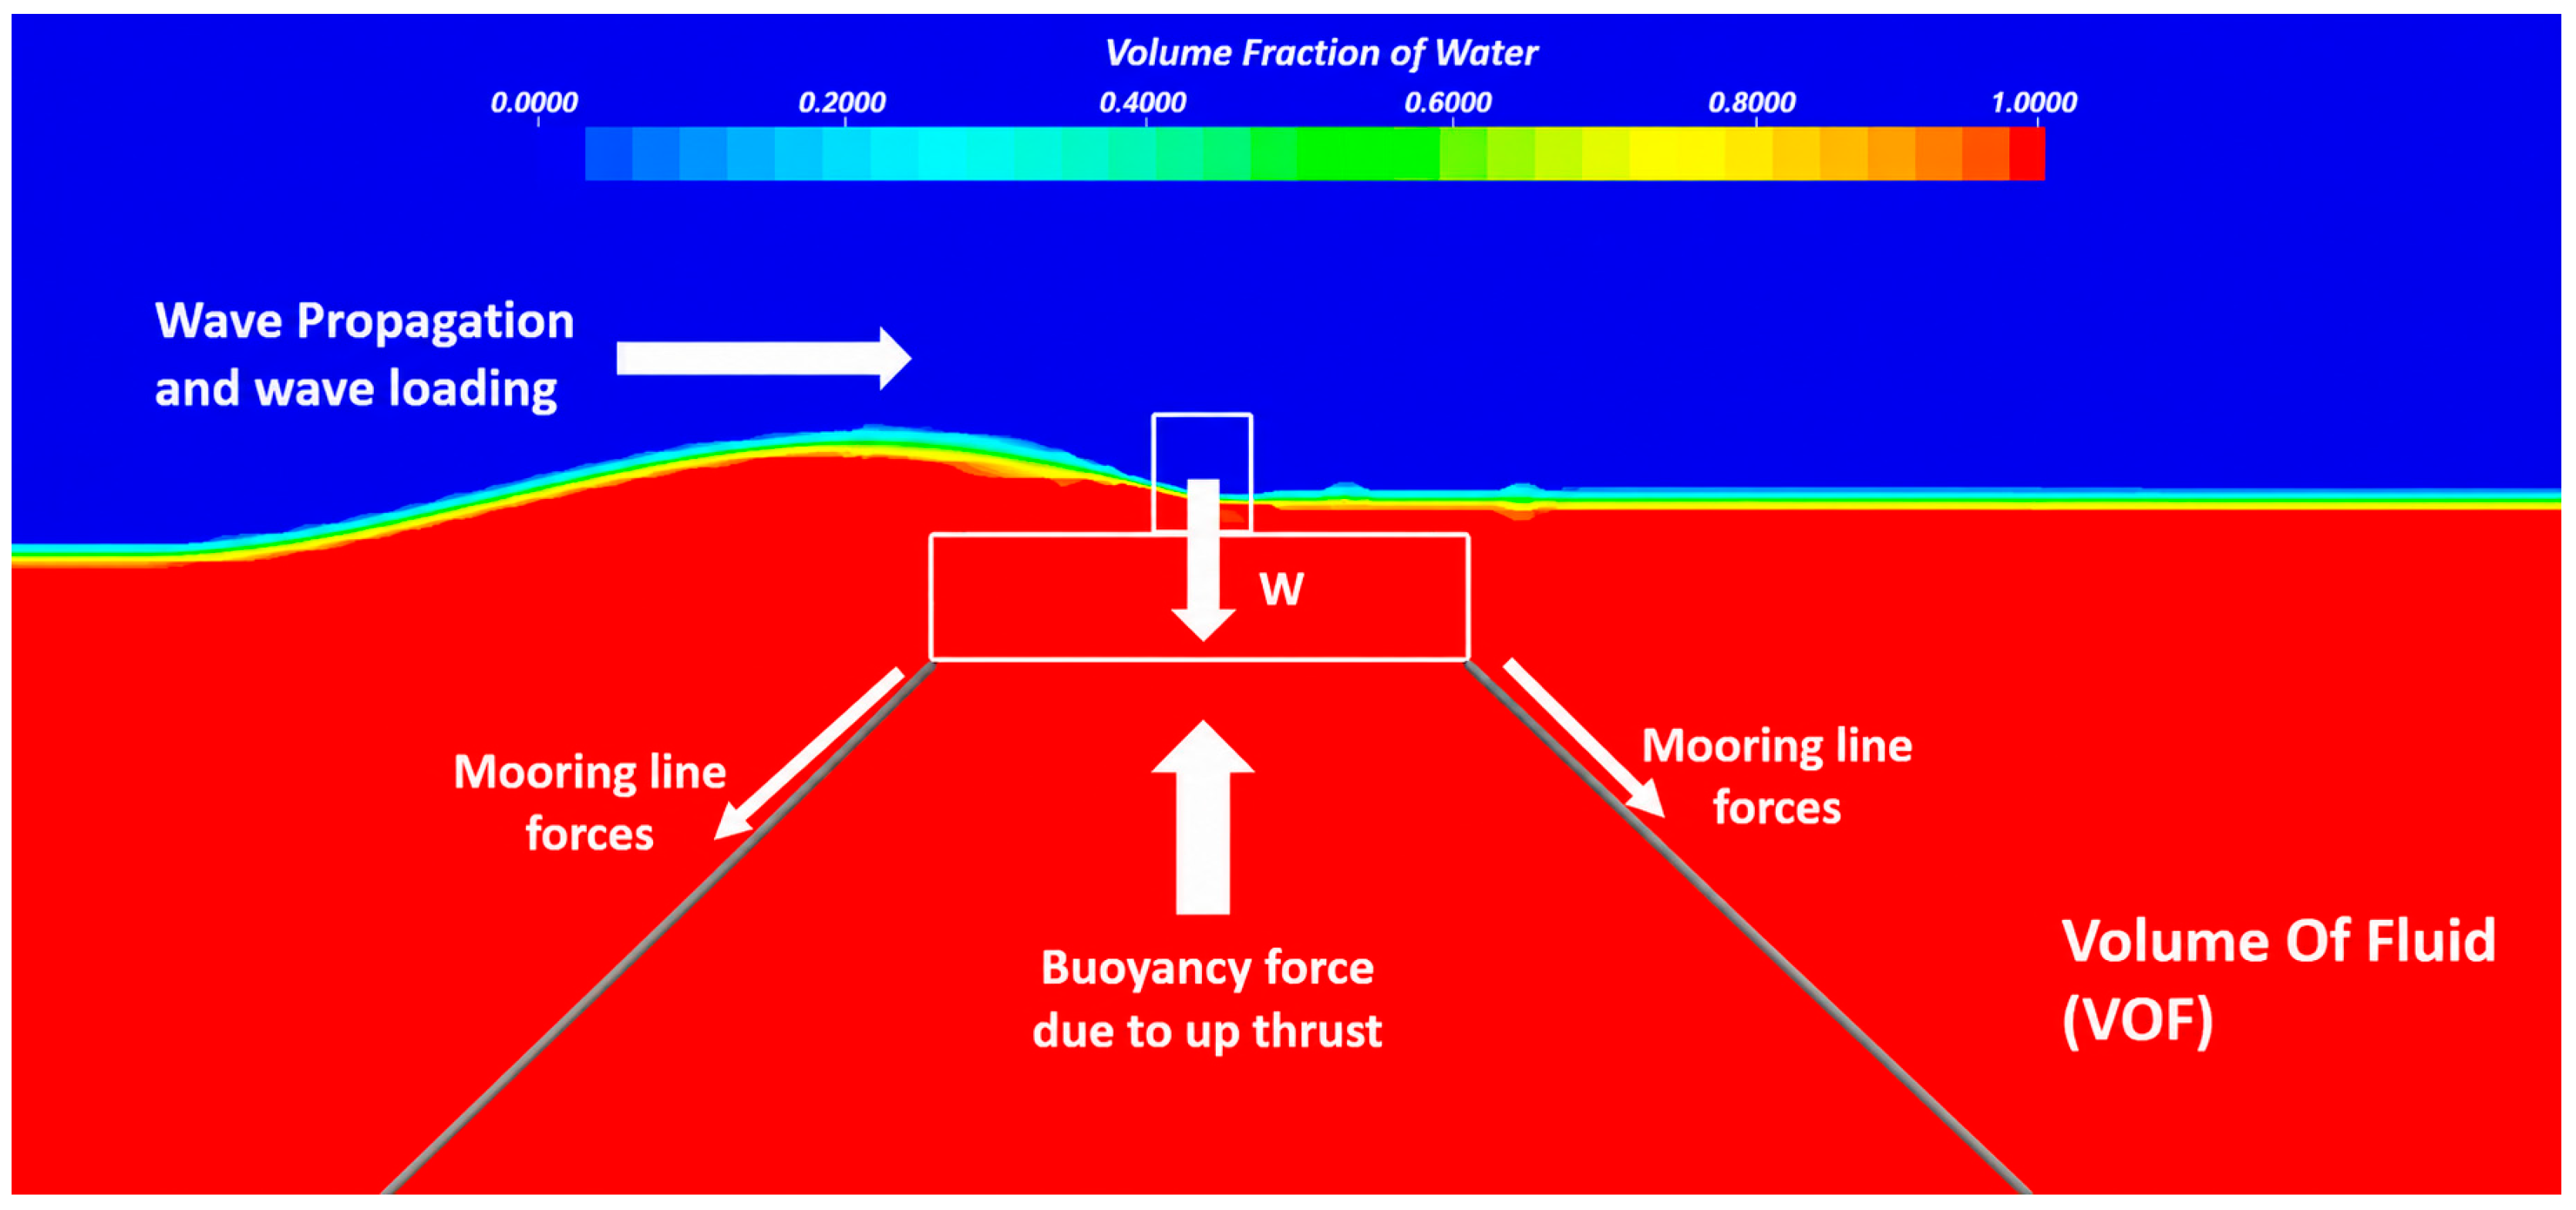
The force balance acting on the moored BBDB-FOWC is illustrated schematically in Figure 11, where the principal forces include structural weight, buoyancy, wave loading, and mooring-line reactions. This figure is significant because it highlights the multi-physics nature of the floating system: the structure is neither freely drifting nor rigidly fixed, but instead constrained by a force balance between hydrodynamic excitation and mooring-induced restoring action.
The downward body weight is balanced primarily by hydrostatic buoyancy, while the inclined mooring lines provide restoring forces that counteract surge and sway excursions [95]. Under wave action, the floating body experiences time-varying hydrodynamic loads, and the mooring system redistributes these loads into restrained translational and rotational motion. This balance is central to the BBDB-FOWC concept because excessive station-keeping stiffness would suppress useful hydrodynamic response, whereas insufficient mooring restraint would lead to excessive surge and yaw, reducing PTO effectiveness [93].
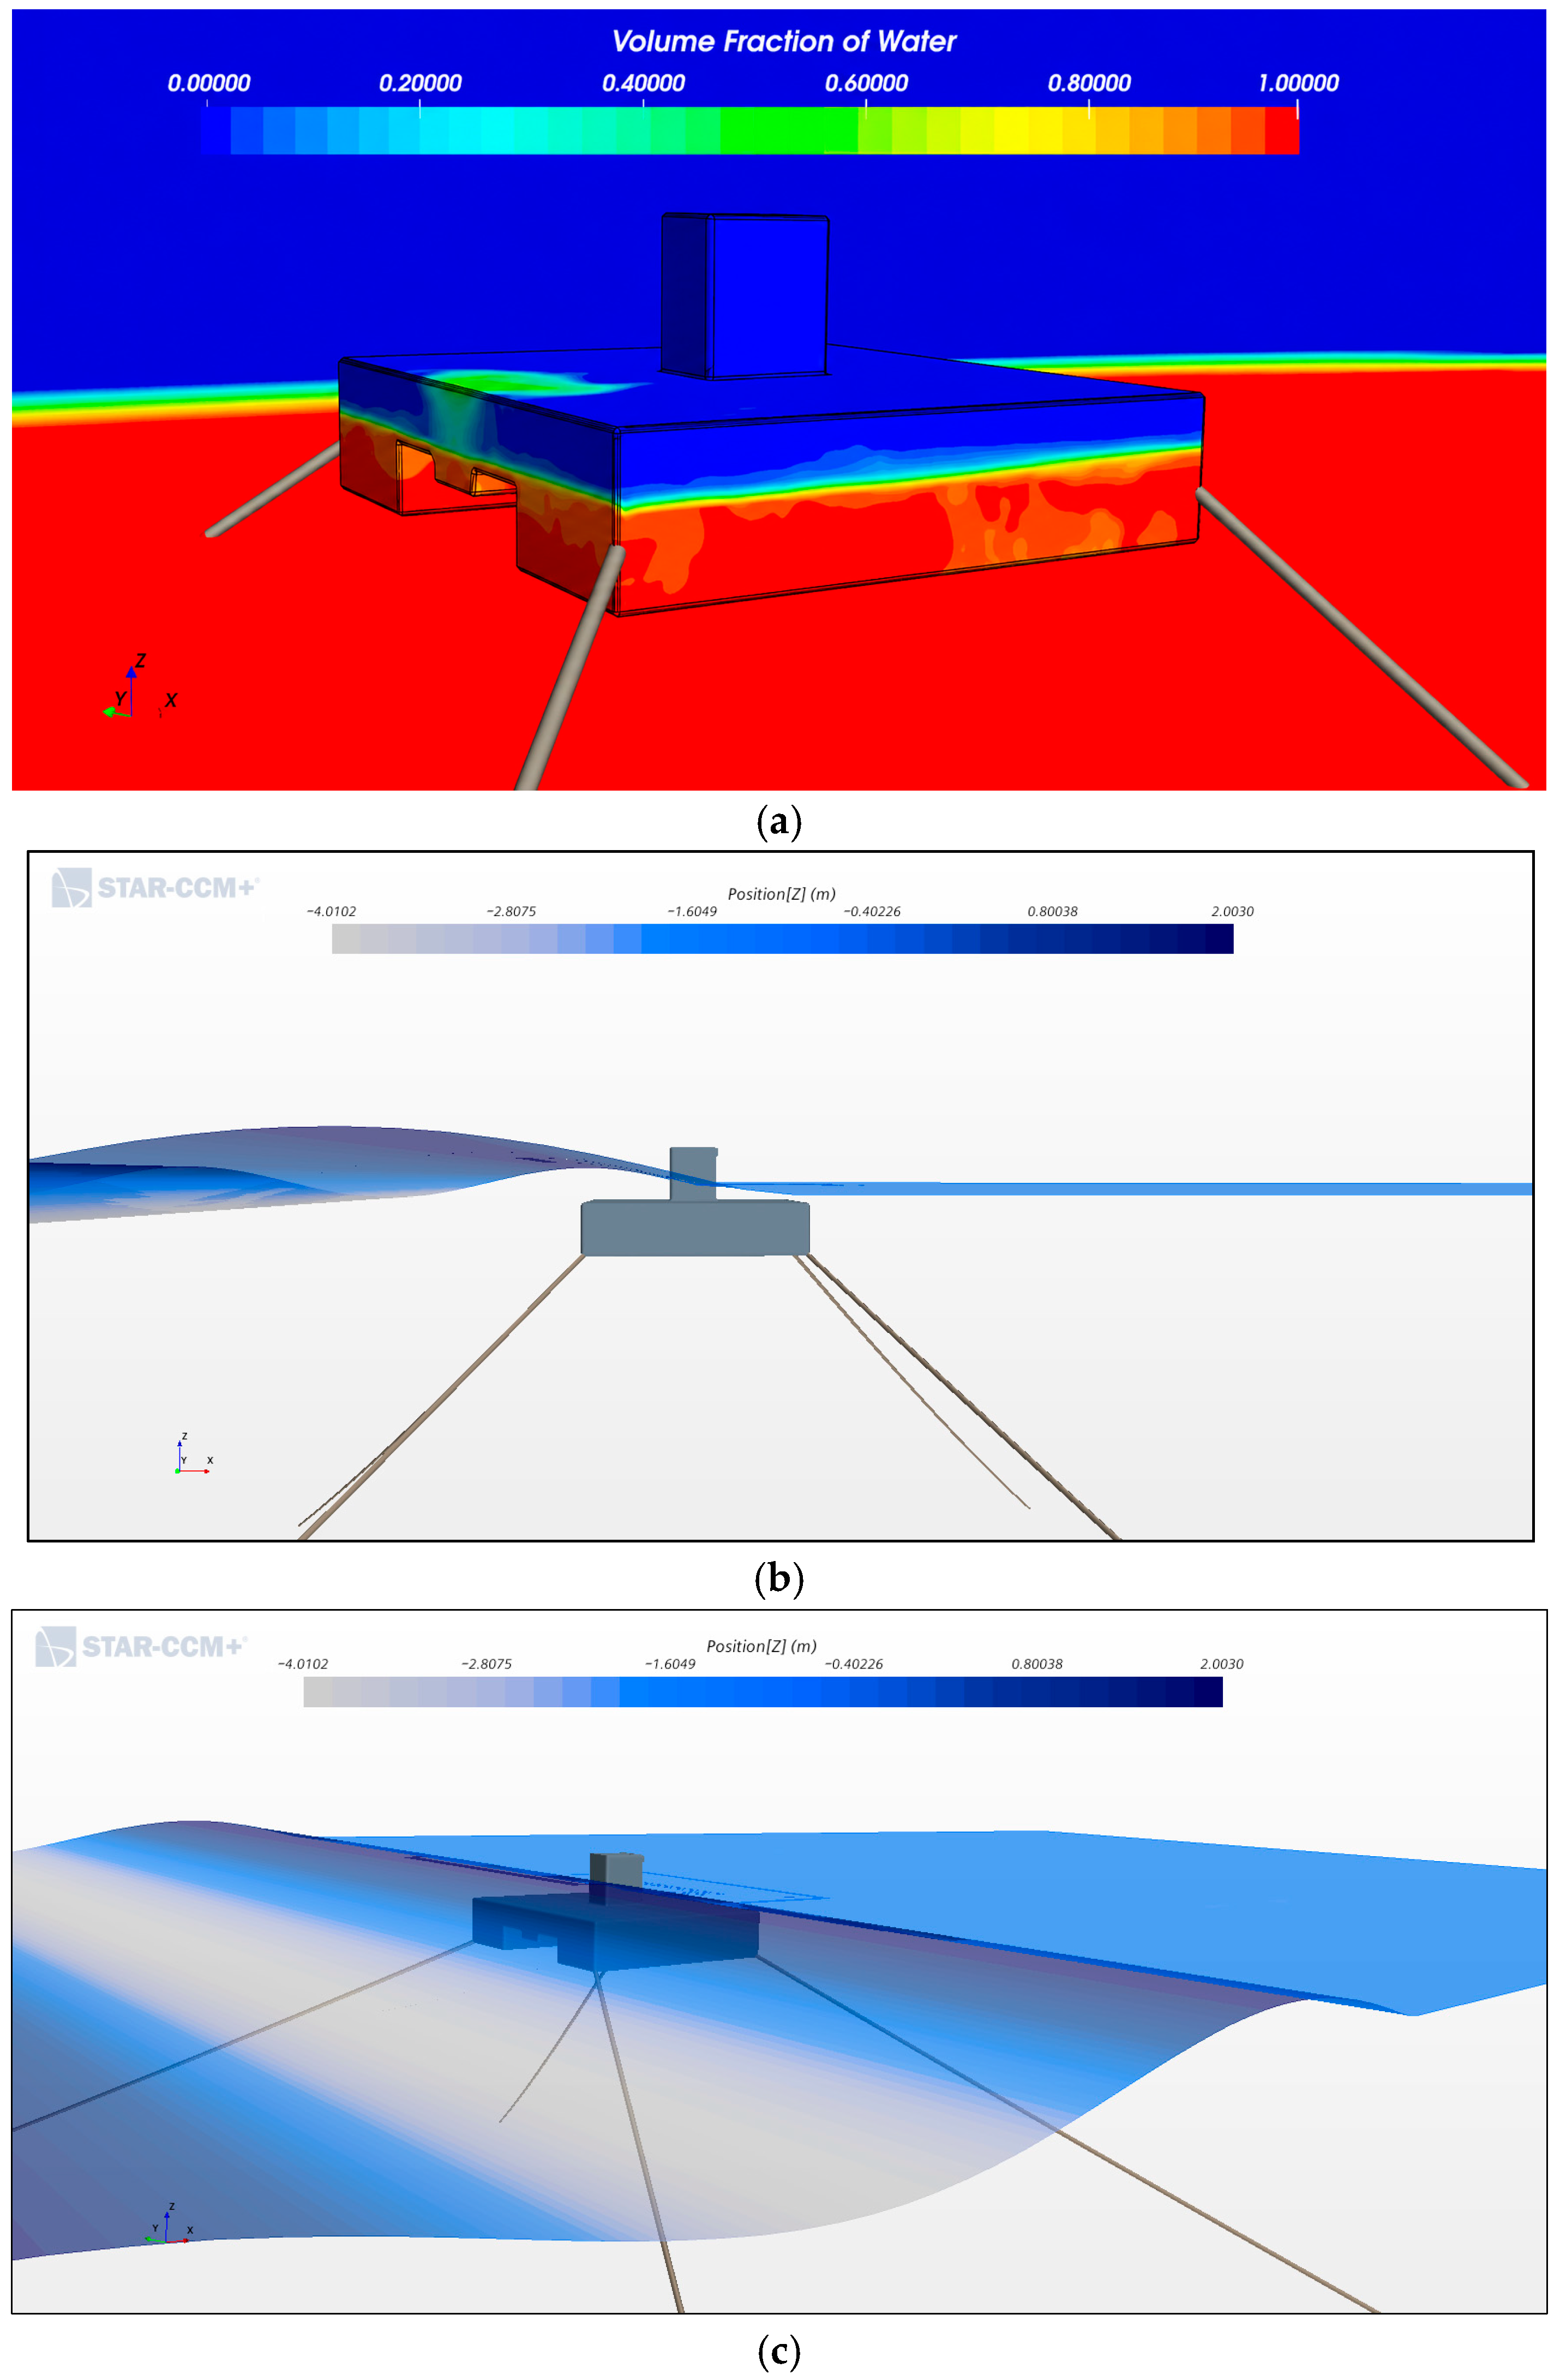
The simulated free-surface and body position, referred to in Figure 12a–c, support this interpretation. Although the body undergoes dynamic wave loading, the global position remains bounded and the platform returns repeatedly toward its mean operating location. This indicates that the 04-line catenary mooring arrangement provides effective station keeping without over-constraining the system.

3.1.4. Time-Varying Body Forces and Motion Response

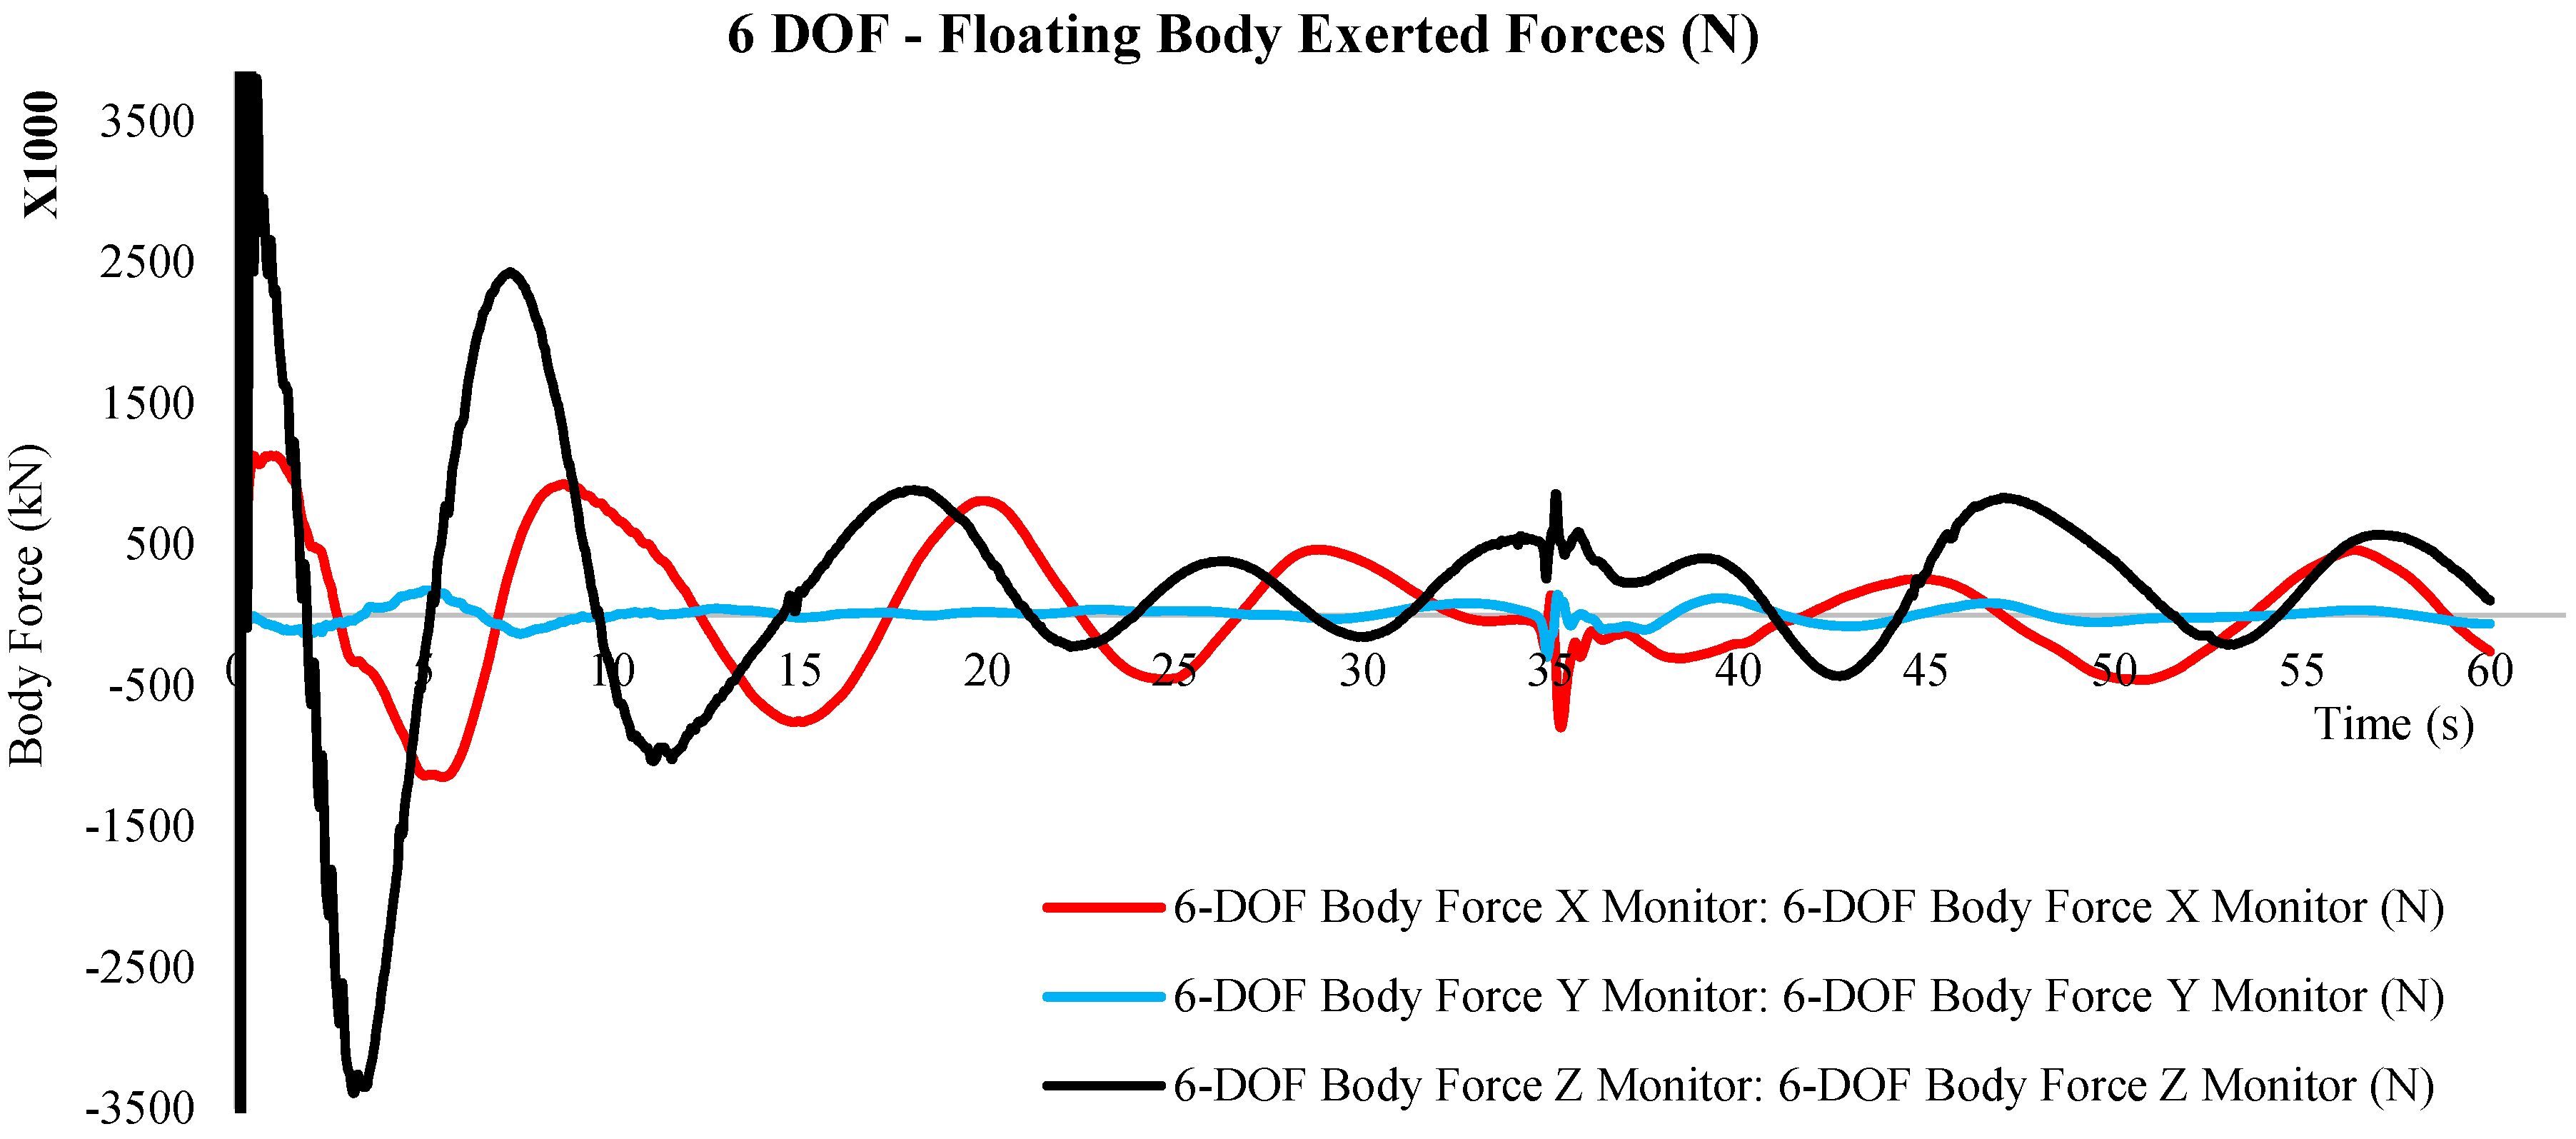
The transient 6-DOF hydrodynamic loads acting on the BBDB-FOWC are quantified in Figure 13. The force response exhibits clear directional dominance, rapid transient decay, and stable periodic behavior consistent with the imposed wave conditions (Hs = 3 m, T = 9 s).
The heave force (Z-direction) dominates the response, reaching an initial peak of approximately ±3.5 × 10⁶ N within the first 5 s. This corresponds to the primary wave impact and rapid establishment of hydrostatic equilibrium. Beyond this transient phase, the amplitude reduces by ~75–80% and stabilizes within ±(0.5–0.8) × 106 N, indicating effective hydrodynamic and mooring-induced damping. The surge force (X-direction) exhibits periodic oscillations aligned with the wave frequency, with peak amplitudes of ±(0.8–1.2) × 106 N during the initial cycles, reducing to ±(0.3–0.6) × 106 N after t ≈ 30 s. This confirms that horizontal excitation is wave-driven but effectively attenuated over time. In contrast, sway forces (Y-direction) remain negligible, confined within ±(0.05–0.15) × 106 N, demonstrating strong lateral constraint from the mooring system and ensuring directional stability of wave interaction. A consistent phase lag of approximately 2–3 s (~π/4–π/3 rad) is observed between surge and heave forces, with surge peaks preceding heave response. This phase offset is hydrodynamically critical, as it enhances relative motion between the external free surface and the internal water column, directly supporting oscillatory flow generation within the chamber.
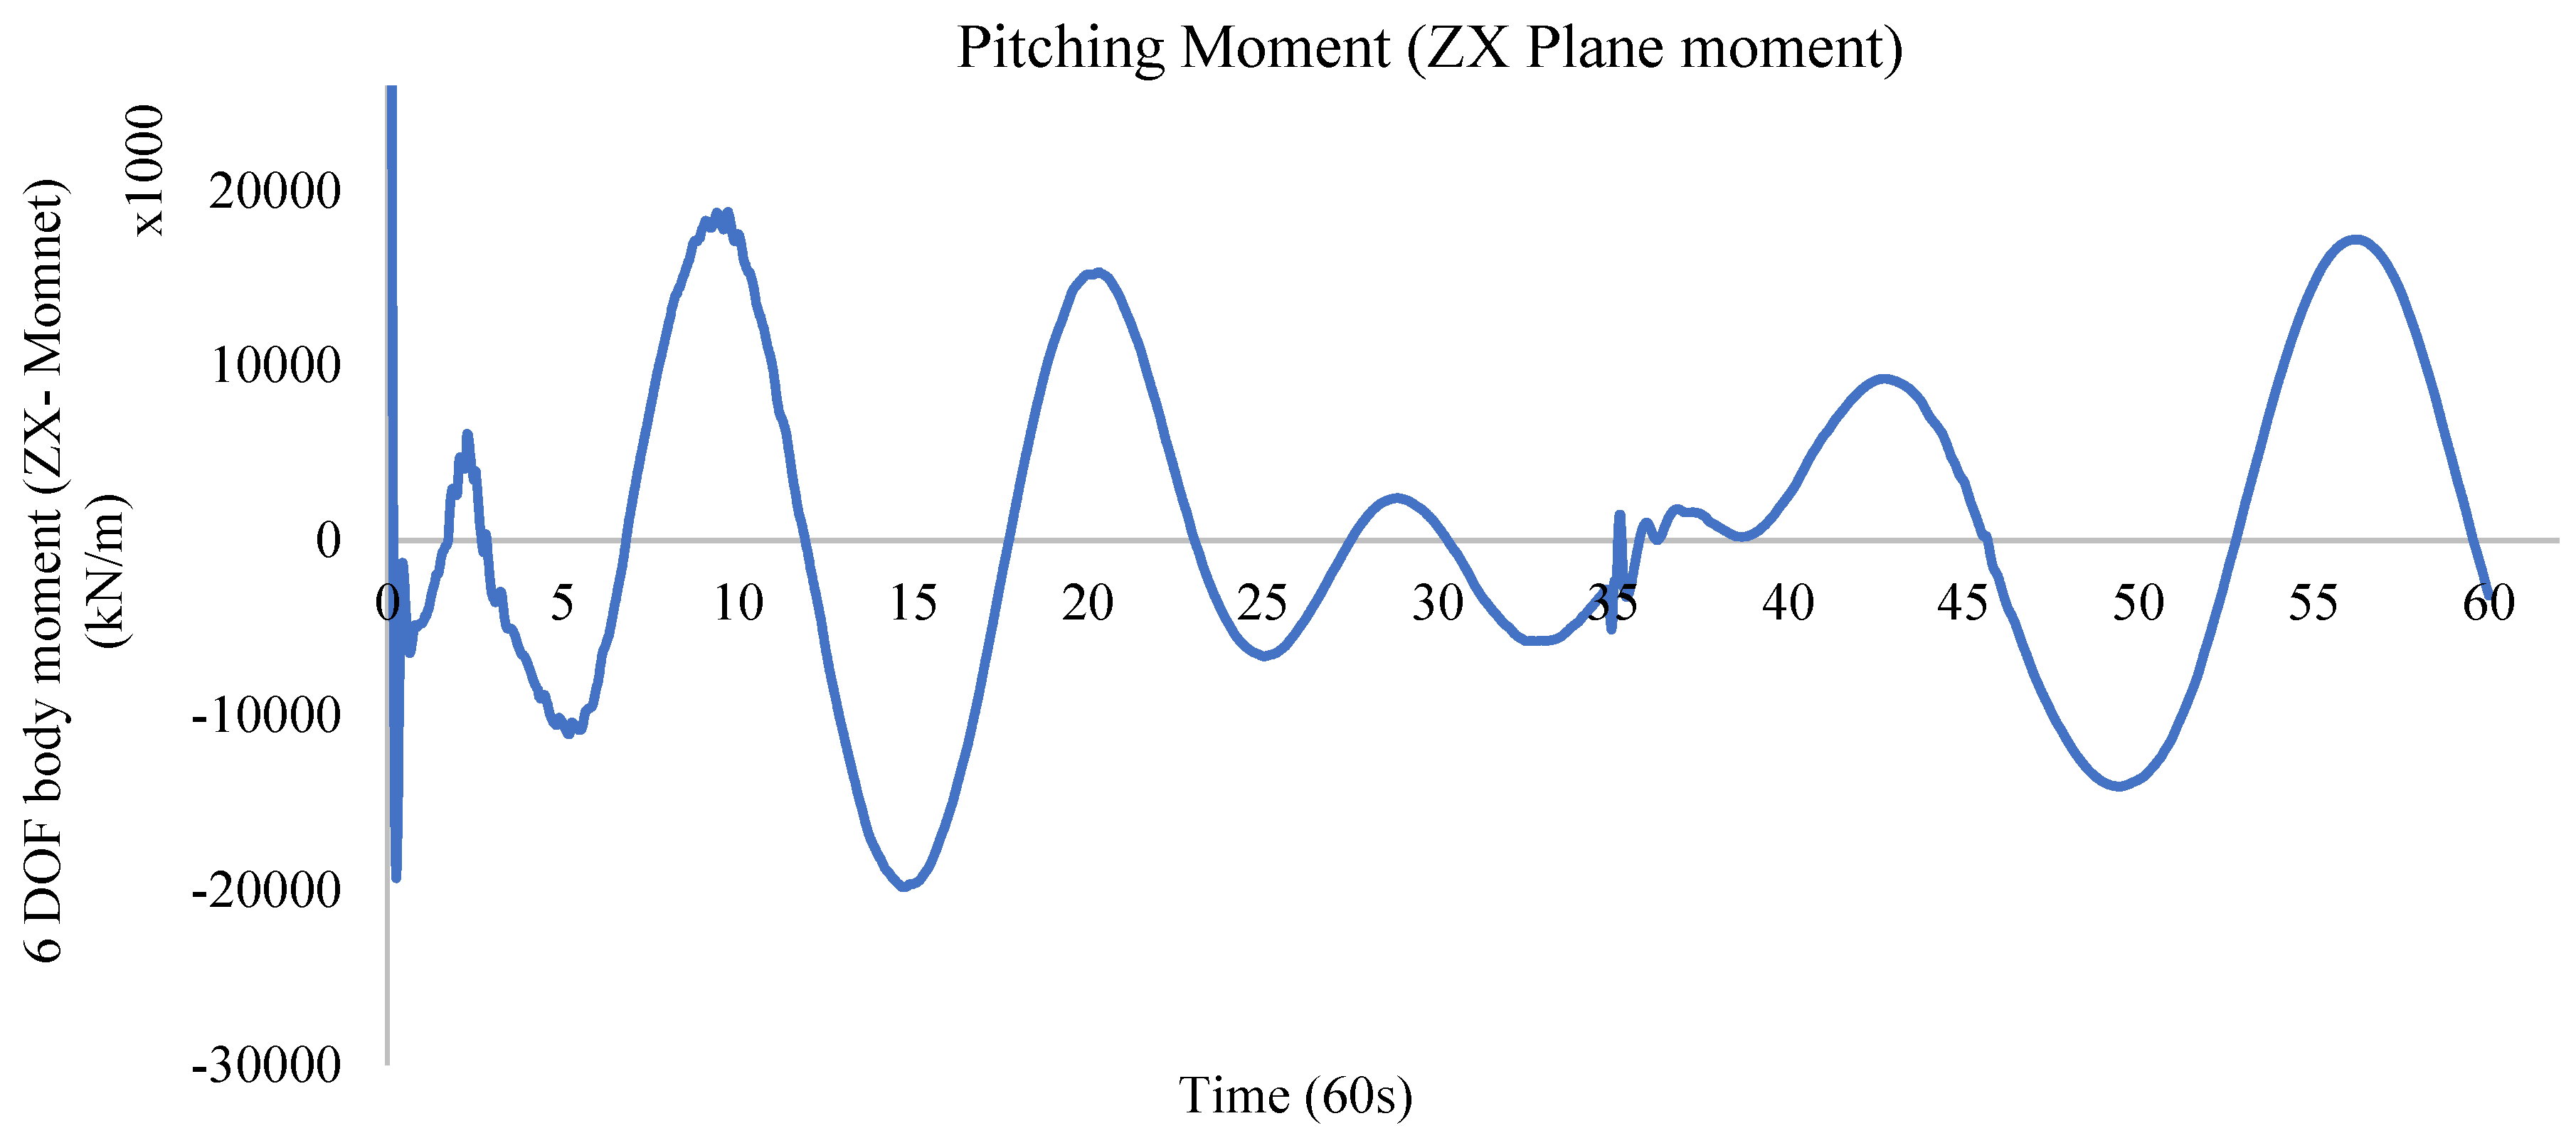
The pitching moment response (Figure 14) provides further insight into the rotational response of the platform. The dominant pitching moment oscillates around zero but with pronounced positive and negative peaks, particularly during the early-to-mid simulation interval. The initial peak reaches approximately ±2.0 × 10⁷ N·m during strong wave interaction (t ≈ 10 s), followed by bounded oscillations within ±(5–10) × 106 N·m. No drift or amplification is observed, indicating dynamically stable pitch behavior. This is consistent with the hydrostatic characteristics (Table 10), where the metacentric height (GM ≈ 4.33 m) provides strong restoring stiffness. The pitching response remains wave-frequency dominated, with amplitude attenuation governed by viscous and radiation damping.
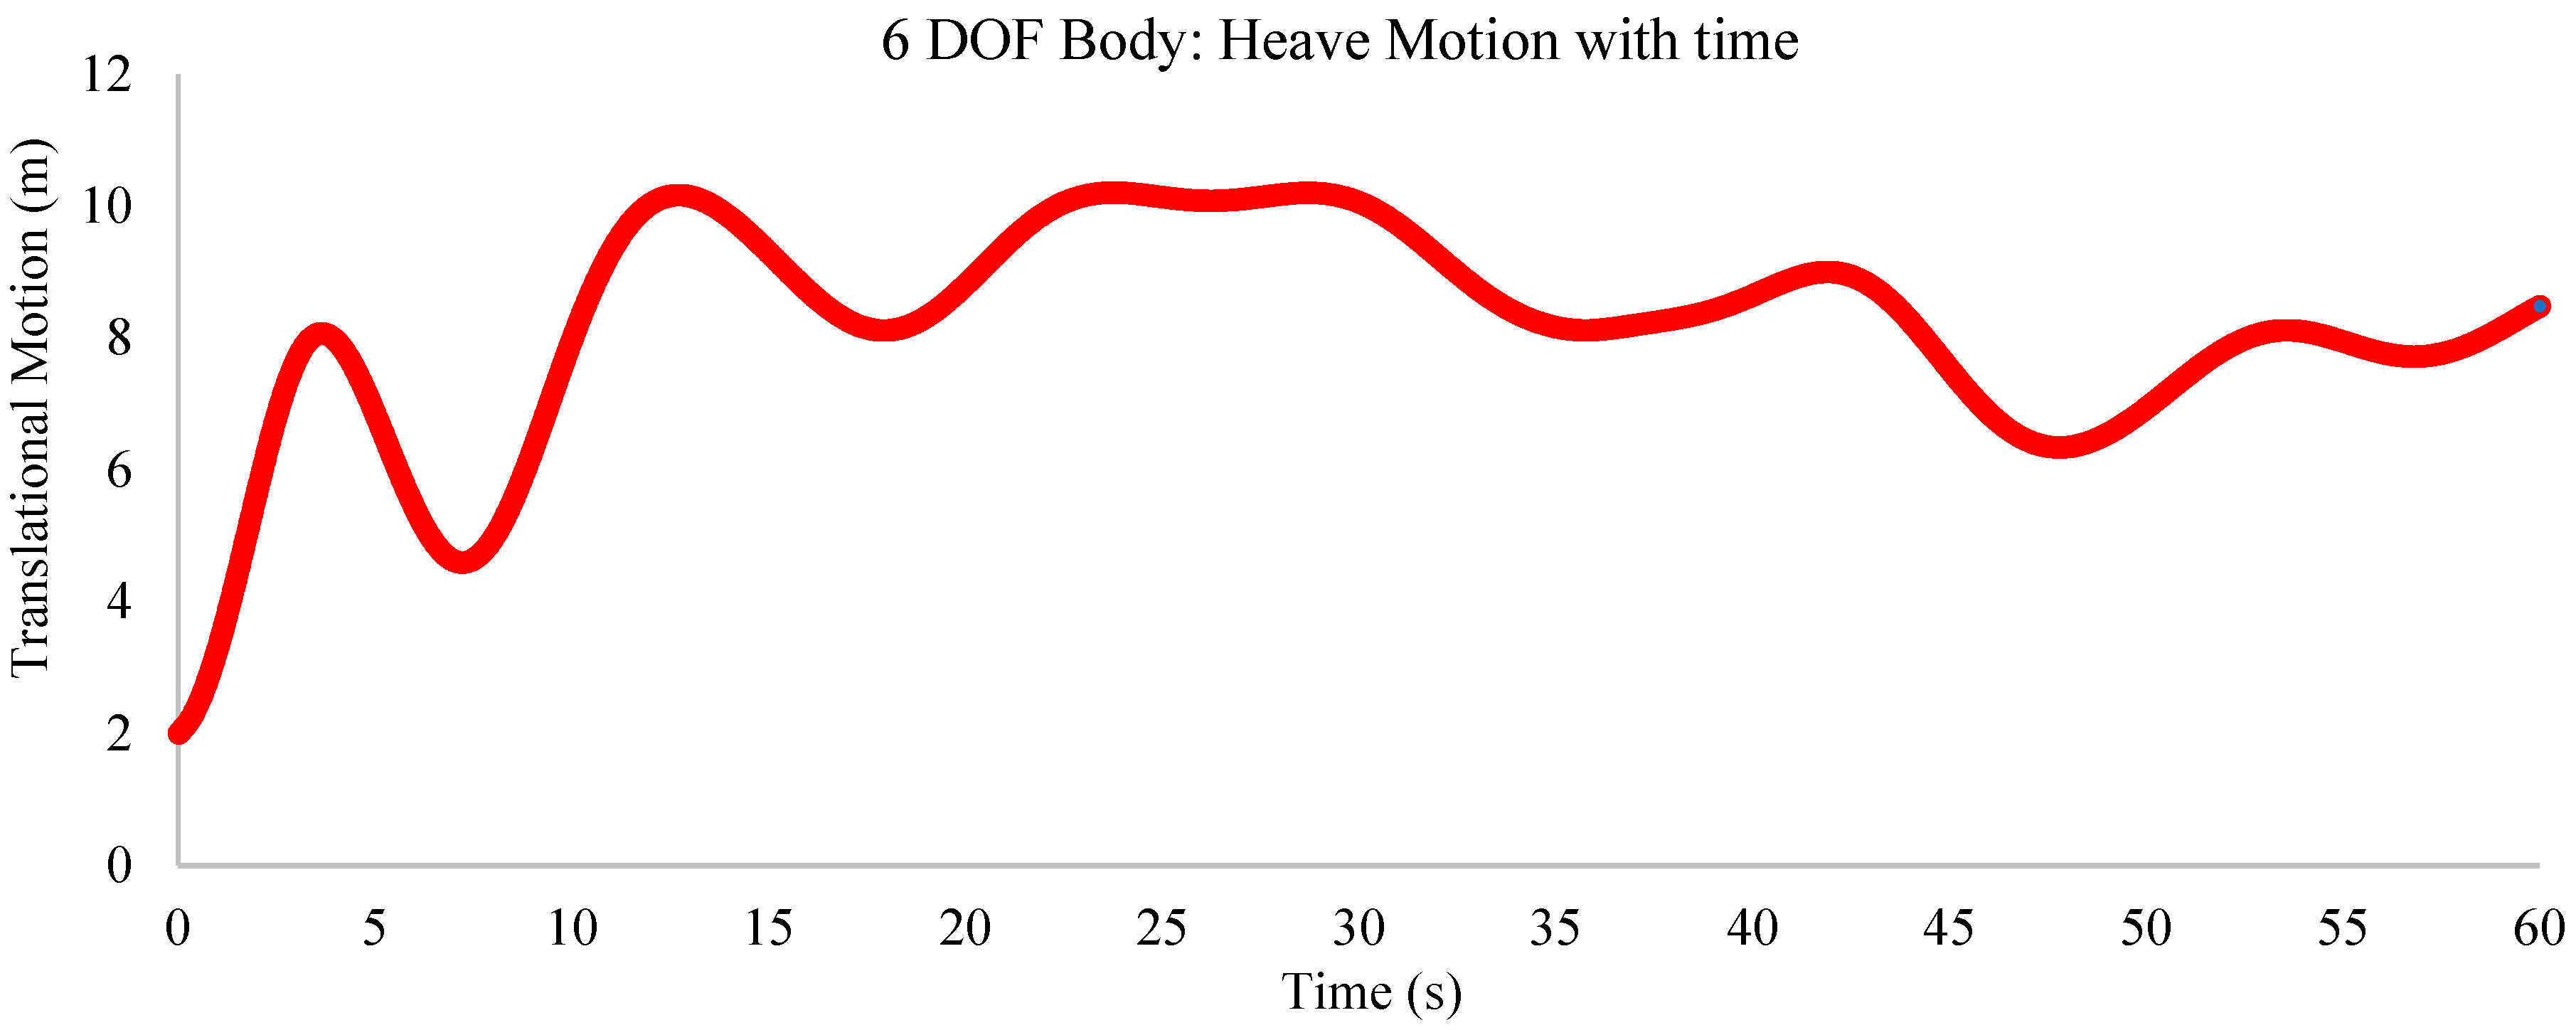
The heave motion history in Figure 15 is particularly important because heave directly affects internal water-column oscillation. The heave motion response (Figure 15) governs the internal OWC excitation and shows 03 distinct regimes. During the initial phase (0–10 s), displacement increases rapidly from ~2 m to ~10 m, reflecting wave build-up. In the oscillatory regime (10–40 s), motion fluctuates within 6.5–10.5 m, with a mean position of approximately 8.8 m. Beyond 40 s, the response converges to a stable band of 7–9 m, indicating a quasi-steady state. The reduction in oscillation amplitude confirms effective damping from hydrostatic restoring forces, viscous effects, and mooring-line feedback. From an engineering perspective, the force and motion coupling is well-balanced. The heave-to-surge force ratio (~1.5–2.0) confirms vertical dominance, which is favorable for OWC operation. The stabilization time (~40 s, equivalent to ~4–5 wave cycles) defines the minimum duration required for representative performance evaluation. Importantly, the sustained heave amplitude (~2–3 m oscillation envelope post-stabilization) is sufficient to drive strong internal water-column oscillations without compromising structural stability.

3.2. Orifice Plate Calibration and Turbine-Equivalent Pressure-Drop Behavior

3.2.1. Pressure-Drop Response of the Orifice Family

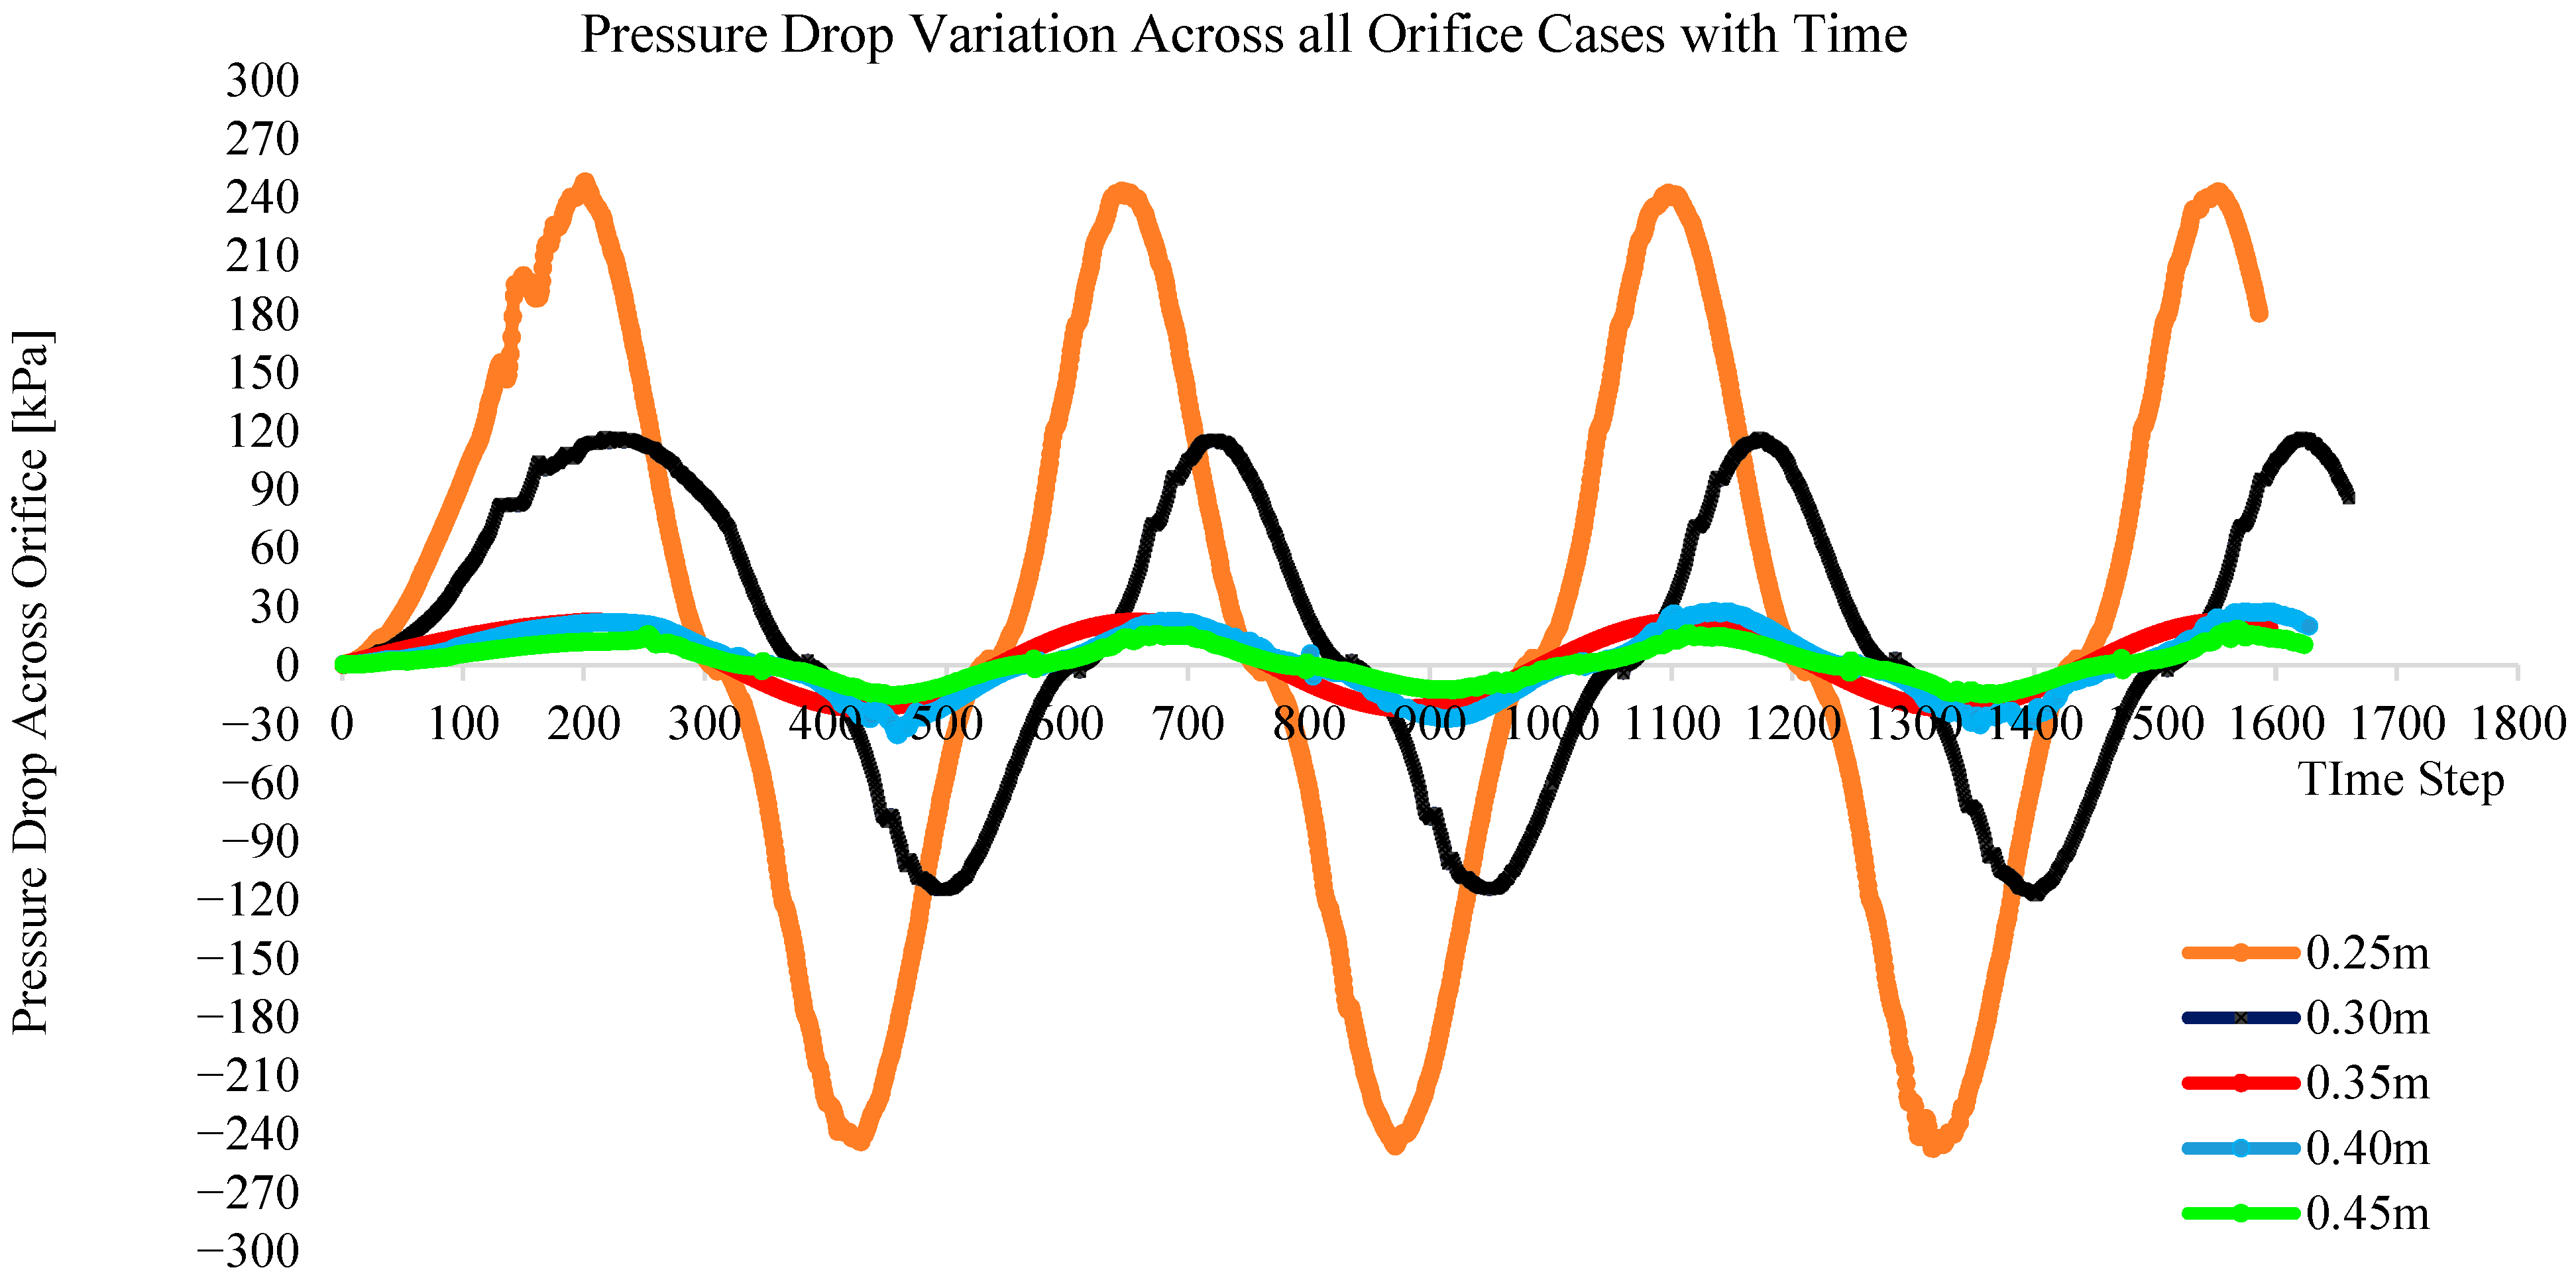
The transient pressure-drop response for all orifice configurations is presented in Figure 16. The results exhibit a clear and monotonic relationship between the orifice diameter ratio (β = d/D) and the hydraulic resistance, confirming that the pressure-drop amplitude is inversely proportional to the effective flow area.
The smallest configuration (β = 0.25) produces the highest pressure-drop magnitude, reaching peak values of approximately ±240–250 kPa. This corresponds to a highly restricted flow regime, where significant energy is dissipated through contraction losses. Such a high-pressure gradient indicates over-damping, which would suppress the oscillatory mass flow required for efficient OWC operation. In contrast, larger orifice diameters (β = 0.35–0.45) exhibit substantially reduced pressure-drop amplitudes, confined within approximately ±15–35 kPa. This reduction of nearly 80–90% relative to the 0.25D case indicates insufficient hydraulic resistance. These configurations operate in an under-damped regime, where the pressure differential is too weak to effectively mimic turbine-induced energy extraction. The intermediate case (β = 0.30) produces peak pressure-drop values of approximately ±110–120 kPa, which aligns closely with the expected turbine operating range. Importantly, this configuration maintains a smooth, nearly sinusoidal response with minimal distortion, indicating stable bidirectional flow behavior and consistent energy dissipation across cycles. A quantitative comparison shows that:
  • The pressure-drop amplitude decreases by approximately 50–55% when increasing from 0.25D to 0.30D;
  • A further increase to 0.35D results in an additional ~70% reduction, indicating a sharp transition from over-damped to under-damped regimes’
  • Beyond β ≥ 0.35, the pressure response becomes weakly sensitive to diameter changes, confirming diminishing resistance effects.
The temporal response across all cases remains periodic and phase-consistent with the imposed wave forcing, indicating that the system operates under quasi-steady oscillatory conditions. However, only the 0.30D configuration satisfies the dual requirement of:
  • Matching the target turbine pressure-drop range (~120–130 kPa);
  • Preserving stable, repeatable oscillatory flow behavior.
Therefore, the 0.30D orifice represents the optimal calibration point, achieving a balanced damping regime that accurately reproduces turbine-equivalent pressure-drop dynamics without introducing excessive flow restriction or energy loss.

3.2.2. Comparison of the 0.30D Orifice with the Turbine Response

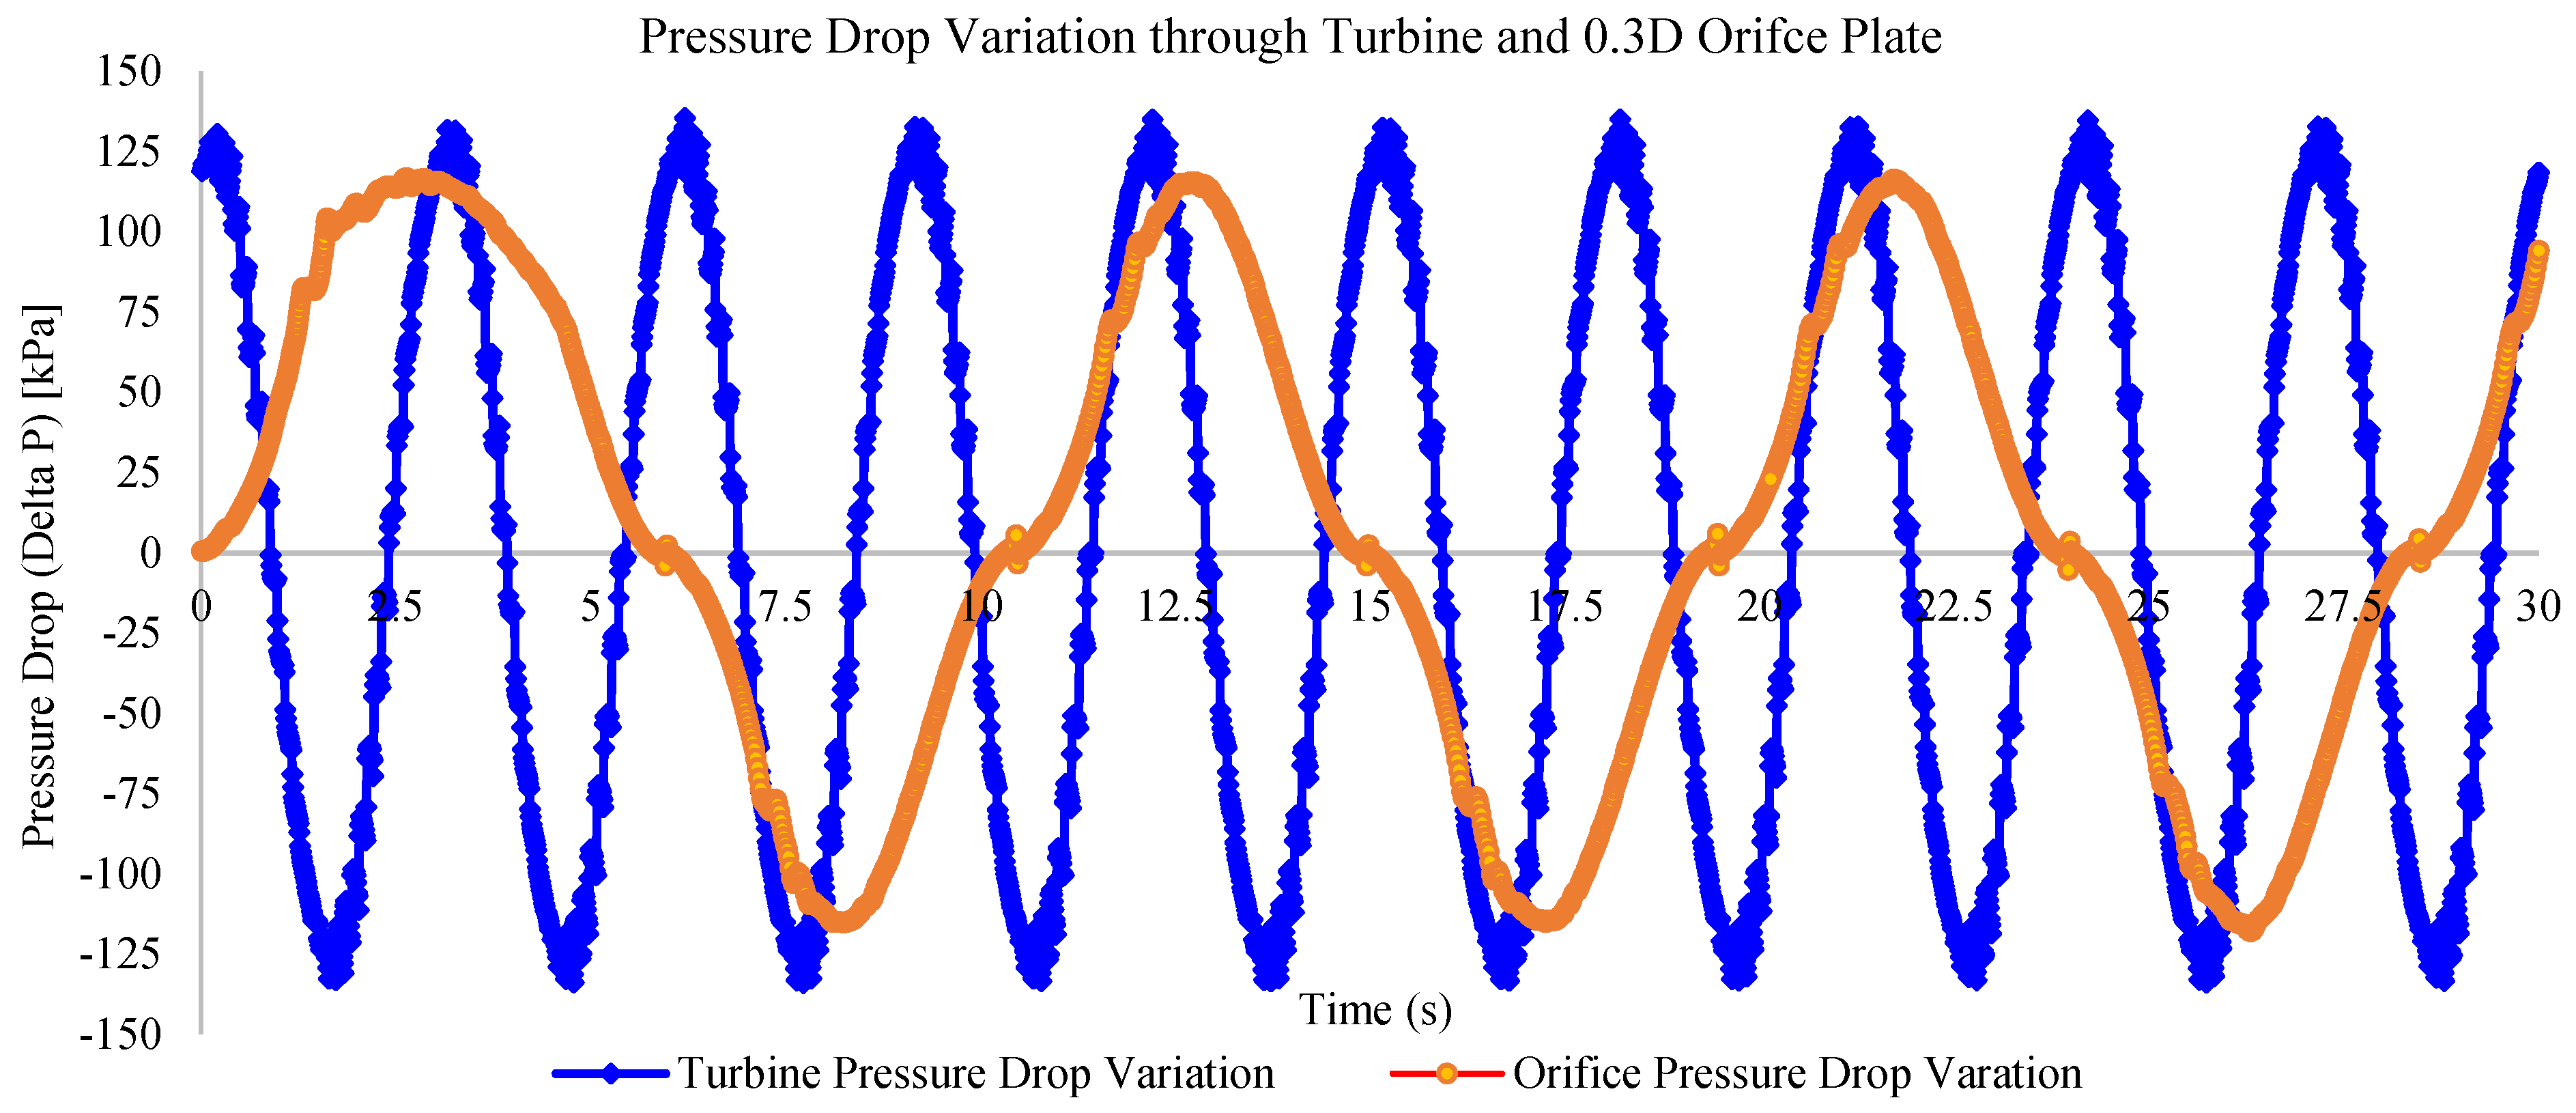
The direct comparison between the turbine pressure-drop response and the calibrated 0.30D orifice is presented in Figure 17. The two signals exhibit comparable amplitude envelopes but distinct waveform characteristics, reflecting fundamentally different flow resistance mechanisms.
The turbine response shows a sharper, non-sinusoidal profile, with peak values reaching approximately ±125–135 kPa. The waveform contains localized steep gradients and minor discontinuities, which are indicative of blade–flow interaction, transient flow separation, and periodic torque-induced resistance fluctuations. These effects introduce higher harmonic content and cycle-to-cycle variability. In contrast, the 0.30D orifice produces a smooth, near-sinusoidal pressure-drop response, with peak amplitudes of approximately ±110–120 kPa. The amplitude deviation between the two systems remains within ~10–12%, which is well within acceptable limits for PTO-equivalent modeling in time-domain simulations. The smoother profile reflects a quasi-steady quadratic resistance behavior, governed by continuous contraction and expansion losses rather than discrete mechanical interactions. A key distinction lies in the temporal frequency content. The turbine signal exhibits higher-frequency oscillations superimposed on the primary wave-induced cycle, whereas the orifice response closely follows the dominant wave frequency with minimal harmonic distortion. This indicates that the orifice effectively captures the bulk energy dissipation mechanism, while filtering out high-frequency fluctuations that are not critical for global hydrodynamic performance. From a phase perspective, both responses remain largely aligned, with negligible phase lag relative to the imposed oscillatory forcing. This confirms that the orifice does not introduce artificial delay or dynamic mismatch in the pressure–flow relationship. Quantitatively: Peak pressure difference between turbine and orifice: ~10–15 kPa; relative amplitude deviation: <12%; frequency agreement: identical dominant wave frequency and signal smoothness; orifice exhibits reduced high-frequency content. From a modeling standpoint, exact waveform replication is not required. The objective is to match the integral energy dissipation and resistance magnitude, which governs the hydrodynamic–PTO coupling. The 0.30D orifice satisfies this requirement by reproducing:
  • The correct pressure-drop scale (~120 kPa);
  • The correct oscillation frequency;
  • A stable and repeatable response over multiple cycles.
Additionally, the absence of sharp discontinuities improves numerical stability and convergence behavior in coupled simulations, particularly under VOF and moving-mesh conditions [93,94,95]. Therefore, the 0.30D orifice provides an optimal balance between physical representativeness and computational robustness, and can be reliably adopted as a turbine-equivalent PTO model for subsequent hydrodynamic and performance analyses.

3.2.3. Pressure-Flow Coupling in the Selected 0.30D Orifice

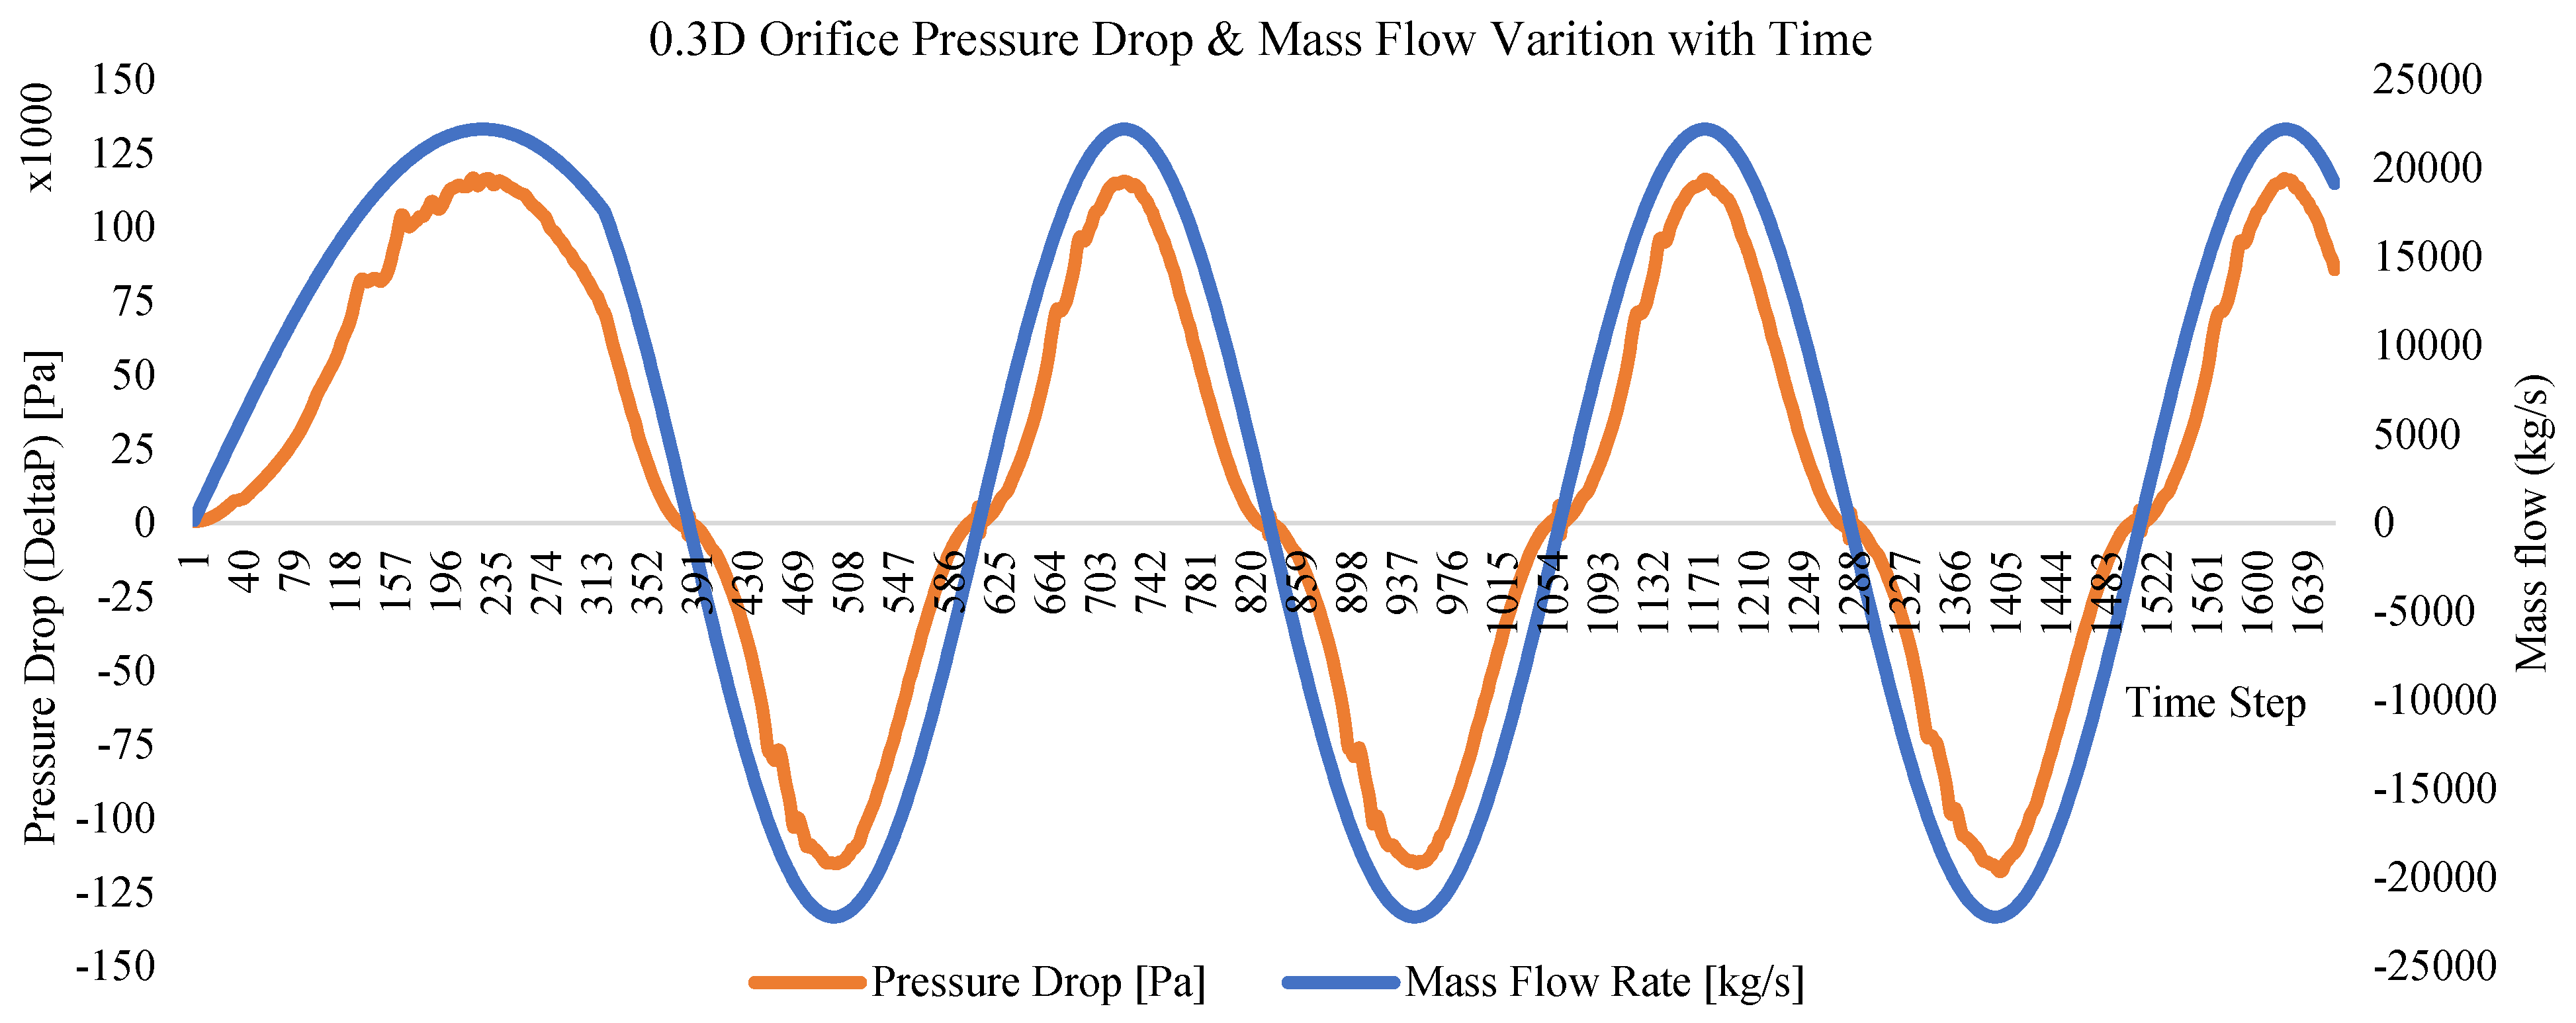
The coupled pressure-drop (ΔP) and mass flow rate (ṁ) histories for the selected 0.30D orifice are presented in Figure 18. Both signals exhibit stable, periodic oscillations over multiple cycles, confirming consistent hydrodynamic forcing and repeatable PTO-equivalent behavior.
The mass flow rate varies approximately within the range of ± (1.8–2.2) × 104 kg/s, while the corresponding pressure-drop amplitude remains within ±110–120 kPa. These magnitudes are consistent with the previously established turbine-equivalent resistance range and confirm that the orifice operates within the intended hydrodynamic regime. A clear phase coupling between ΔP and ṁ is observed. The pressure-drop extrema occur slightly after the corresponding mass-flow peaks, indicating a phase lag characteristic of inertia-dominated oscillatory flow. This behavior is consistent with unsteady internal flow dynamics, where fluid acceleration and deceleration contribute to transient pressure buildup. The phase shift is moderate and remains consistent across cycles, demonstrating stable fluid–structure interaction without phase drift. Quantitatively: Peak mass flow rate ~2.0 × 10⁴ kg/s (±10%), peak pressure drop ~115 kPa (±5%), phase lag is small but finite (~10–20° equivalent shift) and cycle repeatability is high (no amplitude decay or drift).

3.2.4. Cyclic Pressure-Drop–Flow-Rate Behavior and Hydraulic Equivalence

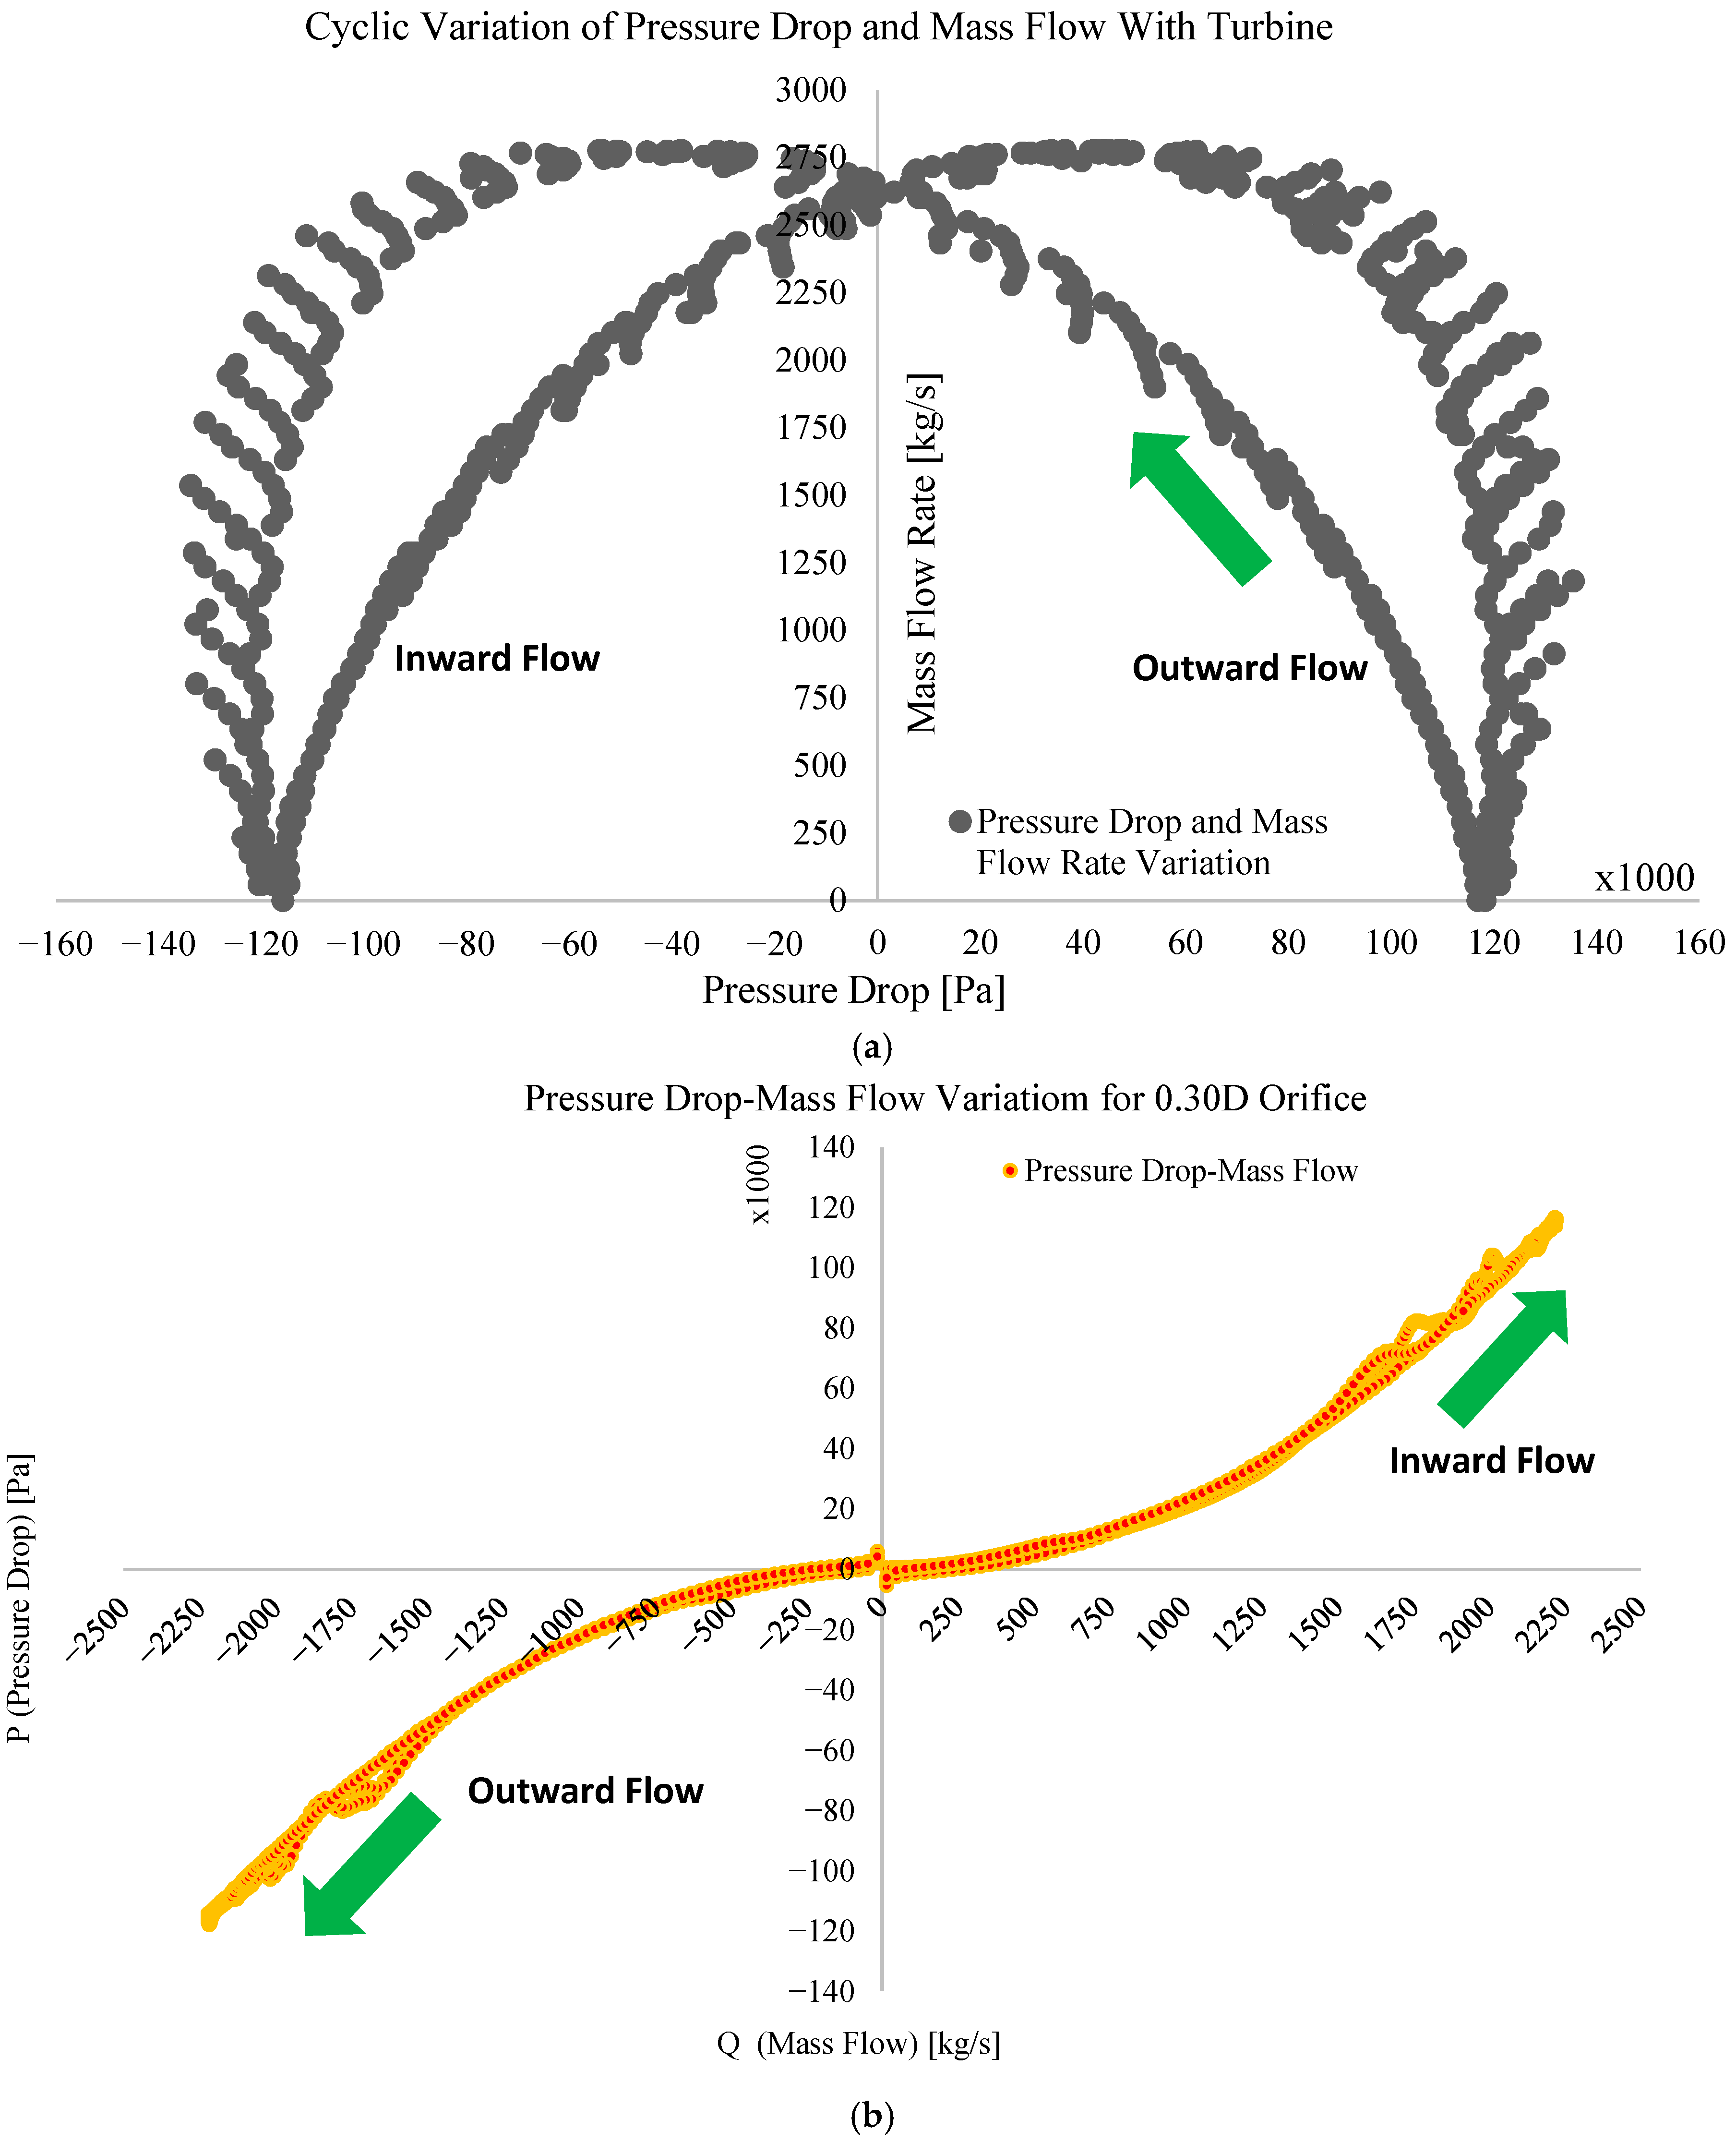
The cyclic ΔP–ṁ relationships for the turbine and the calibrated 0.30D orifice are presented in Figure 19a,b, respectively. These phase-space representations provide a more complete characterization of the hydraulic response than time histories alone, as they directly capture the instantaneous coupling between pressure resistance and flow rate over a full oscillation cycle [96].
The turbine response in Figure 19a forms a wide hysteresis loop, with pressure-drop values spanning approximately ±125–135 kPa and mass flow rates reaching ±(2.0–2.2) × 104 kg/s. The loop exhibits noticeable scatter and asymmetry, particularly near the extrema, which reflects unsteady blade–flow interactions, localized separation, and transient inertial effects within the rotating machinery [97]. The enclosed loop area is relatively large, indicating higher cycle-integrated energy dissipation and the presence of nonlinear resistance components. In comparison, the 0.30D orifice response in Figure 19b produces a smoother and more compact hysteresis loop, with pressure-drop magnitudes of approximately ±110–120 kPa and comparable peak mass flow rates. The loop shape is more symmetric and exhibits minimal scatter, indicating a stable and repeatable quadratic resistance behavior dominated by contraction–expansion losses. The reduced loop irregularity confirms the absence of high-frequency fluctuations associated with mechanical components. A key quantitative outcome is the strong agreement in the operating envelope of both systems:
  • Pressure-drop deviation: <5–10%;
  • Mass flow rate deviation: <7–10%;
  • Dominant cycle frequency: identical;
  • Loop topology: consistent hysteresis behavior (energy dissipation present in both cases).
The presence of hysteresis in both loops confirms that the system is not purely quasi-steady, but influenced by fluid inertia and phase-lag effects, which are critical for realistic PTO modeling. Importantly, the area enclosed by the ΔP–ṁ loop represents the energy dissipated per cycle, which directly relates to the effective power extraction capability. The comparable loop areas indicate that the 0.30D orifice reproduces the integral energy dissipation characteristics of the turbine with high fidelity. While the turbine exhibits additional complexity due to blade-induced unsteadiness, these effects primarily influence local flow physics rather than system-level energy transfer. For the purpose of coupled hydrodynamic simulations, capturing the correct global resistance magnitude, phase relationship, and energy dissipation rate is sufficient. Therefore, the 0.30D orifice demonstrates strong hydraulic equivalence to the turbine at the system level. It accurately reproduces: pressure-drop–flow-rate envelope, nonlinear hysteresis behavior and cycle-averaged energy dissipation. At the same time, it offers superior numerical stability, smoothness, and computational efficiency, making it a robust and practical PTO surrogate for BBDB-FOWC simulations.

3.3. Coupled PTO Performance Under Damped and Undamped Conditions

3.3.1. Time-Domain Pressure and Mass-Flow Behavior

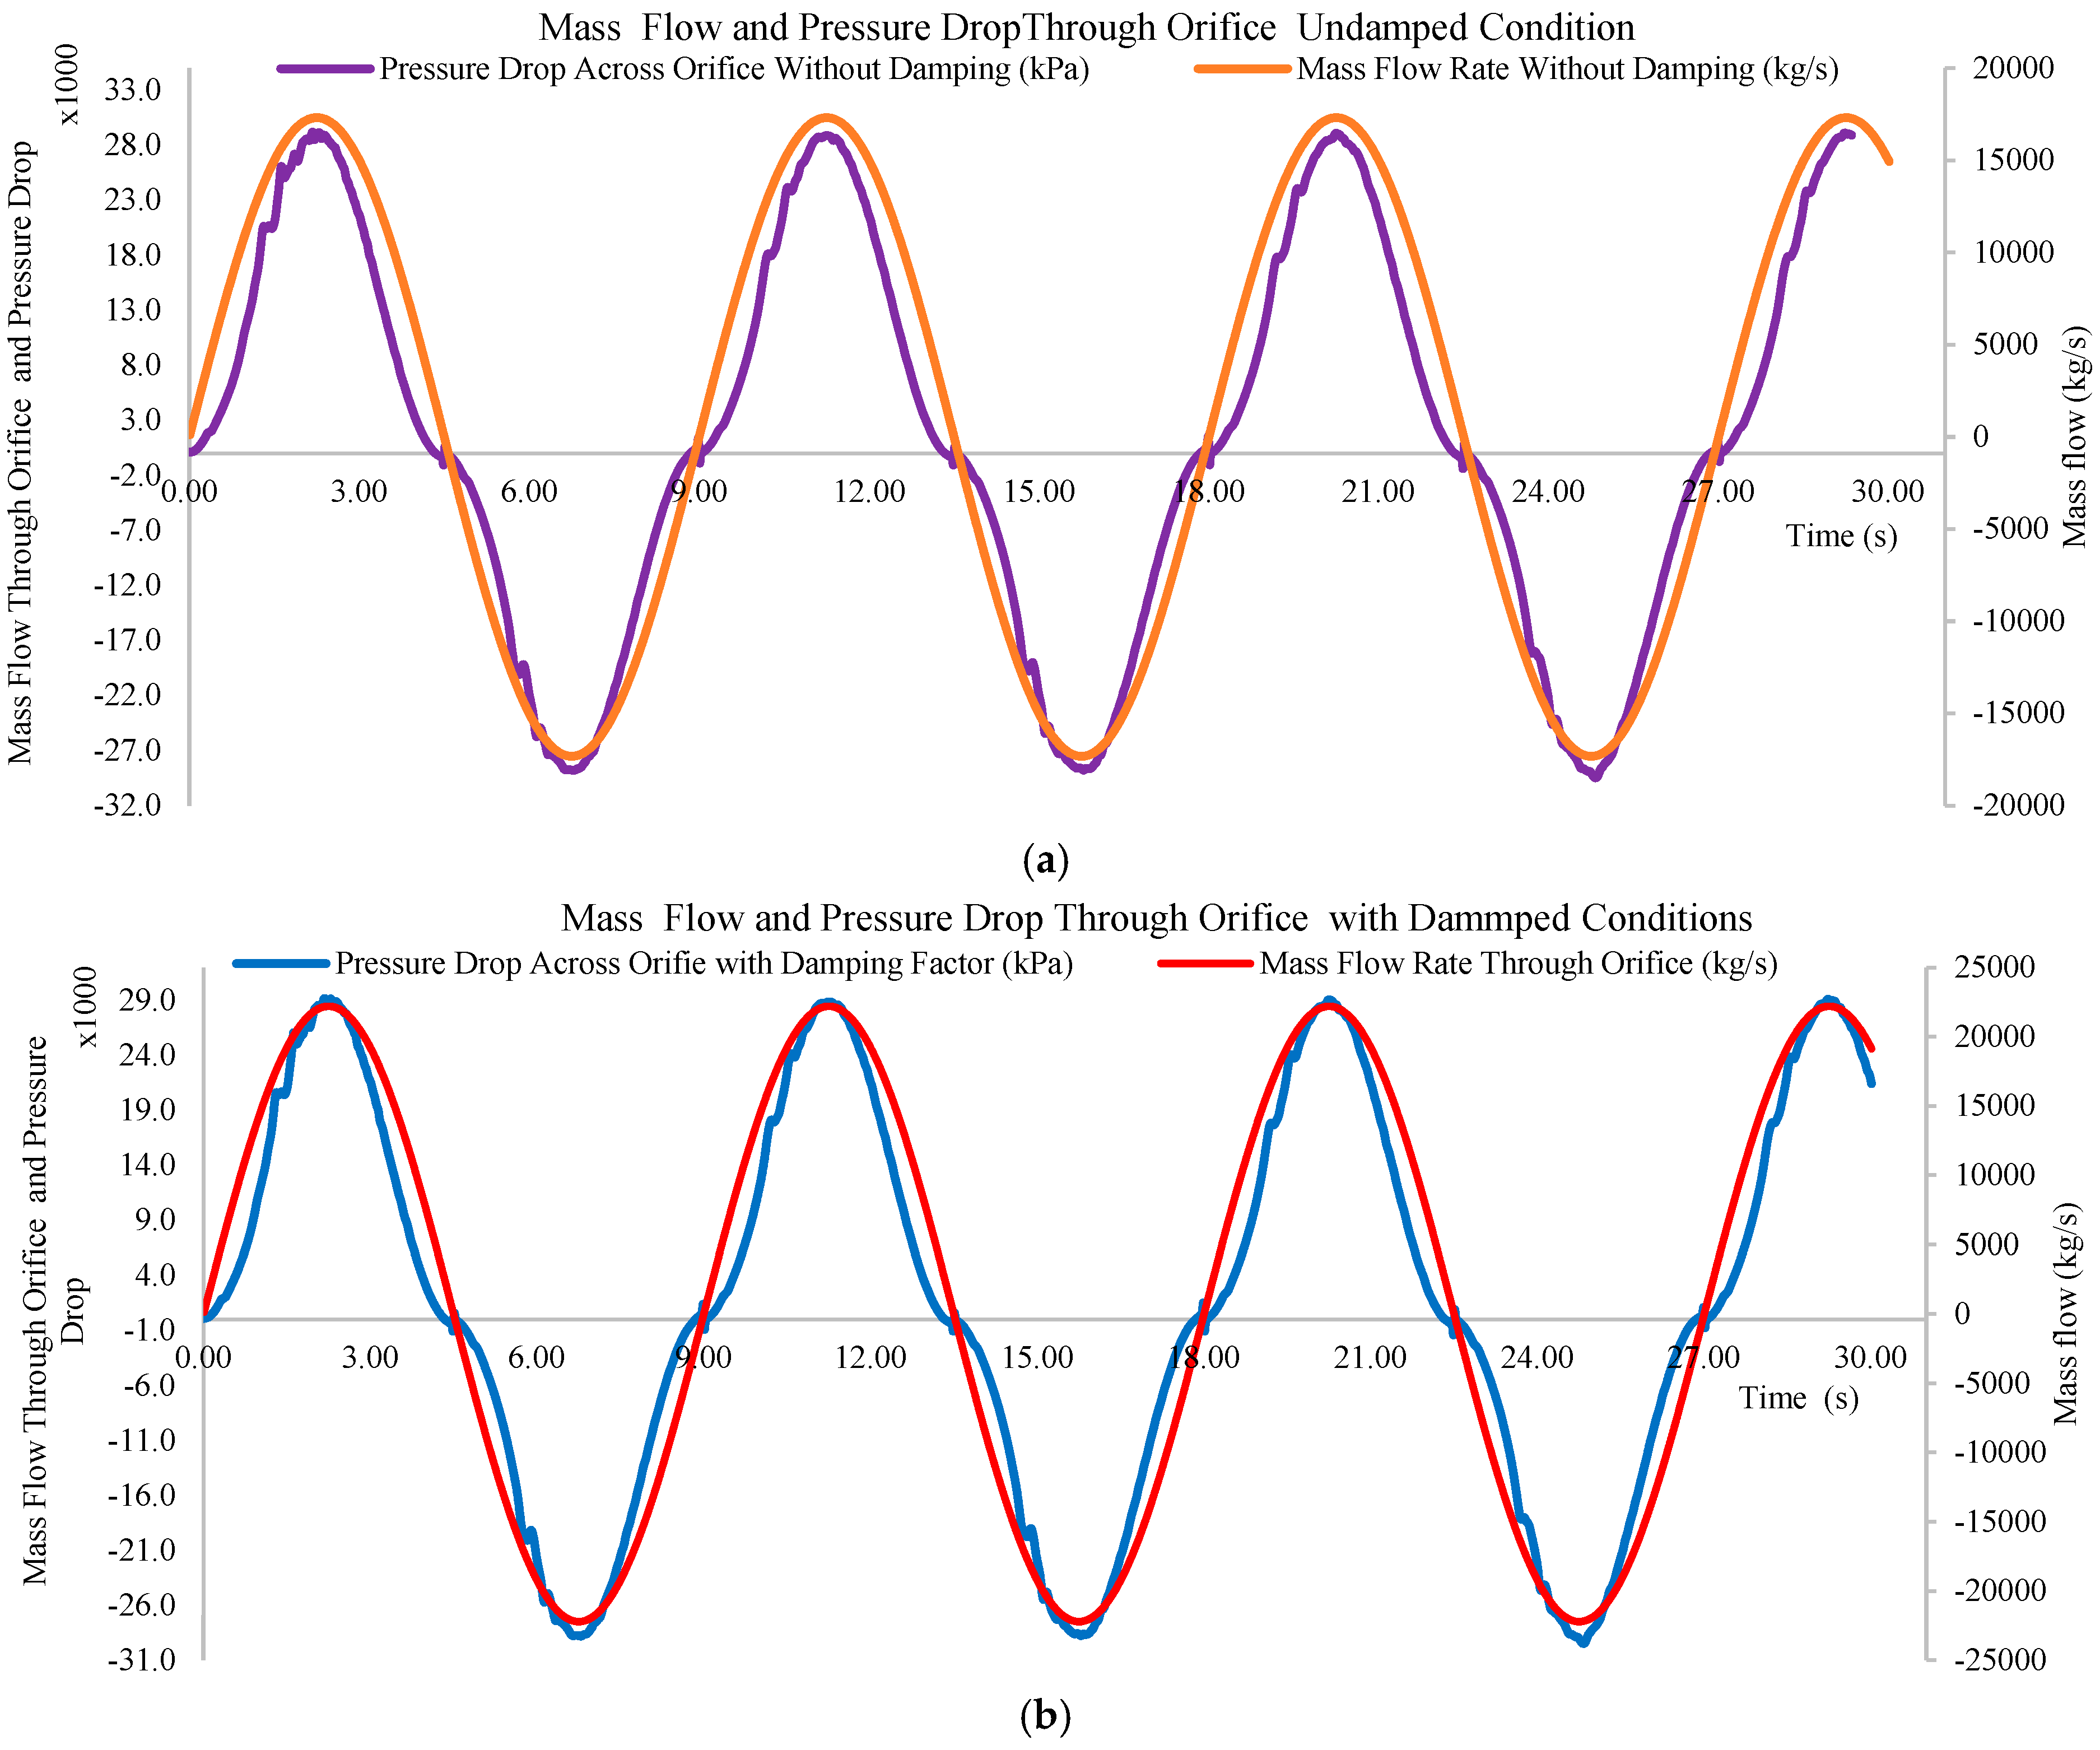
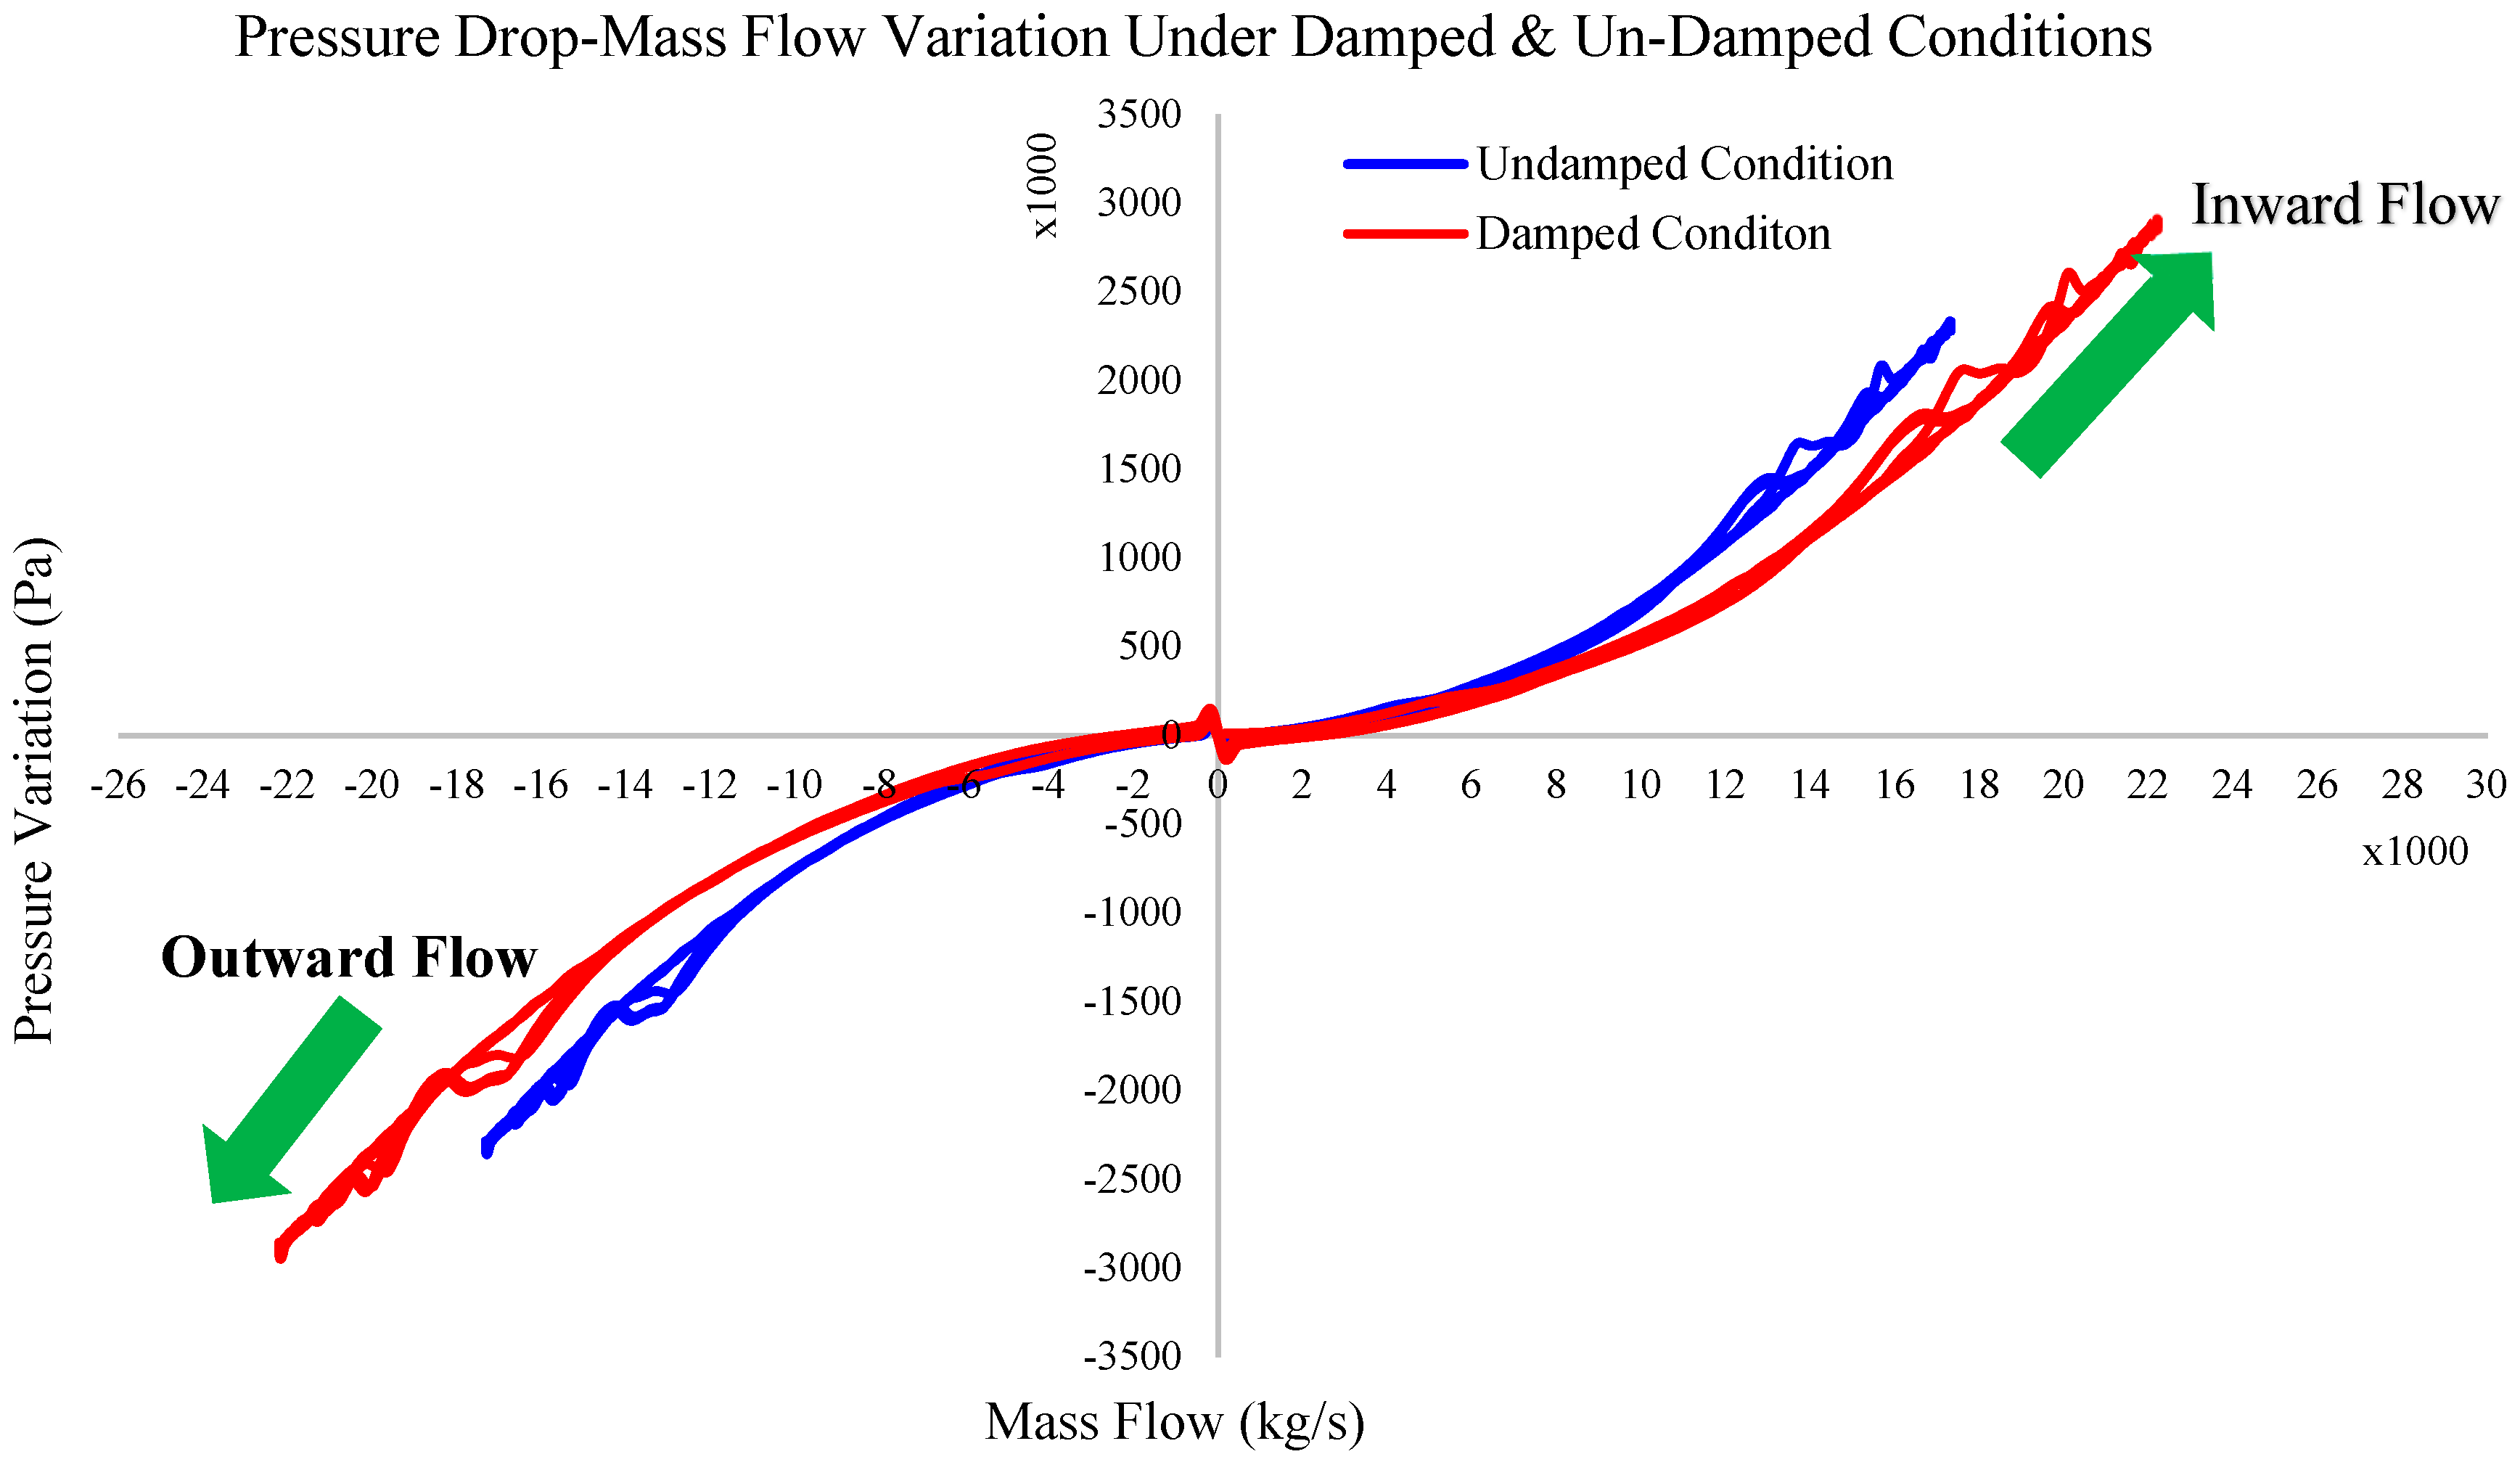
The coupled pressure-drop (ΔP) and mass flow rate (ṁ) responses under undamped and damped conditions are presented in Figure 20a,b. In both cases, the signals exhibit periodic oscillations aligned with the incident wave forcing, confirming stable reciprocating flow through the PTO region. However, the amplitude, smoothness, and phase coherence differ markedly between the 02 conditions.
In the undamped case (Figure 20a), the pressure-drop signal reaches peak values of approximately ±28–30 kPa, while the mass flow rate amplitude is on the order of ±(1.5–1.7) × 104 kg/s. The waveform exhibits noticeable distortion near zero-crossings, with localized irregularities indicating transient flow separation and weak coupling between chamber pressure and oscillatory flow reversal. This results in reduced effective hydraulic loading during portions of the cycle, particularly around flow-direction switching, where ΔP lags and fluctuates relative to ṁ.
In contrast, the damped case (Figure 20b) demonstrates a clear enhancement in both amplitude and waveform regularity. The pressure-drop magnitude remains within a similar peak band (±28–30 kPa), but the mass flow rate increases to approximately ±(2.0–2.3) × 104 kg/s, representing an increase of ~25–30% relative to the undamped condition. More importantly, the ΔP–ṁ signals exhibit improved phase alignment, with smoother sinusoidal profiles and reduced distortion at zero-crossings. This indicates a more coherent coupling between chamber compression and fluid inertia. From a system perspective, this behavior reflects improved hydrodynamic impedance matching between the floating structure and the PTO region. The inclusion of damping suppresses non-productive rigid-body oscillations (primarily excessive heave and pitch components), thereby redirecting a larger fraction of the incident wave energy into controlled internal water-column motion. As a result, the pressure build-up becomes more effective and consistently synchronized with flow acceleration. This improvement is critical because PTO performance scales with the instantaneous product ΔP·Q. The damped configuration increases both the magnitude and phase coherence of this interaction, directly enhancing the energy extraction potential. The results therefore demonstrate that damping does not simply attenuate motion, but actively optimizes the energy-transfer pathway by stabilizing and strengthening the pressure–flow coupling within the oscillating water column system.

3.3.2. Quantitative Performance Comparison

The cycle-averaged performance metrics are summarized in Table 12. The results show a consistent and significant improvement when the viscous damping factor is included in the simulation.
The cycle-average pressure increases from 1475.74 kPa in the undamped case to 1827.06 kPa in the damped case, corresponding to a 19.23% increase. Similarly, the cycle-average flow rate increases from 12.47 m3/s to 15.99 m3/s, representing a 22.01% improvement. Since the hydraulic power transferred through the PTO depends on the product of pressure drop and flow rate, these simultaneous increases result in a much larger rise in power potential. The estimated power potential increases from 18.40 MW to 29.21 MW, which corresponds to a 37.01% increase. Because the incident wave power is unchanged at 138.81 MW for both cases, the improvement is entirely due to more effective internal hydraulic conversion rather than a change in wave resource. Consequently, the calculated orifice efficiency increases from 13.26% in the undamped case to 21.05% in the damped case, again a 37.01% improvement. These numbers show that the damping coefficient has a first-order influence on predicted PTO performance. In practical terms, neglecting damping would lead to a significant underestimation of the device’s hydraulic power-extraction capability.

3.3.3. Cyclic Pressure–Flow Behavior with and Without Damping

The cyclic pressure-drop–mass-flow (ΔP–ṁ) characteristics for the damped and undamped configurations are presented in Figure 21. Both cases exhibit the expected bidirectional hysteresis behavior associated with oscillatory flow through the PTO, with distinct branches corresponding to inward and outward flow. However, the overall loop topology, extent, and coherence differ significantly between the two conditions. The damped case forms a larger and more continuous hysteresis loop, spanning mass flow rates of approximately ±(2.5–3.0) × 104 kg/s and pressure-drop magnitudes of ±(2.5–3.0) × 103 Pa. In contrast, the undamped case shows a narrower and more irregular loop, with mass flow rates limited to approximately ±(2.0–2.3) × 104 kg/s and pressure-drop levels of ±(2.0–2.3) × 103 Pa. This corresponds to an increase of approximately 20–30% in peak pressure development and 15–25% in flow throughput under damped conditions.
More importantly, the area enclosed by the ΔP–ṁ loop, which represents the cycle-integrated energy dissipation (∮ΔP·Q dt), is significantly larger for the damped configuration, indicating a direct increase in effective energy extraction potential. The undamped system exhibits noticeable scatter and local distortions, particularly near flow reversal, reflecting uncontrolled rigid-body motion where a portion of the incident wave energy is dissipated into non-productive structural oscillations rather than contributing to internal chamber pressurization. In contrast, the damped system produces smoother and more symmetric loop trajectories with reduced cycle-to-cycle variability, indicating improved phase synchronization between pressure and flow. This results in more efficient hydrodynamic coupling and more consistent PTO loading. From a physical perspective, the introduction of damping suppresses excessive body motion, particularly in heave and pitch, and redirects energy toward useful pressure buildup across the PTO. The improved coherence of the pressure–flow relationship suggests that damping acts as an effective hydrodynamic impedance matching mechanism, aligning the natural response of the floating structure with the incident wave forcing. Quantitatively, the damped case achieves approximately 25% higher pressure levels, 20% higher flow throughput, and a significantly increased hysteresis loop area compared to the undamped case. These results demonstrate that damping is not merely a stability-control parameter but a primary energy-conversion parameter in BBDB-FOWC systems. The enhanced pressure–flow coupling and increased cycle energy dissipation confirm that controlled damping leads to a more efficient and physically optimized operating regime for wave energy extraction.

3.4. Dimensionless Interpretation of the Hydrodynamics and PTO Response

The hydrodynamic response of the BBDB-FOWC system and the calibrated PTO behavior can be further interpreted using key dimensionless parameters, summarized in Table 13. These parameters provide a generalized understanding of the flow regime, force balance, and energy dissipation mechanisms beyond case-specific dimensional results [98].
The Reynolds number is sufficiently high (Re ≫ 106), confirming that the flow is fully turbulent across both the external wave field and the internal oscillatory chamber flow. This validates the dominance of inertial forces over viscous effects and supports the observed quadratic pressure–flow relationship in the orifice-based PTO surrogate. The Keulegan–Carpenter (KC) number lies within the intermediate range (KC ~ O (1–10)), indicating that both drag and inertia forces contribute significantly to the hydrodynamic loading. This explains the presence of hysteresis in the ΔP–ṁ loops and the phase lag between pressure and flow observed in the transient results. The Froude number remains within the typical range for wave–structure interaction (Fr ~ O(0.1–1)), confirming that gravitational and inertial forces are of comparable magnitude, which governs the free-surface dynamics and heave-dominated response of the floating body. Additionally, the Strouhal-type behavior inherent in the oscillatory flow suggests that the system operates under periodic forcing conditions where frequency-dependent effects, including phase synchronization and resonance characteristics, become important. From a PTO perspective, the dimensionless pressure-drop coefficient and flow coefficient remain consistent across cycles, reinforcing that the 0.30D orifice behaves as a stable nonlinear hydraulic resistance. The similarity in these coefficients between the turbine and orifice confirms that the surrogate captures the correct system-level energy dissipation behavior, independent of geometric scaling. Overall, the dimensionless analysis confirms that the BBDB-FOWC system operates in an inertia-dominated, turbulent, and dynamically coupled regime, where both hydrodynamic forcing and PTO resistance are governed by nonlinear oscillatory flow physics. These results provide a scalable framework for extending the present findings to different wave conditions and device sizes while preserving the underlying physical behavior.

4. Conclusions

This study developed and assessed a modified BBDB-based floating oscillating water column system incorporating a catamaran hull configuration and a hydraulically driven PTO pathway represented through an orifice-based turbine surrogate. The principal novelty of the work lies in the integration of hydrostatic stability assessment, CFD-based free-decay damping identification, 6-DOF wave–structure interaction, mooring effects, and turbine-equivalent PTO resistance within a single coupled numerical framework. The proposed methodology provides a computationally efficient alternative to blade-resolved turbine simulations while preserving the dominant pressure–flow characteristics required for early-stage system-level evaluation of floating wave energy converters.
The hydrostatic analysis confirmed that the modified BBDB-FOWC possesses favorable buoyancy-driven stability characteristics, with metacentric heights of approximately GM ≈ 4.3 m and stable operation under the investigated offshore condition (Hs = 3.0 m, T = 9.0 s). The coupled CFD simulations further demonstrated realistic heave-dominated floating response with controlled surge and limited sway motion, indicating satisfactory hydrodynamic stability and effective mooring-induced station keeping for the selected operating condition.
A major contribution of this work is the development and validation of the orifice-based PTO surrogate. Among the tested configurations, the 0.30D orifice reproduced the reference turbine pressure-drop behavior with less than ~12% deviation while maintaining significantly improved numerical robustness and reduced computational cost compared with turbine-resolved CFD simulations. The ΔP–ṁ hysteresis analysis further confirmed that the surrogate captures the dominant oscillatory energy-dissipation behavior and nonlinear hydraulic resistance of the PTO system.
The results also demonstrate that hydrodynamic damping plays a first-order role in the overall energy-conversion behavior of the floating system. Incorporation of the free-decay-derived damping coefficient (ζ = 0.096) improved the pressure–flow coherence inside the PTO region and increased the predicted extracted power and overall conversion efficiency by approximately 37% compared with the undamped condition. This indicates that damping should not be treated merely as a motion-reduction mechanism, but rather as a coupled hydrodynamic parameter governing impedance matching between the floating-body motion, internal water-column oscillation, and PTO resistance.
Overall, the present work establishes that the proposed BBDB-FOWC concept combined with a hydraulically driven PTO pathway has strong potential for offshore wave energy conversion when the coupled hydrodynamic–PTO interaction is properly tuned. More importantly, the study contributes a physically consistent and computationally tractable framework that bridges the gap between simplified damping-based PTO representations and computationally prohibitive turbine-resolved simulations. Although the present investigation remains a first-order system-level study (TRL~1–2), it provides a robust foundation for future developments involving irregular-wave analysis, turbine-resolved CFD validation, PTO control optimization, mooring sensitivity studies, and experimental verification of the proposed concept.

Author Contributions

Conceptualization, A.H.S.W., A.A. and M.A.; Methodology, A.H.S.W., A.A. and M.A.; Software, A.H.S.W. and A.A.; Validation, A.H.S.W., A.A. and M.A.; Formal analysis, A.H.S.W., A.A. and M.A.; Investigation, A.H.S.W. and A.A.; Resources, A.H.S.W. and A.A.; Data curation, A.H.S.W. and A.A.; Writing—original draft, A.H.S.W., A.A. and M.A.; Writing—review & editing, A.H.S.W., A.A. and M.A.; Visualization, A.H.S.W., A.A. and M.A.; Supervision, A.H.S.W. and M.A.; Project administration, A.H.S.W. and M.A.; Funding acquisition, M.A. All authors have read and agreed to the published version of the manuscript.

Funding

This study was funded by the Faculty of Science and Technology, Department of Energy and Petroleum Engineering, University of Stavanger, Norway.

Data Availability Statement

The original contributions presented in this study are included in the article. Further inquiries can be directed to the corresponding author.

Conflicts of Interest

The authors declare that they have no known competing financial interests or personal relationships that could have appeared to influence the work reported in this paper.

Abbreviations

BBDBBackward Bent Duct Buoy
BESSBattery Energy Storage System
CFDComputational Fluid Dynamics
CFTCross-Flow Turbine
CoBCenter of Buoyancy
CoGCenter of Gravity
CWRCapture Width Ratio
DFBIDynamic Fluid Body Interaction
DoEDepartment of Energy
FOWCFloating Oscillating Water Column
FOWTFloating Offshore Wind Turbine
GMMetacentric Height
GGIGeneral Grid Interface
HPCHigh-Performance Computing
ICEM CFDIntegrated Computer Engineering and Manufacturing Computational Fluid Dynamics
MPSMoving Particle Simulation
NRELNational Renewable Energy Laboratory
OWCOscillating Water Column
PeWECPendulum Wave Energy Converter
PTOPower Take-Off
RM3Reference Model 3
RM5Reference Model 5
RM6Reference Model 6
SPHSmoothed Particle Hydrodynamics
SSTShear Stress Transport
STAR-CCM+Simcenter STAR-CCM+ CFD software
TRLTechnology Readiness Level
VOFVolume of Fluid
WECWave Energy Converter

Nomenclature

αWomersley number-
βOrifice diameter ratio, β = d/D-
ΔDisplacement volumem3
ΔPPressure difference/pressure dropPa
ΔzVertical separation between CoB and CoGm
δLogarithmic decrement-
δnLogarithmic decrement over n cycles-
ηConversion efficiency%
μeffEffective dynamic viscosityPa·s
νLinear damping parameters−1
ρFluid densitykg/m3
ζDamping ratio-
ωAngular frequencyrad/s
ω0Undamped natural circular frequencyrad/s
ωzDamped natural circular frequencyrad/s
AOrifice flow aream2
AwEffective waterplane aream2
AwpWaterplane aream2
BDevice breadth/widthm
bViscous damping coefficientN·s/m
bcChamber widthm
cHydrostatic restoring coefficientN/m
C33Heave stiffness coefficientN/m
C44Roll stiffness coefficientN·m/rad
C55Pitch stiffness coefficientN·m/rad
CdDischarge coefficient-
dOrifice diameterm
DReference nozzle/duct diameterm
FrFroude number-
gGravitational accelerationm/s2
HWave heightm
HsSignificant wave heightm
IInertia tensorkg·m2
IxxSecond moment of waterplane area about roll axism4
IyySecond moment of waterplane area about pitch axism4
kNon-dimensional damping factor-
KCKeulegan–Carpenter number-
KHKeel height/structural height parameterm
LWavelength or device length, depending on contextm
LbFloating-body lengthm
l0Chamber spacingm
mStructural masskg
Mass flow ratekg/s
nNumber of oscillation cycles/number of samples-
PavgRMS-based average PTO powerW
PorificeOrifice/PTO powerW
PPTOEquivalent PTO powerW
PwaveIncident wave powerW or W/m
pPressurePa
QVolumetric flow ratem3/s
ReReynolds number-
StStrouhal number/Strouhal-type parameter-
TWave periods
TeEnergy period/representative wave periods
TzDamped oscillation periods
tTimes
UCharacteristic flow velocitym/s
uVelocity vectorm/s
VTranslational velocity vectorm/s
zHeave displacementm
zaInitial/reference heave amplitudem
zBVertical coordinate of center of buoyancym
zGVertical coordinate of center of gravitym
ziOscillation peak amplitude at cycle im
z(i+1)Oscillation peak amplitude at following cyclem

References

  1. Roka, R.; Figueiredo, A.; Vieira, A.; Gholami, R.; Weerakoon, A.H.S.; Assadi, M.; Cardoso, C. The potential of shallow geothermal energy in Norway and Portugal: Optimized borehole design for two different climate conditions. Energy 2026, 347, 140403. [Google Scholar] [CrossRef]
  2. Weerakoon, A.H.S.; Assadi, M. Hybrid heuristic-MILP framework for techno-economic scheduling of microgrids in day-ahead markets with micro gas turbines and renewables. Energy Convers. Manag. X 2026, 29, 101574. [Google Scholar] [CrossRef]
  3. Gao, Q.; Bechlenberg, A.; Jayawardhana, B.; Ertugrul, N.; Vakis, A.I.; Ding, B. Techno-economic assessment of offshore wind and hybrid wind–wave farms with energy storage systems. Renew. Sustain. Energy Rev. 2024, 192, 114263. [Google Scholar] [CrossRef]
  4. Coe, R.G.; Bacelli, G.; Forbush, D. A practical approach to wave energy modeling and control. Renew. Sustain. Energy Rev. 2021, 142, 110791. [Google Scholar] [CrossRef]
  5. Reguero, B.G.; Losada, I.J.; Mendez, F.J. A global wave power resource and its seasonal, interannual and long-term variability. Appl. Energy 2015, 148, 366–380. [Google Scholar] [CrossRef]
  6. Guo, B.; Ringwood, J.V. A review of wave energy technology from a research and commercial perspective. IET Renew. Power Gener. 2021, 15, 3065–3090. [Google Scholar] [CrossRef]
  7. Singh, U.; Abdussamie, N.; Hore, J. Hydrodynamic performance of a floating offshore OWC wave energy converter: An experimental study. Renew. Sustain. Energy Rev. 2020, 117, 109501. [Google Scholar] [CrossRef]
  8. Dallavalle, E.; Zanuttigh, B.; Contestabile, P.; Giuggioli, A.; Speranza, D. Improved methodology for the optimal mixing of renewable energy sources and application to a multi-use offshore platform. Renew. Energy 2023, 210, 575–590. [Google Scholar] [CrossRef]
  9. Mohseni, M.; Soares, C.G. CFD analysis of wave loading on a 10 MW TLP-type offshore floating wind turbine in regular waves. Ocean. Eng. 2024, 301, 117540. [Google Scholar] [CrossRef]
  10. Rezanejad, K.; Soares, C.G.; López, I.; Carballo, R. Experimental and numerical investigation of the hydrodynamic performance of an oscillating water column wave energy converter. Renew. Energy 2017, 106, 1–16. [Google Scholar] [CrossRef]
  11. Weerakoon, A.H.S.; Kim, B.-H.; Cho, Y.-J.; Prasad, D.D.; Ahmed, M.R.; Lee, Y.-H. Design optimization of a novel vertical augmentation channel housing a cross-flow turbine and performance evaluation as a wave energy converter. Renew. Energy 2021, 180, 1300–1314. [Google Scholar] [CrossRef]
  12. Tapoglou, E.; Georgakaki, A.; Letout, S.; Kuokkanen, A.; Mountraki, A.; Ince, E.; Shtjefni, D.; Joanny Ordonez, G.; Eulaerts, O.; Grabowska, M. Clean Energy Technology Observatory: Ocean Energy in the European Union—2022 Status Report on Technology Development, Trends, Value Chains and Markets; EUR 31219 EN; Publications Office of the European Union: Luxembourg, 2022; Available online: https://publications.jrc.ec.europa.eu/repository/handle/JRC130617 (accessed on 14 March 2026).
  13. Gao, Q.; Ertugrul, N.; Ding, B.; Negnevitsky, M. Offshore Wind, Wave and Integrated Energy Conversion Systems: A Review and Future. In Proceedings of the 2020 Australasian Universities Power Engineering Conference (AUPEC), Hobart, Australia, 29 November–2 December 2020; pp. 1–6. Available online: https://ieeexplore.ieee.org/document/9344500 (accessed on 16 March 2026).
  14. Barua, A.; Rasel, M.S. Advances and challenges in ocean wave energy harvesting. Sustain. Energy Technol. Assess. 2024, 61, 103599. [Google Scholar] [CrossRef]
  15. Kim, I.C.; Alkhabbaz, A.; Jeong, H.; Lee, Y.H. Optimization Methodology of Small Scale Horizontal Axis Shrouded Tidal Current Turbine. In Proceedings of the 2019 IEEE Asia-Pacific Conference on Computer Science and Data Engineering (CSDE), Melbourne, Australia, 9–11 December 2019; pp. 1–3. [Google Scholar] [CrossRef]
  16. Alkhabbaz, A.; Yang, H.-S.; Weerakoon, A.H.S.; Lee, Y.-H. A novel linearization approach of chord and twist angle distribution for 10 kW horizontal axis wind turbine. Renew. Energy 2021, 178, 1398–1420. [Google Scholar] [CrossRef]
  17. Weerakoon, A.H.S.; Young, H.-S.; Kim, W.-K.; Lee, Y.-H. Novel Tidal Energy Harnessing System Utilizing Quadruple Bi-directional Turbine Arrangement. In Proceedings of the 2020 IEEE Asia-Pacific Conference on Computer Science and Data Engineering (CSDE), Gold Coast, Australia, 16–18 December 2020; p. 1. [Google Scholar] [CrossRef]
  18. Bhattacharya, S.; Lombardi, D.; Amani, S.; Aleem, M.; Prakhya, G.; Adhikari, S.; Aliyu, A.; Alexander, N.; Wang, Y.; Cui, L.; et al. Physical Modelling of Offshore Wind Turbine Foundations for TRL (Technology Readiness Level) Studies. J. Mar. Sci. Eng. 2021, 9, 589. [Google Scholar] [CrossRef]
  19. de Andres, A.; MacGillivray, A.; Roberts, O.; Guanche, R.; Jeffrey, H. Beyond LCOE: A study of ocean energy technology development and deployment attractiveness. Sustain. Energy Technol. Assess. 2017, 19, 1–16. [Google Scholar] [CrossRef]
  20. Bond, S.; Diprose, G.; Thomas, A.C. Contesting deep sea oil: Politicisation–depoliticisation–repoliticisation. Environ. Plan. C Politics Space 2019, 37, 519–538. [Google Scholar] [CrossRef]
  21. Konispoliatis, D.N.; Katsaounis, G.M.; Manolas, D.I.; Soukissian, T.H.; Polyzos, S.; Mazarakos, T.P.; Voutsinas, S.G.; Mavrakos, S.A. REFOS: A Renewable Energy Multi-Purpose Floating Offshore System. Energies 2021, 14, 3126. [Google Scholar] [CrossRef]
  22. Solheim, A.V.; Brett, P.O.; Garcia Agis, J.J.; Erikstad, S.O.; Asbjørnslett, B.E. Technology Transfer in Novel Ship Design: A Deep Seabed Mining Study. In Proceedings of the SNAME 14th International Marine Design Conference, Vancouver, BC, Canada, 26–30 June 2022. [Google Scholar] [CrossRef]
  23. Musu, G.P.; Giuliano, S. Application of Offshore Structure Technologies to Renewable Energy Farms. In Proceedings of the OMC Med Energy Conference and Exhibition, Ravenna, Italy, 28–30 September 2021; Available online: https://onepetro.org/OMCONF/proceedings/OMC21/All-OMC21/OMC-2021-160/473254 (accessed on 16 March 2026).
  24. Sheng, W. Wave Energy Converters. In Encyclopedia of Ocean Engineering; Cui, W., Fu, S., Hu, Z., Eds.; Springer: Singapore, 2022. [Google Scholar] [CrossRef]
  25. Giorgi, G.; Gomes, R.P.F.; Henriques, J.C.C.; Gato, L.M.C.; Bracco, G.; Mattiazzo, G. Detecting parametric resonance in a floating oscillating water column device for wave energy conversion: Numerical simulations and validation with physical model tests. Appl. Energy 2020, 276, 115421. [Google Scholar] [CrossRef]
  26. Portillo, J.C.C.; Collins, K.M.; Gomes, R.P.F.; Henriques, J.C.C.; Gato, L.M.C.; Howey, B.D.; Hann, M.R.; Greaves, D.M.; Falcão, A.F.O. Wave energy converter physical model design and testing: The case of floating oscillating-water-columns. Appl. Energy 2020, 278, 115638. [Google Scholar] [CrossRef]
  27. Kisacik, D.; Stratigaki, V.; Wu, M.; Cappietti, L.; Simonetti, I.; Troch, P.; Crespo, A.; Altomare, C.; Domínguez, J.; Hall, M.; et al. Efficiency and Survivability of a Floating Oscillating Water Column Wave Energy Converter Moored to the Seabed: An Overview of the EsflOWC MaRINET2 Database. Water 2020, 12, 992. [Google Scholar] [CrossRef]
  28. Cheng, Y.; Du, W.; Dai, S.; Ji, C.; Collu, M.; Cocard, M.; Cui, L.; Yuan, Z.; Incecik, A. Hydrodynamic characteristics of a hybrid oscillating water column-oscillating buoy wave energy converter integrated into a π-type floating breakwater. Renew. Sustain. Energy Rev. 2022, 161, 112299. [Google Scholar] [CrossRef]
  29. Weerakoon, A.H.S.; Thilan, W.; De Silva, H.A.; Assadi, M. Fixed type-oscillating water column front wall angle variation and impact on chamber performance: CFD numerical wave tank assessment. IOP Conf. Ser. Mater. Sci. Eng. 2023, 1294, 012015. [Google Scholar] [CrossRef]
  30. Howe, D.; Nader, J.-R.; Macfarlane, G. Performance analysis of a floating breakwater integrated with multiple oscillating water column wave energy converters in regular and irregular seas. Appl. Ocean. Res. 2020, 99, 102147. [Google Scholar] [CrossRef]
  31. SNL. Reference Models Project (RMP). Available online: https://energy.sandia.gov/programs/renewable-energy/water-power/projects/reference-model-project-rmp/ (accessed on 16 February 2024).
  32. Bull, D.L.; Smith, C.; Jenne, D.S.; Jacob, P.; Copping, A.; Willits, S.; Fontaine, A.; Brefort, D.; Gordon, M.E.; Copeland, R.; et al. Reference Model 6 (RM6): Oscillating Wave Energy Converter; Sandia National Laboratories (SNL-NM): Albuquerque, NM, USA, 2014. [CrossRef][Green Version]
  33. Hong, D.C.; Hong, S.Y.; Hong, S.W. Numerical study on the reverse drift force of floating BBDB wave energy absorbers. Ocean. Eng. 2004, 31, 1257–1294. [Google Scholar] [CrossRef]
  34. Dell’edera, O.; Niosi, F.; Casalone, P.; Bonfanti, M.; Paduano, B.; Mattiazzo, G. Understanding wave energy converters dynamics: High-fidelity modeling and validation of a moored floating body. Appl. Energy 2024, 376, 124202. [Google Scholar] [CrossRef]
  35. Cheng, Y.; Du, W.; Dai, S.; Yuan, Z.; Incecik, A. Wave energy conversion by an array of oscillating water columns deployed along a long-flexible floating breakwater. Renew. Sustain. Energy Rev. 2024, 192, 114206. [Google Scholar] [CrossRef]
  36. Hu, Y.; Cheng, Y.; Dai, S.; Yuan, Z.; Incecik, A. Hydroelastic performance of a flexible pontoon-type floating breakwater embedded with multiple oscillating-water-column devices. Renew. Energy 2026, 259, 125065. [Google Scholar] [CrossRef]
  37. Zhou, Y.; Ning, D.; Chen, L.; Mayon, R.; Zhang, C. Experimental investigation on an OWC wave energy converter integrated into a floating offshore wind turbine. Energy Convers. Manag. 2023, 276, 116546. [Google Scholar] [CrossRef]
  38. Liu, Z.; Jin, Y.; Cao, L.; Liu, G.; Guo, H. Hydrodynamic performance of an oscillating water column integrated into a hybrid monopile foundation. Ocean. Eng. 2024, 299, 117062. [Google Scholar] [CrossRef]
  39. Zhang, D.; Chen, Z.; Liu, X.; Sun, J.; Yu, H.; Zeng, W.; Ying, Y.; Sun, Y.; Cui, L.; Yang, S.; et al. A coupled numerical framework for hybrid floating offshore wind turbine and oscillating water column wave energy converters. Energy Convers. Manag. 2022, 267, 115933. [Google Scholar] [CrossRef]
  40. Machado, G.S.; Shadman, M.; Nikkhah, E.; Giorgi, G.; Levi, C.; Estefen, S.F. Hybrid floating wind-oscillating water column: A numerical analysis of the coupled performance using an aero-hydro-thermodynamic time-domain model. Energy Convers. Manag. 2026, 348, 120699. [Google Scholar] [CrossRef]
  41. Wang, L.; Xie, C.; Deng, Y.; Wu, Y.; Deng, Z. Numerical and experimental study on the hydrodynamic performance of an offshore-stationary dual-chamber OWC wave energy converter with a horizontal bottom plate. Ocean. Eng. 2024, 310, 118793. [Google Scholar] [CrossRef]
  42. Harikrishnan, T.A.; Manu; Rao, S. Experimental investigation on L-Oscillating Water Column wave energy converter integrated with floating cylindrical breakwater. Ocean. Eng. 2025, 315, 119806. [Google Scholar] [CrossRef]
  43. Sohrabi, S.; Yaghin, M.A.L.; Mojtahedi, A.; Aminfar, M.H.; Dadashzadeh, M. Experimental and numerical investigation of a hybrid floating breakwater-WEC system. Ocean. Eng. 2024, 303, 117613. [Google Scholar] [CrossRef]
  44. Liu, Z.; Zhang, G. Overtopping performance of a multi-level CROWN wave energy convertor: A numerical study. Energy 2024, 294, 130795. [Google Scholar] [CrossRef]
  45. Goulart, M.M.; Martins, J.C.; Gomes, A.P.; Puhl, E.; Rocha, L.A.O.; Isoldi, L.A.; das Gomes, M.N.; dos Santos, E.D. Experimental and numerical analysis of the geometry of a laboratory-scale overtopping wave energy converter using constructal design. Renew. Energy 2024, 236, 121497. [Google Scholar] [CrossRef]
  46. Liu, Z.; Zhang, X.; Xu, C. Experimental study on a back-bent duct buoy oscillating water column device in various degrees of freedom. Renew. Energy 2024, 224, 120121. [Google Scholar] [CrossRef]
  47. Xu, H.; Zhang, Y.; Guo, P. Effect of various motion modes on the performance of a floating pneumatic wave energy converter with a backward bent duct. Renew. Sustain. Energy Rev. 2025, 217, 115766. [Google Scholar] [CrossRef]
  48. Xu, H.; Zhang, Y.; Wang, C. Energy conversion performance of a floating wave energy converter array composed of backward bent duct buoys. Energy 2025, 324, 136100. [Google Scholar] [CrossRef]
  49. Zhu, W.; Tu, Y.; Zheng, S.; Li, H.; Li, D.; Lin, J.; Yang, S.; Li, C. Capture performance improvement of a backward-bent duct buoy wave energy converter using a damping plate. Renew. Energy 2026, 259, 125066. [Google Scholar] [CrossRef]
  50. Li, M.; Wu, B.-J.; Jiang, C.-Y.; Zhang, Y.-Q. Effect of reciprocating and unidirectional airflow on primary conversion of a pentagonal Backward Bent Duct Buoy. Appl. Ocean. Res. 2019, 89, 85–95. [Google Scholar] [CrossRef]
  51. Yang, H.; Zhang, Y.; Luo, P.; Guo, P.; Xu, H.; Wang, C.; He, Y. Physical model tests of Backward Bent Duct Buoy: A review. Renew. Sustain. Energy Rev. 2026, 226, 116346. [Google Scholar] [CrossRef]
  52. Ding, Z.-Y.; Ning, D.-Z.; Mayon, R. Wave-to-wire model for an oscillating water column wave energy converter. Appl. Energy 2025, 377, 124663. [Google Scholar] [CrossRef]
  53. Asiikkis, A.T.; Grigoriadis, D.G.E.; Vakis, A.I. Wave-to-wire modelling and hydraulic PTO optimization of a dense point absorber WEC array. Renew. Energy 2024, 237, 121620. [Google Scholar] [CrossRef]
  54. McGilton, B.; Nakhai, A.Y.; McNally, J. On the optimal sizing of power take-off systems for wave energy converters. Renew. Energy 2025, 252, 123375. [Google Scholar] [CrossRef]
  55. Carrelhas, A.A.D.; Kunz, D.; Gato, L.M.C. WEC-Sim wave-to-wire model of a floating oscillating-water-column wave energy converter. Ocean. Eng. 2026, 346, 123893. [Google Scholar] [CrossRef]
  56. Yang, B.; Duan, J.; Chen, Y.; Wu, S.; Li, M.; Cao, P.; Jiang, L. A critical survey of power take-off systems based wave energy converters: Summaries, advances, and perspectives. Ocean. Eng. 2024, 298, 117149. [Google Scholar] [CrossRef]
  57. Towhid, M.D.S.A.; Hossain, S.B.; Costa, B.T.; Chakraborty, B.; Zanj, A. Toward high-efficiency oscillating water column (OWC) systems: A focused review on turbine optimization, airflow control, and chamber interactions. Renew. Sustain. Energy Rev. 2026, 226, 116476. [Google Scholar] [CrossRef]
  58. Qin, H.; Su, H.; Wen, Z.; Liang, H. Latching control of a point absorber wave energy converter in irregular wave environments coupling computational fluid dynamics and deep reinforcement learning. Appl. Energy 2025, 396, 126282. [Google Scholar] [CrossRef]
  59. Masoomi, M.; Sarlak, H.; Rezanejad, K. Hydrodynamic performance analysis of a new hybrid wave energy converter system using OpenFOAM. Energy 2023, 269, 126807. [Google Scholar] [CrossRef]
  60. Lai, W.; Li, J.; Rong, S.; Yang, H.; Zheng, X. Experimental and numerical study on the integration of a built-in wave energy converter (BIWEC) and floating platform. Ocean. Eng. 2024, 299, 117408. [Google Scholar] [CrossRef]
  61. Yi, Y.; Sun, K.; Liu, Y.; Zhang, J.; Ji, R.; Reabroy, R. Improving the performance of the floating point-absorber array wave energy converter via a fully coupled time domain wave-to-wire model. Energy Convers. Manag. 2025, 327, 119552. [Google Scholar] [CrossRef]
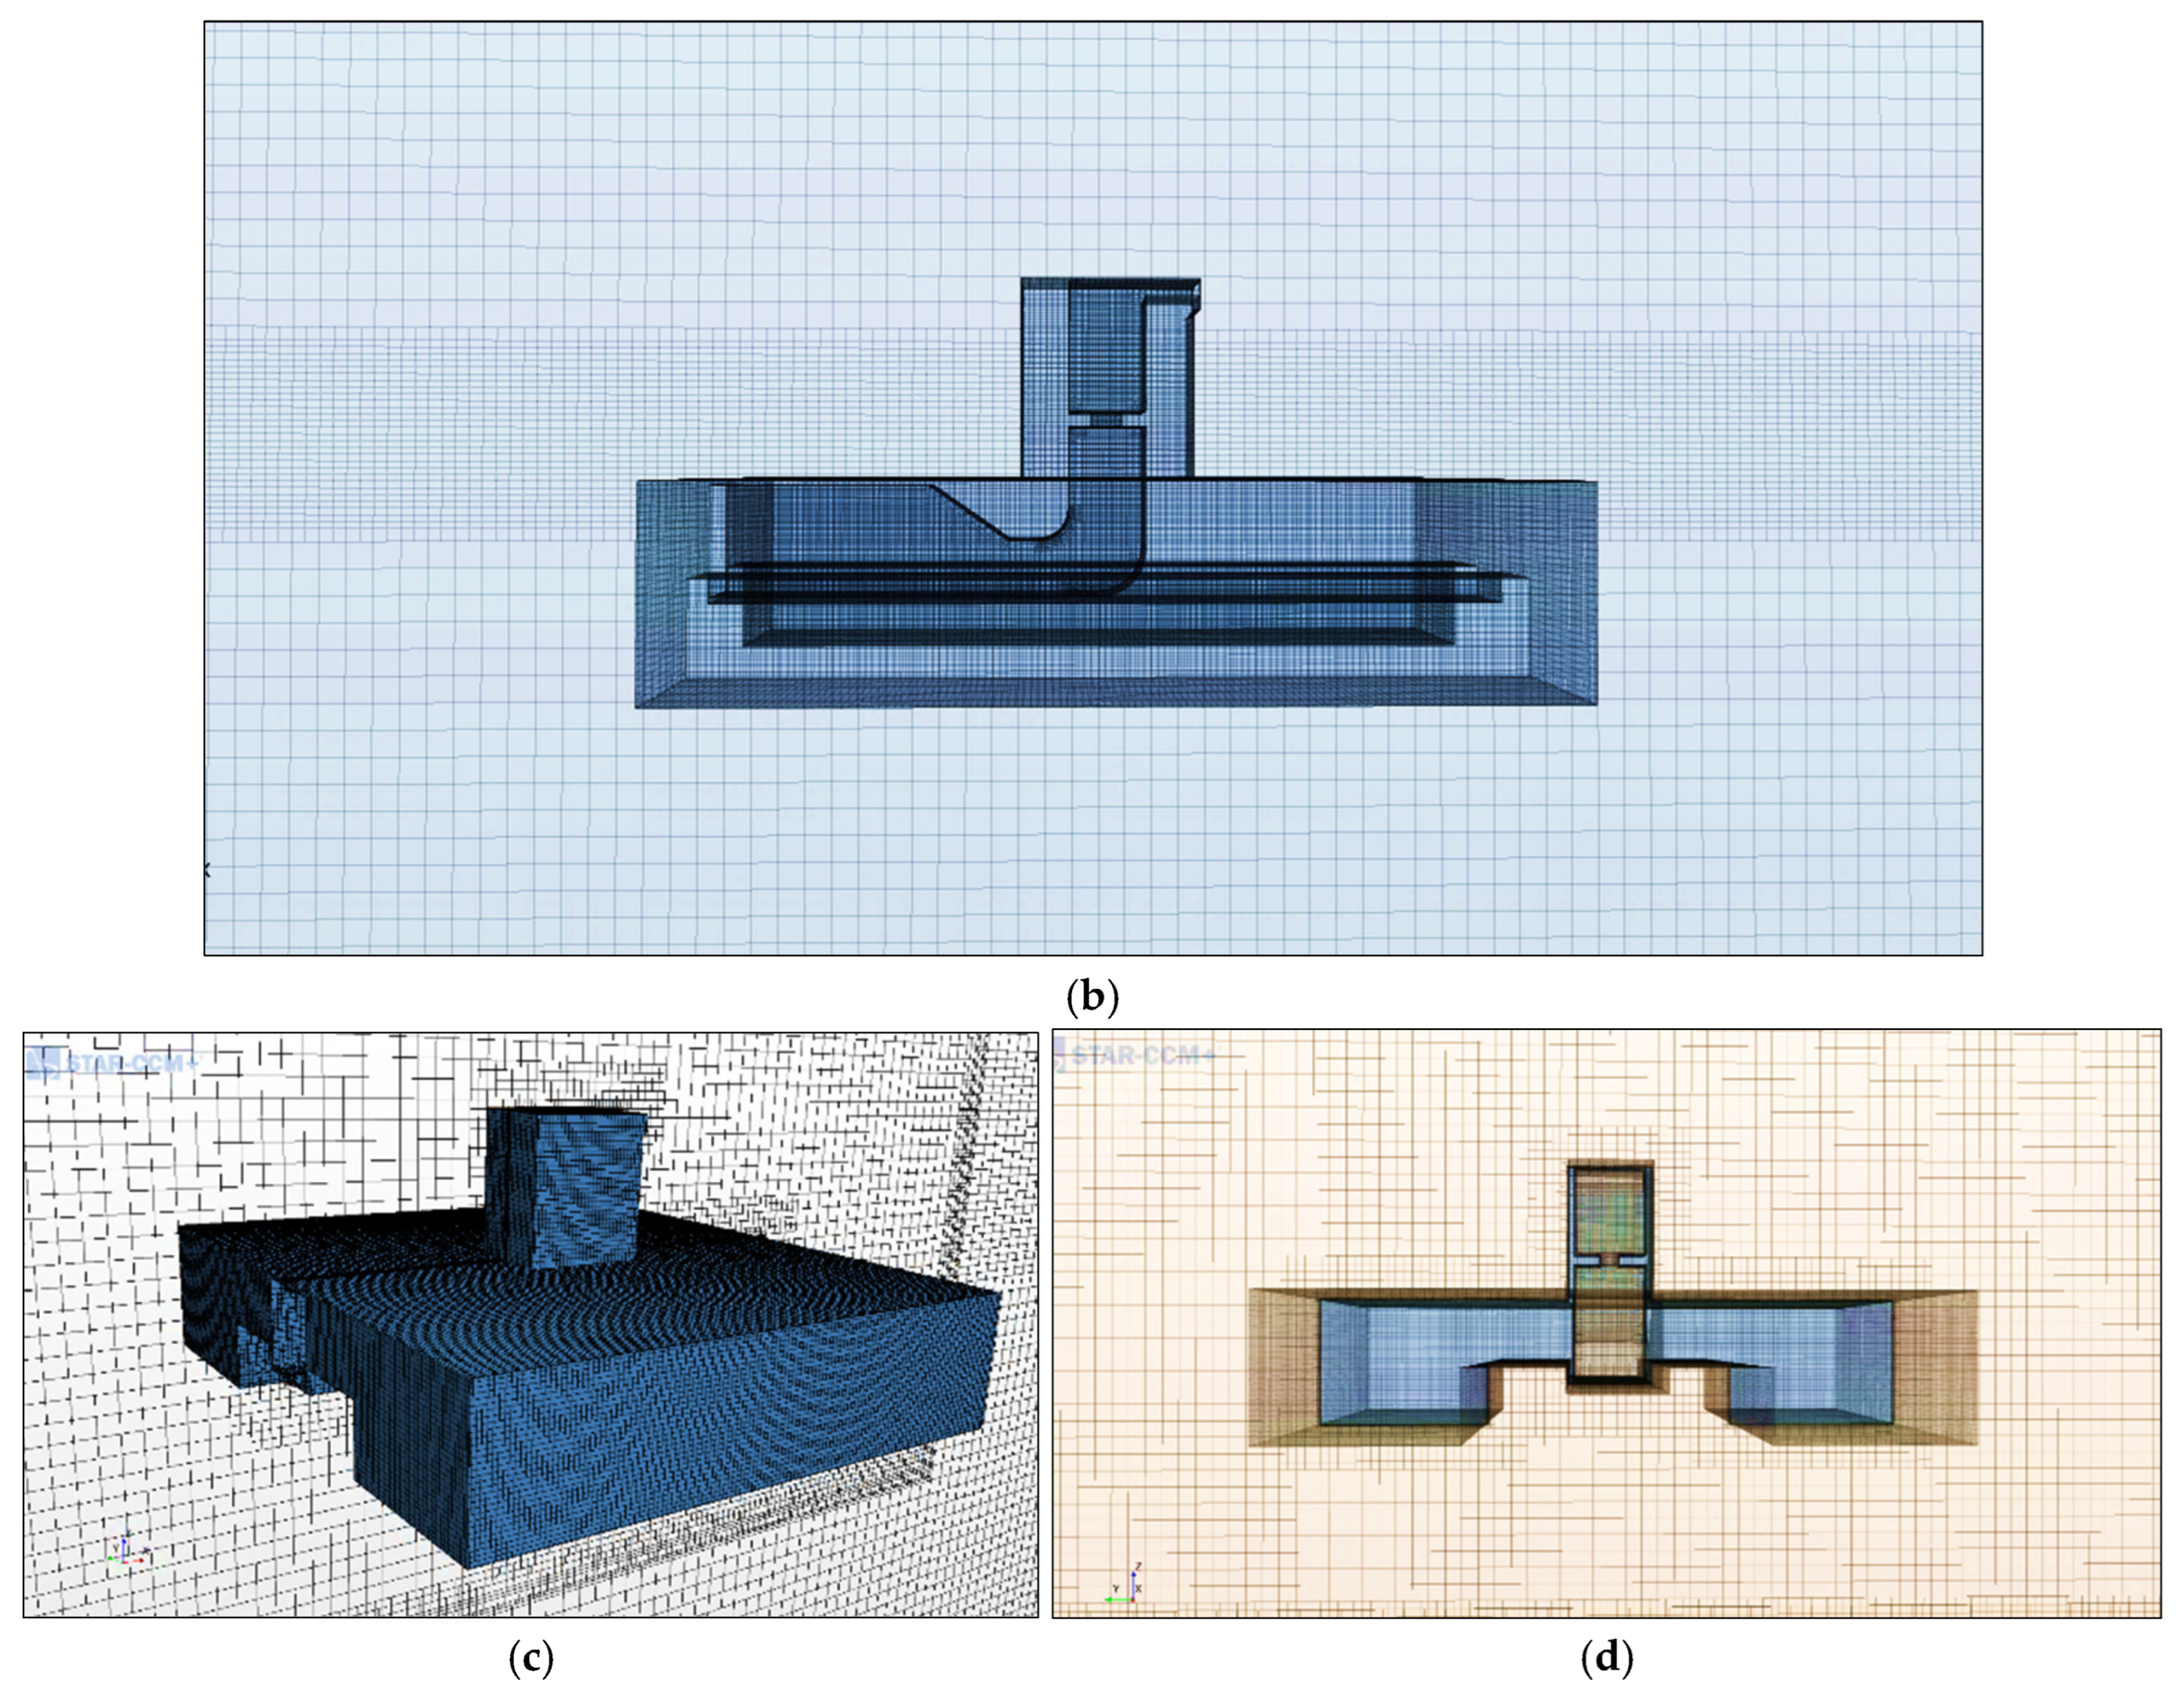
  62. Dash, S.K.; Swami, K.C.; Koley, S. Wave power extraction analysis of a floating hybrid wave energy converter placed over an undulated seabed using hybrid boundary element method. Renew. Energy 2026, 260, 125170. [Google Scholar] [CrossRef]
  63. Zhang, X.; Ning, D.; Mayon, R.; Wei, Y.; Chen, D. Hydrodynamic performance of OWC-WEC arrays integrated with an improved parabolic breakwater featuring submerged sloped sections. Energy 2026, 351, 140823. [Google Scholar] [CrossRef]
  64. Zhao, M.; Ning, D. Review of numerical methods for studying hydrodynamic performance of oscillating water column (OWC) devices. Renew. Energy 2024, 233, 121177. [Google Scholar] [CrossRef]
  65. Sasahara, Y.; Morito, M.; Masuda, M.; Tahara, J. Basic research in resonance characteristics of a water column in the oscillating water column type wave energy converter by free decay test. In Proceedings of the ASME 2025 44th International Conference on Ocean, Offshore and Arctic Engineering, Vancouver, BC, Canada, 22–27 June 2025. [Google Scholar] [CrossRef]
  66. Masuda, Y.; Kuboki, T.; Ravindrum, M.; Pathak, A.G.; Jayashankar, V.; Liang, X. Development of Backward Bent Duct Buoy (BBDB). In Proceedings of the Ninth International Offshore and Polar Engineering Conference, Brest, France, 30 May–4 June 1999; Available online: https://onepetro.org/ISOPEIOPEC/proceedings-abstract/ISOPE99/ISOPE99/24622 (accessed on 20 March 2026).
  67. Neary, V.; Previsic, M.; Jenne, S.; Hallett, K. Reference Model 6 Cost Breakdown (RM6: Oscillating Water Column); Marine and Hydrokinetic Data Repository (MHKDR): Golden, CO, USA; Sandia National Laboratories: Albuquerque, NM, USA, 2014. [Google Scholar] [CrossRef]
  68. Portillo, J.C.C.; Reis, P.F.; Henriques, J.C.C.; Gato, L.M.C.; Falcão, A.F.O. Backward bent-duct buoy or frontward bent-duct buoy? Review, assessment and optimization. Renew. Sustain. Energy Rev. 2019, 112, 353–368. [Google Scholar] [CrossRef]
  69. Weerakoon, A.H.S.; Lee, Y.-H.; Assadi, M. Wave Energy Convertor for Bilateral Offshore Wave Flows: A Computational Fluid Dynamics (CFD) Study. Sustainability 2023, 15, 7152. [Google Scholar] [CrossRef]
  70. Shehata, A.S.; Xiao, Q.; Saqr, K.M.; Alexander, D. Wells turbine for wave energy conversion: A review. Int. J. Energy Res. 2017, 41, 6–38. [Google Scholar] [CrossRef]
  71. Weerakoon, A.H.S.; Assadi, M. Techno economic analysis and performance based ranking of 3–200 kW fuel flexible micro gas turbines running on 100% hydrogen, hydrogen fuel blends, and natural gas. J. Clean. Prod. 2024, 477, 143819. [Google Scholar] [CrossRef]
  72. ANSYS Inc. ANSYS AQWA, version 17.2; ANSYS Inc.: Canonsburg, PA, USA, 2016. [Google Scholar]
  73. Siemens Digital Industries Software. Simcenter STAR-CCM+, version 20.0; Siemens Digital Industries Software: Plano, TX, USA, 2020; Available online: https://www.siemens.com/en-us/products/simcenter/fluids-thermal-simulation/star-ccm/ (accessed on 16 March 2026).
  74. ANSYS Inc. ANSYS CFX, version 17.2; ANSYS Inc.: Canonsburg, PA, USA, 2016. [Google Scholar]
  75. Lee, B.S. Hydrostatics and Stability of Marine Vehicles: Theory and Practice; Springer: Singapore, 2018. [Google Scholar] [CrossRef]
  76. Matthews, N.; Joiner, K.F.; Smith, W.F. Stability Assessment of a Catamaran Using Sea Trials. J. Mar. Sci. Eng. 2024, 12, 1436. [Google Scholar] [CrossRef]
  77. Pan, Z.; Kim, T.; Heo, J. A Mesh Convergence Study for Low Frequency Second Order Wave Forces on Floating Bodies. In Ocean Engineering, Proceedings of the ASME 2023 42nd International Conference on Ocean, Offshore and Arctic Engineering, Melbourne, Australia, 11–16 June 2023; American Society of Mechanical Engineers (ASME): New York, NY, USA, 2023; Volume 5, p. V005T06A045. [Google Scholar] [CrossRef]
  78. Kajishima, T.; Taira, K. Reynolds-Averaged Navier–Stokes Equations. In Computational Fluid Dynamics; Springer: Cham, Switzerland, 2017. [Google Scholar] [CrossRef]
  79. Dolai, A.K.; Pandey, V.; Biswas, G.; Chakraborty, S. A hybrid phase field-volume of fluid method for simulating dynamically evolving interfaces in multiphase flows. Comput. Fluids 2025, 289, 106536. [Google Scholar] [CrossRef]
  80. Díaz, E.O. 3D Motion of Rigid Bodies: A Foundation for Robot Dynamics Analysis; Springer: Cham, Switzerland, 2019. [Google Scholar] [CrossRef]
  81. Yang, H.-S.; Tongphong, W.; Ali, A.; Lee, Y.-H. Comparison of different fidelity hydrodynamic-aerodynamic coupled simulation code on the 10 MW semi-submersible type floating offshore wind turbine. Ocean. Eng. 2023, 281, 114736. [Google Scholar] [CrossRef]
  82. Alkhabbaz, A.; Yang, H.-S.; Tongphong, W.; Lee, Y.-H. Impact of compact diffuser shroud on wind turbine aerodynamic performance: CFD and experimental investigations. Int. J. Mech. Sci. 2022, 216, 106978. [Google Scholar] [CrossRef]
  83. Chen, H.; Xu, Q.; Zheng, X.; Bennetts, L.G.; Xie, B.; Lin, Z.; Lin, Z.; Li, Y. Viscous effects on the added mass and damping forces during free heave decay of a floating cylinder with a hemispherical bottom. Eur. J. Mech. B Fluids 2023, 98, 8–20. [Google Scholar] [CrossRef]
  84. Sun, J.; Hu, S.-L.J.; Li, H. Nonlinear roll damping parameter identification using free-decay data. Ocean. Eng. 2021, 219, 108425. [Google Scholar] [CrossRef]
  85. Bohra, L.K.; Mincks, L.M.; Garimella, S. Experimental Investigation of Pressure Drop Characteristics of Viscous Fluid Flow Through Small Diameter Orifices. J. Fluids Eng. 2021, 143, 021306. [Google Scholar] [CrossRef]
  86. Zheng, S.; Michele, S.; Liang, H.; Meylan, M.H.; Greaves, D. Wave power extraction from a floating elastic disk-shaped wave energy converter. J. Fluid Mech. 2022, 948, A38. [Google Scholar] [CrossRef]
  87. Bouhrim, H.; El Marjani, A.; Nechad, R.; Hajjout, I. Ocean Wave Energy Conversion: A Review. J. Mar. Sci. Eng. 2024, 12, 1922. [Google Scholar] [CrossRef]
  88. Weerakoon, A.H.S.; Assadi, M. Generalized framework for micro gas turbine techno-economic assessment. Energy Convers. Manag. 2024, 316, 118820. [Google Scholar] [CrossRef]
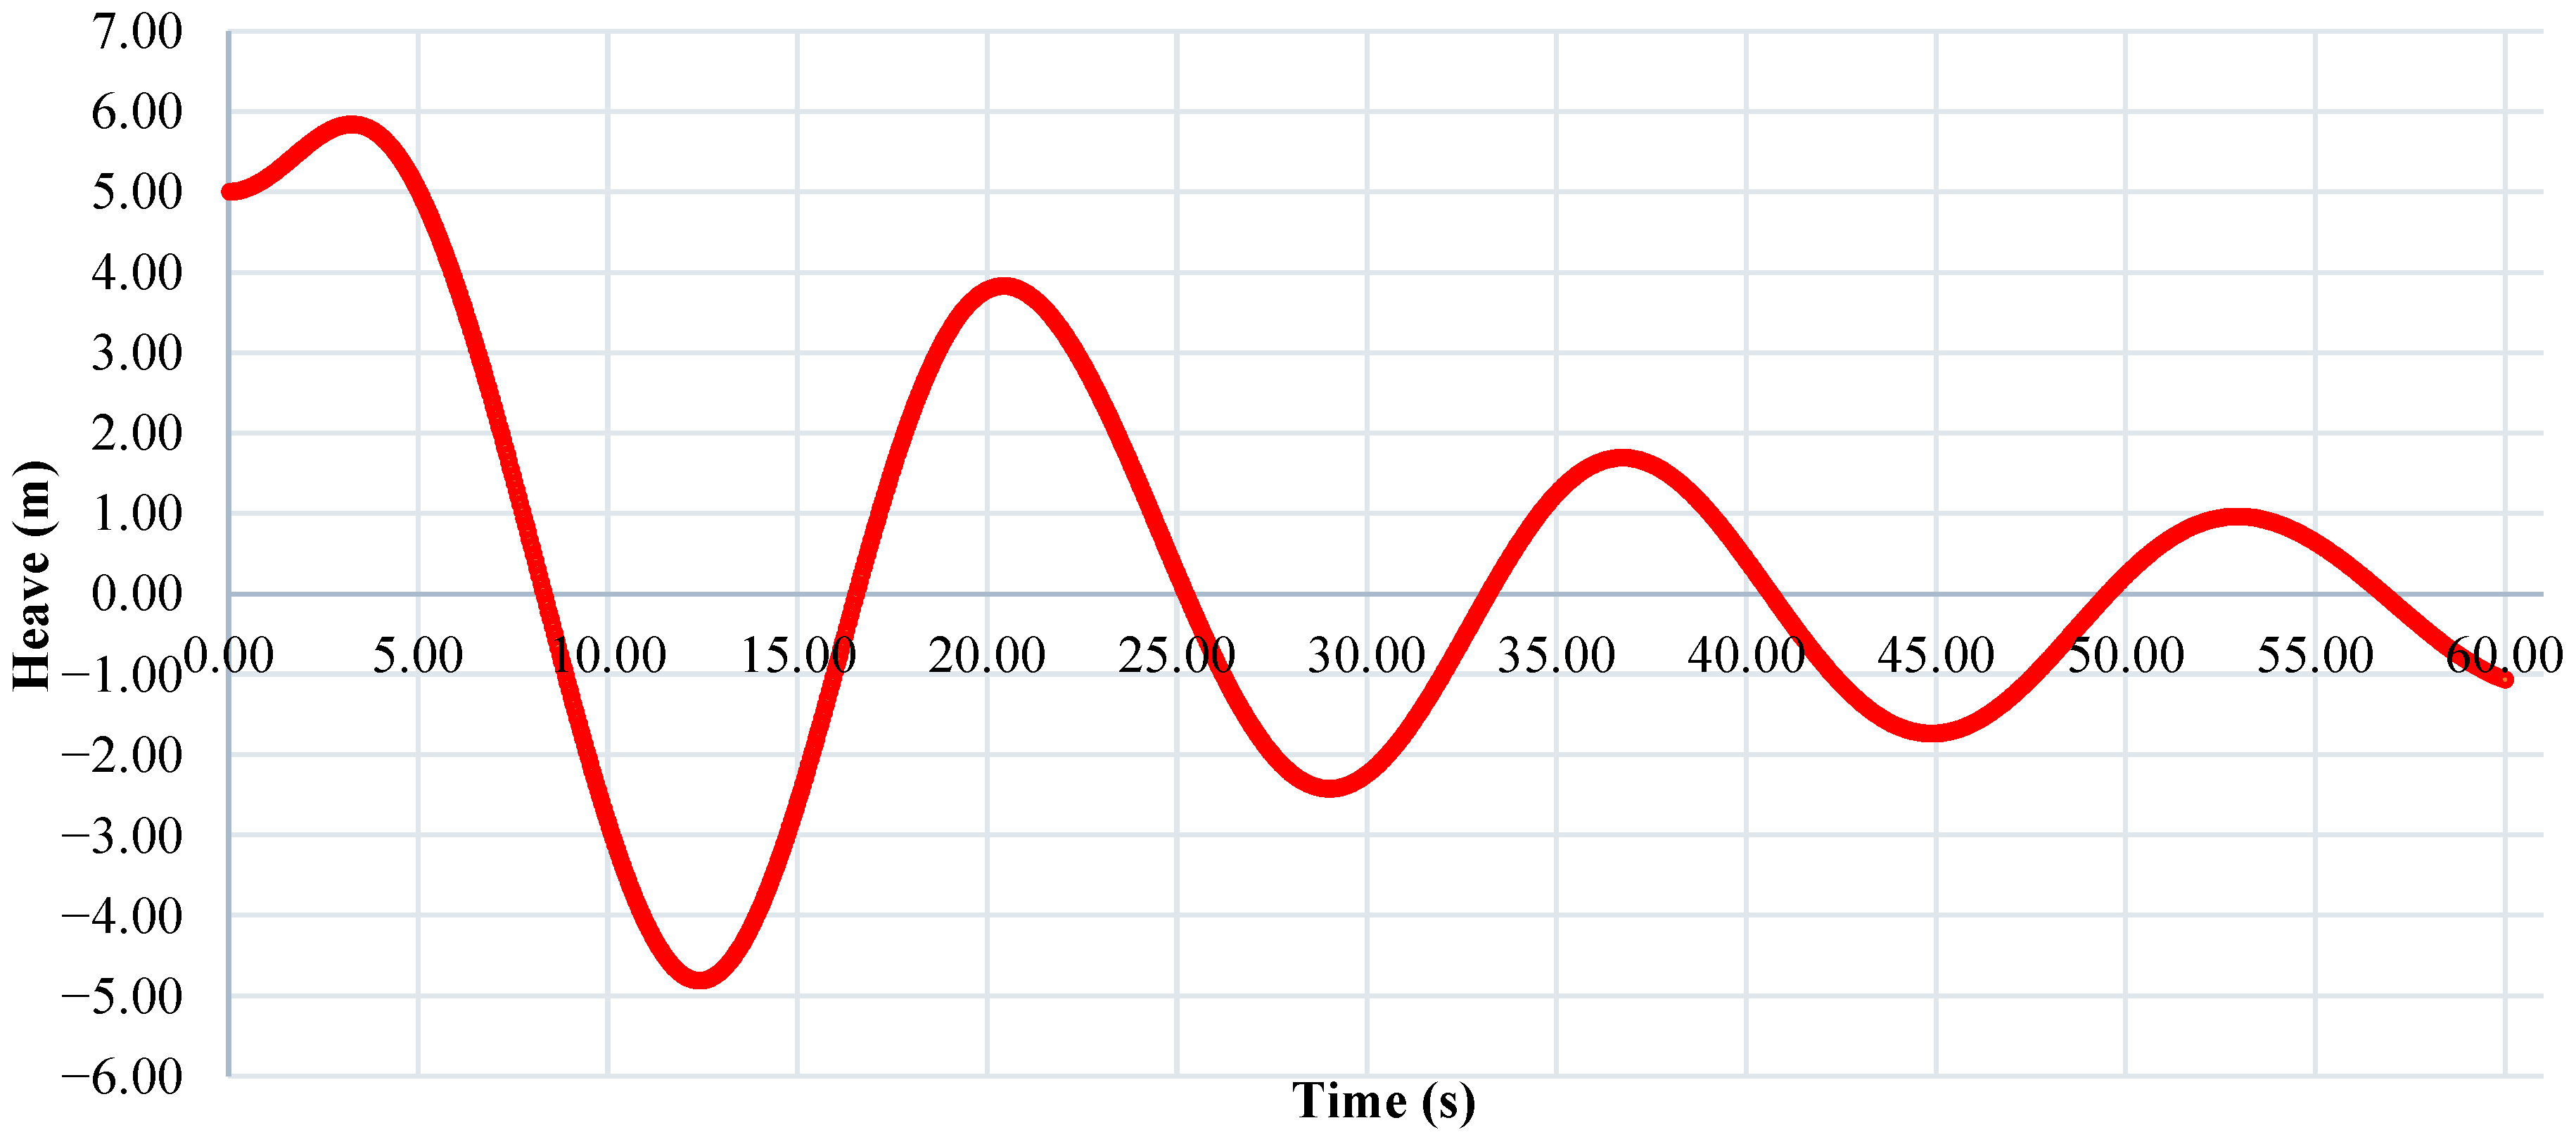
  89. Weerakoon, A.H.S.; Assadi, M. Artificial Neural Network (ANN) driven Techno-Economic Predictions for Micro Gas Turbines (MGT) based Energy Applications. Energy AI 2025, 20, 100483. [Google Scholar] [CrossRef]
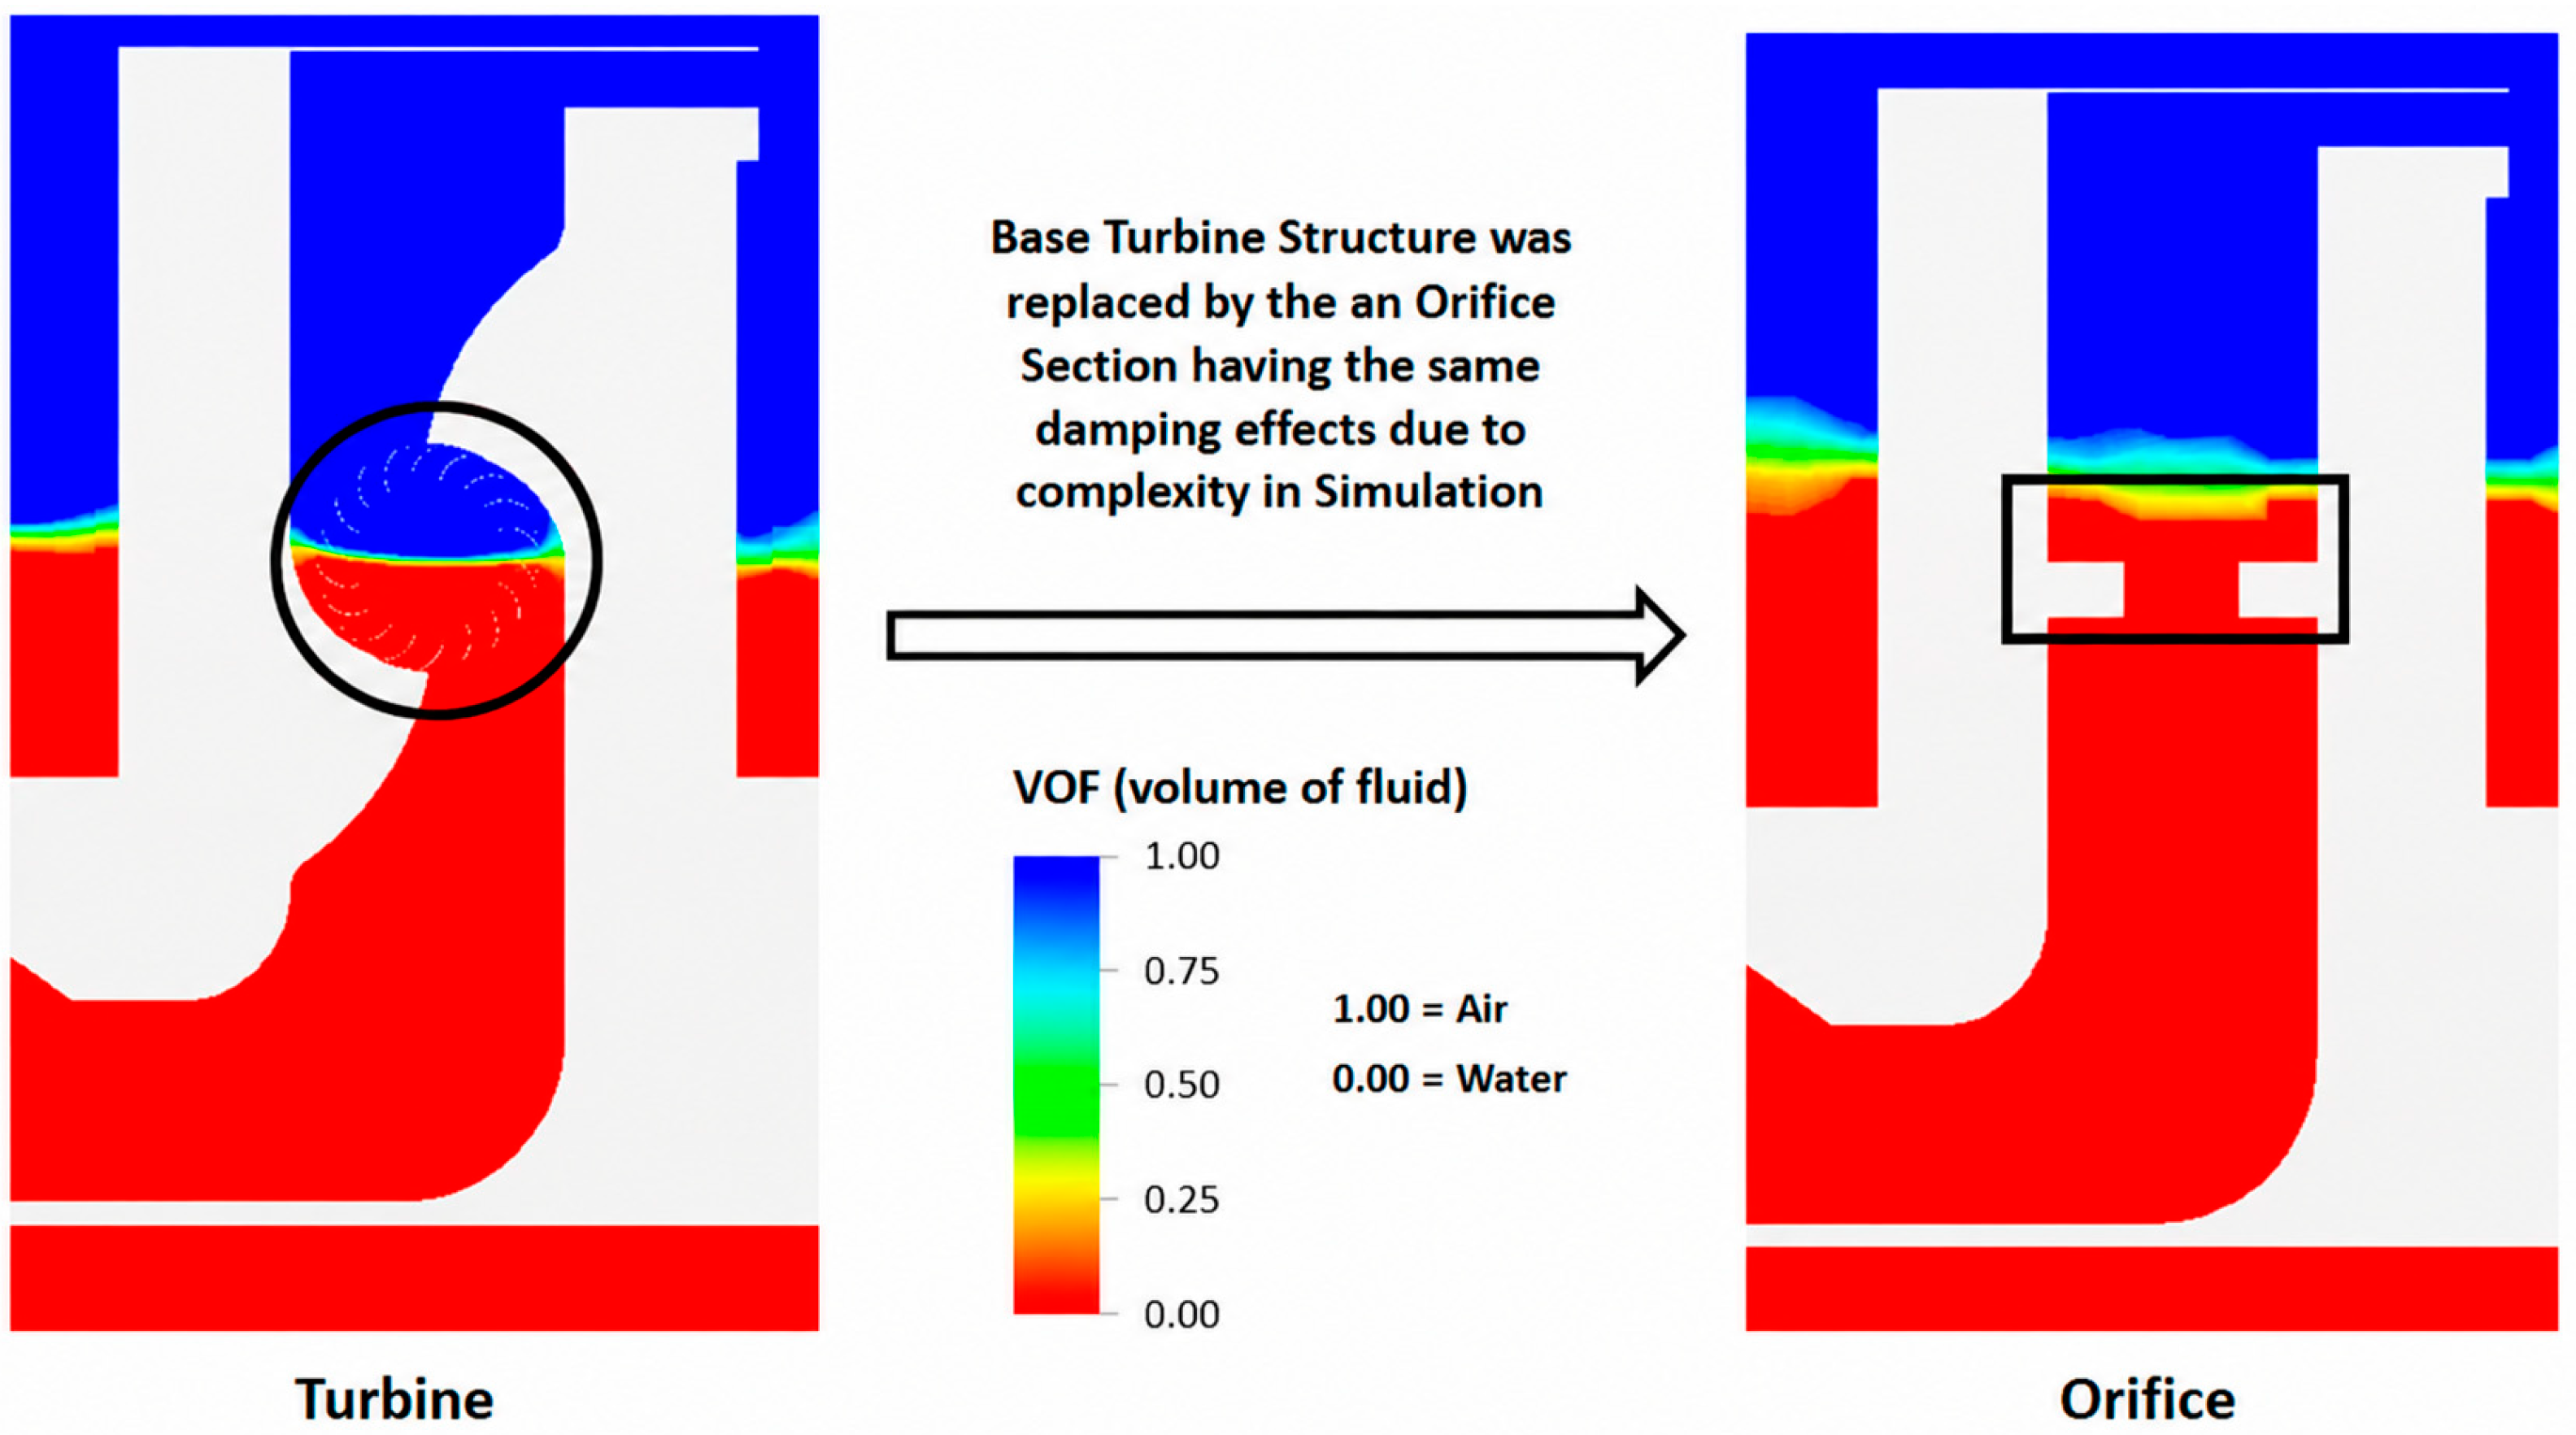
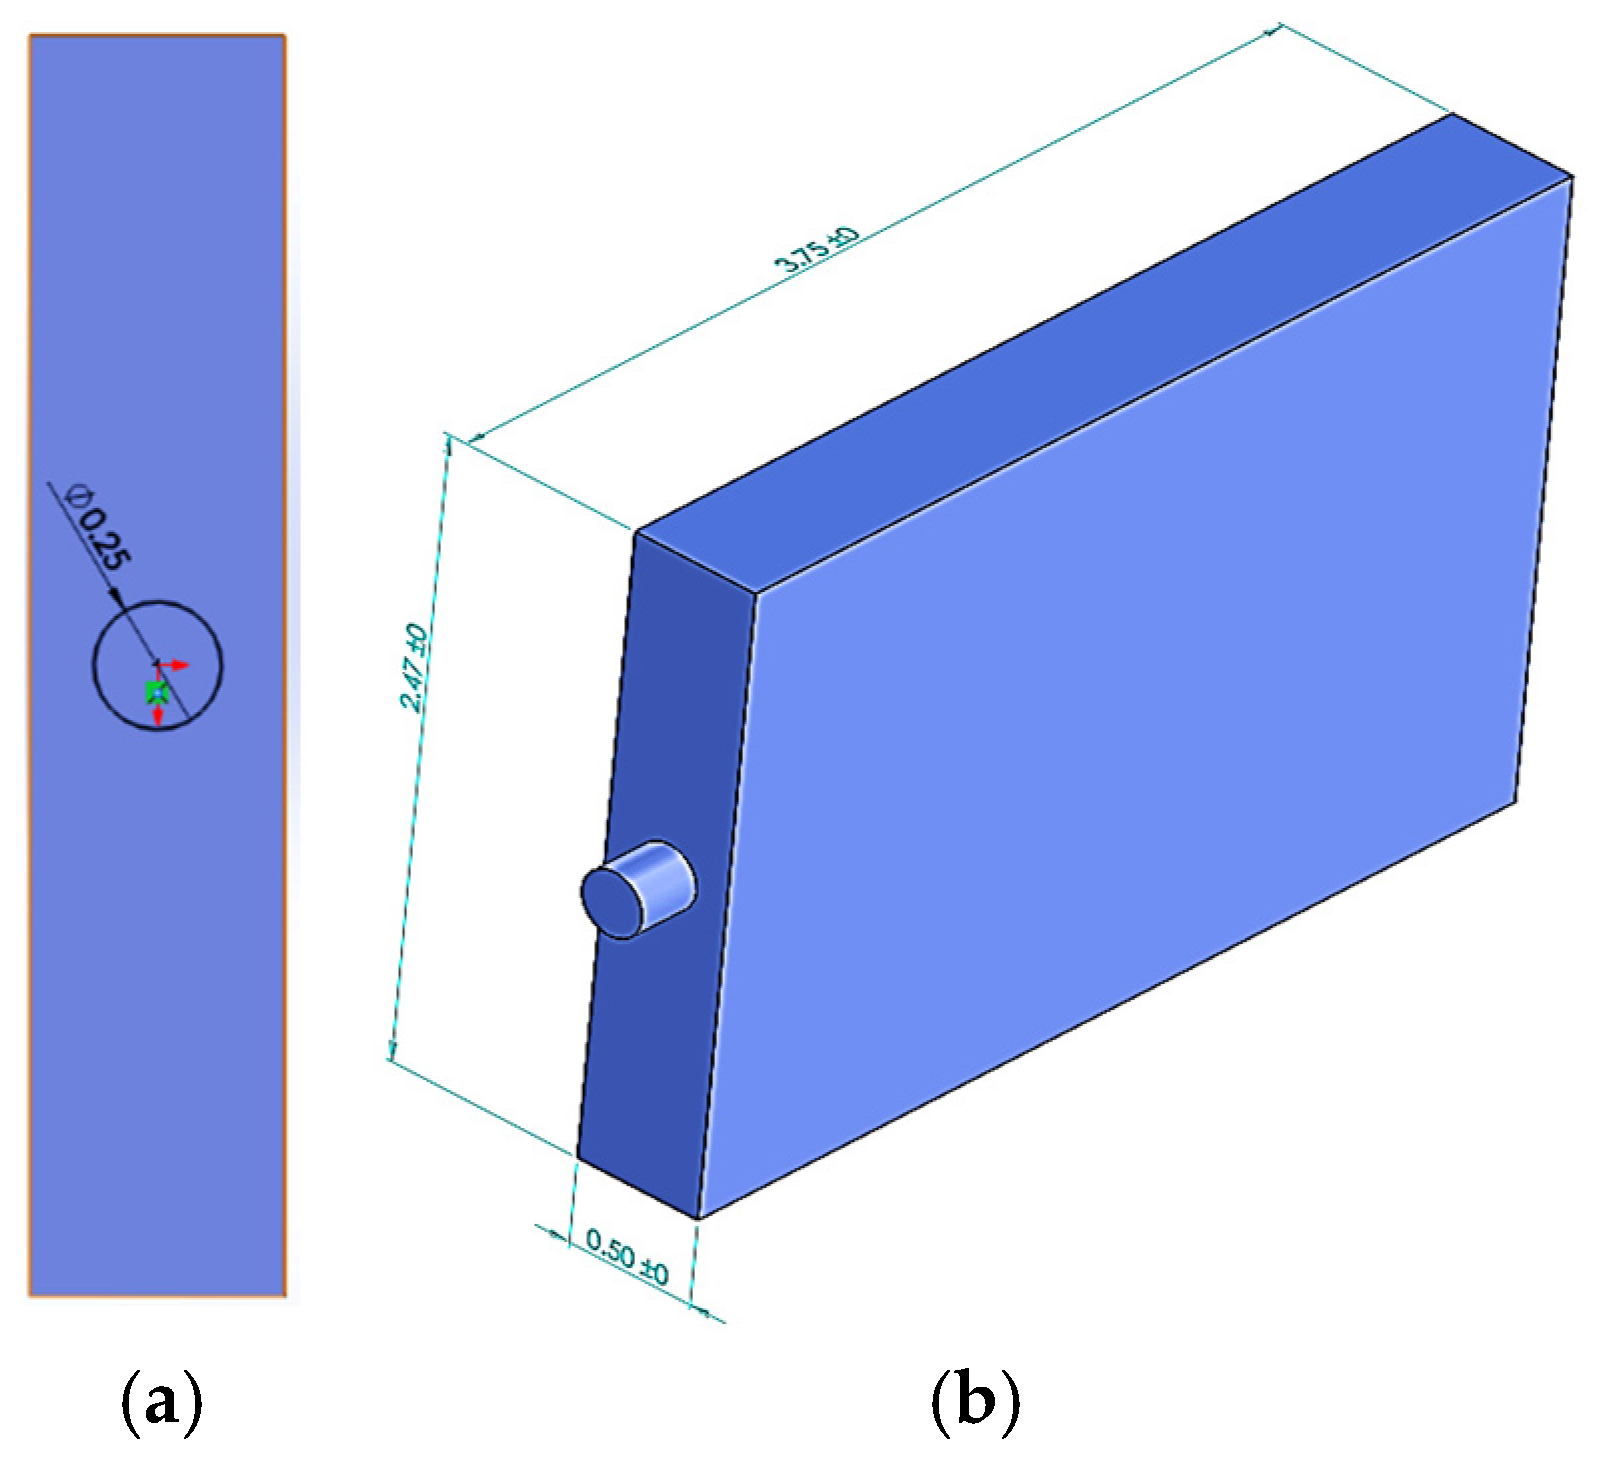
  90. Weerakoon, A.H.S.; Assadi, M. Trends and advances in micro gas turbine technology for sustainable energy solutions: A detailed review. Energy Convers. Manag. X 2023, 20, 100483. [Google Scholar] [CrossRef]
  91. He, H.-C.; Xu, S.-W.; Wang, L.; Wang, X.-F. Dynamic Positioning Control of Surge—Pitch Coupled Motion for Small-Waterplane-Area Marine Structures. China Ocean Eng. 2021, 35, 598–608. [Google Scholar] [CrossRef]
  92. Li, W.; Tang, Y.; Liu, L.; Liu, S.; Cai, R. Heave-roll-pitch coupled nonlinear internal resonance response of a spar platform considering wave and vortex exciting loads. J. Ocean Univ. China 2017, 16, 209–222. [Google Scholar] [CrossRef]
  93. Yang, H.-S.; Alkhabbaz, A.; Tongphong, W.; Lee, Y.-H. Cross-comparison analysis of environmental load components in extreme conditions for pontoon-connected semi-submersible FOWT using CFD and potential-based tools. Ocean. Eng. 2024, 304, 117248. [Google Scholar] [CrossRef]
  94. Yang, H.-S.; Alkhabbaz, A.; Lee, Y.-H. Integrated CFD and hydrodynamic correction approach for load response analysis of floating offshore wind turbine. Ocean. Eng. 2025, 328, 121007. [Google Scholar] [CrossRef]
  95. Alkhabbaz, A.; Hamza, H.; Daabo, A.M.; Yang, H.-S.; Yoon, M.; Koprulu, A.; Lee, Y.-H. The aero-hydrodynamic interference impact on the NREL 5-MW floating wind turbine experiencing surge motion. Ocean. Eng. 2024, 295, 116970. [Google Scholar] [CrossRef]
  96. Ruderman, M.; Kaltenbacher, S.; Horn, M. Pressure-flow dynamics with semi-stable limit cycles in hydraulic cylinder circuits. In Proceedings of the 2021 IEEE International Conference on Mechatronics (ICM), Kashiwa, Japan, 7–9 March 2021; pp. 1–6. [Google Scholar] [CrossRef]
  97. Blasingame, T.A.; McCray, T.L.; Lee, W.J. Decline Curve Analysis for Variable Pressure Drop/Variable Flowrate Systems. In Proceedings of the SPE Gas Technology Symposium, Houston, TX, USA, 22–24 January 1991. [Google Scholar] [CrossRef]
  98. Tenorio-Fernandez, L.; Valle-Levinson, A.; Gomez-Valdes, J. Subtidal hydrodynamics in a tropical lagoon: A dimensionless numbers approach. Estuar. Coast. Shelf Sci. 2018, 200, 449–459. [Google Scholar] [CrossRef]
  99. Yu, T.; He, S.; Shi, H.; Chen, X.; Guo, Q. Numerical investigation of hydrodynamic performance and efficiency of a dual-chamber oscillating water column under different damping and chamber breadth ratio combination. Ocean. Eng. 2022, 266, 113008. [Google Scholar] [CrossRef]
  100. Moradi, M.A.; Mojra, A. Free-surface flow past a circular cylinder at high Froude numbers. Ocean. Eng. 2024, 295, 116804. [Google Scholar] [CrossRef]
  101. Jordan, S.A. Asymmetric turbulent boundary layers along long thin circular cylinders at low-Re. Phys. Fluids 2015, 27, 095106. [Google Scholar] [CrossRef]
  102. Loudon, C.; Tordesillas, A. The Use of the Dimensionless Womersley Number to Characterize the Unsteady Nature of Internal Flow. J. Theor. Biol. 1998, 191, 63–78. [Google Scholar] [CrossRef]
Figure 1. (a) Model RM6 BBDB Device Design. (b) Reference RM6 BBDB configuration with conventional pneumatic PTO (Wells turbine) [68].
Jmse 14 00934 g001
Figure 2. Present study approach: orifice-based PTO surrogate representing turbine-equivalent pressure–flow behavior within the fully coupled CFD framework.
Jmse 14 00934 g002
Figure 3. Systematic representation of implemented methodology (workflow diagram).
Jmse 14 00934 g003
Figure 4. Generated mesh for the floating body and sea domain: (a) Extra-fine mesh of the full simulation domain, (b) Uniform hexahedral mesh of the floating structure and surrounding sea domain, (c) Three-dimensional mesh of the floating body, (d) Detailed mesh of the frontal opening section.
Jmse 14 00934 g004aJmse 14 00934 g004b
Figure 5. Free decay curve for the BBDB-FOWC structure.
Jmse 14 00934 g005
Figure 6. Turbine surrogated orifice section in the water column of OWC.
Jmse 14 00934 g006
Figure 7. (a) Front section and (b) 3D view of the 0.25 m orifice plate CAD profile.
Jmse 14 00934 g007
Figure 8. (a) Mesh elements of the orifice plate combining with the water passage. (b) Mesh created using ANSYS ICEM CFD ®v17.2 software package.
Jmse 14 00934 g008
Figure 9. Numerical setup configuration using Ansys CFX 17.2v for the Orifice Domain in transient calculation mode.
Jmse 14 00934 g009
Figure 10. (a) Continuity equation residuals, (b) X Y Z directional moment convergence.
Jmse 14 00934 g010
Figure 11. Forces and moments acting on the floating body.
Jmse 14 00934 g011
Figure 12. (a) 114 General 3-D view of the stable floating structure, (b) 6-DOF floating body in stable floating condition with dynamic wave loading, (c) Simulated sea condition and star CCM+ wave model adopted for solution.
Jmse 14 00934 g012
Figure 13. Time histories of the hydrodynamic body forces acting on the floating structure in the surge, sway, and heave directions.
Jmse 14 00934 g013
Figure 14. Time variation in the pitching moment acting on the floating structure in the ZX plane.
Jmse 14 00934 g014
Figure 15. Time history of the heave displacement of the floating body during the 6-DOF coupled simulation.
Jmse 14 00934 g015
Figure 16. Pressure drop across all the orifice design types.
Jmse 14 00934 g016
Figure 17. Pressure drop across 0.3D orifice and the turbine comparison.
Jmse 14 00934 g017
Figure 18. Pressure variation and mass flow variation across the 0.3D orifice section with time.
Jmse 14 00934 g018
Figure 19. (a) Pressure Drop vs. Mass Flow rate of the turbine as cyclic variation. (b) Pressure drop vs. Mass Flow rate of the 0.3D orifice plate.
Jmse 14 00934 g019
Figure 20. (a) Orifice plate pressure drop-mass flow variation with undamped condition. (b) Orifice plate pressure-mass flow variation with damped condition.
Jmse 14 00934 g020
Figure 21. Cyclic variation in the pressure-mass flow behavior in both damped and undamped conditions.
Jmse 14 00934 g021
Table 1. Comparison between representative previous studies and the present work.
StudyDevice TypePTO RepresentationFully Coupled CFD Hydrodynamics + PTO6-DOF Floating MotionHydraulic/Orifice SurrogateFocus
Dell’Edera et al. [34]Floating WECNot detailedPartialYesNoHydrodynamic–mooring coupling
Zhou et al. [37]FOWT-OWCPneumatic PTOPartialYesNoExperimental hybrid platform
Zhang et al. [39]FOWT-OWCControlled PTOReduced-order couplingYesNoDynamic response and control
Liu et al. [46]BBDB-OWCPneumatic nozzleNoYesNoMotion-constrained BBDB
Xu et al. [47,48]Pneumatic BBDBSimplified dampingNoYesNoMotion contribution and arrays
Ding et al. [52]OWC Wave-to-wireTurbine-generator modelReduced orderNoNoElectrical conversion
Carrelhas et al. [55]Floating OWCTurbine-generatorReduced orderYesNoWEC-Sim implementation
Zhao et al. [64]ReviewVarious damping models--NoNumerical methodology review
Present StudyModified BBDB-FOWCOrifice-based hydraulic PTO surrogateYesYesYesFully coupled CFD hydrodynamic–PTO interaction
Table 2. Hydrostatic and diffraction analysis setup used in ANSYS AQUA.
ParameterValue/SettingRemarks
SoftwareANSYS AQUA v17.2Hydrostatic and diffraction pre-analysis
Analysis typeHydrostatic + frequency-domain diffractionUsed to generate initial stability and hydrodynamic inputs
Structural representation3D surface/panel modelFloating BBDB-FOWC geometry
Water depthOffshore design depth caseConsistent with subsequent dynamic simulations
Fluid density1025 kg/m3Seawater
Gravity9.81 m/s2Standard
Wave heading range−180° to 180°Directional assessment
Principal heading increment45°Seven representative headings
Frequency range0.2–1.5 rad/sCovers response band around device natural period
Mesh-coarse~1800 panelsInitial sensitivity case
Mesh-medium~3600 panelsSelected for comparison
Mesh-fine~7200 panelsHighest tested discretization
Monitored outputsDisplacement, CoG, CoB, GM, KM, BM, restoring termsUsed for CFD initialization
Convergence criterionVariation in principal hydrostatic outputs < 2% between medium and fineAdopted threshold
Selected discretizationMedium–fine equivalentSufficient for hydrostatic transfer to CFD
Table 3. Numerical setup of the fully coupled hydrodynamic BBDB-FOWC simulations in STAR-CCM+.
ParameterValue/Setting
Code/VersionSIEMENS STAR-CCM+ v20.0
Solver typeTransient, incompressible, segregated flow
Pressure–velocity couplingSIMPLE-type segregated coupling
Spatial discretizationFinite volume
Convection schemeSecond-order upwind
Temporal discretizationSecond-order implicit
Multiphase modelVolume of Fluid (VOF)
PhasesAir + seawater
Turbulence model k ω   S S T
Body motion modelDFBI, 6-DOF
Mooring representationCatenary station-keeping system
Mesh typeHybrid, locally refined trimmed/hexahedral dominant
Overset meshYes
Background regionYes
Overset regionYes
Free-surface refinementYes
Local refinement zonesFree surface, chamber opening, PTO/orifice region, overset interface
Prism layers at wetted walls8–10 layers
Prism-layer growth rate1.15–1.20
Target near-wall treatmentAll y+ wall function compatible
Total cell count (production)~5.0 million
Simulation duration60 s
Time-step controlAutomatic, with capped maximum step
Transient time step0.01–0.02 s
Wave conditionH = 3.0 m, T = 9.0 s
Inlet boundaryRegular wave inlet
Outlet boundaryWave damping/opening
Monitored convergence quantitiesResiduals, body forces, moments, heave, pitch, chamber pressure
Mooring configurationSymmetric 4-line catenary arrangement
Equivalent line length~85–100 m per line
Equivalent line diameter~0.08–0.12 m
Initial pre-tension~40–60 kN
Mooring purposeStation keeping with allowable 6-DOF response
Table 4. STAR-CCM+ mesh refinement and mesh-independence summary for the coupled BBDB-FOWC model.
CaseApprox. CellsCells per Wave HeightCells per Wavelength (Refined Zone)Peak Heave Difference vs. FinePeak Chamber Pressure Difference vs. FineAssessment
Coarse2.1 million10–1260–708.40%10.70%Under-resolved near chamber/free surface
Medium3.6 million14–1680–903.20%4.60%Acceptable, slight smoothing of peaks
Fine/Extra-fine5.0 million18–20100–110N/AN/ASelected production mesh
Table 5. Extracted dynamic parameters from the CFD free-decay test.
ParameterSymbolValueUnitMethod/Basis
Damped oscillation period T z 16.58sMeasured from consecutive decay cycles
Damped natural circular frequency ω z 0.3789rad/s ω z = 2 π T z
Logarithmic decrement δ 0.6060-From successive peak amplitudes
Damping ratio ζ 0.096-From logarithmic decrement formulation
Undamped natural circular frequency ω 0 0.3806rad/sDerived from damped response
Non-dimensional damping factor k 0.0677-Based on restoring coefficient and decay response
Table 6. Numerical setup and sufficiency check for the CFD free-decay test in STAR-CCM+.
ParameterValue/Setting
Simulation objectiveEstimation of viscous damping and non-dimensional damping factor
Motion mode1-DOF heave
Initial displacement1.0 m upward from equilibrium
Water conditionStill water
SolverSTAR-CCM+ transient VOF
Turbulence model k ω   S S T
Mesh typeOverset/free-surface refined
Mesh cases tested1.2 million, 2.0 million, 2.8 million cells
Selected mesh~2.0–2.8 million equivalent
Time-step cases tested0.02 s, 0.01 s
Selected time step0.01 s
Total simulated time60 s
Damped   period ;   T z 16.583 s
Damped   natural   frequency ;   ω z 0.3789 rad/s
Undamped   natural   frequency ;   ω 0 0.3806 rad/s
Logarithmic   decrement ;   δ 0.6060
Damping   ratio ;   ζ 0.096
Non-dimensional   damping   factor ;   k 0.0677
Sufficiency criterion Variation   T z   in   and   ζ  < 2% between two finest cases
Table 7. Geometrical cases considered for the orifice-plate PTO surrogate.
Case IDDiameter Ratio (β = d/D)Orifice DiameterExpected Hydraulic Effect
OP-250.250.25 mHighest pressure drop, strongest damping
OP-300.30.30 mClosest match to turbine response
OP-350.350.35 mModerate damping
OP-400.40.40 mReduced pressure drop
OP-450.450.45 mLowest damping among tested cases
Table 8. Mesh statistics for the ANSYS ICEM/CFX orifice-flow model.
DomainNodesElements
Nozzle Section24,458133,195
Inlet 97,60091,773
Outlet97,60091,773
Upper Wall24,458133,195
All Domains244,116449,936
Table 9. Transient CFD setup used for the orifice-plate simulations in ANSYS CFX.
Simulation ParameterSteady-State Pre-RunTransient Oscillatory Run
Mesh typeHybrid tetra/hexaHybrid tetra/hexa
Total nodes244,116244,116
Total elements449,936449,936
Turbulence modelSSTSST
Fluid phaseSingle phase (water)Single phase (water)
Domain motionStationaryStationary
Time treatmentSteady initializationTransient
Total physical time-30 s
Time step-Automatic~0.005–0.01 s
Inlet boundaryVelocity inlet/imposed oscillatory conditionOscillatory velocity inlet
Outlet boundaryOpeningOpening
Wall conditionSmooth no-slipSmooth no-slip
Interface treatmentConservative interface fluxConservative interface flux
Mesh connectionGGIGGI
Reference comparison targetReference turbine ΔP profileReference turbine ΔP profile
Monitored outputsPressure field, mass flow rateΔP(t), Q(t), phase-averaged response
Table 10. Mesh-independence summary for the ANSYS CFX orifice-flow simulations.
Mesh CaseApprox. ElementsPeak ΔP Diff. vs. FineCycle-Averaged Flow Diff. vs. FineΔP–Q Loop ShapeAssessment
Coarse0.28 million7.10%6.40%Noticeable smoothing near reversalInsufficient throat resolution
Medium0.45 million2.80%3.10%Good agreementSelected mesh
Fine0.72 million--ReferenceSlight accuracy gain, higher Computation cost
Table 11. Key hydrostatic parameters of the BBDB-FOWC floating structure.
ParameterSymbolValueUnitInterpretation
Center of Gravity (Vertical) z G −9.34mLow CoG enhances stability
Center of Buoyancy (Vertical) z B −5.02mBuoyancy acts above CoG
Vertical Separation B G 4.32mStrong restoring tendency
Metacentric Height (Roll) G M x 4.33mHigh roll stability
Metacentric Height (Pitch) G M y 4.34mHigh pitch stability
Displacement Volume Δ 3536.7m3Offshore-scale buoyancy
Waterplane Area A w p 22.41m2Governs heave stiffness
2nd Moment (Roll Axis) I x x 29.54m4Roll restoring leverage
2nd Moment (Pitch Axis) I y y 58.6m4Pitch restoring leverage
Heave Stiffness C 33 (from ANSYS)N/mVertical restoring force
Roll Stiffness C 44 (from ANSYS)Nm/radRotational stability
Pitch Stiffness C 55 (from ANSYS)Nm/radRotational stability
Table 12. Performance comparison of the BBDB-FOWC system under viscous damped and undamped conditions.
Performance MetricSymbolDamped ConditionUndamped ConditionRelative Change (%)
Cycle-averaged pressure Δ P ¯ 1827.061475.7419.23
Cycle-averaged volumetric flow rate Q ¯ 15.9912.4722.01
Extracted power potential P o r i f i c e 29.2118.437.01
Incident wave power P w a v e 138.81138.810
Conversion efficiency η 21.0513.2637.01
Table 13. Characteristic dimensionless parameters for the BBDB-FOWC and orifice-based PTO system.
ParameterExpressionCharacteristic ValuePhysical Interpretation
Wave steepness [98] H L 0.0237Moderately steep wave; nonlinear but not extreme
Frequency parameter [99] ω = 2 π T 0.698 rad/sGoverns oscillatory forcing frequency
Relative body length L b L 0.221Floating body is short relative to wavelength
Relative chamber width b c L 0.0277Chamber opening is highly localized relative to wave scale
Reynolds number (orifice) [98,99] R e = ρ U d / μ (8.5~9.3) × 106Fully turbulent internal PTO flow
Keulegan–Carpenter number (orifice) [99] K C = U T / d 828–912Strongly inertia-dominated oscillatory flow through the orifice
Euler number (orifice) [100] E u = Δ P / ( 0.5 ρ U 2 ) 0.25–0.31Pressure-drop magnitude is dynamically significant but not dominant over convective inertia
Froude number (orifice) [100] F r = U / g d 16.1–17.7Internal PTO flow is strongly inertia-driven relative to gravity
Strouhal-type inverse parameter [101] S t = d / ( U T ) 0.0011–0.0012Very low value, consistent with large-amplitude oscillatory through-flow
Womersley number [102] α = d 2 ω / υ (~125)Thin oscillatory boundary layer relative to orifice diameter
Damping ratio [83,84] ζ 0.096Lightly damped floating-body response
Non-dimensional damping factor [83,84] k 0.0677Moderate hydrodynamic damping contribution
Disclaimer/Publisher’s Note: The statements, opinions and data contained in all publications are solely those of the individual author(s) and contributor(s) and not of MDPI and/or the editor(s). MDPI and/or the editor(s) disclaim responsibility for any injury to people or property resulting from any ideas, methods, instructions or products referred to in the content.