


Abstract
Scour around two compound piles (CPs) in tandem, side-by-side (SBS), and staggered arrangements is investigated through experiments. Each CP has a larger diameter foundation, which is partially buried, and a smaller diameter top part with a diameter ratio of 0.5. The exposed height of the foundation is equal to its diameter. Experiments are conducted for gap ratios from 1 to 3. Due to the shadowing effect from the upstream CP, the downstream CP in the tandem arrangement has shallower scour depth and its most downstream point has deposition at an early stage. In the SBS arrangement, the scour does not have much difference from that of a single CP, but the inner side of each CP has a slightly deeper scour hole than the outer side of each CP and scour hole became independent at gap ratio of 3. In the staggered arrangement, the shadowing effect from the upstream CP was experienced by the downstream CP when G/D = 1, but not 1.5 and 3.
1. Introduction
Multiple piles are commonly used in offshore installations and bridges to support the structures and scour around pile foundation is a main reason that affect structural safety [1]. Scour around multiple piles has more complex sediment transport than a monopile [2]. Jiang and Lin [3] and Sumer et al. [4] concluded that the scour around a pile group has different maximum scour depth and scour extent from a single pile. Many researchers have conducted numerical and experimental investigations around multiple simple piles (SPs) in various arrangements. Here, simple piles refer to the piles whose diameter is uniform. Two piles in tandem, side-by-side (SBS), and staggered arrangements were investigated the most [5,6,7,8,9,10]. Yang et al. [8] summarized that the spacing between the two piles (G/D) and arrangement influence the incoming flow pattern, resulting in different scour depths around each pile, where D and G represent the pile diameter and the gap between the two piles, respectively.
Horseshoe vortex (HV) in front of the pile is the key mechanism that causes the scour [11]. Placing multiple piles in tandem, SBS, and staggered arrangement changes the HV characteristics and results in different characteristics of flow, such as stronger blockage, shielding effect, flow acceleration, and wake interference. All these effects alter the scour depth and extent around each pile in a pile group [9]. Scour around three or more SPs was also investigated [12,13,14,15]. It was concluded that the behavior of fluid flow becomes complex in group arrangements, which affects both the local and global scour depth. Table 1 summarizes the studies and major findings of scour around multiple piles. Different scour protection techniques have been developed to protect piles from scour [16,17].
Table 1.
Summary of studies conducted around multiple piles.
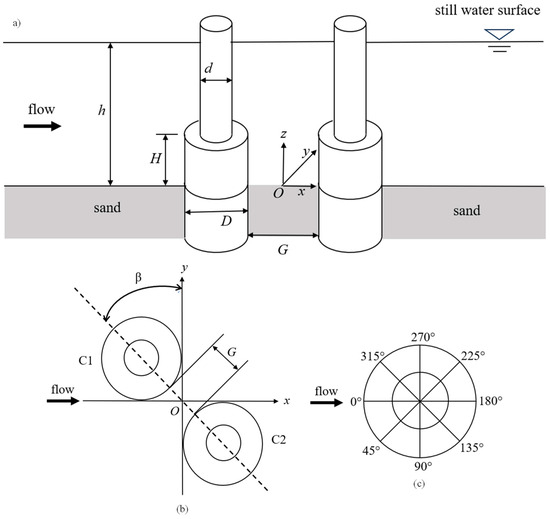
As compared to SPs, studies around multiple CPs are very limited. In Table 1, only the last two studies are about two compound piles, leaving a research void to investigate the scour dynamics around multiple CPs. Compound piles are commonly used in offshore engineering because their larger diameter foundations provide stronger stability. A CP is a non-uniform pile whose diameter of its bottom part is larger than that top part, as seen in Figure 1a. The diameter and height of the bottom part are D and H, respectively, and the diameter of the top part is d. Scour around CPs is dependent upon the geometrical ratios. Many researchers investigated the process of scour using either experimental or numerical approaches [40,41,42,43,44,45,46,47,48] and proposed different prediction formulae for calculating scour depth based upon the geometrical ratios of CPs. Ataie-Ashtiani et al. [42] conducted an experimental study on compound CPs in a clear-water regime and concluded that the height of the foundation-to-diameter ratio (H/D) affects the scour, especially when the H/D is small. Adnan et al. [49] found that H/D affects the scour depth and follows an increasing trend with maximum change around H/D = 0, and developed an empirical equation for calculating scour depth based on H/D. Although previous studies examined the scour evolution around multiple SPs or a single CP, no study around multiple CPs with exposed foundations arranged in various orientations has been conducted before. It is a significant gap because CPs are used widely in offshore structures [1]. Non-uniform geometry of CPs causes complex flow structures and different scour evolutions. Similarly, placing CPs in different orientations results in hydrodynamic interaction between the piles. Hence, the absence of dedicated studies around multiple CPs and their geometrical differences from SPs raises a need for a systematic assessment of scour evolution around multiple CPs.
Figure 1.
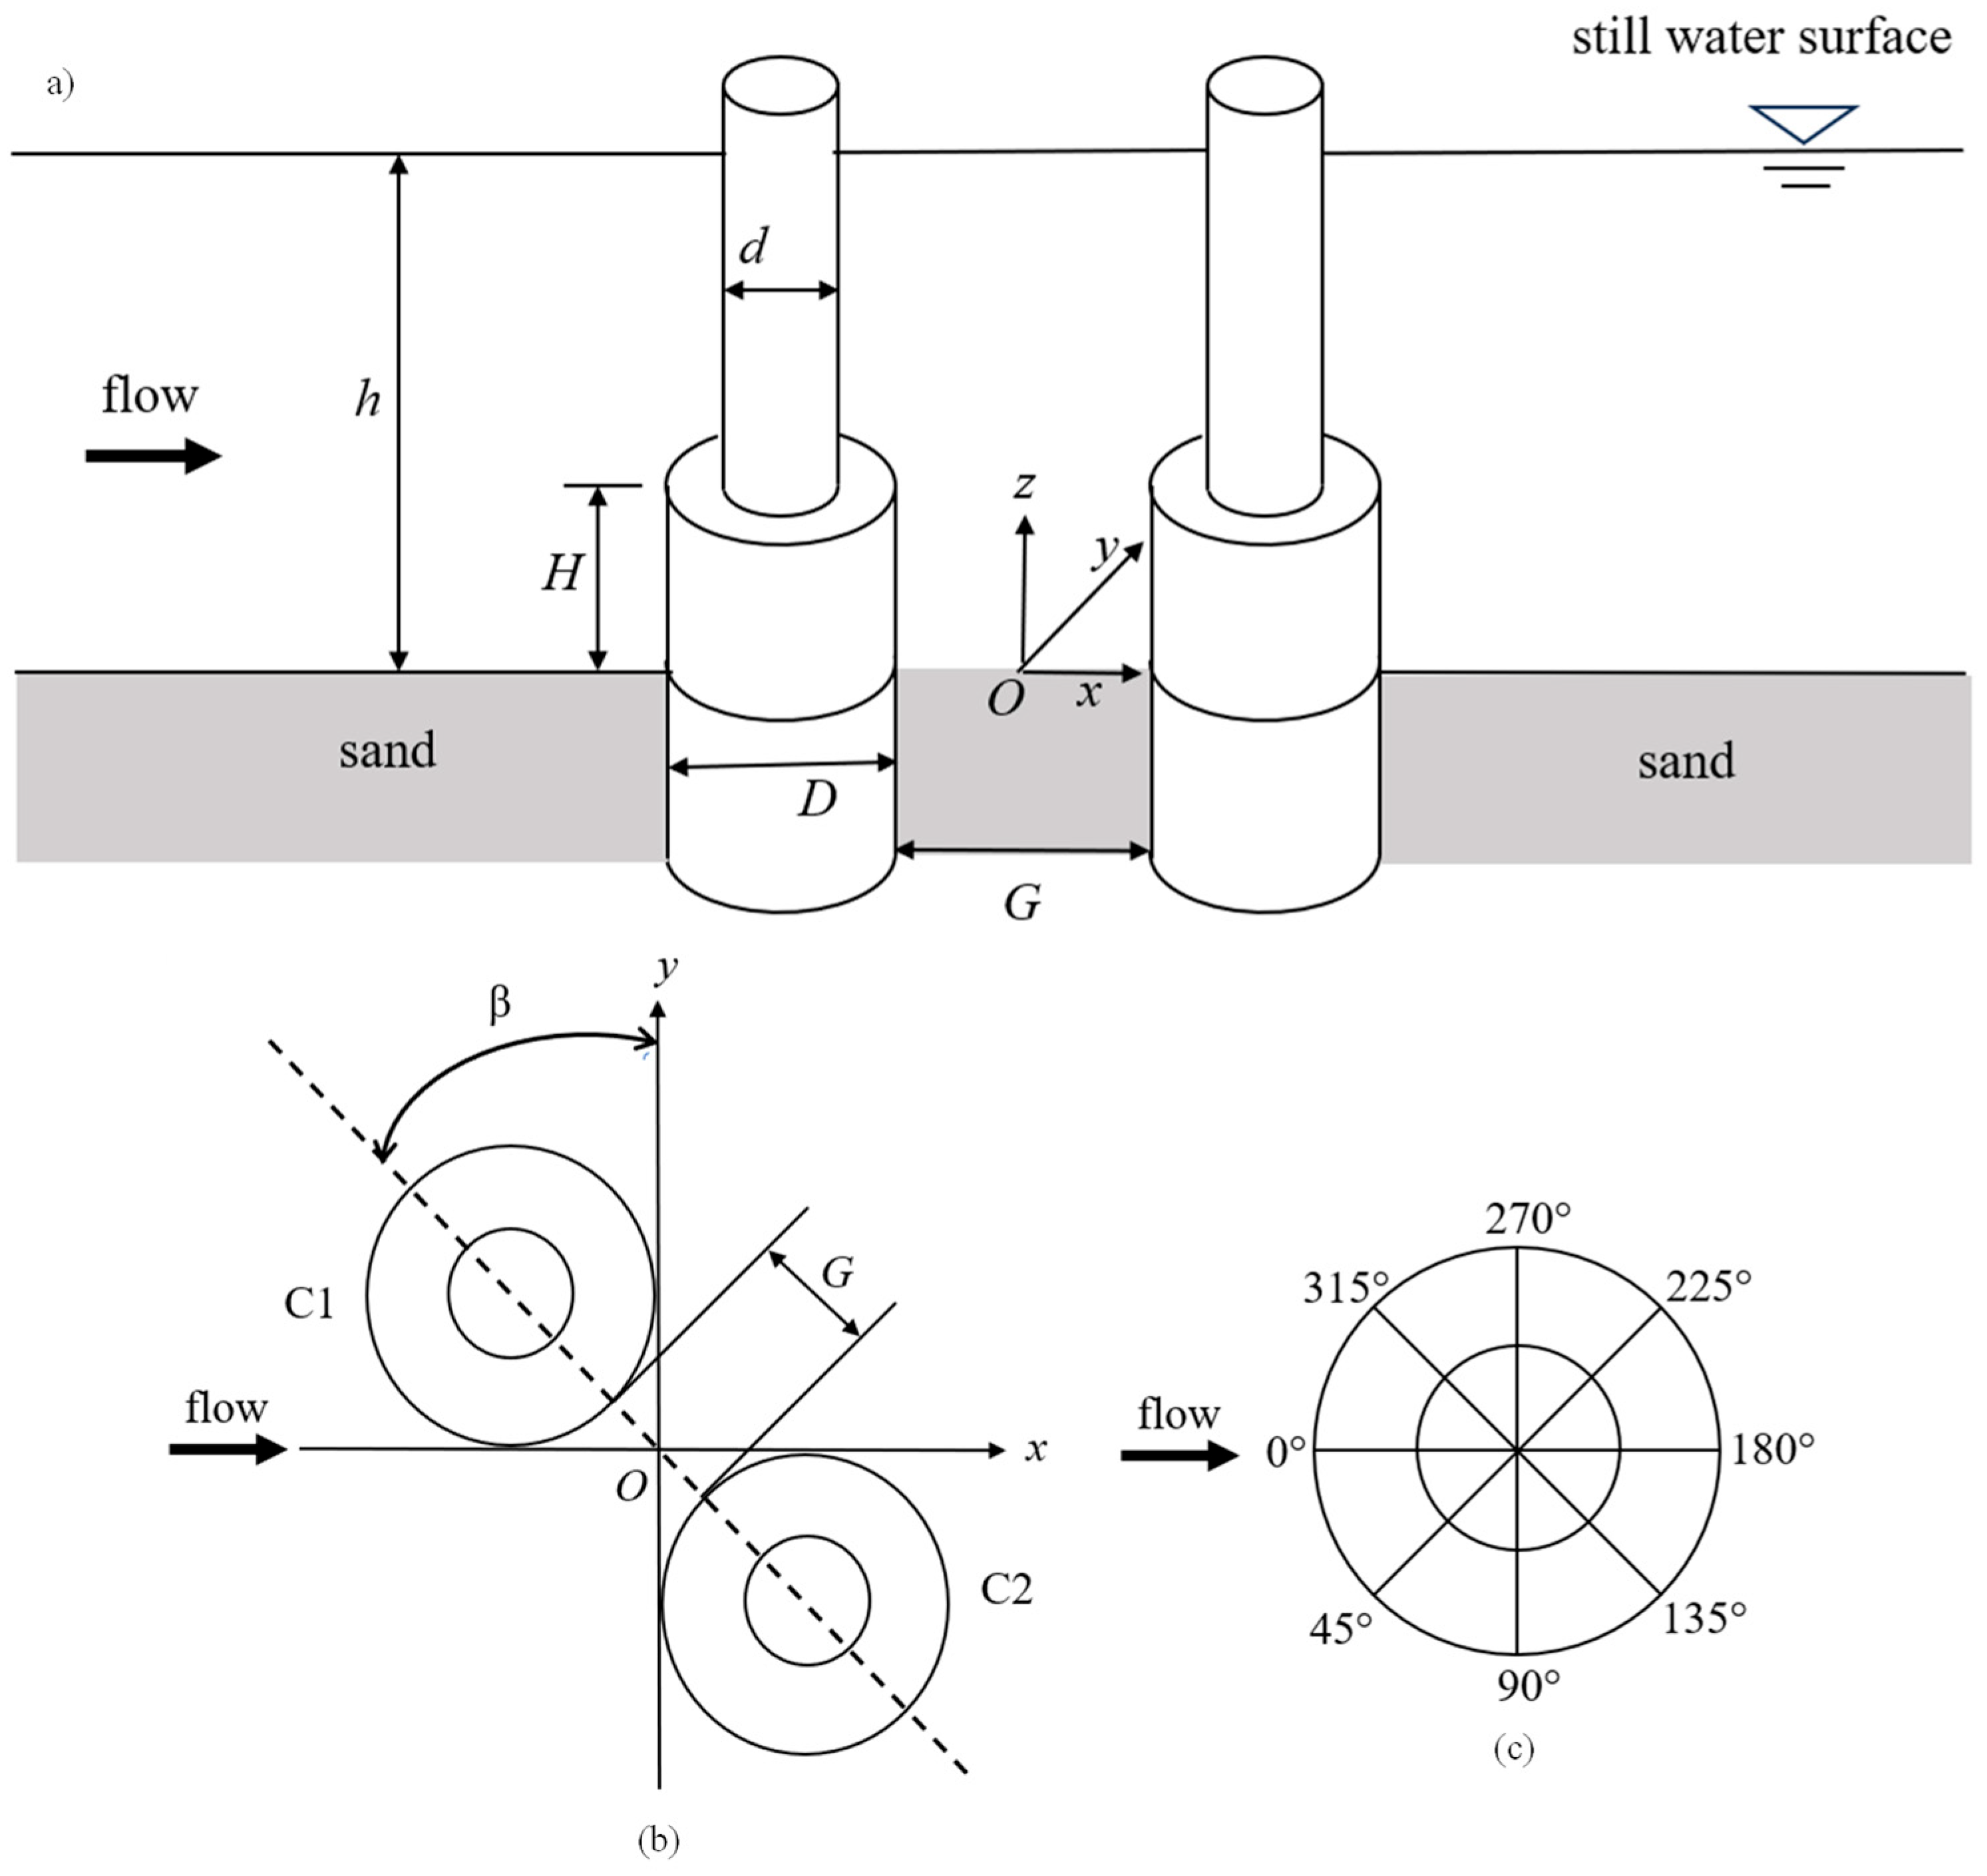
Schematic of two CPs and definition of coordinate system. (a) Side view of two CPs in tandem; (b) top view of two CPs in staggered arrangement; and (c) definition of position angles on the surface of the foundation.
In this study, scour around two compound piles (CPs) in tandem, side-by-side (SBS), and staggered arrangements is investigated through experiments. Each CP has a larger diameter on the bottom part and a smaller diameter on the top part, with a diameter ratio of 0.5. The height of the bottom part is the same as its diameter. Experiments are conducted for gap ratios of 1, 2, and 3 for the tandem arrangement and 1, 1.5, and 3 for the other two arrangements. The study aims to identify the effect of arrangement on the scour depth on each CP. The rest of the paper is arranged as follows. Section 2 presents the experimental setup and measurement method; Section 3 is the detailed discussion of the experimental results, and Section 4 summarizes the conclusions of the study.
2. Experimental Setup and Methodology
All the experiments were conducted in a recirculating 15 m long, 1 m wide, and 0.8 m deep water flume at Western Sydney University. The flume has a 3.65 m long, 1 m wide, and 0.18 m deep sand basin located at 10 m from the inlet. Models were placed approximately 1.5 m from the upstream edge of the sand basin. Experimental parameters, i.e., sand properties, model geometries, and flow conditions, are listed in Table 2. Ettema et al. [50] and Adnan et al. [49] concluded that turbulence present in the flow affects the scour depth and this effect is more visible for smaller diameter piles. To counter this, two flow straighteners in series are installed on the inlet side of the flume to reduce the turbulence intensity [49]. Experiments are conducted for two CPs in tandem, side-by-side, and staggered arrangements. The arrangements of the two CPs in a tandem and staggered arrangement are shown in Figure 1a and Figure 1b, respectively. The side-by-side arrangement is the case where the alignment angle is zero, i.e., β = 0° (β is defined in Figure 1b).
Table 2.
Experimental Parameters.
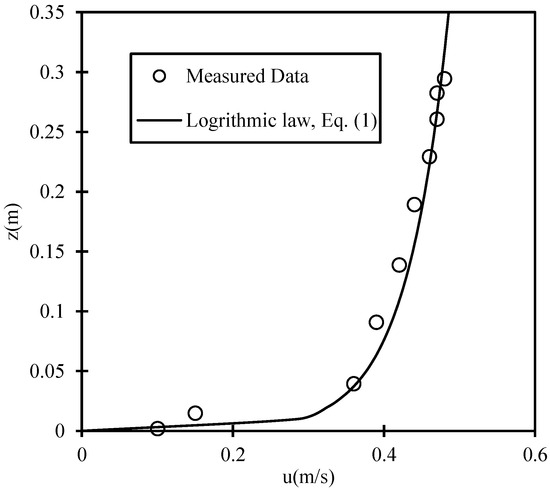
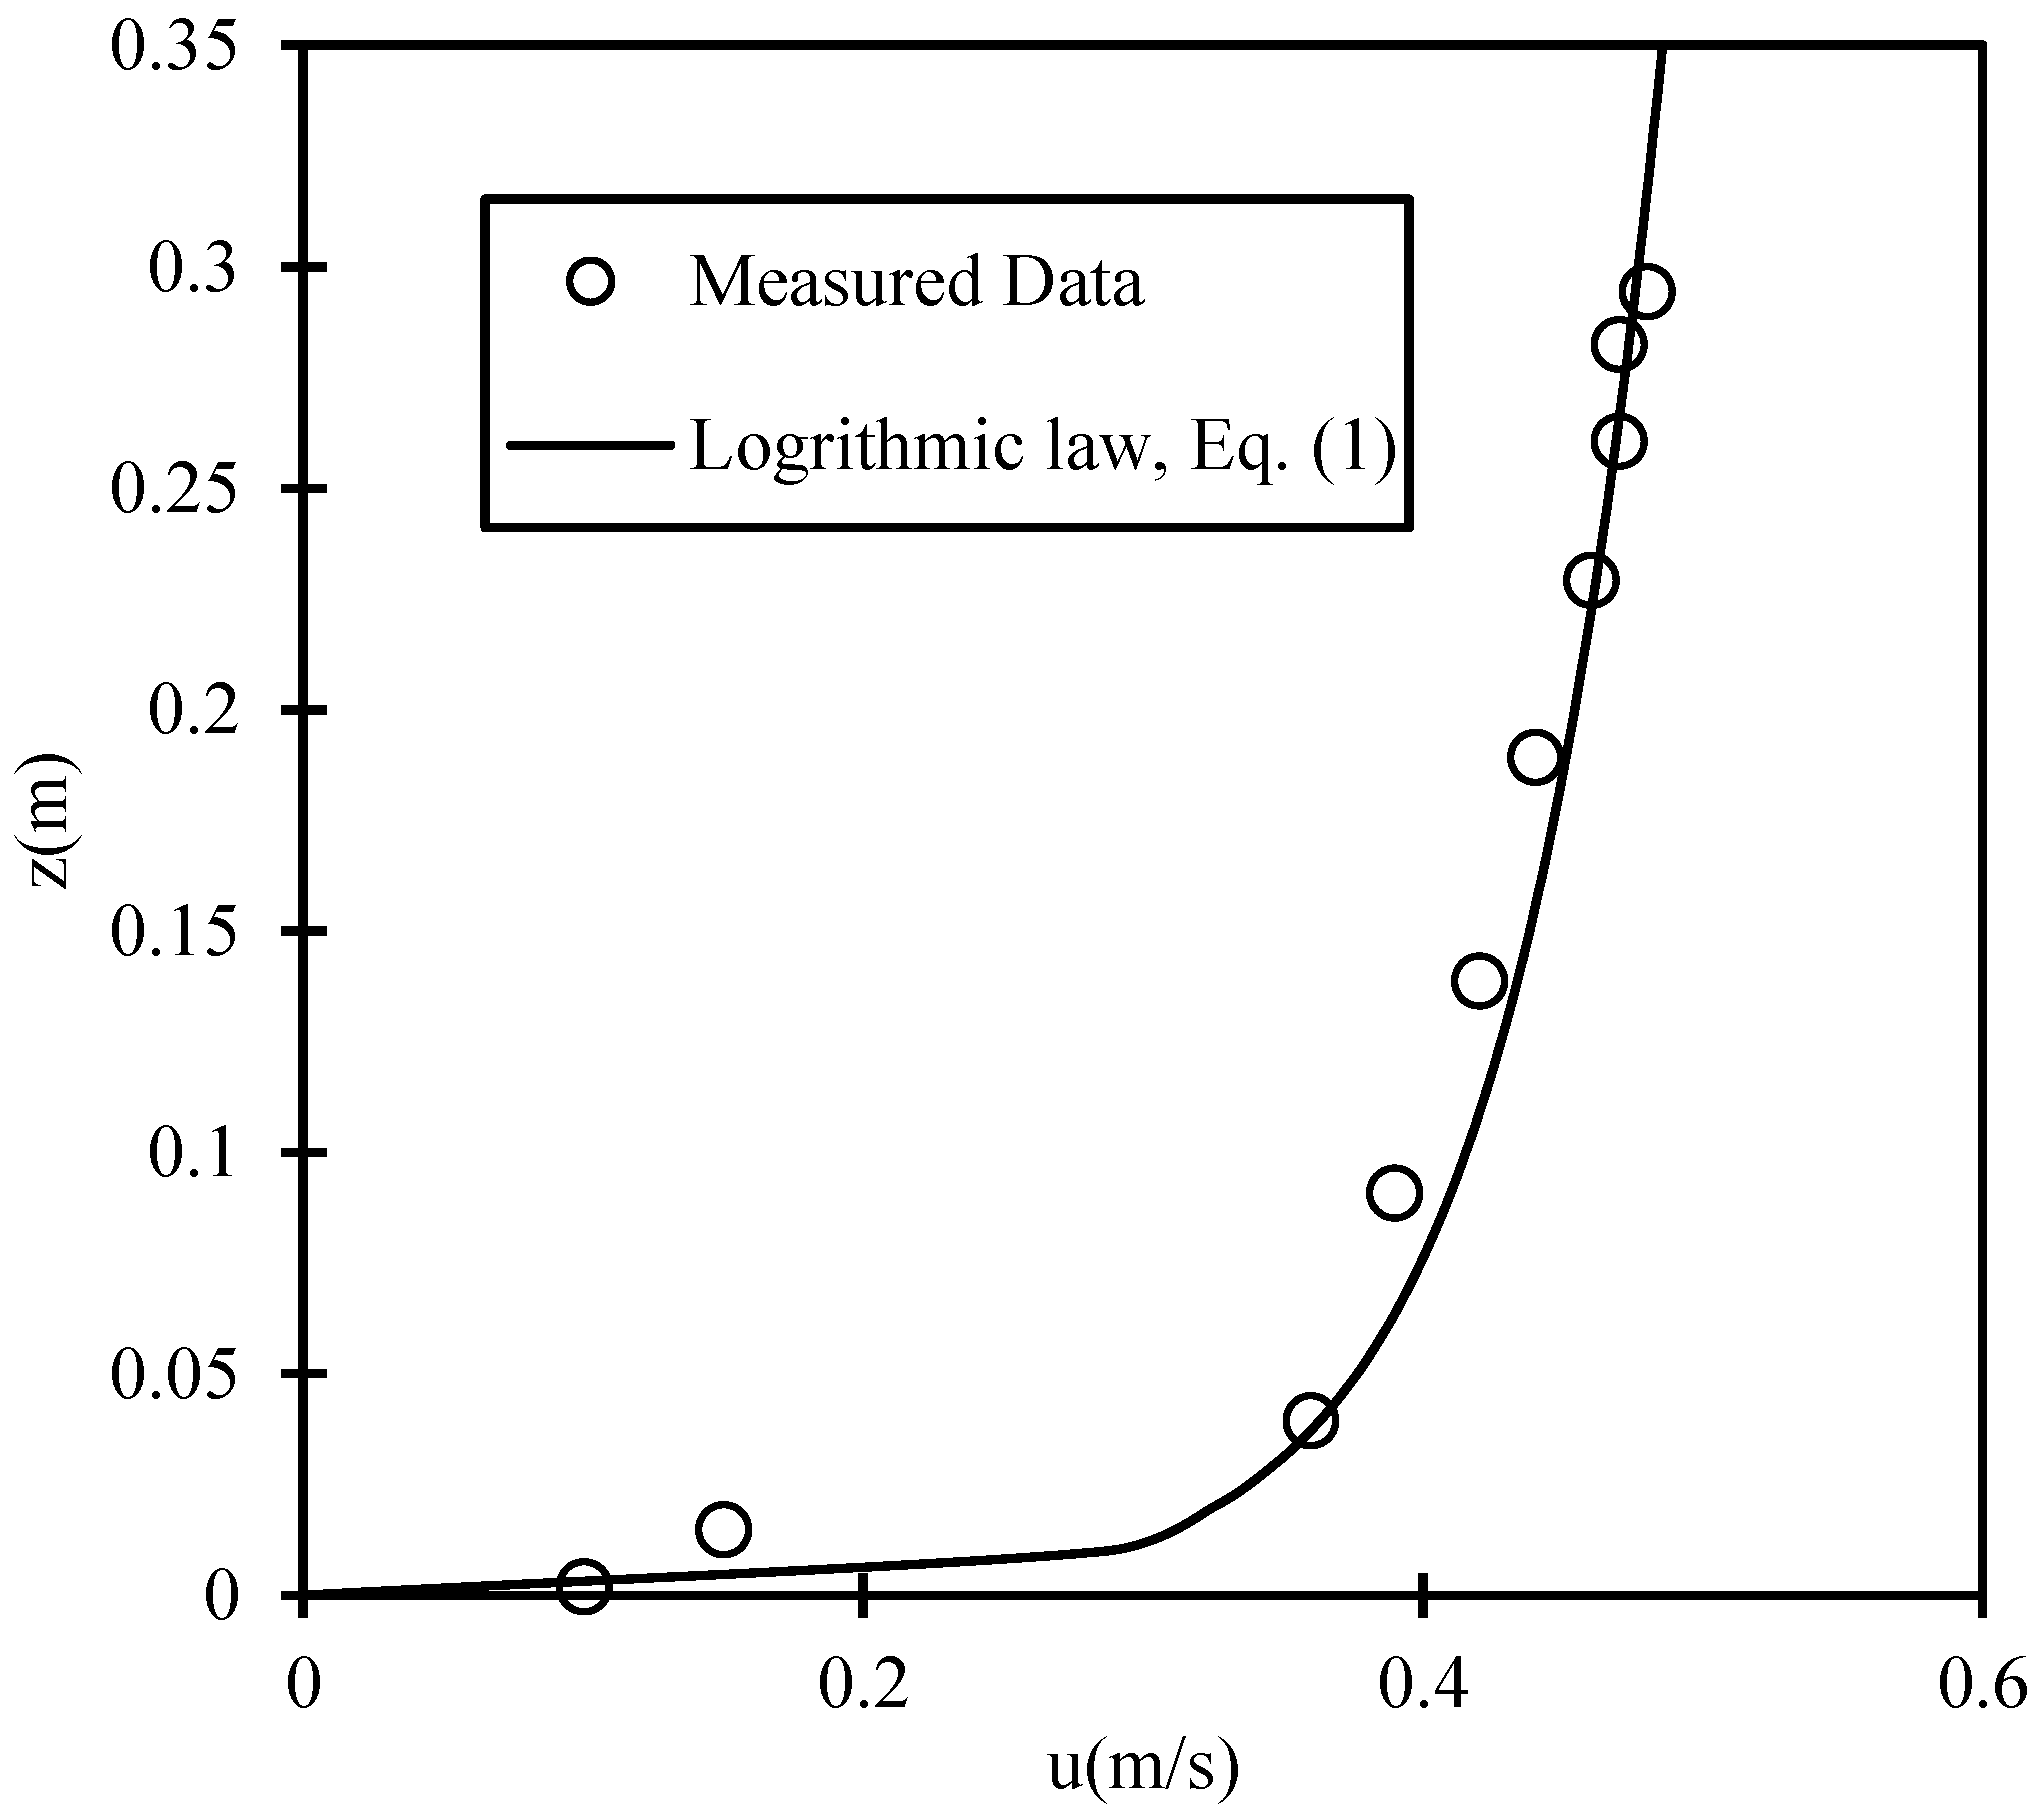
Experimental Parameters listed in Table 2 are constant, while the arrangement angle β and spacing G varies. Incoming flow velocity is recorded using an Acoustic Doppler Velocimeter (ADV), and a depth-averaged profile is plotted which is found to be in agreement with the logarithmic profile. ADV was placed above the sand bed right before the structure to record the approach velocity precisely. Figure 2 displays the measured average velocity at various locations and the velocity profile based upon the logarithmic law given in Equation (1).
where u(z) is the horizontal velocity in the x-direction, z is the height above the flat sand bed, z0 represents the roughness length, and it is related to the median sand particle diameter by z0 = d50/12, is friction velocity defined as , and κ = 0.4 is the Von Karman Constant. Value of = 0.023 m/s makes Equation (1) and the measured velocity aligned. Average velocity over the entire depth (0–0.38 m) is found to be U = 0.373 m/s. The shield parameter can be calculated using Equation (2).
where is the seabed shear stress developed due to water flow, it depends upon the friction coefficient Cd, and it is related to each other by where U is the depth-averaged velocity and . Using these equations, the value of for given flow conditions is 0.033. The ratio of to is 1.1 where is calculated using the empirical relationship proposed by [51]:
where the non-dimensional sand particle diameter and ν is the kinematic viscosity.
Figure 2.
Velocity distribution along the water depth and logarithmic profile fit.
To understand the scour around two CPs fully, a total of 10 experiments based upon a full factorial design of two independent variables having three levels each, along with 1 control experiment were conducted, with each test lasting for 6 h. The proposed experimental design can yield statistically significant results and will capture the main effect of each variable fully. Models are made using acrylic cylinders with a foundation diameter of 100 mm and pile diameter of 50 mm, causing a maximum blockage of 20% based on the diameter of the foundation and 10% based on the diameter of the piles when two models are placed in SBS orientation. The sand used in this study is the same as that used by Mamoon et al. [52] with D/d50 ratio of 137, which is within the suggested range proposed by Melville and Chiew [53]. Within the capability of the flume, the G/D value is kept between 1 and 3, inclusive for all the arrangements to keep the blockage minimum and avoid contraction scour due to flume walls. All the models are emergent, and the total height (h) of the CP is equal to the water depth, resulting in a submergence ratio (h0/h) of 1. Experiments are conducted at of 1.1, which is slightly above the critical value. The test duration was 6 h and equilibrium scour depth was not attained as the aim of this study was to assess the effect of spacing and orientation only for CPs with exposed foundations, which has not been studied earlier. Under the same experimental conditions and similar pile geometry, only the Non-Dimensional Spacing (G/D) and arrangement angle (β) will affect the scour evolution during the 6 h test. Although final maximum scour depth will be different for a longer test, the effect of geometrical parameters and pile interaction upon scour evolution can be observed. Experiments are conducted in steady current conditions, as it is the simplest flow condition for a baseline study to investigate the scour evolution; it will be less complex compared to scour under other flow conditions, which are variable and unsteady in nature.
Scour depth along the sand/surface interface of each CP model is recorded through grids pasted on the inner side of the foundation and readings are taken using an Insta 360 GO3 camera. A total of 8 grids with an accuracy of 1 mm are placed at an equal separation of 45° around the foundation of each pile (see Figure 1c). Once the test is completed, the topography of the bed is scanned using a high-resolution 3D LED scanner (Model: EinScan Pro 2X Plus) with a resolution of 0.05 mm. Scanning is carried out at the end of 6 h once each test is completed and water is completely drained. Table 3 includes the details and major results of each experiment.
Table 3.
Test matrix for scour of CPs in different arrangements, where α is the ratio between the maximum scour depth Sm to the maximum scour depth Sm,CP of single CP, MSD = maximum scour depth, β = arrangement angle (0° for SBS, 45° for SA, and 90° for TA), θ = radial angle, Sm/D = maximum non-dimensional scour depth.
The following experimental procedure was adopted:
- Models are placed in the required arrangement, and the sand bed is smoothed out evenly.
- Water is filled in the flume initially at a very low velocity to ensure the sand bed will not be damaged. The discharge can be increased after the water depth reaches 10 cm, but it still needs to be sufficiently low so that scour will not start.
- Once the desired water depth is attained, the flow rate is slowly increased to the target value, allowing for scour to initiate.
- Bed level readings are taken 28 times during the complete test, while most of the readings are taken in the first 3 h of the test to ensure the recording of fast sediment transport in the initial scour phase.
- Once the test is completed, the water is drained slowly without disturbing the scour hole and the bed is scanned for 3D topography.
3. Results and Discussion
3.1. Validation of Single CP Results and Comparison with Other Studies
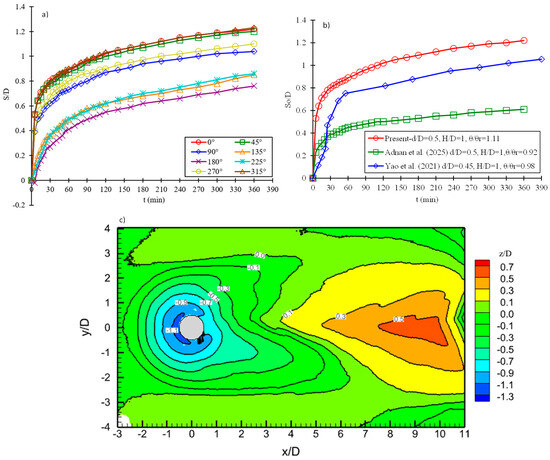
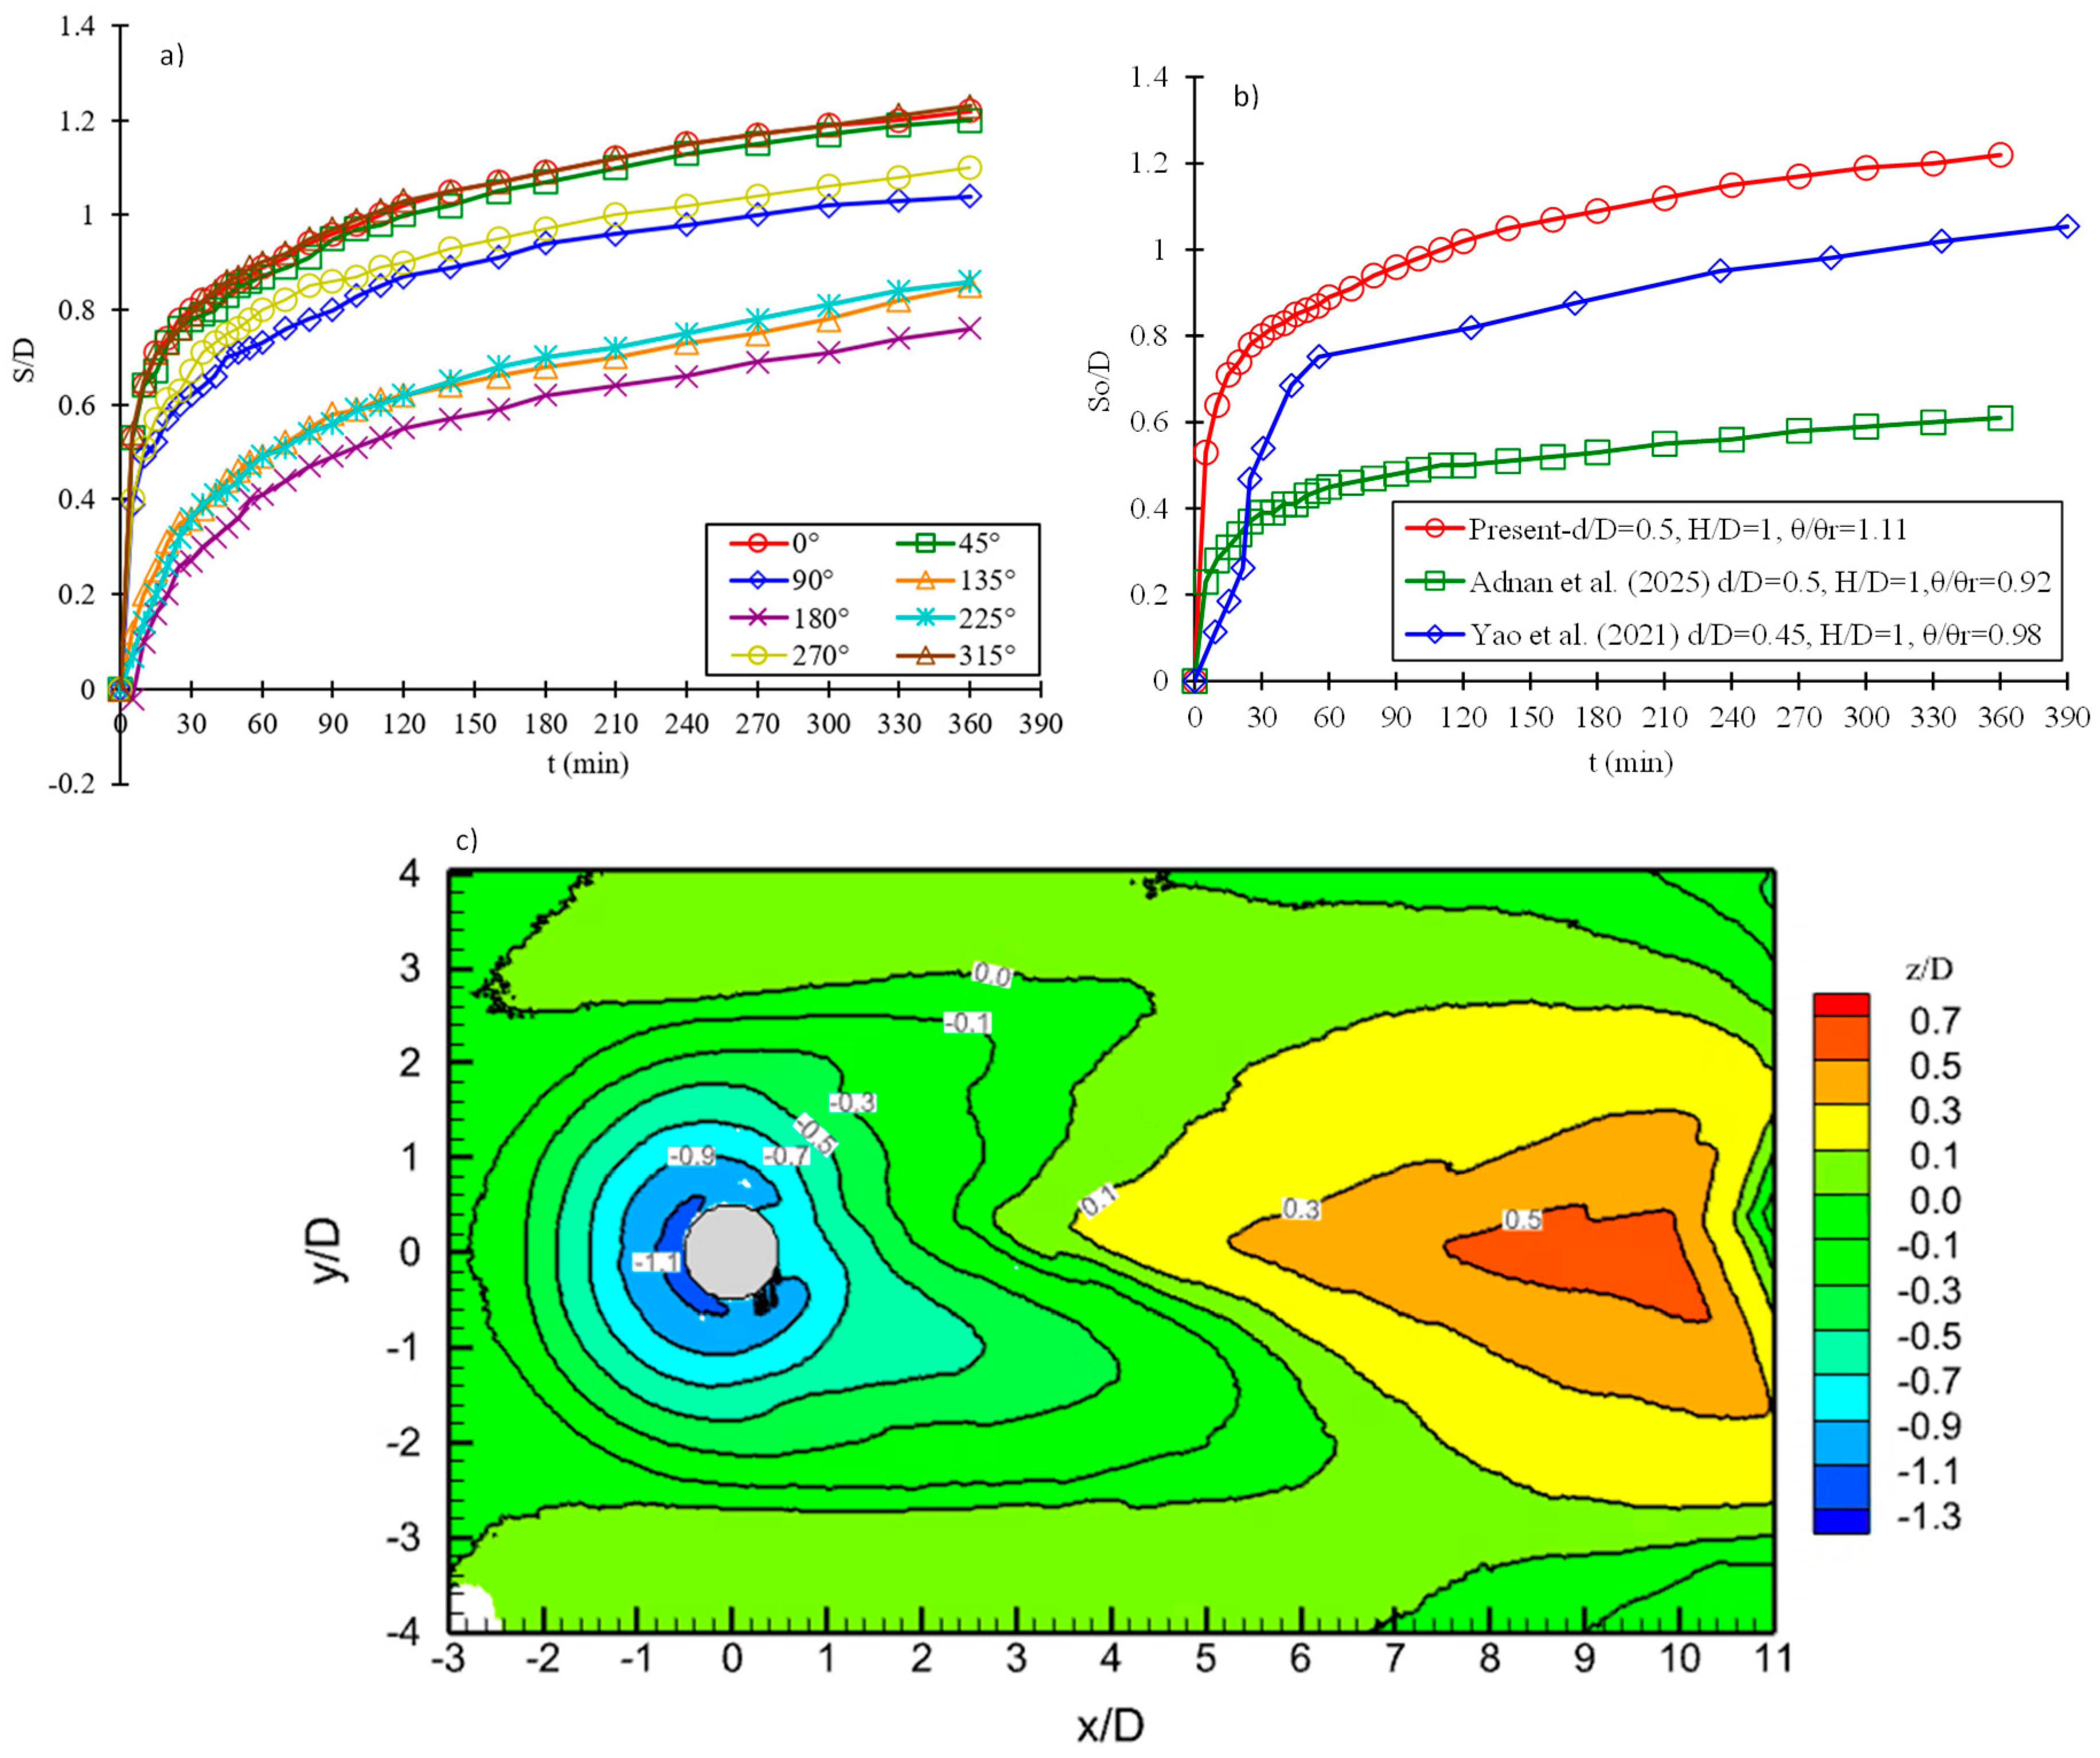
To validate the setup parameters and scour process, a control experiment was conducted around a CP. Experimental results are shown in Figure 3. It is evident from the time history, at the most upstream point of the CP, i.e., θ = 0° (Figure 3a), that the scour increases rapidly in the initial phase, slows down with time, and tends to reach a constant value at the later stage of the trial. The maximum non-dimensional scour depth (Sm/D) attained is 1.22 at the end of the test. Figure 3b is the comparison between the present experimental data studies conducted on CP by Adnan et al. [49] and Yao et al. [46] at θ/θcr ratios of 0.92 and 1.00, respectively. Sm/D value is highest in the current study as compared to the other studies with similar geometrical ratios. Yao et al. [46] reported that the maximum Sm/D occurs at θ/θcr close to 1. The Sm/D value in the current study is 5% greater than the value recorded by Yao et al. [46]. Scour development in the current study follows the same trend as observed in the other two studies, i.e., a rapid start, followed by a steady growth, and finally reaching a constant value depending on the total test time. Almost 75% of the total scour occurred in 20% of the total test time, showing a rapid initial scour rate. A similar growth rate can be observed in the other two studies, which confirms that the temporal evolution of scour in CPs (foundation placed above the sand bed) follows rapid and severe initial scour due to the flow obstruction caused by the projected foundation width. The maximum Sm/D occurs at the most upstream point, showing that the horseshoe vortex (HV) dominates the scour process. In all these studies, the rate of scour is very sensitive to the change in θ/θcr when the ratio is close to 1.
Figure 3.
(a) Temporal development of scour at 8 measuring locations around the CP; (b) comparison of single CP result with other studies on CP [46,49] (c) bed topography at 6 h of scour.
Like the most upstream point, scour measurements are taken around the circumference of the pile foundation at eight radial locations, i.e., 45° apart. Figure 3a shows the temporal development of scour at each measuring location. From the time history, it can be concluded that the continuous sediment movement takes place at each location with maximum sediment removal in the frontal area, intermediate scour progress on the sides, and minimum scour on the lee side. Overall radial distribution of scour is symmetric about the central axis along the flow. From the bed topography, the highest sand deposition occurred approximately at 8D from the cylinder center. On the contrary dune formed at approximately 2.5–3D when θ/θcr is 0.92 [49].
3.2. Temporal Development of Scour in Each Orientation at θ = 0°
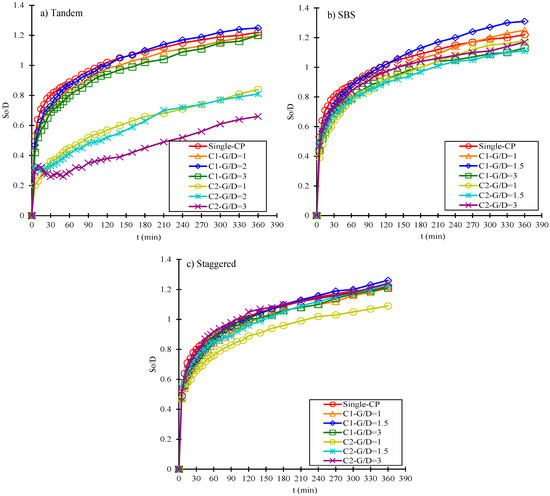
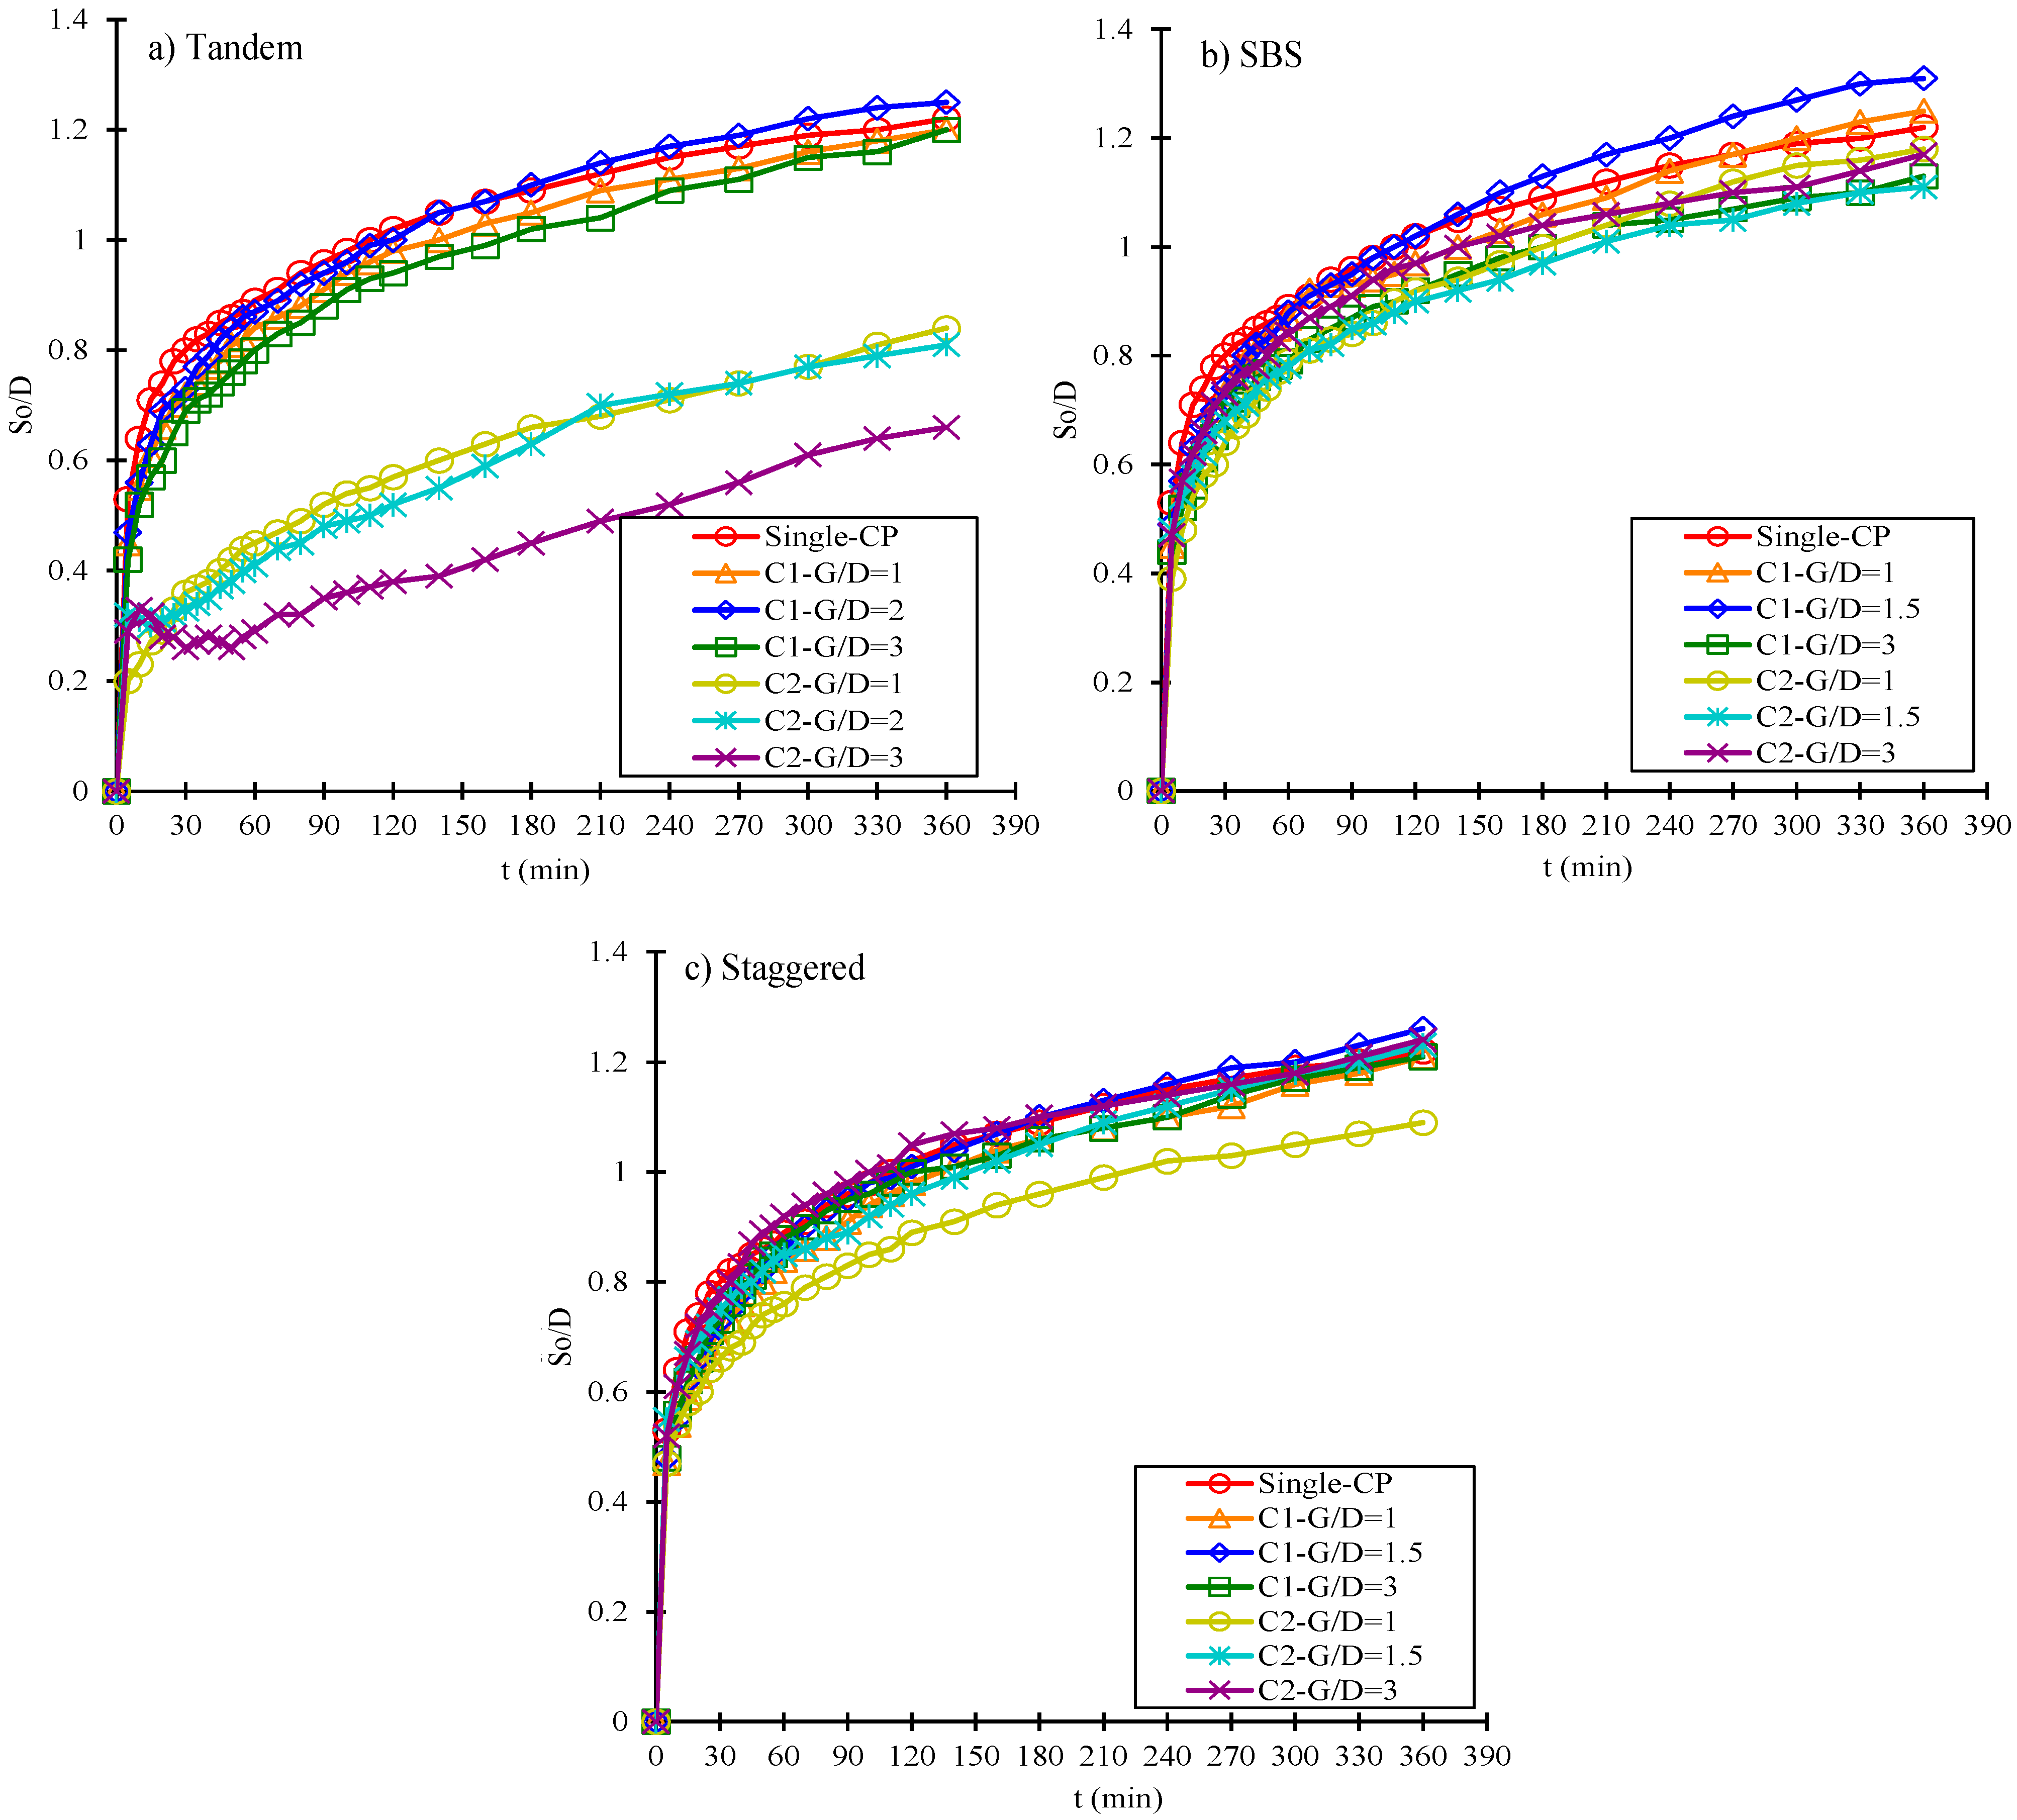
Individual time histories of each pile at the most upstream point (θ = 0°) are presented in. For all the arrangements, scour depth shows a rapid start, followed by a steady phase. This resembles the scour around the single CP case. It can be seen as a typical evolution of scour due to the HSV-dominated process. Initially, there exists a strong downflow, and primary HSV causes intense sediment transport. With the development of the scour hole, the strength of HSV decreases gradually, resulting in a steady growth of scour. In Figure 4a, at G/D = 3, an additional flow interaction can be inferred, which caused a sudden drop in scour depth in front of C2 around 15–60 min. Due to larger spacing, an area of reduced shear stress is formed in front of C2, leading to sand deposition. Once HSV strengthened, scour started again at C2 following a natural trend.
Figure 4.
Temporal development of scour at the most upstream point of each CP.
In tandem arrangement, the scour depth at the rear CP is markedly low due to the flow modification caused by the front CP. At first, front CP blocks the incoming flow and creates a wake zone at the lee side with lower velocity, turbulent intensities, and weak HSV in front of the rear CP. Based upon the spacing between the piles, the scour process slows down at the rear CP and the maximum scour depth decreases.
In the staggered arrangement, the flow interaction differs. At G/D = 1.5 and 3, the most upstream point of C2 is outside the wake region of C1 and directly faces the incoming flow. Therefore, no velocity reduction or weakening of HSV is expected, leading to a scour depth almost equal to C1, and no significant shielding is visible. However, at G/D = 1, C2 partially lies in the wake region of C1 and in partial protection, which caused a reduction in scour depth at C2.
3.3. Temporal and Spatial Development of Scour in Tandem Arrangement
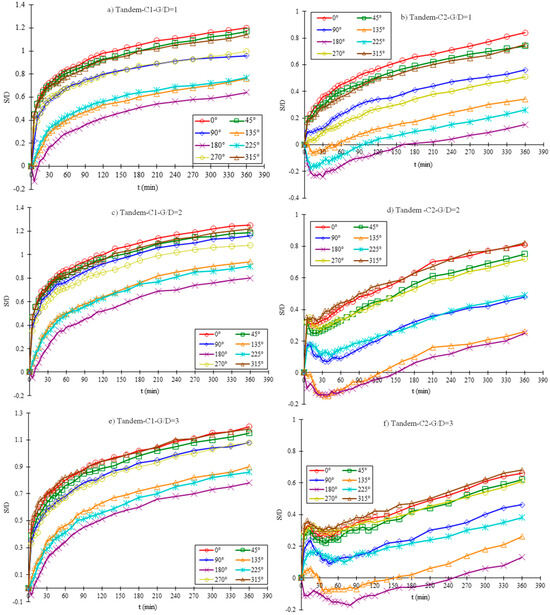
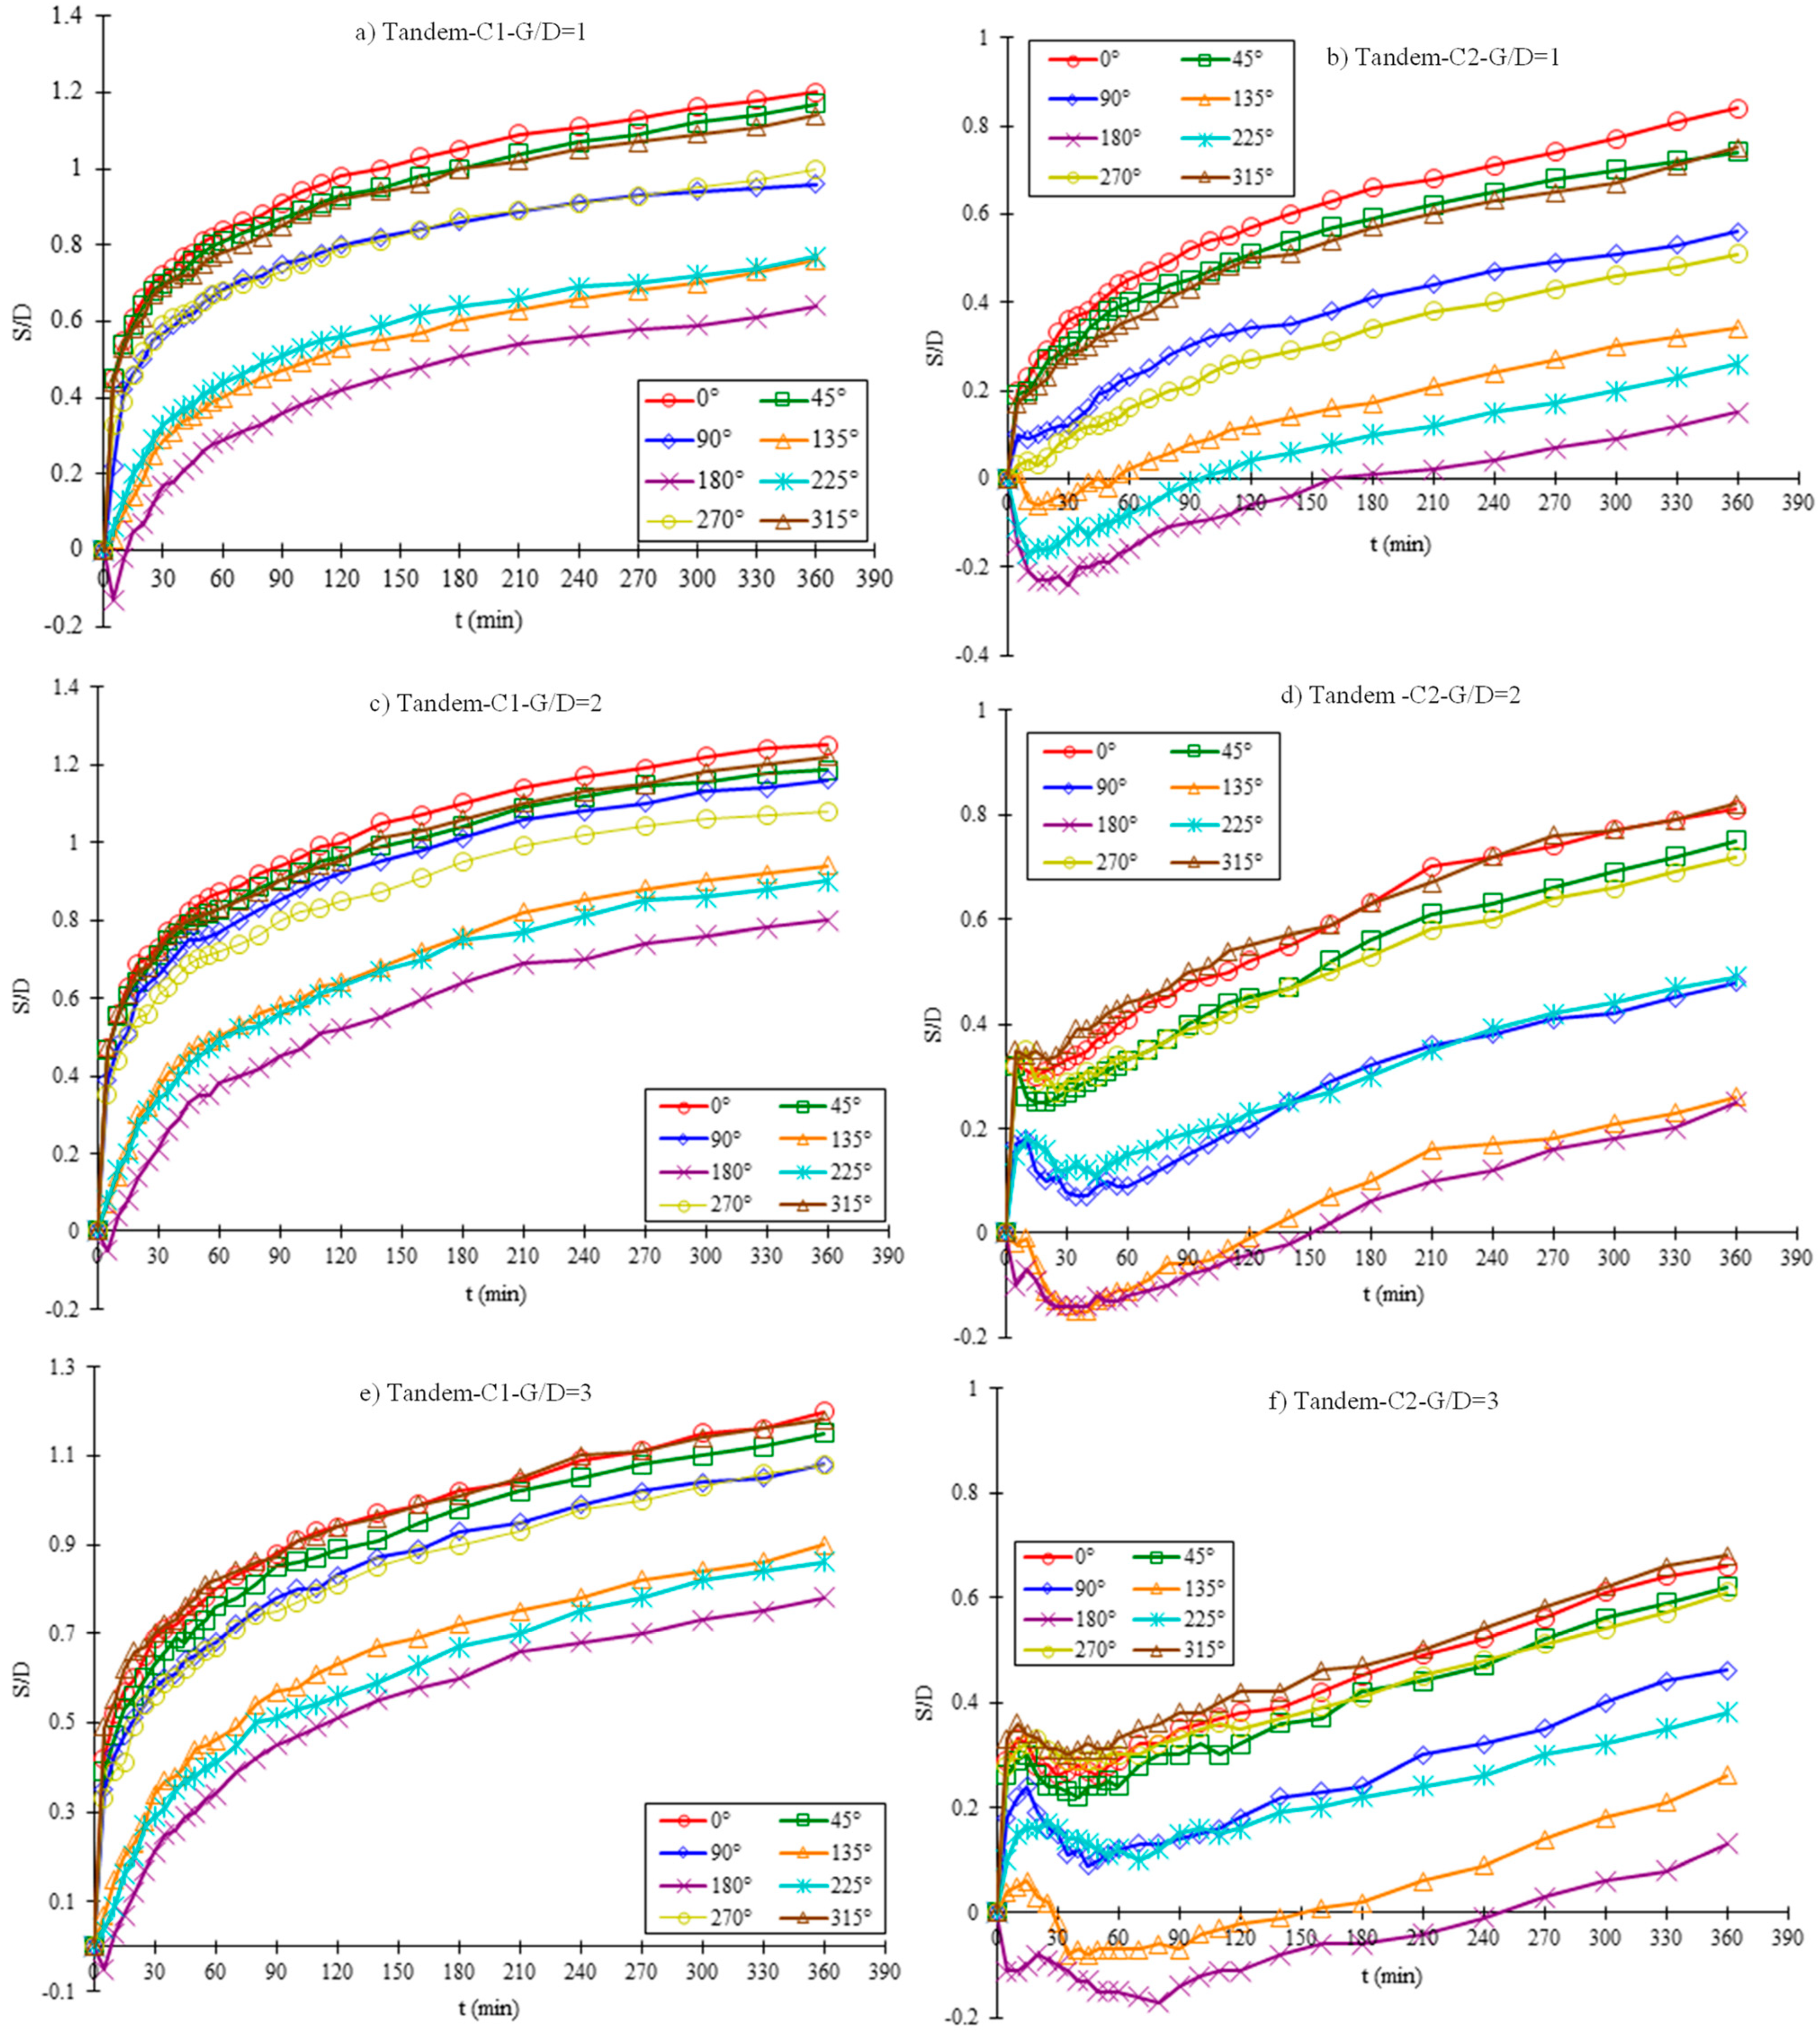
A detailed temporal development of scour around the foundation of the CPs for the tandem arrangement is presented in Figure 5. Negative scour depth represents sediment deposition, while positive values indicate erosion. Although in the current study, the equilibrium scour depths are not attained as tests are not run for longer periods, the effect of G/D on scour depth can be observed clearly. The upstream and downstream piles are referred to as C1 (front pile) and C2 (rear pile), respectively, for tandem cases. Overall, the temporal development of scour at C1 in all the cases resembles the single CP case except at the most downstream point θ = 180°, where in each case there is a slight deposition initially.
Figure 5.
Temporal development of scour at the measuring points of CPs in the tandem arrangement.
In the tandem arrangement, the most downstream point θ = 180° of the C2 experiences deposition for a long period of time; the scour at this point does not occur until t = 160 min, 150, and 240 min for G/D = 1, 2, and 3, respectively. For G/D = 1, the sediment coming from the scouring of C1 got deposited at the rear side of the pile and washed away, eventually leading to scour at those locations. For G/D = 2 and 3, the sediment scoured from C1 got deposited all around the C2 at the early stage and eventually washed down the stream. A weaker horseshoe vortex still exists in front of C2, and this is the reason that initial deposition does not exist in front of C2. The scour depth of the most upstream point of C2 (θ = 0°) slows down and increases, instead of increasing continuously, because the moving sand dune generated from the C1 gets deposited and slows down the scour at C2. The slowing down of scour of the downstream pile was also reported when the two piles are uniform [20] and the two piles are very short and underwater [52]. For G/D = 1, scour depth of the most upstream points for both CPs increases with time without slowing down because the very close proximity between the two piles pushes the sand dune from C1 to move quickly through C2. The slowing down of the scour of C2, due to the shielding effects and the effects of the sand dune from C1, has been numerically proved by Liu et al. [10]. The time for the scour of C2 to reach the equilibrium scour depth will be longer as compared to C1. Based on the above discussion, C1 needs to be protected more than C2, because the development of scour in the early phase carries great importance, as most of the scour occurs in this early period.
For G/D = 1, maximum scour occurred at the most upstream point of each pile, i.e., θ = 0°. For C1 at G/D = 1.5 and 3, the MSD occurred at the same point, but for C2, maximum scour occurred at θ = 315°. Overall, the development of scour at the front point of C1 in all the tandem arrangement cases is equivalent to a single CP case with a slight difference of 1–2%. Conversely, for C2, a reduction of 32%, 34%, and 46% in scour depth for G/D = 1, 2, 3, respectively, was observed. Placement of C1 reduces the velocity at the downstream side, which causes a lower shear stress near the bed and in front of C2, ultimately causing a lower scour. A higher reduction occurs at a certain gap ratio (2–4D) and scour reduction at C2 decreases above and below this value [26]. For closer gaps, the wake reattachment point shifts and near-bed turbulence increases, which stop the scour reduction at C2 [54]. It emphasizes that the reduction in the scour of the rear pile is maximum at an optimal value of G/D, and decreasing the spacing even further increases the scour at the rear pile [33]. At closer spacing, the velocity reduction zone in the wake of C1 merges with C2, which reduces the Velocity Deficit Ratio (VDR) and shear stress reduction in front of the rear pile, causing a deeper scour.
Based upon the three flow regimes present between SPs in tandem arrangement, depending upon the G/D ratio, Sumner [2] proposed three flow regimes that exist between two piles in tandem arrangement and result in combined, unified, and individual scour holes around the piles. Currently, for G/D = 1, scour holes are in the unified scour hole regime and scour pits are merged with each other, while for G/D = 2 and 3, a combined scour hole regime is present where scour pits share common scour volume which lies between the piles. The threshold value of G/D at which piles start to behave as a single pile is not consistently reported in the literature due to the different experimental conditions. Although a shielding effect is present for all G/D values, for the current study, the value of G/D = 2 can be treated as a threshold value for the separation of scour hole regime. Different researchers observed different values ranging from 3.5 to 11 [55,56] depending on the flow conditions. In the current study, both the CPs started to behave partially independently at G/D = 2 when scour holes started to separate. Overall, C2 has lesser scour for all G/D values as compared to C1 due to the sheltering effect. For C2, at G/D = 1, till 120 min of the test, measuring locations at the rear side, i.e., θ = 135°, 180° and 225°, etc., experienced sediment deposition and scour started after 2 h when the incoming flow removed the sediments from these locations towards the downstream side. Once this early phase ends, continuous sediment removal takes place at these points.
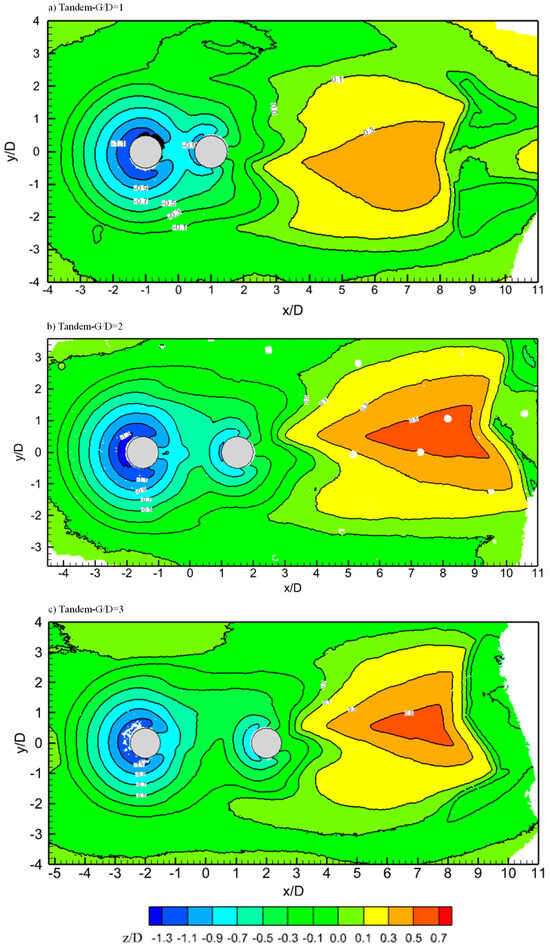
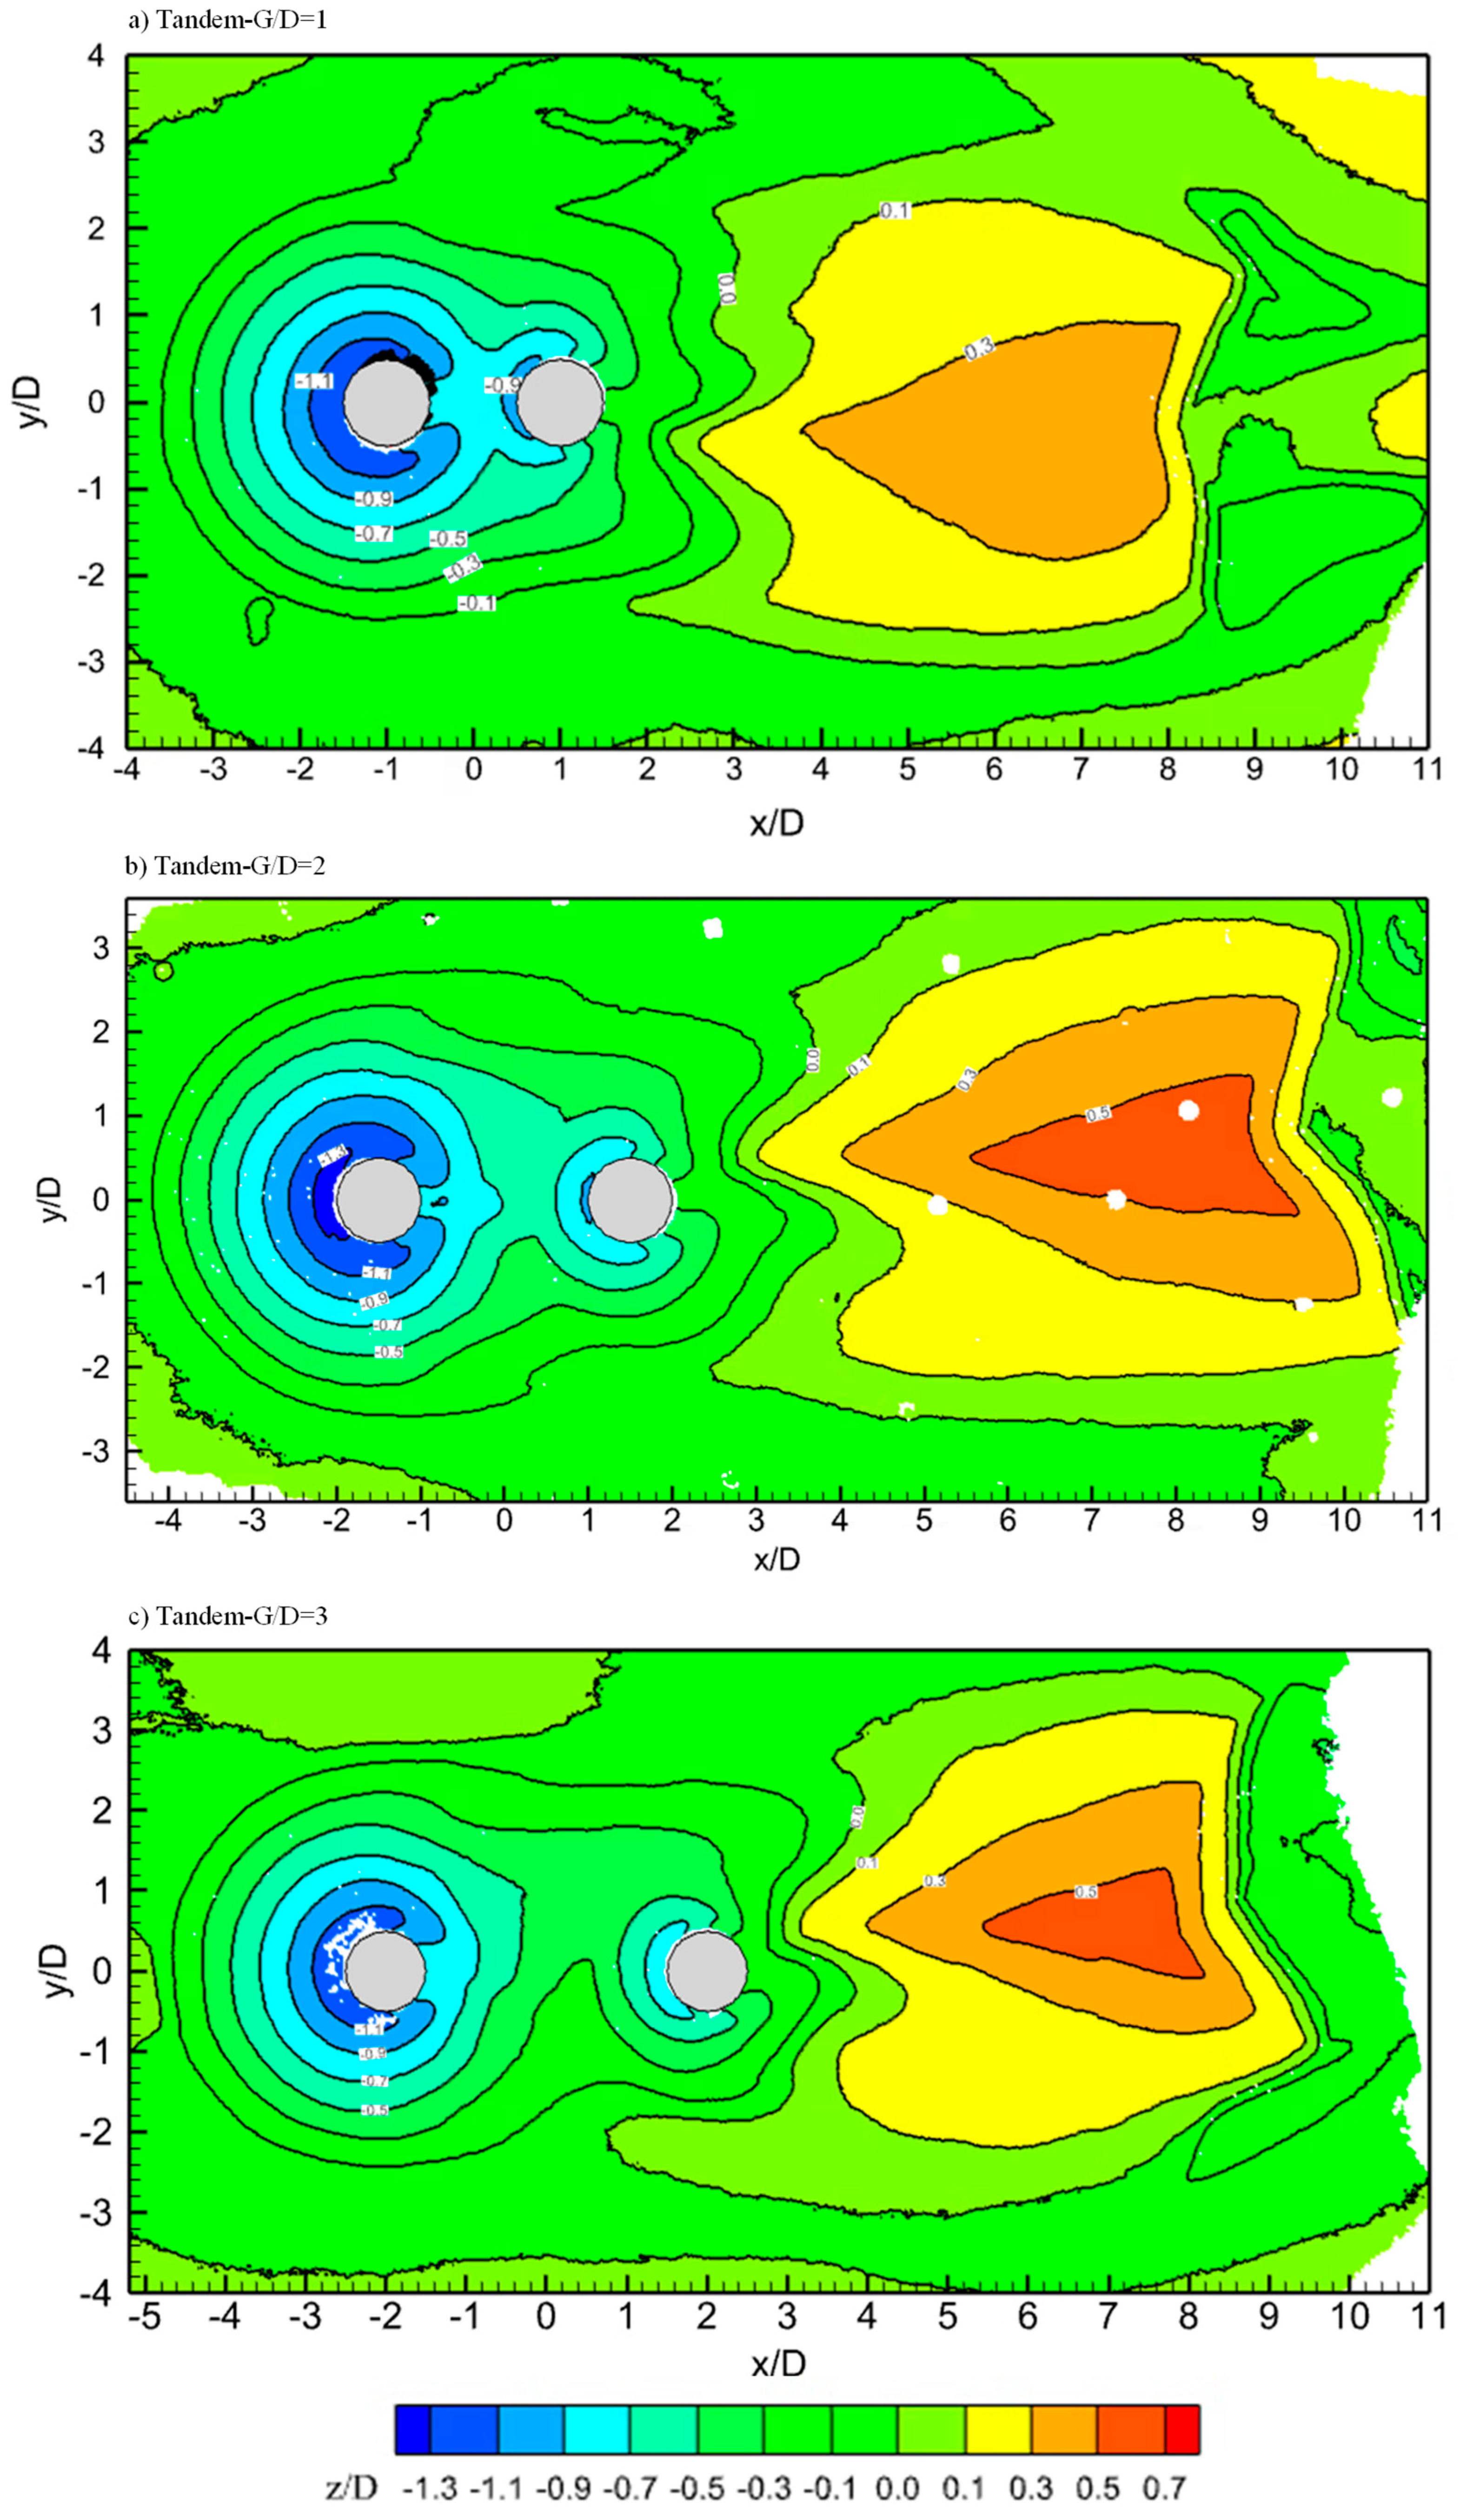
Three-dimensional scanned bed topography after the test completion is presented in Figure 6. The maximum scour depth for both the piles is at the most upstream point of each CP in the tandem arrangement. At 6 h, a dune is formed downstream of C2 and it was initially symmetric with the y/D = 0 line but became asymmetric at t = 6 h. It was found that once the dune biases to one side of the y = 0 line, the degree of bias increases with time. In all three gaps, the scour in the middle of the gap is shallower than the scour in front of C2, indicating that a horseshoe vortex exists in front of C2 and contributes to the scour, but not as much as that to C1. Based upon the classification of uniform flow past two uniform tandem cylinders proposed by Sumner [2], flow is in the extended body regime at G/D = 1 and reattachment regime at G/D = 2 and 3. In all three regimes, the flow between the two cylinders is very weak. Significant scour is found in front of C2, although the scour depth is shallower than C1. Even at the smallest G/D = 1, two distinct scour holes are found with a sand ridge being a boundary between them, indicating that the two CPs cannot be treated as a single body exactly within 6 h. The height of the sand ridge in the gap decreases with the decrease in G/D.
Figure 6.
Scanned bed profiles at 6 h of scour in the tandem arrangement.
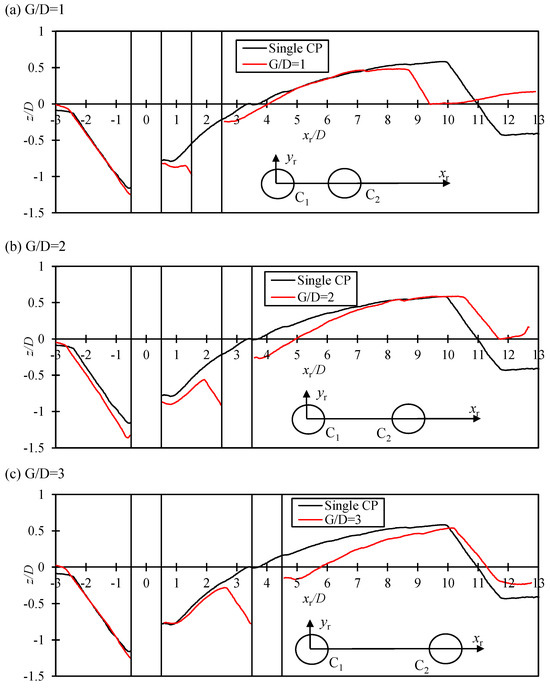
Figure 7 shows the scour profile along the y = 0 symmetric plane for the tandem arrangement, where xr is the coordinate relative to the center of C1. There is a dune between the two piles, for G/D = 2 and 3, and this dune slows down the scour of C2 [37,57]. Variation in scour depth and deposition is similar as discussed through time evolution. Entrapping of sediments between the piles, which causes higher turbulence, can be seen at G/D = 1 and 2 cases along the center line, while for G/D = 3, the height of the dune formed between the piles is lower.
Figure 7.
Scour profile along the symmetry line (y = 0) in the tandem arrangement at 6 h of scour.
3.4. Temporal and Spatial Development of Scour in SBS Arrangement
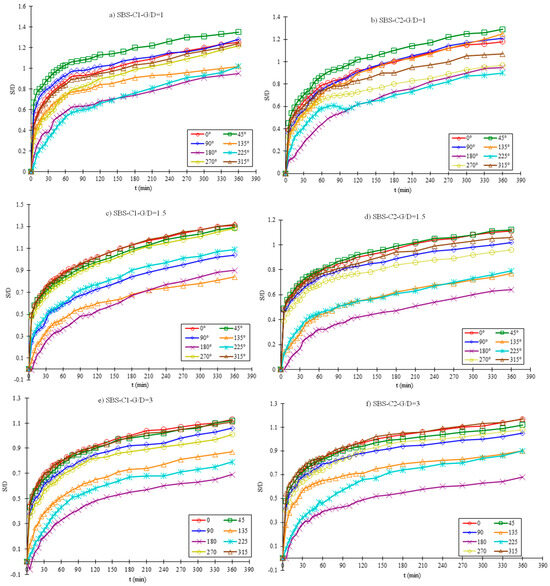
Detailed time histories at each measuring point in the SBS arrangement are presented in Figure 8. In all the tests, the scour depths of the two CPs are quite similar, as C1 and C2 are placed laterally adjacent, so we are treating C1 and C2 equally due to the symmetry of the configuration. Both the piles are fully exposed to the incoming flow with stronger HSV formation and no protection effect. Strong deposition is not seen around either CP because both CPs are fully exposed to the incoming flow and high velocity washed the sediments away towards the downstream side.
Figure 8.
Temporal development of scour at the measuring points of CPs in the SBS arrangement.
At G/D = 3, spacing is large enough and interaction between the piles is negligible because each pile experiences a flow which is like a field around a single pile. However, at G/D = 1 and 1.5, the average scour depth of the two CPs is greater than a single CP due to the blockage effect caused by the proximity, which enhanced the scour at the inner space between the piles. The scour around the inner surface of the two CPs (θ = 45°, 90° 135° for C1 and 225°, 270° and 315° for C2) is deeper as compared to a single CP because of the flow acceleration through the gap. A closer gap causes HSV compression and intensifies vortex activity, causing greater sediment removal.
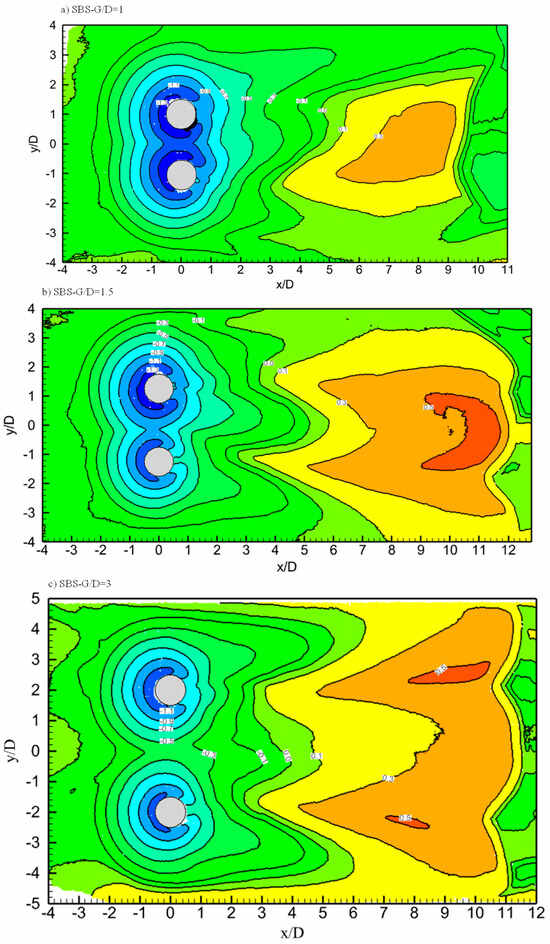
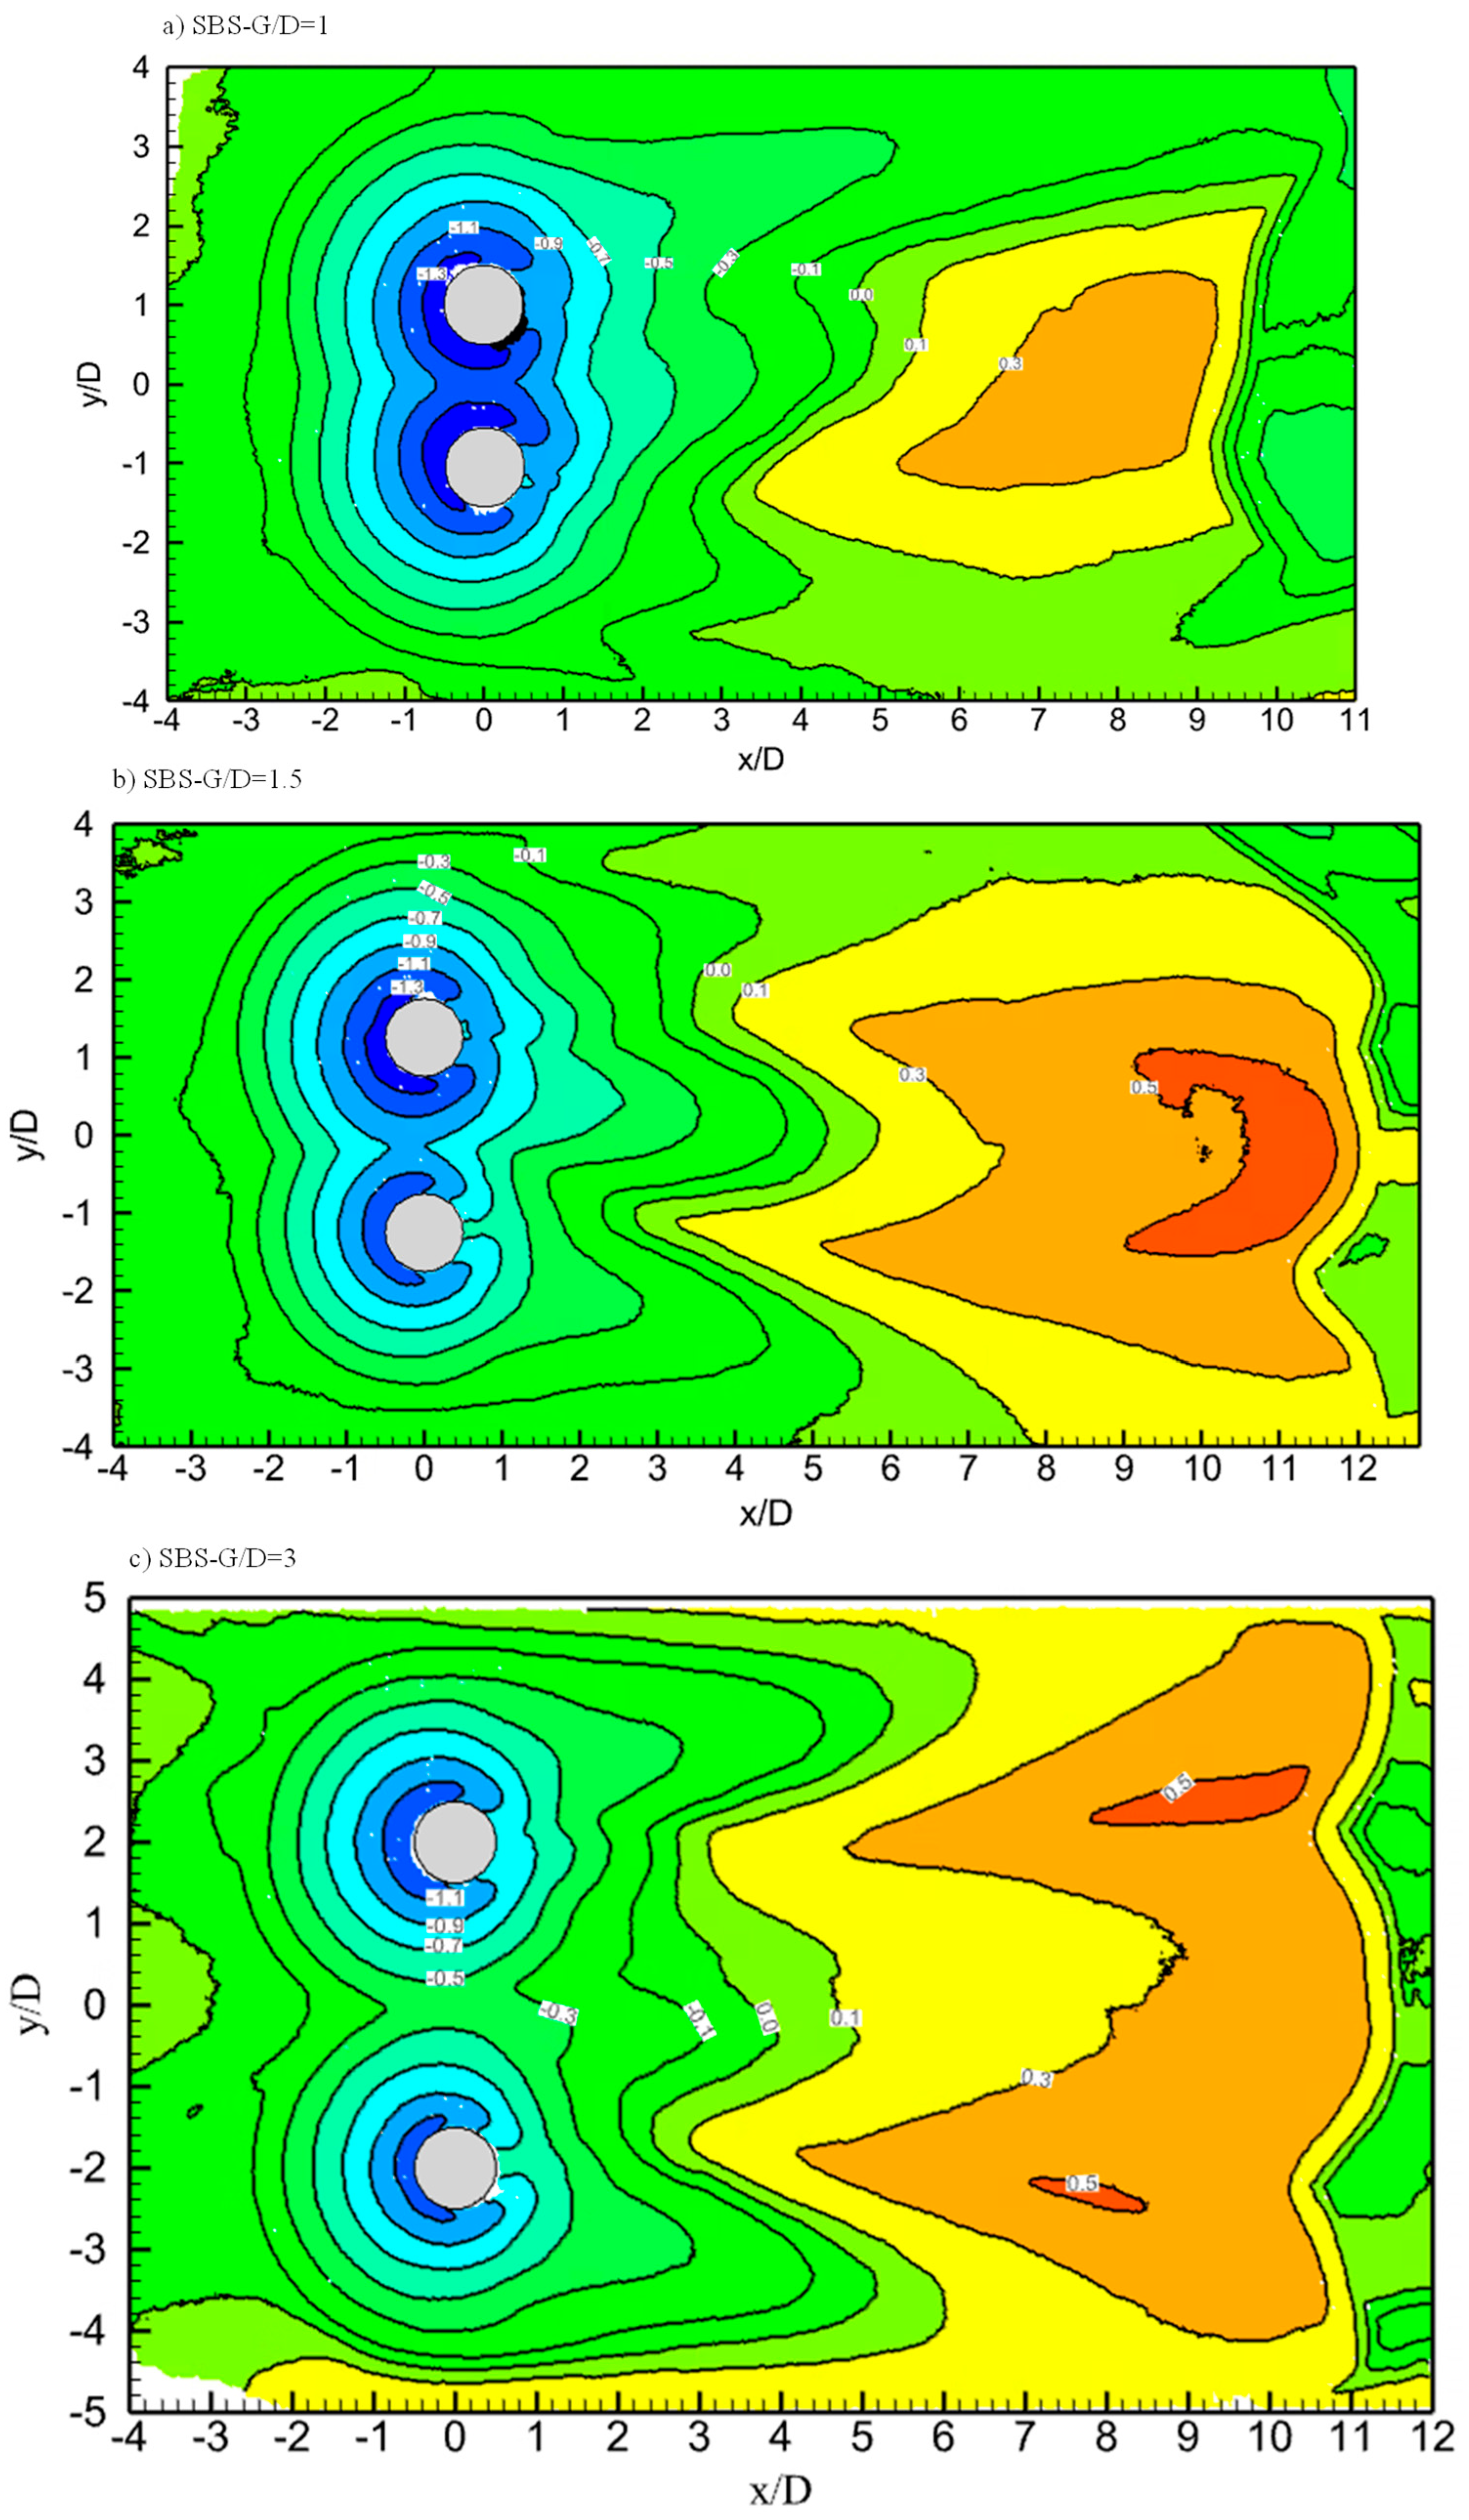
Although scour around both the C1 and C2 is expected to be symmetric, for G/D = 1.5, the scour depth around the CPs is asymmetric, which likely arises from experimental variations or minor flow non-uniformity in the flume and flow biasness, which happens at closer gap ratios [58]. Bed topography (Figure 9) of the SBS arrangement showed a gradual shifting of pile interference from merged to independent scour regimes with increased spacing. At G/D = 1, both scour holes are fully merged, forming a continuous eroded zone between the piles. At G/D = 1.5, this interaction weakens, although influence is present. By G/D = 3, scour holes are fully separated, and each pile behaves as an isolated CP. Correspondingly, a unified dune is formed downstream at approximately 8–10D from the pile center, whereas at G/D = 3, two separate dunes are formed behind each pile wake region. Independent scour behavior started at G/D = 3 with no effect of spacing between the piles. When C1 and C2 are very close to each other at G/D = 1, scour holes are merged with sufficient scour depth in between the piles. This effect started to reduce at G/D = 1.5; at G/D = 3, scour holes became independent, and each pile was behaving as a single CP.
Figure 9.
Scanned bed profiles at 6 h of scour in the SBS arrangement.
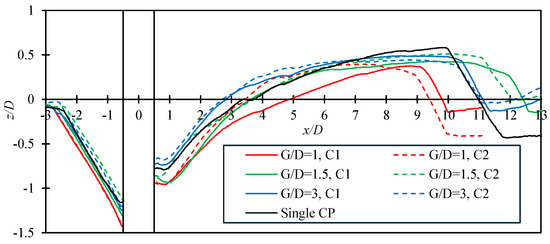
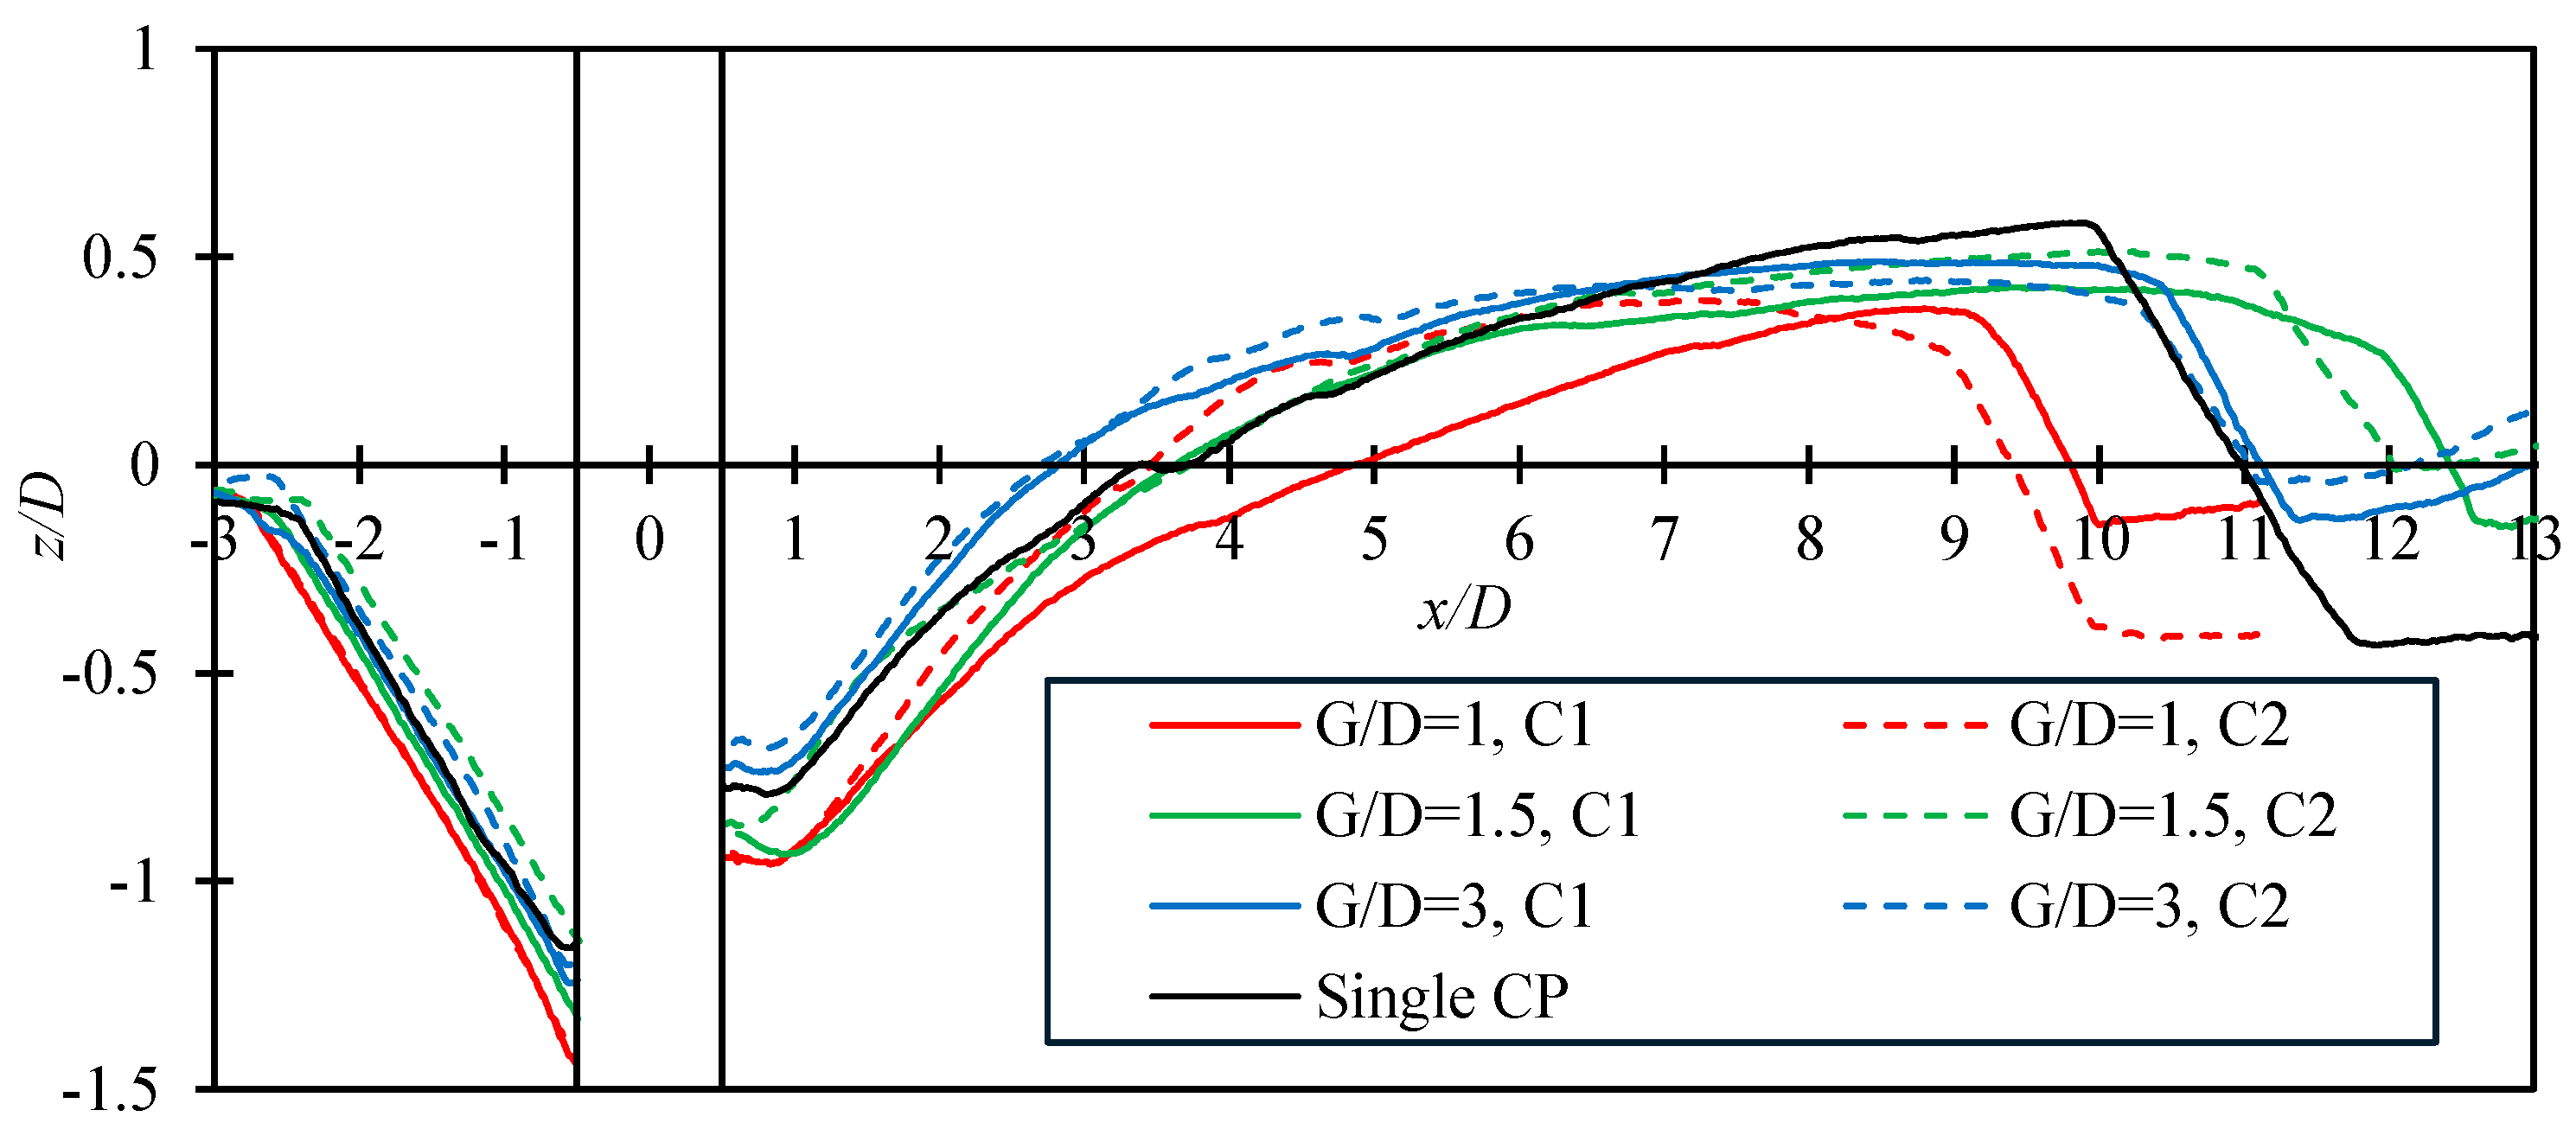
For G/D = 1 and 1.5, a unified deposition occurred at approximately 8–10D of spacing from the pile center, while for G/D = 3, two separate dunes were formed. Figure 10 shows the sediment pattern along the symmetrical lines of both the piles. The erosion and deposition patterns around C1 and C2 are nearly identical. The height of dunes and extent are comparable to a single CP with minor variation, which can be attributed to flow effects caused by the gap. Bed profiles in the SBS arrangement are characterized by two SBS scour holes divided by a sand ridge between them. G/D = 1 has the deepest scour and G/D = 3 has the shallowest. When the scour is dominated by bed load, deeper scour corresponds to higher deposition according to the conservation of sediment mass [59]. At 6 h, the two dunes behind the two SBS CPs combine into one at G/D = 1 and 1.5. To summarize, for SBS, scour evolution resembles that of a single pile except for a few inner points on each pile and for closer gap ratios, where blockage enhanced the scour rate and dune formation accelerated the flow in the space between the piles.
Figure 10.
Scour profile along the symmetric lines of each CP in the SBS arrangement at 6 h of scour.
3.5. Temporal and Spatial Development of Scour in Staggered Arrangement
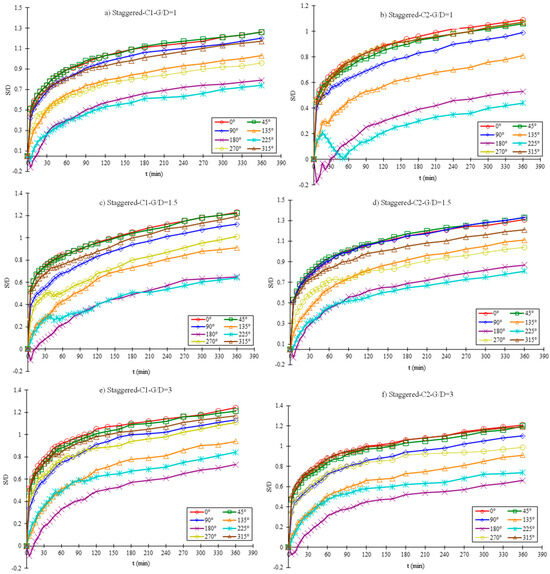
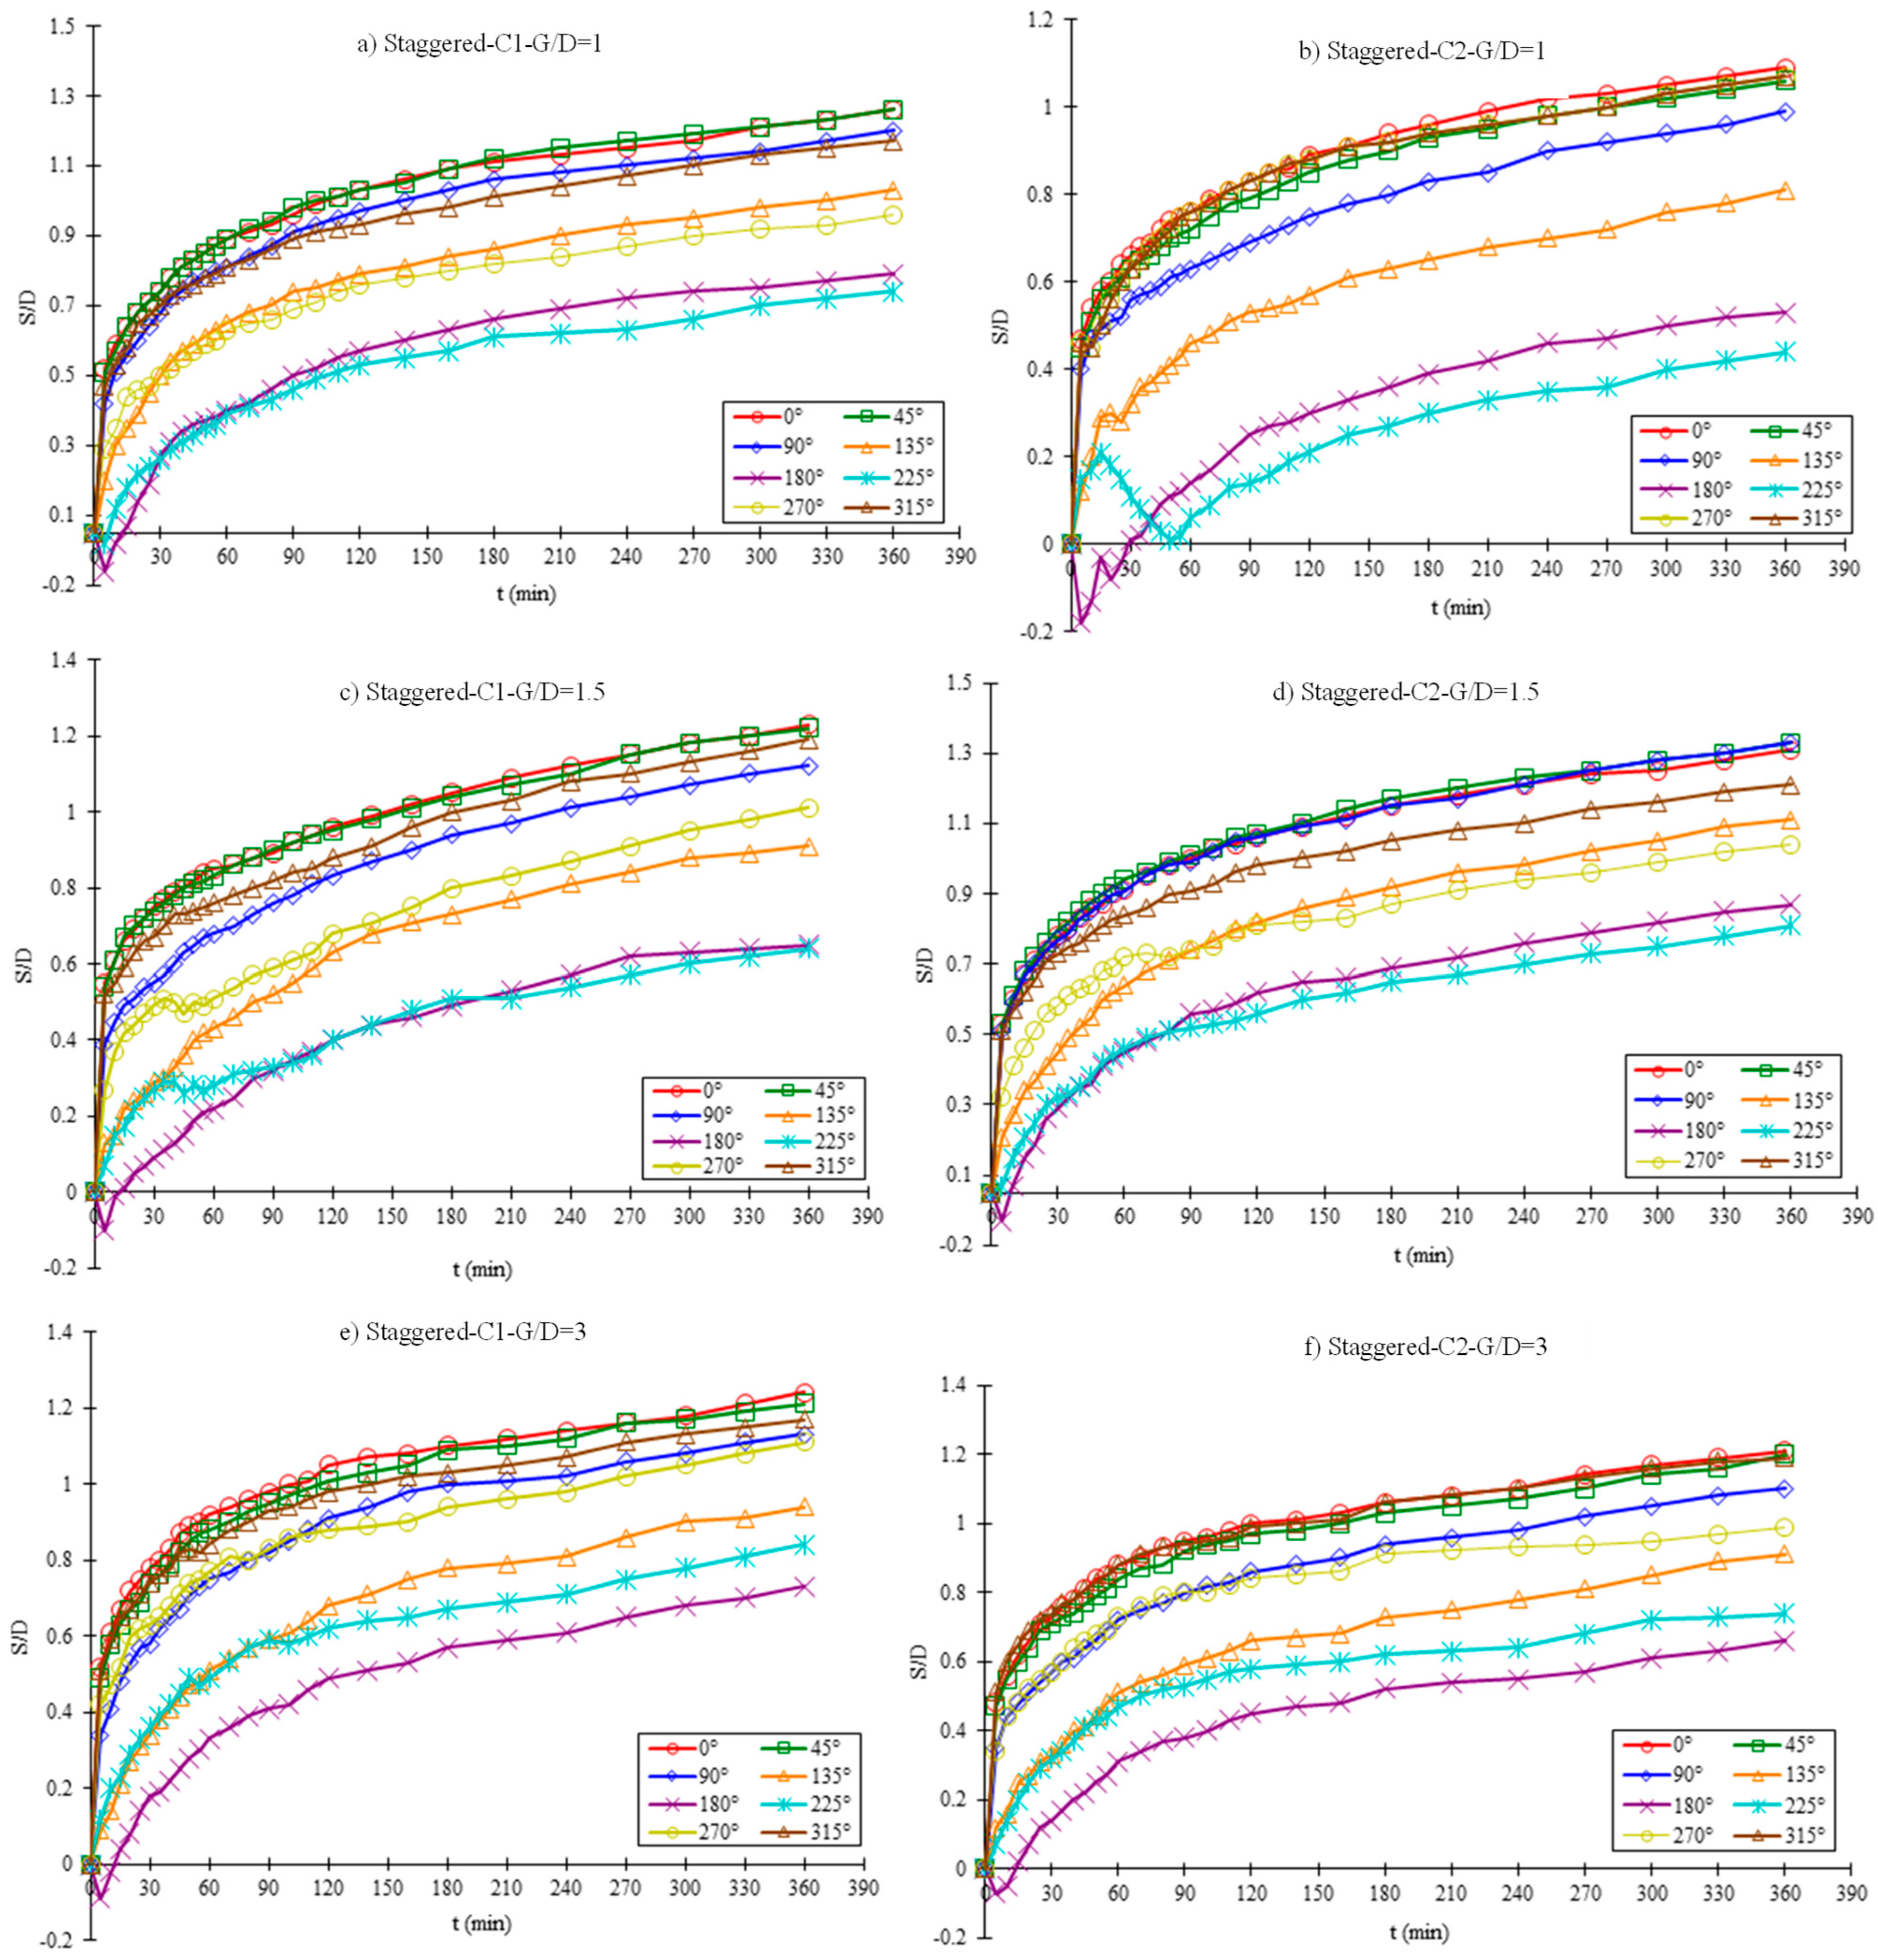
Scour phenomenon and sediment transport pattern in the staggered arrangement are between the tandem and SBS patterns. The maximum scour depth of each CP occurs at about the most upstream point. The maximum scour depth occurs at C2 when G/D = 1.5. At this gap, the downstream C2 is exposed to the accelerated velocity from the side of C1, and it is not affected by the shielding effect from C1. As G/D is increased from 1.5 to 3, the maximum scour depth of C2 decreases. In the staggered arrangement, the maximum scour depth (MSD) happens at the most upstream points of both CPs. Unlike tandem and SBS arrangements, where the MSD decreased with an increase in G/D, the MSD increases with an increase in G/D. Similarly, the MSD is located between the spacing, i.e., inner corners of the CPs have a lower MSD as compared to the symmetrical points on the C1. On the contrary, the MSD at the inner corners of C2 has a higher scour depth as compared to the symmetrical points.
It shows that the scour rate has increased at C2 due to the flow acceleration taking place between the spacing and due to the flow obstruction caused by C1. In conclusion, MSD at the most upstream point of C2 increases as compared to the value at C1 when G/D is increased from 1 to 3. When G/D = 1 in the staggered arrangement, the proximity between the two CPs causes dune transport from C1 to C2, due to which deposition occurs at θ = 315°on C2 at the early stage of the test, and scour depth at θ = 225° showed alternating decreasing and increasing trends (Figure 11b). The shielding effect at G/D = 1 also causes reduction in the scour depth of C2.
Figure 11.
Temporal development of scour at each measuring point of CPs in Staggered Arrangement.
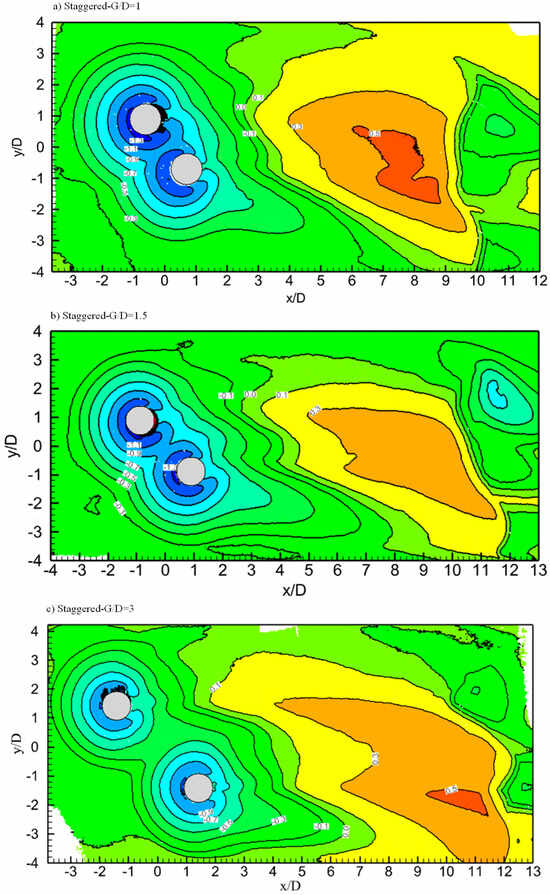
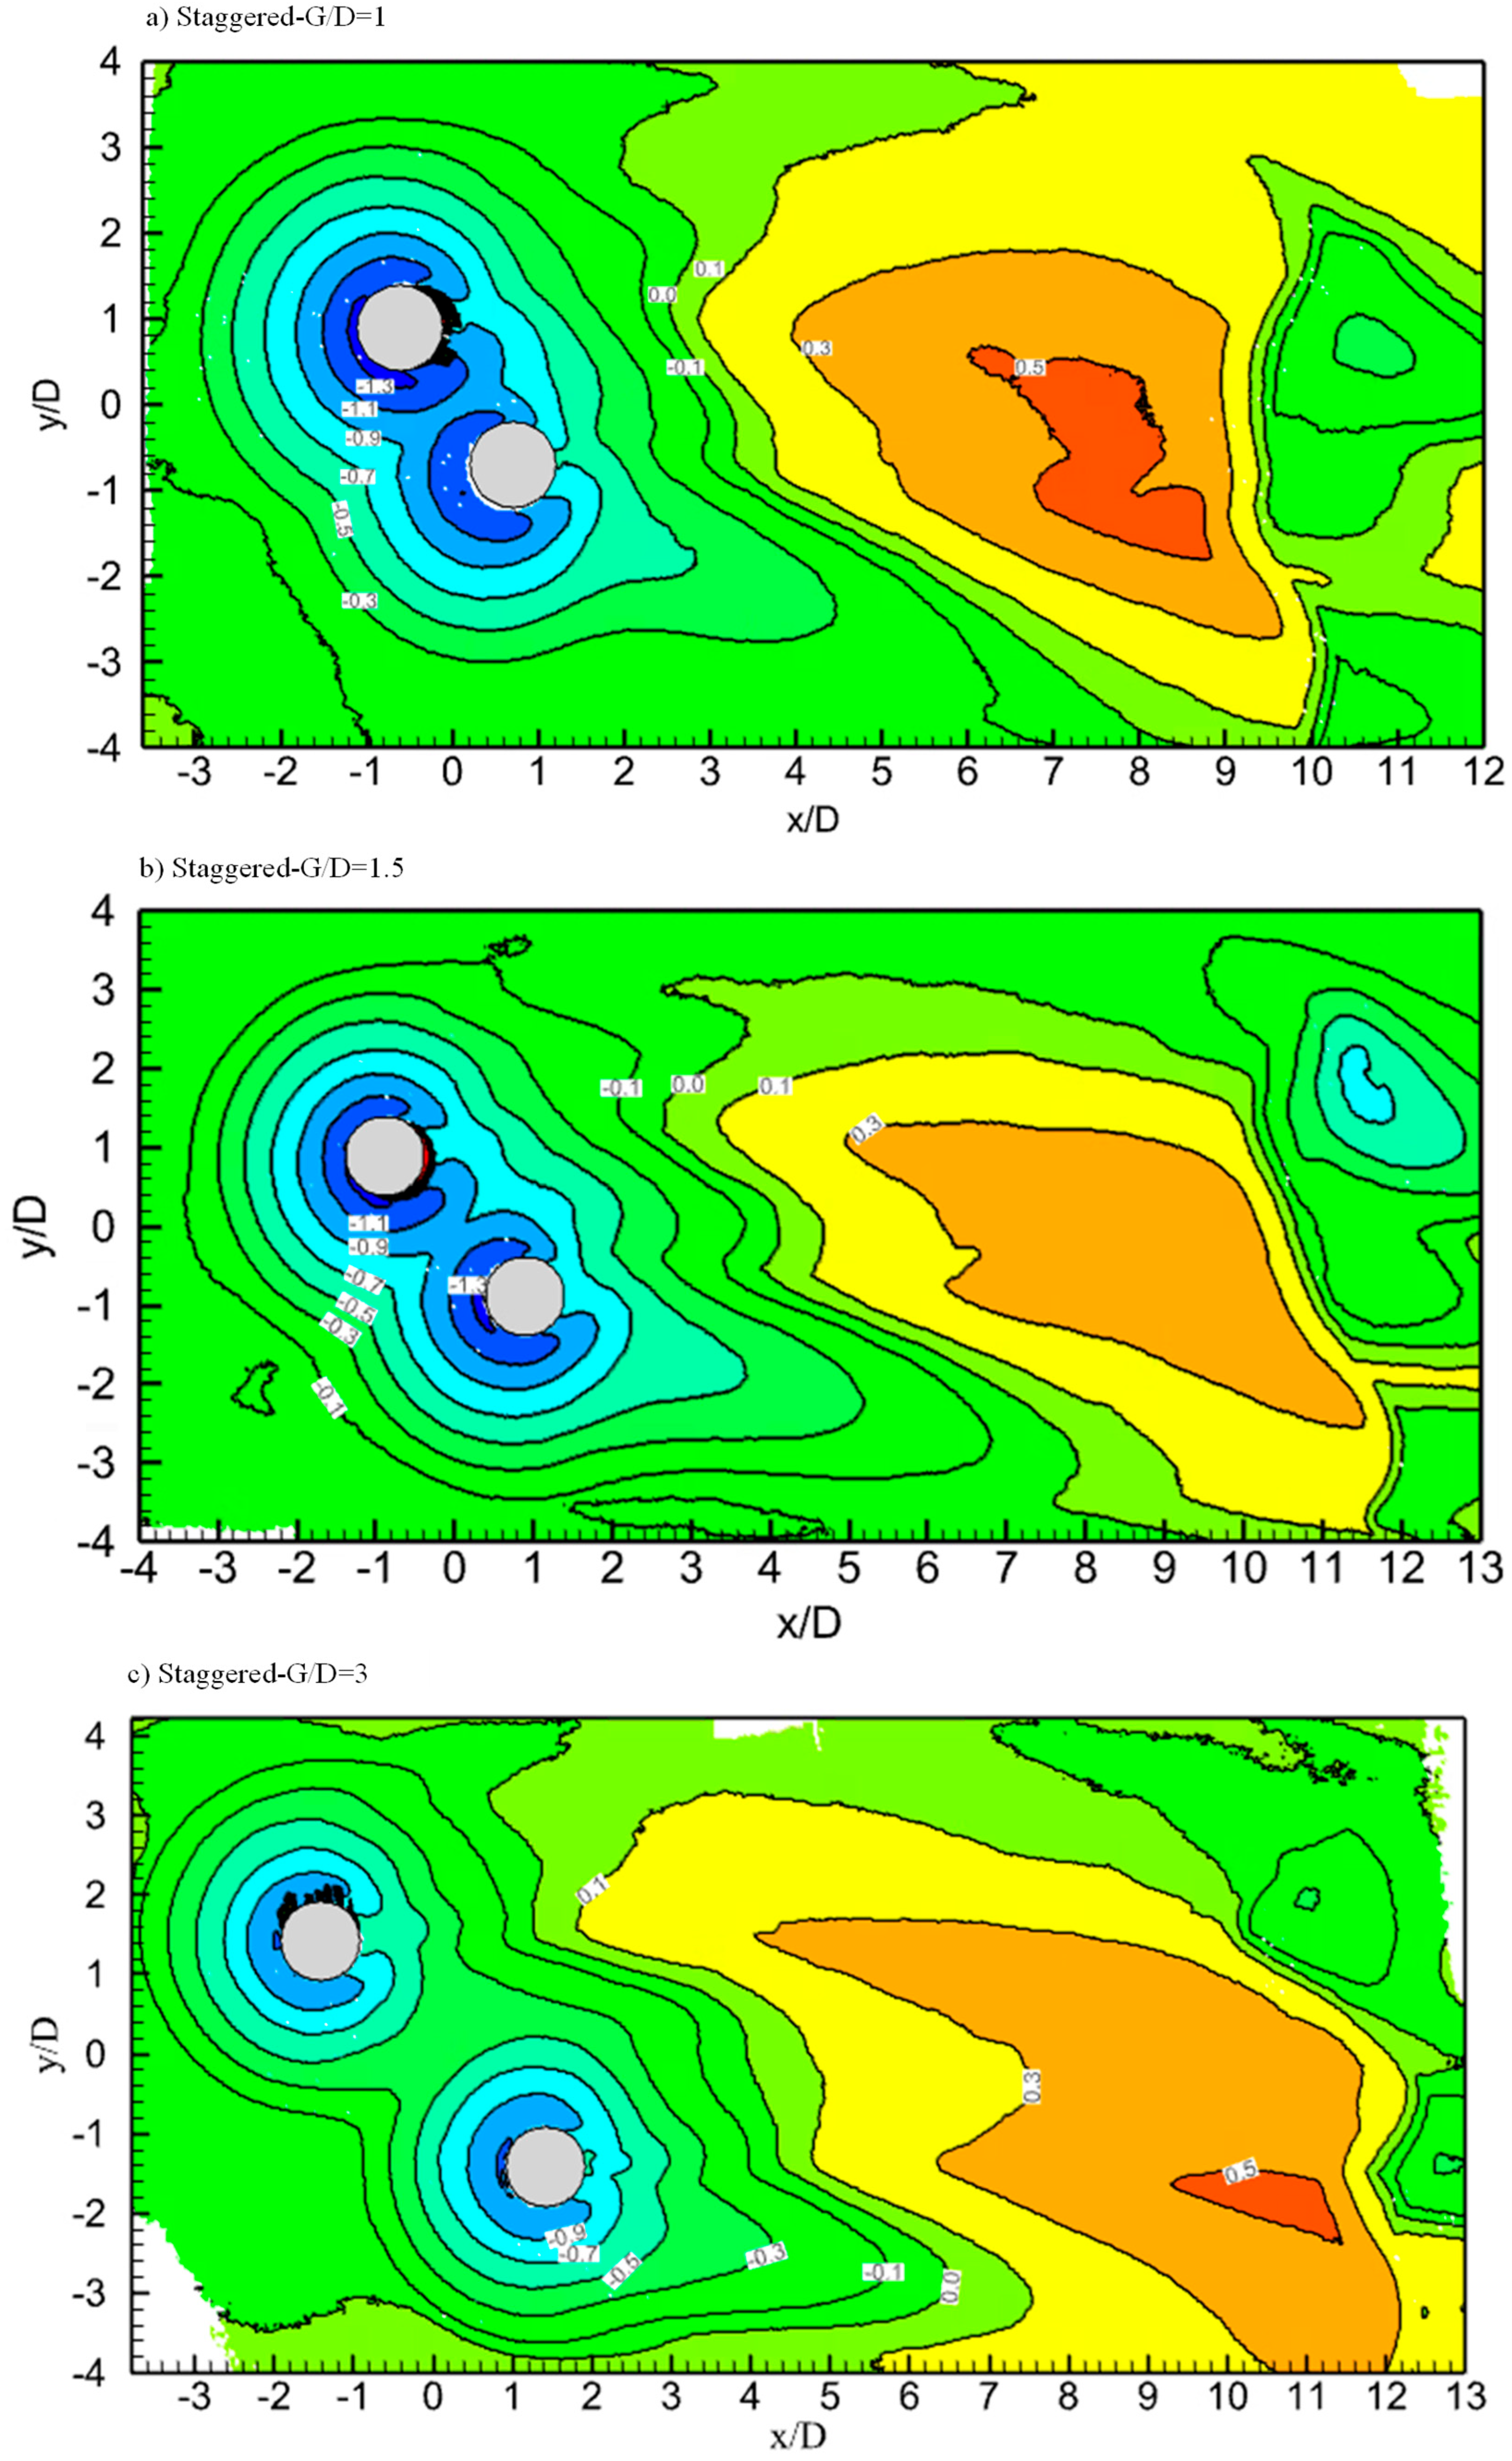
Bed topography in staggered arrangement is shown in Figure 12. Scour depth of each CP is still nearly located at the most upstream point of the CP, and a dune is formed in the wake of the CPs. For G/D = 1 and 1.5, dune height is equal to the value of the SBS case for G/D = 1.5 and 1 cases, respectively. Another difference is in the longitudinal extent of the scour hole, which increased with an increase in G/D value. The same observation was observed in time histories where flow acceleration enhanced the scour at C2.
Figure 12.
Scanned bed profiles at 6 h of scour in the staggered arrangement.
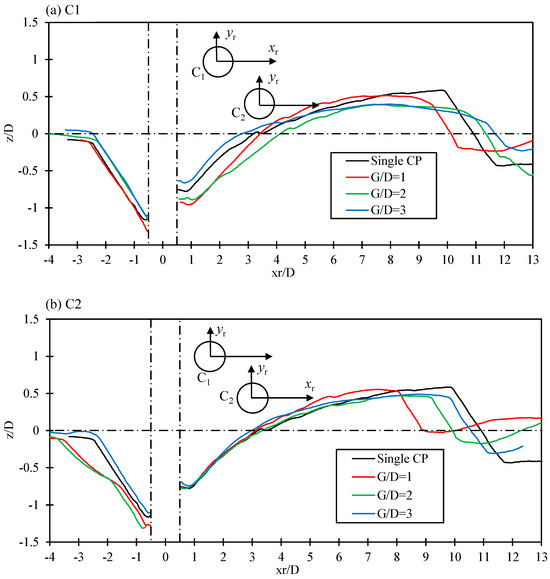
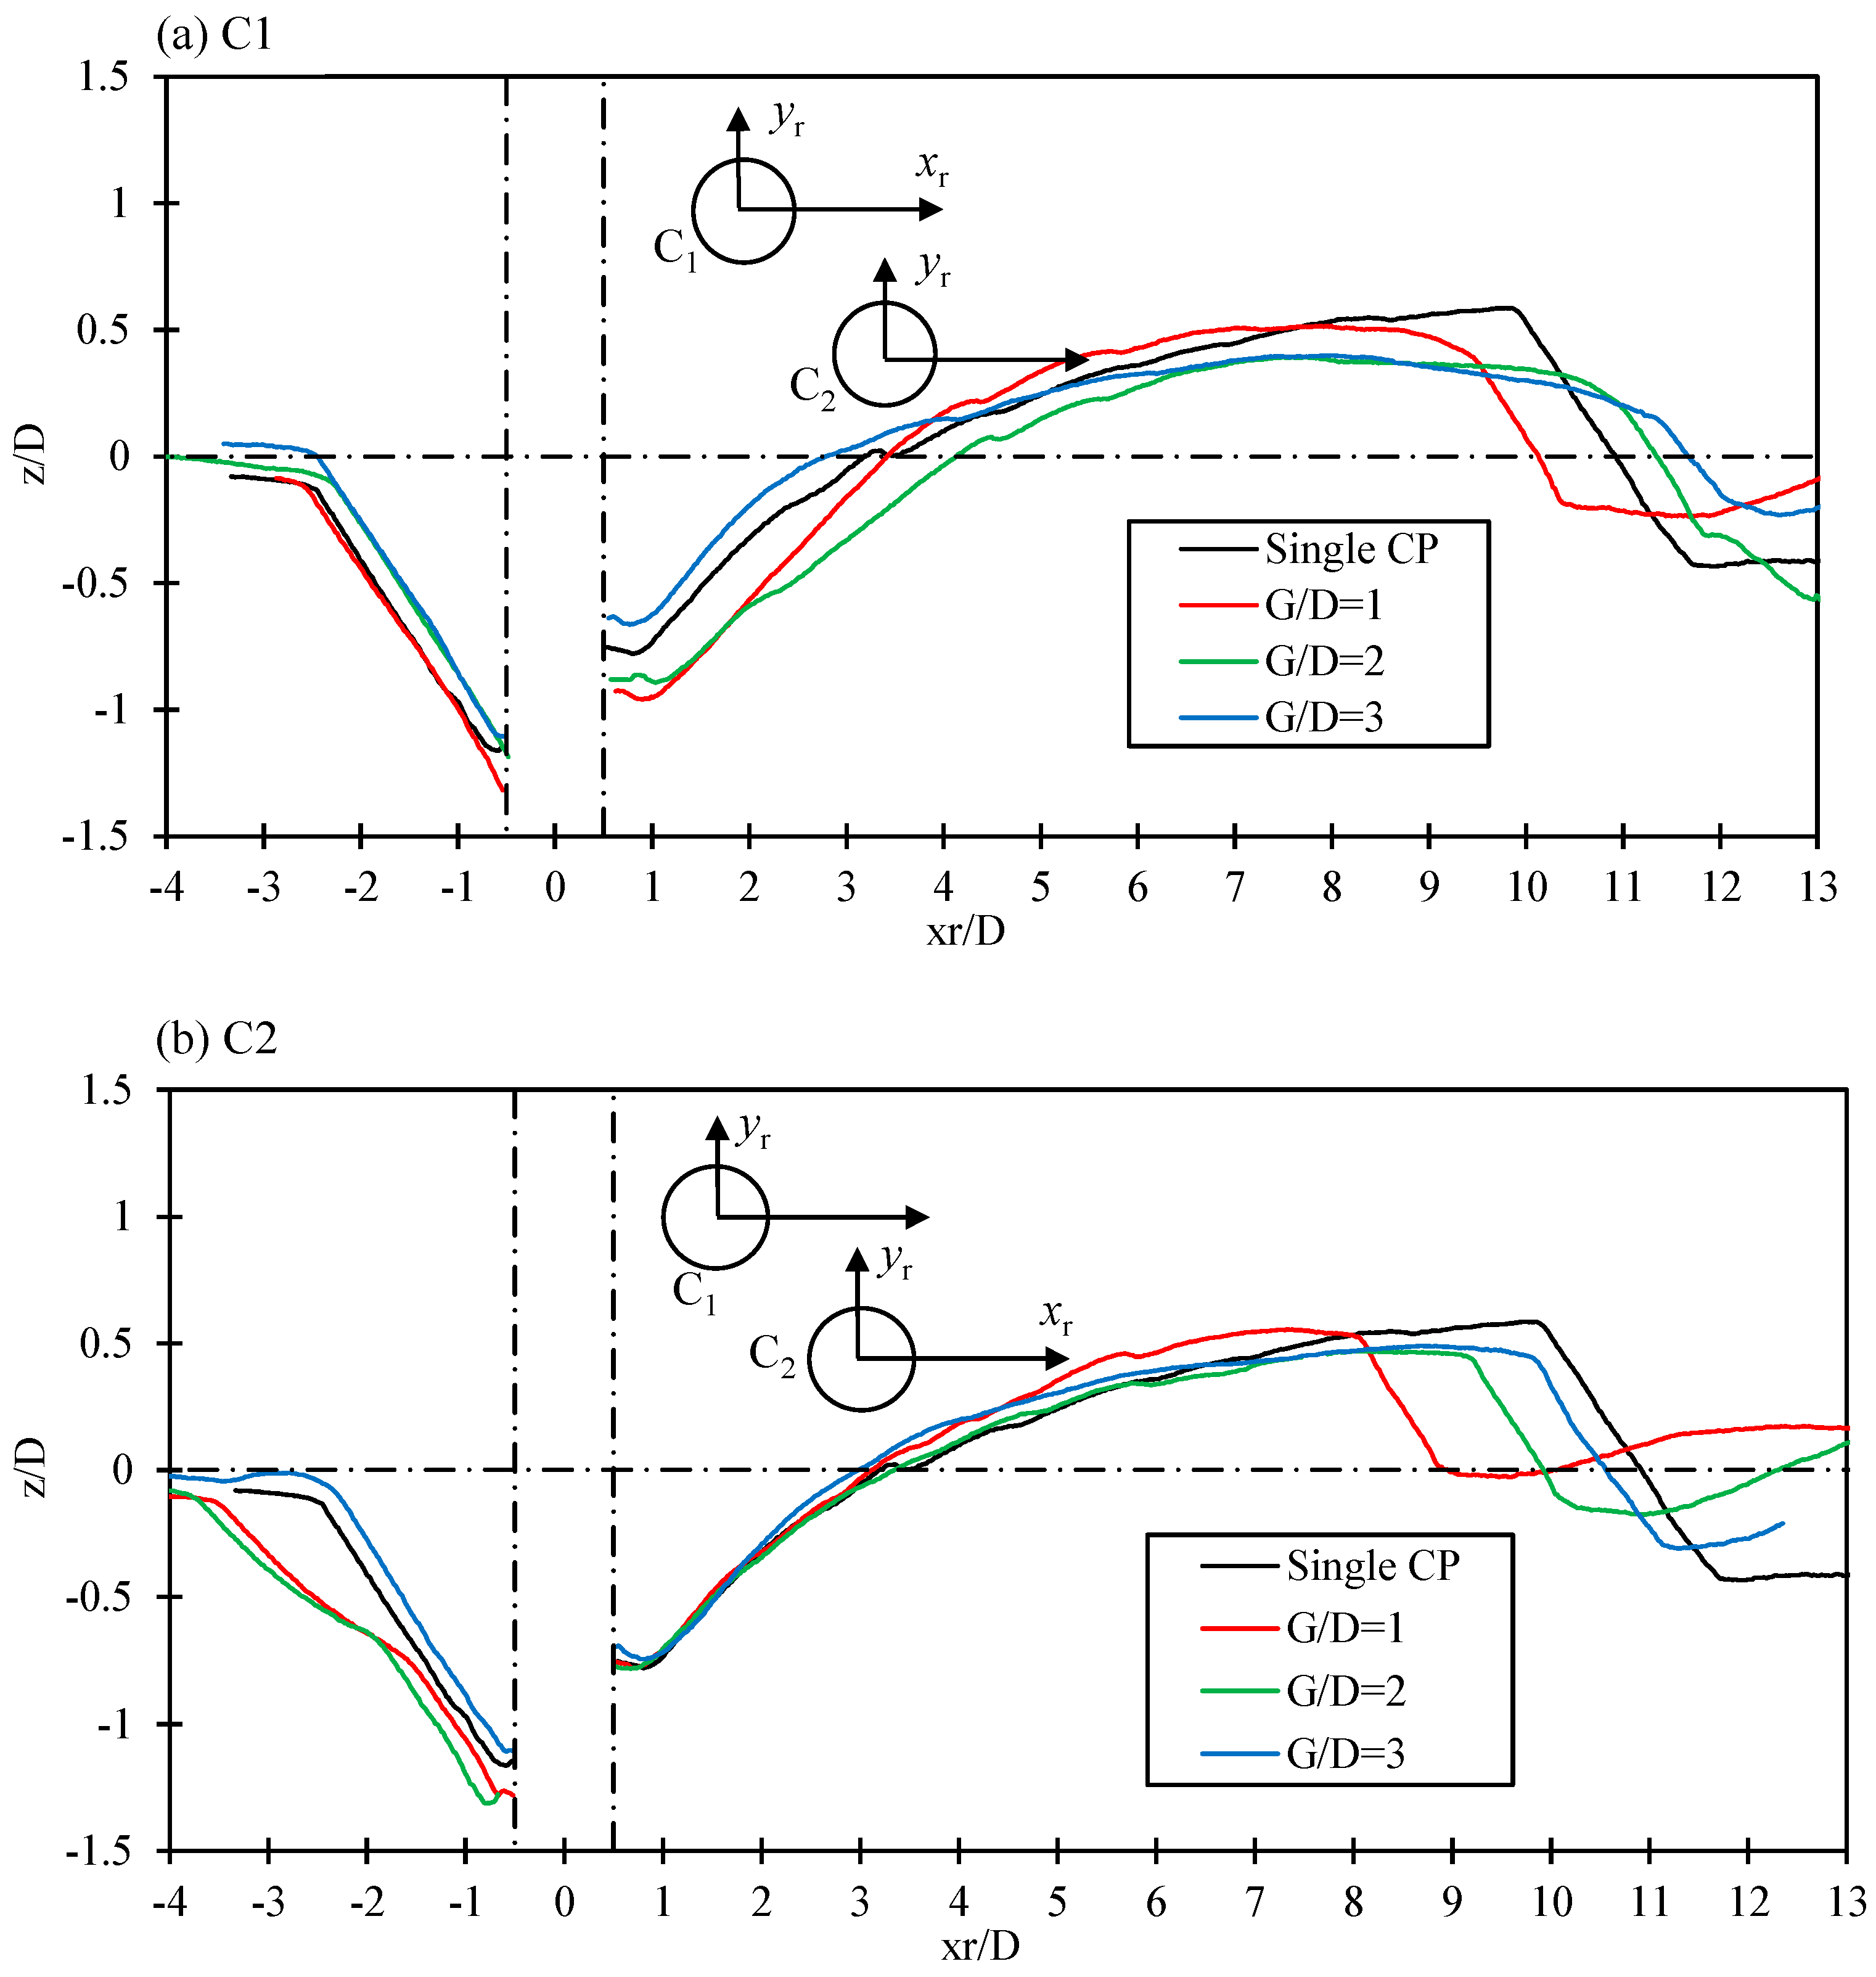
Sand erosion and deposition along the symmetry lines of C1 and C2 for staggered arrangement are shown in Figure 13. Scour and deposition patterns for C1 resemble as of a single CP with not much difference in G/D value. At the most upstream point, scour is approximately the same, while dune height varies. It can be linked to the deposition of sediments in the scour hole of C2, leading to a decreased dune height as compared to the single pile case. Deposition and scour patterns are a bit different for C2, as partial protection of C1 is present. Sand dune height is approximately equal in each case and located at different distances from the pile center for different G/D values. Independent pile behavior started at G/D = 3 when separate scour holes formed around each pile and C2 was not lying much in the wake region of C1.
Figure 13.
Scour profiles along the symmetric line of each CP in the staggered arrangement at 6 h of scour.
4. Conclusions
Experiments are conducted for scour around two subsea CPs in tandem, SBS, and staggered arrangements with d/D = 0.5, H/D = 1, and three gaps (G/D). The main conclusions are summarized below:
- In tandem arrangement, the upstream CP develops a scour pattern like an isolated CP. However, the downstream CP shows strong dependence upon G/D value due to the altered flow in the wake of the upstream pile. A distinct sand ridge forms between the piles, created by the eroded sediment coming from upstream. Initially, the wake side of downstream CP goes through a deposition phase followed by erosion as the wake reattaches and strengthens over time. Overall, downstream CP has shallower scour depth due to the shielding effect.
- In the SBS arrangement, the scour depths of both CPs are very similar to that of a single CP, because both CPs are facing the flow without any shielding effects. The outer sides of each pile have deeper scour than the inner gap region, as flow contraction due to the gap causes sediment trapping. Scour holes become independent at G/D = 3 with two separate dunes downstream.
- In the staggered arrangement, the shadowing effect from the upstream CP affects the scour of the downstream CP when G/D = 1; as a result, the downstream CP has initial deposition at its rear side. At G/D = 1.5 and 3, the shadowing effect disappears, and the scour of the downstream CP develops in a similar trend to that of a single CP.
- Variation in G/D produces different flow regimes, resulting in distinct scour and deposition patterns. The threshold G/D value—at which interaction between the piles starts to diminish and scour around each pile becomes independent—depends on the configuration, which reflects that hydrodynamic interaction between the piles is complex.
- After 6 h of scour, dunes are formed in all three configurations. In tandem and staggered arrangements, a single dune is formed behind the downstream CP. In contrast, for SBS, two dunes formed that merged for G/D = 1 and 1.5, while remaining separate at G/D = 3.
- To summarize, the temporal development of both CPs in the SBS arrangement and C1 in the tandem and staggered arrangements showed various similarities to a single pile case, while the scour depth of C2 is significantly affected by G/D and β, indicating a strong pile–pile interaction.
Author Contributions
Conceptualization, M.A. and M.Z.; Methodology, M.A. and M.Z.; Validation, M.A.; Formal analysis, M.A.; Investigation, M.A.; Data curation, M.A.; Writing—original draft, M.A.; Writing—review and editing, M.Z., H.W., A.M. and V.D.; Visualization, M.A.; Supervision, M.Z., H.W. and A.M.; Project administration, M.Z. All authors have read and agreed to the published version of the manuscript.
Funding
This research received no external funding.
Data Availability Statement
The original contributions presented in this study are included in the article. Further inquiries can be directed to the corresponding author.
Conflicts of Interest
The authors declare no conflict of interest.
References
- Melville, B.W.; Raudkivi, A.J. Effects of foundation geometry on bridge pier scour. J. Hydraul. Eng. 1996, 122, 203–209. [Google Scholar] [CrossRef] [Scilit]
- Sumner, D. Two circular cylinders in cross-flow: A review. J. Fluids Struct. 2010, 26, 849–899. [Google Scholar] [CrossRef] [Scilit]
- Jiang, W.; Lin, C. Scour effects on vertical effective stresses and lateral responses of pile groups in sands. Ocean Eng. 2021, 229, 109017. [Google Scholar] [CrossRef] [Scilit]
- Sumer, B.M.; Fredsøe, J.; Bundgaard, K. Global and local scour at pile groups. In Proceedings of the ISOPE International Ocean and Polar Engineering Conference, ISOPE, Seoul, Republic of Korea, 19–24 June 2005; pp. 204–209. [Google Scholar]
- Devi, G.; Kumar, M. Characteristics assessment of local scour encircling twin bridge piers positioned side by side (SbS). Sādhanā 2022, 47, 109. [Google Scholar] [CrossRef] [Scilit]
- Malik, R.; Setia, B.; Banik, A. Mechanism of Scouring Around Group of Bridge Piers in Tandem Arrangement. J. Inst. Eng. Ser. A 2023, 104, 633–642. [Google Scholar] [CrossRef] [Scilit]
- Malik, R.; Setia, B. Interference between pier models and its effects on scour depth. SN Appl. Sci. 2020, 2, 68. [Google Scholar] [CrossRef] [Scilit]
- Yang, Y.; Qi, M.; Wang, X.; Li, J. Experimental study of scour around pile groups in steady flows. Ocean Eng. 2020, 195, 106651. [Google Scholar] [CrossRef] [Scilit]
- Ma, H.; Zhang, S.; Li, B. Numerical investigation of local scour around twin piles under steady current using CFD-DEM coupling method. Comput. Geotech. 2023, 164, 105805. [Google Scholar] [CrossRef] [Scilit]
- Liu, M.-M.; Wang, H.-C.; Tang, G.-Q.; Shao, F.-F.; Jin, X. Investigation of local scour around two vertical piles by using numerical method. Ocean Eng. 2022, 244, 110405. [Google Scholar] [CrossRef] [Scilit]
- Qu, L.; An, H.; Draper, S.; Watson, P.; Zhao, M.; Harris, J.; Whitehouse, R.; Zhang, D. A review of scour impacting monopiles for offshore wind. Ocean Eng. 2024, 301, 117385. [Google Scholar] [CrossRef] [Scilit]
- Wang, H.; Tang, H.; Xiao, J.; Wang, Y.; Jiang, S. Clear-water local scouring around three piers in a tandem arrangement. Sci. China Technol. Sci. 2016, 59, 888–896. [Google Scholar] [CrossRef] [Scilit]
- Ataie-Ashtiani, B.; Beheshti, A.A. Experimental Investigation of Clear-Water Local Scour at Pile Groups. J. Hydraul. Eng. 2006, 132, 1100–1104. [Google Scholar] [CrossRef] [Scilit]
- Liang, F.; Wang, C.; Wang, Y.; Huang, M. A preliminary experimental study on the mechanism of local scour at pile groups in steady currents. In Frontiers in Offshore Geotechnics III: Proceedings of the 3rd International Symposium on Frontiers in Offshore Geotechnics (ISFOG 2015); Taylor & Francis Books Ltd.: Leiden, The Netherlands, 2015; pp. 599–604. [Google Scholar]
- Islam, M.M.; Basir, M.S.; Mahalder, B. 2022 Local scour analysis around single pier group of piers in tandem arrangement using flow. In Proceedings of the 6th International Conference on Civil Engineering for Sustainable Development, Khulna, Bangladesh, 10–12 February 2022. [Google Scholar]
- Heidarpour, M.; Afzalimehr, H.; Izadinia, E. Reduction of local scour around bridge pier groups using collars. Int. J. Sediment Res. 2010, 25, 411–422. [Google Scholar] [CrossRef] [Scilit]
- Garg, V.; Setia, B.; Singh, V.; Kumar, A. Scour protection around bridge pier and two-piers-in-tandem arrangement. ISH J. Hydraul. Eng. 2022, 28, 251–263. [Google Scholar] [CrossRef] [Scilit]
- Devi, G.; Kumar, M. Experimental study of the local scour around the two piers in the tandem arrangement using ultrasonic ranging transducers. Ocean Eng. 2022, 266, 112838. [Google Scholar] [CrossRef] [Scilit]
- Yu, P.; Liu, J.; Yu, L.; Zhu, L. Numerical investigation of local scour around tandem piers using proposed self-sustaining inlet turbulent boundary conditions. Ocean Eng. 2023, 274, 113987. [Google Scholar] [CrossRef] [Scilit]
- Zhao, S.; Ji, C.; Sun, Z.; Yu, H.; Zhang, Z. Effects of the gap on the local scour around two tandem piles in shallow flows. Ocean Eng. 2022, 246, 110575. [Google Scholar] [CrossRef] [Scilit]
- Yagci, O.; Yildirim, I.; Celik, M.F.; Kitsikoudis, V.; Duran, Z.; Kirca, V.O. Clear water scour around a finite array of cylinders. Appl. Ocean Res. 2017, 68, 114–129. [Google Scholar] [CrossRef] [Scilit]
- Ataie-Ashtiani, B.; Aslani-Kordkandi, A. Flow field around single and tandem piers. Flow Turbul. Combust. 2013, 90, 471–490. [Google Scholar] [CrossRef] [Scilit]
- Okhravi, S.; Gohari, S.; Alemi, M.; Maia, R. Effects of bed-material gradation on clear water scour at single and group of piles. J. Hydrol. Hydromech. 2022, 70, 114–127. [Google Scholar] [CrossRef] [Scilit]
- Abolfathi, S.; Kashefipour, S.M.; Fuhrman, D.R.; Bajestan, M.S. Temporal scouring and backfilling processes around a pile group subject to unsteady hydrographs. Ain Shams Eng. J. 2022, 13, 101565. [Google Scholar] [CrossRef] [Scilit]
- Pasupuleti, L.N.; Timbadiya, P.V.; Patel, P.L. Flow fields around tandem and staggered piers on a mobile bed. Int. J. Sediment Res. 2022, 37, 737–753. [Google Scholar] [CrossRef] [Scilit]
- Qi, H.; Yuan, T.; Zou, W.; Tian, W.; Li, J. Numerical Study on Local Scour Reduction around Two Cylindrical Piers Arranged in Tandem Using Collars. Water 2023, 15, 4079. [Google Scholar] [CrossRef] [Scilit]
- Tang, J.-H.; Puspasari, A.D. Numerical simulation of local scour around three cylindrical piles in a tandem arrangement. Water 2021, 13, 3623. [Google Scholar] [CrossRef] [Scilit]
- Yang, Y.; Qi, M.; Li, J.; Ma, X. Evolution of hydrodynamic characteristics with scour hole developing around a pile group. Water 2018, 10, 1632. [Google Scholar] [CrossRef] [Scilit]
- Amini, A.; Solaimani, N. The effects of uniform and nonuniform pile spacing variations on local scour at pile groups. Mar. Georesour. Geotechnol. 2018, 36, 861–866. [Google Scholar] [CrossRef] [Scilit]
- Rout, A.; Sarkar, A. Temporal Evolution of Scour at Submerged Circular Cylinders. J. Mar. Sci. Appl. 2021, 20, 85–101. [Google Scholar] [CrossRef] [Scilit]
- Rout, A.; Sarkar, A. Local scour around submerged tandem and offset cylinders due to change in alignment angle. Proc. Inst. Civ. Eng. Water Manag. 2020, 173, 14–30. [Google Scholar] [CrossRef] [Scilit]
- Lu, Y.; Wang, Z.; Yin, Z.; Du, S.; Pan, X.; Liang, B. Experimental study on aspect ratio and velocity intensity of scour around submerged pile groups. Front. Mar. Sci. 2022, 9, 910723. [Google Scholar] [CrossRef] [Scilit]
- Liang, F.; Wang, C.; Huang, M.; Wang, Y. Experimental observations and evaluations of formulae for local scour at pile groups in steady currents. Mar. Georesour. Geotechnol. 2017, 35, 245–255. [Google Scholar] [CrossRef] [Scilit]
- Lança, R.; Fael, C.; Maia, R.; Pêgo, J.P.; Cardoso, A.H. Clear-water scour at pile groups. J. Hydraul. Eng. 2013, 139, 1089–1098. [Google Scholar] [CrossRef] [Scilit]
- Solaimani, N.; Amini, A.; Banejad, H.; Taherei Ghazvinei, P. The effect of pile spacing and arrangement on bed formation and scour hole dimensions in pile groups. Int. J. River Basin Manag. 2017, 15, 219–225. [Google Scholar] [CrossRef] [Scilit]
- Puspasari, A.D.; Tang, J.-H. Numerical simulation of scouring around groups of six cylinders with different flow directions. J. Chin. Inst. Eng. 2023, 46, 420–430. [Google Scholar] [CrossRef] [Scilit]
- Gong, M.; Pan, X.; Du, S.; Wu, G.; Lv, Y.; Sun, Y.; Ding, G.; Liang, B. Laboratory Study of Local Scour Around an Array of Pile Groups in Clear-Water Scour Conditions. J. Mar. Sci. Eng. 2025, 13, 137. [Google Scholar] [CrossRef] [Scilit]
- Ravanfar, S.M.; Mohammadpour, R.; Sabzevari, T. Experimental study of local scour around non-uniform twin piers. Int. J. River Basin Manag. 2024, 22, 429–444. [Google Scholar] [CrossRef] [Scilit]
- Yang, Y.; Melville, B.W.; Macky, G.H.; Shamseldin, A.Y. Local scour at complex bridge piers in close proximity under clear-water and live-bed flow regime. Water 2019, 11, 1530. [Google Scholar] [CrossRef] [Scilit]
- Alemi, M.; Pêgo, J.P.; Maia, R. Numerical simulation of the turbulent flow around a complex bridge pier on the scoured bed. Eur. J. Mech.-B/Fluids 2019, 76, 316–331. [Google Scholar] [CrossRef] [Scilit]
- Amini, A.; Melville, B.W.; Ali, T.M. Local scour at piled bridge piers including an examination of the superposition method. Can. J. Civ. Eng. 2014, 41, 461–471. [Google Scholar] [CrossRef] [Scilit]
- Ataie-Ashtiani, B.; Baratian-Ghorghi, Z.; Beheshti, A.A. Experimental Investigation of Clear-Water Local Scour of Compound Piers. J. Hydraul. Eng. 2010, 136, 343–351. [Google Scholar] [CrossRef]
- Coleman, S.E. Clearwater Local Scour at Complex Piers. J. Hydraul. Eng. 2005, 131, 330–334. [Google Scholar] [CrossRef] [Scilit]
- Moreno, M.; Maia, R.; Couto, L. Prediction of Equilibrium Local Scour Depth at Complex Bridge Piers. J. Hydraul. Eng. 2016, 142, 04016045. [Google Scholar] [CrossRef] [Scilit]
- Moreno, M.; Maia, R.; Couto, L. Effects of Relative Column Width and Pile-Cap Elevation on Local Scour Depth around Complex Piers. J. Hydraul. Eng. 2016, 142, 04015051. [Google Scholar] [CrossRef] [Scilit]
- Yao, W.; Draper, S.; An, H.; Cheng, L.; Harris, J.M.; Whitehouse, R.J.S. Experimental study of local scour around submerged compound piles in steady current. Coast. Eng. 2021, 165, 103831. [Google Scholar] [CrossRef] [Scilit]
- Zhu, C.; Wu, W.; Liu, X.; Liu, H.; Hu, R.; Yu, P. Experimental study of structure dimensions effects on local scour of submerged compound suction anchor foundation. Ocean Eng. 2024, 294, 116742. [Google Scholar] [CrossRef] [Scilit]
- Gautam, P.; Eldho, T.I.; Behera, M.R. Effects of pile-cap elevation on scour and turbulence around a complex bridge pier. Int. J. River Basin Manag. 2023, 21, 283–297. [Google Scholar] [CrossRef] [Scilit]
- Adnan, M.; Zhao, M.; Wu, H.; Dhamelia, V. Experimental study of local scour around a compound pile under steady current. Ocean Eng. 2025, 318, 120151. [Google Scholar] [CrossRef] [Scilit]
- Ettema, R.; Kirkil, G.; Muste, M. Similitude of large-scale turbulence in experiments on local scour at cylinders. J. Hydraul. Eng. 2006, 132, 33–40. [Google Scholar] [CrossRef] [Scilit]
- Soulsby, R.L. Dynamics of marine sands: A manual for practical applications. Oceanogr. Lit. Rev. 1997, 9, 947. [Google Scholar] [CrossRef] [Scilit]
- Mamoon, A.-A.; Zhao, M.; Wu, H.; Keshavarzi, A. Experimental investigation of local scour around two submerged short square piles under tandem, side-by-side and staggered arrangements in steady current. Ocean Eng. 2022, 261, 112156. [Google Scholar] [CrossRef] [Scilit]
- Melville, B.W.; Chiew, Y.-M. Time scale for local scour at bridge piers. J. Hydraul. Eng. 1999, 125, 59–65. [Google Scholar] [CrossRef] [Scilit]
- Shrestha, C.K. Bridge Pier Flow Interaction and Its Effect on the Process of Scouring. Ph.D. Thesis, University of Technology Sydney, Ultimo, Australia, 2015. [Google Scholar]
- Amini, A.; Melville, B.W.; Ali, T.M.; Ghazali, A.H. Clear-water local scour around pile groups in shallow-water flow. J. Hydraul. Eng. 2012, 138, 177–185. [Google Scholar] [CrossRef] [Scilit]
- Zhang, Q.; Zhou, X.-L.; Wang, J.-H. Numerical investigation of local scour around three adjacent piles with different arrangements under current. Ocean Eng. 2017, 142, 625–638. [Google Scholar] [CrossRef] [Scilit]
- Gong, M.; Wu, G.; Du, S.; Pan, X.; Lv, Y.; Sun, Y.; Ding, G.; Liang, B. Experimental investigations of local scour around piles in a single-column and three-columns with multiple rows in steady current. Appl. Ocean Res. 2025, 159, 104608. [Google Scholar] [CrossRef] [Scilit]
- Alam, M.M.; Moriya, M.; Sakamoto, H. Aerodynamic characteristics of two side-by-side circular cylinders and application of wavelet analysis on the switching phenomenon. J. Fluids Struct. 2003, 18, 325–346. [Google Scholar] [CrossRef] [Scilit]
- Zhao, C.; Fang, H.; Ouro, P.; Stoesser, T.; Dey, S. Response of bedload and bedforms to near-bed flow structures. J. Hydraul. Eng. 2024, 150, 04023060. [Google Scholar] [CrossRef] [Scilit]

Disclaimer/Publisher’s Note: The statements, opinions and data contained in all publications are solely those of the individual author(s) and contributor(s) and not of MDPI and/or the editor(s). MDPI and/or the editor(s) disclaim responsibility for any injury to people or property resulting from any ideas, methods, instructions or products referred to in the content. |
© 2025 by the authors. Licensee MDPI, Basel, Switzerland. This article is an open access article distributed under the terms and conditions of the Creative Commons Attribution (CC BY) license.