Article

PDO-Modulated ENSO Impact on Southern South China Sea Winter SST: Multi-Anticyclone Synergy

Yazhou Bay Innovation Institute, College of Marine Science and Technology, Hainan Tropical Ocean University, Sanya 572022, China
*
Authors to whom correspondence should be addressed.
J. Mar. Sci. Eng. 2025, 13(9), 1741; https://doi.org/10.3390/jmse13091741
Submission received: 30 July 2025 / Revised: 5 September 2025 / Accepted: 9 September 2025 / Published: 10 September 2025
(This article belongs to the Section Physical Oceanography)

Abstract

El Niño fundamentally elevates the southern South China Sea (SSCS) winter sea surface temperature (SST), and this relationship exhibits significant interdecadal modulation by the Pacific Decadal Oscillation (PDO). Correlation analyses reveal a negative linkage between El Niño-SSCS SST relationship and PDO index (r = −0.5, p < 0.05). Mechanistically, negative PDO phase reconfigures the multi-anticyclone system: a weaker and northeastward-shifted Philippine Sea anticyclone (PSAC, 25° poleward), dissipating northern Indian Ocean anticyclone (NIOAC) and persistent southeastern Indian Ocean anticyclone (SEIOAC) through a reduction in Aleutian low and El Niño intensity. In the negative-minus-positive PDO phase composite, this drives anomalous southerlies/southwesterlies over the SSCS, establishing a zonal SST dipole (west-cooling/east-warming; −0.1 °C/+0.2 °C east/west of 108° E). Ekman dynamics (positive/negative wind stress curl west/east of 108° E), horizontal heat advection and latent heat flux (driven by southwesterly wind) dominate the SST dipole formation. From December to February, Aleutian low suppression and El Niño decay progressively modify the multi-anticyclone system configuration and replace southerly anomalies with northerlies, reducing regional warm SST in the N-P composite. The multi-anticyclone system thus mediates SSCS SST interannual variability, with critical implications for marine predictability under climate oscillations.

1. Introduction

The South China Sea (SCS) is the largest semi-enclosed marginal sea in the western Pacific Ocean, and its unique geographic pattern of “three sides surrounded by land and one facing the ocean” makes it a key coupling area for Pacific-Indian Ocean interaction. As the core area of the Asian monsoon, the SCS is dominated by the northeasterly monsoon in winter [1], forming cyclonic upper circulation [2], and its isotherm is oriented northeast-southwest. Jointly regulated by local air–sea processes, regional circulation and global climate modes, the sea surface temperature (SST) in the SCS exhibits significant multi-scale features such as daily oscillations [3], intraseasonal oscillations [4,5], seasonal variations [6], interannual variations [7,8,9], and interdecadal variations [10,11].
El Niño–Southern Oscillation (ENSO) is one of the most significant interannual climate modes globally, with far-reaching impacts on global climate, ecology, and socio-economics. ENSO significantly affects the climate of East Asia and the neighboring seas through modulation of atmospheric circulation, of which the Philippine Sea anticyclone (PSAC)/cyclone is an important bridge [12,13]. For example, during the ENSO warm phase (El Niño), anomalous warming in the tropical east-central Pacific Ocean caused anomalous cooling in the western Pacific Ocean through the Gill response [14], which triggered the PSAC. The anomalous southeasterly wind from the southwest branch of the PSAC weakened prevailing northeasterly winds and caused significant warming of the SST in the SCS, especially in the southern SCS (SSCS), through latent heat loss and advective heat transport effects. El Niño-the SSCS winter SST relationship (ESR) is defined as the interannual connection between El Niño and winter SST in the SSCS, characterizing the deviation of SSCS winter SST during El Niño events relative to the climatological mean. Previous studies further found that the El Niño-SSCS SST relationship (ESR) is modulated by the intensity and type of ENSO [15]. For example, compared with regular El Niño, super El Niño has greater impacts on the winter SST in the SCS, in which thermodynamical processes play a key role [16,17]. The semi-basin warming mode exists in the SCS for the case of Central Pacific-type El Niño, and the warming is concentrated on the area west of 115° E under the influence of warm advection [8,18]. Differently, the Eastern Pacific-type El Niño has a stronger impact on the thermal variability of the SCS, with a strong warming basin mode.
In addition to the ENSO-related interannual variability, the SCS SST is modulated by large-scale climate modes, showing significant interdecadal variability. The Pacific Decadal Oscillation (PDO) is the main mode of the North Pacific SST variability [19]. On the one hand, PDO directly affects the oceanic advection through the North Pacific wind stress curl, which is associated with the variation in the Aleutian low [20]. The oceanic advection then influences the Kuroshio heat transport and modulates the interdecadal variability of SST in the SCS. On the other hand, PDO triggers the atmospheric response through the modulation of the tropical Pacific SST anomalies to affect the SCS convection, and indirectly regulates the SCS thermal balance [21,22]. Observational analysis showed that a significant interdecadal shift in the SCS winter SST occurred at the end of the 1990s, from a cold phase in 1982–1996 to a warm phase in 2000–2014 [10]. After the PDO changed to a negative phase in the late 1990s, the tropical Pacific trade winds became stronger and wider in scope, which strengthened the strength of the Kuroshio and weakened the heat transport in the Luzon Strait, and indirectly affected the SST in the SCS through vertical mixing and advection processes [23].
As mentioned above, modulated by the PSAC, the winter SSCS SST shows a positive correlation with the strength of El Niño, which is closely related to the PDO phase [17,18]. For example, during the positive phase of the PDO, El Niño corresponds to stronger low-level convergence and upper-level divergence of the upwelling branch of the Walker circulation in the eastern equatorial Pacific Ocean, which increases the efficiency of ocean-atmosphere coupling and leads to an increase in the strength of El Niño [24,25,26]. In addition, the deepening of the thermocline and the expansion of the warm water in the eastern equatorial Pacific Ocean under the positive phase of the PDO provide energy reserves for a strong El Niño [27]. It is expected that during the positive (negative) PDO phase, the El Niño strength is stronger (weaker), and the PSAC is stronger (weaker), then the SSCS winter SST will be warmer (cooler). However, this study reveals that the PSAC is stronger (weaker) but the ESR is weaker (stronger) during the positive (negative) PDO phase. It is not clear whether factors other than PSAC may modulate the interdecadal connection between PDO and ESR. It is worth noting that previous studies have focused more on the seasonal-scale changes in the PSAC to analyze the differences in its role on SCS SST during the developmental, maturation, and decay periods of El Niño [28,29,30]. However, the PSAC also has significant variations on subseasonal scale [31,32]. It is still ambiguous whether there are interdecadal variations in the ESR on the subseasonal scale. Therefore, in this paper, we will focus on the effect of PDO on the interdecadal variability of the ESR on both seasonal and subseasonal scales, and analyze the roles of local thermodynamic processes and the potential mechanisms.

2. Data and Methods

2.1. Data

The monthly SST data are from the Hadley Centre sea ice and SST dataset (HadISST) on a 1° × 1° resolution during 1900–2024 [33]. The monthly sea level pressure, surface wind, surface heat flux, total cloud cover and SST are from the fifth generation ECMWF reanalysis for the global climate and weather (ERA5), which has a resolution of 0.25° × 0.25° from 1940 to the present [34]. The monthly mean oceanic currents and potential temperature are taken from the Simple Ocean Data Assimilation (SODA) version 2.2.4 with a resolution of 0.5° × 0.5° during 1900–2010 [35].

2.2. Methods

When the 3-month running mean Niño-3.4 index exceeds 0.5 °C for five consecutive months, it is classified as an El Niño event. The PDO index is derived from the first principal component (PC1) of monthly SST anomalies in the North Pacific (20–70° N, 110° E–100° W) [19]. After applying an 11-year low-pass filter, the negative PDO phases are 1900–1924, 1947–1976 and 1999–2023, while positive PDO phases are 1925–1946 and 1977–1998. To examine the relationship between the PDO and the interdecadal variability of the ESR, we classify El Niño events based on their occurrence during either positive or negative PDO phases (see Table 1). Specifically, 13 El Niño events occurred during the positive PDO phase (1925–1946, 1977–1998), whereas 26 events occurred during the negative phase (1900–1924, 1947–1976, 1999–2023).
To investigate the relative contributions of thermodynamical processes to SSCS SST during El Niño mature phase, we conducted a mixed-layer heat budget analysis in the study [7,36].
T m t = Q n e t ρ C P H u T m x v T m y w T m z + R
As presented in Equation (1), moving from left to right, the terms represent the mixed layer temperature tendency, the net surface heat flux term, the zonal heat advection term, the meridional heat advection term, the vertical entrainment term, and the residual term, respectively. The net surface heat flux (Qnet) is the sum of the shortwave radiation, longwave radiation, latent heat flux and sensible heat flux. In the aforementioned equation, the units of all terms are °C/s. Nevertheless, in the main text, for the purpose of presenting the data in a more intuitive manner, we uniformly convert the units to °C/month. We define the downward heat flux as positive, indicating that the ocean gains heat from the atmosphere. u, v, w and Tm denote the averaged current and temperature in the mixed layer, ρ   =   1027   kg / m 3 (the reference density of seawater) and Cp 4007   J ° C 1 kg 1 (the specific heat capacity of seawater).
Equation (1) may not close owing to different reanalysis data employed in the heat budget analysis; this study emphasizes the thermodynamic contributions from a qualitative perspective.
In addition, to analyze the impacts of PDO on ESR, this study also employs composite analysis, correlation analysis and regression analysis. Here, the anomalies are defined as deviations from the 70-year (1940–2009) climatological mean. To eliminate global warming signals, grid-point anomalies of oceanic and atmospheric variables and Niño-3.4 index are detrended through a least-squares linear method. For Statistical significance, we perform one-sample t-test for El Niño samples during positive and negative PDO phases, using p < 0.05 as the threshold for significant deviation. For the significance testing of N-P period, we employed a robust statistical framework tailored to data characteristics. This framework ensures the scientific validity and accuracy of independent sample tests through normality and homogeneity of variance diagnostics. For normally distributed data with equal variances, standard two-sample t-tests are used; for normally distributed but heteroscedastic data, Welch’s corrected t-tests (adapted for unequal sample sizes, N = 13 and 26) are applied; for non-normal data, the distribution-free Mann–Whitney U nonparametric test is utilized. All analyses use p < 0.05 as the criterion for significant mean differences between positive and negative PDO phases. The SSCS is defined as the area over 2–9° N and 100–118° E. All the figures in the paper were created using MATLAB R2023b (MathWorks, Inc., Natick, MA, USA), except for the last figure where Microsoft Office 2021 PowerPoint was also used.
To quantitatively assess the ESR, we employ an ESR index formulated as follows:
E S R i   =   S S C S _ S S T i   -   S S C S _ S S T ¯ ,   i   =   1 ,   2 ,     ,   39
Here, ESRi denotes the ESR index for the ith El Niño event, S S C S _ S S T i represents the winter-mean SST in the SSCS during the ith El Niño event and S S C S _ S S T ¯ is the climatological mean of 124-year winter SSCS SST. The ESR index serves as a key quantitative indicator in this study, with larger absolute values indicating stronger relationship between El Niño and SSCS winter SST anomalies, and vice versa. To examine the differences in ESR characteristics during distinct phases of the PDO, we separately calculated the composite ESR indexes for both positive and negative PDO phases.
E S R - P = 1 N 1 i = 1 N 1 E S R i
E S R - N = 1 N 2 i = 1 N 2 E S R i
Here, N1 and N2 represent the number of El Niño events during positive and negative phases of the PDO, respectively, over the period 1900–2023. This phase-compositing approach effectively contrasts the differential impacts of El Niño on SSCS SST under varying PDO phases, thereby elucidating PDO’s decadal modulation mechanism on the ESR.

3. Results

3.1. Relationship Between El Niño and SST in the Southern SCS

Figure 1a presents the winter—mean SST in the SSCS derived from the HadISST dataset over the period 1900–2023, which is found to exhibit a significant 2–7 year oscillation. The interannual variability of SSCS SST is significantly correlated with the Niño3.4 index, and this correlation is statistically significant at the 99% confidence level (Figure 1b). In addition, the SSCS SST reveals prominent interdecadal shifts during the mid-1920s, mid-1940s, late 1970s, and late 1990s, which appear to align with the phase transitions of PDO.
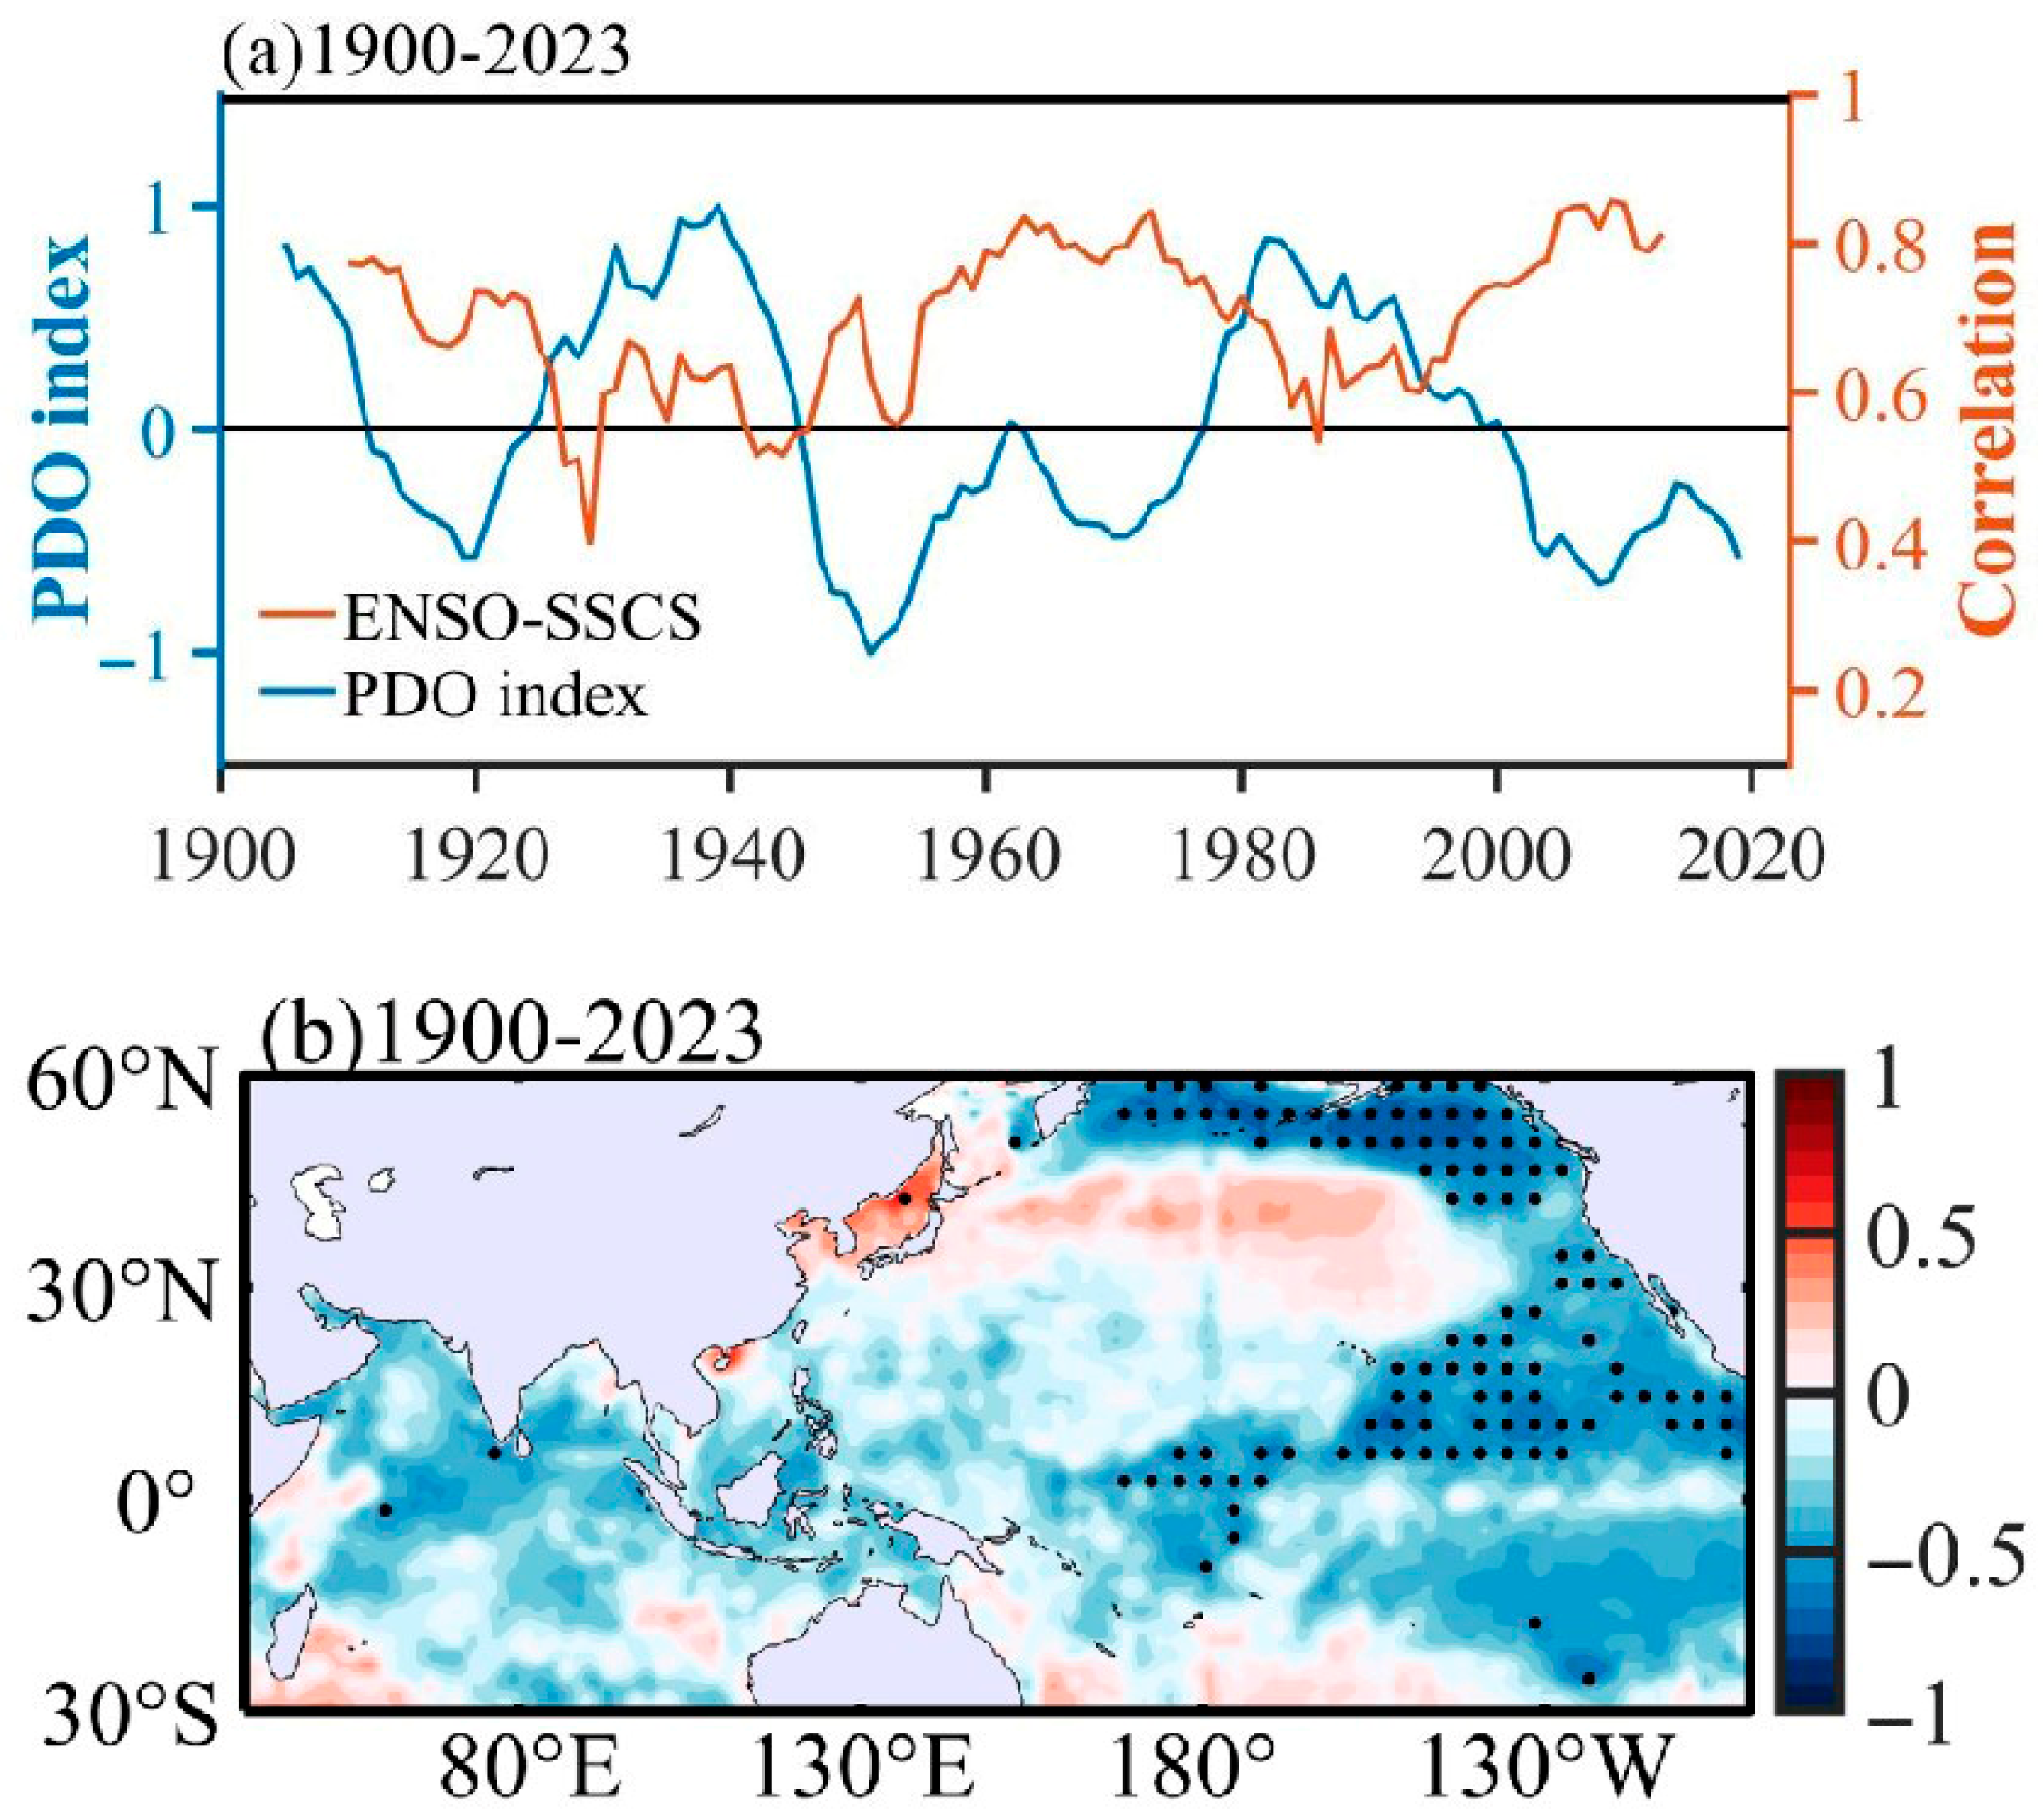
The 21-year sliding correlation coefficient between the Niño 3.4 index and the SSCS SST reveals an interdecadal shift that is significantly stronger during the negative phase of the PDO compared to the positive phase, with the correlation coefficient reaching −0.5 (Figure 2a). Crucially, this correlation reflects year-to-year relationships between SST in the El Niño core region (120–170° W, 5° S–5° N, tropical central-eastern Pacific) and SSCS winter SST. The ESR represents a discrete manifestation during specific conditions when Niño3.4 indexes meet threshold criteria. In addition, similar results are observed using sliding window lengths ranging from 15 to 25 years with an interval of two years, demonstrating that the findings are robust and not overly sensitive to the precise length choice of window. Subsequently, we correlate the 21-year sliding correlation coefficients between the SSCS SST anomalies and Niño-3.4 index over the period 1910–2013 (orange line in Figure 2a) with the global 11-year running mean SST (Figure 2b). It is shown that negative correlations are predominantly located off the west coast of North America, while positive correlations are found in the mid-latitude of the North Pacific Ocean, which is consistent with the spatial modes of the negative PDO phase (Figure 2b). It suggests that the ESR exhibits significant interdecadal variability that is highly inversely correlated with the PDO.
Based on the classification results (see Table 1), we present a scatterplot illustrating the relationship between ENSO and winter SSCS SST during both positive and negative PDO phases (Figure 3), where red (blue) triangles denote positive (negative) SSTA. During the positive PDO phase, 10 of the 13 El Niño events are associated with positive SST anomalies in the SSCS, while the remaining 3 events correspond to negative anomalies. As El Niño intensity increases, a general tendency for SSCS SST to rise is observed, albeit with considerable variability as evidenced by a large standard deviation. During the negative PDO phase, 23 El Niño events led to positive SSCS SST anomalies, and only 3 events resulted in negative anomalies. Compared to the positive PDO phase, both the Niño3.4 index and the range of SSCS SSTA are smaller in magnitude and more tightly clustered (0–0.6 °C) during the negative PDO phase, indicating a stronger and more consistent relationship between ENSO and SSCS SST. These results suggest that the ESR is more pronounced and stable during the negative PDO phase, which is consistent with the results shown in Figure 2.
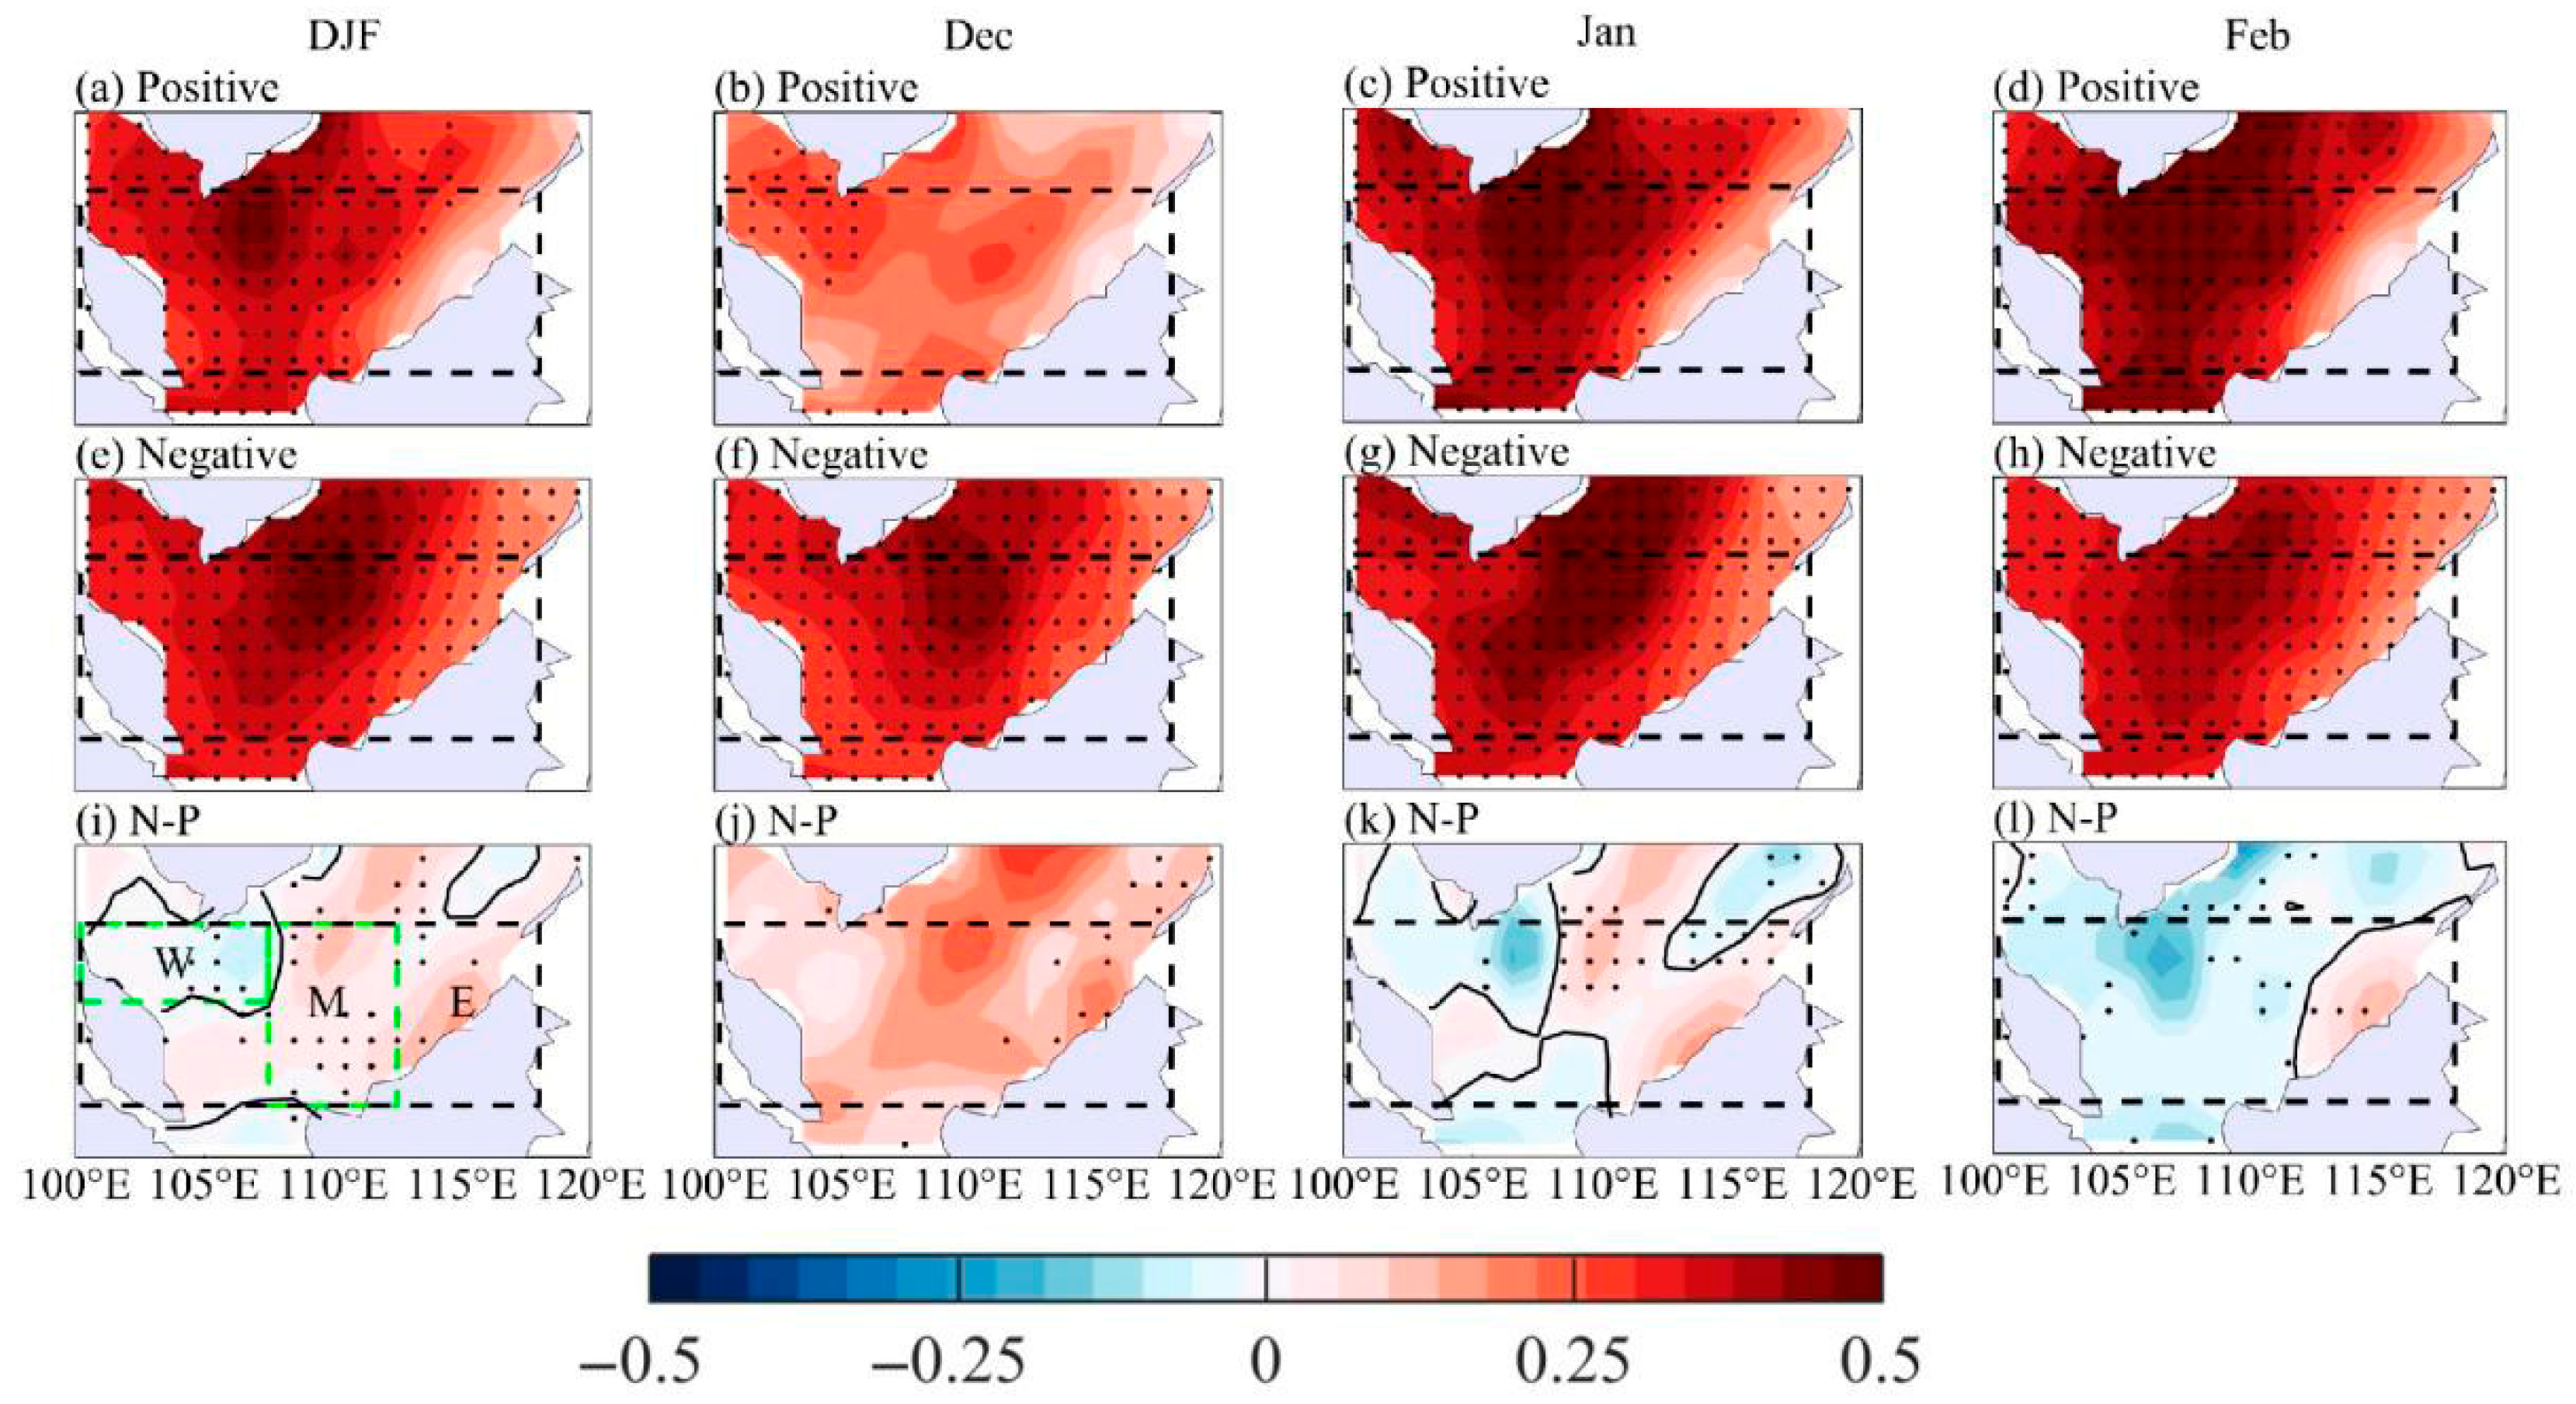
Based on the classification of El Niño events presented in Table 1, we further examine the differences in the spatial and temporal characteristics of ESR during two PDO phases using composite analysis. Figure 4 displays the results of this composite analysis, showing the winter and month-to-month SSCS SSTA during positive PDO phase, negative PDO phase, and the negative minus positive PDO phase (N-P). The black dashed rectangular box highlights the defined SSCS region, located within the band of 2–9° N and 100–118° E. Winter SSCS SST is significantly increased during El Niño events in both the positive and negative PDO phases, with a more pronounced warming in the negative phase, with an overall increase of approximately 0.4 °C (Figure 4a–e). During the positive PDO phase, the warming center is located off southern Vietnam, while during the negative phase, it shifts 45° northeastward to the southeastern coast of Vietnam. Consequently, the overall SSCS region in the N-P composite exhibits a positive SSTA (Figure 4i), consistent with the results illustrated in Figure 2 and Figure 3, indicating that the ESR is more distinct and stable during the negative PDO phase. For N-P composite, the SSTA distribution within the SSCS exhibits notable latitudinal heterogeneity, with anomalous cooling observed in the western part of the region (6–9° N, 100–107° E), while significant warming occurs in the central (2–9° N, 108–112° E) and eastern (2–9° N, 113–116° E) regions. This spatial pattern is closely associated with the differences in the locations of the warming centers between the two PDO phases.
The month-to-month evolution of the winter ESR during different PDO phases is further examined. During the positive PDO phase, the warming trend of SSCS SST gradually intensifies from December to February under the influence of El Niño (Figure 4b–d). In contrast, during the negative PDO phase, the SST warming in the SSCS becomes significant in December, peaks in January, and weakens by February (Figure 4f–h). Consequently, in the N-P composite, the entire SSCS exhibits notable positive SST anomalies in December, particularly in the central and eastern regions, with a maximum anomaly of 0.25 °C (Figure 4i). However, in January of the following year, the spatial distribution of SST anomalies displays a “west-cooling and east-warming” dipole pattern, with the boundary between cold and warm anomalies located near 107° E. The western region experiences a minimum anomaly of −0.2 °C, while the central and eastern regions exhibit a maximum of 0.2 °C (Figure 4k). By February of the following year, the cold-warm boundary shifts eastward to approximately 112° E, and the cold SST anomalies intensify, reaching a minimum of −0.25 °C (Figure 4l). These results indicate that the “west-cooling and east-warming” spatial pattern becomes increasingly pronounced from December to February in the N-P composite.
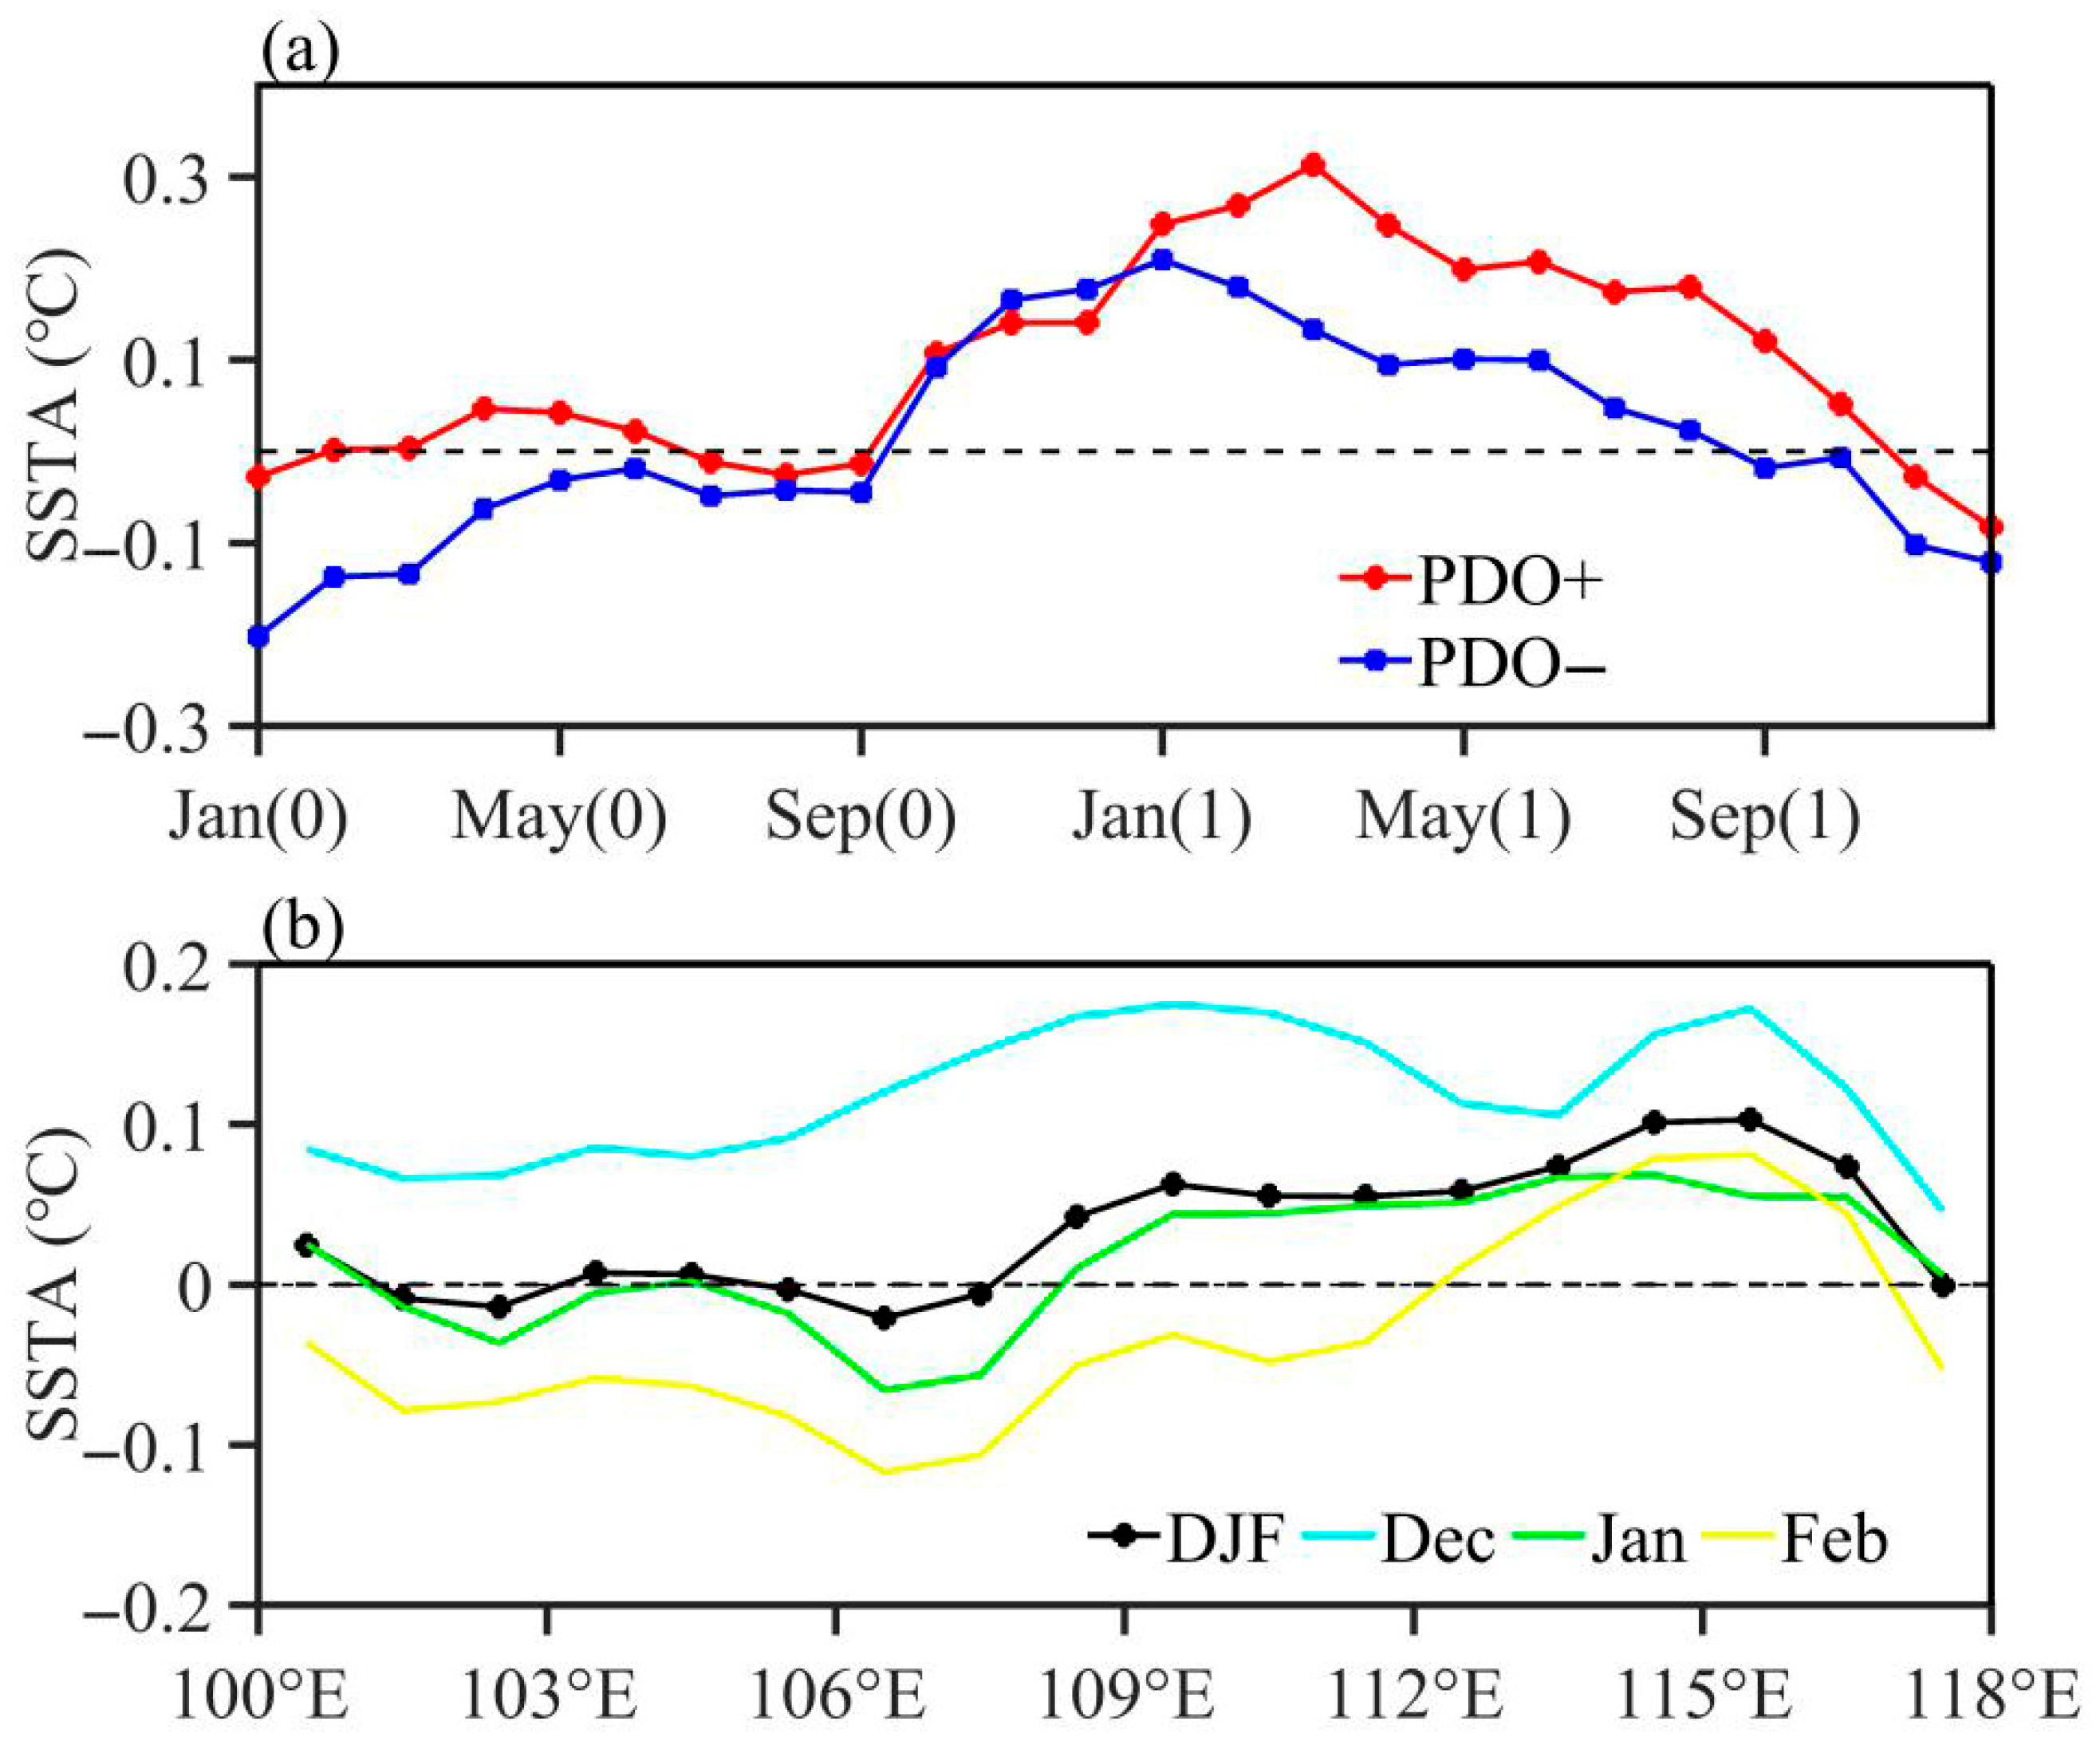
The spatial and temporal evolution of the ESR in the N-P composite is presented in Figure 5. During the positive PDO phase, El Niño-induced warming of the SSCS SST begins in October, peaks in March of the following year, and gradually weakens thereafter, turning into a negative anomaly by November (Figure 5a). In contrast, during the negative PDO phase, the maximum El Niño-induced SSCS SST occurs in January of the following year and shifts to a negative anomaly by September, which may be related to the influence of the PDO on El Niño intensity [36,37]. Consequently, the ESR exhibits a stronger response during the negative PDO phase in November and December and shifts to a significant response during the positive PDO phase since January of the following year.
Latitudinal averaging of SCS SSTA in the N-P composite (Figure 5b) reveals that the winter SSCS exhibits weak cooling in the region west of 107° E and significant warming in the region east of this longitude. The month-to-month spatial and temporal evolution of the ESR further reveals that the entire SSCS displays notable positive SSTA in December (blue line). In January of the following year, the overall SSTA decreases, with warming primarily confined to the area east of approximately 108° E, while negative anomalies are observed over the region west of this longitude (green line), consistent with the findings of Figure 4k. During the negative PDO phase, the ESR peaks in January (0.2 °C) and subsequently declines, whereas warming persists during the positive PDO phase. As a result, the positive (negative) SST anomalies in the SSCS during February of the following year in the N-P composite become further compressed (expanded), appearing east (west) of approximately 112° E (yellow line). Based on Figure 4 and Figure 5, it is evident that under El Niño conditions, the winter SSCS SST is more pronounced during the negative PDO phase compared to the positive PDO phase. However, a distinct “west-cooling and east-warming” pattern emerges starting in January and intensifies in February of the following year.

3.2. Thermodynamic Processes

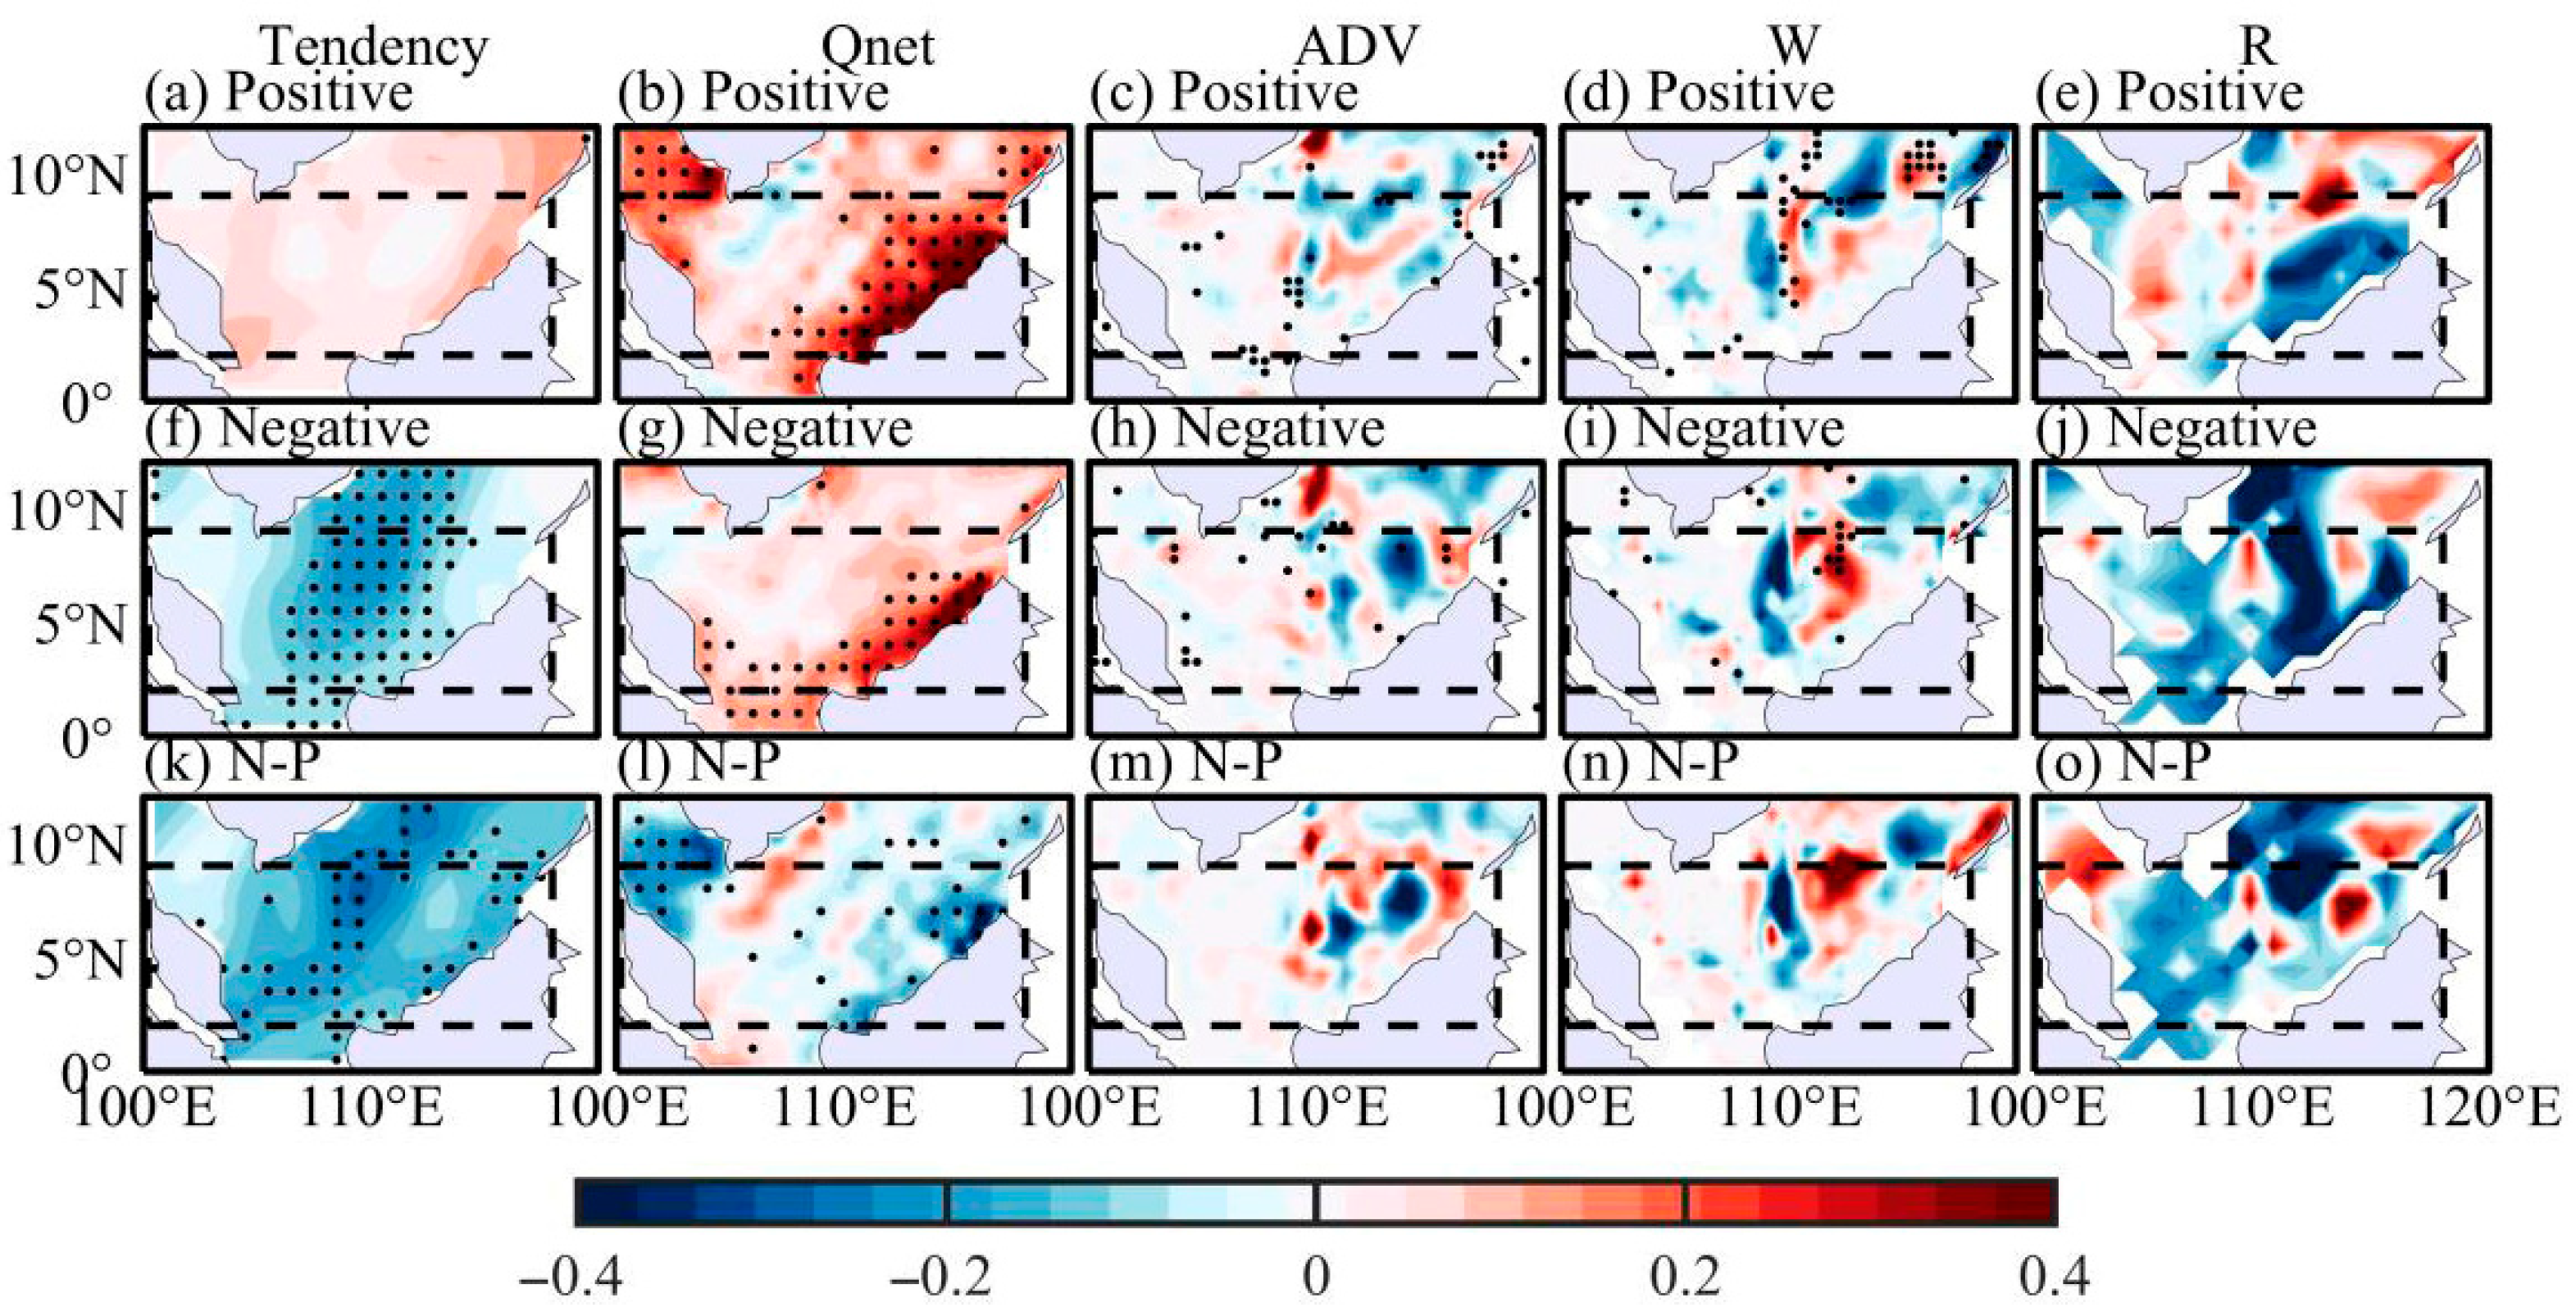
To qualitatively assess the relative contribution of local thermodynamic processes to the SSCS SST, a mixed-layer heat budget analysis is conducted based on Equation (1). Table 2 summarizes the contribution of each component of the mixed-layer heat budget equation (Equation (1)) to the SST tendency in the N-P composite in winter months. As shown in Figure 6c, the western part of the SSCS exhibits a cooling tendency (−0.09 °C/month) in SST during winter. By integrating the spatial distribution of local heat budget terms with the statistical results presented in Table 2, it can be inferred that the net heat flux term exhibits a significant negative anomaly (−0.05 °C/month), which plays a dominant role in the cooling tendency of SST. Meanwhile, the contributions of the horizontal heat advection and vertical entrainment terms are negligible. It should be noted that residual term also plays a significant role.
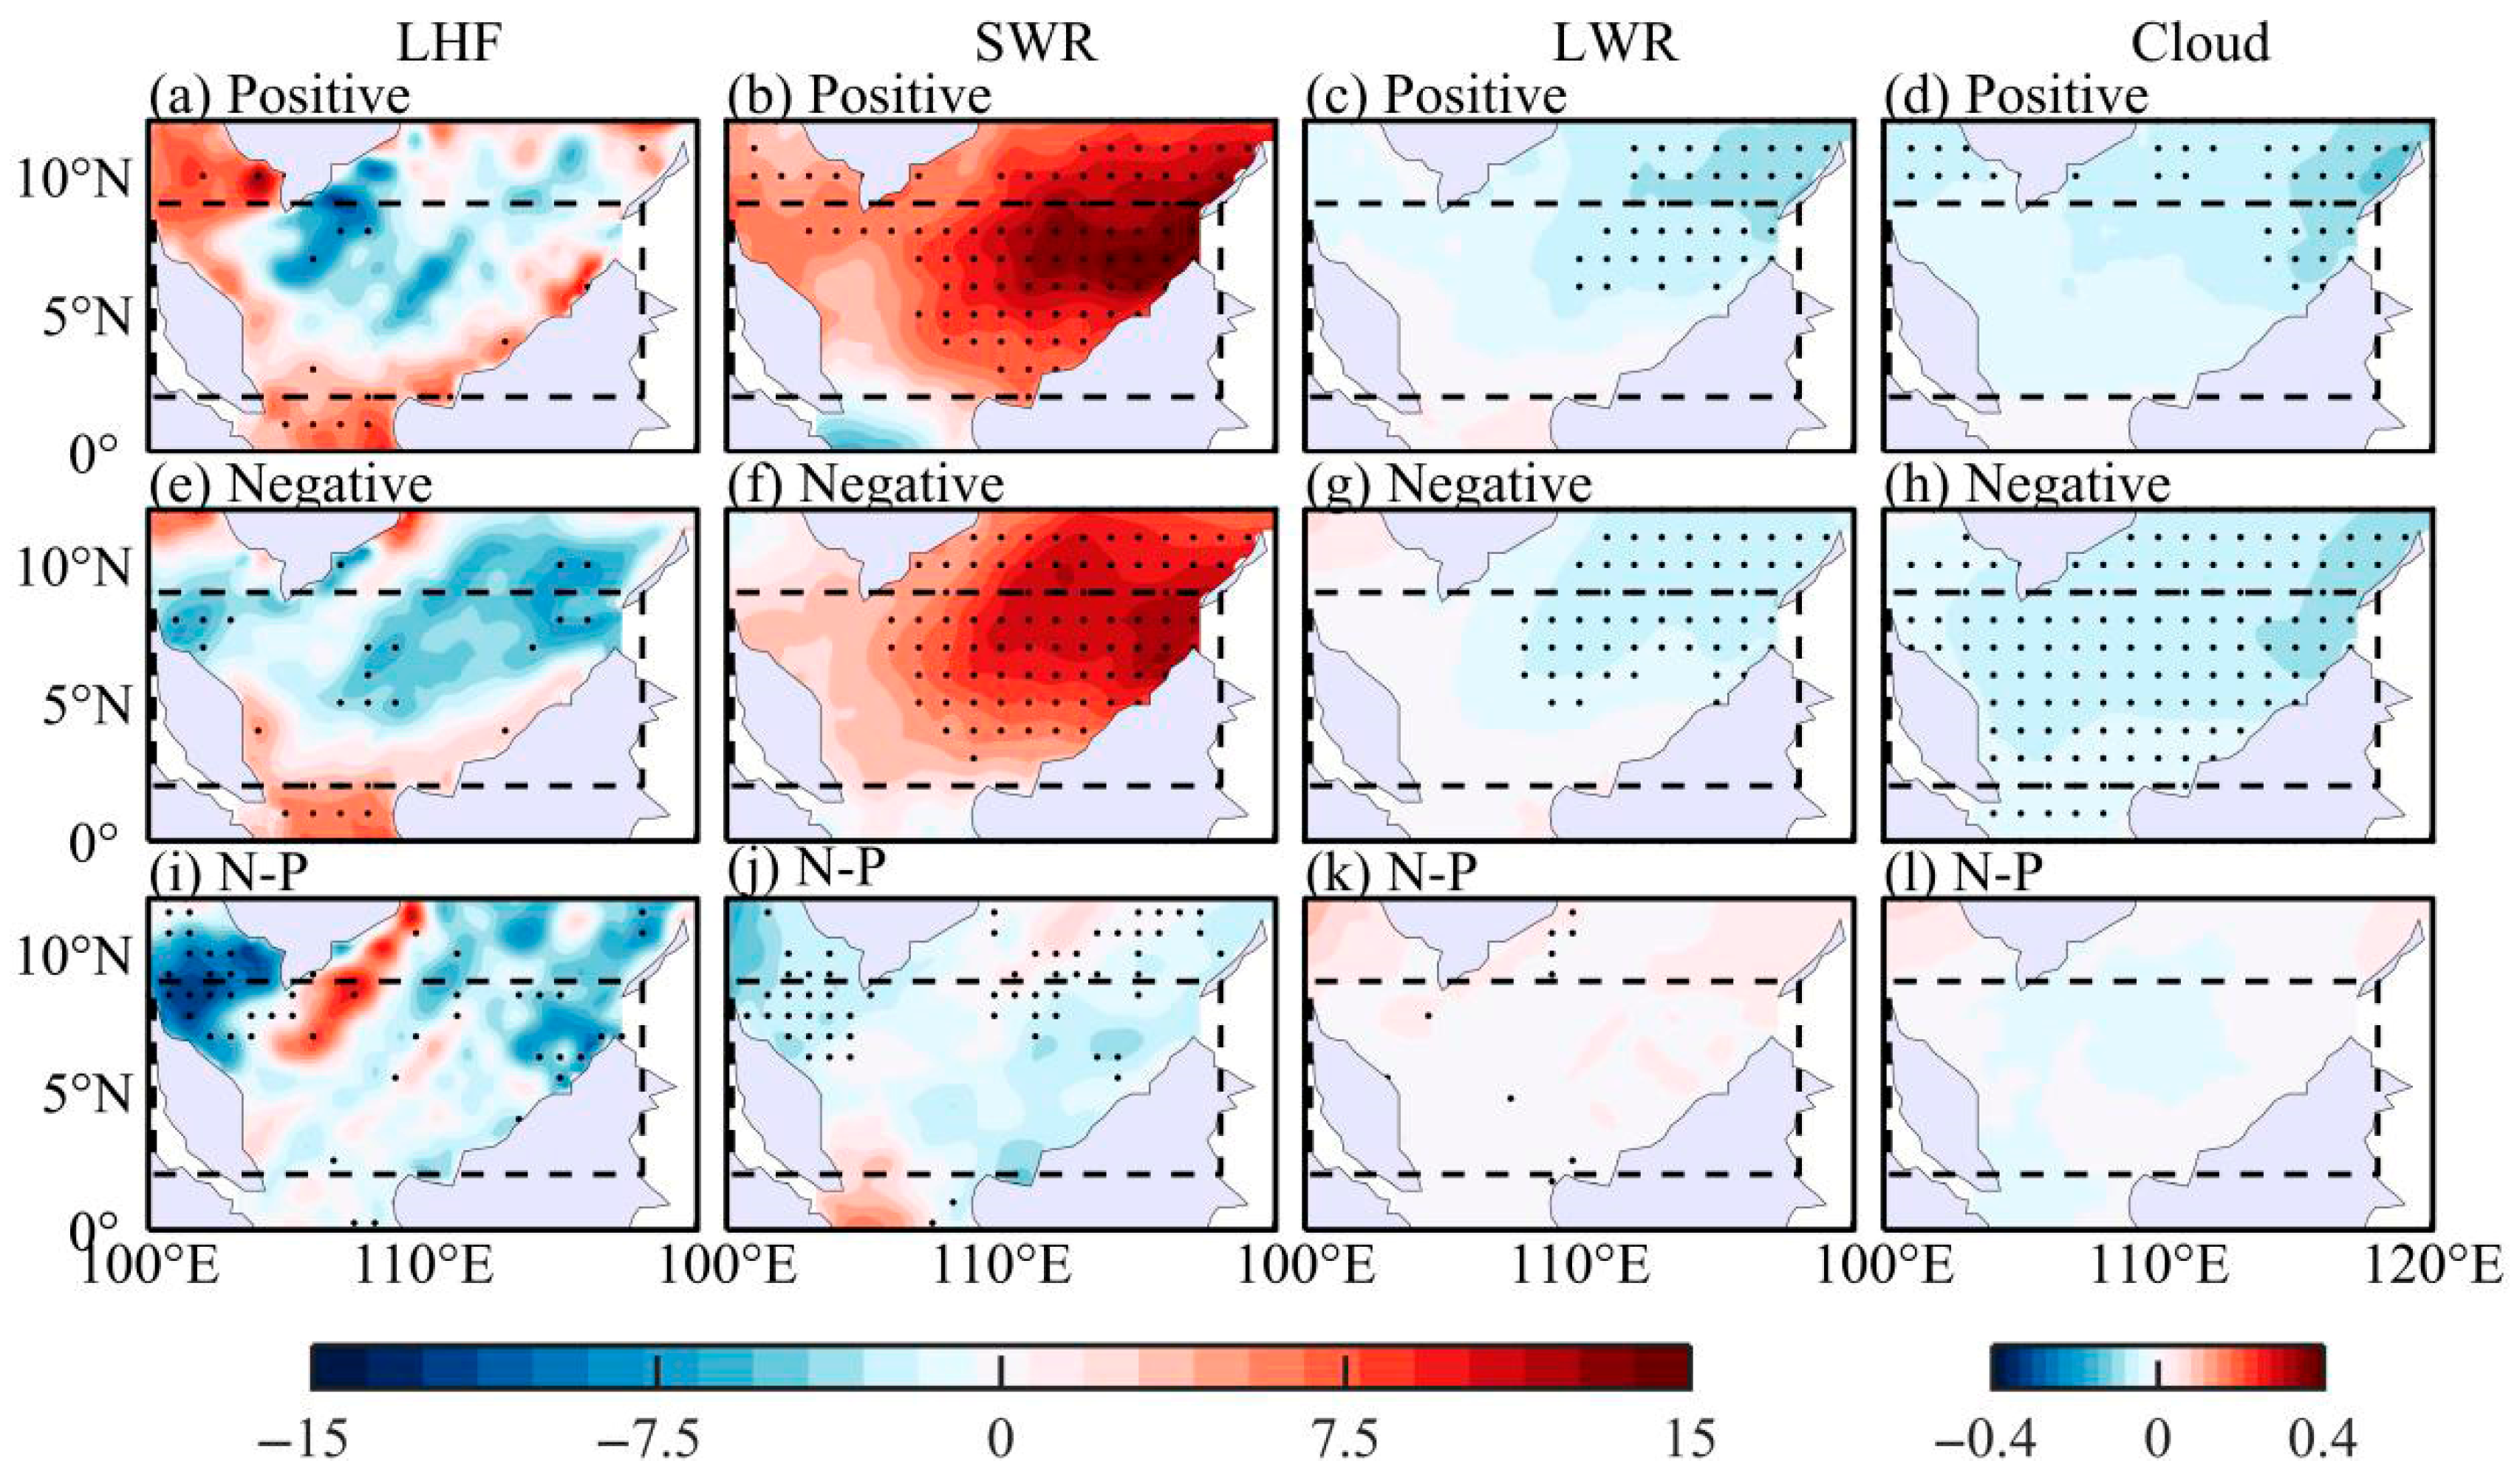
Figure 7 illustrates the spatial and temporal evolution characteristics of the net surface heat flux components in the SSCS. In the western part of the SSCS, variations in net surface heat flux are primarily governed by latent heat flux, which exhibits a significant negative anomaly. Although shortwave and longwave radiations also contribute to anomalous fluxes, their magnitudes are considerably smaller compared to that of latent heat flux. Among the four components, the sensible heat flux remains comparatively minor throughout the winter months.
In the central SSCS, a significant cooling tendency of SST is attributed to the net heat flux term, with a warming amplitude reaching −0.04 °C/month, and vertical entrainment term playing a relatively minor role. Notably, in the eastern region, the SST cooling tendency is predominantly driven by the net heat flux term (−0.09 °C/month). This observed zonal SST contrast may be associated with the spatial structure of the regional wind field and the heterogeneity of oceanic dynamic processes. The subsequent analysis (Section 3.3) will focus on the modulation mechanism of wind field distribution on local thermodynamic processes, particularly examining the synergistic effects of multiple anticyclones on anomalous meridional winds. This investigation aims to provide new insights into the multiscale mechanisms underlying the interannual variability of SSCS SST.
The temporal evolution of winter thermodynamical processes across different regions of the SSCS (Figure 8 and Figure 9) can be further elaborated as follows: in the N-P composite, the western region of the SSCS exhibits a significant positive anomaly in the latent heat flux (0.3 °C/month) during December, which substantially exceeds the negative anomaly of the vertical entrainment term (−0.003 °C/month). Concurrently, the residual term dominates the cooling tendency of SST, while the negative horizontal heat advection term exerts a relatively minor influence. Collectively, these factors lead to the anomalous variation in SST tendency in this region (Figure 8a). Following January of the subsequent year, the latent heat flux shifts from positive to negative, signaling the onset of the cooling tendency in the western region, while the vertical entrainment term starts to depress the cooling tendency. By February of the following year, the negative latent heat flux amplifies (−0.21 °C/month), and the evaporative cooling effect reaches its peak. This process significantly amplified the SST cooling tendency in the western part of the SSCS in synergy with the vertical entrainment term.
In the central region, the significant cooling tendency of SST in December is primarily attributed to the vertical entrainment term (−0.12 °C/month) and the horizontal heat advection term plays a secondary role. In January of the following year, due to the reduction in negative vertical entrainment term, the cooling SST tendency reduces to −0.06 °C/month. By February, the latent heat flux exhibits a sharp decrease, and the net surface heat flux term shifts from positive to negative. This shift establishes a synergistic cooling mechanism involving three key components—the horizontal heat advection, vertical entrainment, and net surface heat flux terms—that collectively drive a pronounced SST cooling tendency.
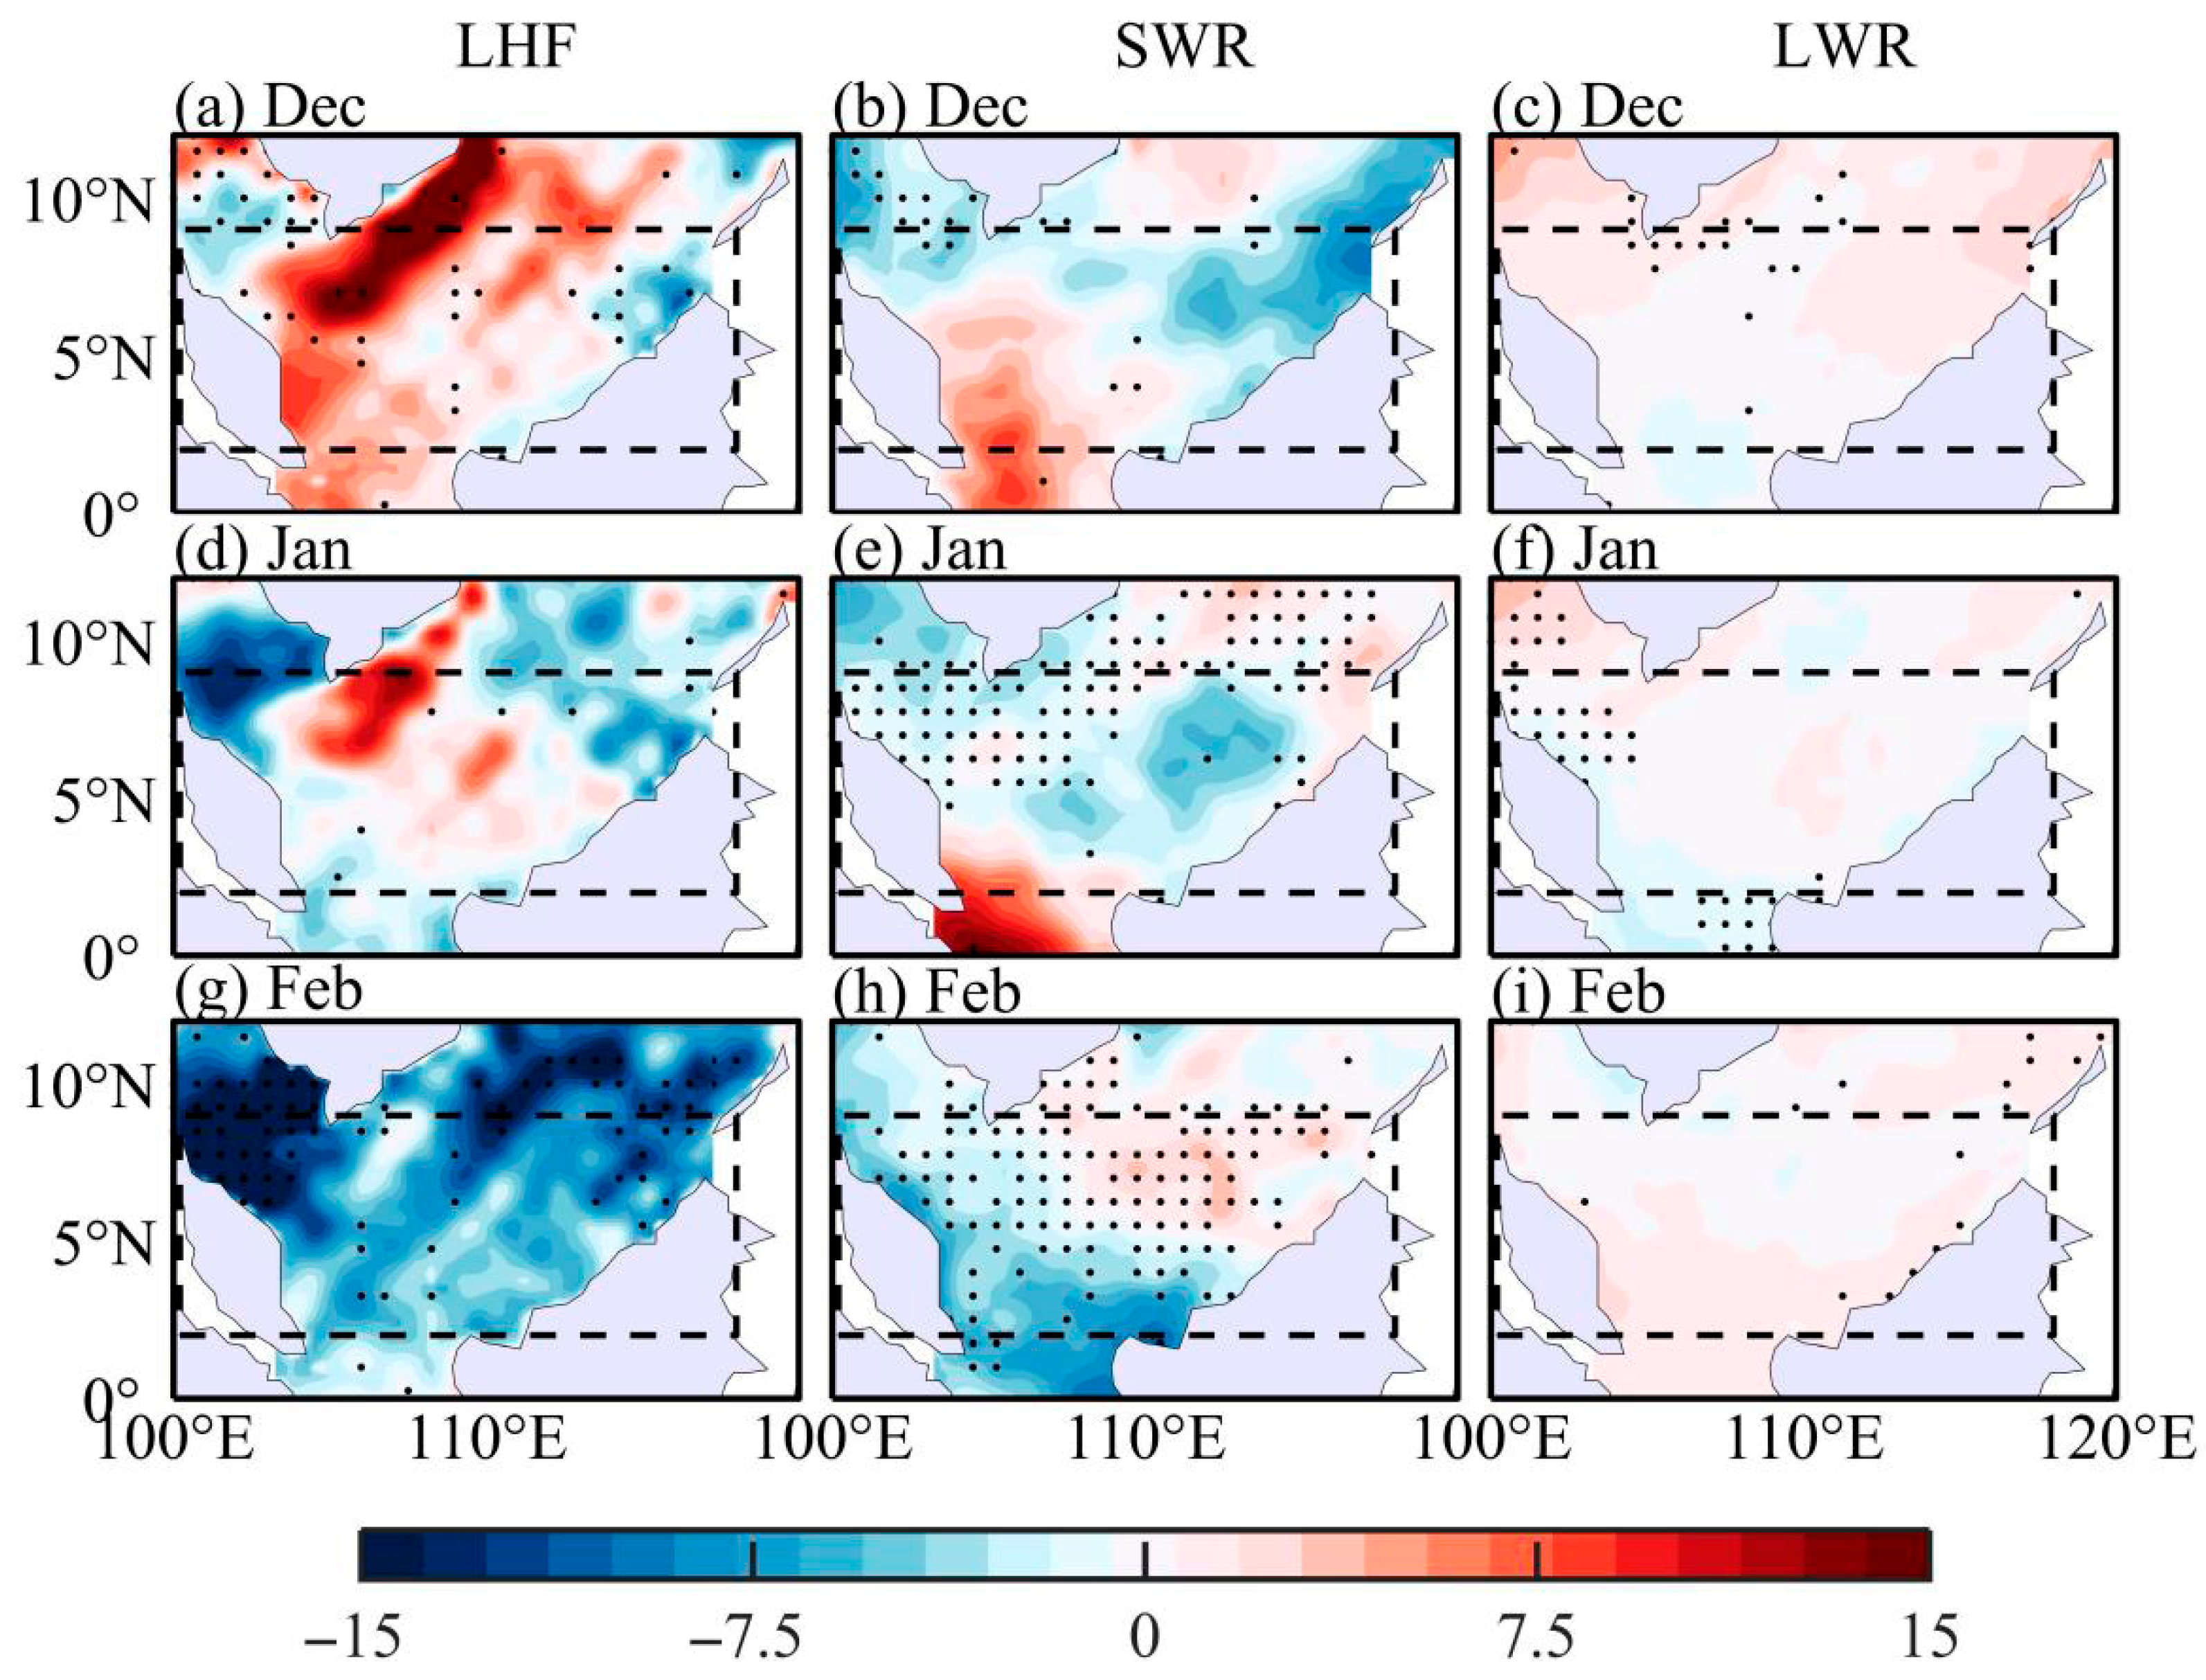
The eastern region exhibits distinct thermodynamical characteristics: the negative anomaly of the net heat flux term persists throughout the winter and remains the primary contributor to the SST cooling tendency. However, in contrast to the gradual cooling tendency observed in the western and central regions, the eastern region reaches its minimum SST in January of the following year, followed by a slight rebound in February (Figure 5b). This anomalous behavior is primarily attributed to inter-month variations in longwave radiation (Figure 9c,f,i). Although both the horizontal heat advection and latent heat flux terms exhibit a decreasing trend from December to February, which would typically lead to progressive SST cooling, longwave radiation in December and February is significantly stronger than in January. This results in a unique “strong radiation–weak cooling” equilibrium, leading to greater SST warming during these months compared to January. The differential influence of longwave radiation on the eastern part of the SSCS across winter months will be further examined through the lens of a positive feedback mechanism in the subsequent analysis.

3.3. Synergy of the Multi-Anticyclone Systems

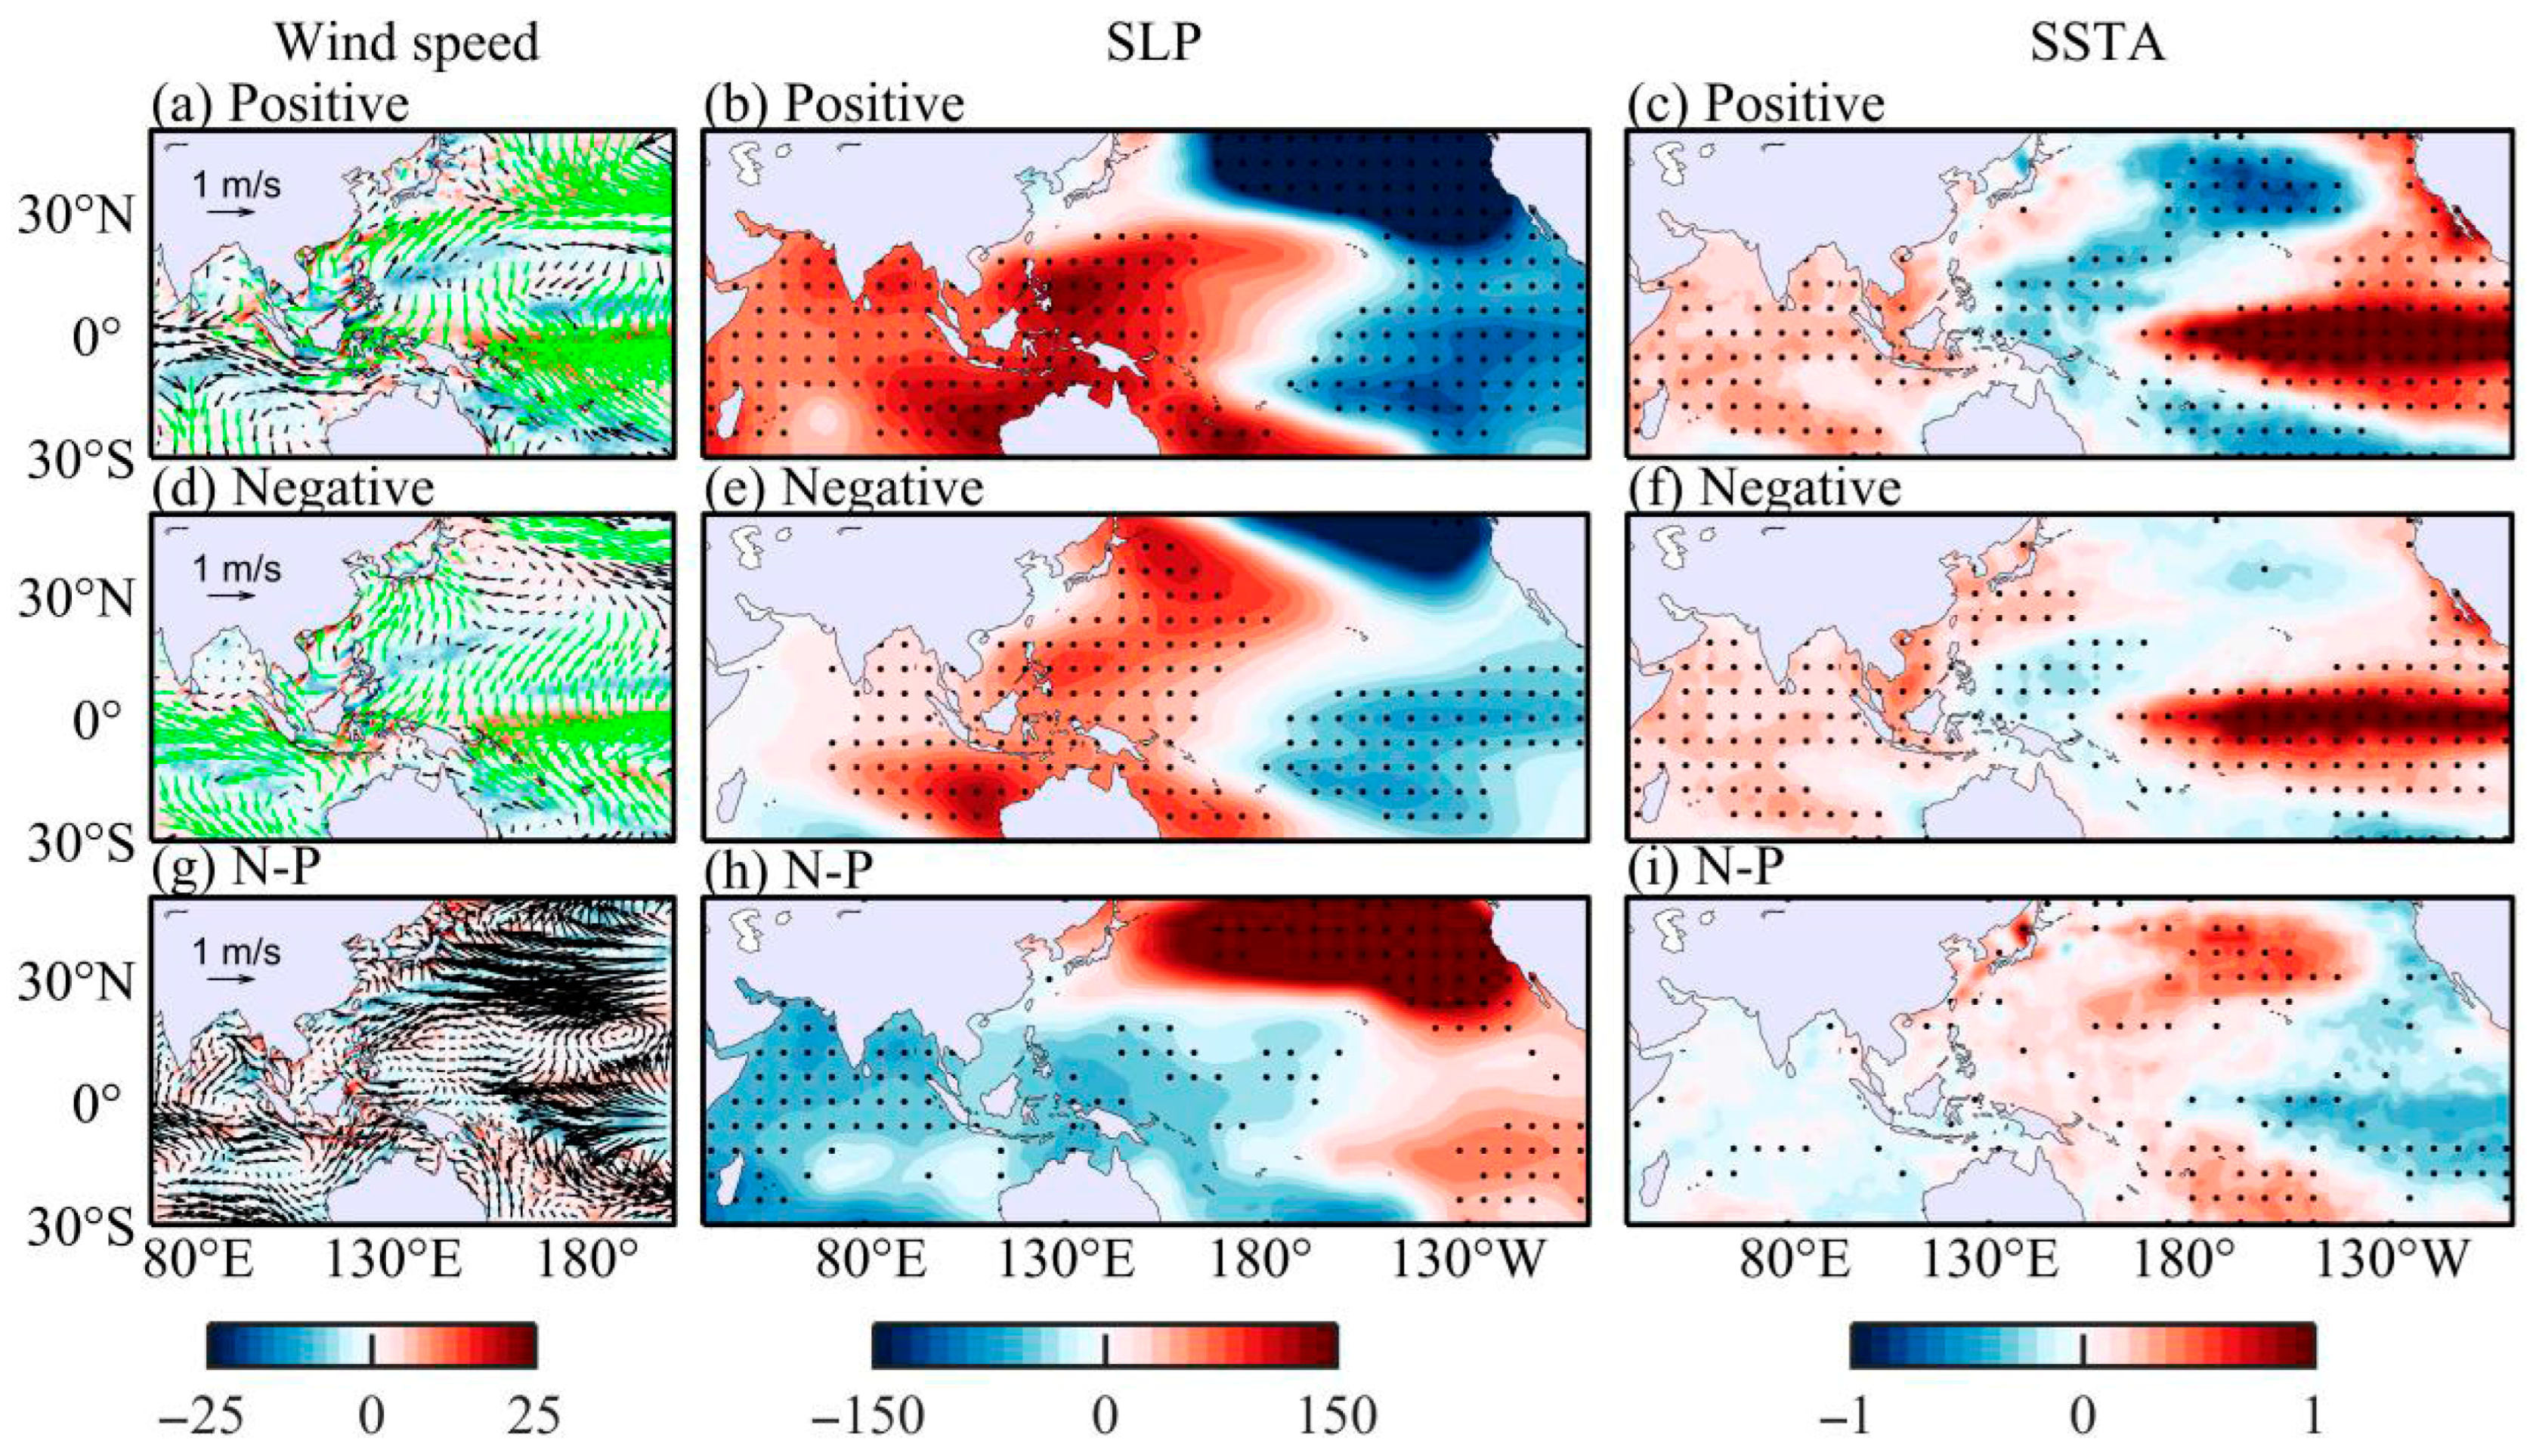
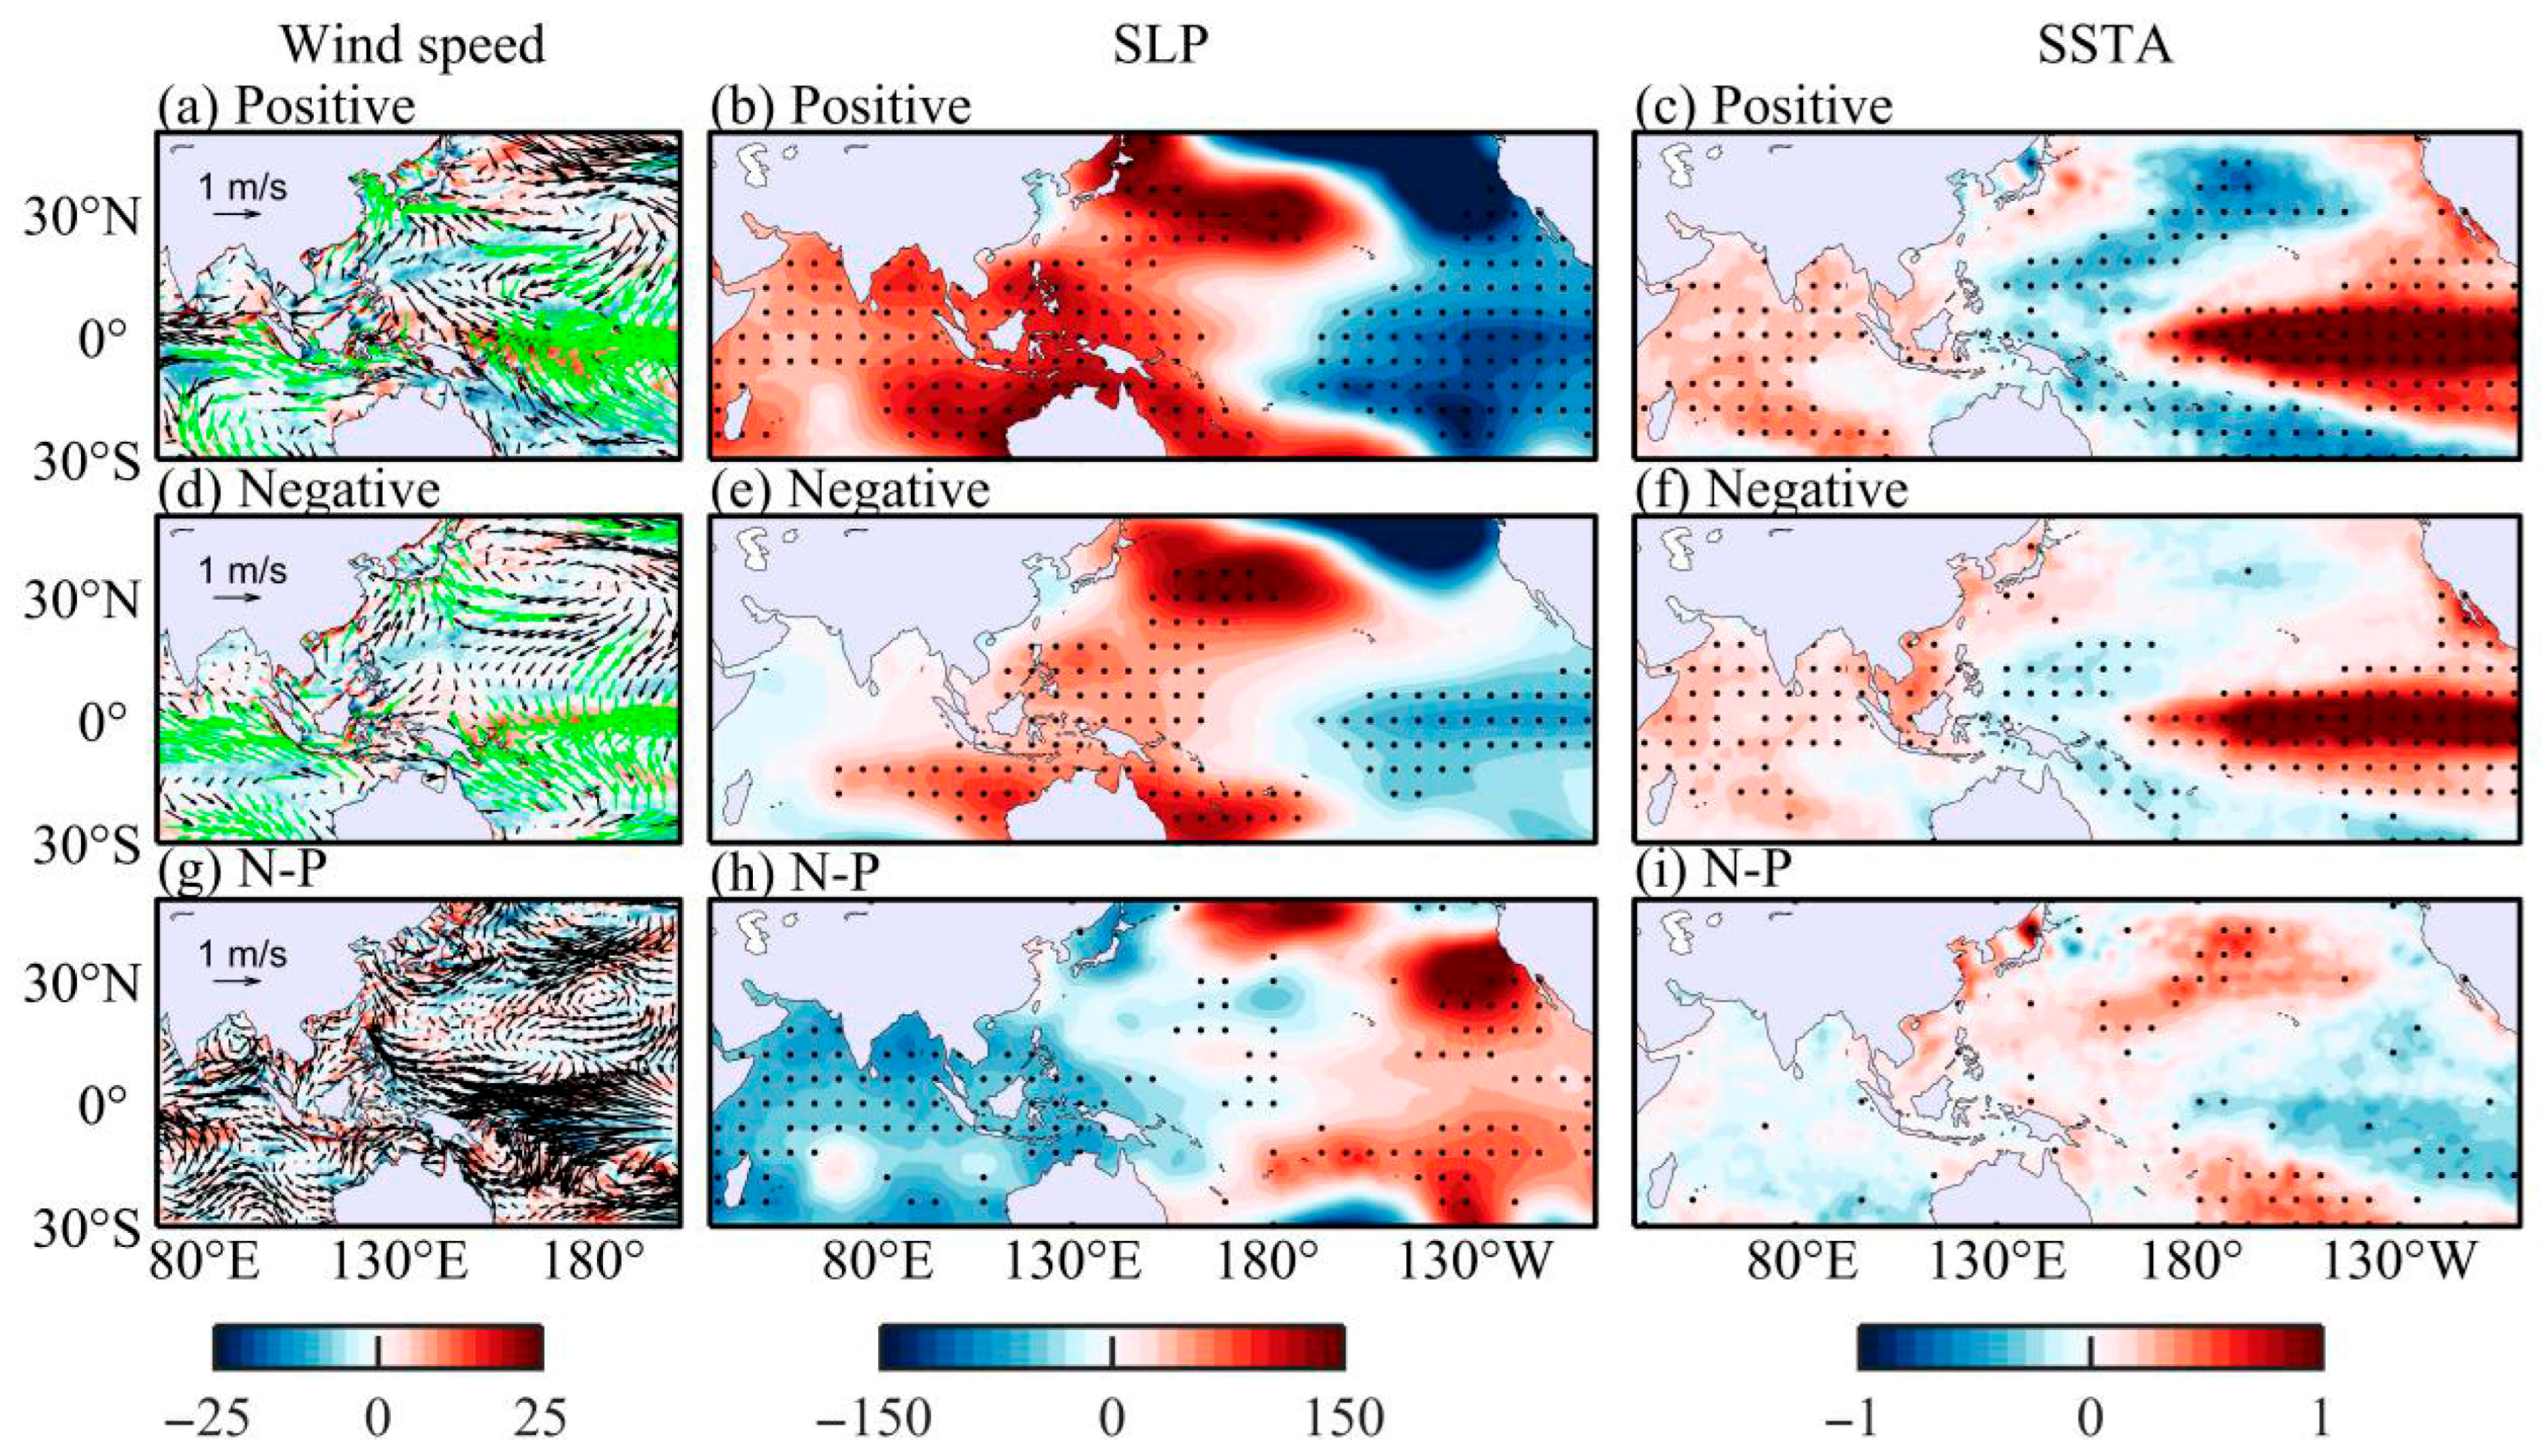
The mechanisms underlying the differences in local thermodynamic processes in the SCS can be attributed to variations in air—sea interactions across the Indo-Pacific during different phases of the PDO, as illustrated in Figure 10. El Niño intensity is significantly enhanced during the positive PDO phase, with a warming magnitude exceeding 1 °C/month, which is consistent with findings from previous studies [36,37]. Specifically, SST in the east-central equatorial Pacific is markedly elevated during the positive PDO phase (Figure 10c). Through the Gill response mechanism, this warming induces a larger cool pool in the western Pacific, which in turn triggers a stronger PSAC and SIOAC, with sea level pressure (SLP) anomalies reaching up to 150 Pa (Figure 10a,b). Simultaneously, the Aleutian low intensifies, resulting in the PSAC being confined to latitudes south of 25° N while exhibiting a broader meridional extent [38]. This meridional expansion of the anticyclonic circulation facilitates the development of robust easterly wind anomalies over the SSCS.
Additionally, the southeasterly winds on the northern flank of the SIOAC turn westward upon entering the tropical Indian Ocean due to the Coriolis effect, and further deflect to the right after crossing the equator, generating a southerly wind component over the SCS. However, the strengthening and southward displacement of the PSAC, together with the anomalous anticyclone over the northern Indian Ocean (with its center located in the Bay of Bengal), result in the formation of a persistent high-pressure anomaly in the northern tropical Indo-Pacific. This anomalous high-pressure system suppresses the development of cross-equatorial southerly anomalies, thereby favoring the dominance of easterly wind anomalies in the tropical Indian Ocean. Consequently, the easterly component becomes predominant in the low-level wind field over the SSCS (Figure 10a).
In contrast, the El Niño intensity during the negative PDO phase is weaker (Figure 10f,i), leading to a corresponding weakening of the PSAC excited through the Gill response mechanism (Figure 10d,e). At the same time, the Aleutian low shifts northward, causing the PSAC to extend northeastward to approximately 50° N. Consequently, the SSCS moves from being located on the southern flank of the PSAC during the positive PDO phase to the southwestern flank, resulting in an overall southeasterly wind anomaly during the negative PDO phase. Furthermore, the disappearance of the NIOAC, along with the weakening and northeastward displacement of the PSAC during the negative PDO phase, facilitates the entry of cross-equatorial southerly winds—originating from the SEOIAC—into the SCS. Under the synergistic influence of multiple anticyclonic systems, anomalous southerly winds during the negative PDO phase are more conducive to triggering significant warming of the SSCS SSTA (Figure 10g,h).
As noted in Section 3.2, the fundamental cause of the “west-cooling and east-warming” SSTA pattern in the SSCS associated with El Niño in the N-P composite lies in the spatial differences among the vertical entrainment term, the horizontal heat advection term, and the latent heat flux term. These differences are closely linked to the zonal transition of wind stress curl from positive in the west to negative in the east (Figure 10g). In the western region, the upwelling of cold water induced by positive wind stress curl (manifested as a negative anomaly in the vertical entrainment term) outweighs the reduction in evaporative cooling caused by the southerly wind anomaly (positive latent heat flux anomaly), resulting in a net negative SST anomaly during winter. In the central region, the weakened wind stress curl reduces the cooling effect of vertical entrainment, while the combined influence of latent heat flux and horizontal heat advection leads to a positive SST anomaly. In the eastern region, the positive vertical entrainment term triggered by negative wind stress curl, together with the positive latent heat flux and horizontal heat advection terms associated with the southwesterly wind anomaly, collectively contribute to the formation of positive SST anomalies.
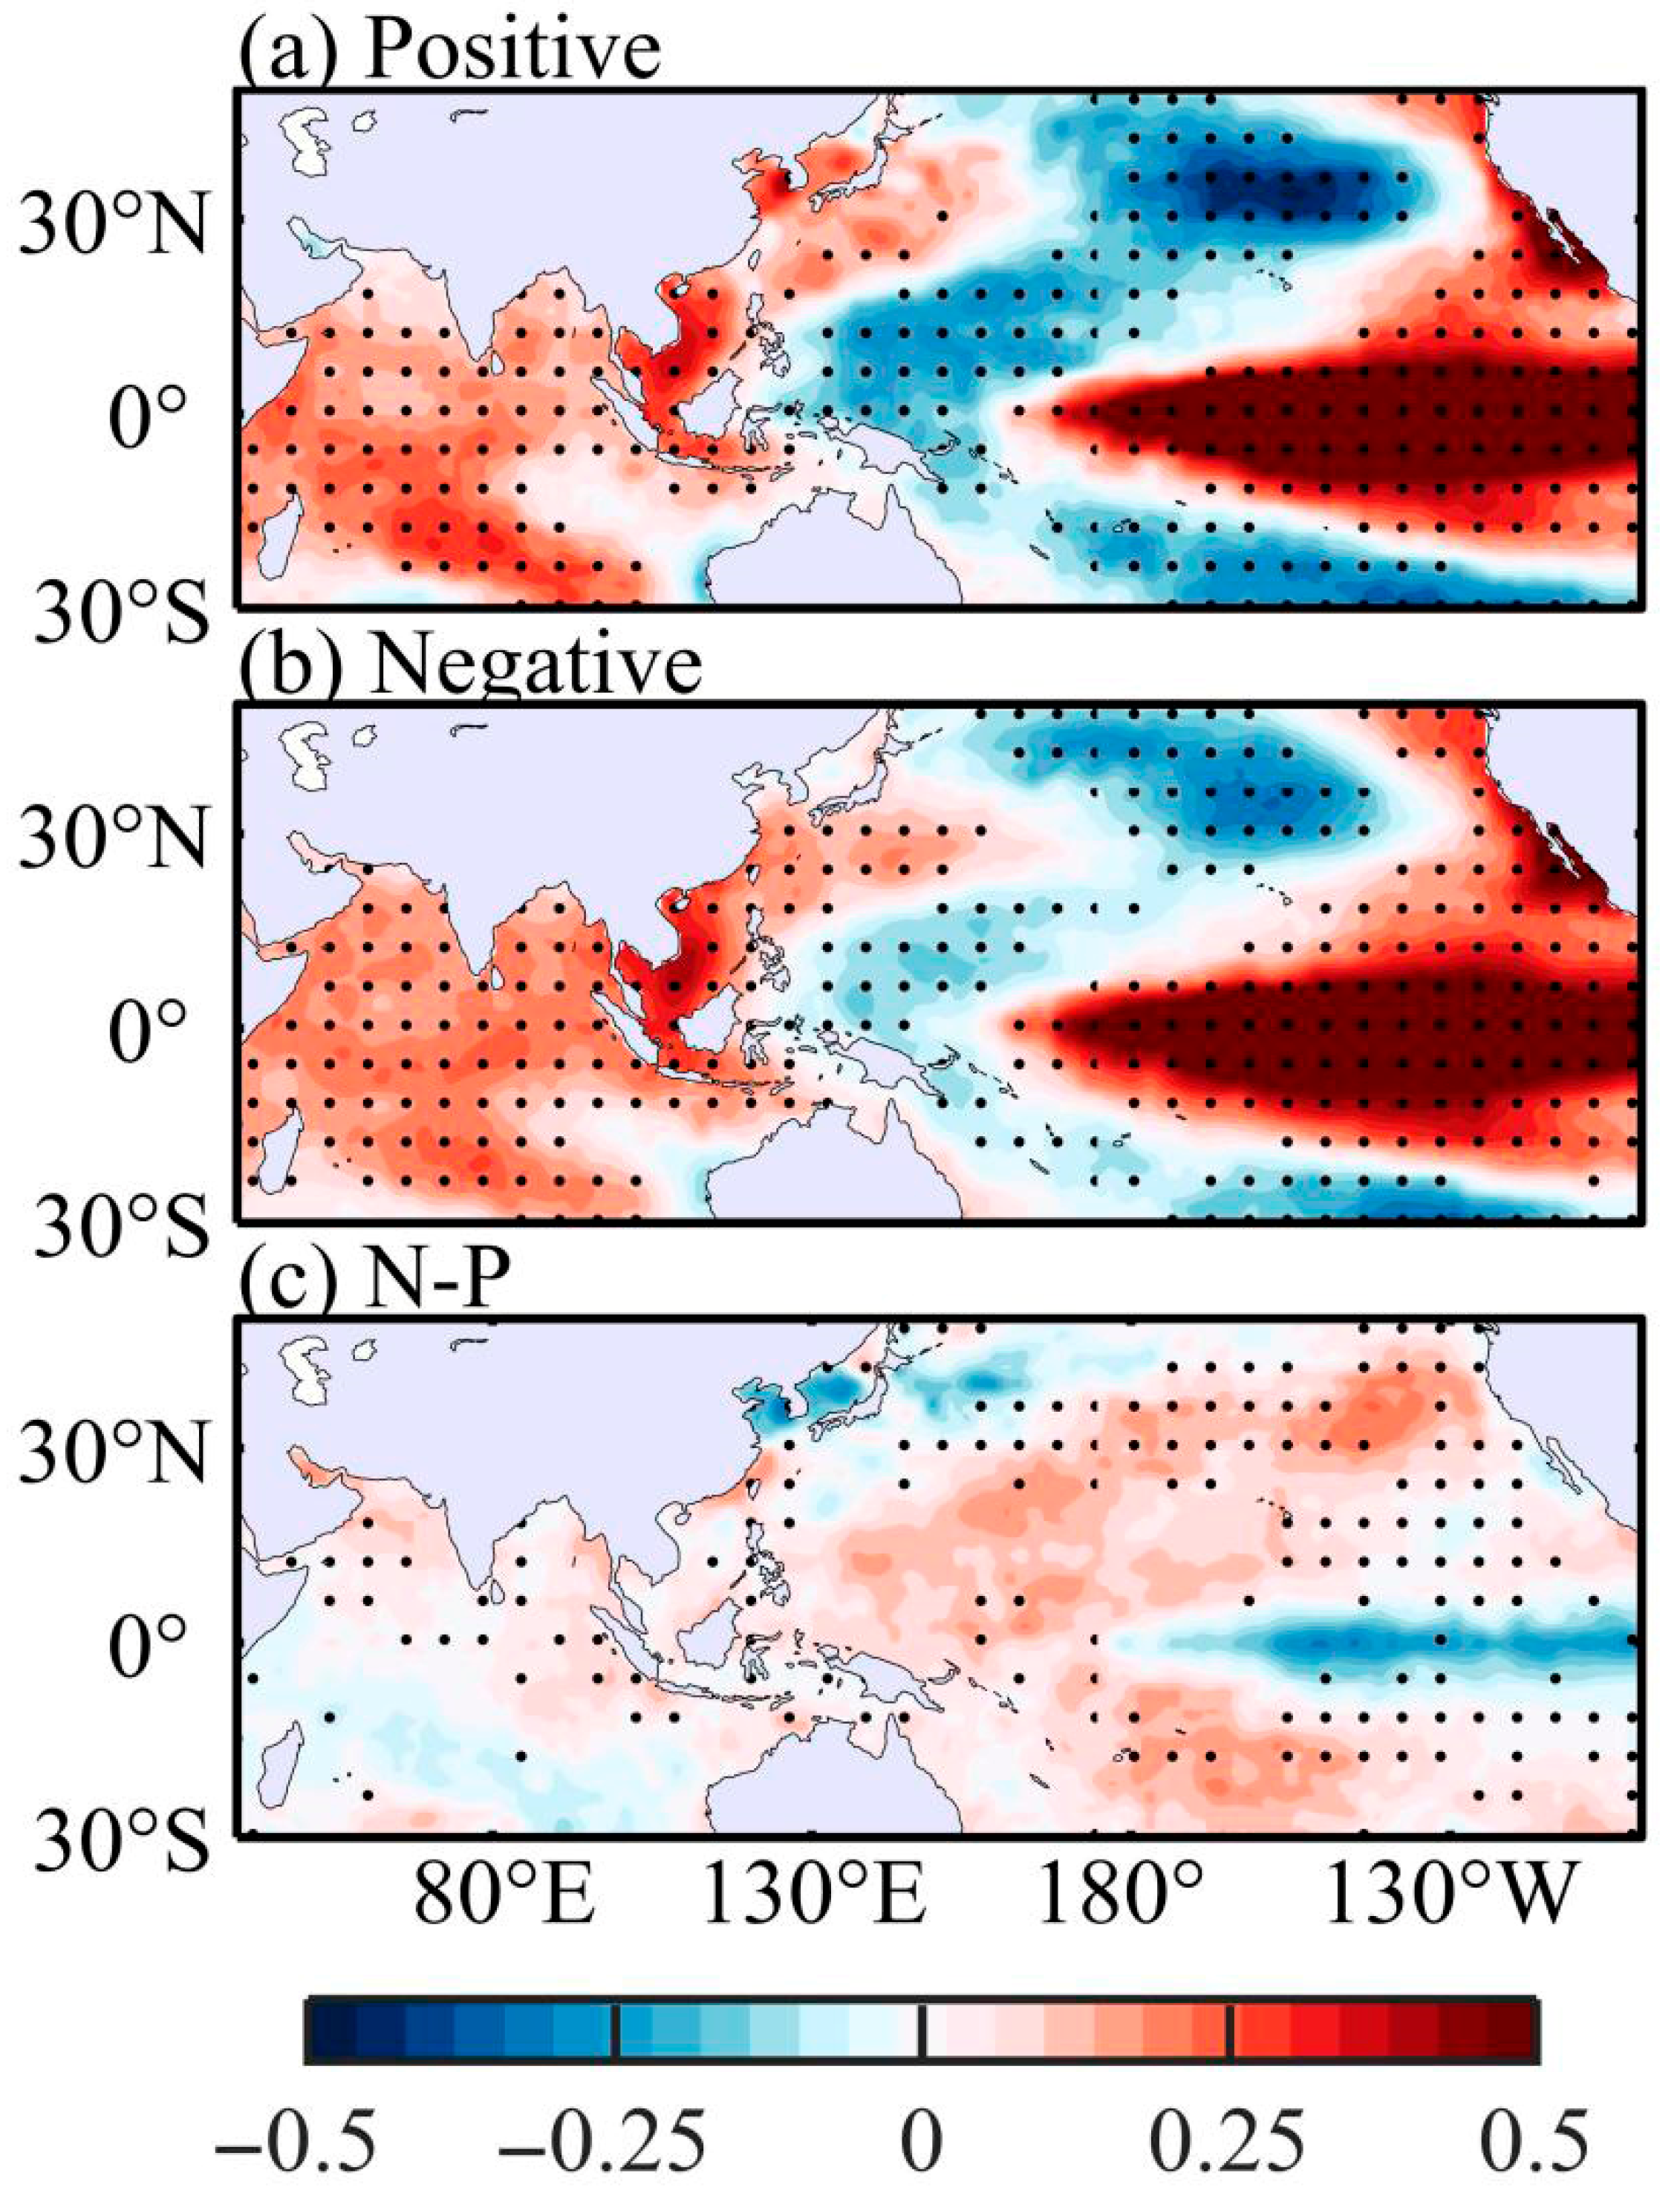
The above composite analyses demonstrate that the PDO influences the spatial distribution of SSCS SST by modulating the intensity of the El Niño, which in turn drives coupled ocean–atmosphere anomalies over the western Pacific Ocean, the southeastern Indian Ocean, and the northern Indian Ocean. The lead-lag correlation analysis reveals that the correlation reaches its maximum when the Niño 3.4 index leads the SSCS SSTA by four months (Figure S1). The regression of the winter-mean SSCS SSTA onto the A(0)S(0)O(0) Niño-3.4 index, as shown in Figure 11, supports this finding. A reduction in El Niño intensity results in a distinct zonal pattern of SSTA in the N-P composite, characterized by cooling in the west and warming in the east. Although the regression analysis method offers a larger sample size of the ESR index, it fails to effectively capture the asymmetry between El Niño and La Niña events. In contrast, the composite analysis method, by precisely selecting El Niño events, theoretically provides a more accurate reflection of the intrinsic nature of the ESR phenomenon. On the other hand, since the regression analysis method includes neutral and La Niña years, it may overestimate the ESR index, whereas the composite analysis method ensures physical plausibility through strict screening. Nevertheless, the regression results further confirm that the primary mechanism underlying the negative correlation between the PDO and the interdecadal variation in the ESR is the synergistic effect of multiple anticyclones across the Indo-Pacific, which are triggered by anomalies in both ENSO intensity and the Aleutian low.
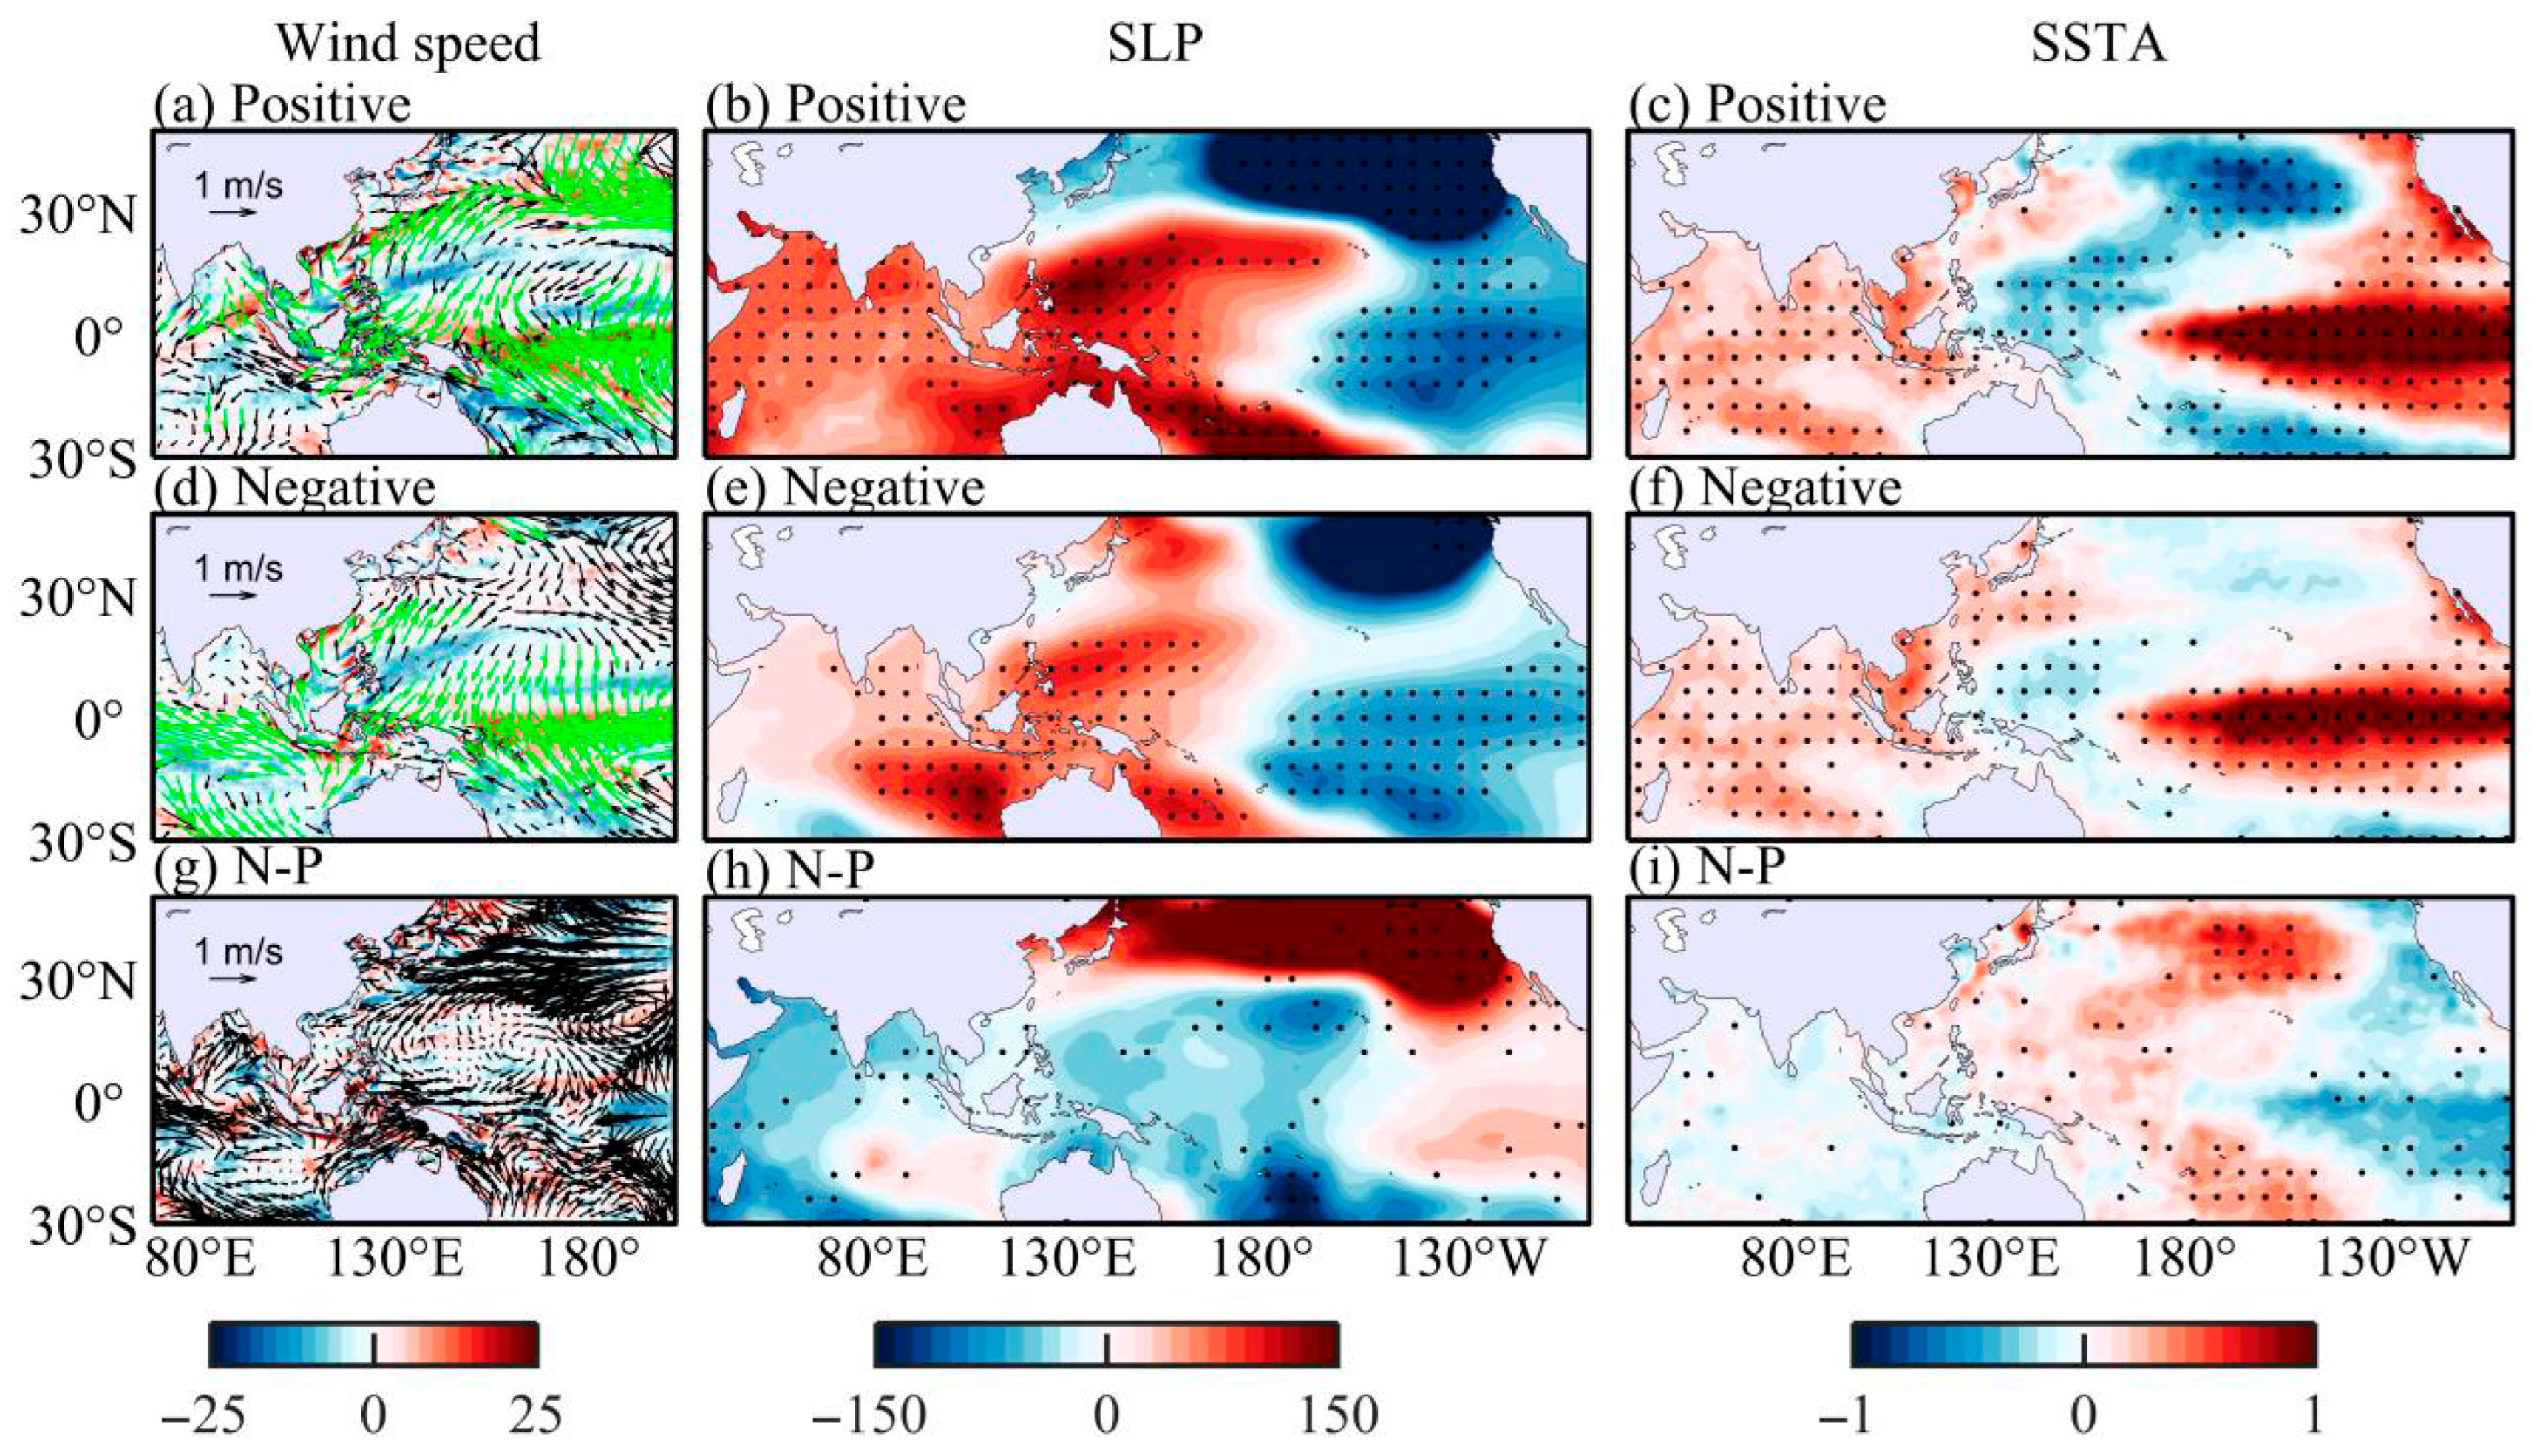
The synergistic mechanism of the three anticyclones on the zonal distribution of the SSCS SST (Figure 12, Figure 13 and Figure 14) can be further elaborated as follows: during the positive PDO phase, the intensity of the El Niño is significantly enhanced, accompanied by the formation of three distinct anticyclones (Figure 12b, Figure 13b and Figure 14b). In contrast, during the negative PDO phase, El Niño weakens, and only two relatively weak anticyclones develop (Figure 12e, Figure 13e and Figure 14e). This difference in anticyclone configuration directly influences the month-to-month climatic response during winter. Specifically, during the negative PDO phase, the PSAC remains relatively stable in both intensity and location, with only a slight strengthening observed in January of the following year. In contrast, during the positive PDO phase, the PSAC not only intensifies significantly from December to January of the following year but also exhibits an eastward migration. This shift results in a wind field transition over the SSCS, changing from easterly winds (Figure 12a) to southeasterly winds (Figure 12d). Consequently, the southerly component over the SSCS is notably enhanced during January of the following year under the positive PDO phase. That is, the southerly wind anomaly in the N-P composite weakens in January of the following year (Figure 12g and Figure 13g). Additionally, for N-P composite, the positive SLP anomaly in the SEIOAC strengthens in January of the following year, while the negative SLP anomalies over the northern Indian Ocean and the Philippine Sea weaken. This leads to a reduction in the interhemispheric pressure gradient and suppresses the inflow of cross-equatorial southerly winds into the SCS. The combined effect of this triple anticyclone configuration thus contributes to the weakening of the southerly anomaly in January of the following year. This weakening subsequently disrupts the equilibrium among the latent heat flux term, horizontal heat advection term, and vertical entrainment term, ultimately triggering a transition of the SSCS SST anomaly from positive to negative.
In February of the following year, although the interhemispheric pressure gradient increases for N-P composite under the influence of the three anticyclone configurations (Figure 14h), which enhances the transport of cross-equatorial southerly winds into the SCS, the PSAC anomalies are strengthened and shift eastward during the positive PDO phase. This results in the development of anomalous southeasterly winds over the SSCS (Figure 14a). In contrast, during the negative PDO phase, the SSCS is characterized by anomalous easterly winds (Figure 14d). Consequently, northerly or northeasterly winds dominate the SSCS in February of the following year for N-P composite (Figure 14g), leading to negative anomalies in both latent heat flux and horizontal heat advection. These changes contribute to the formation of cold SST anomalies in the western and central parts of the SSCS. In the eastern region, positive anomalies in the vertical entrainment term, driven by negative wind stress curl, serve as the primary mechanism responsible for the positive SST anomalies.
Section 3.2 noted that enhanced downward longwave radiation for N-P composite is the primary driver of higher SSCS SST in December and February compared to January. These findings suggest the presence of a positive SST–longwave radiation feedback mechanism, wherein positive SST anomalies induce localized low-pressure systems and enhanced convection, which in turn increase cloud cover, reduce surface upward longwave radiation loss, and thereby reinforce the positive SST anomalies [39].
As shown in Figure 12h, Figure 13h and Figure 14h, the negative SLP anomalies over the eastern part of the SSCS are particularly pronounced in December and February of the following year, allowing for the sustained operation of the positive SST–longwave radiation feedback. In contrast, the weakened negative SLP anomalies in January are insufficient to maintain this feedback mechanism. This explains the observed reduction in longwave radiation and the diminished positive SST anomalies during January of the following year. The SST–longwave radiation positive feedback mechanism has been widely applied to explain SST variability in the northwestern Pacific [39] and the Atlantic Ocean, supported by both observational data and numerical modeling studies [40,41]. Regression analyses further indicate that the attenuation of El Niño events during the December–February period under the negative PDO phase exhibits a significantly stronger trend compared to the positive PDO phase (Figure S2). This leads to a transition of the SSCS SSTA from warm to cold phases, a pattern that aligns closely with the results derived from composite analysis. This consistency further confirms that the primary mechanism underlying the monthly evolutionary interdecadal correlation between the PDO and the ESR lies in the synergistic differences in the location and intensity of multiple anticyclonic systems, which are driven by anomalous variations in ENSO intensity.

4. Conclusions and Discussion

The SST in the SSCS (2–9° N, 100–118° E), a transitional zone between the Pacific and Indian Oceans, exerts significant influences on atmospheric circulation through exchanges of heat, water vapor, and momentum. These interactions have important implications for regional climate extremes and marine ecosystems. The interannual variability of SST in the SSCS has been extensively investigated, particularly focusing on the modulation by ENSO intensity (e.g., Super El Niño vs. regular El Niño) and type (e.g., Eastern Pacific vs. Central Pacific types). However, the decadal-scale evolution of the ESR and its underlying mechanisms remains poorly understood. Based on multi-source oceanic and atmospheric observational data as well as reanalysis products, this study found that the ESR exhibits notable interdecadal variability, which is negatively correlated with the PDO. Specifically, the ESR is stronger during the negative PDO phase, with more pronounced warming of the SSCS SST during the El Niño mature phase.
However, for N-P, the zonal distribution of the winter SSCS SSTA is non-uniform, displaying a distinct anomalous dipole pattern of “west-cooling and east-warming”. This mechanism is explained through heat budget analysis, composite analysis, and regression analysis. During the positive PDO phase, the amplified El Niño forces a cold SSTA in the western Pacific through anomalous Walker circulation. This teleconnection cascade strengthens and westward-extends the PSAC, dynamically coupled with the intensified Aleutian low. Concurrently, the NIOAC and SEIOAC emerge as coordinated components of this hemispheric-scale adjustment. In contrast, the negative PDO attenuates El Niño’s amplitude, reducing the western Pacific cold SSTA magnitude. Consequently, the PSAC weakens and shifts northeastward, accompanying the Aleutian low’s decline, while the NIOAC dissipates and the SEIOAC maintains remarkable stability. Such multi-anticyclone reconfiguration fundamentally modulates meridional wind patterns over the SSCS, generating persistent southerly/southwesterly wind anomalies for N-P epochs.
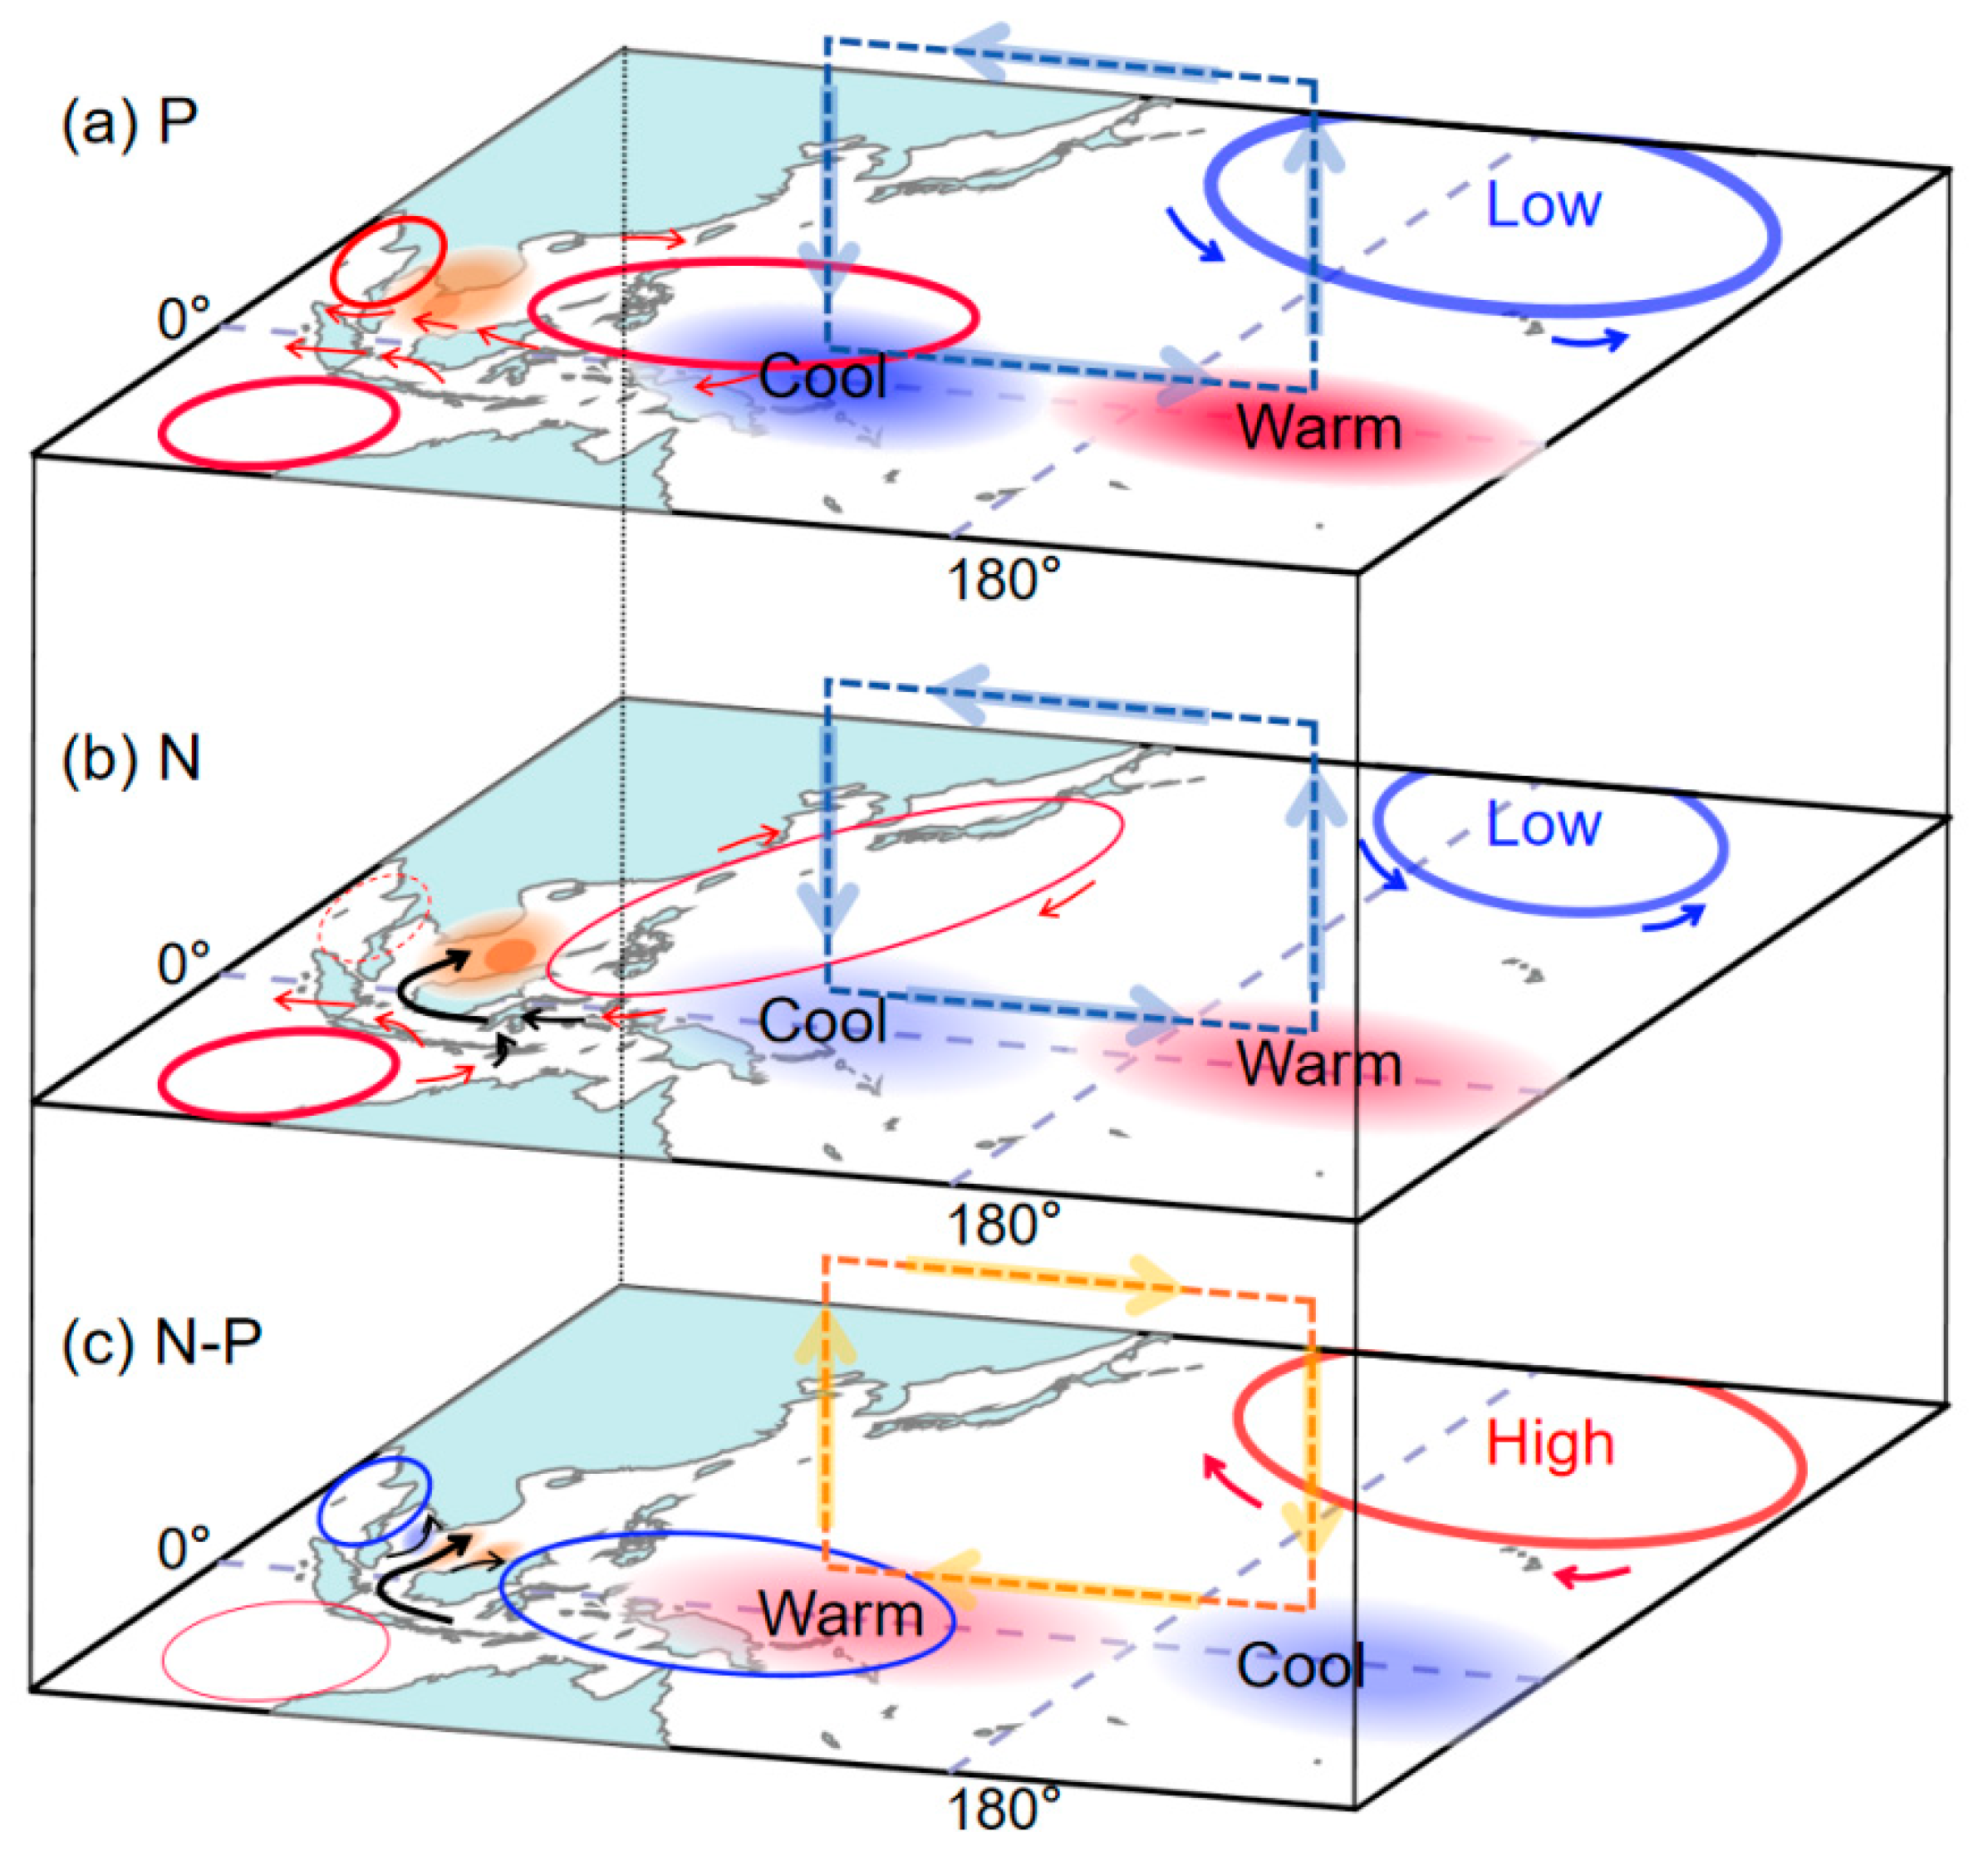
Over the region west of 108° E, positive wind stress curl triggers Ekman pumping, while the southerly anomalies suppress evaporative latent heat loss and cold advection, collectively contributing to negative SSTA. East of 108° E, negative wind stress curl–induced Ekman downwelling and warm advection associated with southwesterly anomalies jointly lead to positive SSTA. A schematic diagram summarizing the above physical processes and mechanisms is presented in Figure 15. Furthermore, the interdecadal correlation between the PDO and ESR exhibits monthly evolutionary characteristics, primarily driven by synergistic differences in the location and intensity of multiple anticyclonic systems induced by anomalous ENSO intensity. This results in a progressive intensification of the “west-cooling and east-warming” SSTA pattern over time. This study can significantly advance the prediction of marine climate in the SCS and neighboring waters on seasonal to decadal scales, especially for detecting and warning of extreme weather, heatwaves, and ecological disasters. Future research investigating interannual variability of regional ocean-atmosphere interactions in the SCS should incorporate cross-basin air–sea coupling processes, particularly the modulating effects of large-scale climate signals such as the PDO.
In this study, the configurations of the three anticyclones are suggested as key mediators of the interdecadal variation in the PDO–modulated ESR. As illustrated in Figure 10, Figure 12, Figure 13 and Figure 14, variations in the intensity of ENSO and the Aleutian low during different PDO phases collectively account for the changes in both the strength and position of the PSAC. However, the intensity variations in the two Indian Ocean anticyclones do not consistently correspond to changes in ENSO intensity. Existing research has revealed that the phase changes in the PDO play a significant modulating role in the associations between ENSO and climate elements in the Indian Ocean. Moreover, this influence exhibits instability on the interdecadal scale. Specifically, during the positive PDO phase, the correlation between ENSO events and SST in the Indian Ocean is remarkably enhanced [42]. Meanwhile, ENSO is more prone to trigger a decrease in SLP in the western Indian Ocean (resulting in cyclonic anomalies), while causing an increase in SLP in the eastern Indian Ocean (generating anticyclonic anomalies) [43]. This modulation of circulation anomalies is closely associated with the background state of Pacific SST dominated by the PDO, rendering the response of Indian Ocean SLP to ENSO phase-dependent. It is noteworthy that on the interdecadal scale, the PDO is regarded as the primary factor responsible for the weakening of the relationship between ENSO and the Indian Ocean monsoon, and its impact far outweighs that of other factors [44].
Equation (1) may not be fully closed due to the use of different reanalysis data in the heat budget analysis. Generally speaking, the magnitudes of the residual and the net heat flux terms are comparable. In the subsequent research, we plan to optimize the analysis from two aspects. Firstly, we will attempt to incorporate other reanalysis datasets, such as Ocean Reanalysis System 5 (ORAS5) [45], the German contribution to the Estimating the Circulation and Climate of the Ocean project in version 2 (GECCO2) [46], the National Centers for Environmental Prediction-National Center for Atmospheric Research Reanalysis 1 (NCEP-NCAR-R1) [47], and Objectively Analyzed air–sea Fluxes (OA Flux) [48], to validate the accuracy of the SODA and ERA5 datasets. Secondly, we will utilize numerical modeling techniques to more accurately quantify the impacts of the net heat flux, horizontal heat advection, and vertical entrainment terms. This approach will enable us to more clearly elucidate the contributions of each thermodynamical process to the SST tendency and further clarify the mechanisms of different factors in the interdecadal variations in the ESR. Nevertheless, it remains unclear whether these variations are associated with anomalies in local air–sea coupling over the Indian Ocean induced by the PDO, a question that warrants further investigation in future studies. Additionally, the synergistic modulation of the meridional wind reconstruction over the SSCS by the three anticyclone configurations—innovatively proposed in this study through statistical analysis—requires further validation through numerical simulations, which will be addressed in our future research. In this study, we first examine the modulation of PDO on ENSO responses using the SSCS as a primary case study, given its tighter coupling with ENSO and fewer confounding factors. Subsequently, we will systematically investigate the asymmetric responses in the northern SCS, Indian Ocean, and the entire Indo-Pacific warm pool.

Supplementary Materials

The following supporting information can be downloaded at https://www.mdpi.com/article/10.3390/jmse13091741/s1. Figure S1: Lead-lag correlations between the D(0)J(1)F(1) SSCS SST anomalies and 3-month running mean Niño-3.4 index from 1900 to 2023; Figure S2: Regression anomalies of December(0), January(1) and February(1) SST (shading; °C) with respect to the Niño-3.4 index during the (a,b,c) positive PDO phase, (d,e,f) negative PDO phase and (g,h,i) N-P. Stippling represents anomalies above the 95% confidence level.

Author Contributions

Conceptualization, Z.W., Y.Z. and G.Z.; Methodology, W.D. and Y.W.; Software, M.Q.; Validation, Y.Z. and Z.W.; Formal analysis, Z.W., Y.W. and M.Q.; Resources, G.Z.; Investigation, Y.W.; Data curation, Y.W.; Writing—original draft preparation, M.Q., Y.W., W.D. and Z.W.; Visualization, M.Q. and W.D.; Writing—review and editing, Y.Z., G.Z. and W.D.; Funding acquisition, Y.Z., G.Z. and Z.W.; All authors have read and agreed to the published version of the manuscript.

Funding

This research was supported jointly by the Major Science and Technology Plan Project of Yazhou Bay Innovation Research Institute of Hainan Tropical Ocean College (2022CXYZD003), Natural Science Foundation of Hainan Province (NO. 421QN265), Scientific Research Foundation of Hainan Tropical Ocean University (NO.RHDRC202120). The authors acknowledge the ECMWF and Asia-Pacific Data-Research Center (APDRC) for providing the reanalysis data.

Data Availability Statement

The data that support the findings of this study are available from the corresponding author upon reasonable request.

Conflicts of Interest

The authors declare that there are no conflicts of interest.

References

  1. Wyrtki, K. Physical Oceanography of the Southeast Asian Waters; Naga Report; University of California, Scripps Institution of Oceanography: San Diego, CA, USA, 1961. [Google Scholar]
  2. Wang, G.; Huang, R.X.; Su, J.L.; Chen, D. The effects of thermohaline circulation on wind-driven circulation in the south china sea. J. Phys. Oceanogr. 2012, 12, 2283–2296. [Google Scholar] [CrossRef]
  3. Wirasatriya, A.; Hosoda, K.; Setiawan, J.D.; Susanto, R.D. Variability of diurnal sea surface temperature during short term and high SST event in the western equatorial pacific as revealed by satellite data. Remote Sens. 2020, 12, 3230. [Google Scholar] [CrossRef]
  4. Wu, R.G.; Chen, Z. Intraseasonal SST variations in the South China Sea during boreal winter and impacts of the East Asian winter monsoon. J. Geophys. Res. Atmos. 2015, 120, 5863–5878. [Google Scholar] [CrossRef]
  5. Han, T.; Xu, K.; Wang, L.; Liu, B.; Tam, C.Y.; Liu, K.; Wang, W. Extremely long-lived marine heatwave in South China Sea during 1981 summer 2020: Combined effects of the seasonal and intraseasonal variations. Glob. Planet. Change. 2023, 230, 104261. [Google Scholar] [CrossRef]
  6. Liu, Q.Y.; Jiang, X.; Xie, S.P.; Liu, W.T. A Gap in the Indo-Pacific Warm Pool over the SCS in Boreal Winter: Seasonal Development and Interannual Variability. J. Geophys. Res. Oceans. 2004, 109, C07012. [Google Scholar] [CrossRef]
  7. Xiao, F.; Wang, D.; Leung, M.Y.T. Early and Extreme Warming in the South China Sea During 2015/2016: Role of an Unusual Indian Ocean Dipole Event. Geophys. Res. Lett. 2020, 47, e2020GL089936. [Google Scholar] [CrossRef]
  8. Liang, Z.; Zeng, L.; Wang, Q.; Peng, Q.; Wang, D. Interpretation of interannual variability of the zonal contrasting thermal conditions in the winter South China Sea. Clim. Dyn. 2021, 58, 1439–1457. [Google Scholar] [CrossRef]
  9. Bi, H.W.; Liu, Q.Y.; Chen, X.Y. Summer surface warming driven by the strong El Niño in the South China Sea. Clim. Dyn. 2024, 62, 1407–1422. [Google Scholar] [CrossRef]
  10. Thompson, B.; Tkalich, P.; Malanotte-Rizzoli, P. Regime shift of the South China Sea SST in the late 1990s. Clim. Dyn. 2017, 48, 1873–1882. [Google Scholar] [CrossRef]
  11. Jiang, G.Q.; Jin, Q.; Wei, J.; Malanotte-Rizzoli, P.; Gordon, A.L.; Li, M. A Reduction in the Sea Surface Warming Rate in the SCS During 1999–2010. Clim. Dyn. 2021, 57, 2093–2108. [Google Scholar] [CrossRef]
  12. Klein, S.A.; Soden, B.J.; Lau, N.C. Remote Sea Surface Temperature Variations During ENSO: Evidence for a Tropical Atmospheric Bridge. Clim. Dyn. 1999, 12, 917–932. [Google Scholar] [CrossRef]
  13. Shiozaki, M.; Enomoto, T.; Takaya, K. Disparate Midlatitude Responses to the Eastern Pacific El Niño. J. Clim. 2021, 34, 773–786. [Google Scholar] [CrossRef]
  14. Gill, A.E. Some Simple Solutions for Heat-Induced Tropical Circulation. Q. J. R. Meteorol. Soc. 1980, 106, 447–462. [Google Scholar] [CrossRef]
  15. Wang, B.; Wu, R.; Fu, X. Pacific-East Asian Teleconnection: How Does ENSO Affect East Asian Climate? J. Clim. 2000, 13, 1517–1536. [Google Scholar] [CrossRef]
  16. Li, C.L.; Yung, H.L.; Feng, C.S. Impacts of two different types of El Niño on the thermal variability in the South China Sea. J. Mar. Sci. Technol. 2020, 28, 211–218. [Google Scholar]
  17. Xiao, F.A.; Wang, D.X.; Wu, Q.Y.; Song, W. Discrepant effects of oceanic advection in the evolution of SST anomalies in the South China Sea during El Niño of different intensities. Front. Mar. Sci. 2022, 9, 871458. [Google Scholar] [CrossRef]
  18. Liu, Q.Y.; Wang, D.X.; Wang, X.; Shu, Y.Q.; Xie, Q.; Chen, J. Thermal variations in the South China Sea associated with the eastern and central Pacific El Niño events and their mechanisms. J. Geophys. Res. Oceans. 2014, 119, 12. [Google Scholar] [CrossRef]
  19. Mantua, N.J.; Hare, S.R. A Pacific interdecadal climate oscillation with impacts on salmon production. Bull. Amer. Meteor. Soc. 1997, 78, 1069–1080. [Google Scholar] [CrossRef]
  20. Lin, Y.; Gan, J.; Cai, Z.; Quan, Q.; Zu, T.; Liu, Z. Coherent Interannual–Decadal Potential Temperature Variability in the Tropical-North Pacific Ocean and Deep South China Sea. Geophys. Res. Lett. 2024, 51, e2023GL106256. [Google Scholar] [CrossRef]
  21. Zhu, X.; Wu, L.; Zhou, J.; Gao, J. The modeled atmospheric and oceanic response to the South China Sea SST anomaly. J. Ocean. Univ. China 2016, 15, 10. [Google Scholar] [CrossRef]
  22. Tao, L.F.; Yang, X.Q.; Fang, J.B.; Sun, X.G. PDO-Related Wintertime Atmospheric Anomalies over the Midlatitude North Pacific: Local versus Remote SST Forcing. J. Clim. 2020, 33, 6989–7010. [Google Scholar] [CrossRef]
  23. Xiao, F.A.; Wang, D.X.; Yang, L. Can Tropical Pacific Winds Enhance the Footprint of the Interdecadal Pacific Oscillation on the Upper-Ocean Heat Content in the South China Sea? J. Clim. 2020, 33, 4419–4437. [Google Scholar] [CrossRef]
  24. Xue, J.; Luo, J.J.; Zhang, W.; Yamagata, T. ENSO–IOD inter-basin connection is controlled by the Atlantic Multidecadal Oscillation. Geophys. Res. Lett. 2022, 49, e2022GL101571. [Google Scholar] [CrossRef]
  25. Wang, X.; Liu, H. PDO modulation of ENSO effect on tropical cyclone rapid intensification in the western North Pacific. Clim. Dyn. 2016, 46, 15–28. [Google Scholar] [CrossRef]
  26. Yu, T.T.; Chen, W.; Huang, P.; Huang, P.; Yang, X.K. Weakened influence of ENSO on the East Asian summer monsoon since the early 2000s. npj Clim Atmos Sci. 2025, 8, 114. [Google Scholar] [CrossRef]
  27. Li, C.Y.; Meng, X.F.; Xie, R.H. Interdecadal modulation of ENSO asymmetry by the Pacific Decadal Oscillation and its mechanism. J. Trop. Oceanogr. 2023, 42, 36–46. [Google Scholar] [CrossRef]
  28. Wu, S.; Lin, W.; Dong, L.; Song, F.; Yang, S.; Lu, Z.; Hu, X. Role of SST in Seasonal Western North Pacific Anomalous Anticyclone: Insights From AMIP Simulations in CMIP6. Geophys. Res. Lett. 2024, 51, e2023GL107080. [Google Scholar] [CrossRef]
  29. Zhang, W.; Tao, W.; Huang, G.; Hu, K.; Qu, X.; Wang, Y.; Tang, H.; Zhang, S. Ongoing intensification of anomalous Western North Pacific anticyclone during post-El Niño summer with achieved carbon neutrality. npj Clim. Atmos. Sci. 2024, 7, 317. [Google Scholar] [CrossRef]
  30. Jiang, N.; Yan, Q.; Wang, H.; Ma, J. Strengthened Western North Pacific Anomalous Anticyclone in an El Niño–Decaying Summer across the Last Interglacial. J. Clim. 2025, 38, 2031–2046. [Google Scholar] [CrossRef]
  31. Watanabe, M.; Jin, F.F. Role of Indian Ocean warming in the development of Philippine Sea anticyclone during ENSO. Geophys. Res. Lett. 2002, 29, 1478. [Google Scholar] [CrossRef]
  32. Zhu, Z.; Yang, Y.; Liu, B. Physics-Based Predictions of the Month-by-Month Summer Western North Pacific Anomalous Anticyclone. J. Clim. 2025, 38, 2187–2203. [Google Scholar] [CrossRef]
  33. Rayner, N.A. Global analyses of sea surface temperature, sea ice, and night marine air temperature since the late nineteenth century. J. Geophys. Res. 2003, 108, 4407. [Google Scholar] [CrossRef]
  34. Hersbach, H.; Bell, B.; Berrisford, P.; Hirahara, S.; Horányi, A.; Muñoz-Sabater, J.; Nicolas, J.; Peubey, C.; Radu, R.; Schepers, D.; et al. The ERA5 Global Reanalysis. Q. J. R. Meteorol. Soc. 2020, 146, 1999–2049. [Google Scholar] [CrossRef]
  35. Carton, J.A.; Giese, B.S. A Reanalysis of Ocean Climate Using Simple Ocean Data Assimilation (SODA). Mon. Weather. Rev. 2008, 138, 2999. [Google Scholar] [CrossRef]
  36. Liu, F.; Zhang, W.; Jin, F.; Hu, S. Decadal Modulation of the ENSO–Indian Ocean Basin Warming Relationship during the Decaying Summer by the Interdecadal Pacific Oscillation. J. Clim. 2021, 34, 2685–2699. [Google Scholar] [CrossRef]
  37. Rao, J.; Ren, R.; Xia, X.; Shi, C.; Guo, D. Combined Impact of El Niño–Southern Oscillation and Pacific Decadal Oscillation on the Northern Winter Stratosphere. Atmosphere 2019, 10, 211. [Google Scholar] [CrossRef]
  38. Zhang, Y.M.; Zhao, Z.; Liao, E.; Jiang, Y. ENSO and PDO-Related Interannual and Interdecadal Variations in the Wintertime Sea Surface Temperature in a Typical Subtropical Strait. Clim. Dyn. 2022, 59, 3359–3372. [Google Scholar] [CrossRef]
  39. Cheng, S.; Kucharski, F.; Li, J.P.; Jin, F.F.; Kang, I.S.; Ding, R.Q. Western tropical Pacific multidecadal variability forced by the Atlantic multidecadal oscillation. Nat. Commun. 2017, 8, 15998. [Google Scholar] [CrossRef]
  40. Soden, B.J.; Vecchi, G.A. The vertical distribution of cloud feedback in coupled ocean-atmosphere models. Geophys. Res. Lett. 2011, 38, L12704. [Google Scholar] [CrossRef]
  41. Zelinka, M.D.; Hartmann, D.L. Why is longwave cloud feedback positive? J Geophys. Res. Atmos. 2010, 115, D16117. [Google Scholar] [CrossRef]
  42. Zhang, X.L.; Mochizuki, T. Decadal modulation of ENSO and IOD impacts on the Indian Ocean upwelling. Front. Earth Sci. 2023, 11, 1212421. [Google Scholar] [CrossRef]
  43. Xavier, A.K.; Varikoden, H.; Babu, C.; Reshma, T. Influence of PDO and ENSO with Indian summer monsoon rainfall and its changing relationship before and after 1976 climate shift. Clim. Dyn. 2023, 61, 5465–5482. [Google Scholar] [CrossRef]
  44. Kaur, S.; Kumar, P.; Weller, E.; Young, I.R. Positive relationship between seasonal Indo-Pacific Ocean wave power and SST. Sci Rep. 2021, 11, 17419. [Google Scholar] [CrossRef] [PubMed]
  45. Zuo, H.; Balmaseda, M.; Tietsche, S.; Mogensen, K.; Mayer, M. The ECMWF Operational Ensemble Reanalysis-Analysis System for Ocean and Sea-Ice: A Description of the System and Assessment. Ocean Sci. 2019, 15, 779–808. [Google Scholar] [CrossRef]
  46. Kohl, A. Evaluation of the GECCO2 ocean synthesis: Transports of volume, heat and freshwater in the Atlantic. Q. J. R. Meteorol. Soc. 2015, 141, 166–181. [Google Scholar] [CrossRef]
  47. Kalnay, E.; Kanamitsu, M.; Kistler, R.; Collins, W.; Deaven, D.; Gandin, L.; Iredell, M.; Saha, S.; White, G.; Woollen, J.; et al. The NCEP/NCAR 40-Year Reanalysis Project. Bull. Amer. Meteorol. Soc. 1996, 77, 437–472. [Google Scholar] [CrossRef]
  48. Yu, L.S.; Jin, X.Z.; Robber, W. Multidecade Global Flux Datasets from the Objectively Analyzed Air-Sea Fluxes (OAFlux) Project: Latent and Sensible Heat Fluxes, Ocean Evaporation, and Related Surface Meteorological Variables; OAFlux Project Technical Report. OA-2008-01; Woods Hole Oceanographic Institution: Woods Hole, MA, USA, 2008; p. 64. [Google Scholar]
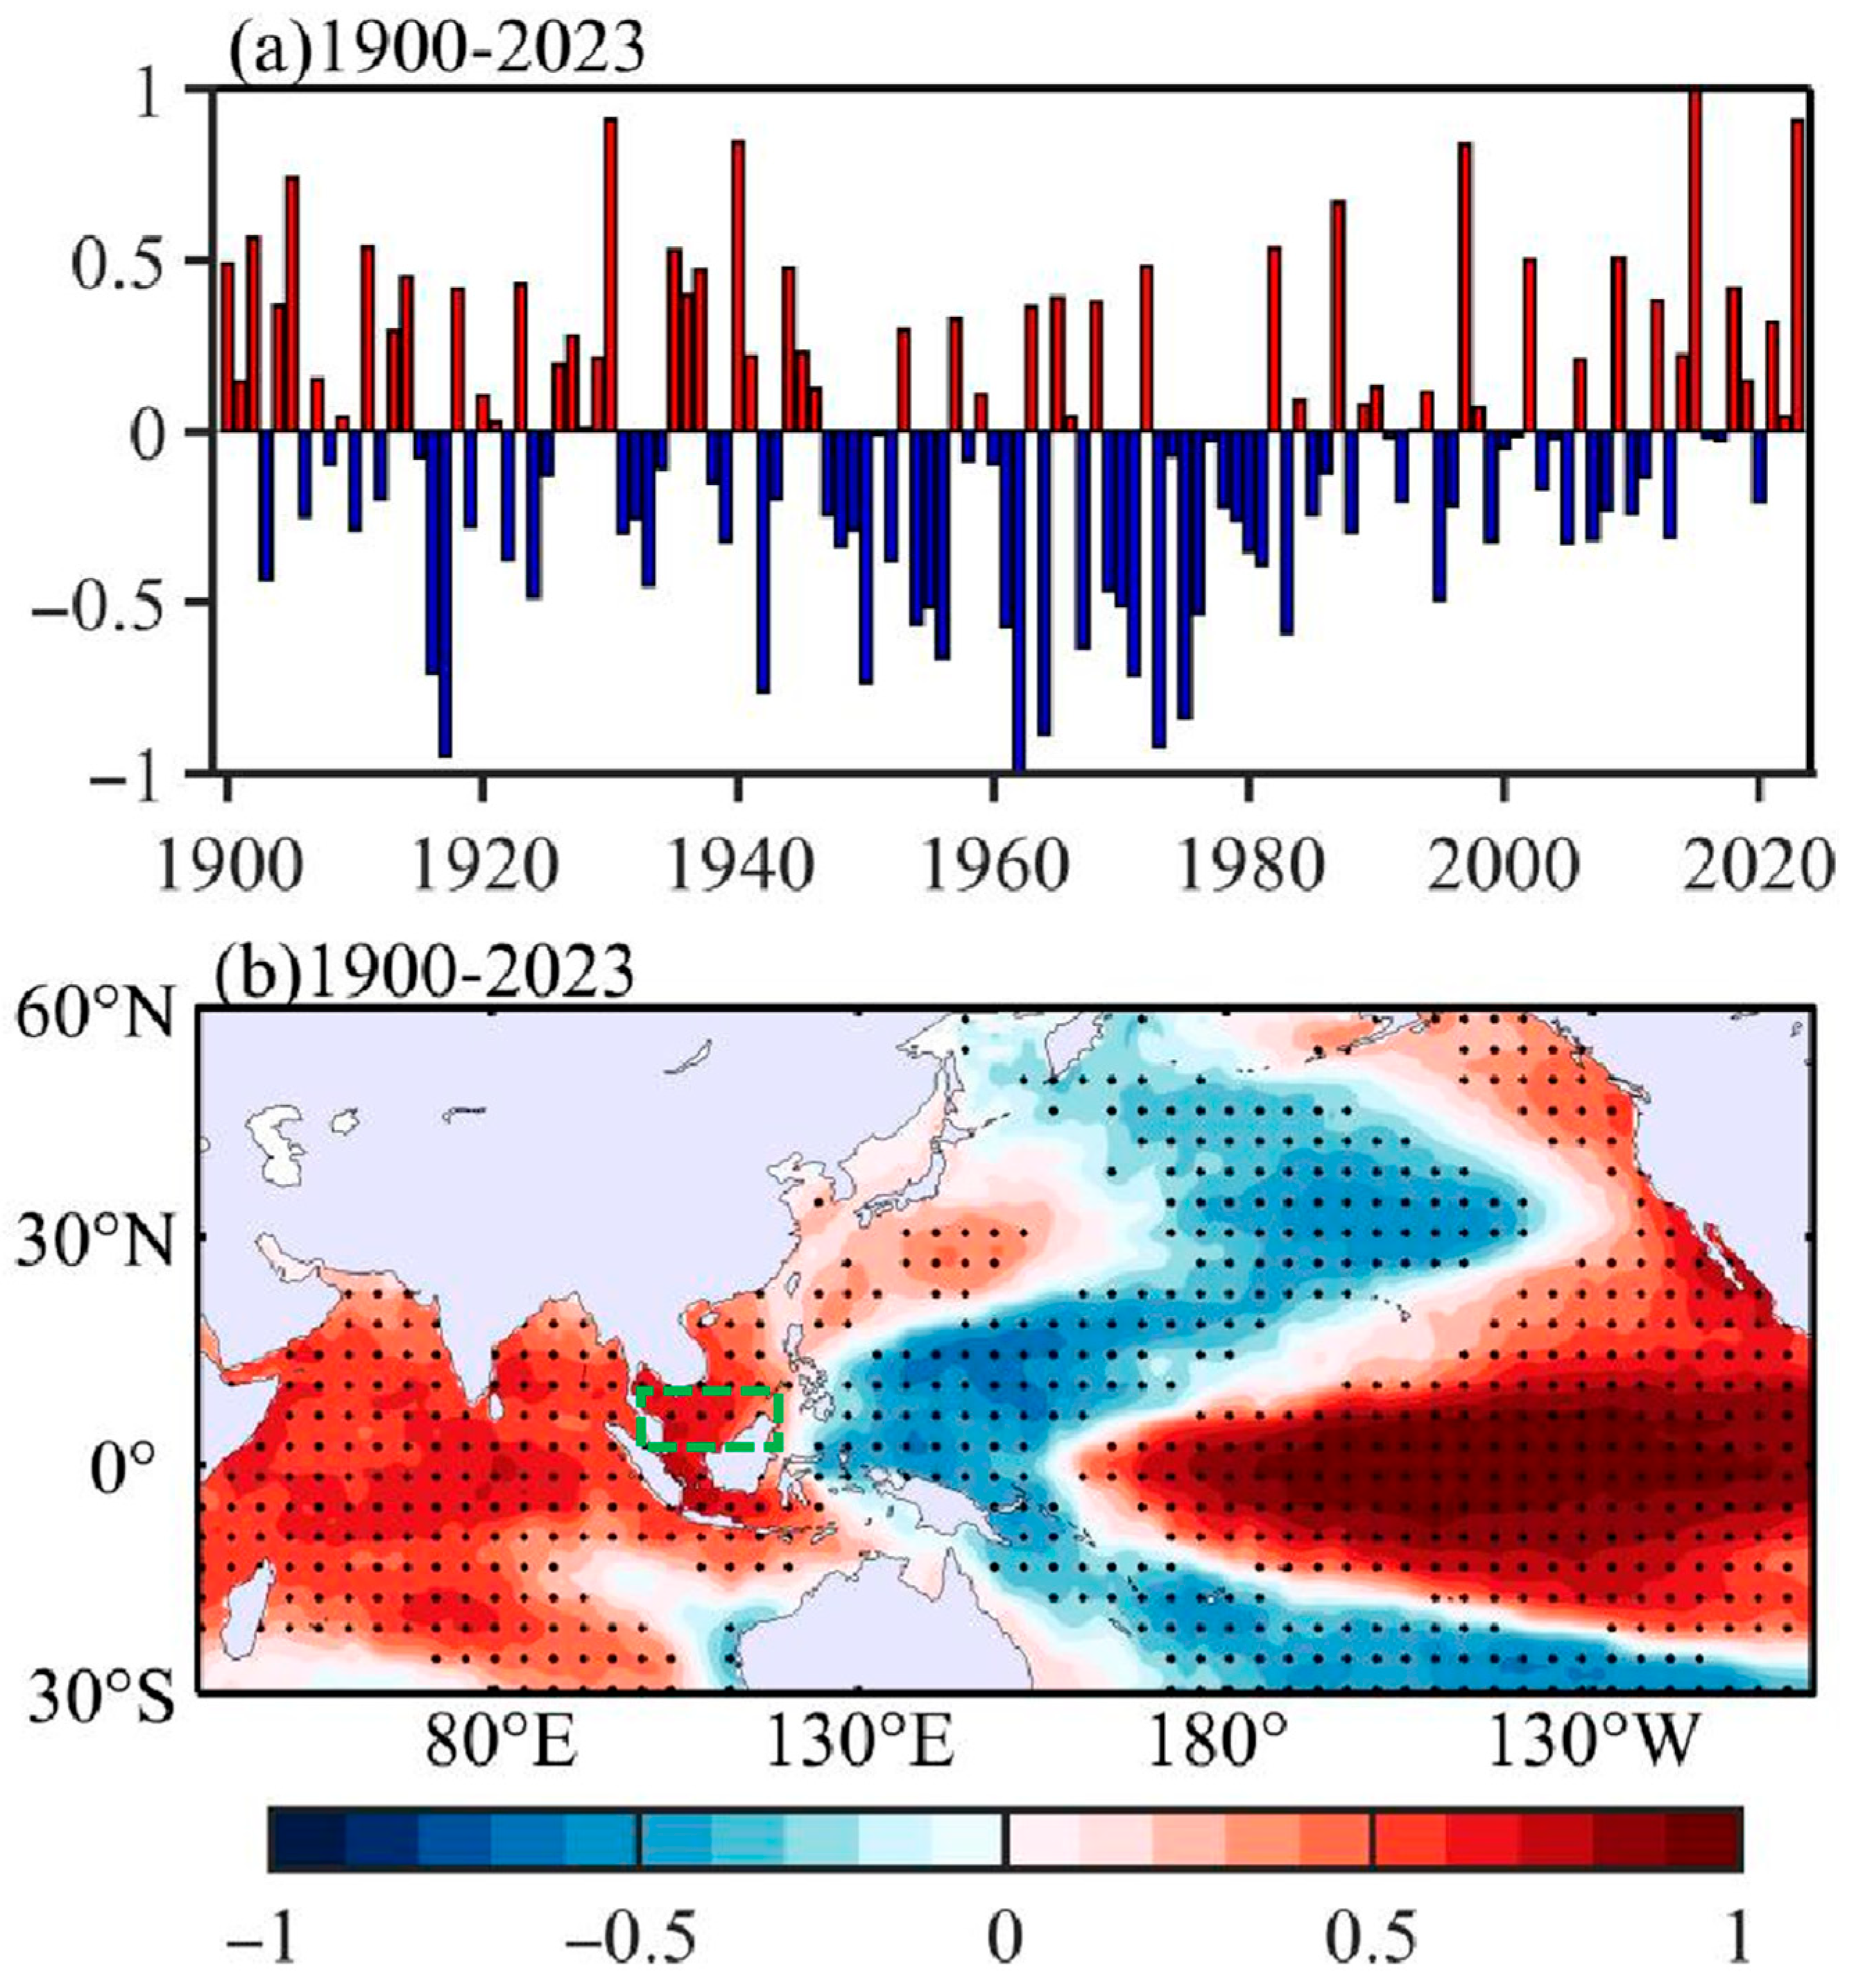
Figure 1. Relationship between SSCS SST anomalies and ENSO in the HadISST data set. (a) The time series of normalized D(0)J(1)F(1) southern SCS (SSCS) SST anomalies during 1900–2023. (b) Correlation map between the interannual variations in normalized D(0)J(1)F(1) Niño-3.4 index and the Indo-Pacific SST anomalies from 1900 to 2023. Stippling represents anomalies above the 99% confidence level. The green dashed box in (b) represents the SSCS.
Jmse 13 01741 g001
Figure 2. Connection between the interdecadal variation in El Niño core region (120–170° W, 5° S–5° N) SST-SSCS SST relationship and the PDO in the HadISST data set. (a) The 11-year running mean normalized PDO index (blue line) and interdecadal variation in El Niño core region (the tropical central-eastern Pacific) SST-SSCS SST relationship (orange line). The time-varying ESR is measured by the 21-year sliding correlation between the D(0)J(1)F(1) SSCS SST anomalies and D(0)J(1)F(1) Niño-3.4 index. (b) Correlation map between the interdecadal variation in El Niño core region SST-SSCS SST relationship and Indo-Pacific decadal SST anomalies from 1900 to 2023. The long-term linear trends in SST data were removed prior to the analysis. The black solid line in (a) represents both the PDO index of zero and the correlation at 99% confidence level. Stippling in (b) represents anomalies above the 95% confidence level using the effective number of degrees of freedom.
Jmse 13 01741 g002
Figure 3. Relationship between El Niño and SSCS SST in the HadISST data set. Scatter plot of the D(0)J(1)F(1) SSCS SST anomalies as a function of the D(0)J(1)F(1) Niño-3.4 index for the El Niño events (triangle) in (a) positive PDO phase and (b) negative PDO phase. Red and blue triangles denote positive and negative SST anomalies of the SSCS respectively.
Jmse 13 01741 g003
Figure 4. Differences in the ESR during positive and negative phases of PDO. Based on the data from HadISST, composite anomalies of D(0)J(1)F(1), Dec(0), Jan(1) and Feb(1) SST (shading; °C) over the SSCS for the El Niño events in (ad) positive PDO phase, (eh) negative PDO phase and (il) differences between the negative and positive phases of PDO (N-P). The black dashed rectangle represents the region of SSCS (2–9° N, 100–118° E). The black contour lines represent 0 °C in (il). Stippling represents anomalies above the 95% confidence level. In (i), W, M, and E represent the western, middle, and eastern parts of the SSCS.
Jmse 13 01741 g004
Figure 5. Different evolutionary characteristics of the ESR during positive and negative phases of PDO in the HadISST data set. (a) Composite 24-month evolution of the SSCS regional mean SST anomalies during the El Niño events of different PDO phases. (b) Composite results of SSCS zonal mean SST anomalies during the mature phase of El Niño averaged over the region 2–9° N for N-P.
Jmse 13 01741 g005
Figure 6. Differences in mixed-layer heat budget terms between positive and negative phases of PDO. Composite anomalies of D(0)J(1)F(1) mixed layer temperature tendency (Tendency), net surface heat flux term (Qnet), horizontal advection term (ADV), vertical entrainment term (W) and residual term (R) over the SSCS during El Niño mature phase in (ae) positive PDO phase, (fj) negative PDO phase and (ko) N-P. Unit is °C/month. Stippling represents anomalies above the 95% confidence level.
Jmse 13 01741 g006
Figure 7. Similarly to Figure 6, but for latent heat flux (LHF; W/m2), shortwave radiation (SWR; W/m2), longwave radiation (LWR; W/m2) and total cloud cover (Cloud).
Jmse 13 01741 g007
Figure 8. Similarly to Figure 6k–o, but for December (0) (ae), January (1) (fj) and February (1) (ko) during N-P. Unit is °C/month.
Jmse 13 01741 g008
Figure 9. Similarly to Figure 6g–i, but for December (ac), January (df) and February (gi) during N-P. The left, middle and right volumes represent latent heat flux (LHF), shortwave radiation (SWR) and longwave radiation (LWR), respectively. Unit is W/m2.
Jmse 13 01741 g009
Figure 10. Differences in air–sea interaction in the Indo-Pacific during the mature phase of El Niño over positive and negative phases of the PDO. Composite anomalies of D(0)J(1)F(1) surface winds (vector; m/s) with curl (shading; 10−5/s) (a,d,g), sea level pressure (shading; Pa) (b,e,h) and SST (shading; °C) (c,f,i) during El Niño mature phase in (ac) positive PDO phase, (df) negative PDO phase and (gi) N-P. Green vectors indicate velocity anomalies are significant at the 95% confidence level, while the black ones do not pass the significance test. Stippling represents anomalies above the 95% confidence level.
Jmse 13 01741 g010
Figure 11. Regression anomalies of D(0)J(1)F(1) SST (shading; °C) with respect to the A(0)S(0)O(0) Niño-3.4 index during the (a) positive PDO phase, (b) negative PDO phase and (c) N-P. Stippling represents anomalies above the 95% confidence level.
Jmse 13 01741 g011
Figure 12. Similarly to Figure 10, but for December (0). Composite anomalies of December surface winds (vector; m/s) with curl (shading; 10−5/s) (a,d,g), sea level pressure (shading; Pa) (b,e,h) and SST (shading; °C) (c,f,i) in (ac) positive PDO phase, (df) negative PDO phase and (gi) N-P.
Jmse 13 01741 g012
Figure 13. Similarly to Figure 10, but for January (1). Composite anomalies of January surface winds (vector; m/s) with curl (shading; 10−5/s) (a,d,g), sea level pressure (shading; Pa) (b,e,h) and SST (shading; °C) (c,f,i) in (ac) positive PDO phase, (df) negative PDO phase and (gi) N-P.
Jmse 13 01741 g013
Figure 14. Similarly to Figure 10, but for February (1). Composite anomalies of February surface winds (vector; m/s) with curl (shading; 10−5/s) (a,d,g), sea level pressure (shading; Pa) (b,e,h) and SST (shading; °C) (c,f,i) in (ac) positive PDO phase, (df) negative PDO phase and (gi) N-P.
Jmse 13 01741 g014
Figure 15. Schematic diagram illustrating the teleconnection mechanism between the Pacific Decadal Oscillation and the decadal variability of El Niño—the southern South China Sea SST relationship. (ac) represent positive PDO phase, negative PDO phase and negative minus positive PDO phase, respectively. Color-filled areas denote positive (red)/negative (blue) sea surface temperature anomalies (SSTA); Hollow circles indicate anomalous anticyclones (red) and cyclones (blue), with line thickness scaling proportionally to intensity; Arrows represent surface wind anomalies; Blue/orange rectangles paired with bold arrows depict anomalous Walker circulation.
Jmse 13 01741 g015
Table 1. Classification of El Niño events during positive and negative PDO phases.
PDO PhaseEl Niño Events
Positive1925/26, 1930/31, 1940/41, 1941/42
1977/78, 1979/80, 1982/82, 1986/87, 1987/88, 1990/91, 1991/92, 1994/95, 1997/98
Negative1902/03, 1905/06, 1911/12, 1913/14, 1914/15, 1918/19, 1923/24
1951/52, 1953/53, 1957/58, 1963/64, 1965/66, 1968/69, 1969/70, 1972/73, 1976/77
2002/03, 2003/04, 2004/05, 2006/07, 2009/10, 2014/15, 2015/16, 2018/19, 2019/20, 2023/24
Table 2. Statistical table of heat budget terms in the western, middle and eastern parts of the SSCS during the mature phase of El Niño. dSST represents mixed layer temperature tendency, Qnet represents the net heat flux term, ADV represents the horizontal heat advection term, W represents the vertical entrainment term and R represents the residual term. Unit is °C/month. (“*” represents the dominant promoting effect of the specified heat budget terms on the tendency of SST).
dSSTQnetADVWR
DJFWest−0.0954−0.0515 *0.00230.0074−0.0536
Middle−0.1717−0.0407−0.0077−0.0229−0.1004 *
East−0.1291−0.0937 *−0.0098−0.0057−0.0199
DecWest−0.11640.0768−0.0091−0.0035−0.1806 *
Middle−0.12540.0348−0.0292−0.1227 *−0.0083
East−0.0434−0.1001 *0.093−0.0076−0.0287
JanWest−0.0553−0.0243−0.00340.0196−0.0472 *
Middle−0.0632−0.02260.0154−0.0541 *−0.0019
East−0.0260−0.0870 *−0.01530.03380.0425
FebWest−0.0521−0.2071 *0.0044−0.00150.1521
Middle−0.1295−0.1345 *0.03010.0058−0.0309
East−0.1120−0.0939 *−0.078 *−0.03830.0982
Disclaimer/Publisher’s Note: The statements, opinions and data contained in all publications are solely those of the individual author(s) and contributor(s) and not of MDPI and/or the editor(s). MDPI and/or the editor(s) disclaim responsibility for any injury to people or property resulting from any ideas, methods, instructions or products referred to in the content.