Article

Investigating Catching Hotspots of Fishing Boats: A Framework Using BeiDou Big Data and Deep Learning Algorithms

1
College of International Economics & Trade, Ningbo University of Finance & Economics, Ningbo 315175, China
2
Faculty of Governance and Global Affairs, Leiden University, 2311 EZ Leiden, The Netherlands
3
Faculty of Maritime and Transportation, Ningbo University, Ningbo 315211, China
*
Authors to whom correspondence should be addressed.
J. Mar. Sci. Eng. 2025, 13(5), 905; https://doi.org/10.3390/jmse13050905
Submission received: 25 March 2025 / Revised: 24 April 2025 / Accepted: 30 April 2025 / Published: 1 May 2025
(This article belongs to the Special Issue Resilience and Capacity of Waterway Transportation)

Abstract

:
Illegal, unreported, and unregulated (IUU) fishing significantly threatens marine ecosystems, disrupts the ecological balance of the oceans, and poses serious challenges to global fisheries management. This contribution presents the efficacy of China’s summer fishing moratorium using BeiDou vessel monitoring system (VMS) data from 2805 fishing vessels in the East China Sea and Yellow Sea, integrated with a deep learning framework for spatiotemporal analysis. A preprocessing protocol addressing multidimensional noise in raw VMS datasets was developed, incorporating velocity normalization and gap filling to ensure data reliability. The CNN-BiLSTM hybrid model emerged as optimal for fishing behavior classification, achieving 89.98% accuracy and an 87.72% F1 score through synergistic spatiotemporal feature extraction. Spatial analysis revealed significant policy-driven reductions in fishing intensity during the moratorium (May–August), with hotspot areas suppressed to sporadic coastal distributions. However, concentrated vessel activity in Zhejiang’s nearshore waters suggested potential illegal fishing. Post-moratorium, fishing hotspots expanded explosively, peaking in October and clustering in Yushan, Zhoushan, and Yangtze River estuary fishing grounds. Quarterly patterns identified autumn–winter 2021 as peak fishing seasons, with hotspots covering >80% of East China Sea grounds. The framework enables real-time fishing state detection and adaptive spatial management via dynamic closure policies. The findings underscore the need for strengthened surveillance during moratoriums and post-ban catch regulation to mitigate overfishing risks.

1. Introduction

Illegal, unreported, and unregulated (IUU) fishing poses a significant threat to the marine ecosystem, undermines the ecological balance of the oceans, and presents a substantial challenge to global fisheries management [1]. According to the Food and Agriculture Organization of the United Nations (FAO) [2], the annual catch from IUU fishing activities ranges from 11 to 26 million tons, with an estimated economic value of USD 10 to 23 billion. Furthermore, the sustainable development of marine fisheries has emerged as a critical issue for the marine community. The latest FAO report [2] indicates that only 64.6% of marine fish stocks are being fished sustainably, a decline of 1.2% from 2017, highlighting the growing concern about marine resource depletion. Consequently, safeguarding the marine ecosystem and combating illegal fishing practices have become matters of international consensus.
However, few fishery administrations around the world have a comprehensive management system to combat IUU [3]. In 2001, the FAO adopted the International Plan of Action to Prevent, Deter and Eliminate Illegal, Unreported and Unregulated Fishing (IPOA-IUU) instrument to combat, stop, and eliminate IUU fishing, but due to the low political will of fishery administrations and law enforcement, the IPOA-IUU failed to produce the expected effect [4]. To facilitate the implementation of the IPOA-IUU, the FAO finally completed the final chapter of the Port State Measures Agreement (PSMA) in 2009, the main objective of which was to prevent IUU catches from entering the international market [5]. This agreement eliminated the IUU fishing from entering other countries for trade, but returning to the ports of their home country was not restricted, and this meant that IUU could not be eradicated [6]. After the adoption of the PSMA, the FAO adopted the Voluntary Guidelines on the Effectiveness of the Home State in 2014 as a guideline on the voluntary responsibility of the home state for the elimination of IUU fishing due to the lack of effective control from the home states over their fishing vessels, which allowed authorized fishing vessels to fly flags without being subject to the due diligence of the fishing vessel under international law [7]. Although the Guidelines apply to waters under the jurisdiction of the flag State or coastal State, the criteria for assessing the effectiveness of the flag State may be inconsistent in national jurisdictions, and in international waters, they are dependent on the political will of the States and are still only a “soft law” [8]. In April 2025, China’s accession to the Agreement on Port State Measures (PSMs) resulted in an increase in States Parties from the initial 25 to the current 81. The number of contracting Parties has increased from 25 at the beginning to 81 at present, and more than two-thirds of the global fisheries trade countries have become contracting Parties to the Agreement [9], and combating the elimination of IUU behaviors has become a hotspot issue in the global fisheries industry. In this context, the study of marine fishing hotspots can help to identify IUU fishing activities in fisheries [10] and provide necessary decision support for marine spatial planning and marine ecological protection.
The BeiDou satellite navigation system is a global satellite navigation system independently developed by China, which is characterized by high positioning accuracy and large coverage [11]. China’s fishing vessel monitoring system (VMS) is based on the BeiDou satellite navigation system and is used to record important information, such as latitude, longitude, date, speed, heading, BeiDou ID, etc., and it is a powerful tool to ensure the safety of fishing vessel navigation at sea and the stability of operation [12]. Currently, all fishing vessels in China are required to compulsorily install fishing vessel monitoring systems, and the equipment is required to be kept on at all times. For these reasons, the VMS is more popular than the AIS for small fishing vessels, and the VMS enables us to obtain more time-integrated, high-precision information about the status of fishing vessels [13,14]. By mining the information of latitude, longitude, date, speed, heading, and BeiDou ID in the VMS data, we can obtain a basic understanding of the operating status of fishing vessels, which is of profound significance in analyzing the fishery resources [15,16], fishing intensity [17,18], and fishing behaviors of fishing vessels [15], and then we can analyze the dynamics of fishery farms [19,20], combat illegal fishing behaviors, and evaluate the impacts on the marine ecosystems [21,22].
A total of 60% of China’s trawl fishing vessels fish in the Yellow Sea and East China Sea [23]. As of the end of 2018, there were 88,852 offshore fishing vessels in the coastal areas of the East China Sea and Yellow Sea, with an annual output of 7,943,082 tons, accounting for 51.6% of the country’s total fishing volume [24]. This study addresses the fishing vessels in Zhejiang Province over one year, from June 2021 to May 2022, as an example, investigating the fishing hotspots and the effectiveness of fishing bans in the East China Sea and the Yellow Sea by developing an integrated analytical framework using BeiDou-derived vessel monitoring system (VMS) data and deep learning. Current IUU management lacks robust methodologies to dynamically map fishing hotspots and assess policy efficacy, particularly in high-intensity regions, like the East China and Yellow Seas. By combining CNN-BiLSTM architectures with multidimensional VMS trajectories, this research aims to (1) establish a high-precision vessel behavior classification system, (2) quantify seasonal fishing pressure under regulatory measures, and (3) identify latent IUU risks during moratorium periods. The framework bridges technical gaps between satellite surveillance data and actionable fisheries governance, providing a replicable model for enhancing compliance verification and adaptive spatial management in data-poor marine regions.
The paper is structured as follows. Section 2 reviews the previous literature; Section 3 presents the research framework, the vessel behavior recognition algorithm, and the fishing hotspot mapping model; Section 4 is a case study of the East China Sea and the Yellow Sea; Section 5 reports the most important results and discusses the effect of the fishery management measures and policy; and Section 6 is the conclusions.

2. Literature Review

Typically, the behavioral states of fishing vessels can be broadly classified into three states, namely, anchoring, fishing, and normal navigation [25]. Traditionally, the analysis of fishing vessel behavior is based on the logbook, which is a manual record of fishing operations, which may lead to some unregistered fishing operations [26]. Since the vessel monitoring system (VMS) and the Automatic Identification System (AIS) are widely used, VMS and AIS data have become the main means for scholars to understand vessel operations [27,28]. As a result, fishing vessel behavior recognition based on the VMS and AIS has gradually become one of the research hotspots in the field of fishery and ocean management. Currently, the methods for analyzing fishing vessel behavior based on big data means can be divided into the following four categories.
The first category is speed and heading- threshold-based methods. The idea of the traditional speed- and heading-based method is to extract the speed as well as the heading thresholds in the VMS data [25,29,30]. This method is easy to operate and suitable for the case of a large amount of data, but when focusing only on the value of one variable, the speed of navigation, it leads to many fishing vessel behaviors at low speeds being misclassified as fishing [31]. To improve the traditional speed heading threshold, some scholars have proposed using a Gaussian mixture model [32,33], which uses the data to fit the bimodal structure of the Gaussian model to identify the fishing status, but it cannot be satisfied for the dataset that cannot be fitted with a Gaussian model.
The second category is the method based on the clustering algorithm. The so-called clustering algorithm mainly takes the initial point of the fishing vessel’s state of low-speed movement or wandering for a long time in a small range as a stopping point in the trajectory of the activity of carrying out fishing behavior and then identifies the fishing behavioral activities in the trajectory of the fishing vessel by detecting the stopping point. Common clustering algorithms are K-means [34,35] and DBSCAN (Density-based Spatial Clustering of Applications with Noise) [36,37,38]. The K-means algorithm relies on the setting of the K value, which is subjective [39]. Clustering algorithms, on the other hand, require a large number of datasets to form feature clusters and have requirements on the size and shape of the nested classes and thus are not suitable for datasets with small sample sizes and a wide operating area [39].
The third category is probability-based methodologies. Probability-based recognition algorithms mainly recognize the operational states of a trajectory by determining the transition probabilities between the three operational states of a fishing vessel. Among them, the Hidden Markov Model (HMM) [40] and the Bayesian model [41,42] are widely used for fishing vessel operational state identification. The probability-based methodology has strong robustness, but the disadvantage is that it requires a large training set of samples, and the model predicts the next point from the state of the previous point, which does not have a good grasp of the trajectory as a whole, and the recognition accuracy is not high.
The fourth category is deep learning-based methodologies. With the continuous improvement of methods for behavioral recognition, deep learning has been widely used in speech recognition, visual object recognition, object detection, and many other fields, such as drug discovery and genomics [43,44,45], and it is also gradually being applied to the field of fishing vessel recognition to learn deep features among fishing vessel data [46,47]. Common deep learning methodologies include feedforward neural networks, e.g., convolutional neural networks (CNNs). CNNs have a good ability to model local and spatial structures, can accurately extract image features, and achieve translation invariance and scale invariance of features through convolution and pooling operations, which makes CNNs excel in image feature extraction and feature representation, and they can be used as a feature extractor for fishing vessel data [48,49]. The second includes feedback neural networks, such as long short-term memory (LSTM), which has an excellent performance in modeling and prediction of sequential data and can be used for the prediction of fishing vessel sequential data as it can capture long-term dependencies in the sequential data and perform contextual modeling through the gating mechanism and the memory units [50]. However, LSTM models only consider information in one direction, relying on the effects of previous moments [51], whereas BiLSTM can bi-directionally process sequence data using two independent hidden layers, and it has been successfully applied to language and image processing [52]. In previous deep learning-based methodology studies, many scholars have experimented with fishing vessel trajectory datasets, all of which have achieved good results, and they are currently one of the most accurate and popular methodologies in the field of fishing vessel behavior recognition [53,54].
The Yellow Sea and East China Sea are vast, and tens of thousands of fishing vessels are engaged in fishing operations every day. However, most of the previous literature focuses on the behavioral identification of single fishing gears and vessels, such as trawl [55,56], drift net [40,57], and longline [58,59], and there is no in-depth consideration of the data of a combination of multiple fishing gears and vessels. There is no clear boundary of the scope of the fishing grounds in the Yellow Sea and the East China Sea in the traditional sense. There are fewer descriptions of the research of fishing hotspots as well as spatial and temporal variations of the fishing hotspots in the East China Sea in the existing literature.
Based on this, considering that VMS systems are more reliable than AIS systems among fishing vessels in China and that the VMS could provide more accurate information on fishing vessels than the AIS, this paper proposes a research framework that combines BeiDou big data and deep learning to investigate the fishing hotspot of fishing vessels.

3. Methodology

3.1. Research Framework for Fishing Hotspots Based on BeiDou Big Data and Deep Learning

This subsection describes, in detail, the main elements and functions of the research framework for fishing hotspots based on BeiDou big data and deep learning.
The research framework is divided into three main modules: deep learning, BeiDou big data, and hotspot analysis method (see Figure 1). The deep learning module selects the most suitable algorithm for the BeiDou dataset through comparison. The BeiDou big data module involves cleaning, processing, and filtering the raw fishing vessel VMS data. Then, BeiDou big data drove the deep learning algorithm to classify the fishing vessel behaviors. The hotspot analysis method clusters the classified data into fishing hotspots of fishing vessels in the study area.

3.2. CNN-BiLSTM Algorithm

The CNN-BiLSTM architecture was selected over other models for fishing vessel behavior recognition in this study due to four key technical and methodological advantages.
i.
Spatiotemporal Feature Synergy
The CNN excels at extracting local spatial patterns from sequential VMS data, while BiLSTM captures bi-directional temporal dependencies.
Transformers, while powerful in global context modeling, struggle to inherently prioritize localized spatiotemporal interactions critical for distinguishing transient fishing behaviors (e.g., trawling vs. transit).
ii.
Computational Efficiency
The linear complexity of the CNN-BiLSTM (O(n)) outperforms Transformer’s quadratic attention mechanisms (O(n2)) when processing long-term BeiDou sequences (average 1273 daily points/vessel). This ensures practical deployability on maritime monitoring systems with hardware constraints.
iii.
Small-Data Robustness
CNN-BiLSTM’s parameter-sharing convolutional layers and L1 regularization prevent overfitting more effectively than attention-based models, which typically require larger datasets to learn meaningful self-attention patterns.
iv.
Interpretable Hierarchical Learning
The staged architecture (CNN → BiLSTM → classification) provides granular diagnostic capabilities. Convolutional filters identify localized fishing signatures, and BiLSTM gates track behavioral phase transitions.
The CNN-BiLSTM architecture was selected after rigorous empirical and theoretical evaluation of its capacity to model localized spatial features and bi-directional temporal dependencies inherent to VMS trajectories. Compared to GRU- or Transformer-based hybrids, the framework achieves superior parameter efficiency and interpretability while maintaining robustness to noise—critical for real-world deployment in resource-constrained maritime monitoring systems.

3.2.1. CNN Model

Convolutional neural networks (CNNs) are currently used in many fields such as face recognition [60], text classification [61], image classification [62], object detection [63], Spectroscopy measurements [64], etc. The CNN usually includes an input layer, a convolutional layer, a pooling layer, a fully connected layer, and an output layer, and the input data of the fishing boats are all one dimensional. The convolutional layer is the core of the CNN, containing multiple convolution kernels. The input data and convolution kernels complete the convolution operation, which ensures network sparsity and parameter sharing [65]. The main operations of the convolutional layer are shown in Formula (1) as follows:
x i o u t = f i = 1 n x i i n w i j + b j
where i denotes the number of convolutional layers of the CNN; x i o u t denotes the output value of the first layer; f · denotes the activation function; x i i n denotes the input value of the i layer; w i j denotes the i weight matrix of the j convolutional layer and the first neuron; and b j denotes the j bias value of the output.
The pooling layer is mainly used to compress the features extracted from the convolutional layer to speed up the network’s operation. There are mainly two methods, average pooling and maximum pooling, and in this paper, the maximum pooling method is selected.
The main role of the fully connected layer is to purify the features extracted by the convolutional extraction and pooling compression, and then they are often connected to the Dropout layer to prevent overfitting and then handed over to the SoftMax layer for classification output.

3.2.2. BiLSTM Model

LSTM is an improved model of a recurrent neural network (RNN), which can well filter the temporal data that needs to be remembered, but LSTM can only consider the information from the front to the back. BiLSTM can process the sequential data in both directions using two independent hidden layers. LSTM consists of forgetting gates, input gates, output gates, and memory units [66], and the specific computational process in Formulas (2)–(6) is as follows:
F t = σ s W f h t 1 , x t + b f
I t = σ s W i h t 1 , x t + b i
C ¯ t = σ t W c h t 1 , x t + b c
C t = F t · C t 1 + I t · C ¯ t
O t = σ s W o h t 1 , x t + b o
where t , f , i , c , and o denote the current state, oblivion gate, input gate, candidate unit, and output gate, respectively; F t , I t , and O t denote the output values of the oblivion gate, input gate, and output gate, respectively; C ¯ t , C t , and C t 1 denote the state of the candidate unit, the current unit state, and the state of the previous unit; W f , W i , W c , and W o denote the weight values of the oblivion gate, the input gate, the candidate unit, and the output gate, respectively; σ s denotes the Sigmoid activation function; σ t denotes the tanh activation function; h t 1 , x t is the vector matrix consisting of the previous and current moments; b f ,   b i , b c , and b o are the bias values of the forgetting gate, the input gate, the candidate unit, and the output gate, respectively.
BiLSTM consists of a forward LSTM and a reverse LSTM together, where the forward LSTM is responsible for the inputs of x 1 , x 2 x n and the reverse LSTM is responsible for extracting the features in positive and negative order. The feature vectors of the two outputs are then combined to form the final feature expression [52].

3.2.3. Modeling Evaluation

The selection of accuracy, precision, recall, and F1 score align with the dual objectives of minimizing false positives and false negatives. Precision indicates the proportion of actual positive samples in the samples with positive prediction results. Recall indicates the proportion of actual positive samples in the samples with positive prediction results to the proportion of positive samples in the full samples. The two preferred use scenarios are different and often have a relationship between them. To synthesize the two use scenarios, the weighted indicator Fl score is introduced for the two [67]. Although this study is a three-classification problem, the anchoring and sailing states can also be recognized as non-fishing states, which is approximated as a two-classification problem. The F1 score is a combination of the two, and the higher the F1 score, the more robust the model is [68]. Accuracy provides a holistic performance measure, while precision and recall respectively address domain-specific costs of over-detection and under-detection. The F1 score balances these trade-offs, particularly crucial given the class imbalance in maritime datasets. The related metrics formulas are shown in Formulas (7)–(10) as follows:
A c c u r a c y = T P + T N T P + F P + T N + F N
P r e c i s i o n = T P T P + F P
R e c a l l = T P T P + F N
F 1 = 2 P r e c i s i o n R e c a l l P r e c i s i o n + R e c a l l
where TP is the number that was predicted to be positive and was also positive; FP is the number that was predicted to be positive and was negative; FN is the number that was predicted to be negative and was positive; and TN is the number that was predicted to be negative and was also negative.

3.3. Hot Spot Analysis

The Hot Spot Analysis (HSA) [69,70,71] is an area where the importance of an element as a hotspot exceeds 95%, and this threshold is often used to define the range of live animals. That is, as a fishing hotspot, the area where the number of fishing points should be greater than 95%, and this boundary is used as the basis for dividing fishing hotspots.

3.4. Fishing Hotspot Mapping Model Based on BeiDou Big Data and the CNN-BiLSTM Algorithm

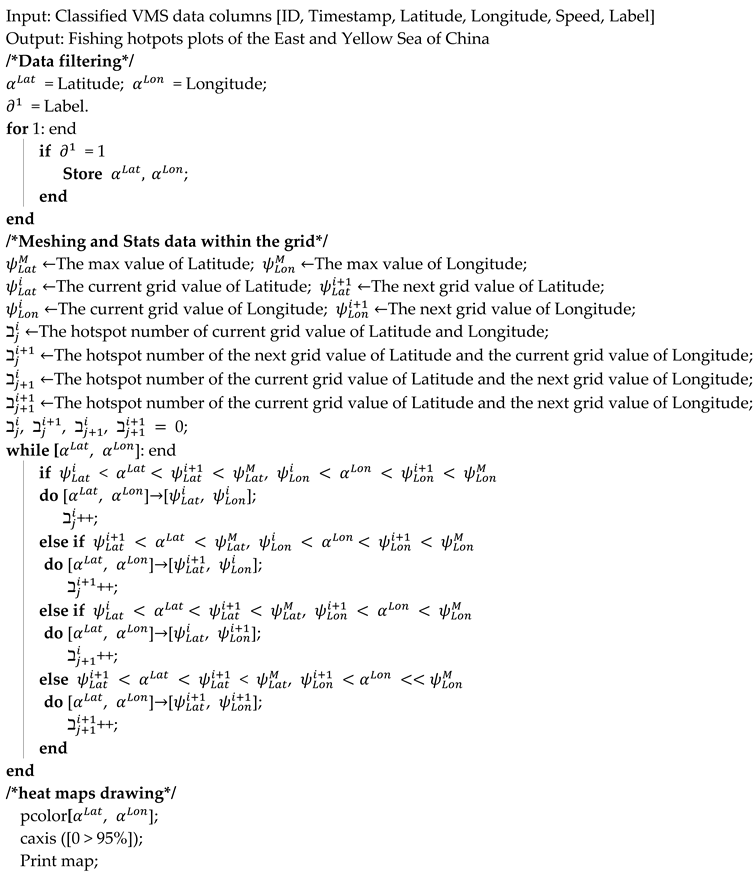
Chinese fishing vessels operate within designated zones that maintain a specific distance from the coastline. We categorize vessels as follows: those within 1 nautical mile of the coastline and with speeds below 1 knot are labeled 0; vessels beyond 1 nautical mile from the coastline and with speeds exceeding 5 knots are labeled 2; and all other cases are labeled 1. Based on the above algorithm, the existing VMS data were labeled (0 for stationary labels, 1 for fishing labels, and 2 for normal sailing). The labeled VMS data are plotted as fishing hotspots according to the pseudo-code of the East China Sea and the Yellow Sea fishing hotspot mapping model using the CNN-BiLSTM and BeiDou big data presented in Algorithm 1.
Algorithm 1. Fishing hotspot mapping model of the East China Sea and the Yellow Sea based on the CNN-BiLSTM and BeiDou big data.
Jmse 13 00905 i001
The model input comprises six columns corresponding to BeiDou ID, timestamp, latitude, longitude, velocity, and label, respectively.
Step 1 is Data Filtering. Segregate input data by label, with special isolation of fishing-related records.
Step 2 is Spatiotemporal Grid Analysis. Establish a grid system with a 0.05° resolution in both latitude and longitude. The study area encompasses approximately 51,000 grid cells. Spatial interpolation is applied to assign filtered vessel positions to their respective grid cells, followed by quantification of position density per grid.
Step 3 is Hotspot Identification. Generate fishing hotspot maps by applying a 95th percentile threshold to grid cell position density. Cells exceeding this threshold are classified as fishing hotspots.

4. Case Study

4.1. Study Area

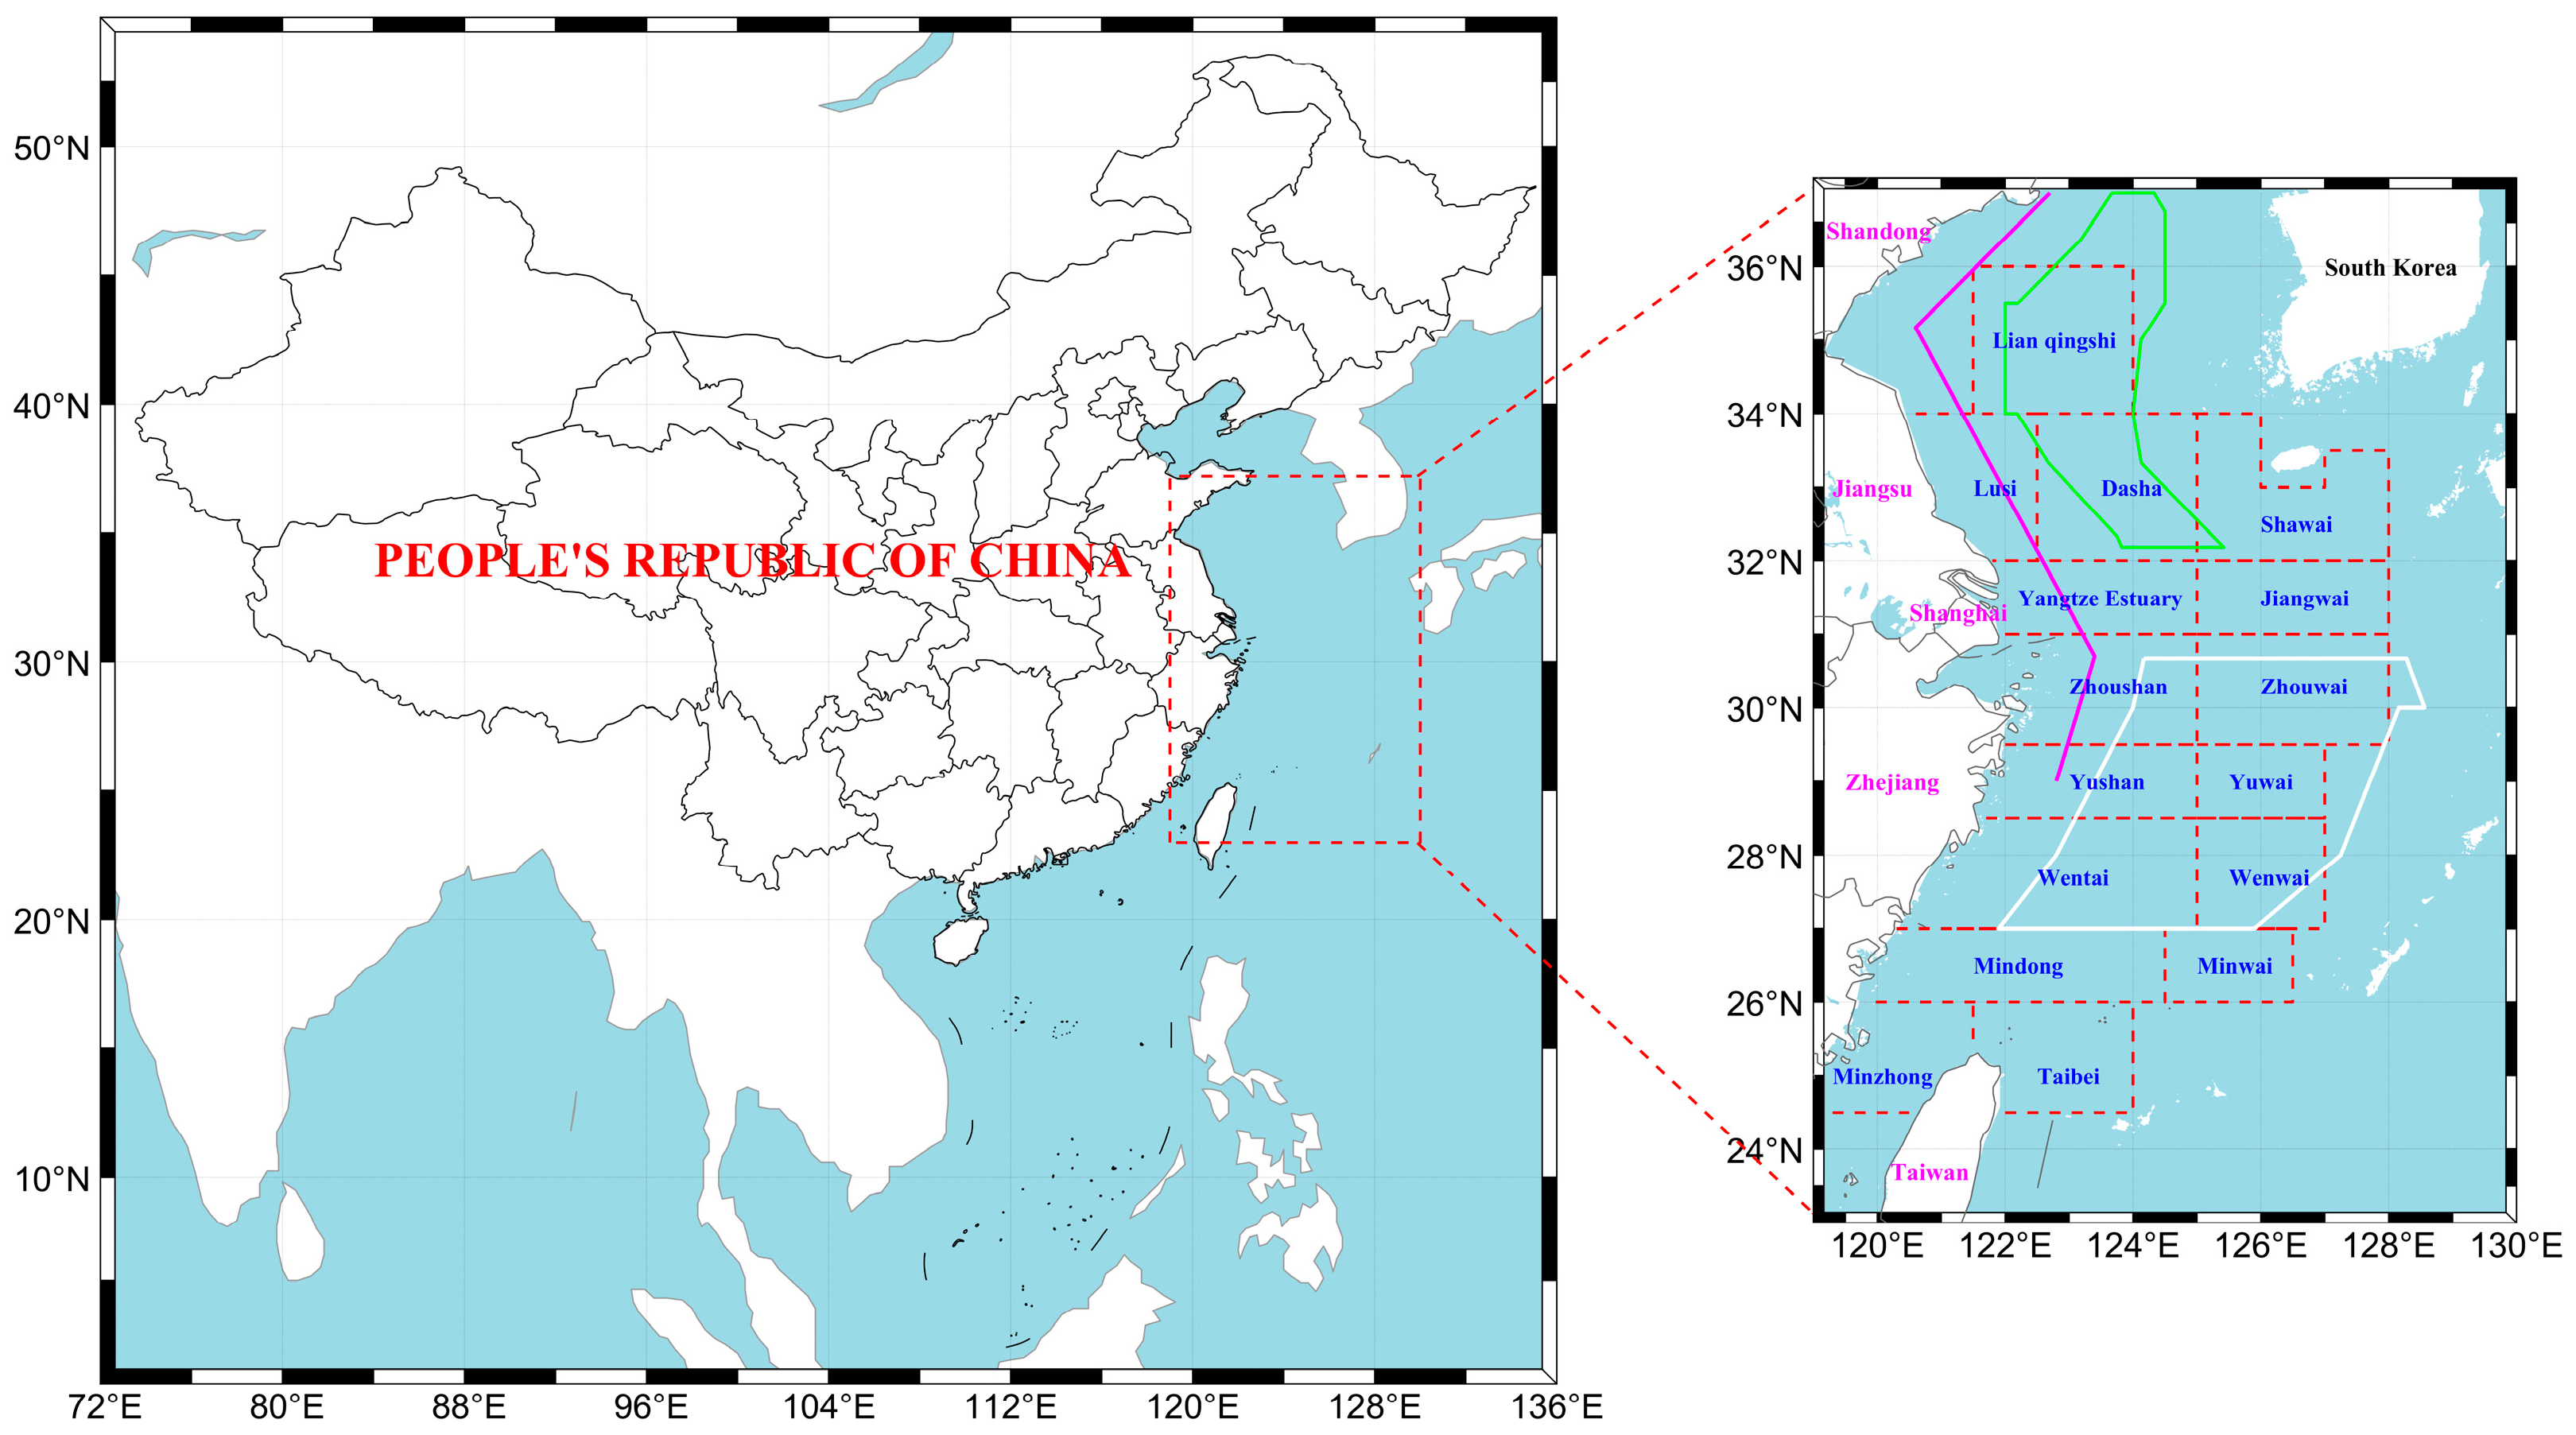
The overall area of the East China Sea and the Yellow Sea is located at 22°42′~39°50′ N, 117°11′~131° E. From north to south, six provinces and cities, namely, Shandong, Jiangsu, Shanghai, Zhejiang, and Fujian, as well as Taiwan, are located along the East China Sea and the Yellow Sea, which is rich in fishery resources. The overall data are distributed in most of the East China Sea and the Yellow Sea from 23°~37° N, 119°~130° E, which contains 16 major fishing grounds in the East China Sea and the Yellow Sea and the China–Japan and China–Korea Fishery Agreement Provisional Measures Zones (PMZs) (see Figure 2). Among them, the East Sea has a subtropical and temperate climate, which is conducive to the reproduction and growth of plankton, and it is a good place for a variety of fish and shrimp colonies and habitats [72].

4.2. Data

The data used in this study are the VMS data of five types of fishing vessels, namely, trawlers, purse seiners, gillnets, tension nets, and longlines, in the East China Sea and the Yellow Sea waters from June 2021 to May 2022, which contain a total of 12 months, with a total of more than 2.8 billion pieces of VMS information recorded.
Fishing vessel speed, transmit time, longitude, and latitude data in the BeiDou database are stored in a certain format and cannot be extracted directly for analysis, so they need to be converted according to the official data interpretation method. The speed data in the database are all 10 times the actual speed; we apply the algorithm of Feng, Grifoll, Yang, and Zheng [73] to convert the speed, and speed anomalies of less than 0 knots and more than 20 knots need to be eliminated. Since this study does not involve the extraction of trajectories, the corresponding missing values have been excluded, and the ship position point data with normal data are retained.
After data processing, from 1 June 2021 to 30 May 2022, we identified a total of 2805 fishing vessels, of which 1915 were trawlers, 21 were stowers, 41 were longlines, 782 were drift gillnets, and 46 were purse seiners. With an average of 1273 vessel points reported per day by a single vessel and an average of 463,521 vessel points recorded per day, the average number of fishing vessels per month varied as follows (Table 1).

4.3. Model Verification

4.3.1. CNN Layer

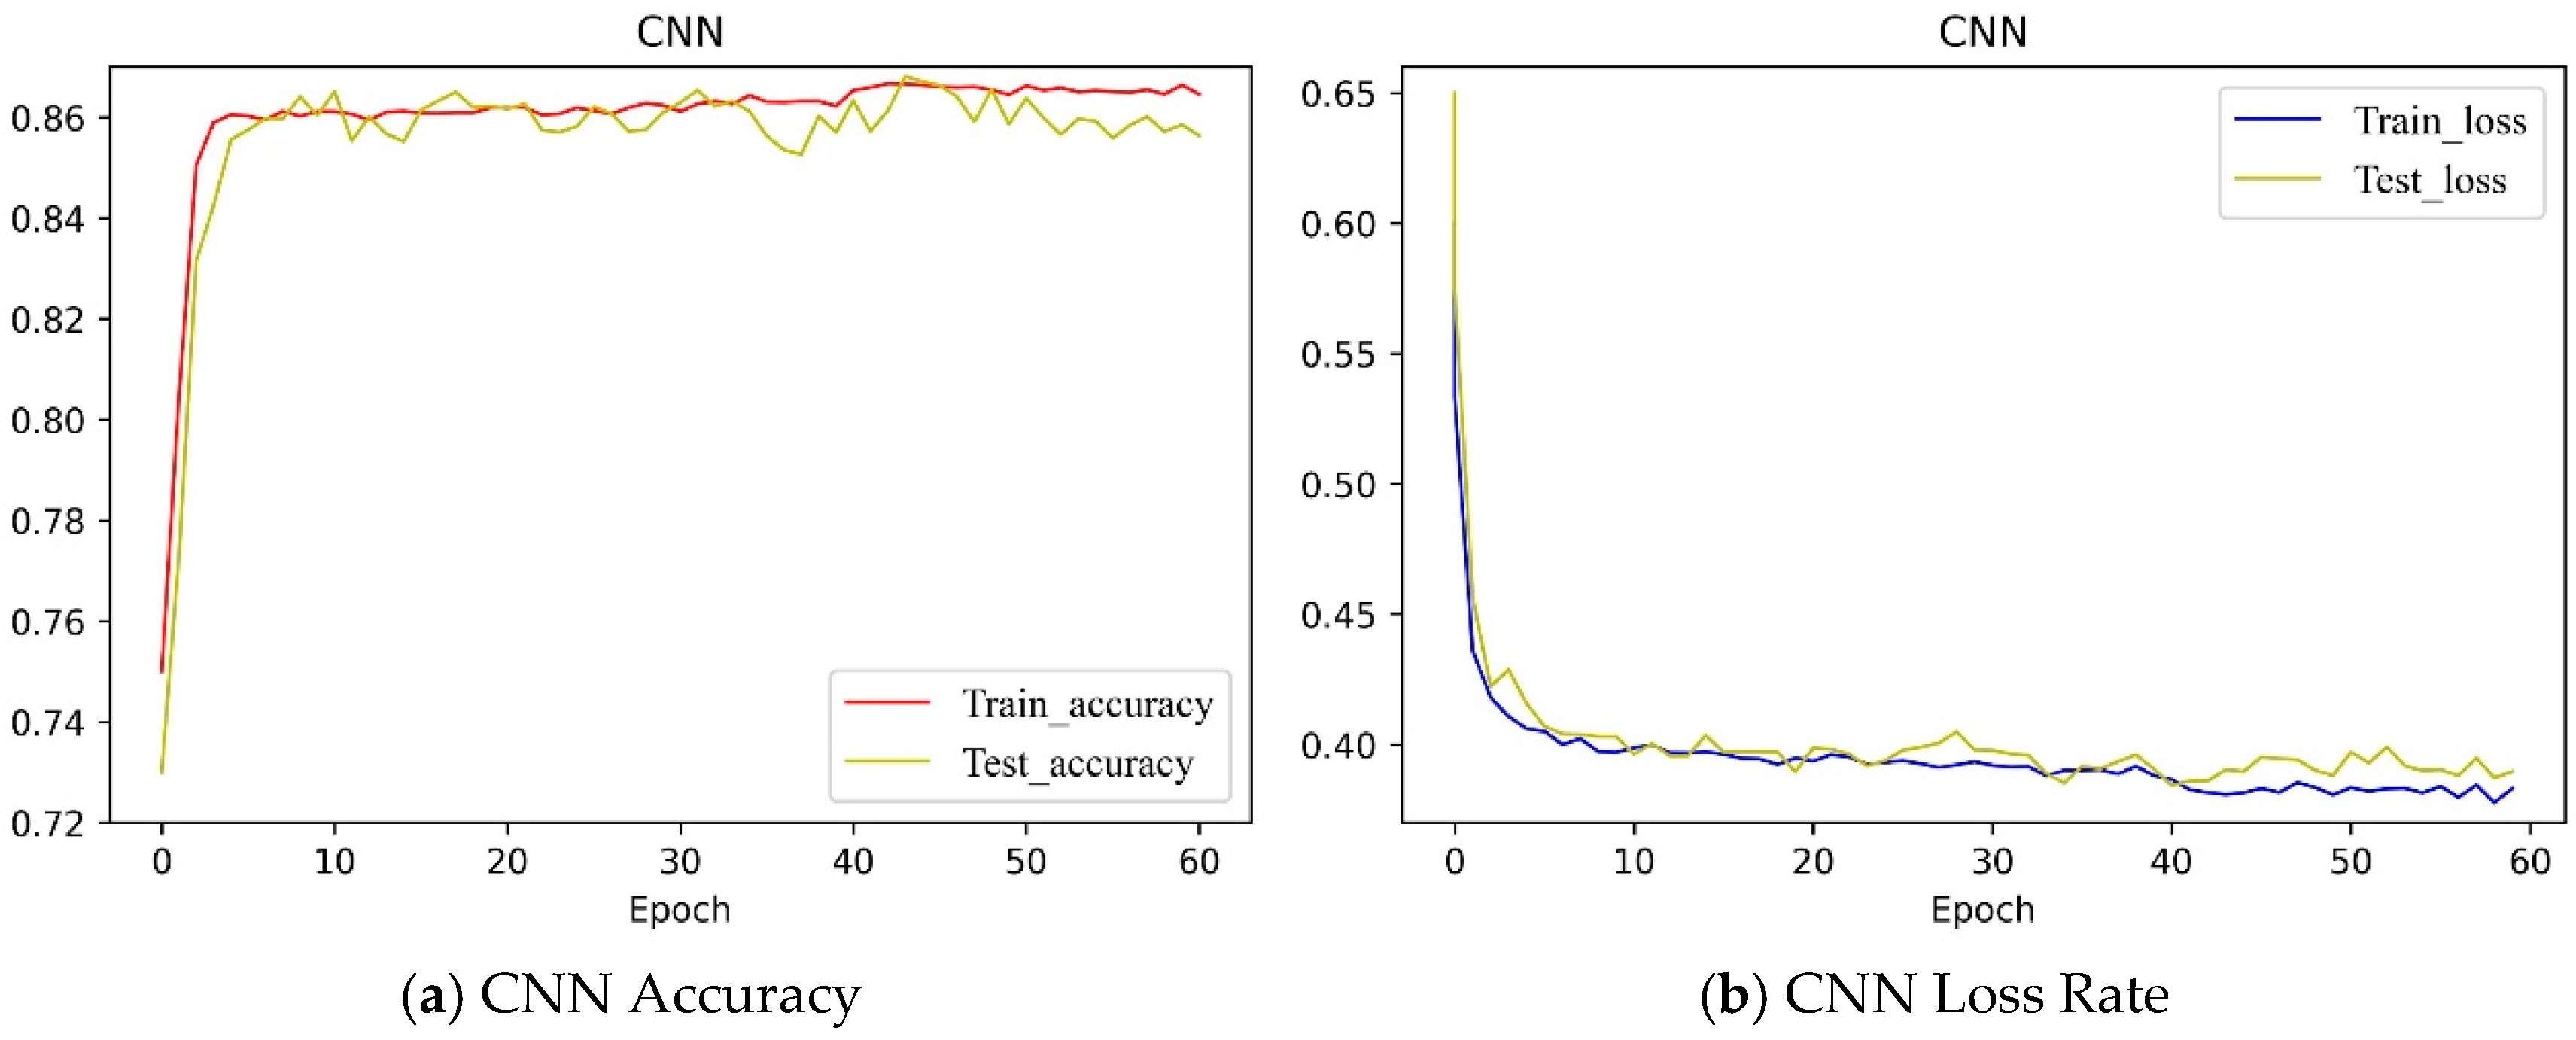
According to China’s annual summer fishing moratorium in 2021, trawlers and open-net vessels were subject to a fishing ban from May to September, while other fishing vessels were prohibited from operating between May and August. To ensure model convergence accuracy, this study employed vessel position data from a representative day in mid-October as training inputs, with behavioral labels assigned as follows: 1 for active fishing, 0 for anchoring, and 2 for normal transit. A total of 339,757 geospatial vessel points were sampled and partitioned into training (271,805 points) and test (67,952 points) sets at an 80:20 ratio. During CNN algorithm development, empirical observations indicated model performance plateauing after 40 epochs; nevertheless, the iteration count was conservatively set to 60 cycles to ensure convergence robustness. The training set facilitated parameter optimization, including neural network weight matrices and bias vectors with validation data monitoring overfitting/underfitting risks, while the test set objectively assessed predictive capability. For multi-class classification, the SoftMax activation function was implemented in conjunction with L1 regularization to enhance generalizability. Hyperparameter configurations detailing the CNN architecture are systematically presented in Table 2.
Table 2 lists the typical configurations during the exploration of the optimal structure and parameters of the CNN in this paper, with the convolutional layer numbers representing the number of filters. Architectures A–E, using only convolutional layers, show that the number of convolutional layers increased from one layer in Architecture A to four layers in Architecture D. The accuracy in Architecture D reaches the maximum, showing that four convolutional layers have a relatively more appropriate depth, and Architecture E adds another layer of convolutional layers, which leads to overfitting, and, therefore, the accuracy of the test set decreases instead of increasing. To alleviate the overfitting problem, Architecture F adds a Dropout layer and a maximum pooling layer on top of Architecture D, and the model accuracy is improved compared to Architecture D. To confirm whether the overfitting phenomenon can continue to be mitigated, Architecture G adds another maximum pooling layer and a Dropout layer on top of Architecture F, and the accuracy of Architecture G is effectively improved. To continue to alleviate the overfitting problem, Architecture H added a Dropout layer after fully connected layer 1 for feature extraction, but the test accuracy decreased and was accompanied by underfitting. The reason is that the use of too many Dropout layers causes the network to lose a large number of neurons and results in the model learning insufficient features. Therefore, a reasonable arrangement of Dropout can maintain a balance between the overfitting and underfitting problems. According to the experiment, the model’s performance is better by keeping only the Dropout layer after convolutional layer 4. In conclusion, the optimal CNN structure is Architecture G.
Figure 3 shows the trend of the model accuracy as well as the loss value during the training process. After the 35th epoch, the model has less fluctuation in the accuracy and loss value in the training set and test set.

4.3.2. BiLSTM Layer

Table 3 lists the typical configurations used in this paper when exploring the optimal structure of BiLSTM. The numbers in the BiLSTM layers represent the number of neurons, and following a similar idea to the CNN architecture, Architectures A–D were taken to use only BiLSTM recurrent units. The results show that the three-layer BiLSTM reaches the optimal accuracy in the test set, and if it continues to increase, it will lead to model overfitting, resulting in a decrease in accuracy, so the three-layer BiLSTM recurrent body unit is more appropriate.
Architecture E adds a Dropout layer on top of Architecture C to regulate the overfitting problem, and the test accuracy is further improved. However, if we continue to add the fully connected and Dropout layers, the accuracy of Architecture F will decrease, probably due to the fully connected layer increasing the overfitting of the model. To further verify that it is the fully connected layer that causes the overfitting problem, Architecture G adds the Dropout layer after the third BiLSTM layer and cancels fully connected layer 1, which improves the accuracy over Architecture E. Therefore, Architecture G is the optimal BiLSTM structure.
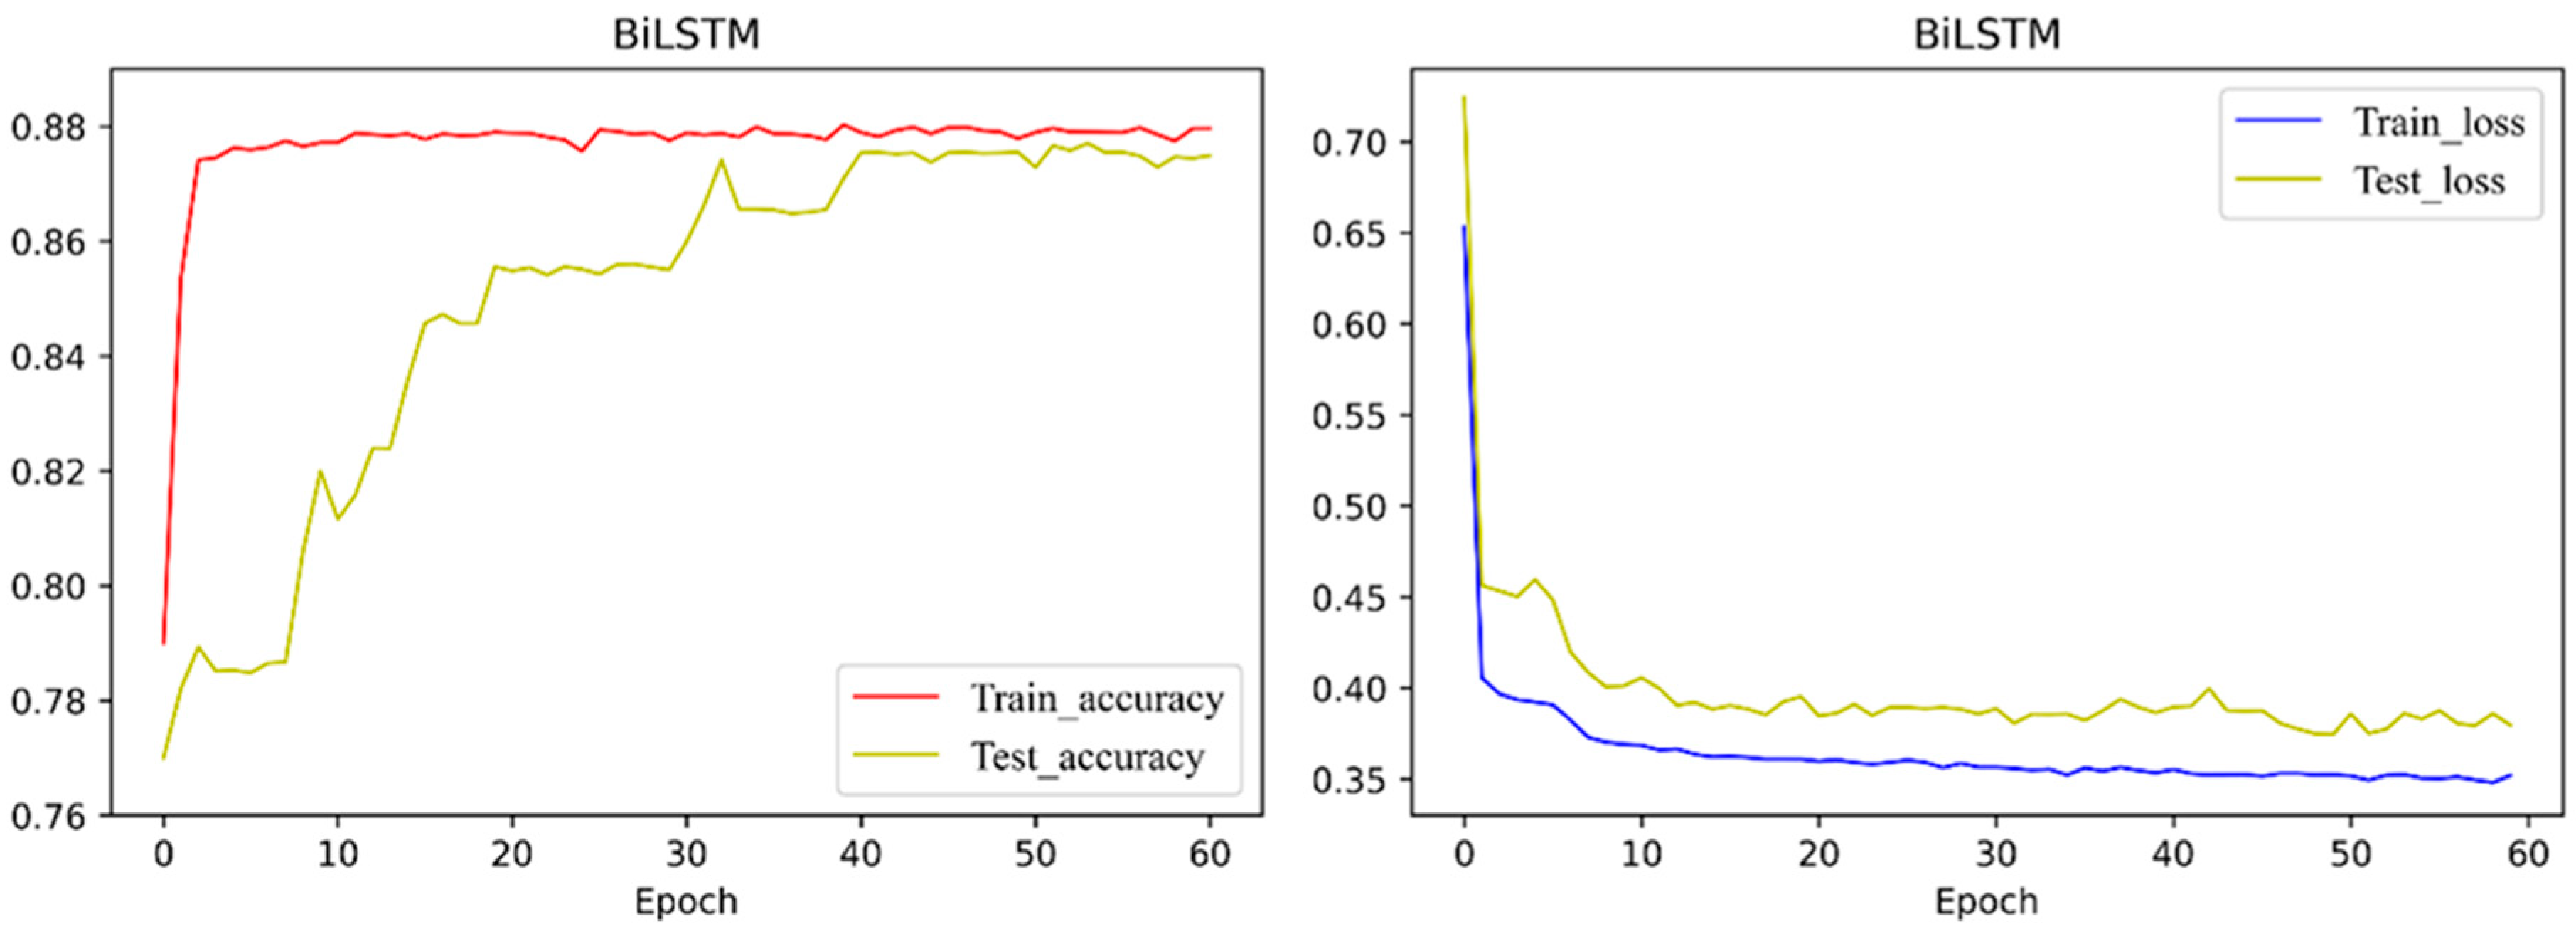
Figure 4 shows the trend of the model accuracy as well as the loss value during the training process of BiLSTM under the optimal structure; after the 40th epoch, the model fluctuates less in the training set in terms of accuracy and loss value, and there are overfitting fluctuations in the test set, but it tends to be stable.

4.3.3. CNN-BiLSTM

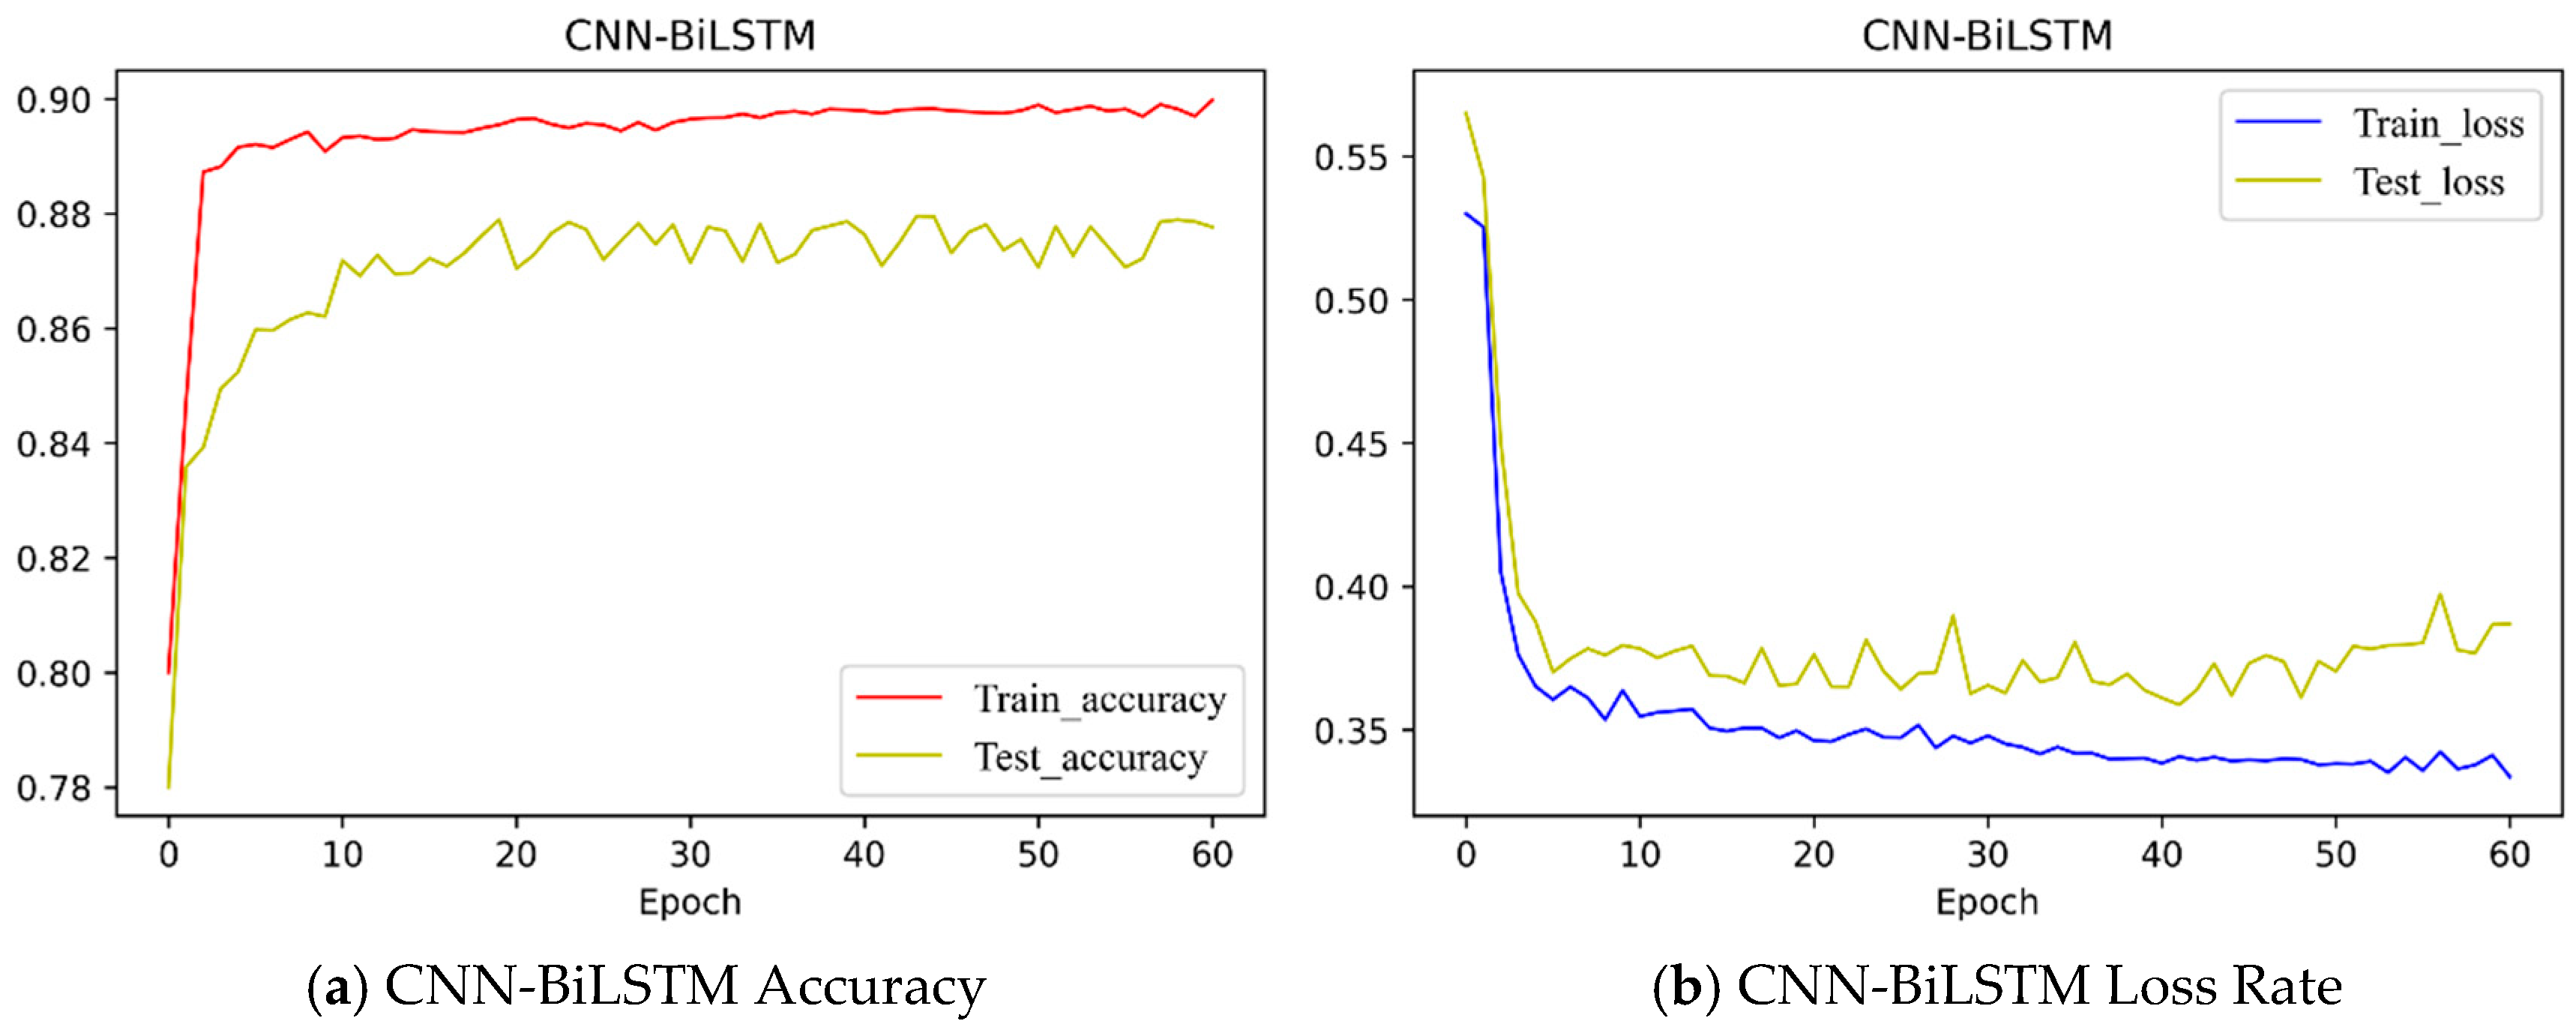
Figure 5 shows the trend of the model accuracy as well as the loss value of the CNN-BiLSTM during the training process. The model performs well on the training set, and overfitting fluctuation occurs on the test set, but the overall errors are small. We believe that the CNN-BiLSTM performs well on the dataset.

4.3.4. Model Evaluation and Comparison

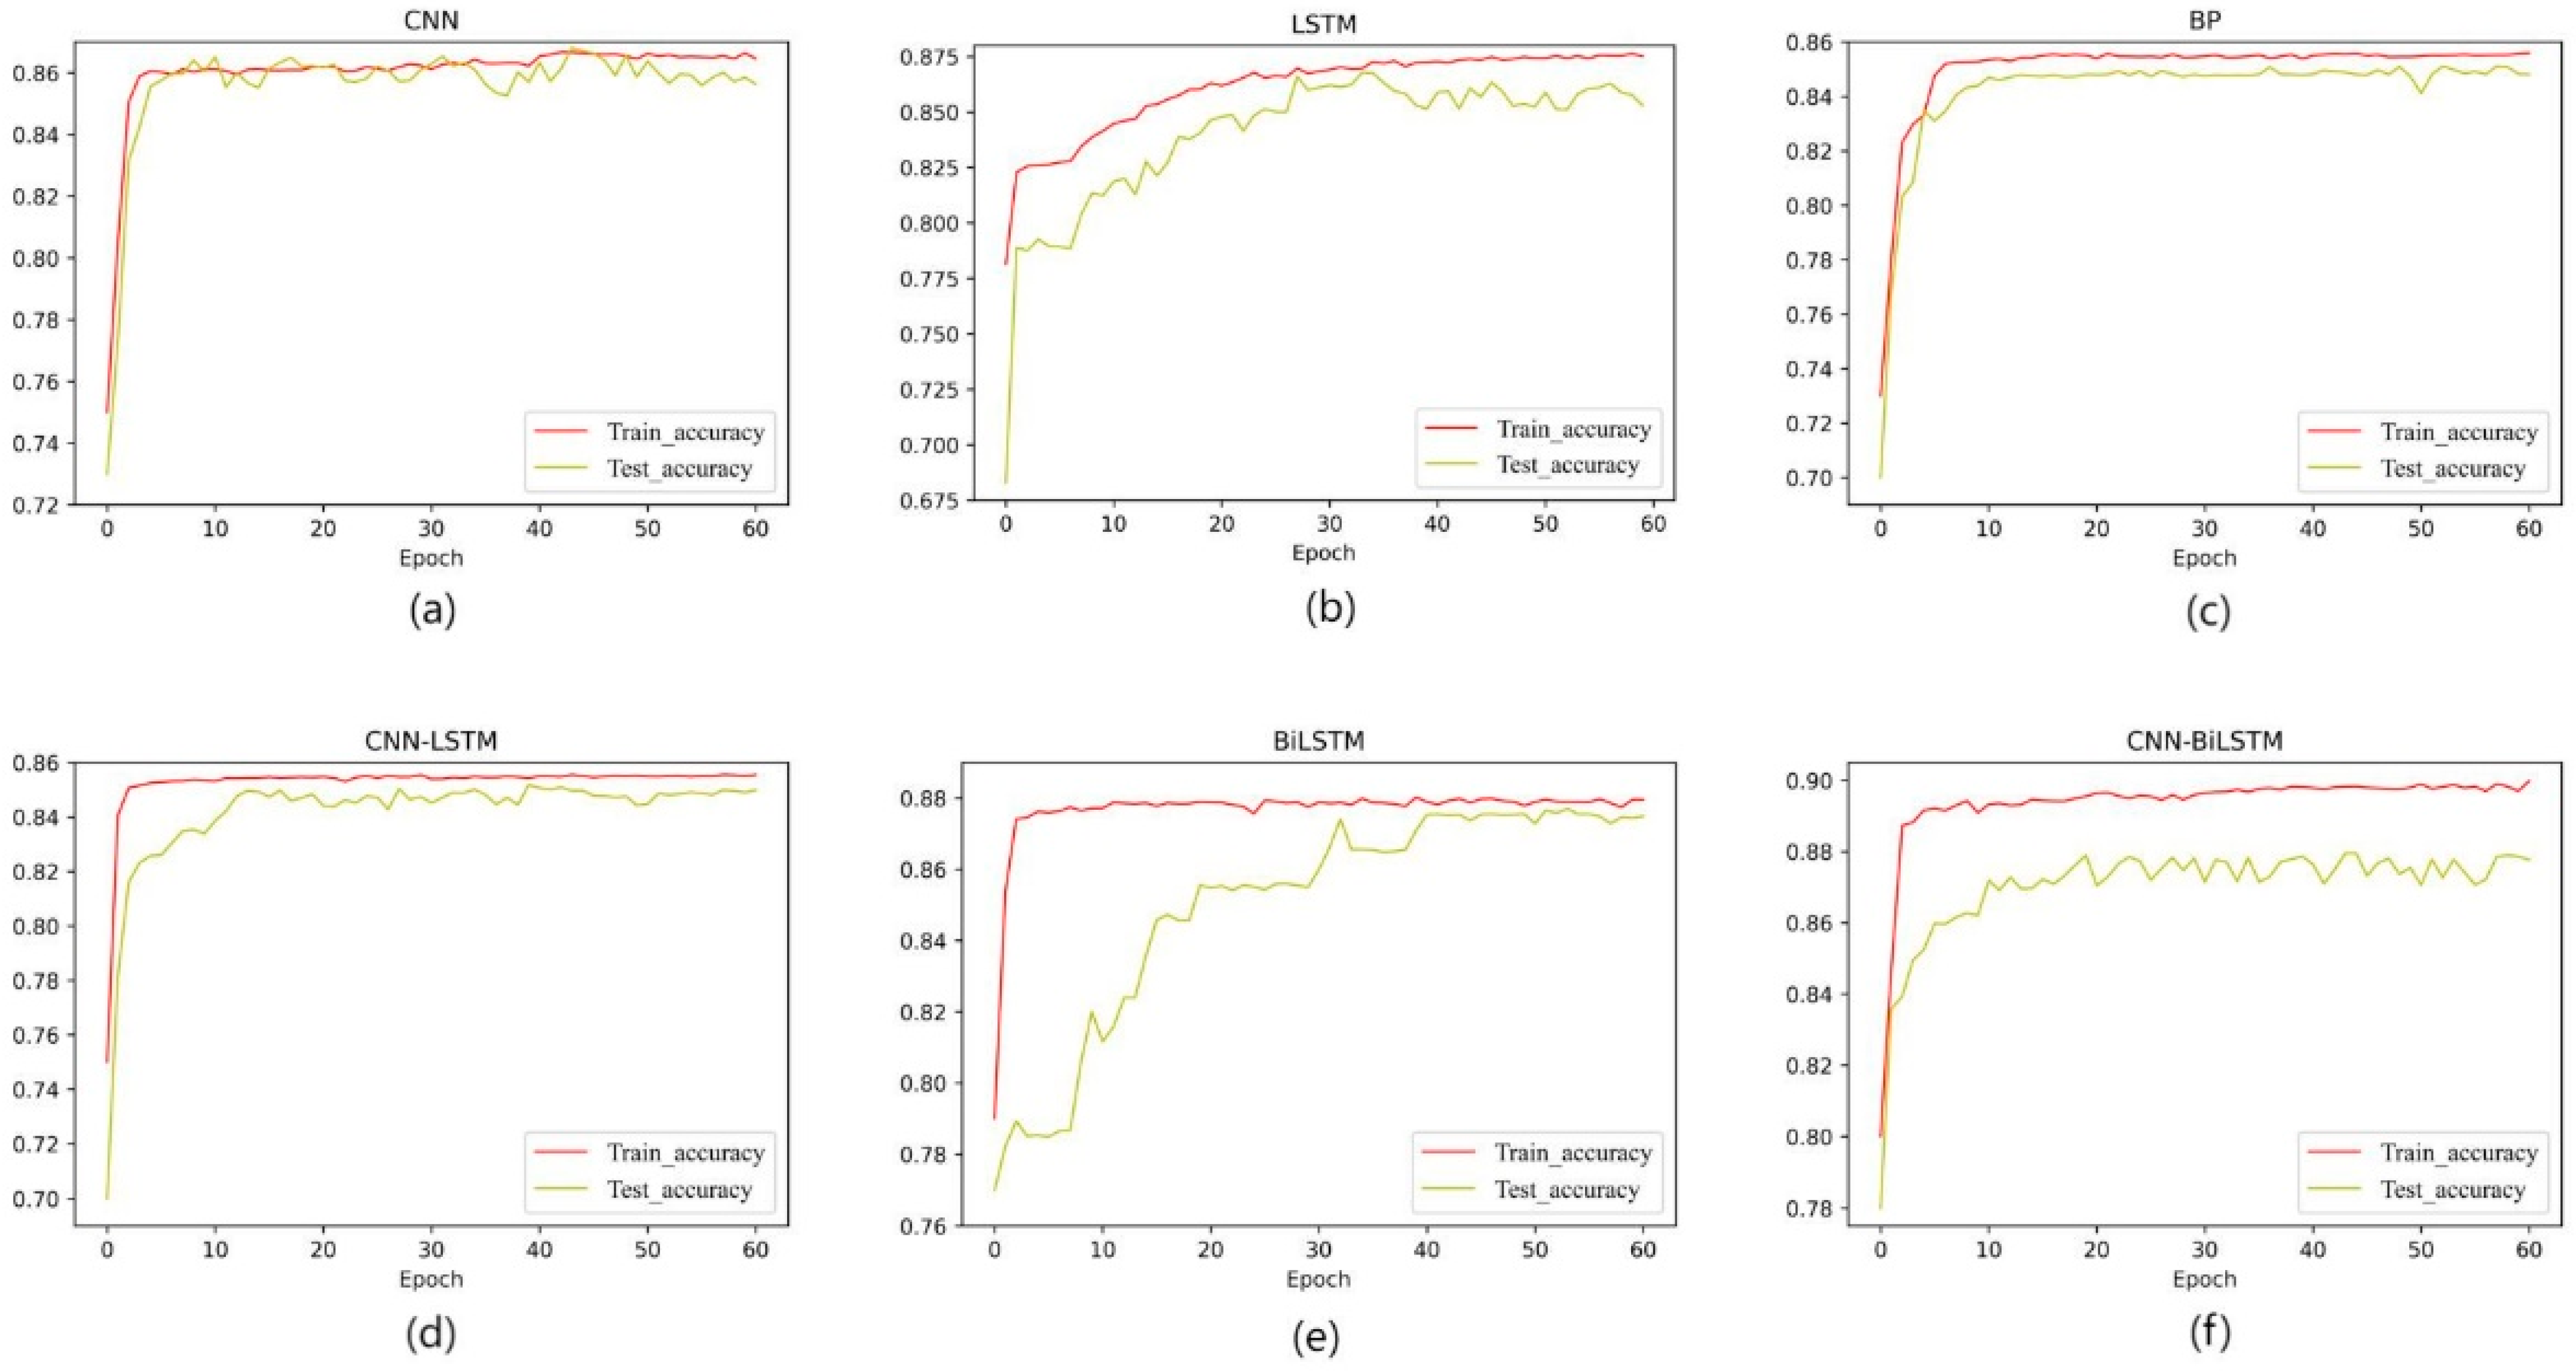
In addition, this paper also compares the accuracy of the BP neural network and the CNN-LSTM and LSTM networks; the accuracy graph of each network is shown in Figure 6.
Based on the evaluation indexes in the previous section, the classification results of the neural networks in this paper are as follows (see Table 4), and since the F1 index of the CNN-BiLSTM model has the highest score of 87.72% among these six models, we can consider that the CNN-BiLSTM predicts the dataset most accurately.

5. Results and Discussion

5.1. Results

5.1.1. Monthly Changes in Fishing Hotspots in the East China Sea and the Yellow Sea

Excluding the effect of the closed season, we counted the number of catches on each grid in October in a logarithmic distribution. As shown in Figure 7, we found that in the logarithmic function with a base of 10, the proportion is more than 95% when the number of hotspots is close to 8000 (the lg function is equal to about 3.9), so in this study, we consider the number of catches exceeding 8000 in a single grid as a fishing hotspot.
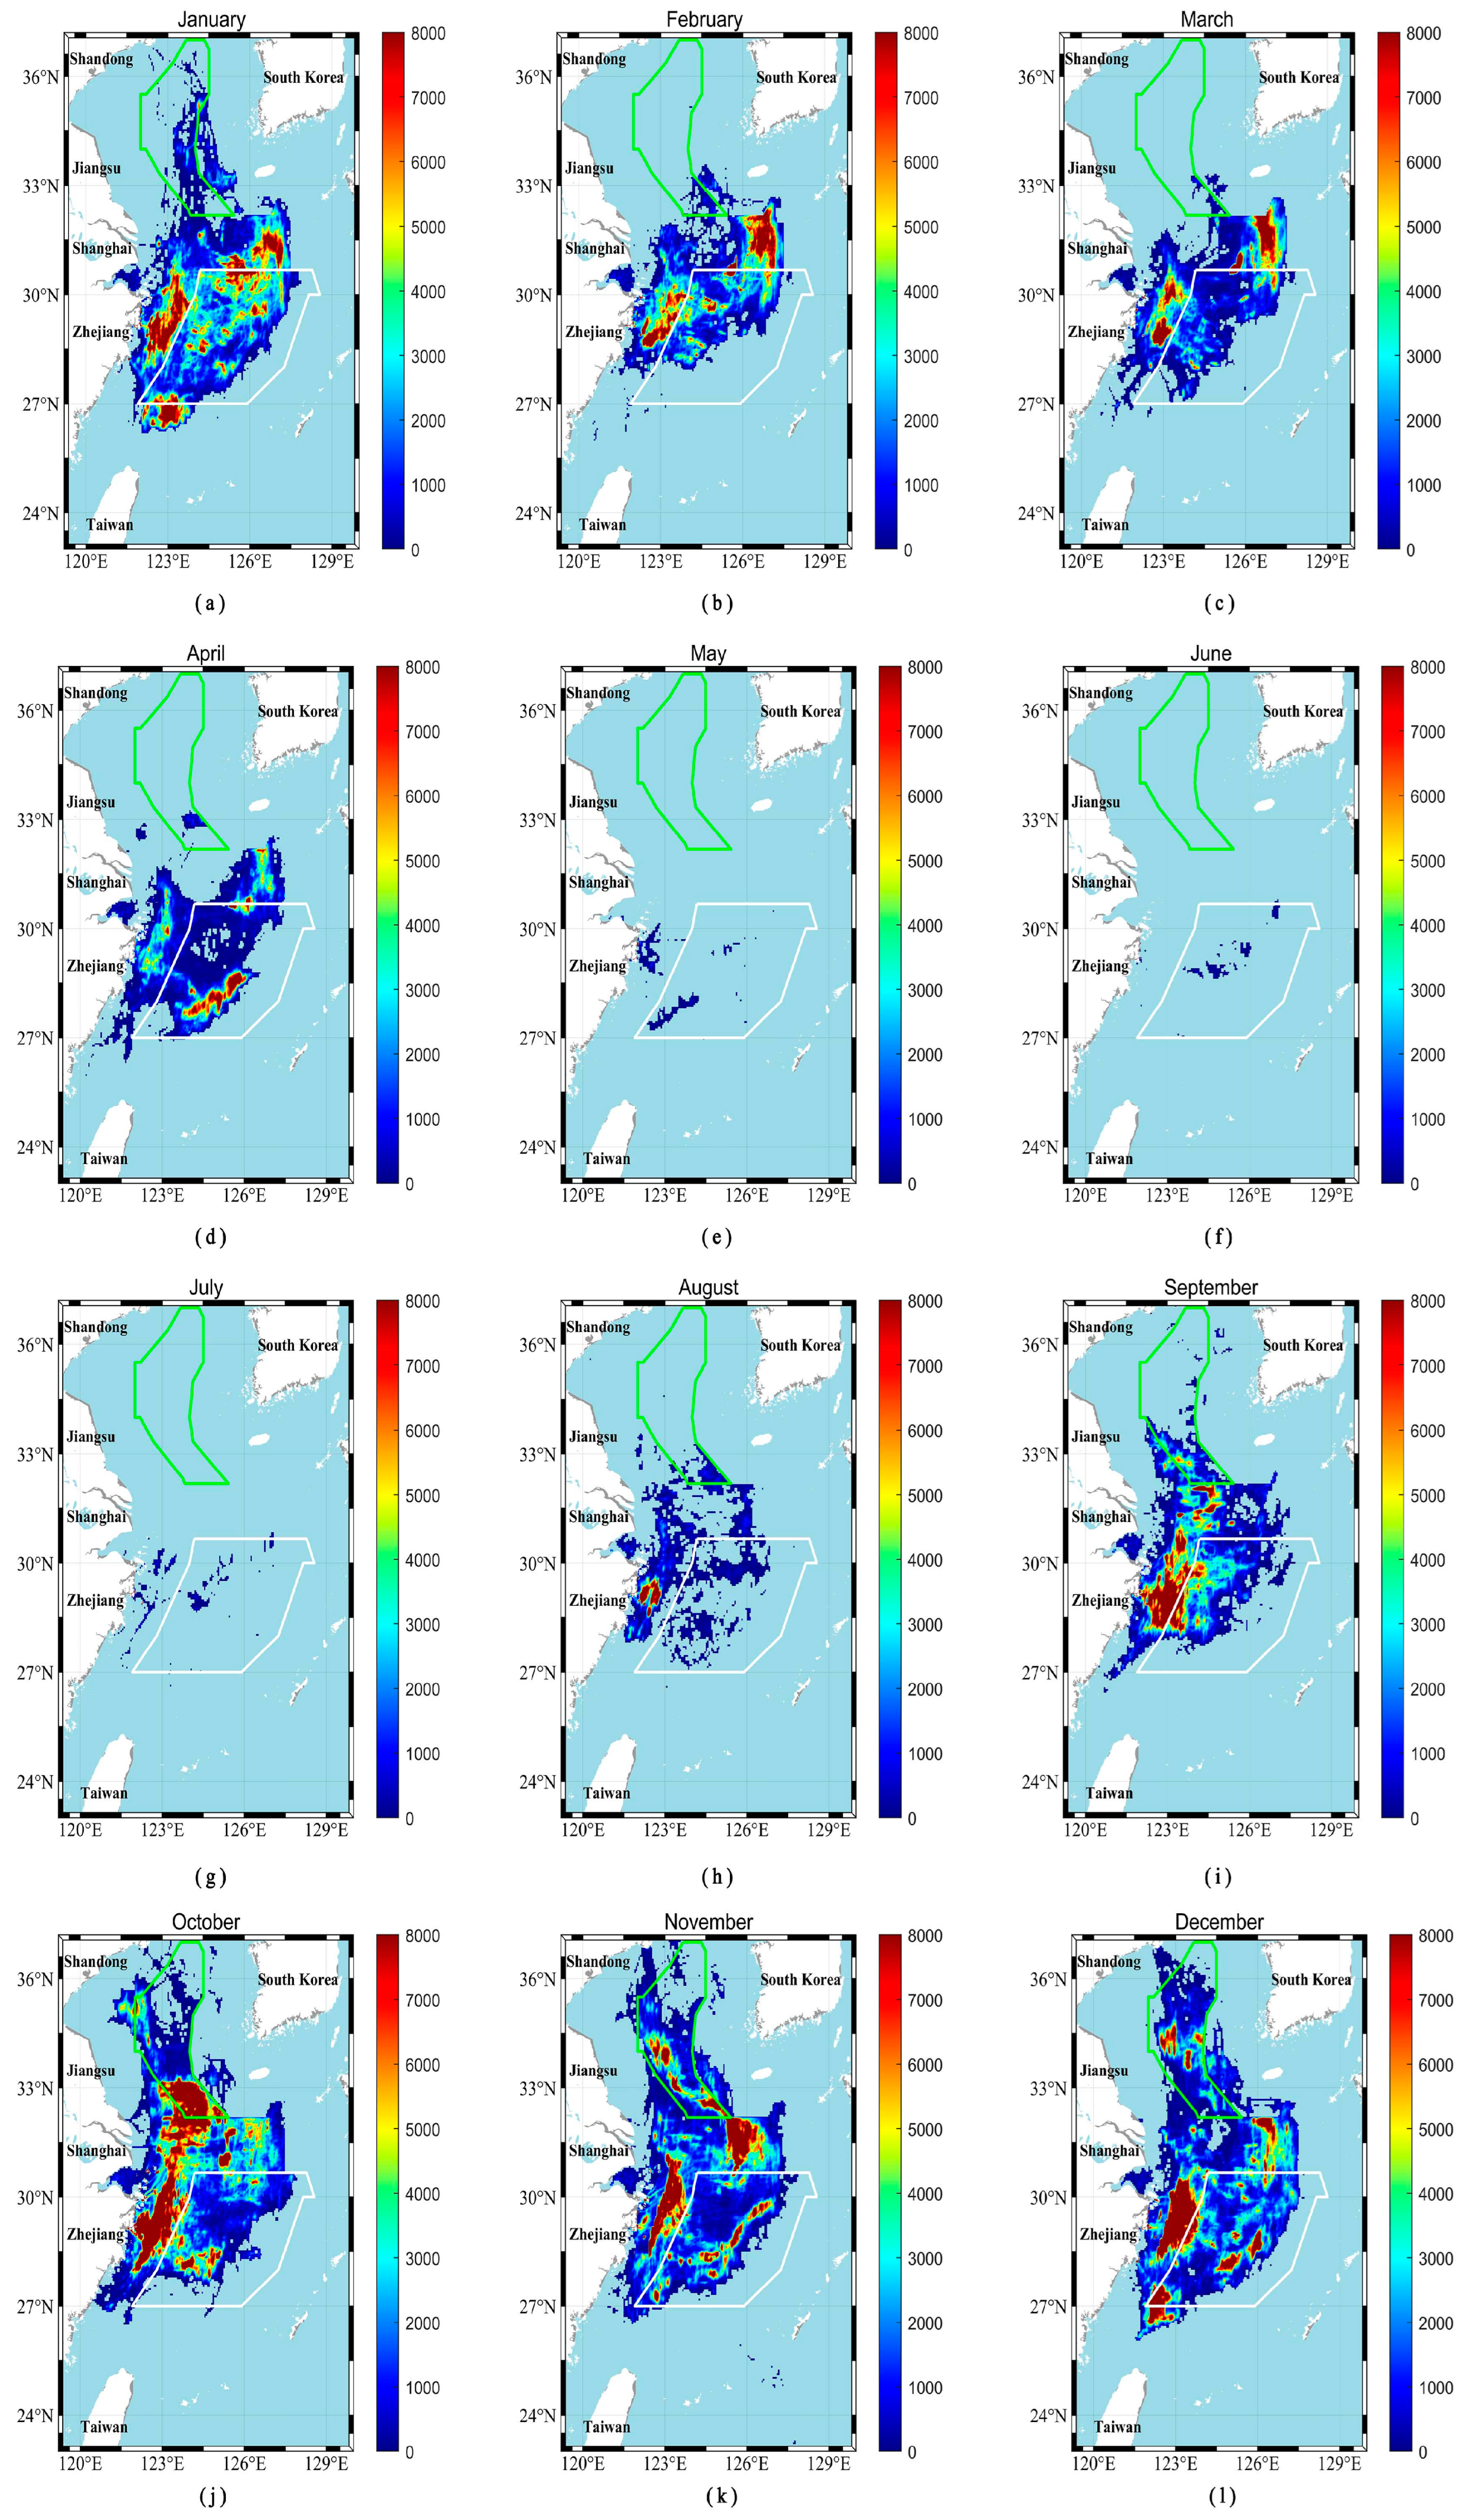
To better study the fishing hotspot areas in the East China Sea and the Yellow Sea, we tiled the number of vessel locations counted at each grid point in the algorithm. For grid division, we divide 0.05 longitude and latitude into one grid, i.e., each grid contains about 30 km2 of actual area. Based on the above, we counted the number of hotspot grids that covered more than 8000 times the number of vessel locations in a single grid, and the maximum and average values of the number of vessel locations in a single grid have been analyzed for the magnitude of the fishing activities and the range of concentration of fishing areas in each month. Under the combined influence of the annual summer fishing ban, climate, holidays, and other factors, the high-intensity fishing activities in the East China Sea and the Yellow Sea were mainly concentrated in September–December after the annual summer fishing ban (Table 5), and the hotspot grids in October, November, and December after the annual summer fishing ban showed an obvious jump. Among them, the maximum number of hotspot grids was 1517 in October, and a hotspot extreme value of 856,020 occurred in August.
Based on the above study, we drew a map of the monthly fishing hotspots in the East China Sea and the Yellow Sea (Figure 8). The fishing hotspots in January were concentrated in the fisheries of Yushan, Zhouwai, Jiangwai, and Min Dong, and the overall hotspots were wider in scope and mainly concentrated in the East China Sea.
In February, the fishing activities were not as good as in January, and the fishing hotspots were concentrated in the fisheries of Yushan, Jiangwai, and Zhouwai. In March, the fishing activities were not much different from those in February, and the hotspots were more focused on the fisheries of Yushan, Jiangwai, and Zhouwai. In April, the hotspots were significantly smaller, and the fishing areas of Wintai and Wintai became hotspots. In March, the fishing activities were not much different from those in February, with the hotspots focusing on the Yushan, Jiangwai, and Zhouwai fishing grounds; in April, the hotspots decreased significantly, with the Yushan and Zhouwai fishing grounds gradually ceasing to be hotspots and the Wentai and Wengwai fishing grounds becoming hotspots.
There were almost no fishing activities and no hotspots in May and June/July because of the annual summer fishing ban; the fishing ban was lifted for some fishing vessels in August, and a small portion of Yushan fishing grounds became hotspots. In mid-September, all fishing boats lifted the fishing ban; consequently, the hotspot areas expanded greatly compared to August, with the Yushan and Zhoushan fishing grounds becoming the hotspot areas for the month. The range of fishing activities in October, November, and December was similar overall, with the October hotspot area being the largest, spanning many coastal fishing grounds, such as Wentai, Yushan, Zhoushan, the mouth of the Yangtze River, and Lvsi. The hotspot areas in November and December were vertically separated from those in October and included the fishing hotspots in Yushan, Zhoushan, the mouth of the Yangtze River, and the fishing grounds outside Zhoushan.

5.1.2. Quarterly Changes in Fishing Hotspots in the East China Sea and the Yellow Sea

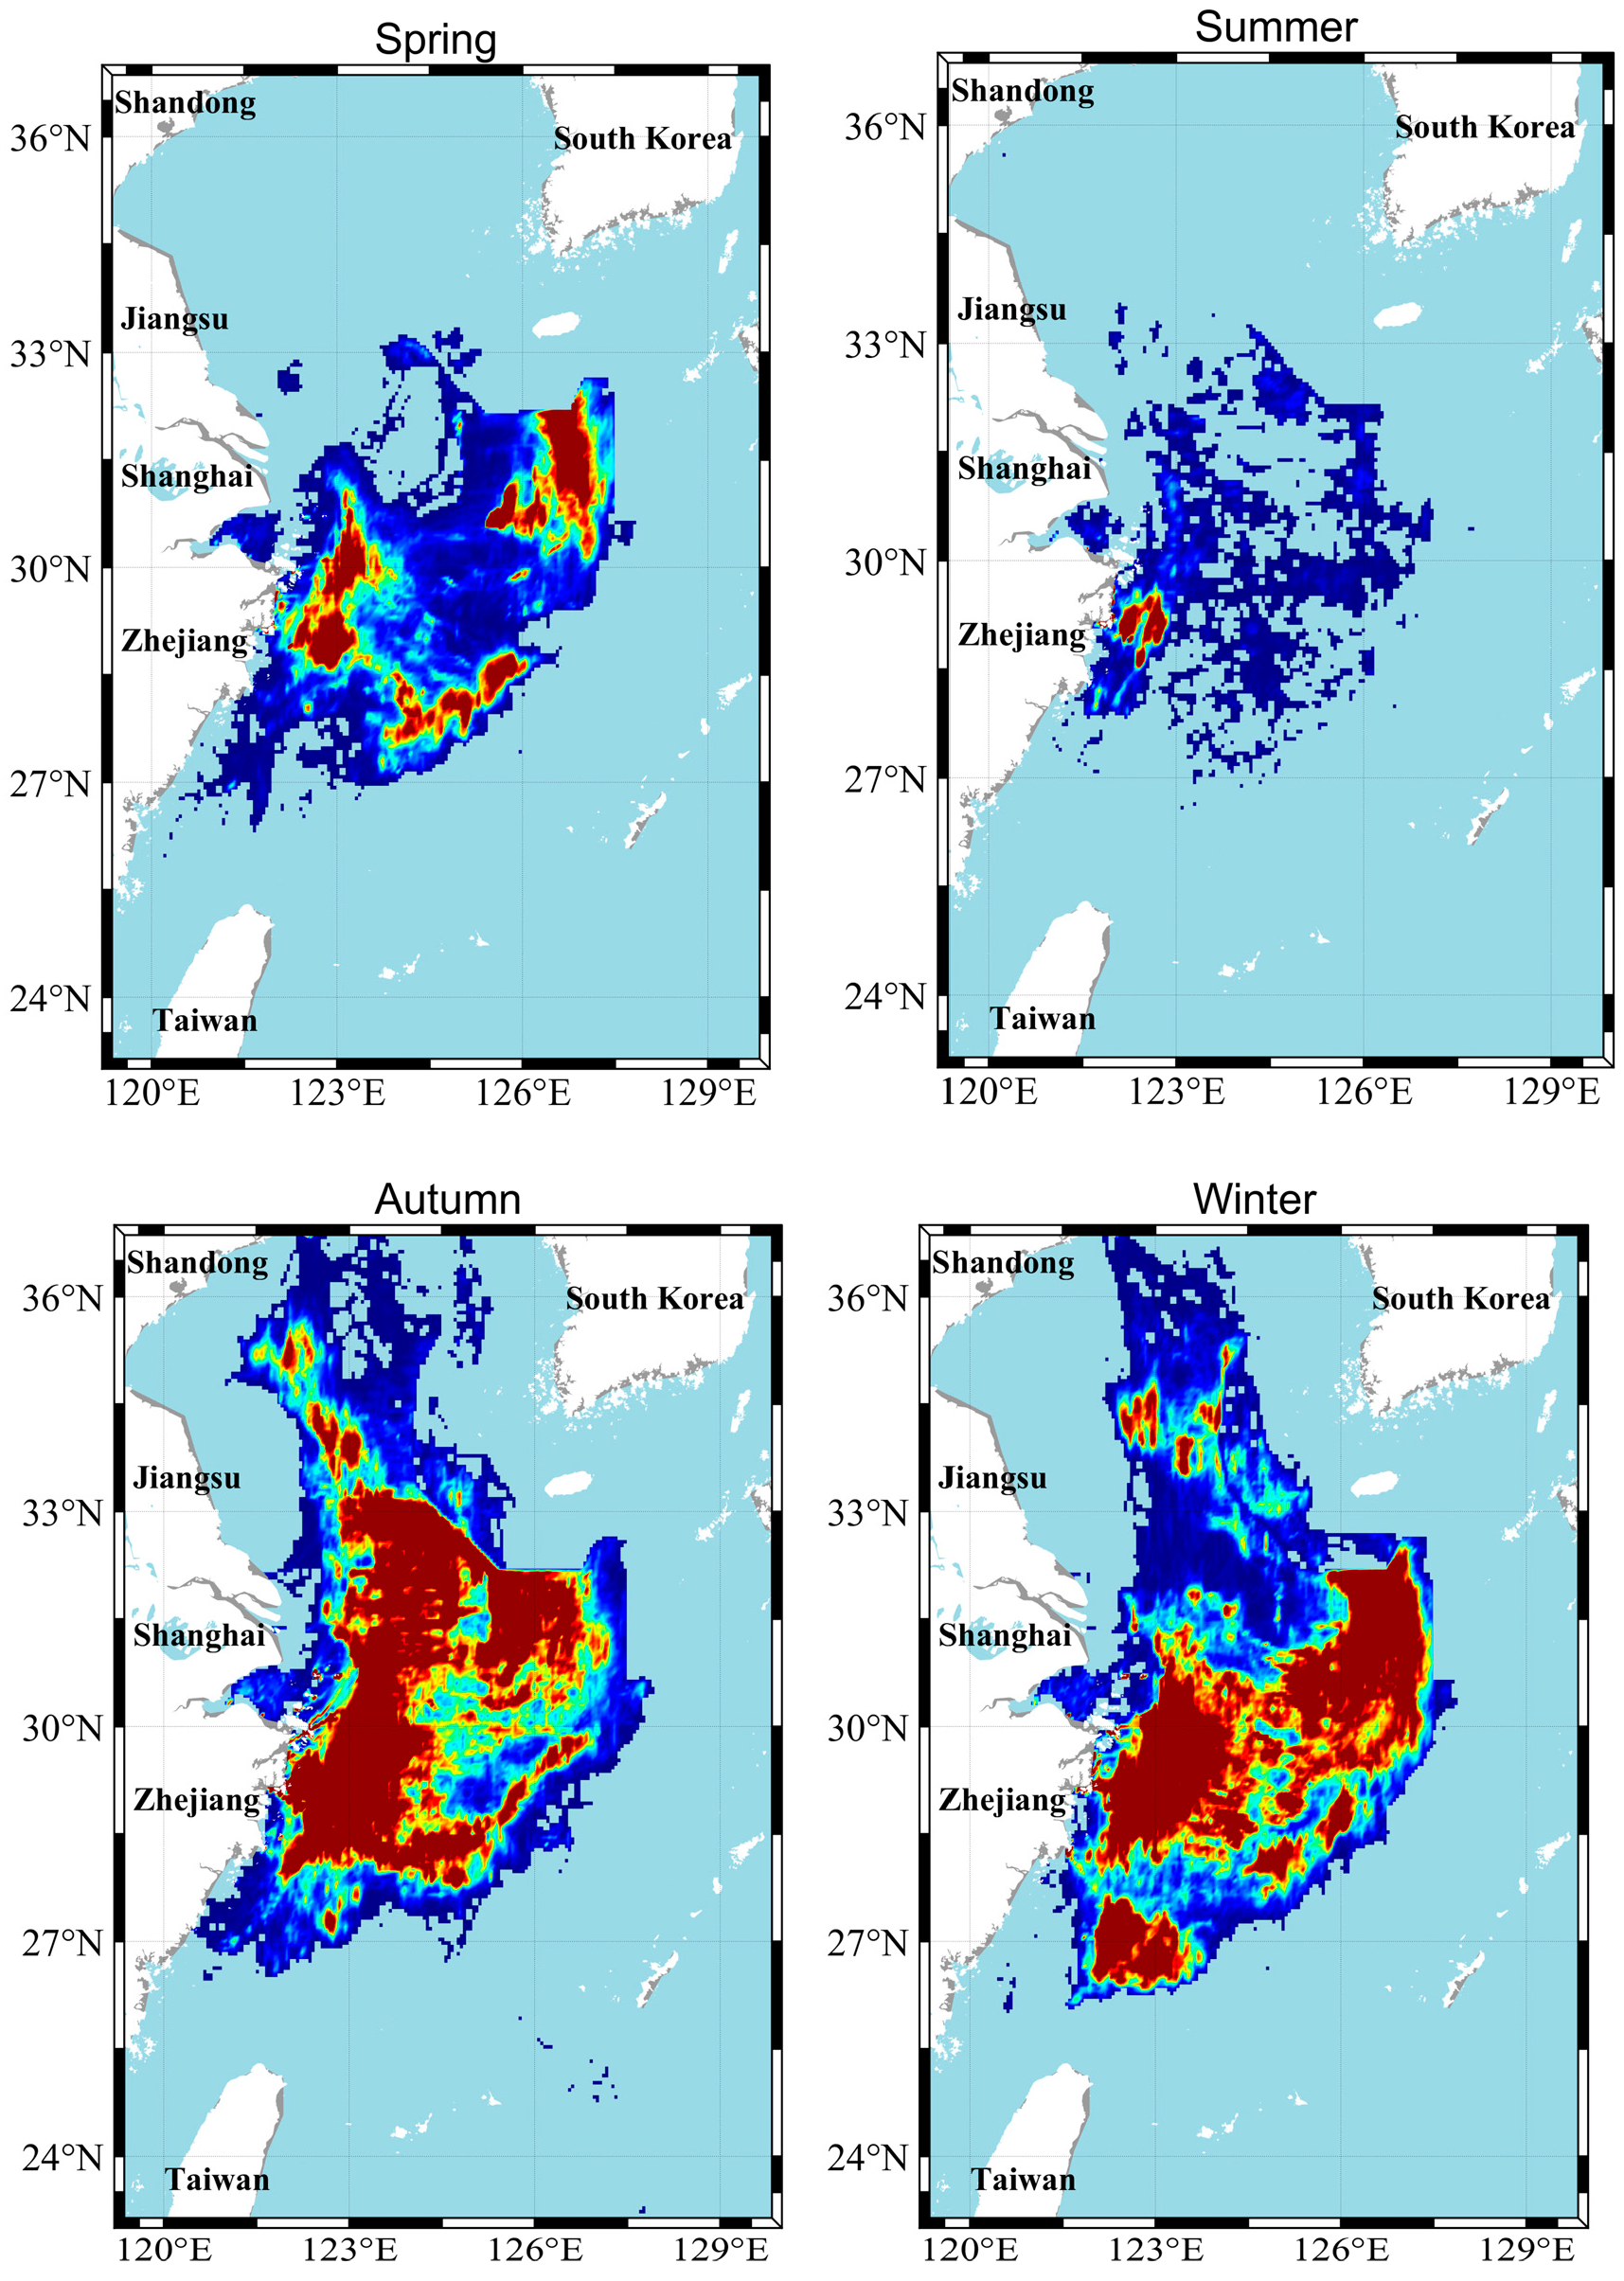
The two seasons of autumn (September–November) and winter (December–February) in 2021 are the peak seasons for fishing activities; the fishing activities in the spring (March–May) of 2022 are not strong, and in the summer (June–August) of 2021, the fishing activities are almost suspended due to the effect of the annual summer fishing ban, and only a few hotspots are found in Zhoushan fishery and Yushan along the coast. The hotspots in the fishing areas in the autumn of 2021 are very scattered, covering most of the fishing grounds along the East China Sea. From autumn to winter, the hotspots north of Zhoushan fishing ground no longer existed, and Zhoushan and Yushan along the East China Sea, as well as the fishing grounds off Wintai and Wintai, became concentrated hotspot fishing areas. From the winter of 2021 to the spring of 2022, there existed only the coastal waters of Zhoushan and Yushan fisheries with hotspots, as well as the distant waters off Wentai, Wenwai, and Zhoushan, which is something we need to study (Figure 9).

5.2. Discussion

5.2.1. Evaluation of the Effectiveness of the Annual Summer Fishing Ban

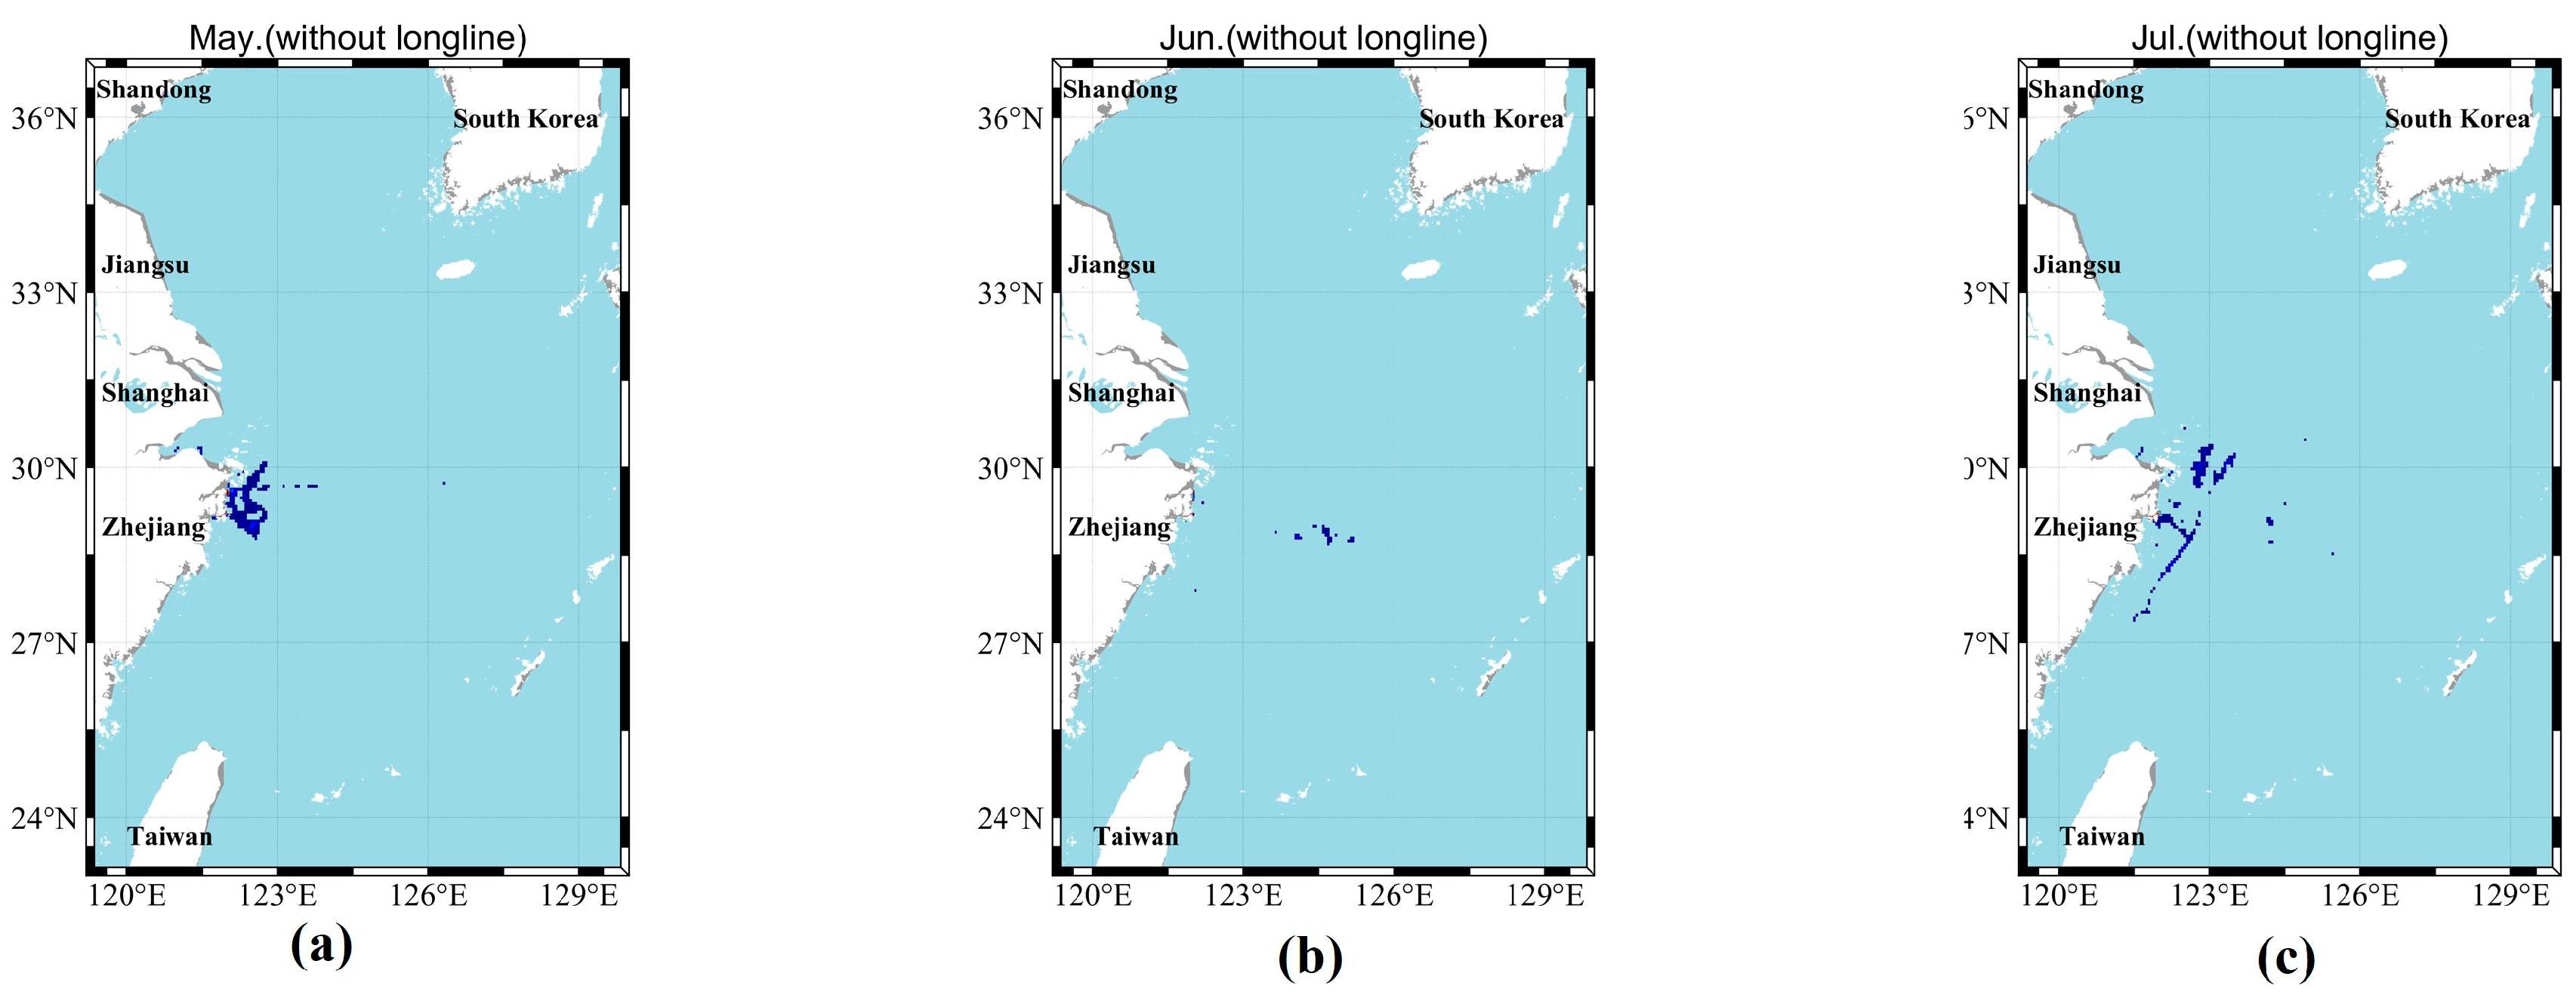
The annual summer fishing ban has a good short-term effect on relieving fishing pressure [74]. To achieve a sustainable development strategy for marine organisms, according to Circular No. 1 of 2021 of the Ministry of Agriculture and Rural Affairs of China (MAARC) on the annual summer fishing ban, the closed season for trawlers, purse seiners, and gillnets other than gear vessels in the Yellow Sea and the East China Sea between 35° N and 26°30’ N is from May 1st to August 1st, and the closed season is delayed until September 16th for open-net fishing vessels. We mapped the fishing hotspots of fishing vessels, except for fishing, gear during the closed season to observe whether there are illegal fishing behaviors during the closed season, as shown in Figure 10.
According to Figure 10, there are no hotspots in the sea as a whole from May to July during the closed season, and the activities of the fishing vessels are also mainly offshore in Zhoushan and Yushan fishing grounds, but there are still intensive activities of the fishing vessels in the offshore sea area of Zhejiang during the months of May and July, which might be the anchoring fishing vessels in the fishing port. There may also be fishing vessels during the closed season that fish in the offshore waters of Zhejiang, which is unlawful behavior. We also need to pay attention to overfishing in the catch period after the closed season, which may attenuate the fishing pressure relief brought about by the annual summer fishing ban.

5.2.2. Managerial Implications

The fishing vessels active in the East China Sea and Yellow Sea are mainly tug fishing vessels and drift net fishing vessels, among which the ratio of trawl, drift net, net, purse seine, and longline fishing vessels is about 91:37:1:2:2. The fishing activities of trawl fishing boats and drift net fishing boats are the main force of fishing in the East Yellow Sea. In the supervision of fishing boats by fishery authorities, the focus should be on these two types of fishing boats.
Based on the hotspot map from June 2021 to May 2022, under the comprehensive influence of summer fishing bans, climate, holidays, and other factors, high-intensity fishing activities in the East Yellow Sea are mainly concentrated from September to December after the fishing ban period, and the hotspot grid shows significant transitions in October, November, and December after the fishing ban period. The maximum number of hotspot grids in October is 1517, and the hotspot coverage area can reach 45,510 km2, which means that October is the busiest month for nearshore fishing activities. Attention should be paid to collisions between merchant ships and other large vessels and fishing boats.
Regarding the effectiveness of the summer fishing ban system, there are no hotspots on the sea, which proves that the overall fishing ban system is effective. However, there are intensive fishing activities in the Zhoushan and Yushan fishing grounds near the sea. We suspect that non-fishing vessels may still be fishing in these two fishing grounds during the summer fishing ban period.
Spring is the least busy season, except for the fishing ban period, mainly due to severe weather conditions, such as strong winds, waves, sea ice, and fog concentrated in spring, resulting in sluggish fishing activities in spring. Especially, in April, severe weather occupied 22 days, making the fishing hotspots during the non-fishing ban period in April the least, with only 160 grids.
In terms of the effectiveness evaluation of the fishing ban areas for mobile trawling vessels, the hotspots of trawling vessel fishing in January, August, September, October, November, and December all appeared in the fishing ban areas of mobile trawling vessels, concentrated in the Zhoushan and Yangtze River estuary fishing grounds. Fishery regulatory authorities should increase their efforts to supervise the trawling behavior of trawling vessels in the Zhoushan and Yangtze River estuary fishing grounds within the fishing ban areas of mobile trawling vessels.
The quota fishing system implemented by China can directly affect the fishing hotspots of the month and has a positive effect on the increase in fishery populations and the reasonable maintenance of regularly designated fishing resources.
From June 2021 to May 2022, fishing vessels from Zhejiang Province engaged in fishing activities in the waters under temporary measures between China and Japan, as well as between China and South Korea, without violating the relevant provisions of the China–Japan Fisheries Agreement and the China–South Korea Fisheries Agreement. This has established a good image of a major country in maintaining friendly relations and a harmonious marine ecosystem among countries.

6. Conclusions

This study investigated BeiDou vessel monitoring system (VMS) data from five distinct fishing vessel classes operating in the East China Sea and Yellow Sea, integrating a deep learning framework to systematically analyze spatiotemporal patterns in fishing behavior classification and activity hotspots while assessing the efficacy of seasonal fishing moratoriums. The key findings are structured as follows.
This study introduces an optimized preprocessing protocol addressing multidimensionality and noise inherent in raw VMS datasets. Through velocity normalization and spatiotemporal gap-filling techniques, a comprehensive trajectory database was established encompassing 2805 vessels. Post-processing analysis revealed that individual vessels transmitted 1273 positional records daily on average, confirming exceptional data continuity that ensures reliability for computational modeling.
A comparative evaluation of six neural architectures identified the CNN-BiLSTM hybrid model as superior for operational state detection, achieving an 89.98% classification accuracy and an 87.72% F1 score. Architectural optimization demonstrated that a four-convolutional-layer CNN with dual max pooling operations optimally balanced feature abstraction against overfitting risks, while a three-layer bi-directional long short-term memory (BiLSTM) network with strategic dropout regularization effectively captured temporal dependencies in movement patterns. The integrated framework’s synergistic spatial–temporal feature extraction enhanced classification robustness by 2.47–4.19% compared to standalone models.
The spatiotemporal analysis of fishing hotspots reveals that policies have a significant inhibitory effect on fishing intensity. After the lifting of the fishing ban, the hotspot areas showed explosive growth, reaching a peak in October, mainly concentrated in Yushan, Zhoushan, and the Yangtze River estuary fishing grounds. On a quarterly scale, the autumn to winter period of 2021 is the peak season for fishing activities, with hotspots covering over 80% of the fishing grounds along the East China Sea coast, while in summer, they are only sporadically distributed in coastal areas. It is worth noting that during the fishing ban period, there is still intensive fishing activity in the waters near Zhejiang, and caution should be taken against the risk of illegal fishing.
The methodology offers two critical management applications. (1) The CNN-BiLSTM architecture enables near-real-time detection of fishing states, enhancing surveillance during regulatory periods. (2) Hotspot distribution patterns inform adaptive spatial management through dynamic closure adjustments and conservation zone design. Limitations include single-year validation and untested cross-regional generalizability. Subsequent research priorities involve multi-annual dataset incorporation, cross-basin model validation, multi-source data fusion (AIS, satellite oceanography), and edge computing implementations for onboard monitoring systems.
This study also has the following shortcomings. Firstly, the database selected in this study only includes fishing vessels from Zhejiang Province, which does not cover all active fishing vessels in the East China Sea and the Yellow Sea well. Secondly, due to the large amount of data, this article only draws fishing hotspots based on the classification of ship position points. If trajectories are extracted and classified based on the different states of the trajectories in a small amount of data, the accuracy will be higher. Thirdly, due to the limited research on hot topics in the East China Sea and Yellow Sea, as well as the study of BeiDou data from fishing vessels, some of the main conclusions of this article are difficult to provide more literature support.
In the future, research will focus more on improving the BeiDou database of fishing vessels in the East China Sea and Yellow Sea, as well as refining fishing vessel trajectories. Research should utilize better deep learning methods to provide more accurate means for identifying the behavior of fishing vessels, take a longer-term step towards curbing illegal fishing activities, improve fishery regulatory measures, and build a harmonious marine ecosystem. The interpretability of convolutional neural networks has been criticized as an unexplainable “black box” due to the complex nonlinear model structure and high-dimensional data distribution of CNNs. We did not address the issue in our preliminary work. In later cooperation with the fisheries management department, we will focus on analyzing this scientific issue.

Author Contributions

Formal analysis, X.L.; Investigation, F.W.; Data curation, T.C.; Writing—original draft, F.W.; Writing—review & editing, Q.L.; Supervision, H.F.; Project administration, H.F.; Funding acquisition, H.F. All authors have read and agreed to the published version of the manuscript.

Funding

This research was partially funded by the “Research Base on Digital Economy Innovation and Linkage with Hub Free Trade Zones”, a key research base of philosophy and Social Sciences in Ningbo and National “111” Centre on Safety and Intelligent Operation of Sea Bridges [grant number D21013].

Data Availability Statement

The raw data supporting the conclusions of this article will be made available by the authors upon request.

Conflicts of Interest

The authors declare no conflict of interest.

References

  1. Hung, C.-Y.; Huynh, H.H.; Wu, X.-H.; Tsai, W.-P. Multimodel approach to a support stock assessment of standardized catch and effort data: A case study of blue shark (Prionace glauca) in the Indian Ocean by the Taiwanese large-scale longline fishery. J. Mar. Sci. Technol. 2024, 32, 104–115. [Google Scholar] [CrossRef]
  2. FAO. State of the World’s Fisheries and Aquaculture 2022; Food and Agriculture Organization of the United Nations: Rome, Italy, 2022. [Google Scholar]
  3. FAO. International Plan of Action to Prevent, Deter and Eliminate Illegal, Unreported and Unregulated Fishing; FAO: Rome, Italy, 2001. [Google Scholar]
  4. Kuemlangan, B.; Amidjogbe, E.-R.; Nakamura, J.; Tomassi, A.; Hupperts, R.; Bojang, B.; Amador, T. Enforcement approaches against illegal fishing in national fisheries legislation. Mar. Policy 2023, 149, 105514. [Google Scholar] [CrossRef]
  5. FAO. Agreement on Port State Measures to Prevent, Deter and Eliminate Illegal, Unreported and Unregulated Fishing; FAO: Rome, Italy, 2009. [Google Scholar]
  6. Serdy, A. The Shaky Foundations of the FAO Port State Measures Agreement: How Watertight Is the Legal Seal against Access for Foreign Fishing Vessels? Int. J. Mar. Coast. Law 2016, 31, 422–441. [Google Scholar] [CrossRef]
  7. FAO. Voluntary Guidelines for Flag State Performance; FAO: Rome, Italy, 2014. [Google Scholar]
  8. Erikstein, K.; Swan, J. Voluntary Guidelines for Flag State Performance: A New Tool to Conquer IUU Fishing. Int. J. Mar. Coast. Law 2014, 29, 116–147. [Google Scholar] [CrossRef]
  9. FAO. Report of the Fourth Meeting of the Parties to the Agreement on Port State Measures to Prevent, Deter and Eliminate Illegal, Unreported and Unregulated Fishing; FAO: Rome, Italy, 2023. [Google Scholar]
  10. Temple, A.J.; Skerritt, D.J.; Howarth, P.E.C.; Pearce, J.; Mangi, S.C. Illegal, unregulated and unreported fishing impacts: A systematic review of evidence and proposed future agenda. Mar. Policy 2022, 139, 105033. [Google Scholar] [CrossRef]
  11. Li, R.; Zheng, S.; Wang, E.; Chen, J.; Feng, S.; Wang, D.; Dai, L. Advances in BeiDou Navigation Satellite System (BDS) and satellite navigation augmentation technologies. Satell. Navig. 2020, 1, 12. [Google Scholar] [CrossRef]
  12. Zhang, K.; Lin, Q.; Lian, F.; Feng, H. Estimating emissions from fishing vessels: A big Beidou data analytical approach. Front. Mar. Sci. 2024, 11, 1418366. [Google Scholar] [CrossRef]
  13. Zhao, Z.; Hong, F.; Huang, H.; Liu, C.; Feng, Y.; Guo, Z. Short-term prediction of fishing effort distributions by discovering fishing chronology among trawlers based on VMS dataset. Expert Syst. Appl. 2021, 184, 115512. [Google Scholar] [CrossRef]
  14. Zhang, C.; Chen, Y.; Xu, B.; Xue, Y.; Ren, Y. The dynamics of the fishing fleet in China Seas: A glimpse through AIS monitoring. Sci. Total Environ. 2022, 819, 153150. [Google Scholar] [CrossRef]
  15. Dupont, C.; Gourmelon, F.; Meur-Ferec, C.; Herpers, F.; Le Visage, C. Exploring uses of maritime surveillance data for marine spatial planning: A review of scientific literature. Mar. Policy 2020, 117, 103930. [Google Scholar] [CrossRef]
  16. Sala-Coromina, J.; García, J.A.; Martín, P.; Fernandez-Arcaya, U.; Recasens, L. European hake (Merluccius merluccius, Linnaeus 1758) spillover analysis using VMS and landings data in a no-take zone in the northern Catalan coast (NW Mediterranean). Fish. Res. 2021, 237, 105870. [Google Scholar] [CrossRef]
  17. Fernandez-Arcaya, U.; Rodríguez-Basalo, A.; Verísimo, P.; Rodriguez, J.; Ceballos, E.; Gonzalez-Irusta, J.M.; García-Alegre, A.; Plaza-Morlote, M.; Serrano, A.; Punzón, A. Bottom fishing beyond trawling. Spatio-temporal trends of mobile and static bottom fisheries on benthic habitats. Mar. Policy 2024, 159, 105805. [Google Scholar] [CrossRef]
  18. He, B.; Yan, F.; Su, F.; Lyne, V.; Tang, J. Prediction of fishing intensity and trends across South China Sea biogeographic zones. Sci. Total Environ. 2023, 899, 165691. [Google Scholar] [CrossRef]
  19. Mills, C.M.; Townsend, S.E.; Jennings, S.; Eastwood, P.D.; Houghton, C.A. Estimating high resolution trawl fishing effort from satellite-based vessel monitoring system data. ICES J. Mar. Sci. 2007, 64, 248–255. [Google Scholar] [CrossRef]
  20. Hinz, H.; Murray, L.G.; Lambert, G.I.; Hiddink, J.G.; Kaiser, M.J. Confidentiality over fishing effort data threatens science and management progress. Fish Fish. 2013, 14, 110–117. [Google Scholar] [CrossRef]
  21. Hinz, H.; Prieto, V.; Kaiser, M.J. Trawl disturbance on benthic communities: Chronic effects and experimental predictions. Ecol. Appl. 2009, 19, 761–773. [Google Scholar] [CrossRef]
  22. Colletti, A.; Savinelli, B.; Di Muzio, G.; Rizzo, L.; Tamburello, L.; Fraschetti, S.; Musco, L.; Danovaro, R. The date mussel Lithophaga lithophaga: Biology, ecology and the multiple impacts of its illegal fishery. Sci. Total Environ. 2020, 744, 140866. [Google Scholar] [CrossRef]
  23. Zhang, S.; Jin, S.; Zhang, H.; Fan, W.; Tang, F.; Yang, S. Distribution of bottom trawling effort in the Yellow Sea and East China Sea. PLoS ONE 2016, 11, e0166640. [Google Scholar] [CrossRef]
  24. Pei, K.; Zhang, J.; Zhang, S.; Sui, Y.; Zhang, H.; Tang, F.; Yang, S. Spatial distribution of fishing intensity of canvas stow net fishing vessels in the East China Sea and the Yellow Sea. Indian J. Fish 2023, 70, 1–9. [Google Scholar] [CrossRef]
  25. Fock, H.O. Fisheries in the context of marine spatial planning: Defining principal areas for fisheries in the German EEZ. Mar. Policy 2008, 32, 728–739. [Google Scholar] [CrossRef]
  26. Rijnsdorp, A.D.; Dol, W.; Hoyer, M.; Pastoors, M.A. Effects of fishing power and competitive interactions among vessels on the effort allocation on the trip level of the Dutch beam trawl fleet. ICES J. Mar. Sci. 2000, 57, 927–937. [Google Scholar] [CrossRef]
  27. Yoo, S.-L.; Jung, C.-Y. Geohash-based Arrangement of Live-Fire Exercise Areas Using AIS. J. Mar. Sci. Technol. 2023, 31, 420–427. [Google Scholar] [CrossRef]
  28. Chen, S.T.; Yang, M.F.; Kao, S.L.; Tu, M.; Kuo, J.-Y.; Chao, Y.-T.; Hsu, H.-K. Research on the collision risk of ships off Keelung based on AIS data. J. Mar. Sci. Technol. 2023, 31, 553–565. [Google Scholar] [CrossRef]
  29. Bertrand, S.; Burgos, J.M.; Gerlotto, F.; Atiquipa, J. Lévy trajectories of Peruvian purse-seiners as an indicator of the spatial distribution of anchovy (Engraulis ringens). ICES J. Mar. Sci. 2005, 62, 477–482. [Google Scholar] [CrossRef]
  30. Walter, J.F., III; Hoenig, J.M.; Gedamke, T. Correcting for effective area fished in fishery-dependent depletion estimates of abundance and capture efficiency. ICES J. Mar. Sci. 2007, 64, 1760–1771. [Google Scholar] [CrossRef]
  31. Lee, J.; South, A.B.; Jennings, S. Developing reliable, repeatable, and accessible methods to provide high-resolution estimates of fishing-effort distributions from vessel monitoring system (VMS) data. ICES J. Mar. Sci. 2010, 67, 1260–1271. [Google Scholar] [CrossRef]
  32. Vespe, M.; Gibin, M.; Alessandrini, A.; Natale, F.; Mazzarella, F.; Osio, G.C. Mapping EU fishing activities using ship tracking data. J. Maps 2016, 12, 520–525. [Google Scholar] [CrossRef]
  33. Chen, R.; Wu, X.; Liu, B.; Wang, Y.; Gao, Z. Mapping coastal fishing grounds and assessing the effectiveness of fishery regulation measures with AIS data: A case study of the sea area around the Bohai Strait, China. Ocean Coast. Manag. 2022, 223, 106136. [Google Scholar] [CrossRef]
  34. Silva, L.; Gil, J.; Sobrino, I. Definition of fleet components in the Spanish artisanal fishery of the Gulf of Cádiz (SW Spain ICES division IXa). Fish. Res. 2002, 59, 117–128. [Google Scholar] [CrossRef]
  35. Lucey, S.M.; Fogarty, M.J. Operational fisheries in New England: Linking current fishing patterns to proposed ecological production units. Fish. Res. 2013, 141, 3–12. [Google Scholar] [CrossRef]
  36. Nesdoly, A.; Bone, C.; Fraser, M.; Serra-Sogas, N.; Canessa, R. Evaluating models for classifying movement of whale-watching vessels. Ecol. Inform. 2023, 73, 101903. [Google Scholar] [CrossRef]
  37. Wei, Z.; Xie, X.; Lv, W. Self-adaption vessel traffic behaviour recognition algorithm based on multi-attribute trajectory characteristics. Ocean Eng. 2020, 198, 106995. [Google Scholar] [CrossRef]
  38. Bai, X.; Xie, Z.; Xu, X.; Xiao, Y. An adaptive threshold fast DBSCAN algorithm with preserved trajectory feature points for vessel trajectory clustering. Ocean Eng. 2023, 280, 114930. [Google Scholar] [CrossRef]
  39. Ahmed, M.; Seraj, R.; Islam, S. The k-means Algorithm: A Comprehensive Survey and Performance Evaluation. Electronics 2020, 9, 1295. [Google Scholar] [CrossRef]
  40. Sun, Y.; Lian, F.; Yang, Z. Analysis of the activities of high sea fishing vessels from China, Japan, and Korea via AIS data mining. Ocean Coast. Manag. 2023, 242, 106690. [Google Scholar] [CrossRef]
  41. Gamaza-Márquez, M.A.; Pennino, M.G.; Torres, M.A.; Acosta, J.J.; Erzini, K.; Sobrino, I. Discard practices in the gulf of Cadiz multispecies trawl fishery. Implications for the EU ‘landing obligation’. Mar. Policy 2020, 118, 104008. [Google Scholar] [CrossRef]
  42. Walker, E.; Bez, N. A pioneer validation of a state-space model of vessel trajectories (VMS) with observers’ data. Ecol. Model. 2010, 221, 2008–2017. [Google Scholar] [CrossRef]
  43. Lecun, Y.; Bengio, Y.; Hinton, G. Deep learning. Nature 2015, 521, 436–444. [Google Scholar] [CrossRef]
  44. Schmidhuber, J. Deep learning in neural networks: An overview. Neural Netw. 2015, 61, 85–117. [Google Scholar] [CrossRef]
  45. Saleh, A.; Sheaves, M.; Rahimi Azghadi, M. Computer vision and deep learning for fish classification in underwater habitats: A survey. Fish Fish. 2022, 23, 977–999. [Google Scholar] [CrossRef]
  46. Jiang, D.; Shi, G.; Li, N.; Ma, L.; Li, W.; Shi, J. TRFM-ls: Transformer-based deep learning method for vessel trajectory prediction. J. Mar. Sci. Eng. 2023, 11, 880. [Google Scholar] [CrossRef]
  47. Duan, H.; Ma, F.; Miao, L.; Zhang, C. A semi-supervised deep learning approach for vessel trajectory classification based on AIS data. Ocean Coast. Manag. 2022, 218, 106015. [Google Scholar] [CrossRef]
  48. Chen, X.; Liu, Y.; Achuthan, K.; Zhang, X. A ship movement classification based on Automatic Identification System (AIS) data using Convolutional Neural Network. Ocean Eng. 2020, 218, 108182. [Google Scholar] [CrossRef]
  49. Liang, M.; Liu, R.W.; Li, S.; Xiao, Z.; Liu, X.; Lu, F. An unsupervised learning method with convolutional auto-encoder for vessel trajectory similarity computation. Ocean Eng. 2021, 225, 108803. [Google Scholar] [CrossRef]
  50. Cao, K.; Zhang, T.; Huang, J. Advanced hybrid LSTM-transformer architecture for real-time multi-task prediction in engineering systems. Sci. Rep. 2024, 14, 4890. [Google Scholar] [CrossRef]
  51. Ma, J.; Jia, C.; Yang, X.; Cheng, X.; Li, W.; Zhang, C. A Data-Driven Approach for Collision Risk Early Warning in Vessel Encounter Situations Using Attention-BiLSTM. IEEE Access 2020, 8, 188771–188783. [Google Scholar] [CrossRef]
  52. Bai, X.; Ye, K.; Xu, X. Ship trajectory prediction using CNN-BILSTM with sparse attention mechanisms for enhanced maritime safety. Ships Offshore Struct. 2024, 1–17. [Google Scholar] [CrossRef]
  53. Cheng, X.; Wang, J.; Chen, X.; Zhang, F. Attention-enhanced and integrated deep learning approach for fishing vessel classification based on multiple features. Sci. Rep. 2025, 15, 8642. [Google Scholar] [CrossRef]
  54. Li, Y.; Wang, Z. biSAMNet: A Novel Approach in Maritime Data Completion Using Deep Learning and NLP Techniques. J. Mar. Sci. Eng. 2024, 12, 868. [Google Scholar] [CrossRef]
  55. Joo, R.; Bez, N.; Etienne, M.-P.; Marin, P.; Goascoz, N.; Roux, J.; Mahévas, S. Identifying partners at sea from joint movement metrics of pelagic pair trawlers. ICES J. Mar. Sci. 2021, 78, 1758–1768. [Google Scholar] [CrossRef]
  56. Zhang, W.; Liu, M.; de Mitcheson, Y.S.; Cao, L.; Leadbitter, D.; Newton, R.; Little, D.C.; Li, S.; Yang, Y.; Chen, X.; et al. Fishing for feed in China: Facts, impacts and implications. Fish Fish. 2020, 21, 47–62. [Google Scholar] [CrossRef]
  57. Roberson, L.; Wilcox, C.; Boussarie, G.; Dugan, E.; Garilao, C.; Gonzalez, K.; Green, M.; Kark, S.; Kaschner, K.; Klein, C.J.; et al. Spatially explicit risk assessment of marine megafauna vulnerability to Indian Ocean tuna fisheries. Fish Fish. 2022, 23, 1180–1201. [Google Scholar] [CrossRef]
  58. Liu, W.-H.; Lin, C.-C.; Lee, C.-F.; Tsai, C.-S.; Yang, T.-Y. Toward sustainable development of tuna longline fishery in Taiwan: Value chain analysis. Mar. Policy 2024, 161, 106010. [Google Scholar] [CrossRef]
  59. Dapp, D.R.; Walker, T.I.; Huveneers, C.; Reina, R.D. Respiratory mode and gear type are important determinants of elasmobranch immediate and post-release mortality. Fish Fish. 2016, 17, 507–524. [Google Scholar] [CrossRef]
  60. Elharrouss, O.; Almaadeed, N.; Al-Maadeed, S.; Khelifi, F. Pose-invariant face recognition with multitask cascade networks. Neural Comput. Appl. 2022, 34, 6039–6052. [Google Scholar] [CrossRef]
  61. Zeng, F.; Chen, N.; Yang, D.; Meng, Z. Simplified-Boosting Ensemble Convolutional Network for Text Classification. Neural Process. Lett. 2022, 54, 4971–4986. [Google Scholar] [CrossRef]
  62. Zhong, H.; Li, L.; Ren, J.; Wu, W.; Wang, R. Hyperspectral image classification via parallel multi-input mechanism-based convolutional neural network. Multimed. Tools Appl. 2022, 81, 24601–24626. [Google Scholar] [CrossRef]
  63. Cheng, G.; Han, J.; Zhou, P.; Xu, D. Learning Rotation-Invariant and Fisher Discriminative Convolutional Neural Networks for Object Detection. IEEE Trans. Image Process. 2019, 28, 265–278. [Google Scholar] [CrossRef]
  64. Wang, Z.; Tian, X.; Xie, P.; Xu, J.; Zheng, J.; Pan, Y.; Zhang, T.; Fan, G. A convolutional neural networks method for tropospheric ozone vertical distribution retrieval from Multi-AXis Differential Optical Absorption Spectroscopy measurements. Sci. Total Environ. 2024, 951, 175049. [Google Scholar] [CrossRef]
  65. Alzubaidi, L.; Zhang, J.; Humaidi, A.J.; Al-Dujaili, A.; Duan, Y.; Al-Shamma, O.; Santamaría, J.; Fadhel, M.A.; Al-Amidie, M.; Farhan, L. Review of deep learning: Concepts, CNN architectures, challenges, applications, future directions. J. Big Data 2021, 8, 53. [Google Scholar] [CrossRef]
  66. Mohamed, E.; Yacine, K.G.E.; Rabea, S. Abundance and Distribution of Fish Larvae in the Central Coast of the Algerian Sea. J. Mar. Sci. Technol. 2023, 31, 135–144. [Google Scholar] [CrossRef]
  67. Gallego, F.O.; Corchuelo, R. An encoder–decoder approach to mine conditions for engineering textual data. Eng. Appl. Artif. Intell. 2020, 91, 103568. [Google Scholar] [CrossRef]
  68. Dong, S.; Wang, P.; Abbas, K. A survey on deep learning and its applications. Comput. Sci. Rev. 2021, 40, 100379. [Google Scholar] [CrossRef]
  69. Tanui, I.C.; Kandie, F.; Krauss, M.; Piotrowska, A.; Kiprop, A.; Shahid, N.; Liess, M.; Brack, W. Seasonal hot spots of pollution and risks in Western Kenya: A spatial-temporal analysis of almost 800 organic micropollutants. Sci. Total Environ. 2024, 949, 175036. [Google Scholar] [CrossRef]
  70. Powell, R.A. Animal home ranges and territories and home range estimators. Res. Tech. Anim. Ecol. Controv. Conseq. 2000, 442, 65–110. [Google Scholar]
  71. Le Guyader, D.; Ray, C.; Gourmelon, F.; Brosset, D. Defining high-resolution dredge fishing grounds with Automatic Identification System (AIS) data. Aquat. Living Resour. 2017, 30, 39. [Google Scholar] [CrossRef]
  72. Jiang, H.; Cheng, H.-Q.; Le Quesne, W.J.F.; Xu, H.G.; Wu, J.; Ding, H.; Arreguin-Sanchez, F. Ecosystem model predictions of fishery and conservation trade-offs resulting from marine protected areas in the East China Sea. Environ. Conserv. 2008, 35, 137–146. [Google Scholar] [CrossRef]
  73. Feng, H.; Grifoll, M.; Yang, Z.; Zheng, P. Collision risk assessment for ships’ routeing waters: An information entropy approach with Automatic Identification System (AIS) data. Ocean Coast. Manag. 2022, 224, 106184. [Google Scholar] [CrossRef]
  74. Qu, P.; Pang, M.; Wang, Q.; Li, Z.; Liu, C.; Zhang, Z.; Tang, X. Influence of timing of fishing on trophic levels and diets of typical fish and invertebrate species in the Bohai Strait over a single year based on carbon and nitrogen isotope analysis. Ecol. Indic. 2016, 70, 348–356. [Google Scholar] [CrossRef]
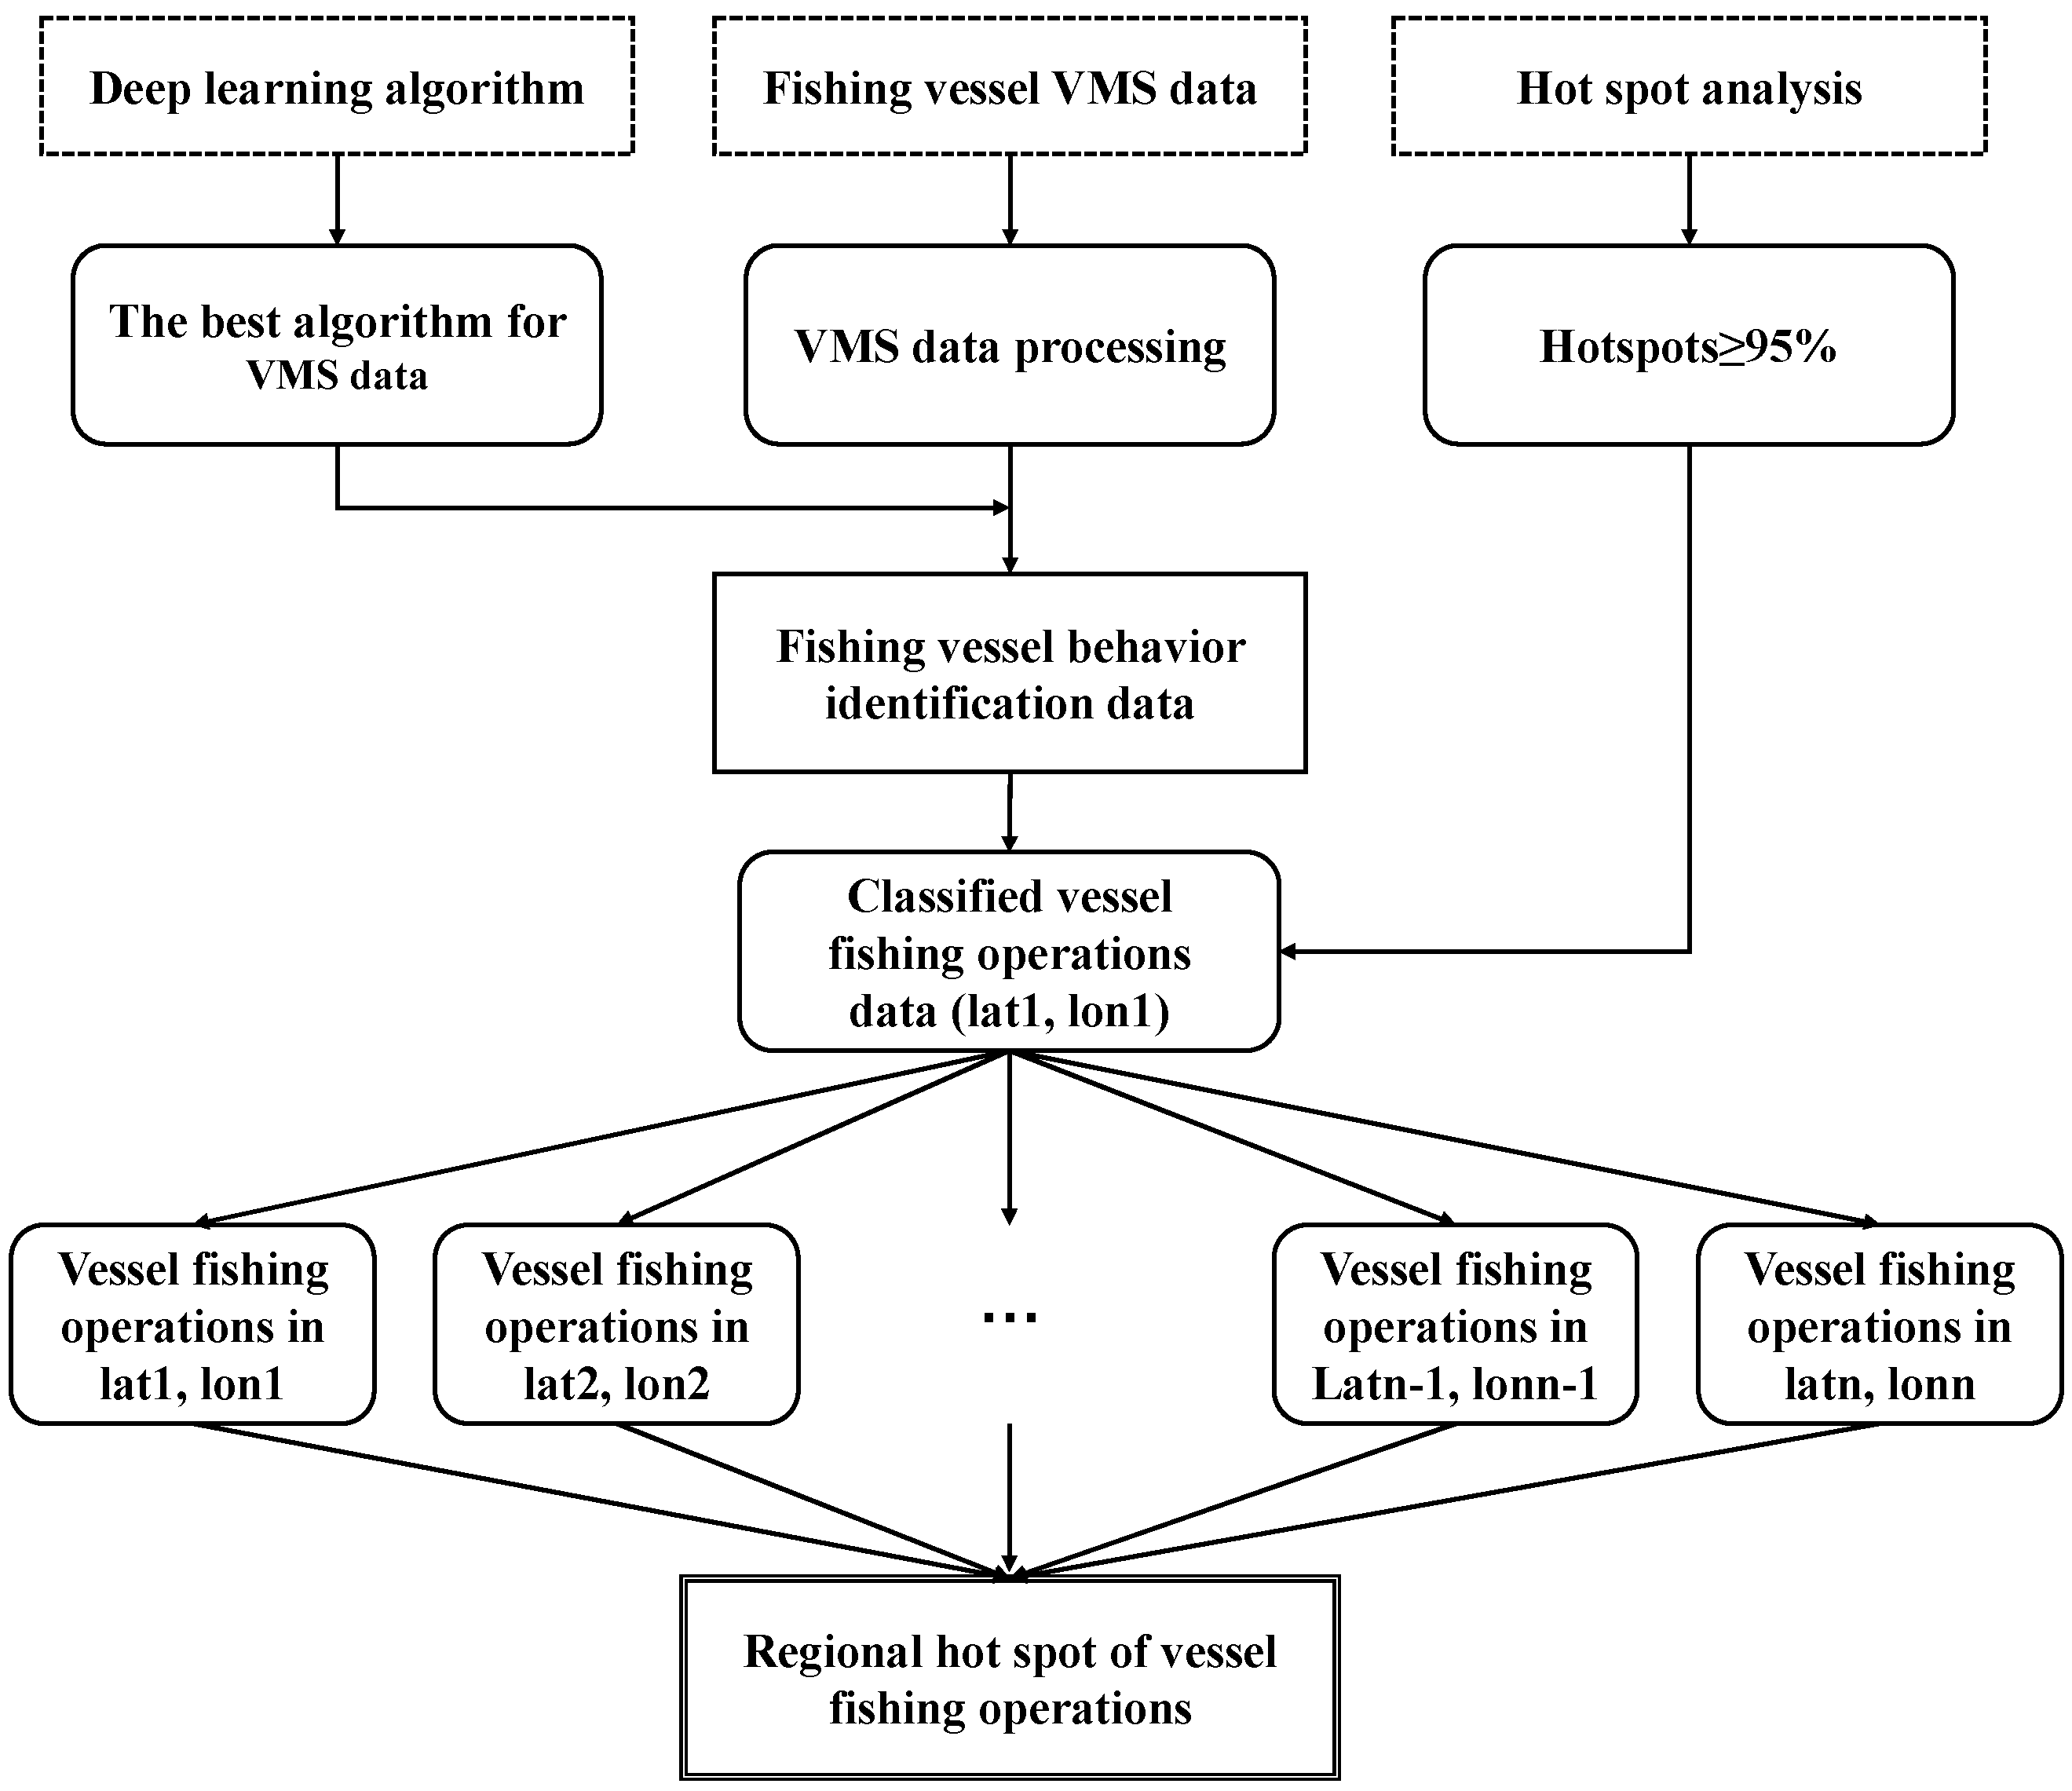
Figure 1. Research framework of fishing hotspots based on BeiDou big data and deep learning.
Jmse 13 00905 g001
Figure 2. Map of the study area. Note: The red dashed box represents the fishing grounds, the white solid box represents the Sino–Japanese PMZ, and the green solid box represents the Sino–Korean PMZ.
Jmse 13 00905 g002
Figure 3. Plot of the CNN training results.
Jmse 13 00905 g003
Figure 4. Plot of the best LSTM training results (left: BiLSTM accuracy; right: BiLSTM loss rate).
Jmse 13 00905 g004
Figure 5. Plot of the CNN-BiLSTM training results.
Jmse 13 00905 g005
Figure 6. (a) Training results of the CNN model. (b) Training results of the LSTM model. (c) Training results of the BP model. (d) Training results of the CNN-LSTM model. (e) Training results of the BiLSTM model. (f) Training results of the CNN-BiLSTM model.
Jmse 13 00905 g006
Figure 7. Statistics on the logarithmic distribution of the number of fish caught on a single grid in October.
Jmse 13 00905 g007
Figure 8. (a) The fishing hotspots in the East China Sea and the Yellow Sea in January. (b) The fishing hotspots in the East China Sea and the Yellow Sea in February. (c) The fishing hotspots in the East China Sea and the Yellow Sea in March. (d) The fishing hotspots in the East China Sea and the Yellow Sea in April. (e) The fishing hotspots in the East China Sea and the Yellow Sea in May. (f) The fishing hotspots in the East China Sea and the Yellow Sea in June. (g) The fishing hotspots in the East China Sea and the Yellow Sea in July. (h) The fishing hotspots in the East China Sea and the Yellow Sea in August. (i) The fishing hotspots in the East China Sea and the Yellow Sea in September. (j) The fishing hotspots in the East China Sea and the Yellow Sea in October. (k) The fishing hotspots in the East China Sea and the Yellow Sea in November. (l) The fishing hotspots in the East China Sea and the Yellow Sea in December.
Jmse 13 00905 g008
Figure 9. Map of quarterly fishing hotspots in the East China Sea and the Yellow Sea.
Jmse 13 00905 g009
Figure 10. (a) Fishing hotspots for non-tackle vessels in May. (b) Fishing hotspots for non-tackle vessels in June. (c) Fishing hotspots for non-tackle vessels in July.
Jmse 13 00905 g010
Table 1. Statistics on monthly changes in the number of fishing vessels.
Ship TypeMonth
123456789101112
Trawler13561214874442364688424472955129614241494
Drift422394186134102234141222245198348393
Seine302315971662220243646
Stow15146551277881215
Longline414136374040394040414141
Total1864168611176275189906177631268156718611989
Table 2. CNN structure configuration table.
ArchitecturesABCDEFGH
Input LayerThe 128 × 1 × 5 Feature Vector
Convolutional Layer11010101010101010
Convolutional Layer2None10101010101010
Max Pooling LayerNoneNoneNoneNoneNoneYesYesYes
Dropout LayerNoneNoneNoneNoneNoneYesYesYes
Convolutional Layer3NoneNone202020202020
Convolutional Layer4NoneNoneNone2020202020
Max Pooling LayerNoneNoneNoneNoneNoneNoneYesYes
Dropout LayerNoneNoneNoneNoneNoneNoneYesYes
Convolutional Layer5NoneNoneNoneNone40NoneNoneNone
Fully Connected Layer1NoneNoneNoneNoneNoneNoneNoneYes
Dropout LayerNoneNoneNoneNoneNoneNoneNoneYes
Fully Connected Layer2YesYesYesYesYesYesYesYes
Time Consuming120 s240 s360 s490 s590 s540 s590 s660 s
Accuracy (%)81.20%82.65%85.52%85.72%82.67%85.78%86.46%82.43%
Table 3. BiLSTM structure configuration table.
ArchitecturesABCDEFG
Input LayerThe 128 × 1 × 5 Feature vector
BiLSTM Layer 110101010101010
BiLSTM Layer 2None101010101010
Dropout LayerNoneNoneNoneNoneYesYesYes
BiLSTM Layer 3NoneNone2020202020
BiLSTM Layer 4NoneNoneNone20NoneNoneNone
Dropout LayerNoneNoneNoneNoneNoneNoneYes
Fully Connected Layer 1NoneNoneNoneNoneNoneYesNone
Dropout LayerNoneNoneNoneNoneNoneYesNone
Fully Connected Layer 2YesYesYesYesYesYesYes
Time Consuming240 s360 s600 s724 s603 s667 s680 s
Accuracy (%)84.05%85.35%86.51%82.31%87.11%82.37%87.51%
Table 4. Summary of the classification effects of the neural network models.
ModelAccuracyPrecision RateRecall RateF1
CNN86.46%83.52%90.46%86.76%
LSTM87.21%83.64%89.64%86.53%
BP85.79%83.78%90.60%87.06%
BiLSTM87.51%83.12%91.23%87.00%
CNN-LSTM85.55%82.23%88.52%85.26%
CNN-BiLSTM89.98%84.21%91.53%87.72%
Table 5. Monthly hotspot statistics.
MonthNumber of Hotspot GridsSea Area (km2)Maximum ValueMean Value (Beyond 8000)
January69920,970151,85013,798
February46814,040558,16018,565
March3189540147,72014,482
April160480039,34211,397
May19570203,89042,126
June26780502,53064,548
July351050717,87065,330
August1233690856,02027,452
September64819,440346,23014,661
October151745,510370,06015,805
November95128,530126,00012,830
December109732,910103,89016,582
Disclaimer/Publisher’s Note: The statements, opinions and data contained in all publications are solely those of the individual author(s) and contributor(s) and not of MDPI and/or the editor(s). MDPI and/or the editor(s) disclaim responsibility for any injury to people or property resulting from any ideas, methods, instructions or products referred to in the content.