Article

Quantum-Inspired MoE-Based Optimal Operation of a Wave Hydrogen Microgrid for Integrated Water, Hydrogen, and Electricity Supply and Trade

1
Department of Energy and Renewable Energy Engineering, Faculty of Engineering and Technology, Egyptian Chinese University, Cairo 11786, Egypt
2
Faculty of Pharmacy, Egyptian Chinese University, Cairo 11786, Egypt
3
Department of Mechanical Engineering, Faculty of Engineering, “Dunarea de Jos” University of Galati, 800008 Galati, Romania
*
Author to whom correspondence should be addressed.
J. Mar. Sci. Eng. 2025, 13(3), 461; https://doi.org/10.3390/jmse13030461
Submission received: 25 January 2025 / Revised: 20 February 2025 / Accepted: 25 February 2025 / Published: 27 February 2025
(This article belongs to the Special Issue Advances in Offshore Wind and Wave Energies—2nd Edition)

Abstract

:
This research explores the optimal operation of an offshore wave-powered hydrogen system, specifically designed to supply electricity and water to a bay in Humboldt, California, USA, and also sell it with hydrogen. The system incorporates a desalination unit to provide the island with fresh water and feed the electrolyzer to produce hydrogen. The optimization process utilizes a mixture of experts in conjunction with the Quantitative Structure-Activity Relationship (QSAR) algorithm traditionally used in drug design, to achieve two main objectives: minimizing operational costs and maximizing revenue from the sale of water, hydrogen, and electricity. Many case studies are examined, representing typical electricity demand and wave conditions during typical summer, winter, spring, and fall days. The simulation, optimization, and results are carried out using MATLAB 2018 and SAM 2024 software applications. The findings demonstrate that the combination of the QSAR algorithm and quantum-inspired MoE results in higher revenue and lower costs compared to other current techniques, with hydrogen sales being the primary contributor to increased income.

1. Introduction

The global focus is shifting toward achieving fully sustainable energy and water management by 2050 [1]. The concept of the water-energy nexus refers to the interdependent relationship between water usage in energy production and energy used for water production [2]. Examples of this nexus include using sustainable energy for water desalination and harnessing seawater to generate electricity through tidal, wave, and wind converters [3].
Wave energy technology, a promising source of renewable energy, is used to generate clean electricity from the movement of ocean waves. Several successful wave energy projects have been implemented, particularly in Europe, with increasing interest in exploring its potential in other regions [4]. Wave energy presents a significant opportunity to contribute to the global transition to renewable energy and helps meet future energy demands sustainably [5]. Hydrogen is emerging as a key player in the future of sustainable energy generation and storage, with the potential to reshape global energy dynamics [6]. The green hydrogen is produced from green energy technology such as PV, wind, or wave applications. It is then stored in the form of gas or liquid to be converted during energy need to electricity or thermal energy. The United States has developed detailed plans to promote hydrogen energy as a crucial element of its clean energy transition. At the core of these efforts is the U.S. National Clean Hydrogen Strategy and Roadmap, which identifies pathways for integrating clean hydrogen into national decarbonization efforts across various economic sectors. This roadmap provides a comprehensive framework for scaling up the production and utilization of clean hydrogen, with detailed projections for 2030, 2040, and 2050 [7]. Green hydrogen, produced from wave energy and seawater desalination, is seen as a promising solution [
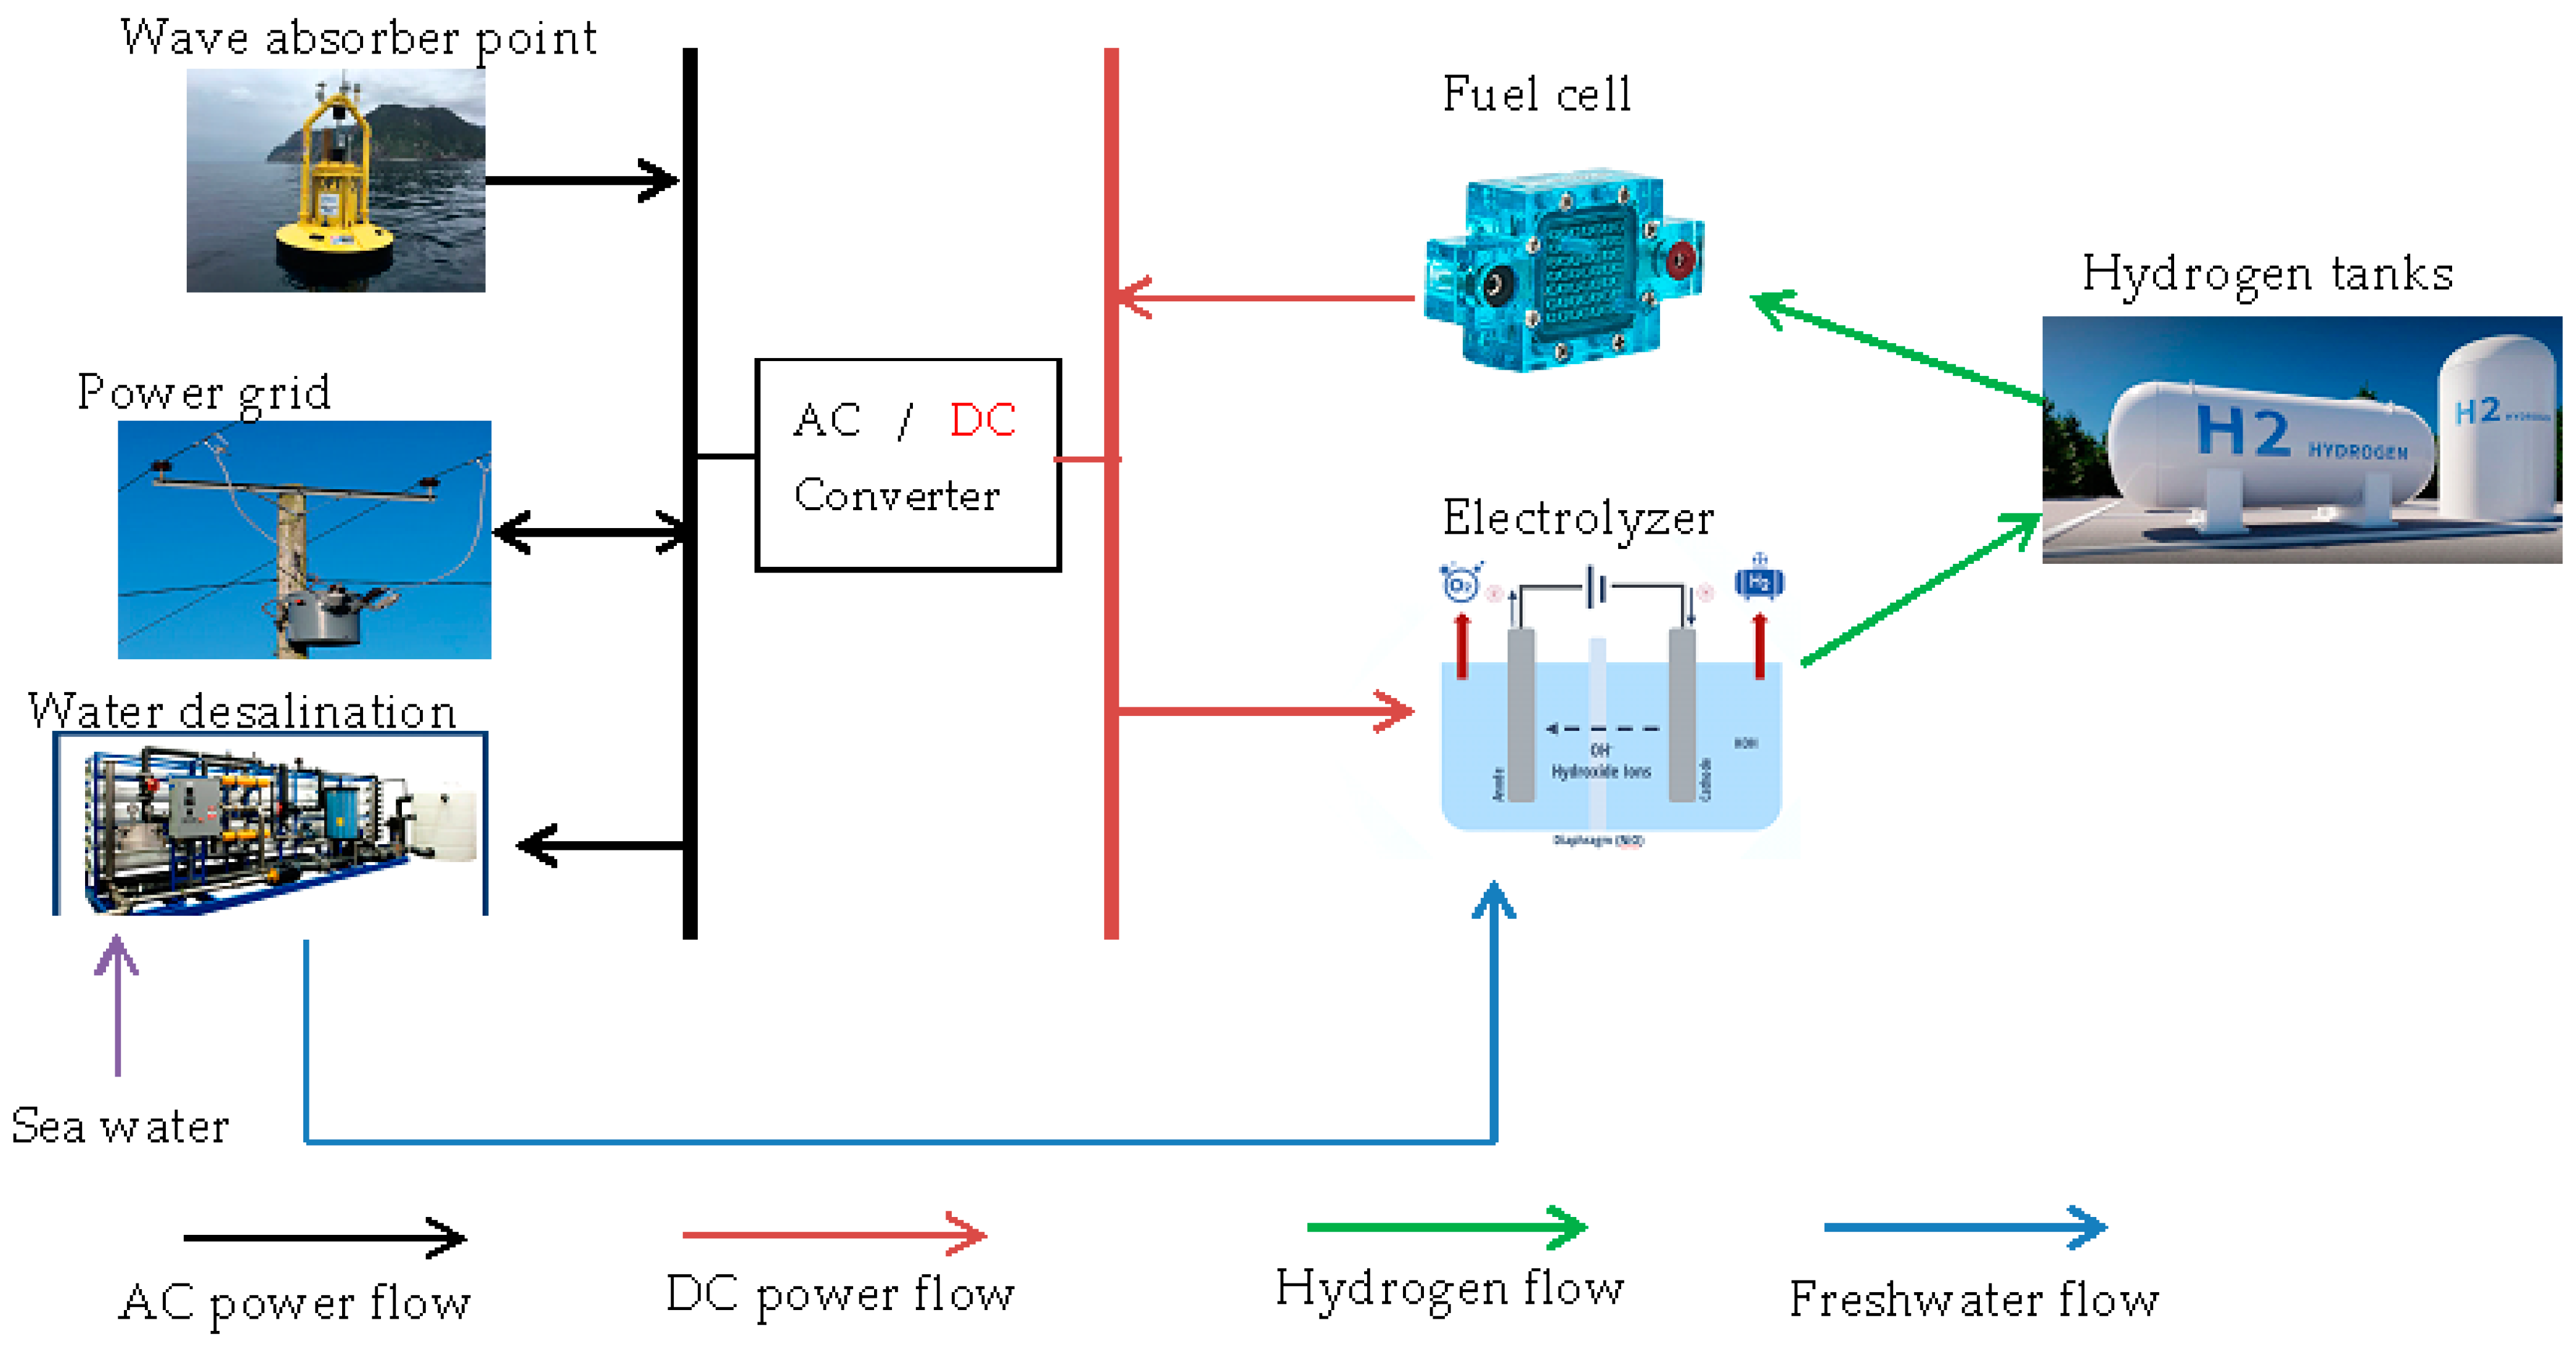
8]. The hydrogen system typically consists of three components mainly an electrolyzer that converts water into hydrogen, a hydrogen storage tank to store the produced hydrogen, and a fuel cell that converts stored hydrogen back into electricity [9,10].
In recent years, researchers have been exploring the use of hydrogen in sustainable energy generation and storage. One study focused on optimizing the operation of a system involving photovoltaic (PV) cells, hydrogen, batteries, and the electrical grid [11]. Another examined the operation of a combined wind, photovoltaic, battery, and hydrogen system [12]. Many recent studies have aimed to reduce the operational costs of microgrids and power systems. For example, a study presented a method to optimize the operation of a region in Egypt while considering operation costs maximizing the share of renewable energy to reach 100% [13,14].
The application of Mixture of Experts (MoE) models in microgrids offers a promising approach for optimizing energy distribution and management in decentralized energy systems. Microgrids, which consist of interconnected local energy sources such as solar panels, wind turbines, and storage units, require sophisticated decision-making systems to efficiently manage energy flow and ensure reliability. MoE models, with their ability to combine the expertise of multiple specialized models, can be used to model complex and dynamic behavior in microgrid systems [15]. In this context, different experts can be assigned to various tasks, such as forecasting energy demand, predicting renewable energy generation, managing storage units, and controlling energy exchange between grid and microgrid. A gating network determines which expert’s output to prioritize, based on current operating conditions, such as weather, load demand, or energy availability. This adaptability allows MoE models to handle uncertainties and variations in renewable energy generation, improving the overall efficiency and reliability of the microgrid [16]. Furthermore, MoE-based systems can potentially offer better scalability and robustness, as they can adapt to new experts or update existing ones as the microgrid evolves. Research into MoE in microgrids could lead to more intelligent and resilient energy management systems, paving the way for the integration of renewable energy sources and the development of smart grid technologies [17,18].
Quantitative Structure-Activity Relationship (QSAR) modeling is a valuable tool used to analyze the relationships between the chemical structure of compounds and experimental observations. The method relies on numerical descriptors, quality of observed data, and statistical techniques to establish correlations [19]. Despite its effectiveness, QSAR has limitations, such as overfitting, limited applicability to new chemical structures, and challenges in providing accurate error estimates [20]. QSAR models are frequently used to optimize chemical compounds for potential clinical trials [21]. In this research, QSAR is employed to optimally operate a wave hydrogen energy microgrid.
From the above studies, it was noticed that no previous research was implemented on how to employ wave and hydrogen energy technologies in the United States, especially in California. In this research, the main contributions covered the following topics:
i.
Integration of hydrogen and wave energies to form a microgrid to produce electricity, water, and hydrogen for supplying a bay in the USA and trade.
ii.
Employ the QSAR optimization technique to operate the microgrid optimally to achieve minimum cost and maximum revenue in daily operation.
iii.
Employ MoE as an artificial intelligence tool for solving the multi-objective goals in the operation of the microgrid.
iv.
Compare the performance of the daily wave energy generation, the microgrid cost of operation, and revenue in different seasons namely summer, winter, fall, and spring.
The paper is organized as follows; Section 2 illustrates the modeling of the microgrid while in Section 3, an illustration of the project location is presented. Section 4 illustrates how optimization and artificial intelligence are employed towards optimal operation of the microgrid. Section 5, Section 6 and Section 7 present results, discussions, and conclusions, respectively.

2. Microgrid Modeling

The microgrid shown in Figure 1 is operated by a wave energy converter namely a point absorber to operate electrolyzer, electrical loads, and water desalination unit. The energy is stored in the form of hydrogen in compressed gas tanks; the hydrogen is converted to electricity by fuel cells. The aim of the microgrid is the production of electricity, hydrogen, and water for use and selling.

2.1. Wave Energy Conversion System

A wave energy system works by capturing the kinetic and potential energy from ocean waves and converting it into electrical power. A point absorber wave energy converter is used in this research which is a floating device that harnesses the vertical motion of ocean waves to generate electricity, typically using a hydraulic or mechanical power take-off system to drive a generator. The energy available from the waves is determined by the wave height ( H ) and the wave period ( T ), along with other environmental parameters. The total power in the waves ( P w a v e ) can be estimated using (1) [22].
P w a v e = ρ · g 2 ·   H 2 · T 64 π
ρ is the density of seawater which is set to be 1000 kg/m3, g is the gravitational acceleration (9.81 m/s2). This power is then captured by a wave energy converter, selected in this research to be a point absorber. The vertical motion of the waves is converted into mechanical energy, which is then transformed into electrical power using a generator. The mechanical power output ( P m e c h a n i c a l ) can be approximated as illustrated in (2) [23].
P m e c h a n i c a l = C m · H 2 T
C m is a constant representing the efficiency of the point absorber. The mechanical power is then converted into electrical power ( P e l e c t r i c a l ) by the generator and turbine, considering their respective efficiencies ( η g e n e r a t o r and η t u r b i n e ) as illustrated in (3) [24].
P e l e c t r i c a l = P m e c h a n i c a l . η t u r b i n e . η g e n e r a t o r

2.2. Water Desalination Unit

The operation of the water desalination unit is outlined in [25] and the equations governing the system are (4) and (5).
W w a t e r ( t ) = G R ( P t ( t ) P R )
W s t = W s t 1 + G w t W u s e ( t )
W w a t e r signifies the quantity of pure water produced, G R is the nominal capability for pure water production, P t is the utilized power, and P R is the nominal power of the unit of desalination. W s indicates the water stored in the reservoir, G w refers to the freshwater generated, and W u s e is the amount of freshwater utilized.

2.3. Hydrogen Energy System

The hydrogen system is composed of three key components: the electrolyzer, the hydrogen storage tank, and the fuel cell. The primary function of the electrolyzer is to produce hydrogen, as described in Equations (6) and (7). The amount of power required to perform the electrolysis process is denoted as P e l   , while the mass of hydrogen generated during the process is represented by m e l
P e l ( t ) = i = 1 N e l A i e l N e l I e l V e l t
m e l ( t ) = N e l   I e l   η f t 2 F M
The fuel cell’s primary function is to transform hydrogen into electrical energy, as shown in Equations (8) and (9). The proton exchange membrane fuel cell is used in this research to convert hydrogen to electricity. The power utilized in the redox reaction is denoted as P F C , while the amount of hydrogen consumed during this process is represented by m F C .
P F C ( t ) = i = 1 N F C A i F C N F C I F C V F C t
m F C ( t ) = N F C   I F C   t 2 F M
In this context, A represents the operational status of the cell during electrolysis (where 0 indicates off and 1 indicates on). N refers to the total number of electrolyzers or fuel cells. The variables V and I denote the voltage and current of the cell, respectively. F is the Faraday constant, and η f represents Faraday's efficiency. The quantity M refers to the mass of hydrogen in kilograms.
After hydrogen exits the electrolyzer, it undergoes compression before being stored in a tank. Taking into account the adiabatic expansion and the variation in hydrogen volume, the storage process can be described by Equation (10).
V s t o r a g e ( t ) R T d Y H d t = n s t o r e d   h y d r o g e n
In this equation, Y H represents the hydrogen performance parameter, V s t o r a g e is the volume of the stored hydrogen, T is the temperature during the adiabatic process, and R is the ideal gas constant [9].

3. Microgrid Location

Humboldt Bay is located along the northern coast of California, nestled between the Pacific Ocean and the rugged coastal ranges as shown in Figure 2. The bay stretches roughly 15 miles inland, with its waters framed by the Humboldt Bay Heads, which offer natural protection from the open ocean. Situated in Humboldt County, the bay is surrounded by a mix of lush forests, tidal marshes, and hills that create a dramatic and scenic backdrop. The bay itself is one of the largest natural harbors on the West Coast, offering a sheltered environment that has historically supported maritime activities [26]. The surrounding landscape includes diverse ecosystems, from salt marshes to dense redwood forests, which contribute to the bay’s ecological importance [27].
The bay is positioned near the city of Eureka, which sits along its southern shore, providing easy access to the bay’s waters. To the north and south, the bay is bordered by smaller communities, each contributing to the regional economy and culture. The area’s geography also makes it a popular destination for outdoor enthusiasts, who come to enjoy the natural beauty, wildlife, and recreational opportunities the bay and its surroundings offer [28]. Humboldt Bay’s location in this remote and picturesque corner of California makes it a unique and important natural resource for both the local community and the broader region [29]. The Humboldt Bay area relies on a mix of surface water and groundwater for its water supply, with conservation efforts in place to address periodic droughts. Energy needs are shifting toward sustainability, with decommissioned fossil fuel plants replaced by renewable sources like offshore wind and solar power. The region benefits from renewable energy programs, although challenges remain in infrastructure and grid capacity. Local authorities prioritize water quality and energy efficiency to ensure a sustainable future. The wave energy system will be implemented in Humboldt Bay 5344.78 m distance from the shore, with a water depth of 48 m, latitude of 40.84, and longitude of −124.25. The wave height is illustrated in Figure 3 which is exported from SAM 2024 software application and shows that there is a big wave energy potential especially in winter [30].

4. Optimization in Microgrid Operation

4.1. Optimization Problem Definition

The optimization is done to minimize the cost of operation and maintenance while also increasing the revenue from the sale of energy and water. Increasing revenue from the sale of electricity, hydrogen, and freshwater ( F 1 ) and lowering operating costs for fuel cells, electrolyzers, and water desalination units ( F 2 ) are the two main goals of the objective function (F). The weighting factor and normalization procedures are two ways that combine the two objective functions.
Objective functions:
(A)
Maximizing income
F 1 = m a x t = 1 24 ( C E P E t + C H m H t + C W W s t ) / 24
where C E is the price per unit of electricity sold, the electricity that was sold in KWhr is P E t , C H is the cost per unit of hydrogen sold, m H is how many liters of hydrogen are sold, C W is the cost per unit of freshwater sold and W s is the volume of water sold in cubic meters.
(B)
Minimization of operation cost
The objective is to minimize the operation cost of water desalination unit, electrolyzer unit, and fuel cell.
F 2 = min t = 1 24 ( U e l P e l t + U F C P F C t + U W P W t ) / 24
where the unit costs for running the fuel cell, water desalination, and electrolyzer units are U e l , U F C , and U W , respectively.
There are two ways to handle this multi-objective problem: the normalization approach, which uses the single best solution for each objective, as shown in (13) and the weighting factors, as shown in (14) assuming equal priority for the two objectives.
F = 1 O p t i m a l   F 1 F 1 + 1 O p t i m a l   F 2 F 2
F = 1 2 F 1 + 1 2 F 2
Constraints:
  • Normal power flow equations
The system’s power generation (from wave and fuel cells) is equal to the power sold to the grid and the power required for system consumption (water desalination power, electrolyzer, and load). The fuel cell and electrolyzer cannot operate simultaneously.
P W i n d t + P F C t = P t t + P e l t + P l o a d t + P E t
P F C t · P e l t = 0
ii.
Inequality constraints (limits)
Wave energy conversion limits: Wave energy converter cannot exceed maximum power.
0 P W a v e ( t ) P W a v e m a x
P W a v e m i n ( t ) P W a v e ( t ) P W a v e m a x ( t )
The output of a water desalination plant varies from minimum to maximum.
W w a t e r m i n ( t ) W w a t e r ( t ) W w a t e r m a x ( t )
Fuel cell and electrolyzer units operating power limitations
P e l m i n P e l ( t ) P e l m a x
P F C m i n P F C ( t ) P F C m a x
To prevent any damage to the grid component, the power sold to the grid must be less than the maximum amount that the grid could receive from the system.
P E ( t ) P E m a x
Hydrogen storage energy should follow (23), (24), and (25)
E H t = E H t 1 1 δ + t ( P e l t 1 η e l P F C t 1 η F C )
E H m i n E H ( t ) E H m a x
0.2 S O C 0.8
where the capacity of the storage is E H , δ is the coefficient of discharge and S O C is the state of charge.

4.2. QSAR Optimization

In quantitative structure-activity relationship (QSAR) studies in drug design, the process typically involves the use of two distinct datasets: the training set and the test set. These datasets are instrumental in the development and validation of predictive models. The training set consists of a diverse array of chemical compounds along with their corresponding biological activities or properties. The goal of the training set is to develop a QSAR model that can accurately predict the biological activity of novel compounds based on their molecular descriptors, which represent the structural features of the compounds [19].
The test set, on the other hand, is utilized to evaluate the model’s predictive capability. Unlike the training set, the compounds in the test set are not used during the model training phase, allowing researchers to assess how well the model generalizes to previously unseen data. The performance of the model is typically evaluated by comparing its predictions against the actual observed values in the test set [20,21].
A widely used metric for assessing model performance in QSAR studies is the Q-squared (Q2) statistic. Q2 quantifies the proportion of variance in the observed data that the model is able to explain. It ranges from 0 to 1, with values closer to 1 indicating a better fit between the model and the data. In the context of QSAR, a model is considered reproducible if its Q 2 value exceeds 0.8 in the training set. A model is deemed predictive if its Q2 value is greater than 0.6, while both reproducibility and predictive capability must be satisfied for the model to be regarded as valid [31,32,33].
The Q2 statistic is computed in (26):
Q 2 = 1 S S r e s S S t o t
where S S r e s represents the sum of squared residuals (the differences between predicted and observed values), and S S t o t is the total sum of squares (the overall variability in the observed data). The individual components S S r e s and S S t o t can be calculated as illustrated in (27) and (28)
S S r e s = ( y o b s y p r e d ) 2
S S t o t = ( y o b s y m e a n ) 2
where y o b s is the observed activity value, y p r e d is the predicted activity value, and y m e a n is the mean of the observed activity values.
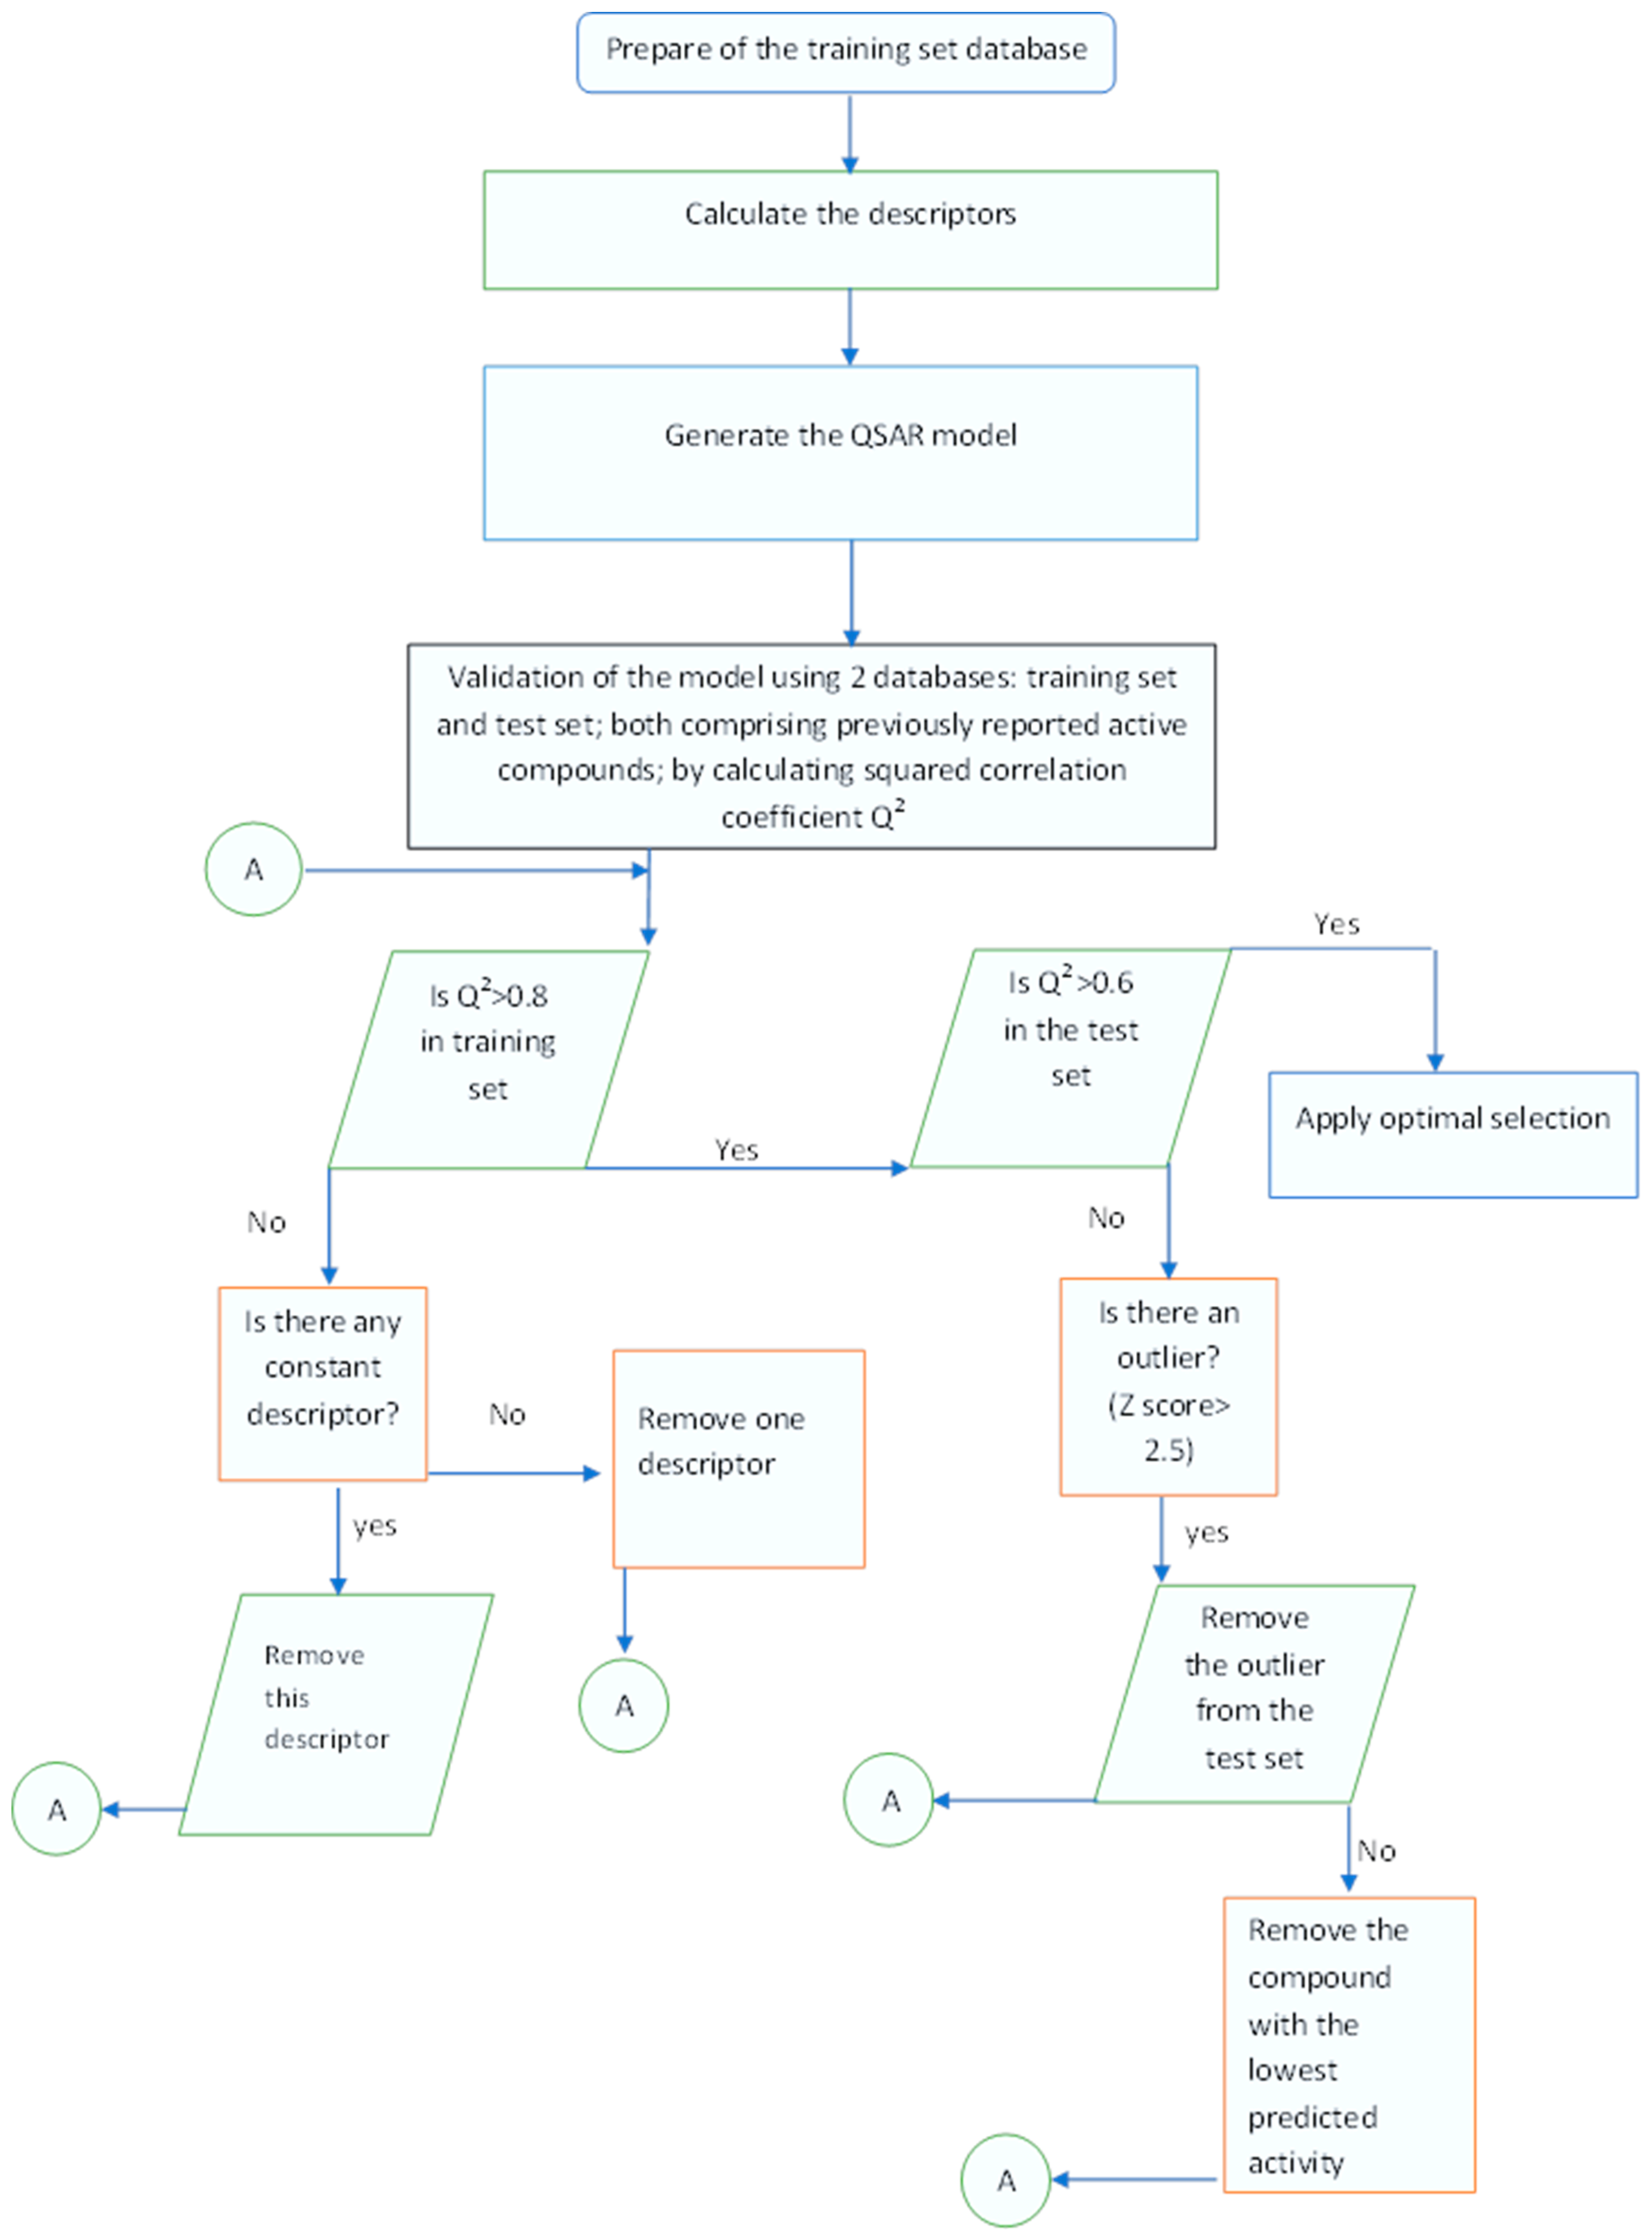
In QSAR studies, outliers and z-scores play crucial roles in data analysis and model development as shown in Figure 4 which illustrates the flowchart of QSAR optimization. Outliers are data points that significantly deviate from the expected trend and can introduce noise or bias, thus negatively affecting model accuracy. Identifying and appropriately handling outliers is vital for ensuring the reliability of QSAR models. Outliers may arise due to factors such as measurement errors, experimental artifacts, or the presence of compounds with rare or unique characteristics.
The z-score is a statistical tool used to quantify how far a data point deviates from the mean of a distribution, measured in standard deviations. In QSAR analysis, z-scores are often employed for both outlier detection and data normalization. A commonly accepted threshold for identifying outliers based on z-scores is 2.5, where values beyond this threshold indicate potential outliers [33].
The z-score for a data point x i is calculated using the formula in (29):
z = x i μ σ
where x i is the observed value, μ is the mean, and σ is the standard deviation of the data distribution.

4.3. Quantum-Inspired Mixture of Experts Strategy

The Mixture of Experts (MoE) strategy represents a cutting-edge approach to addressing multi-objective optimization challenges across various domains. This framework combines the strengths of modularization, selective activation, and parallel processing to achieve superior performance in solving complex, multifaceted problems. By design, the MoE strategy decomposes a problem into smaller, specialized tasks, each handled by an “expert” model. These experts are dynamically activated based on contextual information, making the MoE approach a promising solution for balancing trade-offs between conflicting objectives [34].
The MoE framework consists of two primary components: the expert models and a gating network. Each expert model is trained to specialize in a particular objective or subset of the problem space. For instance, in the context of microgrid energy optimization, individual experts might focus on distinct objectives, such as maximizing renewable energy utilization, minimizing operational costs, or enhancing system reliability. The gating network functions as a decision-making mechanism, dynamically assigning tasks to the most relevant expert(s) based on the input features or environmental context. This selective activation ensures computational efficiency by engaging only the required subset of experts, thereby reducing unnecessary processing overhead.
The MoE strategy is particularly well-suited for multi-objective optimization due to its ability to address trade-offs among competing objectives. Traditional optimization techniques often require combining objectives into a single composite function, which can obscure individual priorities and lead to suboptimal solutions. In contrast, MoE retains the granularity of each objective by assigning them to specialized experts, thereby enabling more effective optimization. Moreover, the modular nature of MoE facilitates scalability, as additional experts can be introduced to address emerging objectives or accommodate evolving problem requirements.
From a computational perspective, the MoE strategy offers significant advantages. The independent nature of expert models allows for parallel processing, which enhances scalability and reduces computation time in large-scale optimization problems. Furthermore, the specialization of experts ensures that each model achieves high performance within its designated domain, leading to improved overall optimization outcomes. This is particularly beneficial in applications where objectives are highly diverse and interdependent, such as energy systems, supply chain management, autonomous systems, and healthcare.
In energy systems, for example, the MoE approach can be utilized to optimize the distribution of energy resources, balance operational costs, and enhance sustainability. Each objective is managed by a specialized expert, while the gating network coordinates its interactions to provide an integrated solution. Similarly, in supply chain management, the MoE framework can address the trade-offs between cost efficiency, delivery speed, and inventory levels. The modularity and adaptability of the MoE strategy make it a versatile tool for addressing complex multi-objective challenges across industries.
The implementation of the MoE framework has demonstrated significant potential in various research studies. For instance, recent advancements in machine learning and artificial intelligence have highlighted the efficacy of MoE in optimizing resource allocation, reducing energy consumption, and improving decision-making processes in dynamic environments [18,35]. These findings underscore the transformative role of the MoE strategy in solving real-world optimization problems.
Figure 5 shows how MoE is employed to solve the multi-objective optimization process to optimally operate the wave hydrogen microgrid in this research. The optimal value of each single objective is calculated using QSAR optimization.
The gating network in the MoE framework is a crucial component responsible for dynamically selecting the appropriate experts for a given input. It operates as a mediator that decides which expert model should process the input data based on certain criteria, such as input features or environmental context. Here is a detailed breakdown of how the gating network is typically designed in this research:
a.
Input layer: The gating network starts by receiving the same input as the entire MoE system. The inputs included in this research are wave height, water demand, and electricity demand. It is designed in this research to have one neuron.
b.
Quantum-Inspired Processing [36]: The inputs are processed to mix between the two objectives based on the normalization of probability amplitudes, to ensure that the sum of the weights is 1. The absolute square of each amplitude to get the selection weights is shown in (30). This ensures that the gating network still produces a valid probability distribution of weights, but the way these weights are formed introduces a quantum-like interference.
w i = O p t i m a l   F i 2 O p t i m a l   F i 2 + O p t i m a l   F j 2
c.
Output layer: consists of one neuron and the outputs are on/off decision of the water desalination unit, the electrolyzer, and the fuel cell.

5. Results

This study aims to evaluate the performance of a newly proposed quantum-inspired MoE, optimization technique, QSAR, alongside other advanced methods in terms of revenue generation and total cost for a hypothetical microgrid. The analysis is conducted for typical summer, spring, fall, and winter days, considering realistic daily electricity demand and wave height variations. Five optimization scenarios were examined: Normalized QSAR Optimization (NQSAR), Weighting Factor QSAR Optimization (WQSAR), Particle Swarm Optimization (PSO), Genetic Algorithm Optimization (GA), and Quantum-Inspired Mixture of Experts (MoE). The microgrid is assumed to include a 1 GW wave converter located in the Pacific Ocean of Humboldt Bay, with a maximum water load capacity of 3.91 million tons. To ensure consistency and accuracy, all optimization algorithms were implemented and tested using MATLAB 2018 while data of generation was imported from SAM 2024 to MATLAB.
In this study, the power rating of both the electrolyzer and the fuel cell is 10 MW with a capacity of 20 MWhrs. The cost of 1 Kg of hydrogen is assumed to be USD10 while 1 Kwh of electricity is assumed to be USD0.46 similar to 1 m3 of water. The wave power and energy produced over one year are shown in Figure 6 and Figure 7, respectively using the SAM 2024 version. The yearly accumulative energy produced from the microgrid is 2,292,968,704 kWhr with a capacity factor of 26.2%.

5.1. Summer Day

Figure 8 and Figure 9 illustrate the electricity demand and the wave energy production on a typical summer day in Humboldt Bay, Pacific Ocean. Optimization is conducted using five different scenarios to enhance revenue generation while reducing the microgrid’s operational expenses. As depicted in Figure 10 and Figure 11, the MoE followed by the NQSAR approach, then the WQSAR, achieves higher revenue and lower operational costs compared to the other two methods. Additionally, the data in Figure 12 indicate that hydrogen sales account for approximately two-thirds of the total income.

5.2. Winter Day

Figure 13 presents the electricity demand on a winter day for Humboldt Bay, Pacific Ocean which is 29% lower than the summer demand, while Figure 14 represents the wave energy production from the converter on a typical winter day which is almost double that of the summer day. Optimization is performed using five scenarios to maximize revenue and minimize the microgrid’s operational costs. As shown in Figure 15 and Figure 16, the MoE followed by the NQSAR, then the WQSAR, achieves higher revenue and lower costs compared to GA and PSO. Furthermore, the data in Figure 17 reveal that hydrogen sales contribute approximately 70% of the total income.

5.3. Spring Day

Figure 18 presents the electricity demand on a spring day for Humboldt Bay, Pacific Ocean which is 12% lower than the summer demand, while Figure 19 represents the wave energy production from the converter on a typical spring day which is almost 10% lower than that of the winter day. Optimization is performed using five scenarios to maximize revenue and minimize the microgrid’s operational costs. As shown in Figure 20 and Figure 21, the MoE, followed by NQSAR, then WQSAR, achieves higher revenue and lower costs compared to GA and PSO. Furthermore, the data in Figure 22 reveal that hydrogen sales contribute approximately 65% of the total income followed by almost 22% from selling electricity.

5.4. Fall Day

Figure 23 presents the electricity demand on a fall day for Humboldt Bay, Pacific Ocean which is 11% lower than the summer demand, while Figure 24 represents the wave energy production from the converter on a typical fall day which is almost 14% lower than that of the winter day. Optimization is performed using five scenarios to maximize revenue and minimize the microgrid’s operational costs. As shown in Figure 25 and Figure 26, the MoE, followed by NQSAR, then WQSAR, achieves higher revenue and lower costs compared to GA and PSO. Furthermore, the data in Figure 27 reveal that hydrogen sales contribute approximately 60% of the total income followed by almost 24% from selling electricity.

6. Discussions

Wave-powered hydrogen, electricity, and water production offer significant environmental advantages, primarily by generating hydrogen with zero direct greenhouse gas emissions, unlike fossil fuel-based hydrogen methods. Additionally, wave energy has a minimal land footprint, reducing habitat disruption compared to large-scale solar or wind farms. The process also supports decarbonization efforts in hard-to-abate sectors, such as shipping and heavy industry, by providing a clean fuel alternative. However, regulatory barriers remain a challenge. The deployment of wave energy, water desalination, and hydrogen infrastructure requires complex permitting processes, environmental impact assessments, and compliance with evolving hydrogen safety standards. Furthermore, the lack of clear policies and incentives for marine renewable hydrogen production can delay project implementation and investment decisions. Addressing these challenges through streamlined regulations, government incentives, and international standardization will be crucial for accelerating the adoption of wave-powered hydrogen solutions.
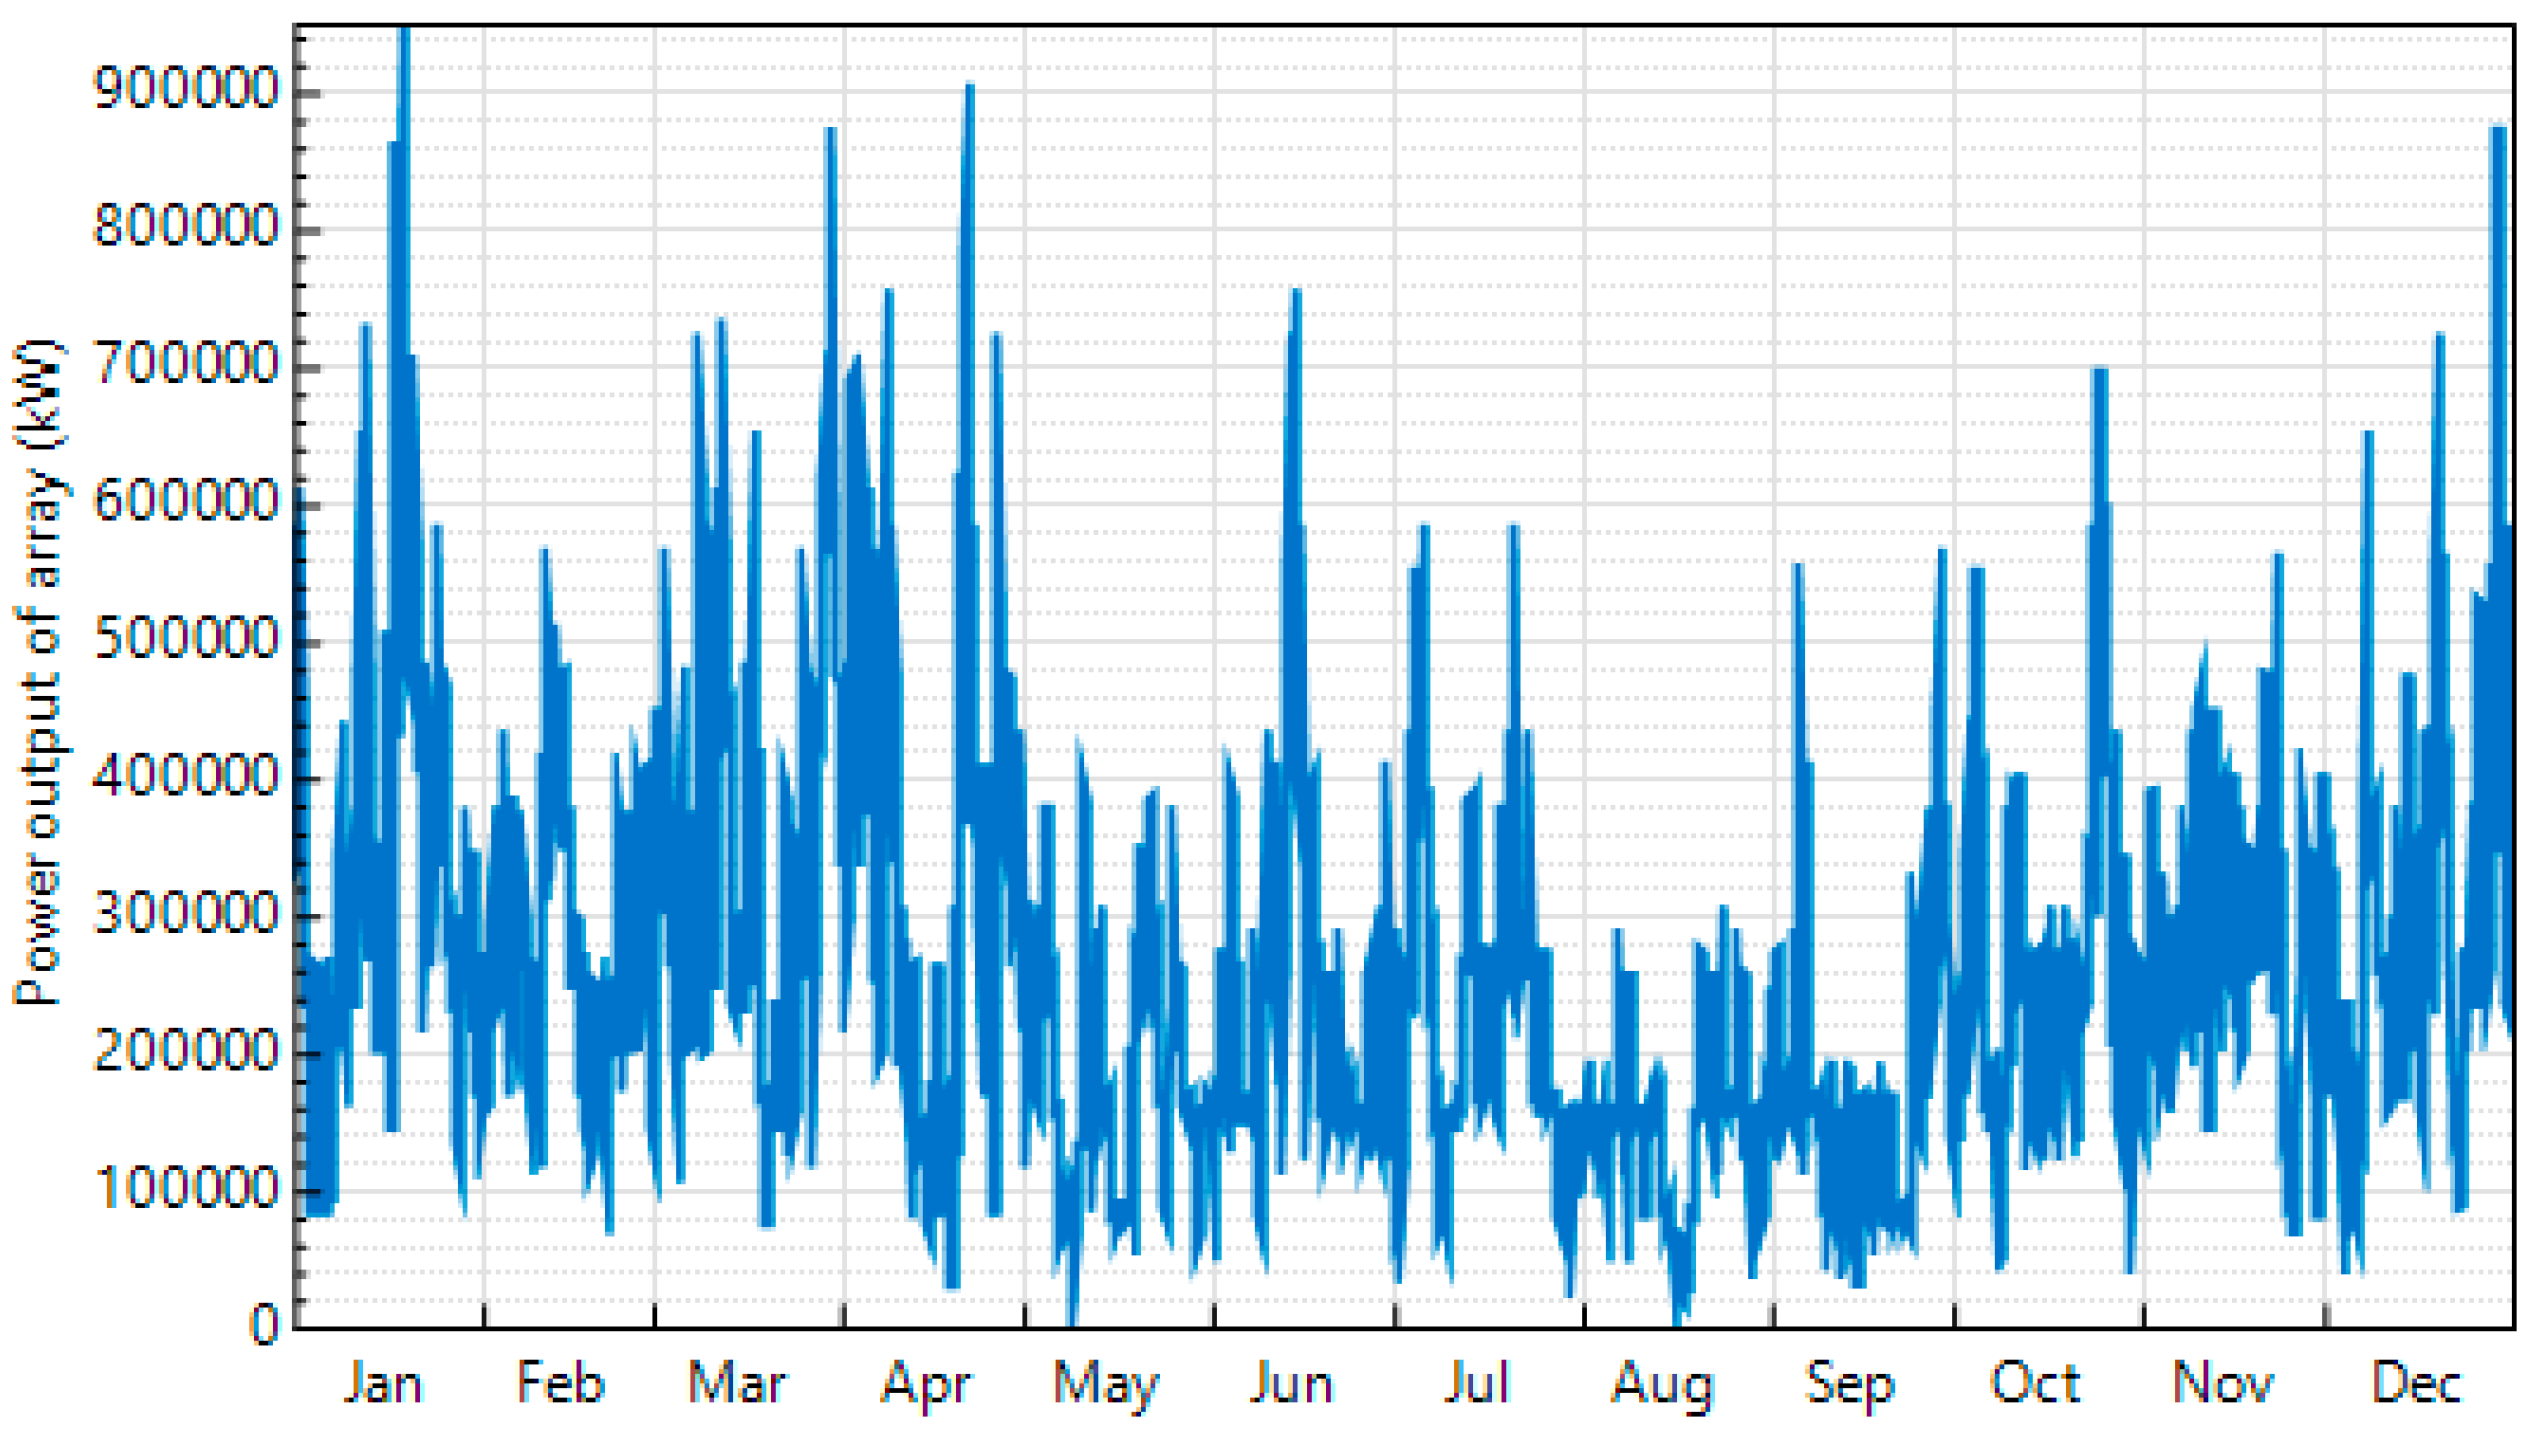
The seasonal analysis of the microgrid system, optimized using the quantum-inspired Mixture of Experts (MoE) and other advanced algorithms, offers a comprehensive perspective on the performance and revenue potential of integrating wave energy with hydrogen production. The results for typical summer, winter, spring, and fall days highlight distinct variations in electricity demand, wave energy production, and revenue contributions from hydrogen sales and electricity generation.
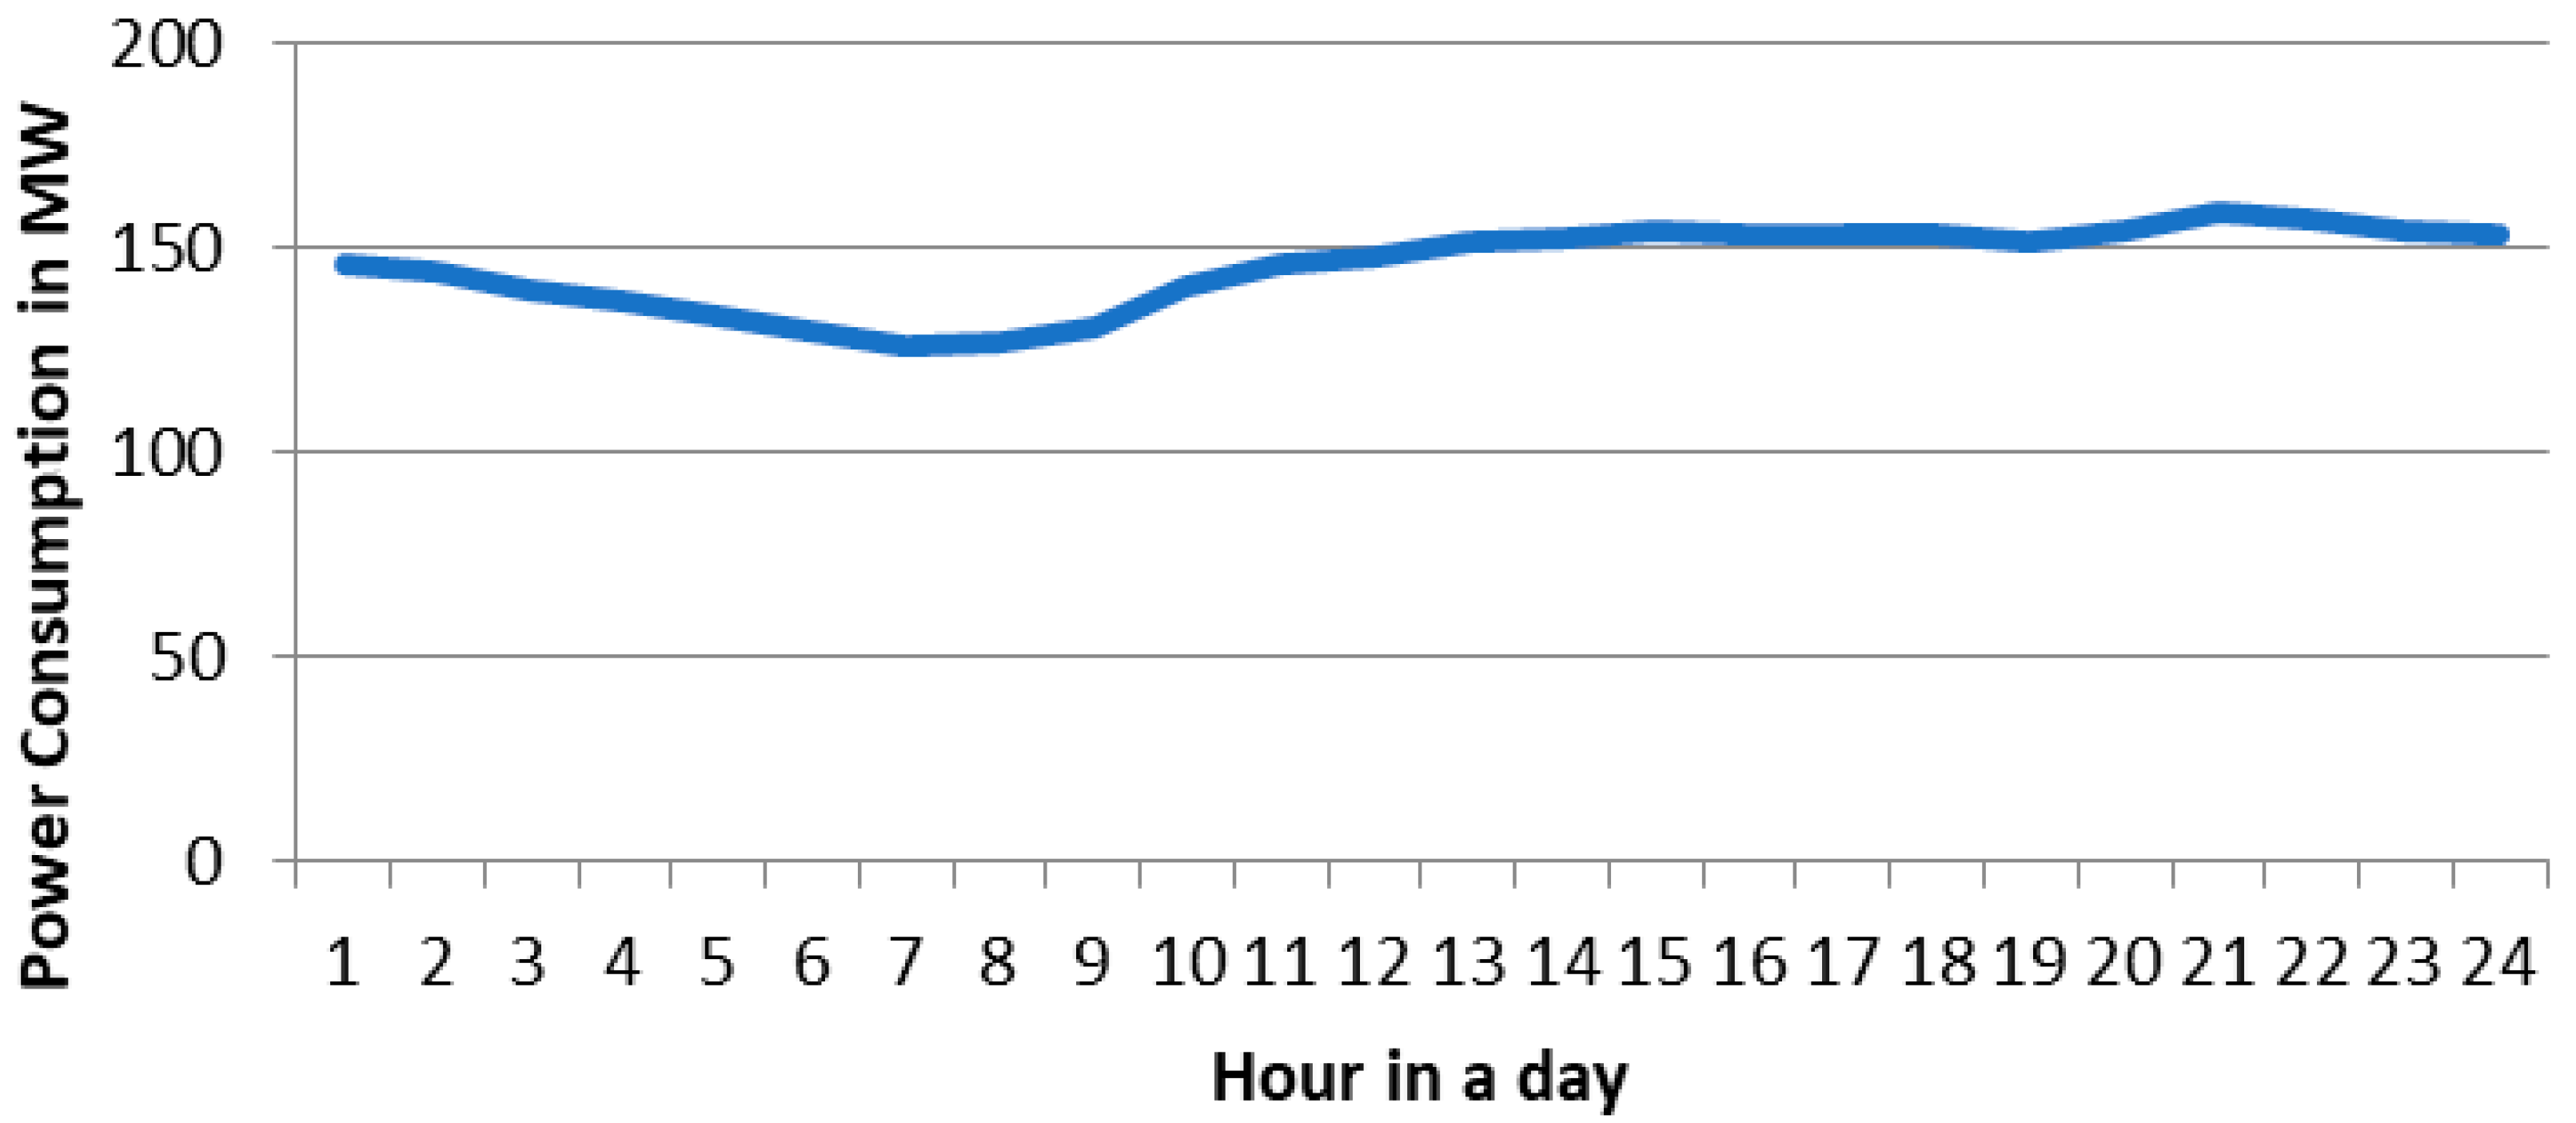
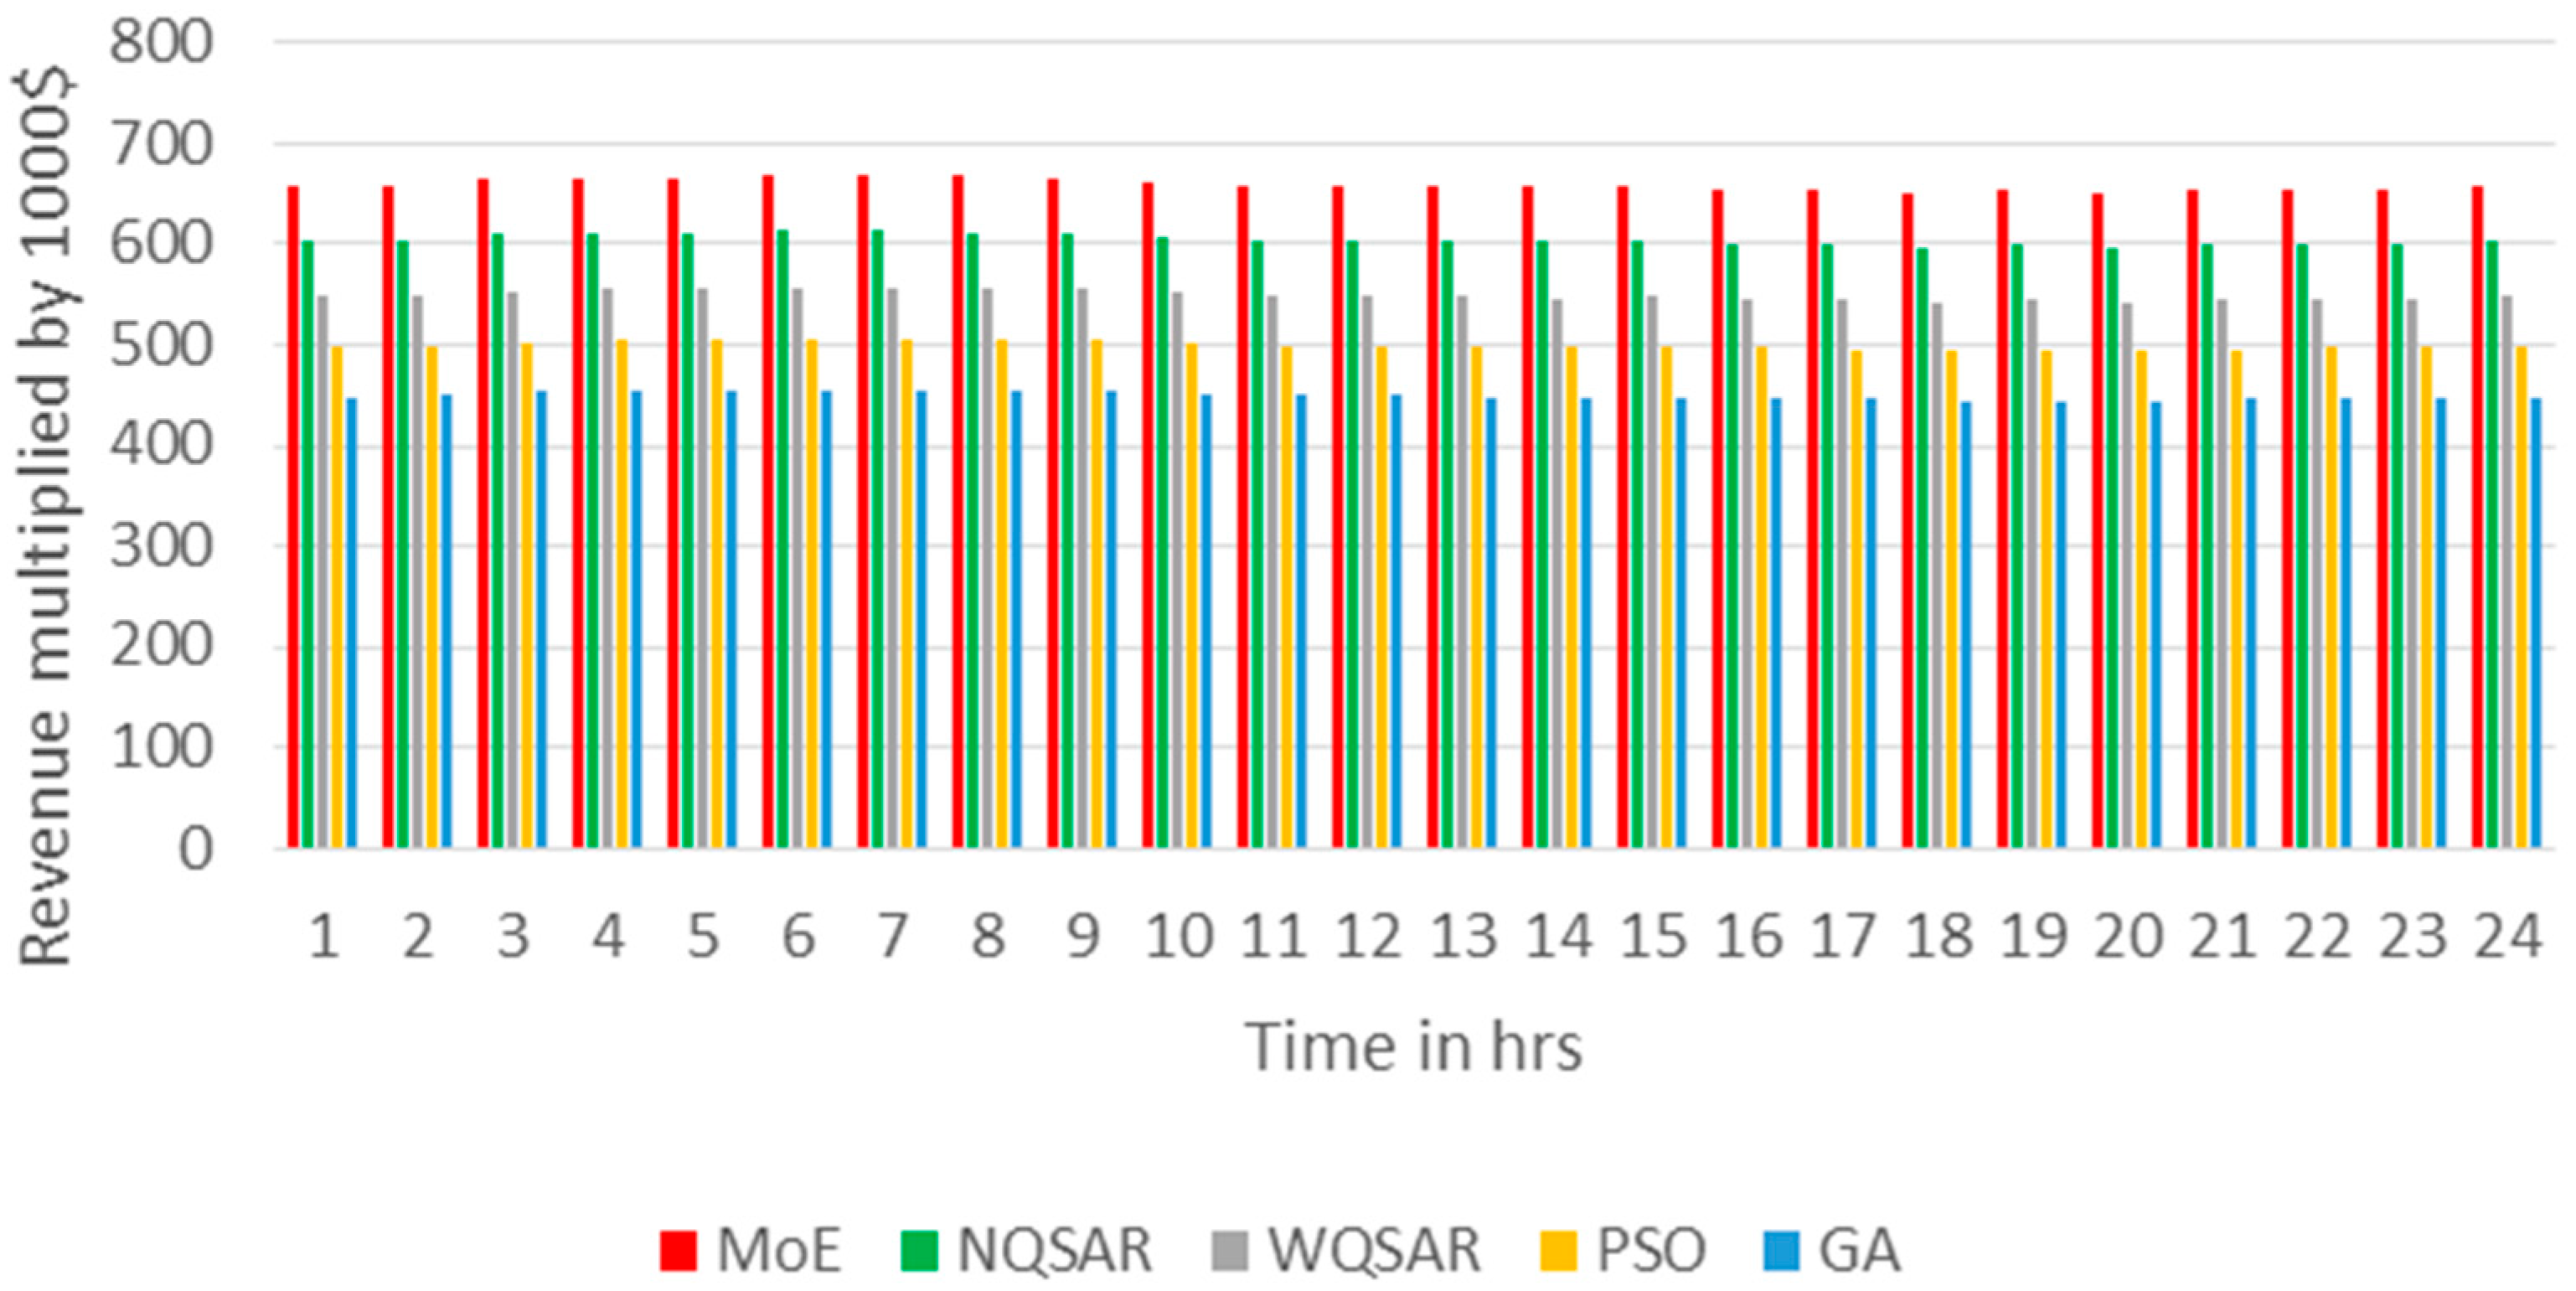
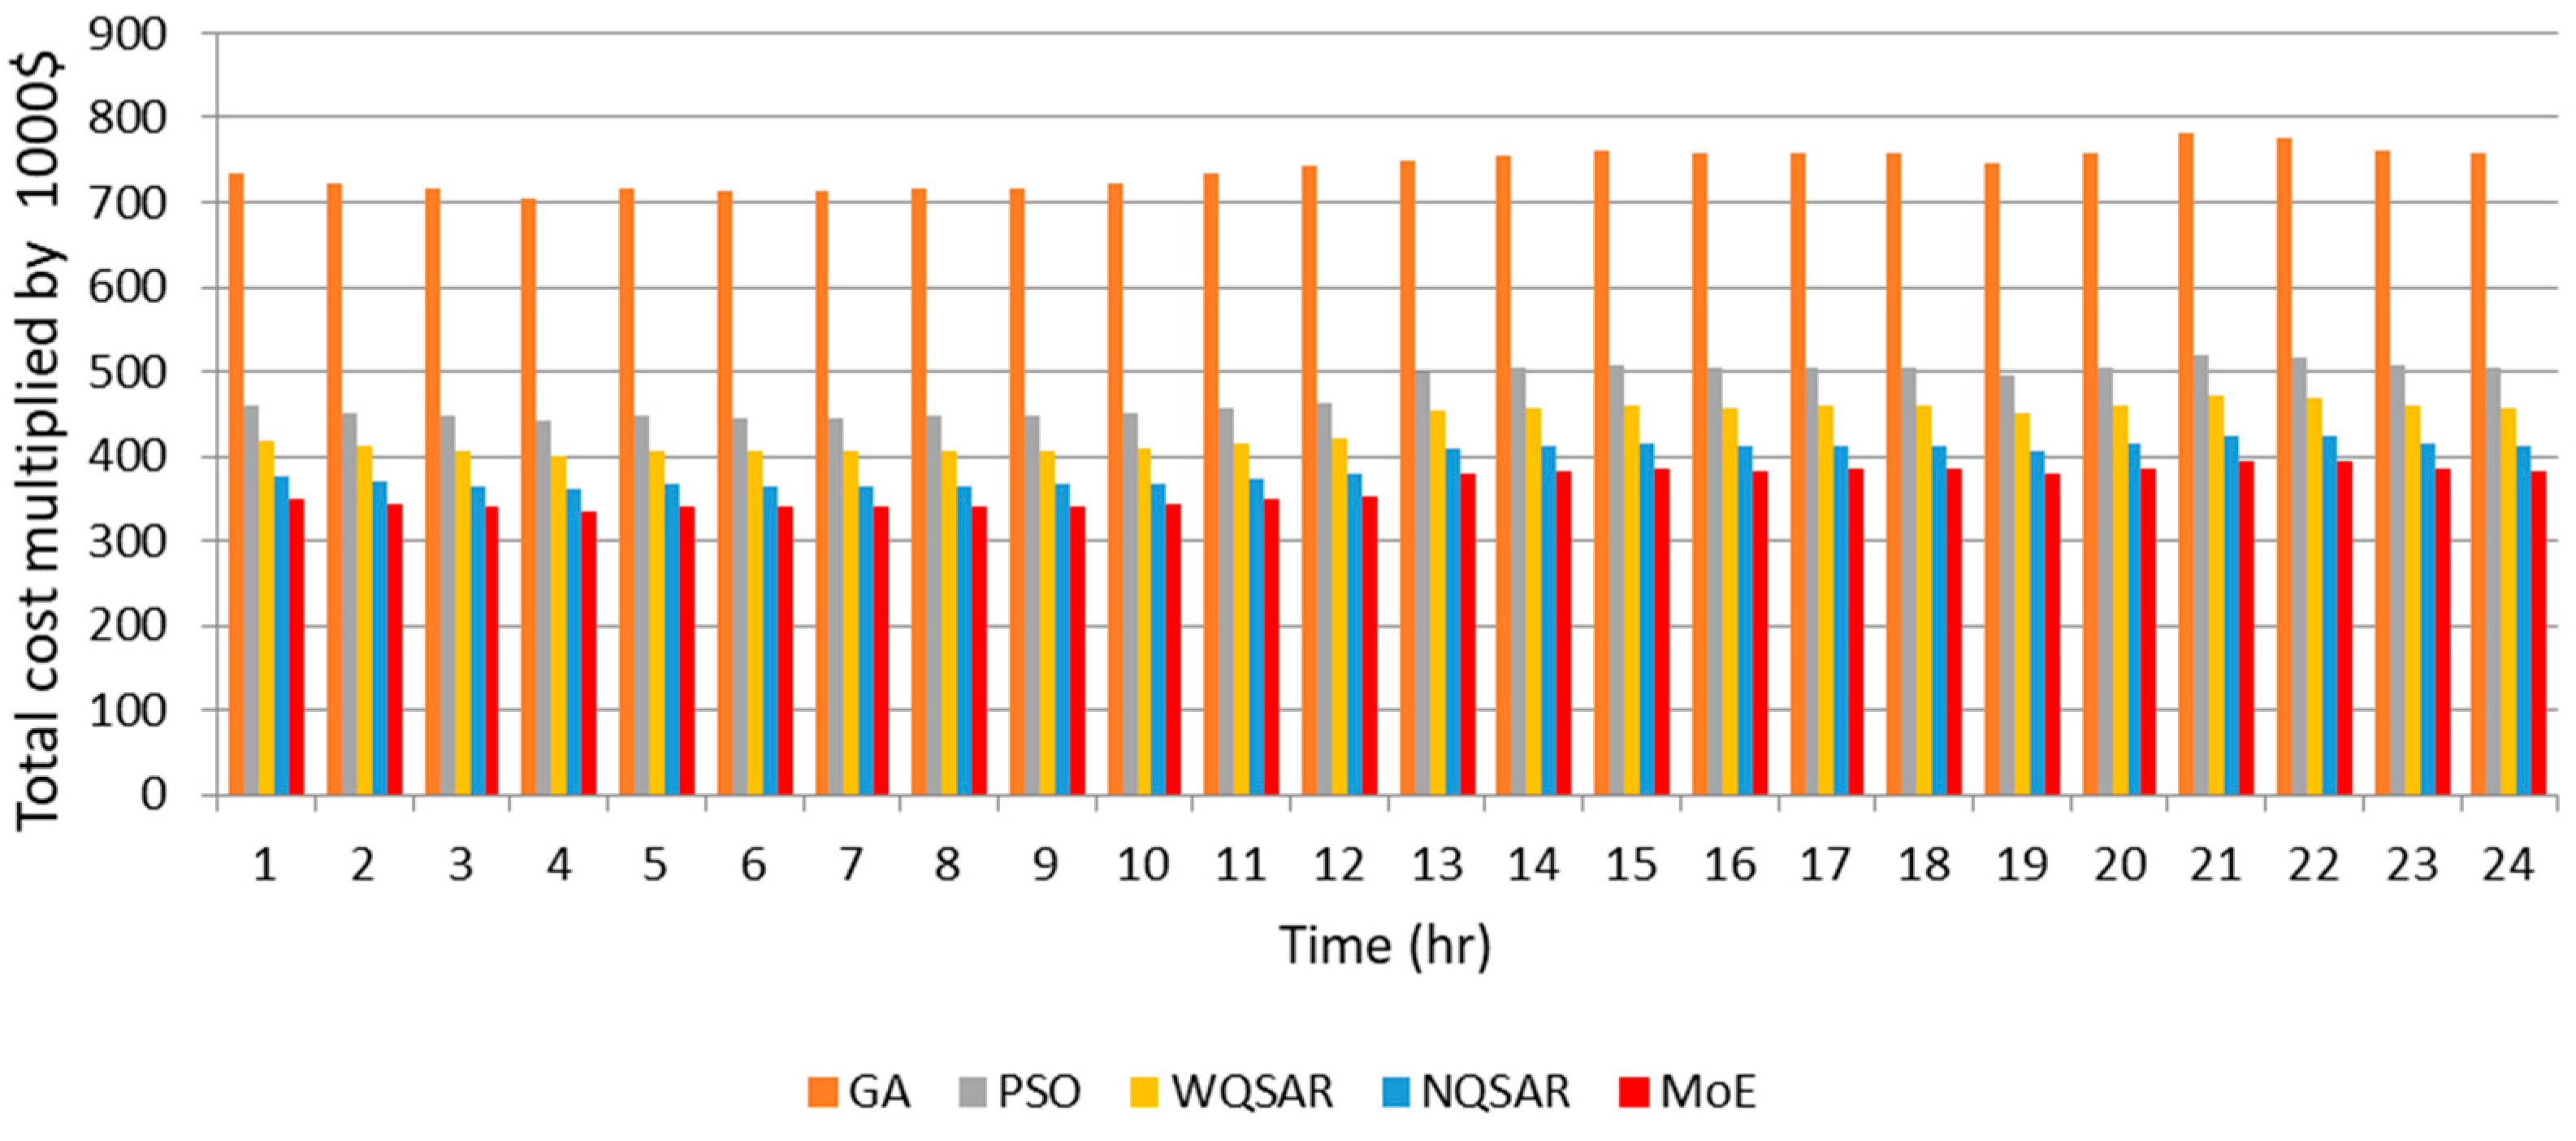
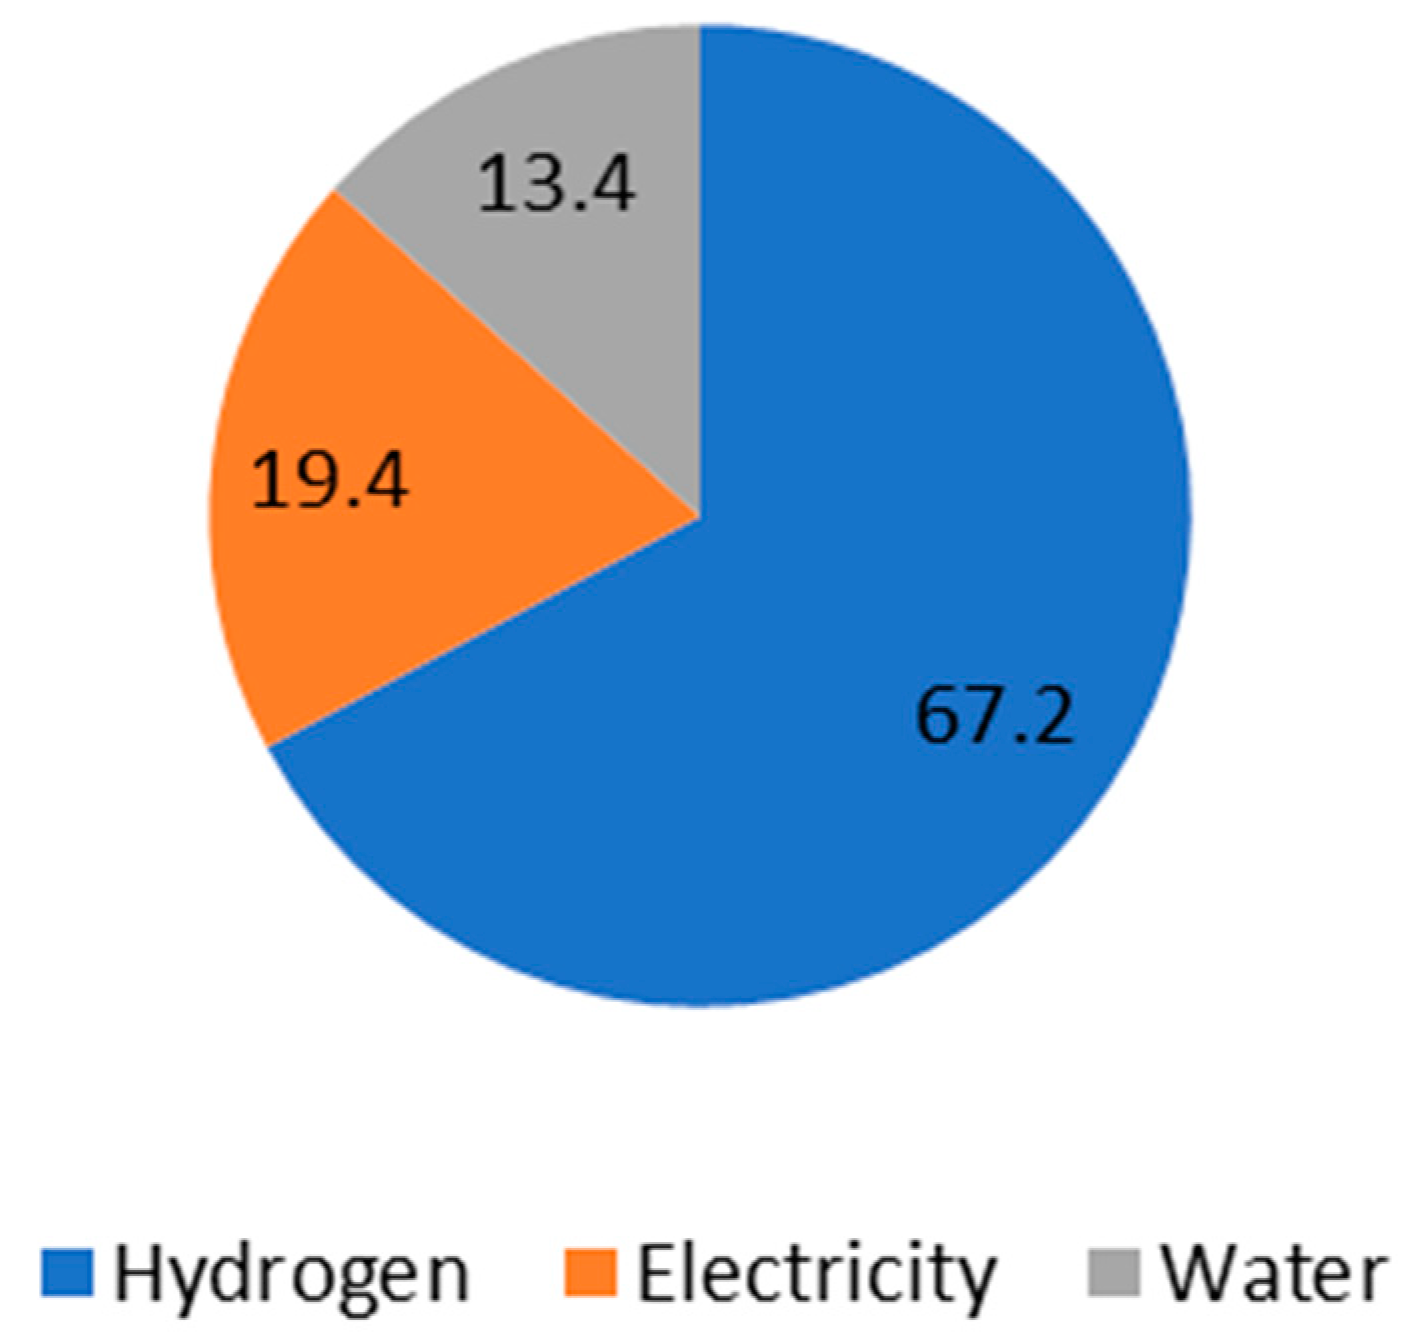
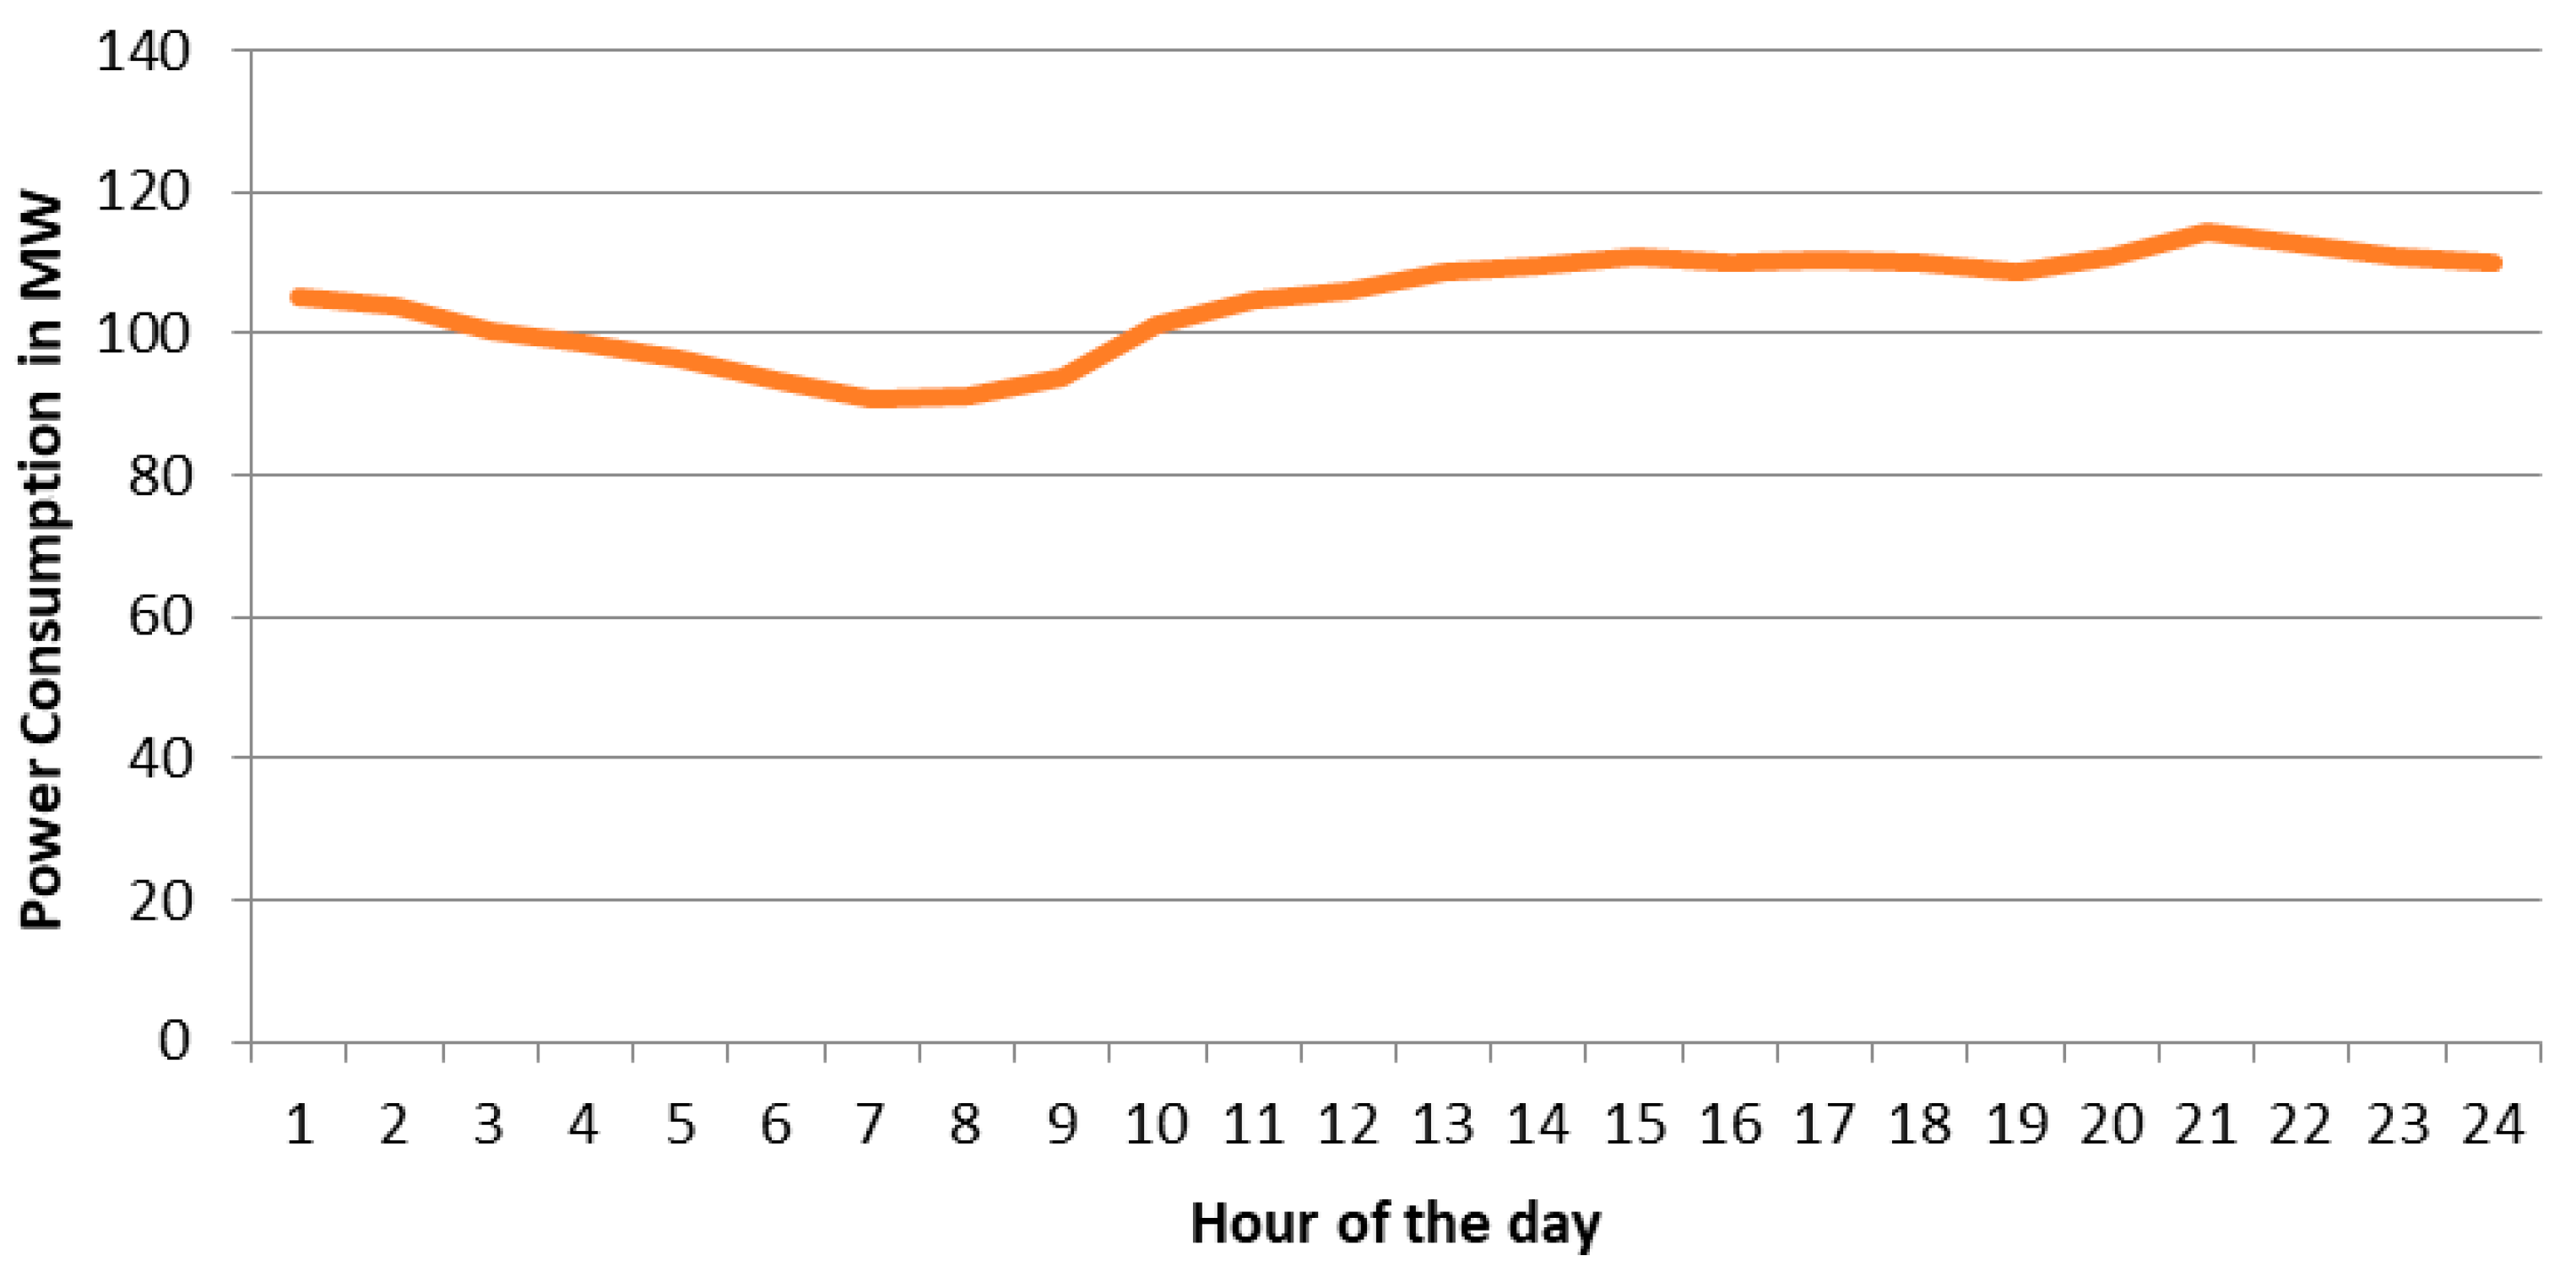
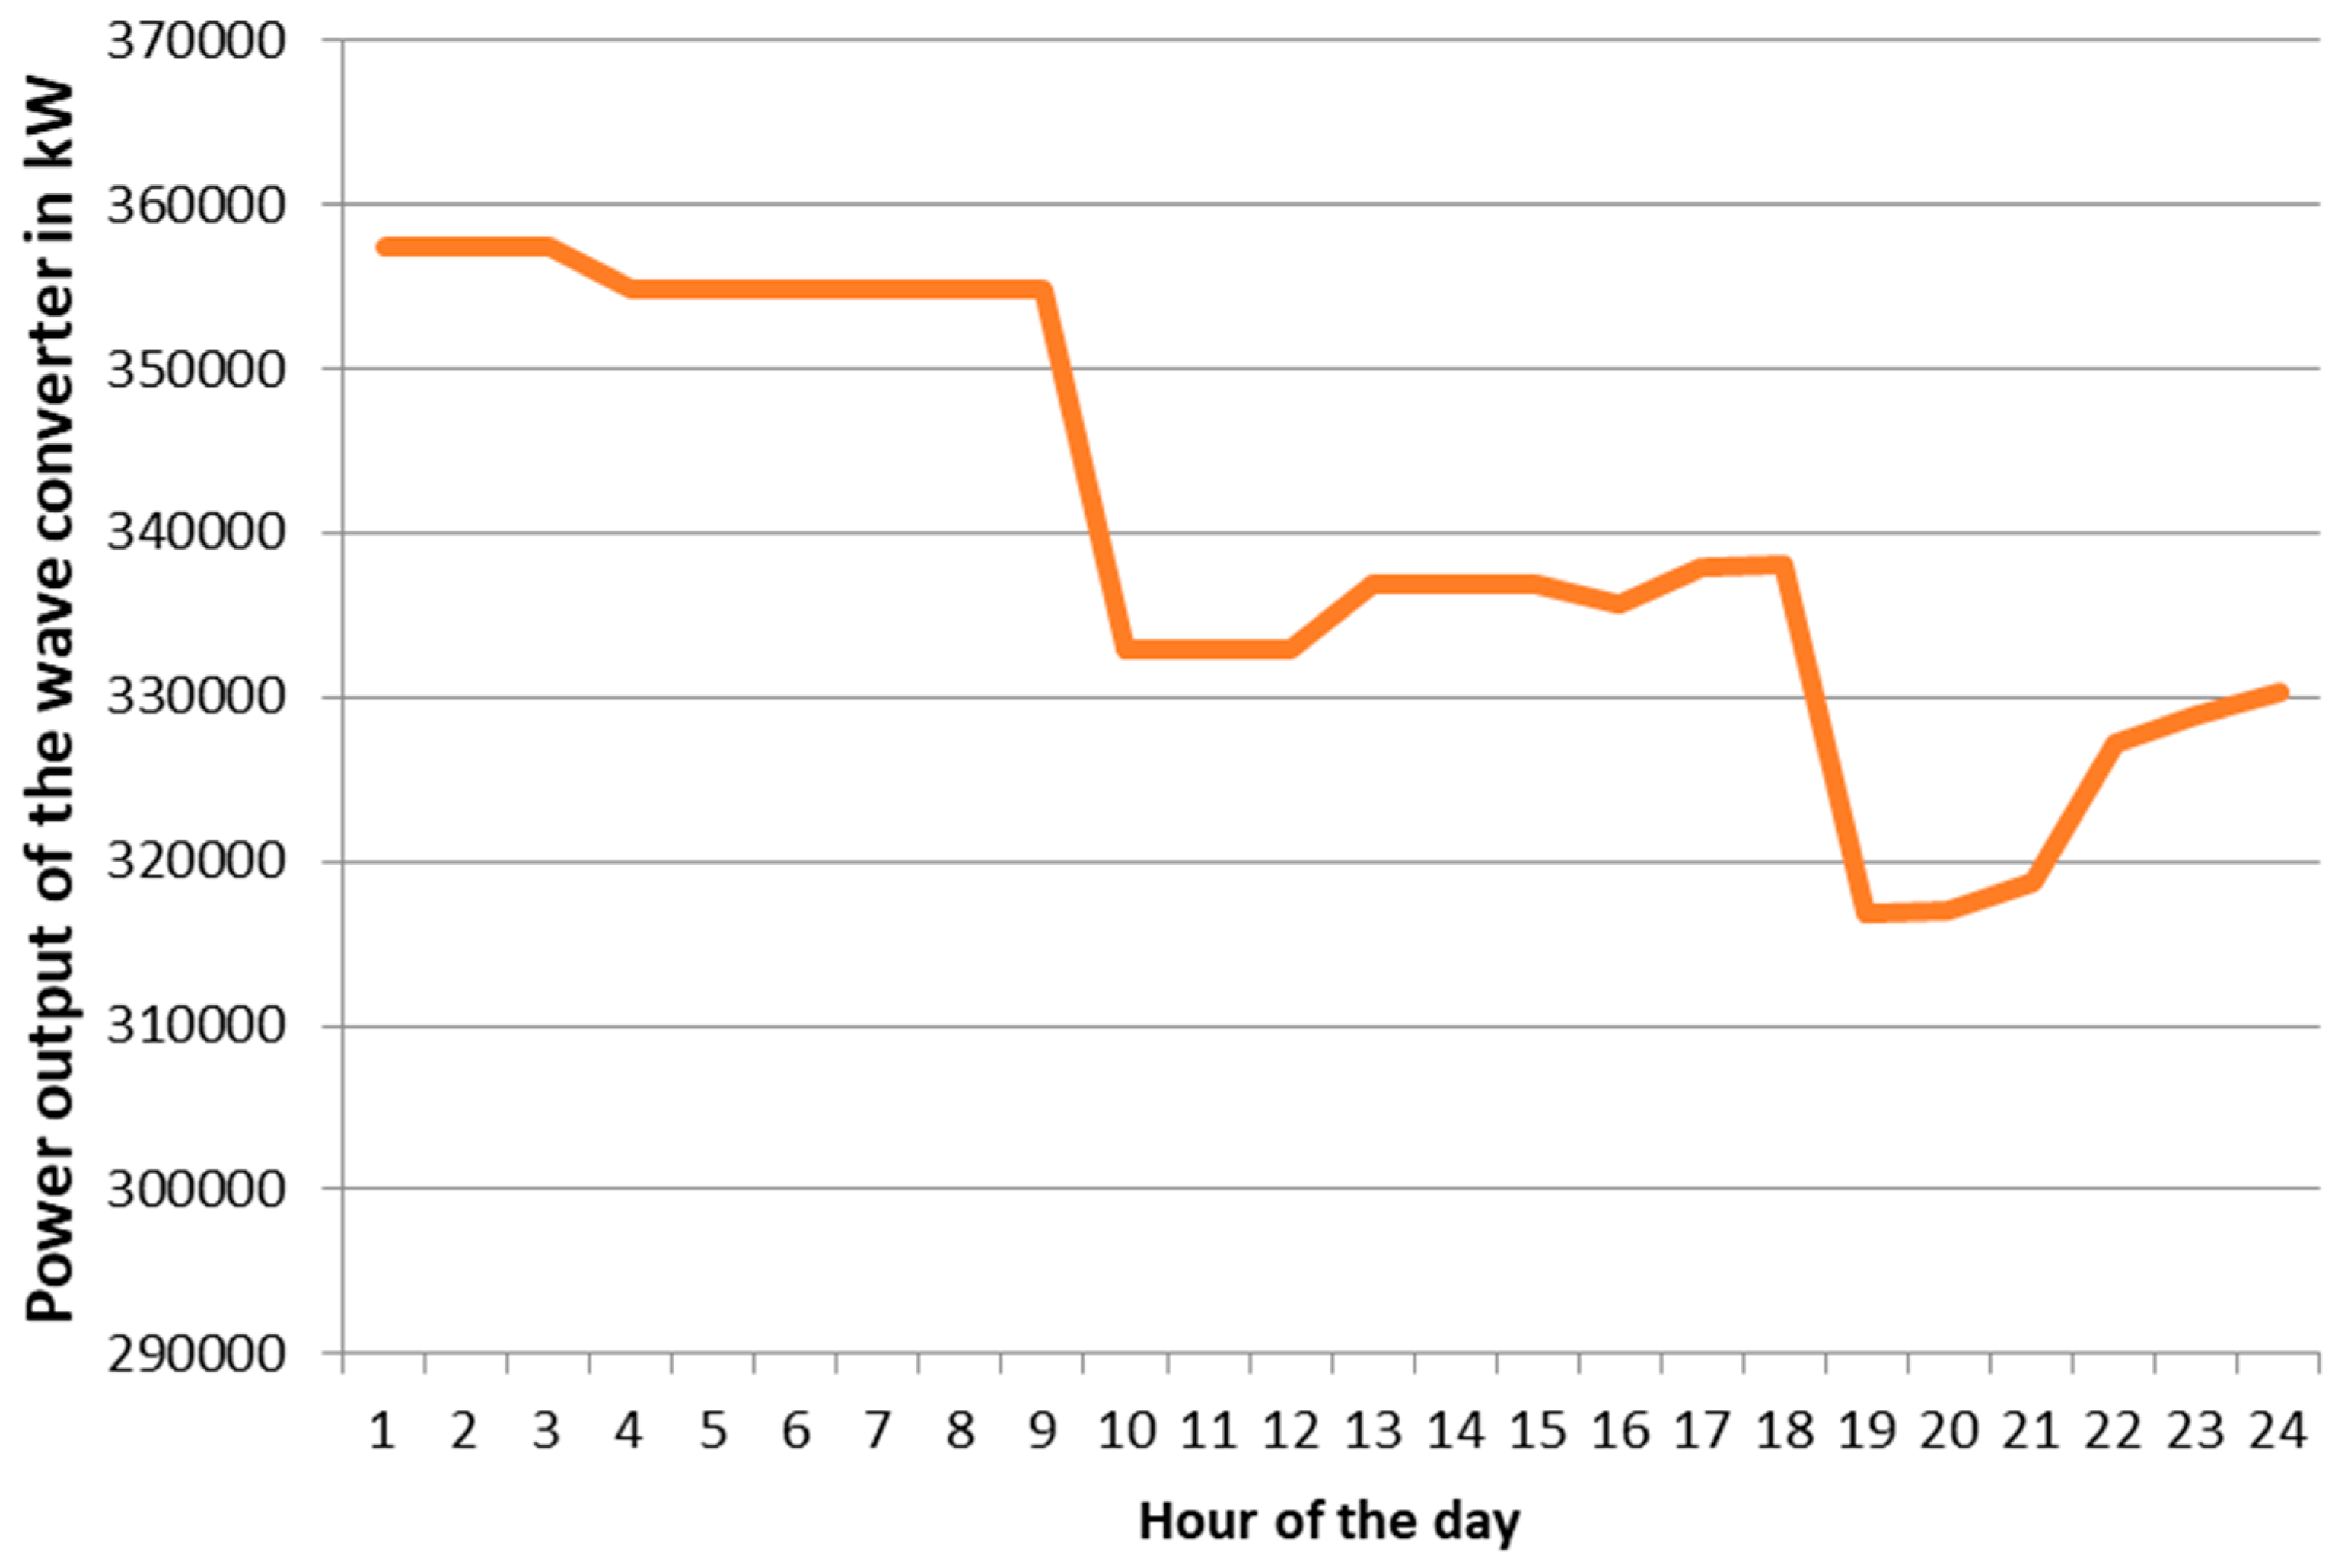
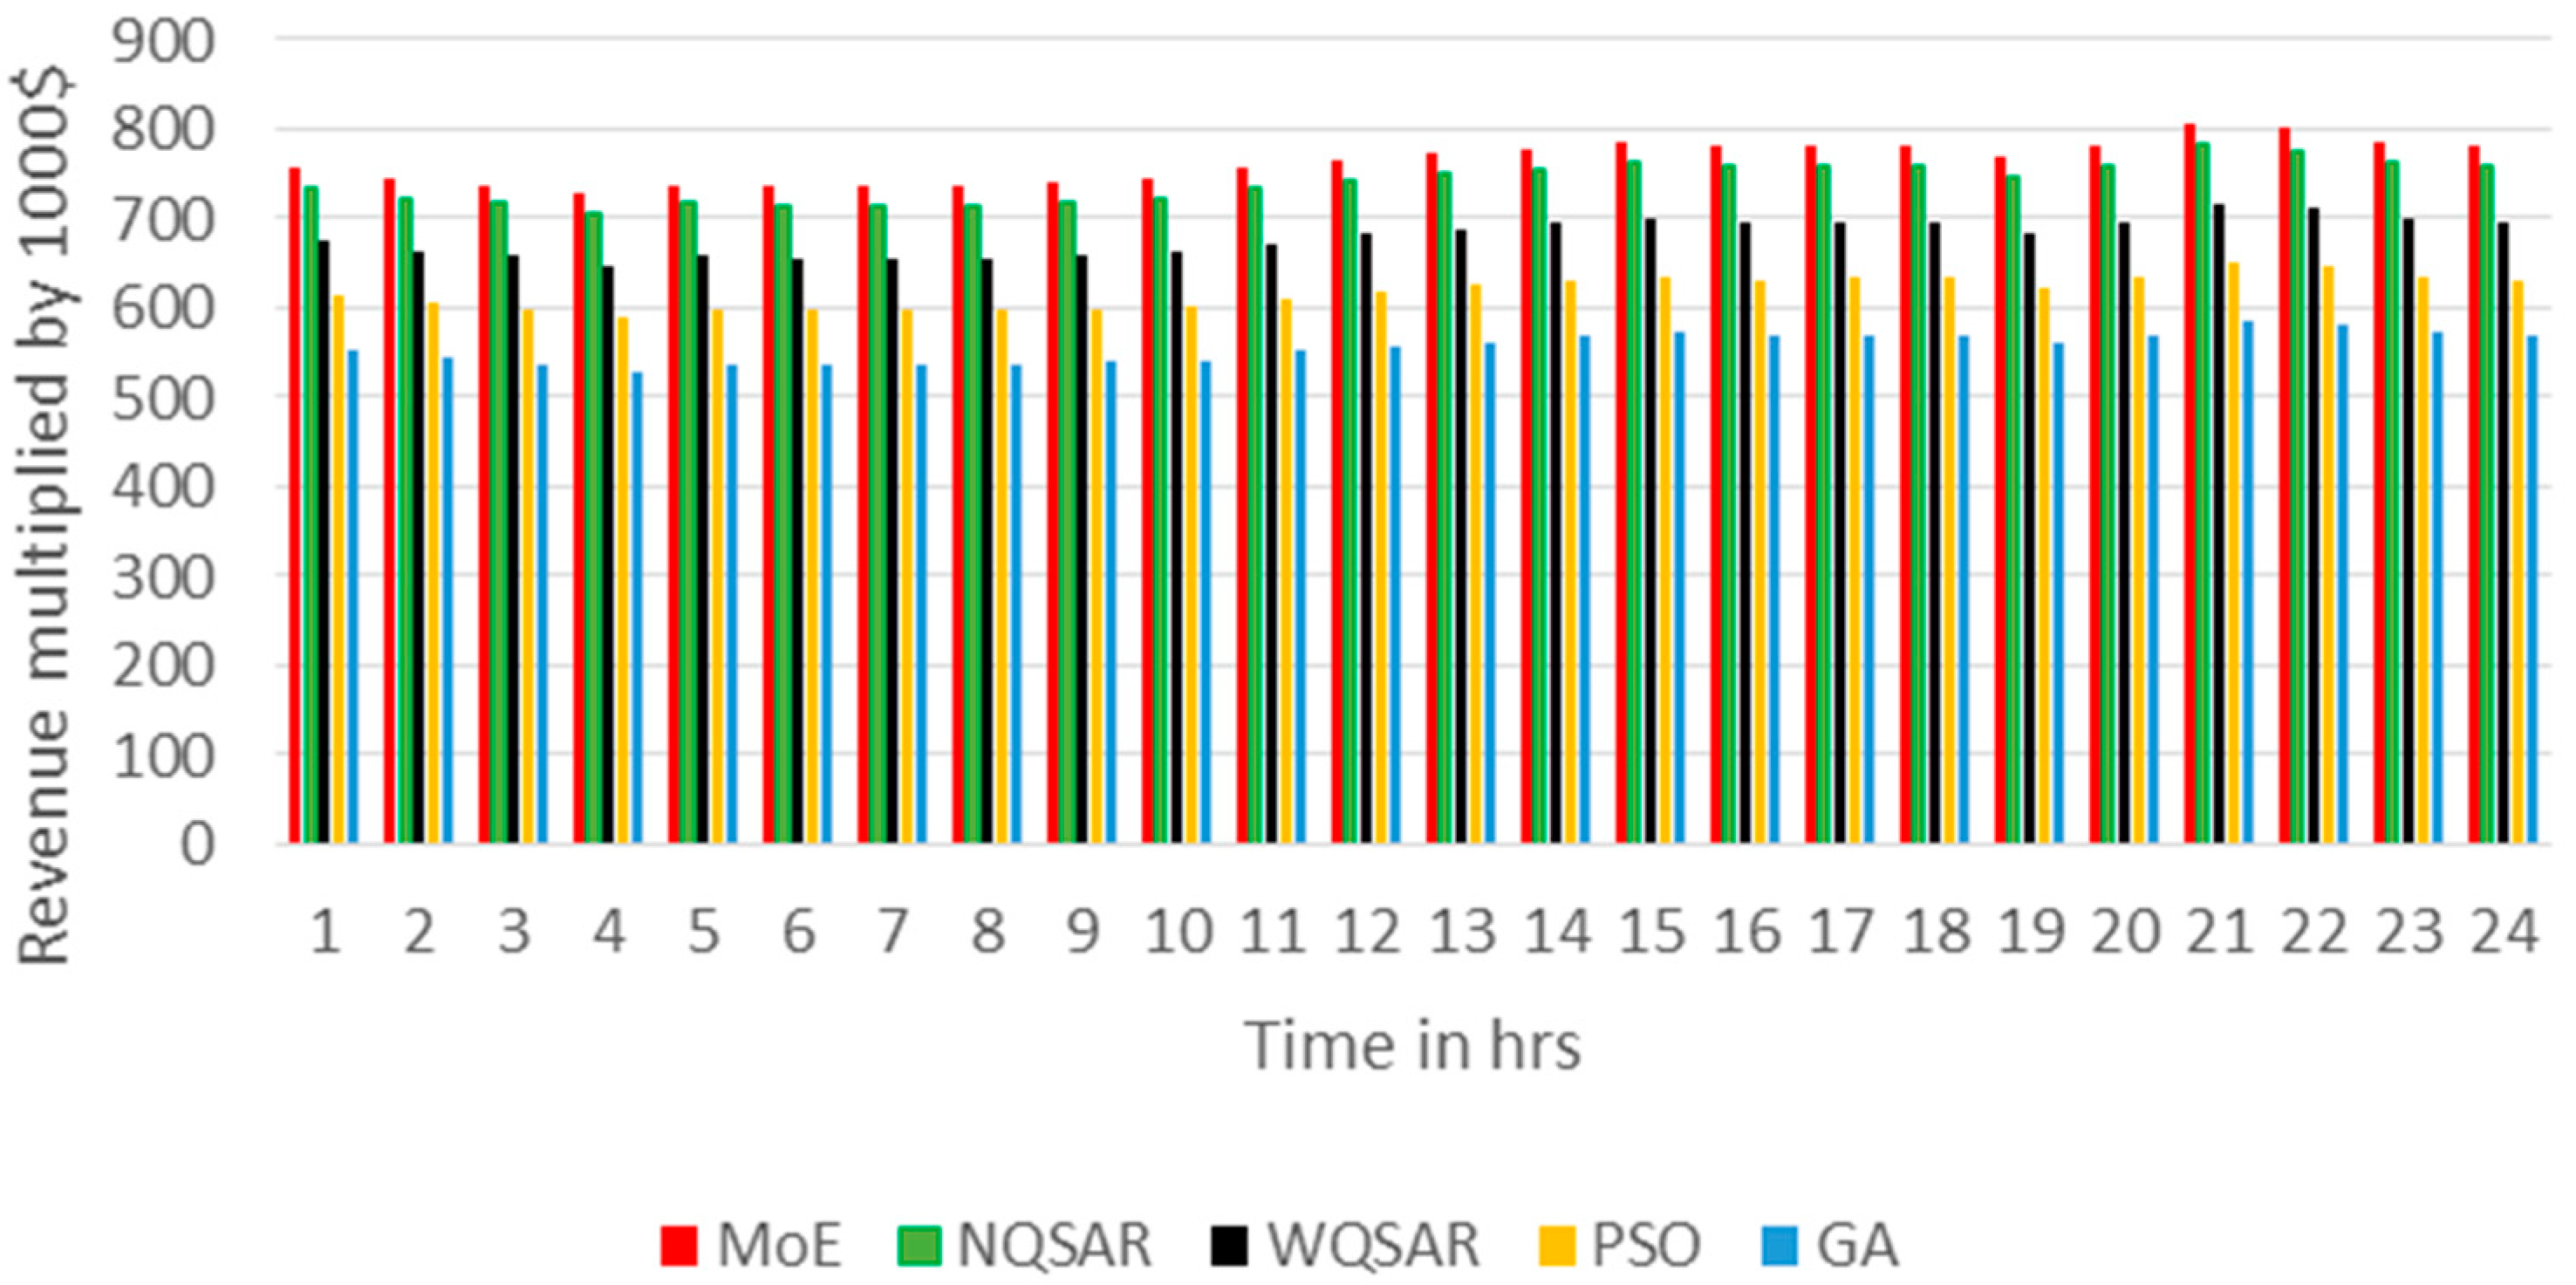
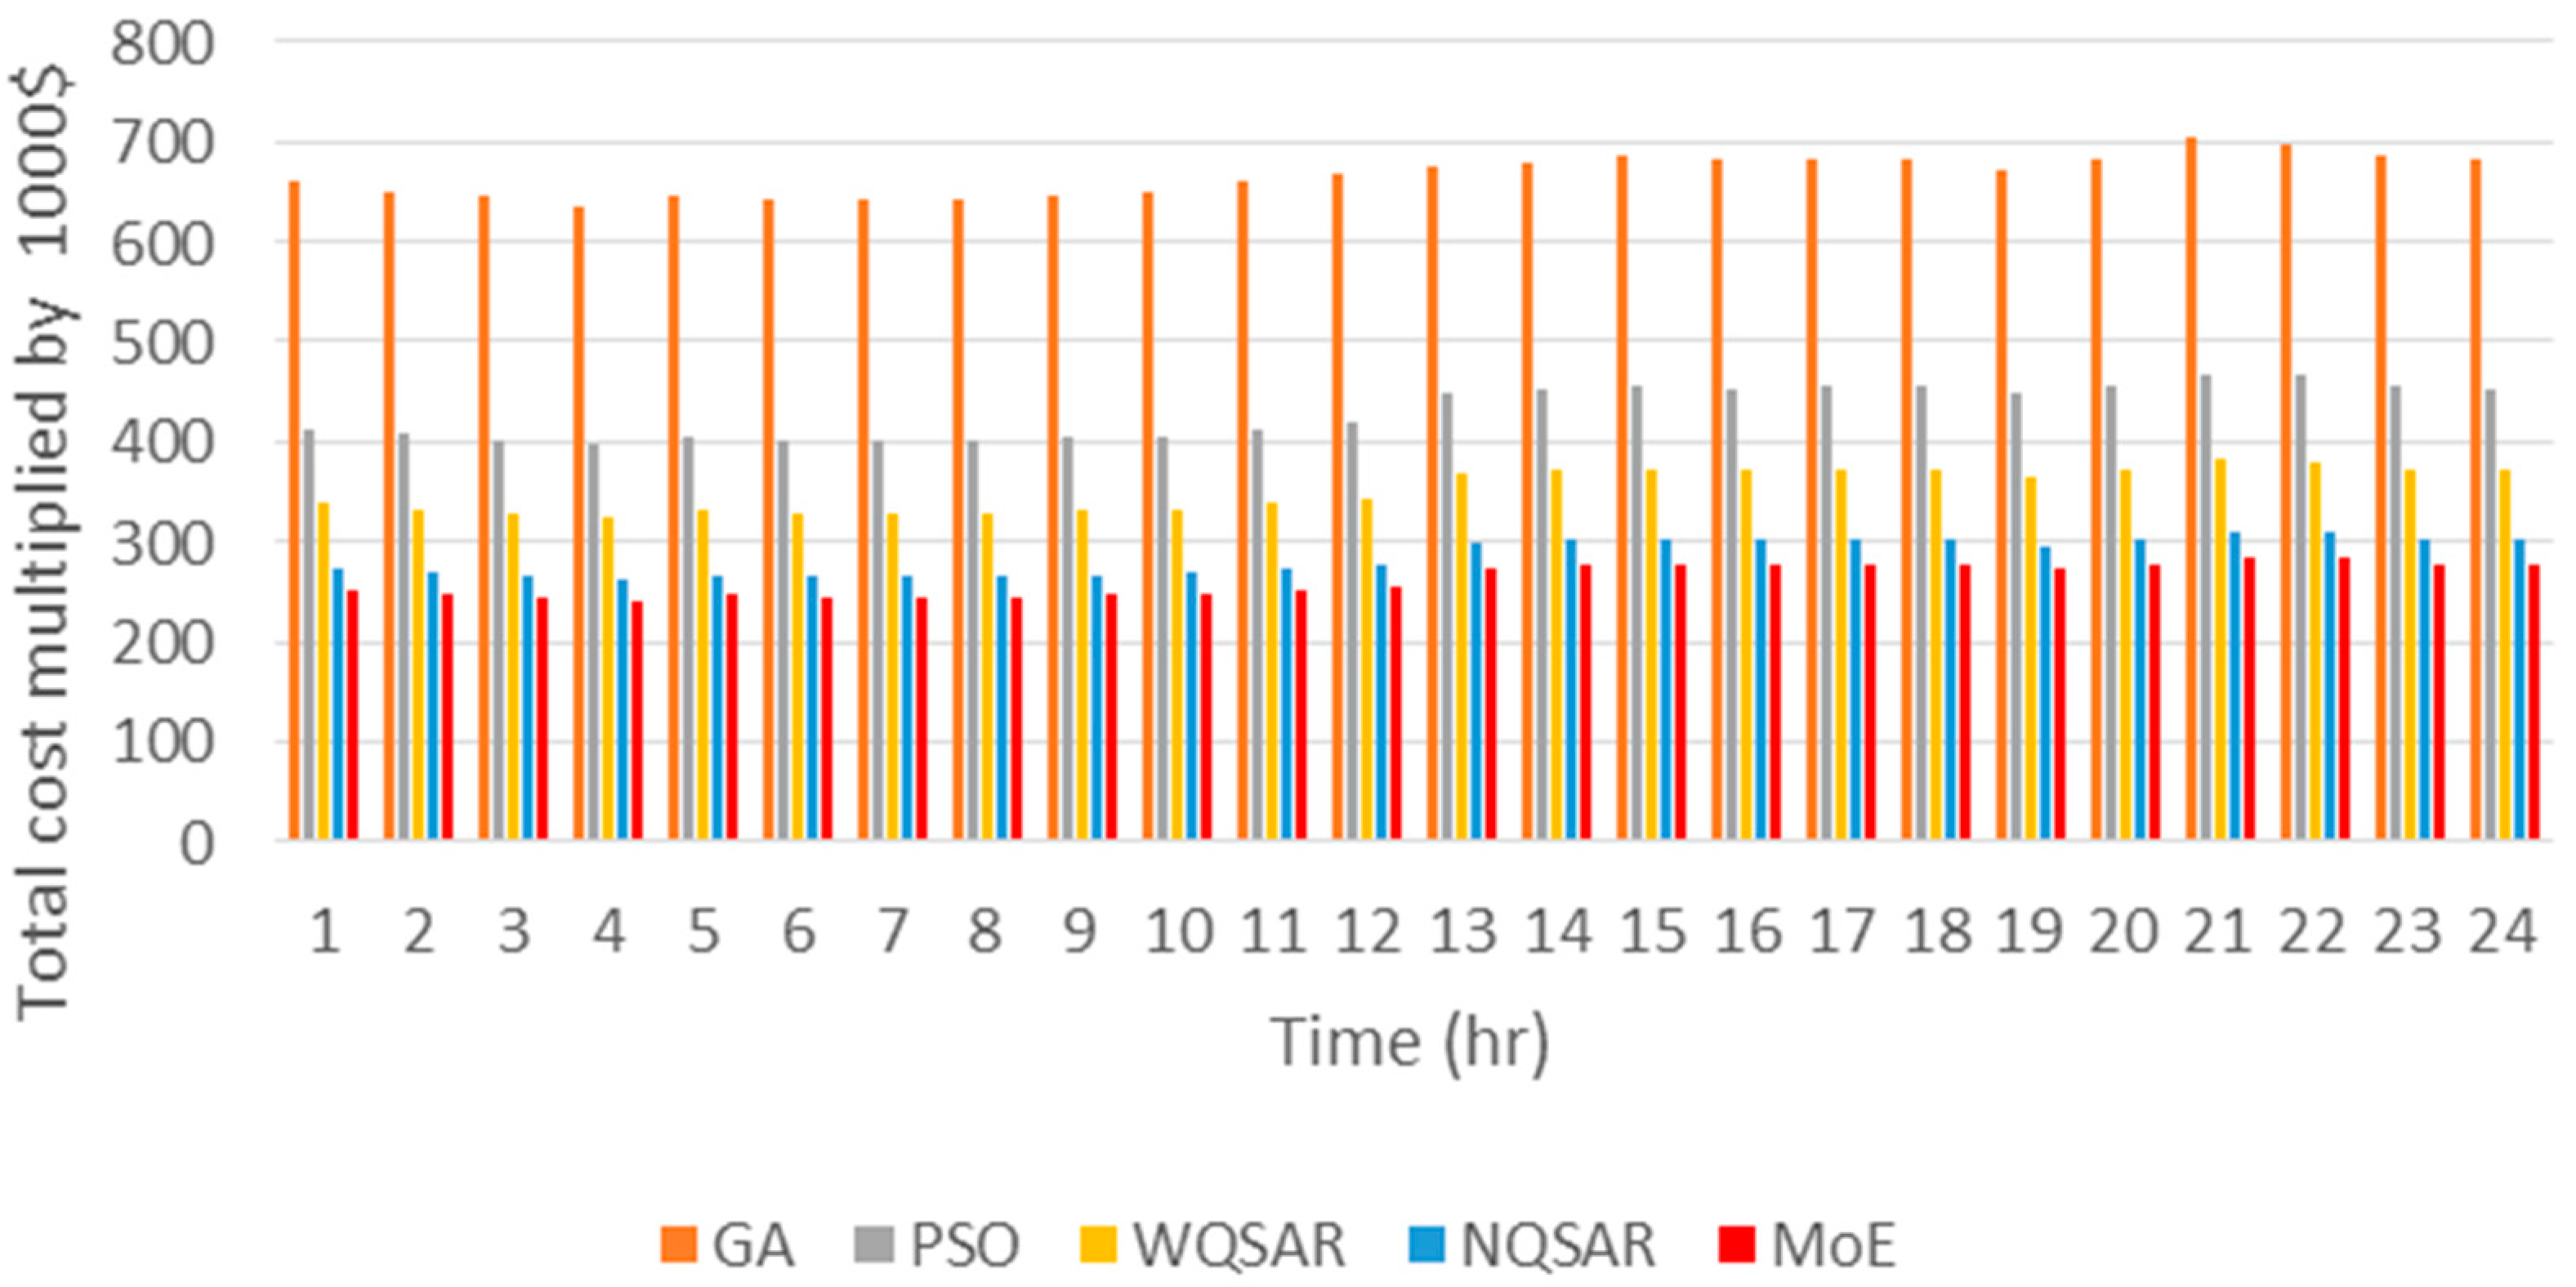
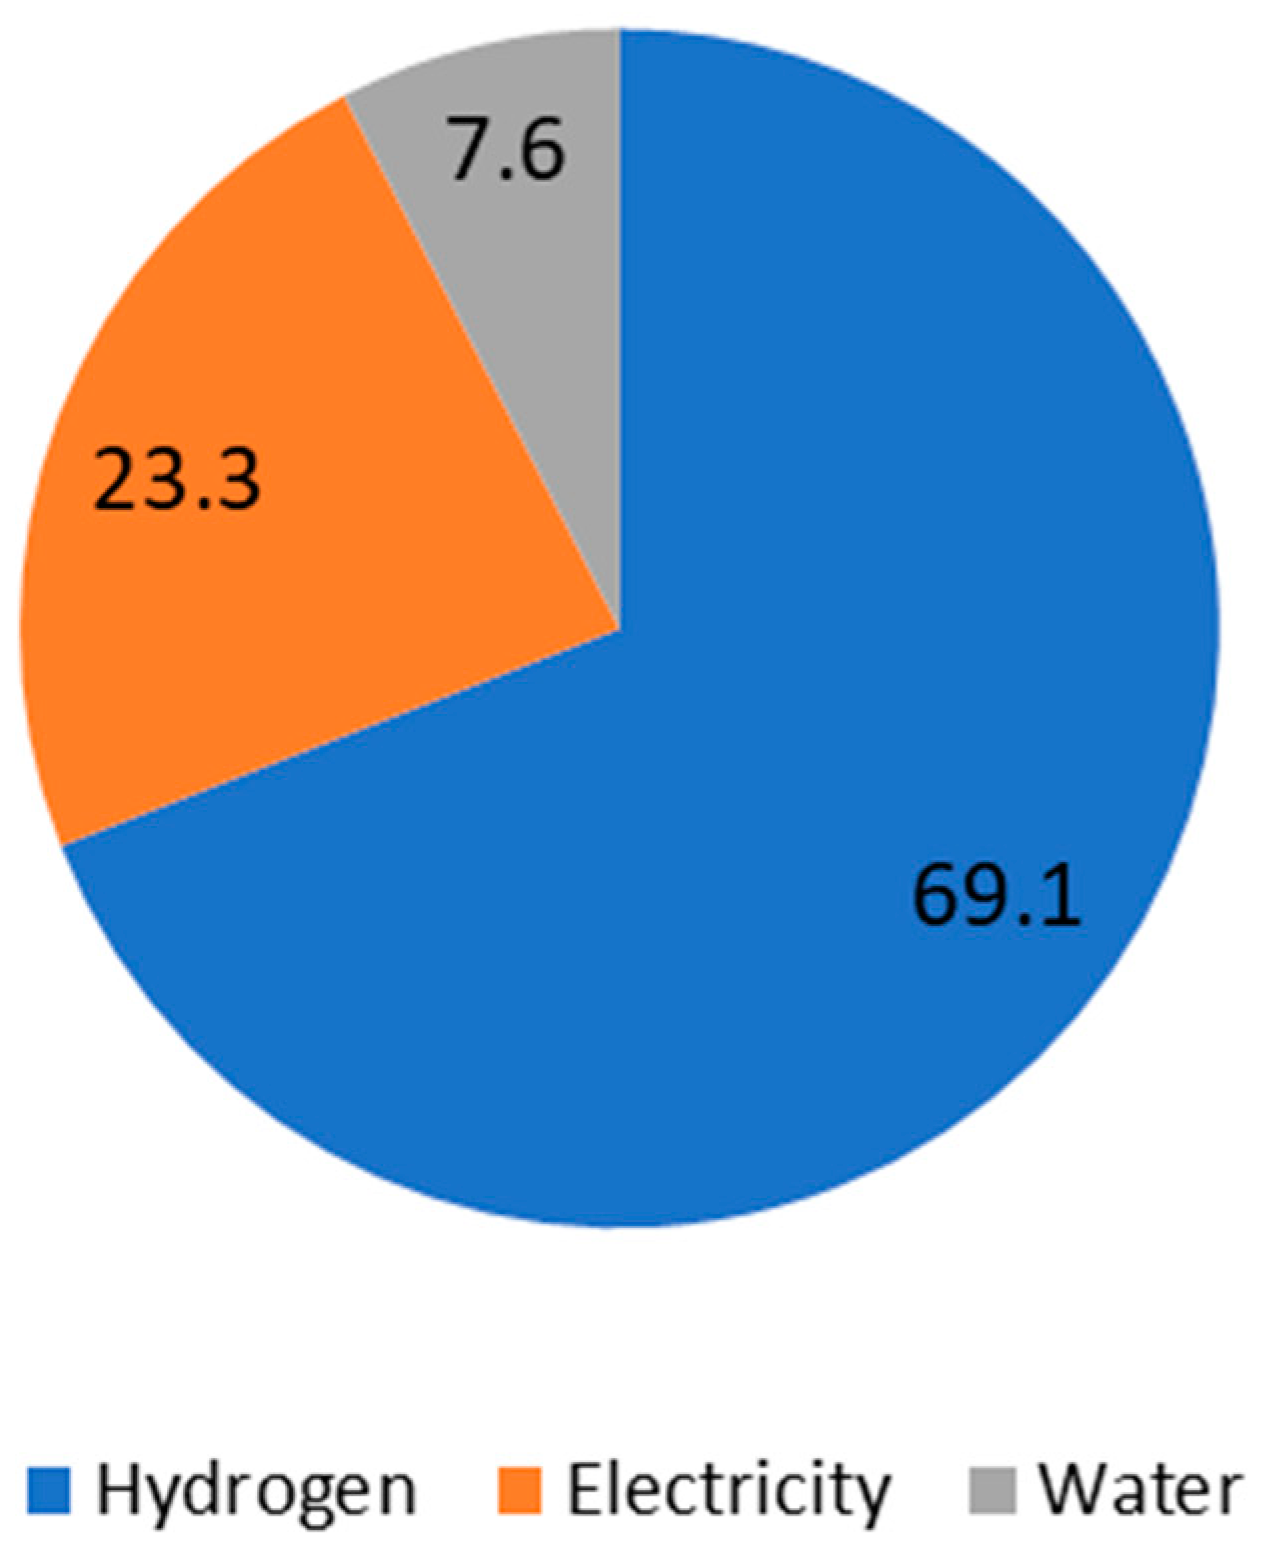
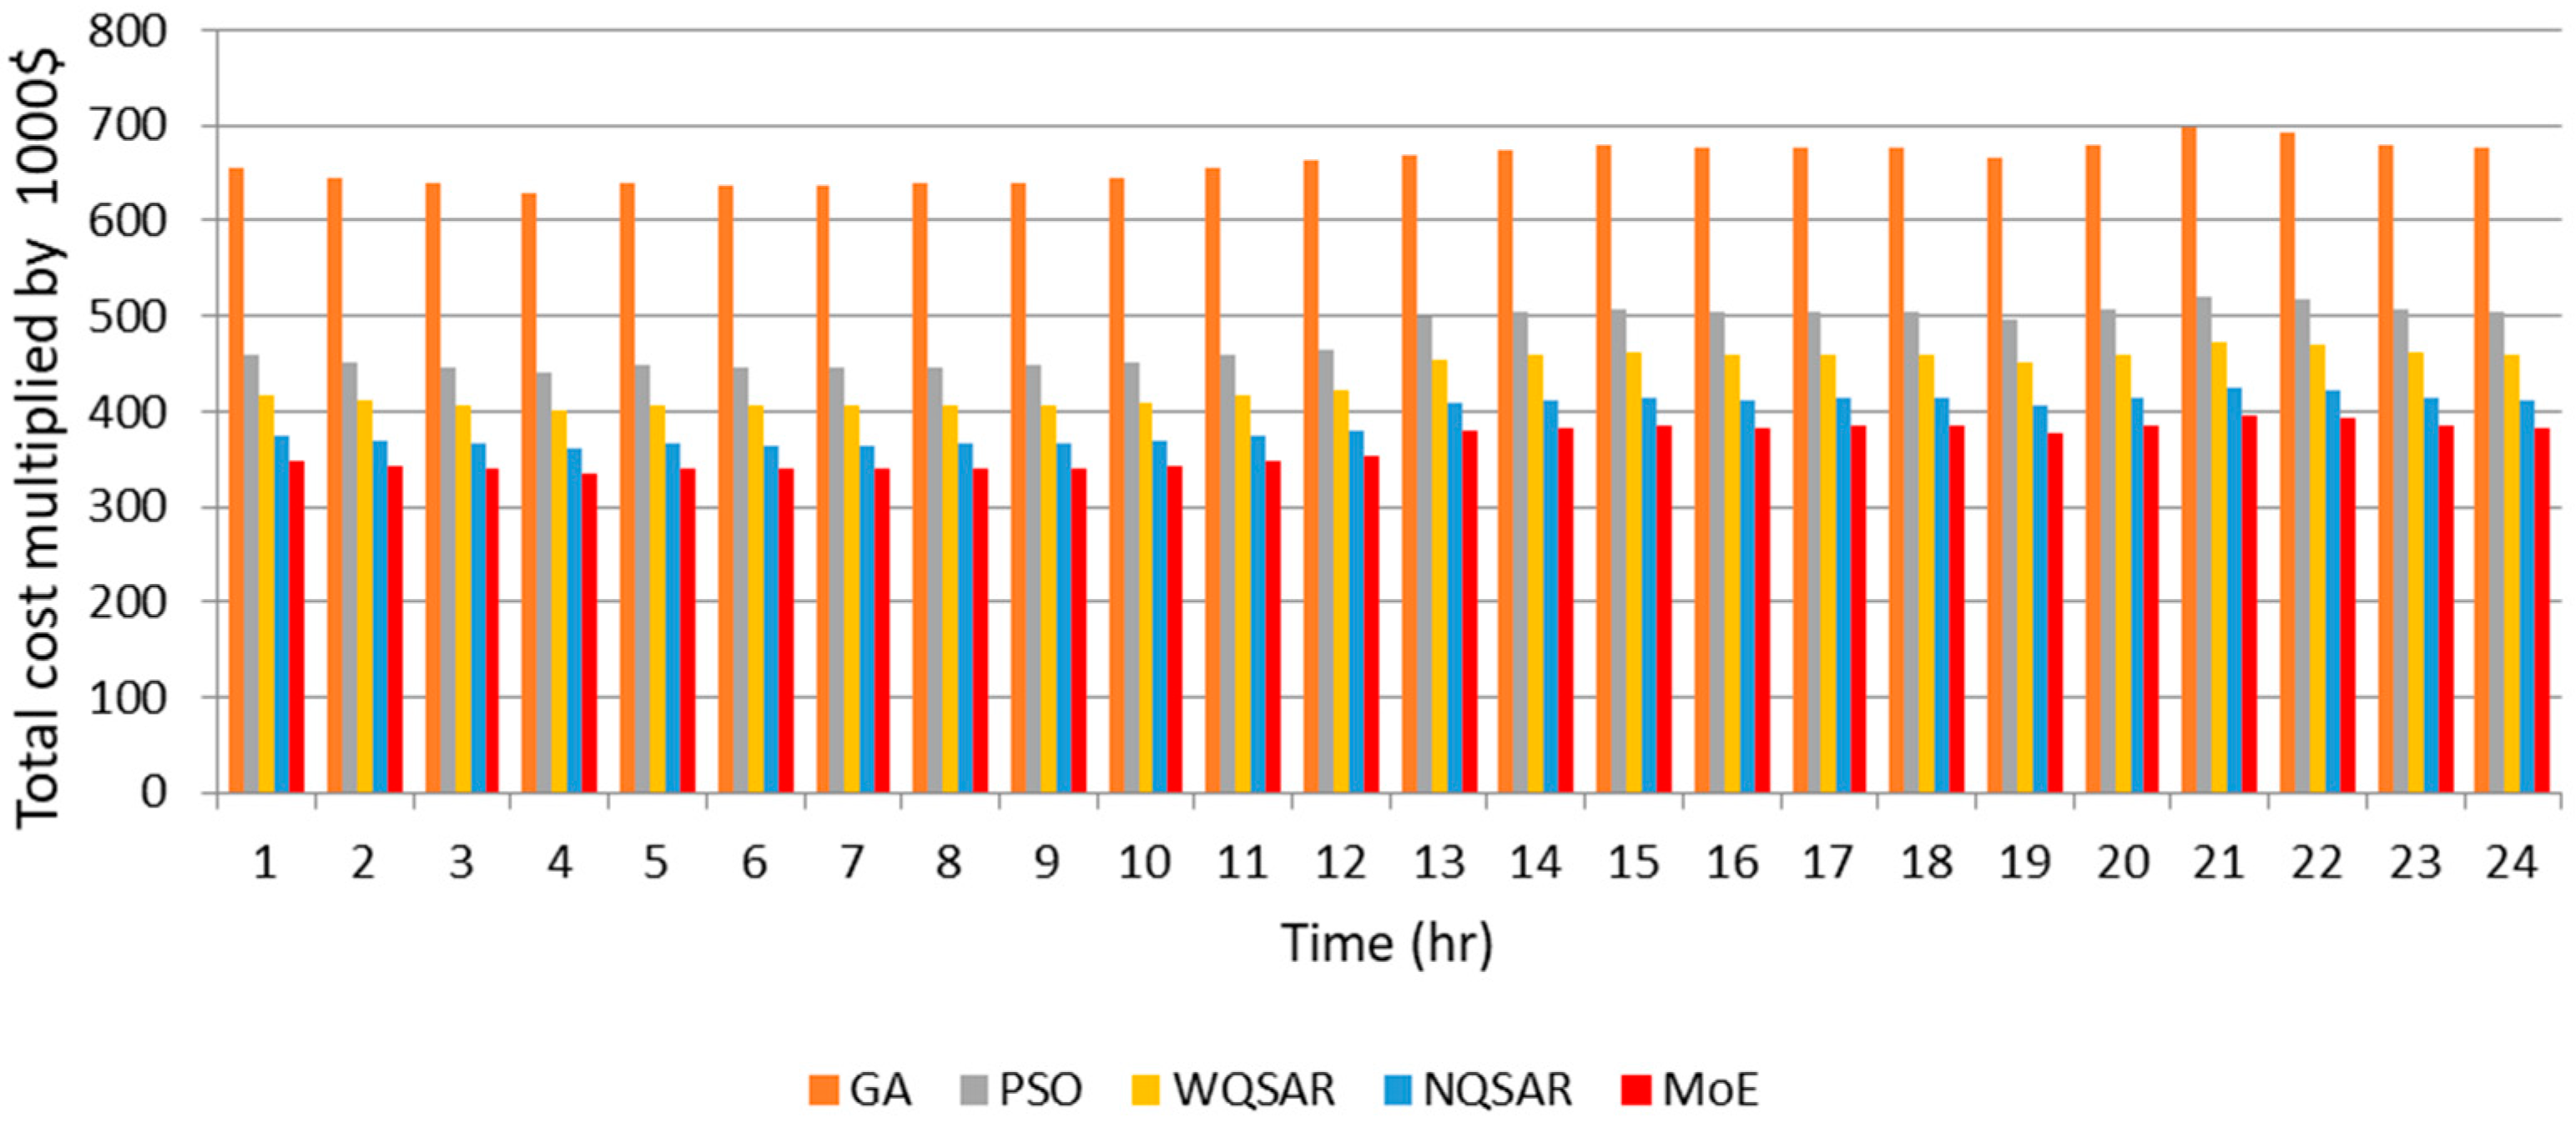
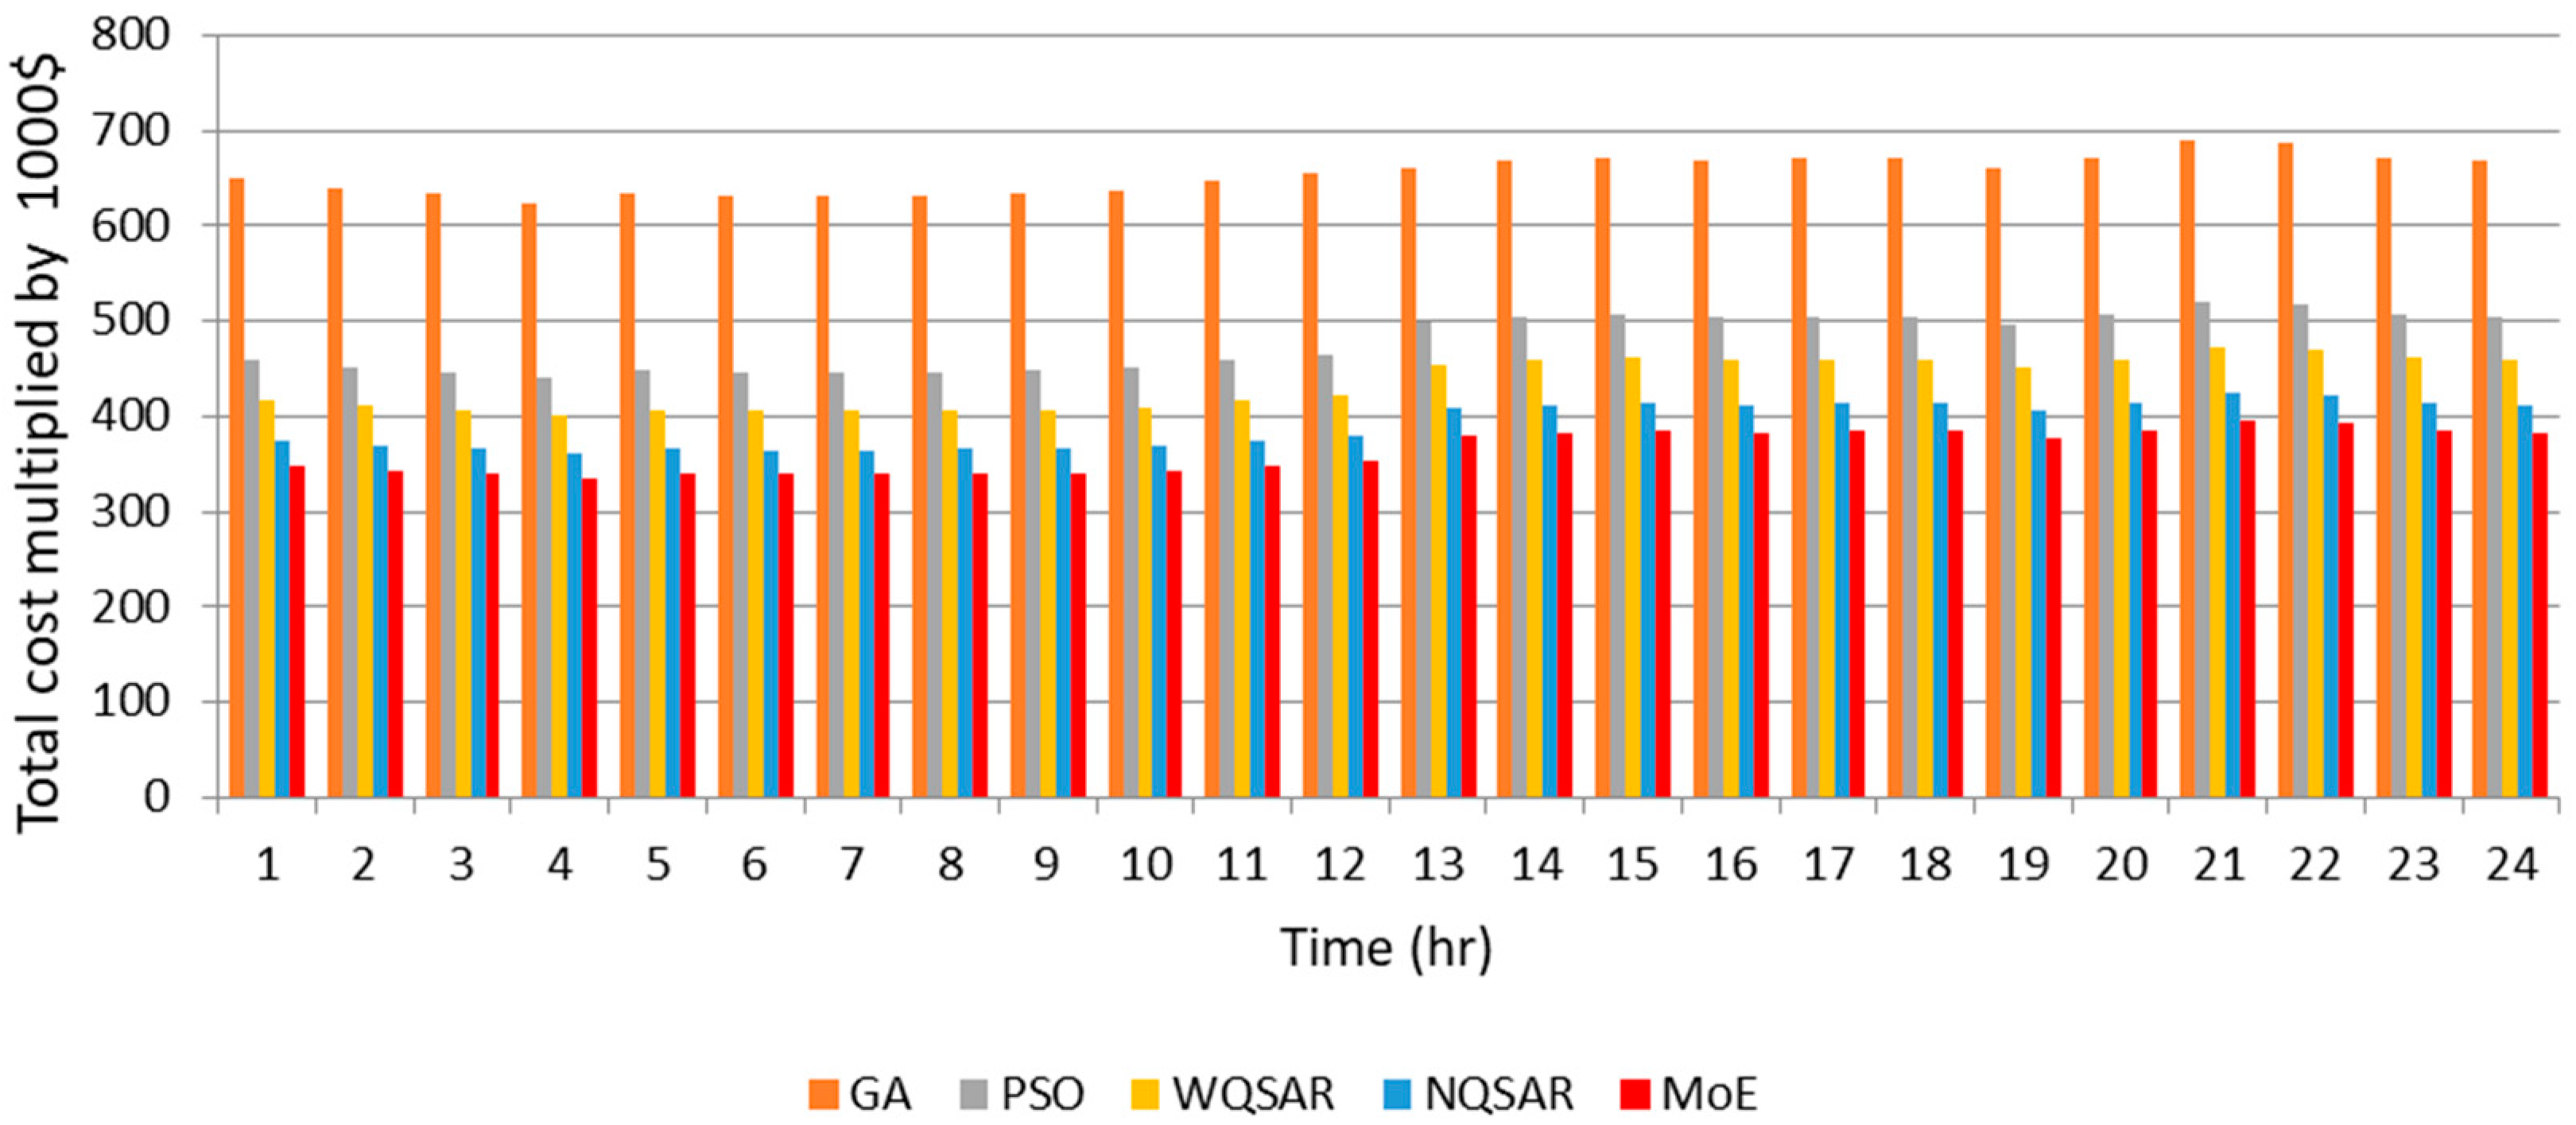
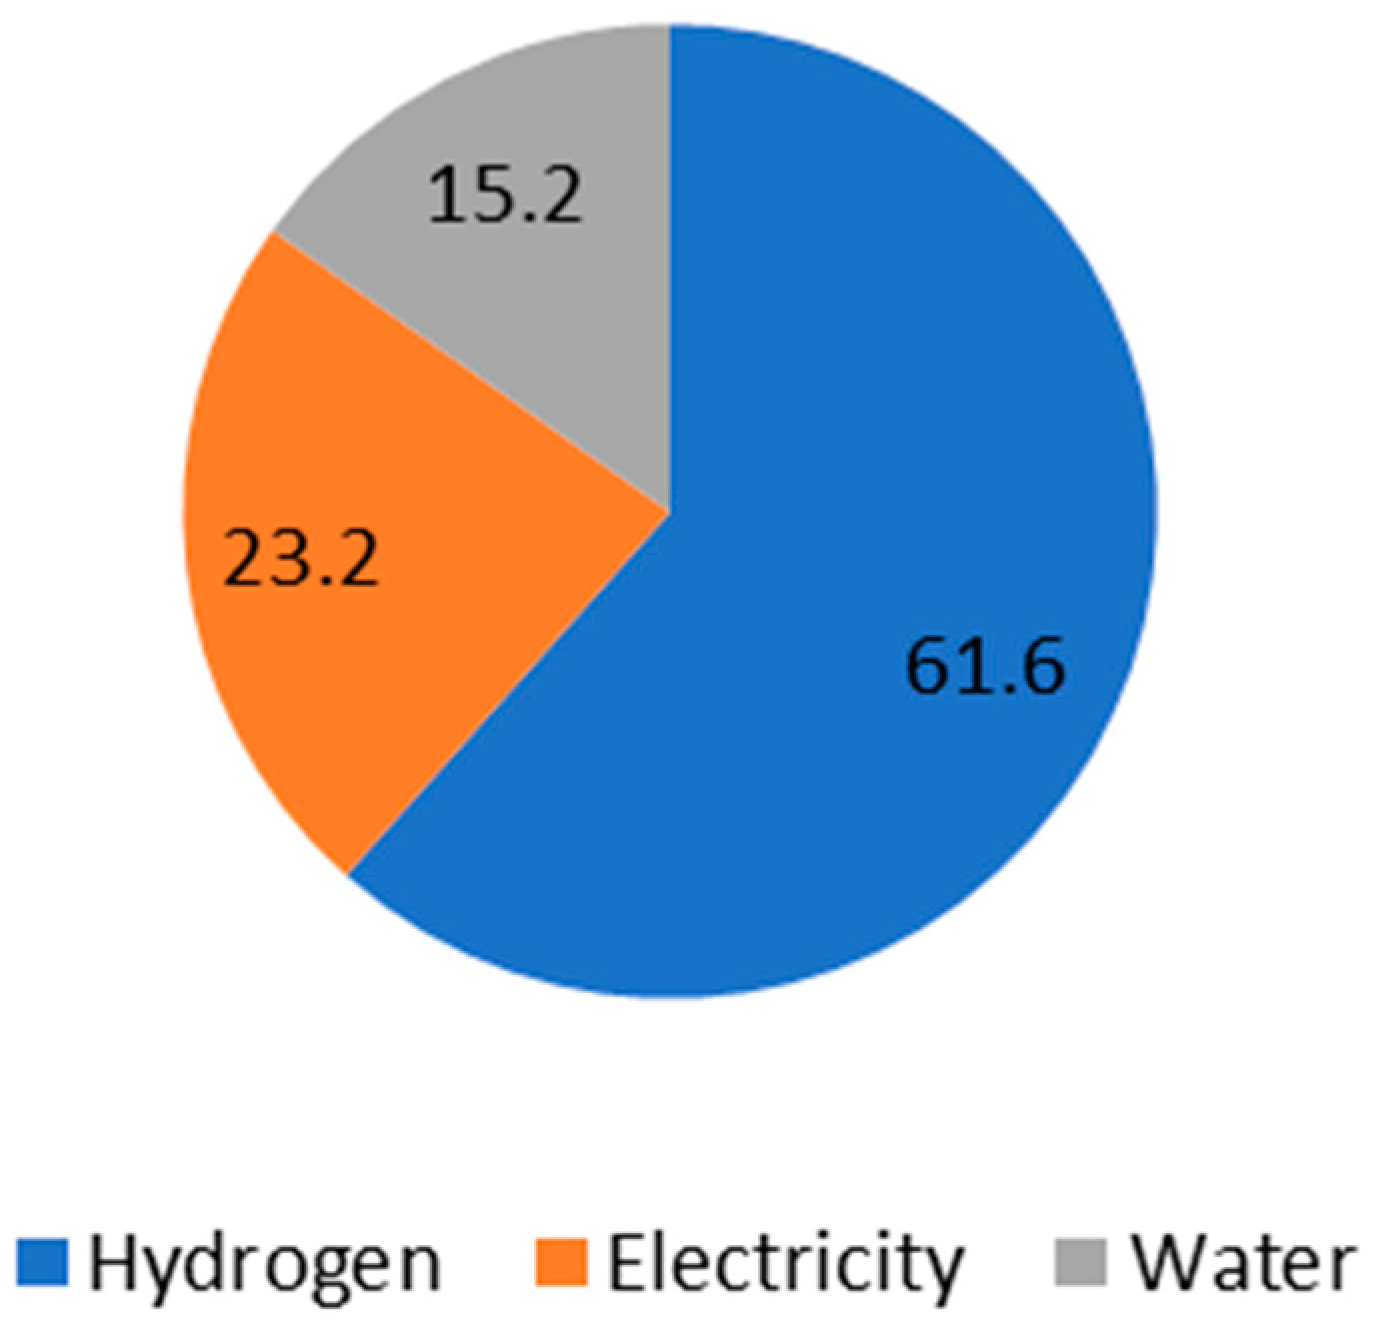
On a typical summer day, the electricity demand peaks, while wave energy production is relatively lower compared to winter. The optimization results indicate that the MoE, followed by the normalized QSAR (NQSAR) and weighting factor QSAR (WQSAR), outperforms Particle Swarm Optimization (PSO) and Genetic Algorithm (GA) in enhancing revenue and reducing operational costs. Notably, hydrogen sales accounted for approximately two-thirds of the total income, underscoring the economic importance of hydrogen production in the microgrid’s operational model.
During a winter day, the electricity demand is approximately 29% lower than in summer, but wave energy production nearly doubles. This seasonal shift enhances the capacity for hydrogen production and storage. The optimization results reaffirm the superiority of the MoE approach, followed by NQSAR and WQSAR, in achieving higher revenue and lower costs. Hydrogen sales contributed an even higher share of the income at approximately 70%, highlighting the critical role of hydrogen as a revenue driver during periods of high wave energy production.
Spring and fall days exhibit intermediate characteristics between summer and winter. In spring, electricity demand is 12% lower than in summer, and wave energy production is about 10% lower than in winter. Similarly, in fall, electricity demand is 11% lower than in summer, and wave energy production is 14% lower than in winter. In both cases, the MoE optimization technique consistently delivered the best results in terms of revenue generation and cost reduction, followed by NQSAR and WQSAR. Hydrogen sales accounted for approximately 65% and 60% of the total income in spring and fall, respectively, with electricity sales contributing a smaller but significant portion (22% in spring and 24% in fall).
These findings emphasize the effectiveness of advanced optimization techniques like MoE in adapting to seasonal variations in demand and resource availability. The consistent superiority of the MoE approach across all seasons demonstrates its robustness and adaptability in optimizing microgrid operations under diverse conditions. Compared to prior studies that primarily focused on singular optimization techniques, this study highlights the advantages of integrating quantum-inspired algorithms in managing complex energy systems. For instance, while traditional methods like PSO and GA are widely used, their performance in this study was outpaced by the MoE and QSAR approaches, particularly in balancing cost efficiency and revenue generation.
The economic viability of the system is further supported by the high contribution of hydrogen sales to total income, which aligns with the growing global interest in hydrogen as a clean energy carrier. The integration of hydrogen production systems into the microgrid provides not only a means for addressing seasonal energy storage needs but also a pathway for monetizing excess wave energy during periods of low electricity demand. These results are consistent with findings in recent renewable energy studies, reinforcing the critical role of hydrogen in future energy systems.
Despite these strengths, some limitations should be noted. The study assumes fixed costs for hydrogen and electricity, which may not reflect real-time market fluctuations. Additionally, while the system’s capacity factor (26.2%) is promising, further research is needed to explore the long-term impacts of wave energy variability on operational stability. Future work should also investigate the potential of combining wave energy with other renewable resources, such as marine geothermal energy, to further enhance system resilience and scalability. Furthermore, policy support and economic incentives will play a pivotal role in scaling up such systems for broader adoption.
In this study, the MoE approach was selected over other optimization techniques, such as QSAR, GA, and PSO, due to its superior adaptability, performance, and interpretability in handling the specific challenges of our application. Unlike QSAR, which is primarily effective for linear relationships, MoE excels in capturing non-linear patterns by partitioning the problem space and assigning specialized models (experts) to distinct regions. While GA and PSO are powerful optimization tools, they often suffer from computational inefficiency and suboptimal convergence in high-dimensional spaces. In contrast, MoE leverages a gating network to dynamically allocate resources to the most relevant experts, resulting in faster and more accurate optimization. Additionally, MoE offers enhanced interpretability, as the contributions of individual experts and the gating network can be analyzed to understand their roles in the final solution—a critical advantage in our application. Furthermore, MoE demonstrates greater robustness to noisy data compared to QSAR, GA, and PSO, as the gating network can effectively filter out irrelevant or noisy inputs by assigning low weights to less reliable experts. These attributes collectively justify the selection of MoE as the preferred approach for this study.
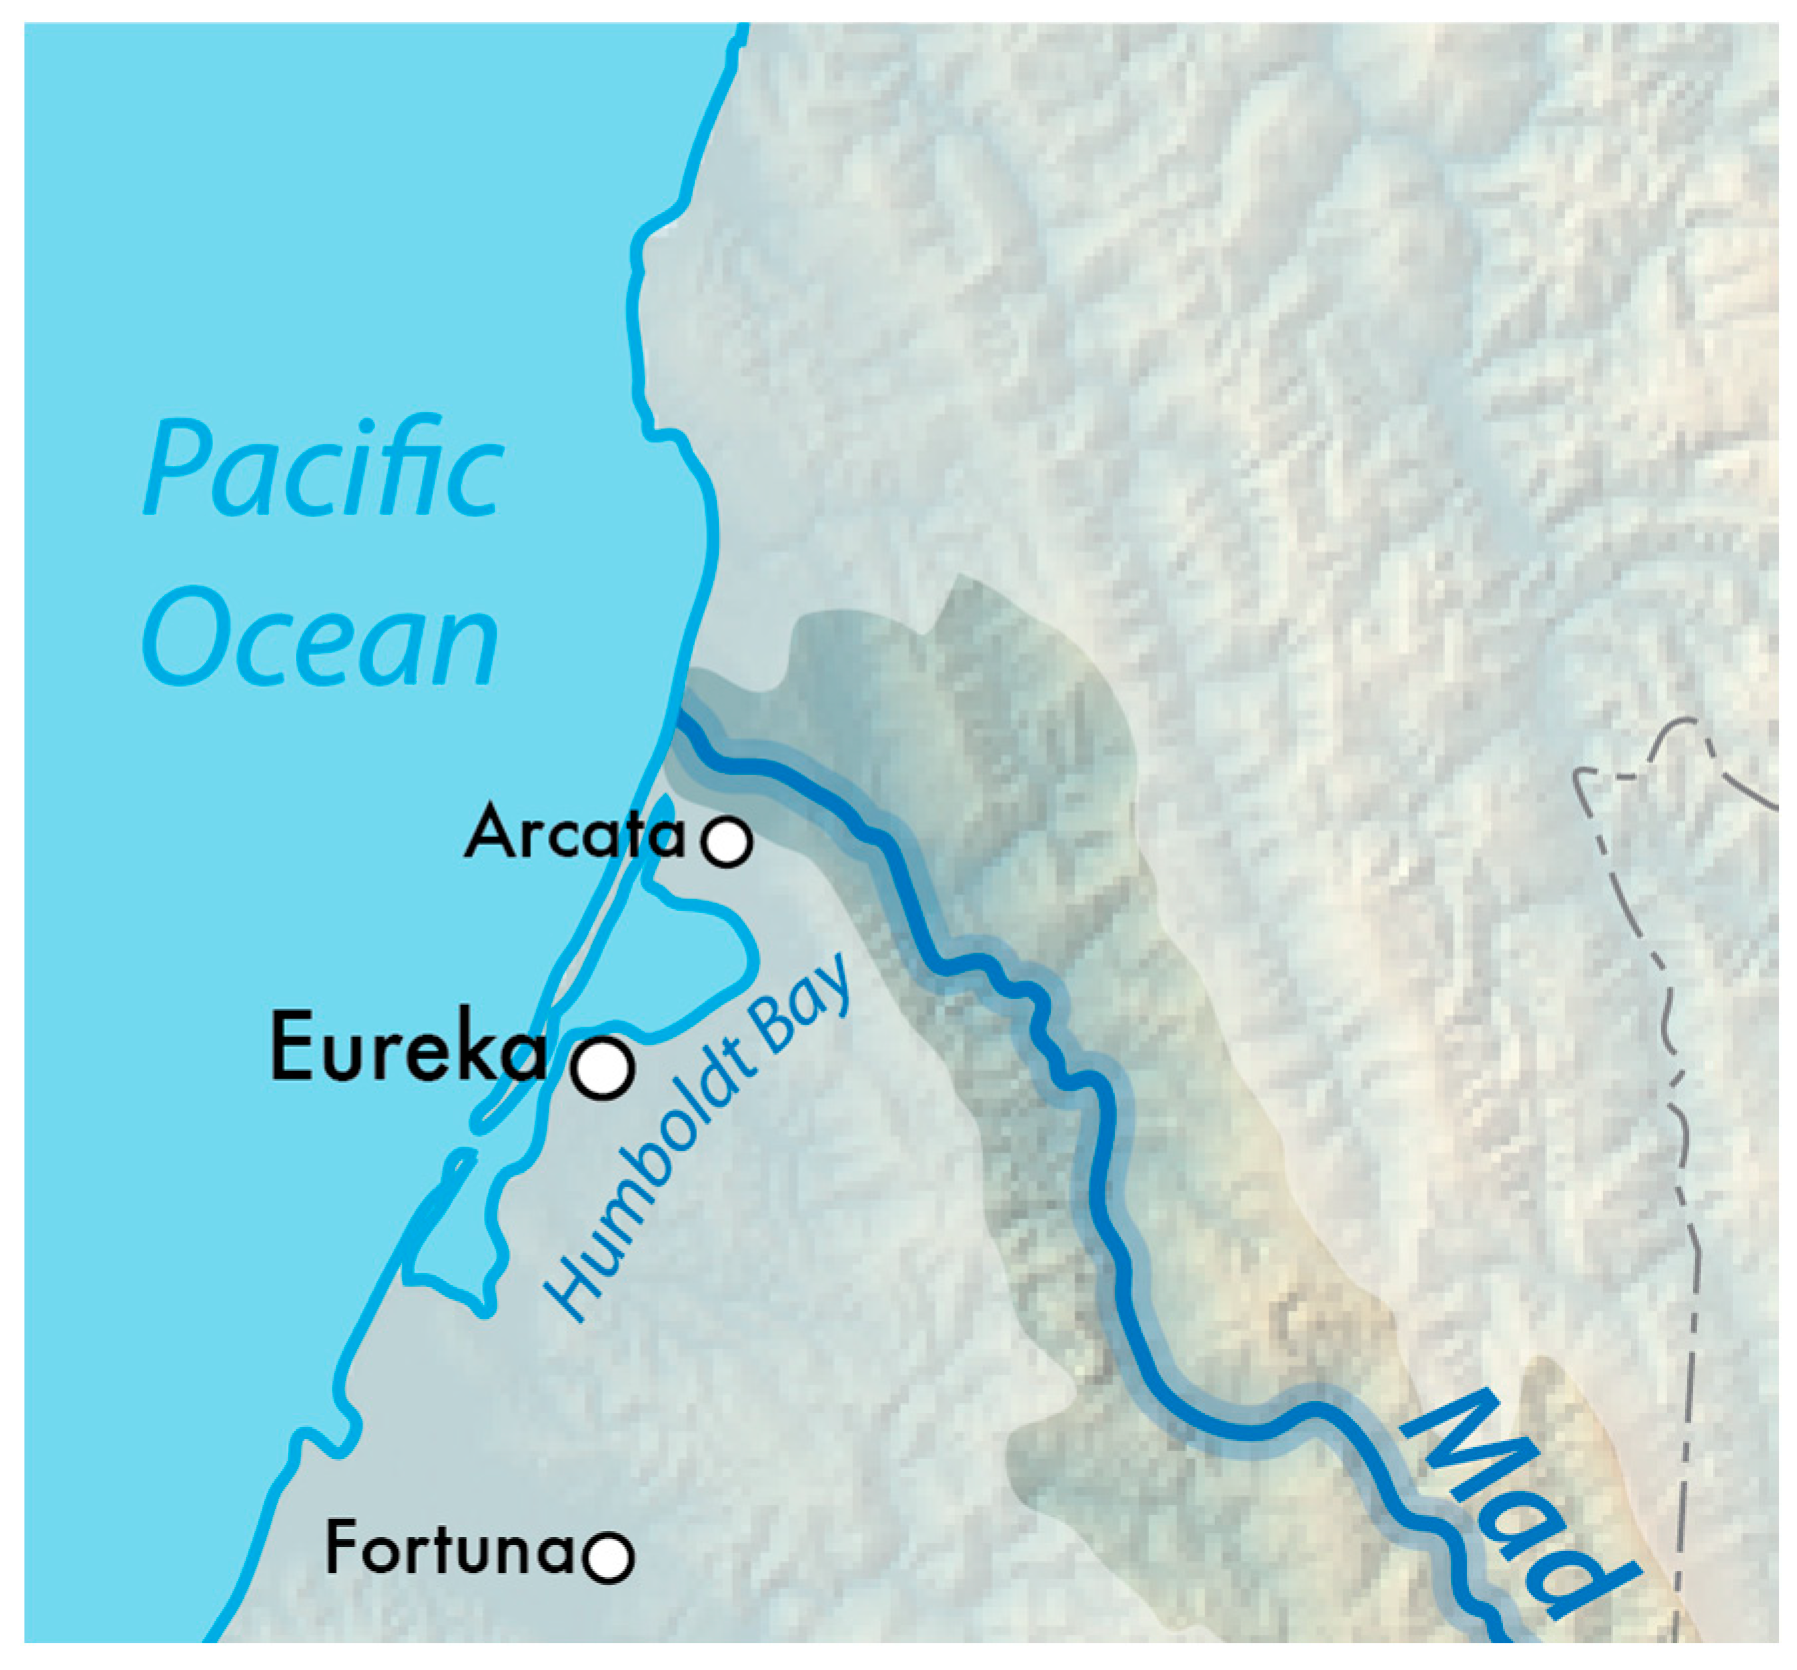
To assess the impact of market fluctuations on the feasibility of wave-to-hydrogen production in Humboldt Bay, a sensitivity analysis was conducted on hydrogen, electricity, and water prices. Hydrogen prices varied within a range of USD2.5/kg (optimistic), USD5.0/kg (baseline), and USD10.0/kg (pessimistic), reflecting current market conditions and future projections. Similarly, electricity prices were analyzed at USD0.03/kWh (renewable-rich scenario), USD0.07/kWh (current average), and USD0.15/kWh (high-cost grid dependence). Additionally, variations in water prices were considered, given the importance of water supply in electrolysis. Water costs were assessed within USD0.5/m3 (low-cost access), USD1.5/m3 (moderate cost), and USD3.0/m3 (high-cost regions) to reflect different sourcing conditions, including desalination and municipal supply. The results indicate that lower hydrogen, electricity, and water costs significantly improve project feasibility, reducing the Levelized Cost of Hydrogen (LCOH) and enhancing economic viability. Conversely, high electricity and water prices increase operational costs, posing challenges to competitiveness, particularly in regions with limited freshwater availability. These findings highlight the importance of cost-efficient energy and water sourcing, as well as potential policy incentives, to enhance the feasibility of wave-powered hydrogen production.
Overall, the integration of advanced optimization techniques and hybrid renewable systems positions this study as a significant contribution to the ongoing transition toward sustainable energy solutions, particularly in coastal and resource-rich regions like Humboldt Bay. In future studies, research will be applied to power quality, stability, and control of the proposed microgrid.

7. Conclusions

This study demonstrates the transformative potential of integrating wave energy with hydrogen production using advanced optimization techniques to supply a bay with water and electricity then selling both and the hydrogen. The quantum-inspired Mixture of Experts (MoE) consistently outperformed other methods, achieving superior revenue and cost efficiency across all seasons. Hydrogen production emerged as the primary revenue driver, contributing up to 70% of total income, while the system’s capacity factor of 26.2% underscores the viability of wave energy for coastal regions in the United States and worldwide. By addressing seasonal variations and leveraging cutting-edge optimization, this research sets a benchmark for hybrid renewable systems. Future exploration of real-time implementation and the integration of additional resources like marine geothermal energy can further enhance scalability and resilience. These findings provide a solid foundation for advancing sustainable energy solutions, aligning with global clean energy goals.

Author Contributions

Conceptualization, H.H.F.; methodology, H.H.F.; software, H.H.F. and F.H.F.; validation, E.R.; formal analysis, F.H.F.; investigation, E.R.; resources, E.R.; data curation, F.H.F.; writing—original draft preparation, H.H.F.; writing—review and editing, E.R.; visualization, F.H.F.; supervision, E.R.; project administration, H.H.F.; funding acquisition, E.R. All authors have read and agreed to the published version of the manuscript.

Funding

No external fund was received for this research.

Institutional Review Board Statement

Not applicable.

Informed Consent Statement

Not applicable.

Data Availability Statement

Data are contained within the article.

Conflicts of Interest

The authors declare no conflicts of interest.

References

  1. IEA. Introduction to the Water-Energy Nexus Report. International Energy Agency. 23 March 2020. Available online: https://www.iea.org/articles/introduction-to-the-water-energy-nexus (accessed on 22 January 2025).
  2. Shenouda, A.; Hagras, M.A.; Rusu, E.; Ismael, S.; Fayek, H.H.; Balah, A. Selecting Appropriate Water–Energy Solutions for Desalination Projects in Coastal Areas. J. Mar. Sci. Eng. 2024, 12, 1901. [Google Scholar] [CrossRef]
  3. Fayek, H.H.; Mohammadi-Ivatloo, B. Tidal Supplementary Control Schemes-Based Load Frequency Regulation of a Fully Sustainable Marine Microgrid. Inventions 2020, 5, 53. [Google Scholar] [CrossRef]
  4. Li, H.; Wu, J. CFD Simulation of the Wave Pattern Above a Submerged Wave Energy Converter. J. Mar. Sci. Eng. 2025, 13, 23. [Google Scholar] [CrossRef]
  5. Gomes, R.P.F.; Gato, L.M.C.; Henriques, J.C.C.; Portillo, J.C.C.; Howey, B.; Collins, K.M.; Hann, M.R.; Greaves, D.M. Compact floating wave energy converters arrays: Mooring loads and survivability through scale physical modelling. Appl. Energy 2020, 280, 115982. [Google Scholar] [CrossRef]
  6. Le, T.T.; Sharma, P.; Bora, B.J.; Tran, V.D.; Truong, T.H.; Le, H.C.; Nguyen, P.Q.P. Fueling the Future: A Comprehensive Review of Hydrogen Energy Systems and Their Challenges. Int. J. Hydrogen Energy 2024, 54, 791–816. [Google Scholar] [CrossRef]
  7. U.S. Department of Energy. U.S. National Clean Hydrogen Strategy and Roadmap. 2020. Available online: https://www.hydrogen.energy.gov (accessed on 22 January 2025).
  8. Taroual, K.; Nachtane, M.; Rouway, M.; Tarfaoui, M.; Faik, A.; Mînzu, V.; Hilmi, K.; Saifaoui, D. Marine Renewable-Driven Green Hydrogen Production toward a Sustainable Solution and a Low-Carbon Future in Morocco. J. Mar. Sci. Eng. 2024, 12, 774. [Google Scholar] [CrossRef]
  9. Fayek, H.H.; Fayek, F.H.; Rusu, E. Operation of a 100% Off-Shore Renewable Energy Micro-Grid for Water, Hydrogen, and Electricity. In Proceedings of the 2024 International Conference on Machine Intelligence and Smart Innovation (ICMISI), Alexandria, Egypt, 12–14 May 2024. [Google Scholar]
  10. Billah, S.B.; Kabir, K.M.; Islam, M.O.; Barua, S.; Mahmud, M.S.; Hossain, M.S. Hydrogen Energy Storage Based Green Power Plant in Seashore of Bangladesh: Design and Optimal Cost Analysis. In Proceedings of the 2017 International Conference on Innovations in Green Energy and Healthcare Technologies (IGEHT), Coimbatore, India, 16–18 March 2017. [Google Scholar]
  11. Liu, Z.; Wang, H.; Zhou, B.; Yang, D.; Li, G.; Yang, B.; Xi, C.; Hu, B. Optimal Operation Strategy for Wind–Hydrogen–Water Power Grids Facing Offshore Wind Power Accommodation. Sustainability 2022, 14, 6871. [Google Scholar] [CrossRef]
  12. Gutiérrez-Martín, F.; Amodio, L.; Pagano, M. Hydrogen Production by Water Electrolysis and Off-Grid Solar PV. Int. J. Hydrogen Energy 2021, 46, 29038–29048. [Google Scholar] [CrossRef]
  13. Fayek, H.H.; Abdalla, O.H. Maximization of Renewable Power Generation for Optimal Operation of the Egyptian Grid. In Proceedings of the 2020 IEEE 29th International Symposium on Industrial Electronics (ISIE), Delft, The Netherlands, 17–19 June 2020; pp. 1033–1038. [Google Scholar]
  14. Fayek, H.H.; Abdalla, O.H. Operation of the Egyptian Power Grid with Maximum Penetration Level of Renewable Energies Using Corona Virus Optimization Algorithm. Smart Cities 2022, 5, 34–53. [Google Scholar] [CrossRef]
  15. Mohammadzadeh, M.; Akbari, E.; Salameh, A.A.; Ghadamyari, M.; Pirouzi, S.; Senjyu, T. Application of Mixture of Experts in Machine Learning-Based Controlling of DC-DC Power Electronics Converter. IEEE Access 2022, 10, 117157–117169. [Google Scholar] [CrossRef]
  16. Chen, D.; Zhou, X. AttMoE: Attention with Mixture of Experts for Remaining Useful Life Prediction of Lithium-Ion Batteries. J. Energy Storage 2024, 84 Pt A, 110780. [Google Scholar] [CrossRef]
  17. Tong, J.; Liu, Z.; Zhang, Y.; Zheng, X.; Jin, J. Improved Multi-Gate Mixture-of-Experts Framework for Multi-Step Prediction of Gas Load. Energy 2023, 282, 128344. [Google Scholar] [CrossRef]
  18. Hsu, C.-C.; Jiang, B.-H.; Lin, C.-C. A Survey on Recent Applications of Artificial Intelligence and Optimization for Smart Grids in Smart Manufacturing. Energies 2023, 16, 7660. [Google Scholar] [CrossRef]
  19. Veerasamy. QSAR—An Important In-Silico Tool in Drug Design and Discovery. In Advances in Computational Modeling and Simulation; Springer Nature: Singapore, 2022; pp. 191–208. [Google Scholar]
  20. Lewis, R.A.; Wood, D.J. Modern 2D QSAR for Drug Discovery. Wiley Interdiscip. Rev. Comput. Mol. Sci. 2014, 4, 505–522. [Google Scholar] [CrossRef]
  21. Tropsha, A. Best Practices for QSAR Model Development, Validation, and Exploitation. Mol. Inform. 2010, 29, 476–488. [Google Scholar] [CrossRef] [PubMed]
  22. Bouhrim, H.; El Marjani, A.; Nechad, R.; Hajjout, I. Ocean Wave Energy Conversion: A Review. J. Mar. Sci. Eng. 2024, 12, 1922. [Google Scholar] [CrossRef]
  23. Sheng, W. Wave energy conversion and hydrodynamics modelling technologies: A review. Renew. Sustain. Energy Rev. 2019, 109, 482–498. [Google Scholar] [CrossRef]
  24. Ahn, S.; Haas, K.A.; Neary, V.S. Wave energy resource characterization and assessment for coastal waters of the United States. Appl. Energy 2020, 267, 114922. [Google Scholar] [CrossRef]
  25. Katakam, V.S.S.; Bahadur, V. Reverse Osmosis-Based Water Treatment for Green Hydrogen Production. Desalination 2024, 581, 117588. [Google Scholar] [CrossRef]
  26. Humboldt Bay Harbor District. About Humboldt Bay. Available online: https://www.humboldtbay.org (accessed on 15 January 2025).
  27. Humboldt Bay Harbor, Recreation, and Conservation District. Humboldt Bay Management Plan. 2007. Available online: https://humboldtbay.org/sites/humboldtbay2.org/files/documents/hbmp2007/HumBayMgmtPLAN_print.pdf (accessed on 10 August 2024).
  28. California State Parks. Humboldt Bay and Surrounding Areas. Available online: https://www.parks.ca.gov (accessed on 15 January 2025).
  29. California Coastal Commission. Humboldt Bay: A Coastal Resource. Available online: https://www.coastal.ca.gov (accessed on 15 January 2025).
  30. National Renewable Energy Laboratory (NREL). System Advisor Model (SAM); Version 2024.12.12; National Renewable Energy Laboratory (NREL): Golden, CO, USA, 2024. Available online: https://sam.nrel.gov (accessed on 22 January 2025).
  31. Roy, K.; Kar, S.; Das, R.N. Understanding the Basics of QSAR for Applications in Pharmaceutical Sciences and Risk Assessment; Academic Press: San Diego, CA, USA, 2015. [Google Scholar]
  32. Ayoka, T.O.; Uchegbu, U.J.; Alabuike, C.C.; Nnadi, C.O. Efficient Classification and Regression Models for the QSAR of Chloroquine Analogues Against Chloroquine-Sensitive and Chloroquine-Resistant Plasmodium Falciparum. Lett. Appl. NanoBioSci. 2024, 13, 90. [Google Scholar]
  33. Filzmoser, P.; Maronna, R.; Werner, M. Outlier Detection in High-Dimensional Spaces. Comput. Stat. Data Anal. 2008, 52, 1694–1711. [Google Scholar] [CrossRef]
  34. Vats, A.; Raja, R.; Jain, V.; Chadha, A. The Evolution of Mixture of Experts: A Survey from Basics to Breakthroughs. Preprints 2024, 2024080583. [Google Scholar] [CrossRef]
  35. Rauf, H.; Khalid, M.; Arshad, N. Machine Learning in State of Health and Remaining Useful Life Estimation: Theoretical and Technological Development in Battery Degradation Modelling. Renew. Sustain. Energy Rev. 2022, 156, 111903. [Google Scholar] [CrossRef]
  36. Felser, T.; Trenti, M.; Sestini, L.; Gianelle, A.; Zuliani, D.; Lucchesi, D.; Montangero, S. Quantum-Inspired Machine Learning on High-Energy Physics Data. NPJ Quantum Inf. 2021, 7, 111. [Google Scholar] [CrossRef]
Figure 1. Wave hydrogen energy technologies microgrid.
Jmse 13 00461 g001
Figure 2. Humboldt Bay, USA location in Pacific Ocean [27].
Jmse 13 00461 g002
Figure 3. Yearly wave heights in Humboldt Bay, USA.
Jmse 13 00461 g003
Figure 4. QSAR optimization flowchart.
Jmse 13 00461 g004
Figure 5. MoE implementation in wave hydrogen microgrid.
Jmse 13 00461 g005
Figure 6. Wave converter output power in a year.
Jmse 13 00461 g006
Figure 7. Wave energy production yearly.
Jmse 13 00461 g007
Figure 8. Electrical power consumption on a typical summer day.
Jmse 13 00461 g008
Figure 9. Hourly power produced from a wave converter on a typical summer day.
Jmse 13 00461 g009
Figure 10. Revenue of the project on summer days using different optimization techniques.
Jmse 13 00461 g010
Figure 11. The total operation cost of the microgrid on a summer day using different optimization techniques.
Jmse 13 00461 g011
Figure 12. Income share from hydrogen, water, and electricity on a summer day.
Jmse 13 00461 g012
Figure 13. Electrical power consumption on a winter day.
Jmse 13 00461 g013
Figure 14. Power produced by a wave converter on a winter day.
Jmse 13 00461 g014
Figure 15. Revenue on a winter day using different optimization techniques.
Jmse 13 00461 g015
Figure 16. Operation cost of microgrid on a winter day using different optimization techniques.
Jmse 13 00461 g016
Figure 17. Share out of total income on a winter day.
Jmse 13 00461 g017
Figure 18. Electrical power consumption on a spring day.
Jmse 13 00461 g018
Figure 19. Output power from the wave converter on a spring day.
Jmse 13 00461 g019
Figure 20. Revenue on a spring day.
Jmse 13 00461 g020
Figure 21. Operation cost of microgrid on a spring day.
Jmse 13 00461 g021
Figure 22. Share of income on a spring day.
Jmse 13 00461 g022
Figure 23. Power consumption on a fall day.
Jmse 13 00461 g023
Figure 24. Output power from wave converter on a fall day.
Jmse 13 00461 g024
Figure 25. Revenue on a fall day.
Jmse 13 00461 g025
Figure 26. Cost of microgrid operation on a fall day.
Jmse 13 00461 g026
Figure 27. Share of income on a fall day.
Jmse 13 00461 g027
Disclaimer/Publisher’s Note: The statements, opinions and data contained in all publications are solely those of the individual author(s) and contributor(s) and not of MDPI and/or the editor(s). MDPI and/or the editor(s) disclaim responsibility for any injury to people or property resulting from any ideas, methods, instructions or products referred to in the content.

