Article

Long-Term (1979–2024) Variation Trend in Wave Power in the South China Sea

1
State Key Laboratory of Tropical Oceanography, Key Laboratory of Science and Technology on Operational Oceanography, South China Sea Institute of Oceanology, Chinese Academy of Sciences, Guangzhou 511458, China
2
University of Chinese Academy of Sciences, Beijing 100049, China
3
Sanya Institute of Ocean Eco-Environmental Engineering, Sanya 572025, China
*
Authors to whom correspondence should be addressed.
J. Mar. Sci. Eng. 2025, 13(3), 524; https://doi.org/10.3390/jmse13030524
Submission received: 17 January 2025 / Revised: 26 February 2025 / Accepted: 7 March 2025 / Published: 9 March 2025
(This article belongs to the Special Issue Advances in Offshore Wind and Wave Energies—2nd Edition)

Abstract

:
Wave power (WP) is a strategic oceanic resource. Previous studies have extensively researched the long-term variations in WP in the South China Sea (SCS) for energy planning and utilization. This study extends the analysis of long-term trends to the last year based on ERA5 (European Centre for Medium-Range Weather Forecasts Reanalysis v5) reanalysis data from 1979 to 2024. Our results mainly indicate that the trends in WP after 2011 are significantly different from those before 2011. Before 2011, the WP in the SCS primarily showed an increasing trend, but, after 2011, it shifted to a decreasing trend. This trend has seasonal differences, manifested as being consistent with the annual trend in winter and spring while being inconsistent with the annual trend in summer and autumn. It indicates that the opposite trend in WP before and after 2011 was mainly the result of WP variations in winter and spring. To illustrate the driving factor for the WP’s variations, the contemporary long-term trend of the wind fields is systematically analyzed. Analysis results reveal that, regardless of seasonal differences or spatial distribution, the two trends are consistent in most situations, indicating that wind fields are the dominant factor for the long-term variations in WP. Meanwhile, the effects of the wind fields on the WP variations can also be modulated by environmental factors such as oceanic swell propagation and local topography. This study contributes to the knowledge of the latest trends and driving factors regarding the WP in the SCS.

1. Introduction

Wave power (WP) has essential strategic value in remote seas where laying power grids is costly. By utilizing the vast and largely untapped energy from ocean waves, WP can reduce reliance on traditional fossil fuels and provide a reliable and continuous power supply [1,2,3,4,5]. It can offer green energy for observation equipment, oil drilling platforms, ranches, and other offshore facilities. For example, WP can supplement the energy requirements of remote islands [6,7], where conventional energy infrastructure is often challenging to establish and maintain.
It is necessary to carry out systematic resource assessments before planning WP deployment projects and designing the wave energy converters [2,3,4,5]. Take the South China Sea (SCS), the largest marginal sea in the western Pacific, as an example; due to its unique geographical characteristics and rich marine resources, many studies have been performed to assess the richness and stability of WP resources, based on in situ observations, satellite data, and numerical models [6,7,8,9,10,11,12,13,14,15,16]. For example, numerical models reveal that the WP is richest in the northern deep basin area of the SCS [8,11,12]. Meanwhile, it can be influenced by shallow topography such as islands [6,12,13,15] and coastal regions [6,9,10,14,16]. As a result, the WP exhibits significant seasonal and regional variations under the combined effects of seasonal winds and shallow topography in the SCS, e.g., [14,15].
Because WP is a strategic oceanic resource, accessing the long-term development trends is particularly important. Therefore, recent studies have increasingly paid more attention to the long-term variations and their forcing driving mechanisms in the WP assessment studies for the SCS [17,18,19,20,21,22]. For example, Ching-Piao et al. quantitatively evaluated the variations in wave climate in the northwestern Pacific and Taiwan waters based on a long-term wave dataset [17]. Zheng et al. proposed that the China Seas exhibited a significant overall increasing trend in WP density for several decades, mainly before 2011 [18,19,20]. They point out that the rising trend in winter and spring is more substantial than that in summer and autumn in the SCS [18]. Sun et al. focused on the WP trend in the coastal regions of the China Seas, and their results emphasize the significantly increasing trend in the northern coastal SCS during winter [21,22]. Liu et al. evaluated the long-term variability in global WP and demonstrated the increasing WP results from the global climate change and intensification of the Antarctic Oscillation [23]. Although the existing studies have greatly enhanced our understanding of long-term characteristics and distribution patterns for the WP in the SCS, most of the analysis focuses on a monotonic trend within a limited period. Previous studies have pointed out that a WP peak appeared in 2011 for the SCS (e.g., [18,19]); however, the long-term trend after this peak, especially its difference compared to the trend before 2011, has still received limited attention.
Moreover, clarifying the driving factors behind the trends will help us understand the variation mechanism and further predict WP. The SCS has a complex topography [24] and a unique oceanographic environment [25], and the factors affecting WP variation should be comprehensively considered. Previous studies have shown that the seasonal distribution of and variation in the wind field are the main driving forces that cause the variance of waves and WP. For example, Zheng et al. conducted a regionalization analysis of wind and wave energy resources in the East China Sea and the SCS [26]; Wang et al. assessed wave and wind energy in the Weifang Sea area over 20 years [27]; Dong et al. simulated the wind and wave energy resources in the waters off the Yangtze River Delta [28]. Their results reveal a close relationship between wind and wave energy. However, for the SCS, in addition to wind forcing, the modulation of environmental factors such as topography and background swells on the WP may also need to be considered. This is because, although the direction of wind and waves changes seasonally with the monsoon, the swell energy from the deep ocean that propagates from the northeast to the southwest throughout the year always dominates [15,29]; in addition, complex topographic factors have a significant impact on the wave dynamics and energy in local areas [12,13].
Based on the above considerations, this study extends the WP long-term trend analysis to the most recent year. It systematically analyzes the spatial and seasonal distribution characteristics of the trend in the SCS from 1979 to 2024. The study focuses on the differences between the trends before and after 2011. Based on the results of the WP’s long-term trend, the driving mechanisms of the trend are discussed in relation to the wind field’s contemporary variations. Background environmental factors such as topography and swell are combined into the discussion for the situations where trends in WP and winds are not entirely consistent.

2. Data and Methods

2.1. Data

2.1.1. Reanalysis Data

The European Centre for Medium-Range Weather Forecasts Reanalysis v5 (ERA5) reanalysis data were employed to analyze the wave energy resources in the SCS. The data consist of the fifth generation of global meteorological reanalysis products released by the European Center for Medium-Range Weather Forecasts [30,31]. Parameters including significant wave height (Hs) and energy period (Te) with a spatial resolution of 0.5° from 1 January 1979 to 31 December 2024, with a time resolution of 1 h, were obtained from the product. The quality of ERA5 wave data has been thoroughly validated by different authors [32,33]. This dataset has also been applied in various aspects, such as observation data reconstruction [34], satellite data calibration [35], and wave energy resource analysis [15].
To discuss the dynamic reasons for the long-term trend in WP, the wind data from the ERA5 dataset were employed to compare the spatiotemporal characteristics of the wind fields with WP variations. There are many widely used wind field datasets provided by satellite remote sensing observations or model assimilation reanalysis results [36,37,38,39]. The reason for choosing the ERA5 wind data in this study is that these data have enough reliability and sufficient spatiotemporal coverage. Prior investigations from different global regions have shown that the ERA5 wind field data match the performance of other popular wind products, such as the NCEP version 2 coupled forecast system model (CFSv2) and the satellite altimeter data [38,39]. In the SCS, the accuracy of ERA5’s wind field data is similar to that of the products provided by satellite remote sensing data [36] and the data assimilation system of the China Meteorological Administration [37]. More importantly, ERA5 data have global coverage, including the entire SCS, with a horizontal spatial resolution of 0.25°, and the data period can cover the whole analysis period from 1979 to 2024. It is vital to have sufficient time and space coverage for the wind data to match the WP assessment results in this study.

2.1.2. Bouy Observations

In this study, the accuracy of ERA5 reanalysis data in evaluating WP in the SCS was further verified using in situ observations from a buoy. The buoy is located in the middle of the southern SCS at a longitude of 130 °E and a latitude of 9.5 °N (Figure 1). It was deployed by the South China Sea Institute of Oceanology, Chinese Academy of Sciences, in 2020. Due to communication interruption, the buoy’s data remained interrupted for a long time before 22 February 2021 and after 2 October 2021. For this reason, this study uses data from 22 February to 2 October 2021, totaling more than seven consecutive months. The results of comparing the observed data with the WP density calculated by ERA5 are detailed in Section 3.1.

2.2. Methods

2.2.1. Calculation of the Energy Density

Based on previous studies on WP assessments in different sea regions, e.g., [4,12,18], the following equation was used to calculate the WP density (Pw):
P w = ρ g 2 H s 2 T e / 64 π
where Hs is the significant wave height, Te is the wave energy period, g is the gravitational acceleration, and ρ is the seawater density, which equals 1025 kg/m3 in this study.
Due to data resolution of only 0.5°, and considering the spatial continuity of the wave field, the Kriging method was used for interpolation when plotting the results. In the resulting graphs, the actual resolution of the plot is 0.2°. All the graphs displaying spatial distribution in this paper were made using the Surfer software version 11.0.642.

2.2.2. Determination of the Long-Term Trend

The annual and seasonal mean Pw of all spatial grids from 1979 to 2024 was calculated, and then linear fittings were performed relative to the annual and seasonal mean Pw. The slope obtained by the fitting was applied to represent the interannual variation trend in WP at the corresponding locations and during the corresponding seasons. Linear fitting methods offer substantial advantages in terms of computational simplicity and efficiency, making them ideal for large-scale datasets and long-term trend research [40,41]. In practice, the outcomes of linear fitting and other trend computations are generally identical [21]; nevertheless, it is a more straightforward computational process, making it a better choice in many scenarios [42].
At the same time, the reliability of the trends was evaluated through correlation analysis and p-value testing. The p-value was obtained by analyzing the correlation between the mean Pw and the year series, which can be used to evaluate the significance of the long-term trend.
Due to an impressive peak in the annual mean Pw that occurred in 2011 (see the results in Section 3.2 below), this study further divides the data into two periods, 1979–2011 and 2011–2024, with an emphasis on the analysis of the differences in the WP’s interannual trend in the two periods.

3. Results

3.1. Validity of ERA5 Data Applied in This Study

Pw was calculated using ERA5 and buoy-measured data. The comparison results show that the Pw calculated using the ERA5 data agree with that calculated using the buoy observation data (Figure 2). The observed data and computed results are highly consistent regarding time series and scatter comparison. The matched scatters are close to both sides of the 1:1 line. In addition, the baseline of the quantile–quantile plots is close to the y = x line. Moreover, the two sets of calculated Pw are highly consistent in terms of their histograms, probability density, and cumulative density. According to statistics, the bias, MAE (mean absolute error), RMSE (root means square error), and SI (scatter index) are only −0.36 kW/m, 0.95 kW/m, 1.44 kW/m, and 0.28, respectively. The correlation coefficient (R) is as high as 0.94. These results suggest that the ERA5 reanalysis data are reliable for calculating WP in the SCS in this study.

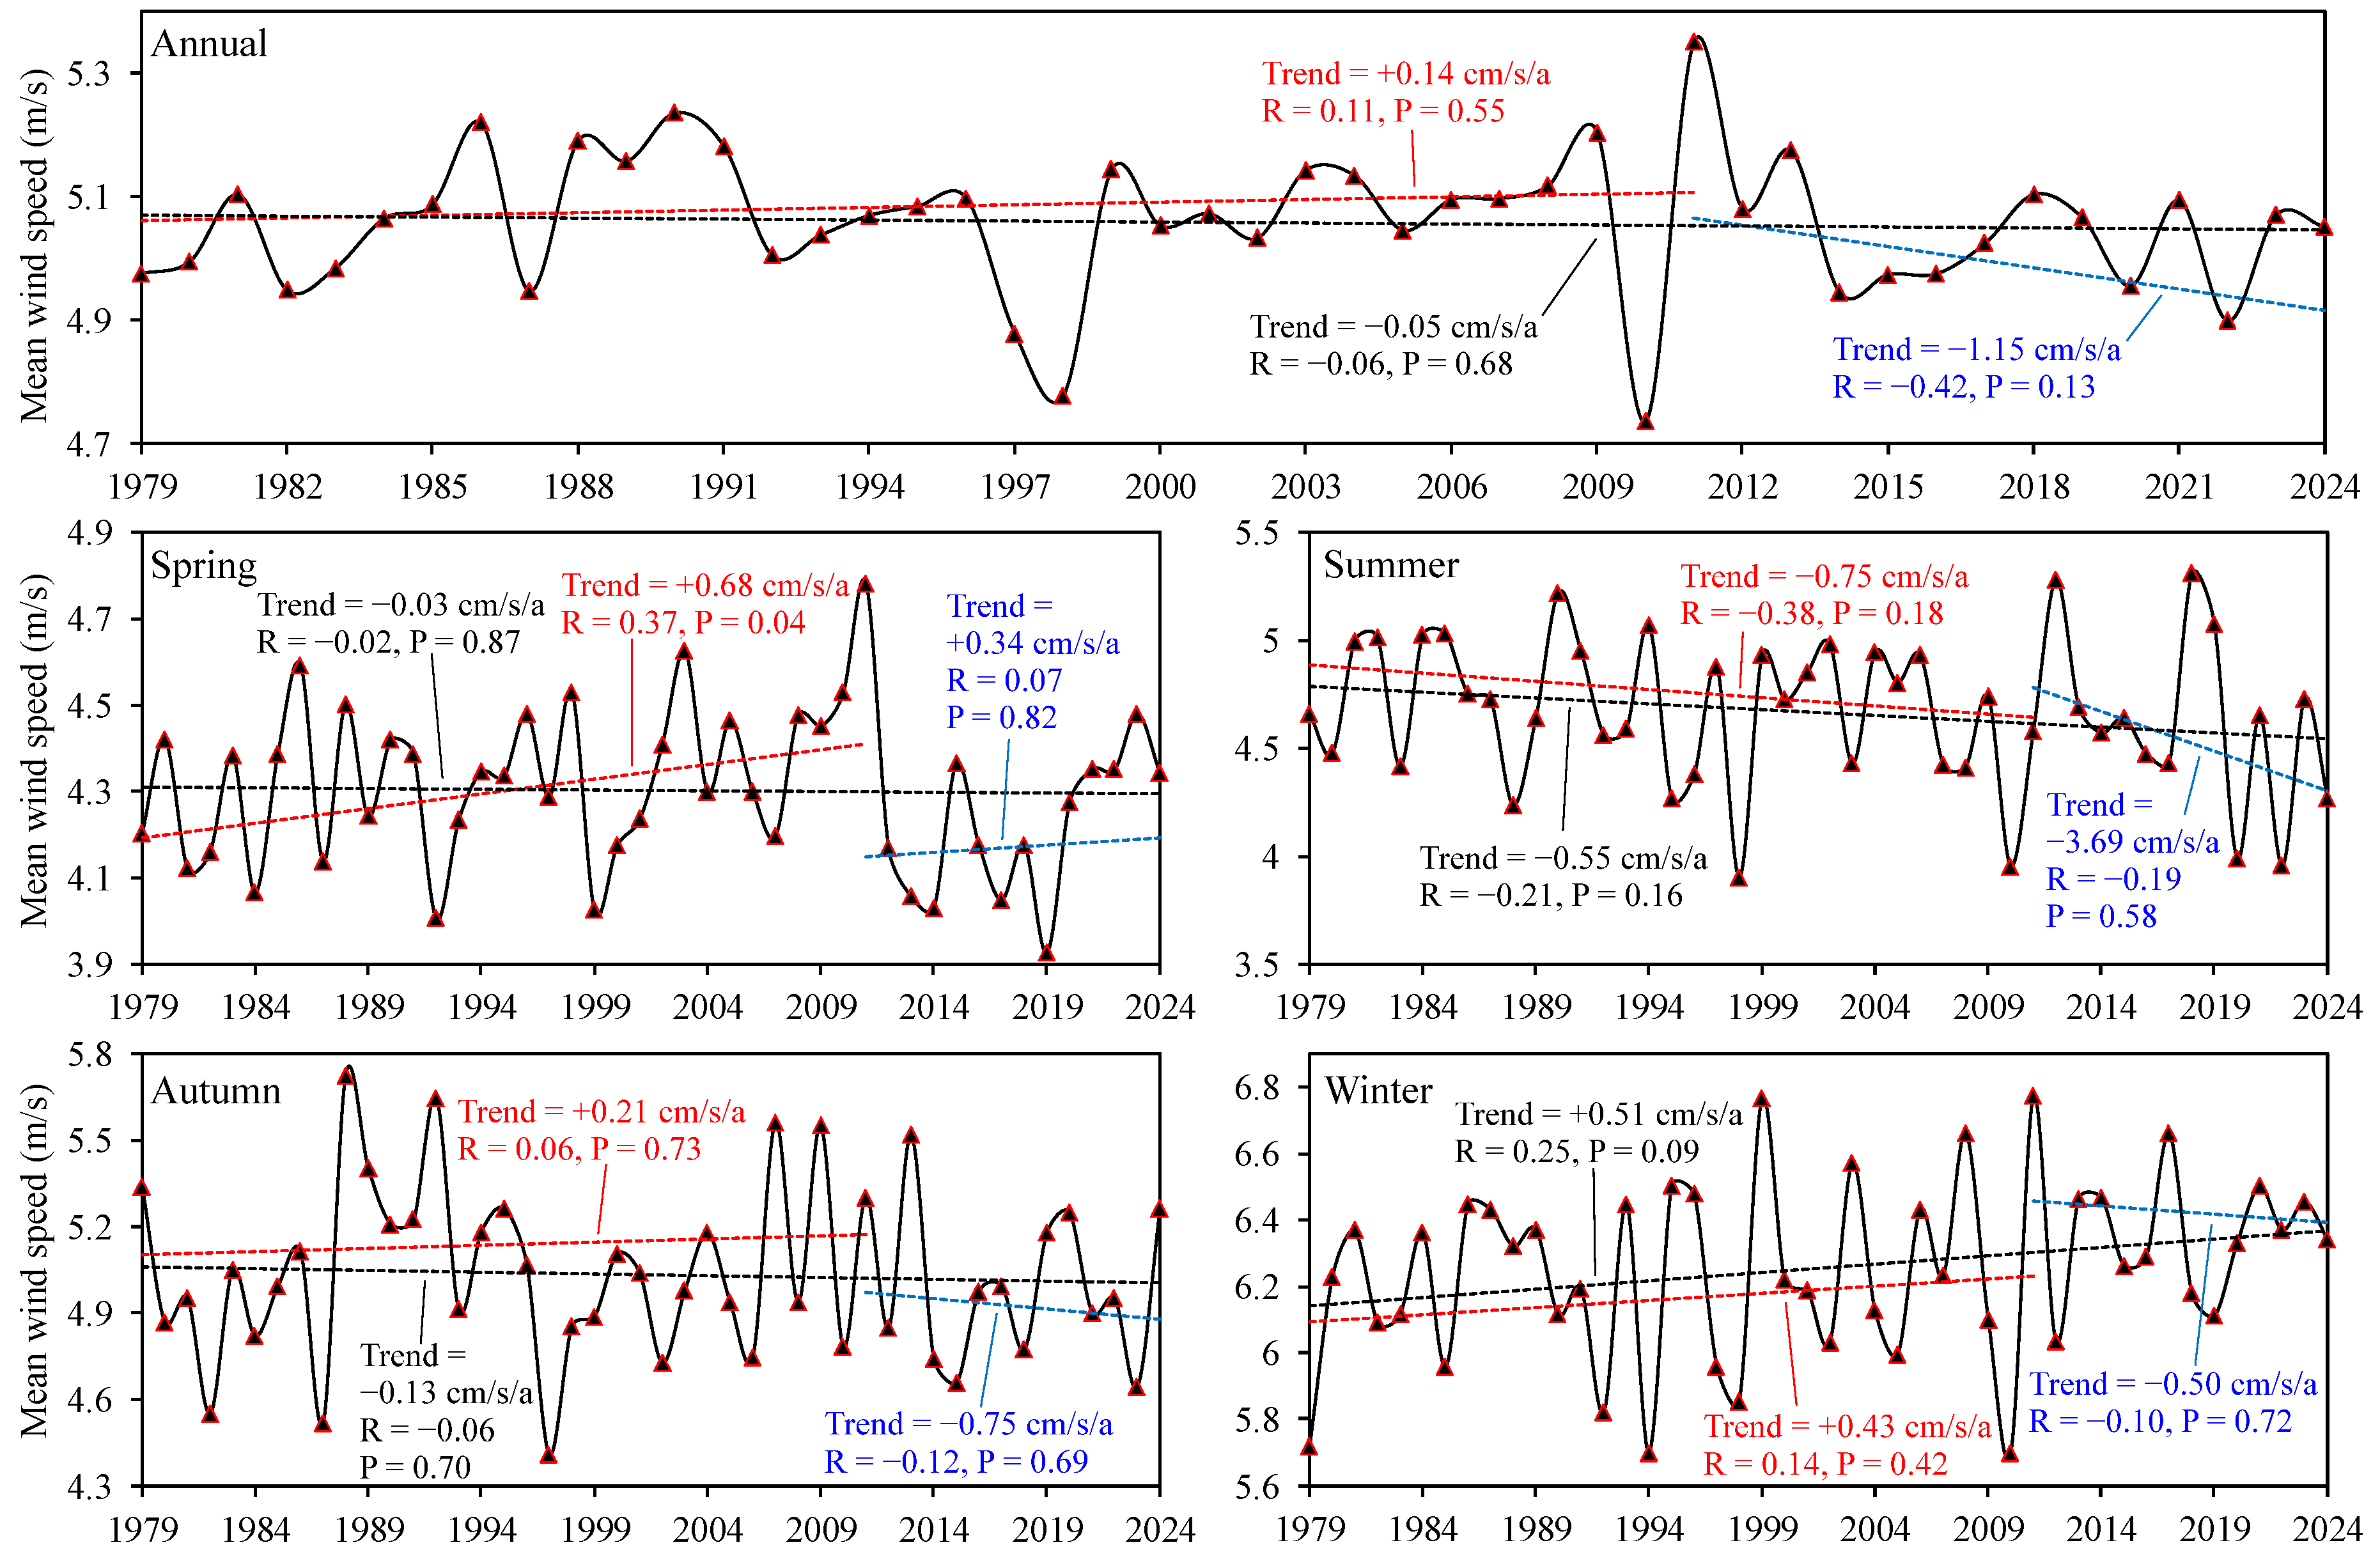
3.2. Overall Characteristics of Interannual WP Variations

Based on the Pw results from 1979 to 2024, it is found that the Pw in the SCS has significant annual and seasonal variations (Figure 3a). The WP is relatively high during winter and is relatively low during summer and spring. The peak of the monthly average Pw is about 20 kW/m during these years. By comparing the variations in the annual mean values, it is found that the WP appears to have experienced a generally increasing trend during the investigated 45 years (Figure 3b). As it can be seen from the figure, Pw reached its peak in 2011. Before 2011, Pw showed an increasing trend, with a growth rate of about 52.5 W/m/a. The significant (p ≤ 0.01) upward annual trends from 1979 to 2011 and from 1979 to 2024 are also confirmed by correlation analysis. Moreover, the results of this study indicate that, during the past decade, from 2011 to 2024, the trend reversed, with a decline rate of about 52.6 W/m/a (Figure 3b). The reversal of this trend needs special attention in the future development planning of WP.
If we regard 2011 as a turning point and further analyze the spatial characteristics of the WP annual change rate, we can find that the spatial patterns of the WP’s long-term change rate are consistent with the climatological mean WP intensity in the SCS (Figure 4). The spatial distributions in the figure reveal that the most apparent variation signal in the trends, no matter the strengthening trend before 2011 or the decreasing trend after 2011, mainly extends southwestward from the West Pacific and across the SCS along the deep-water basin.

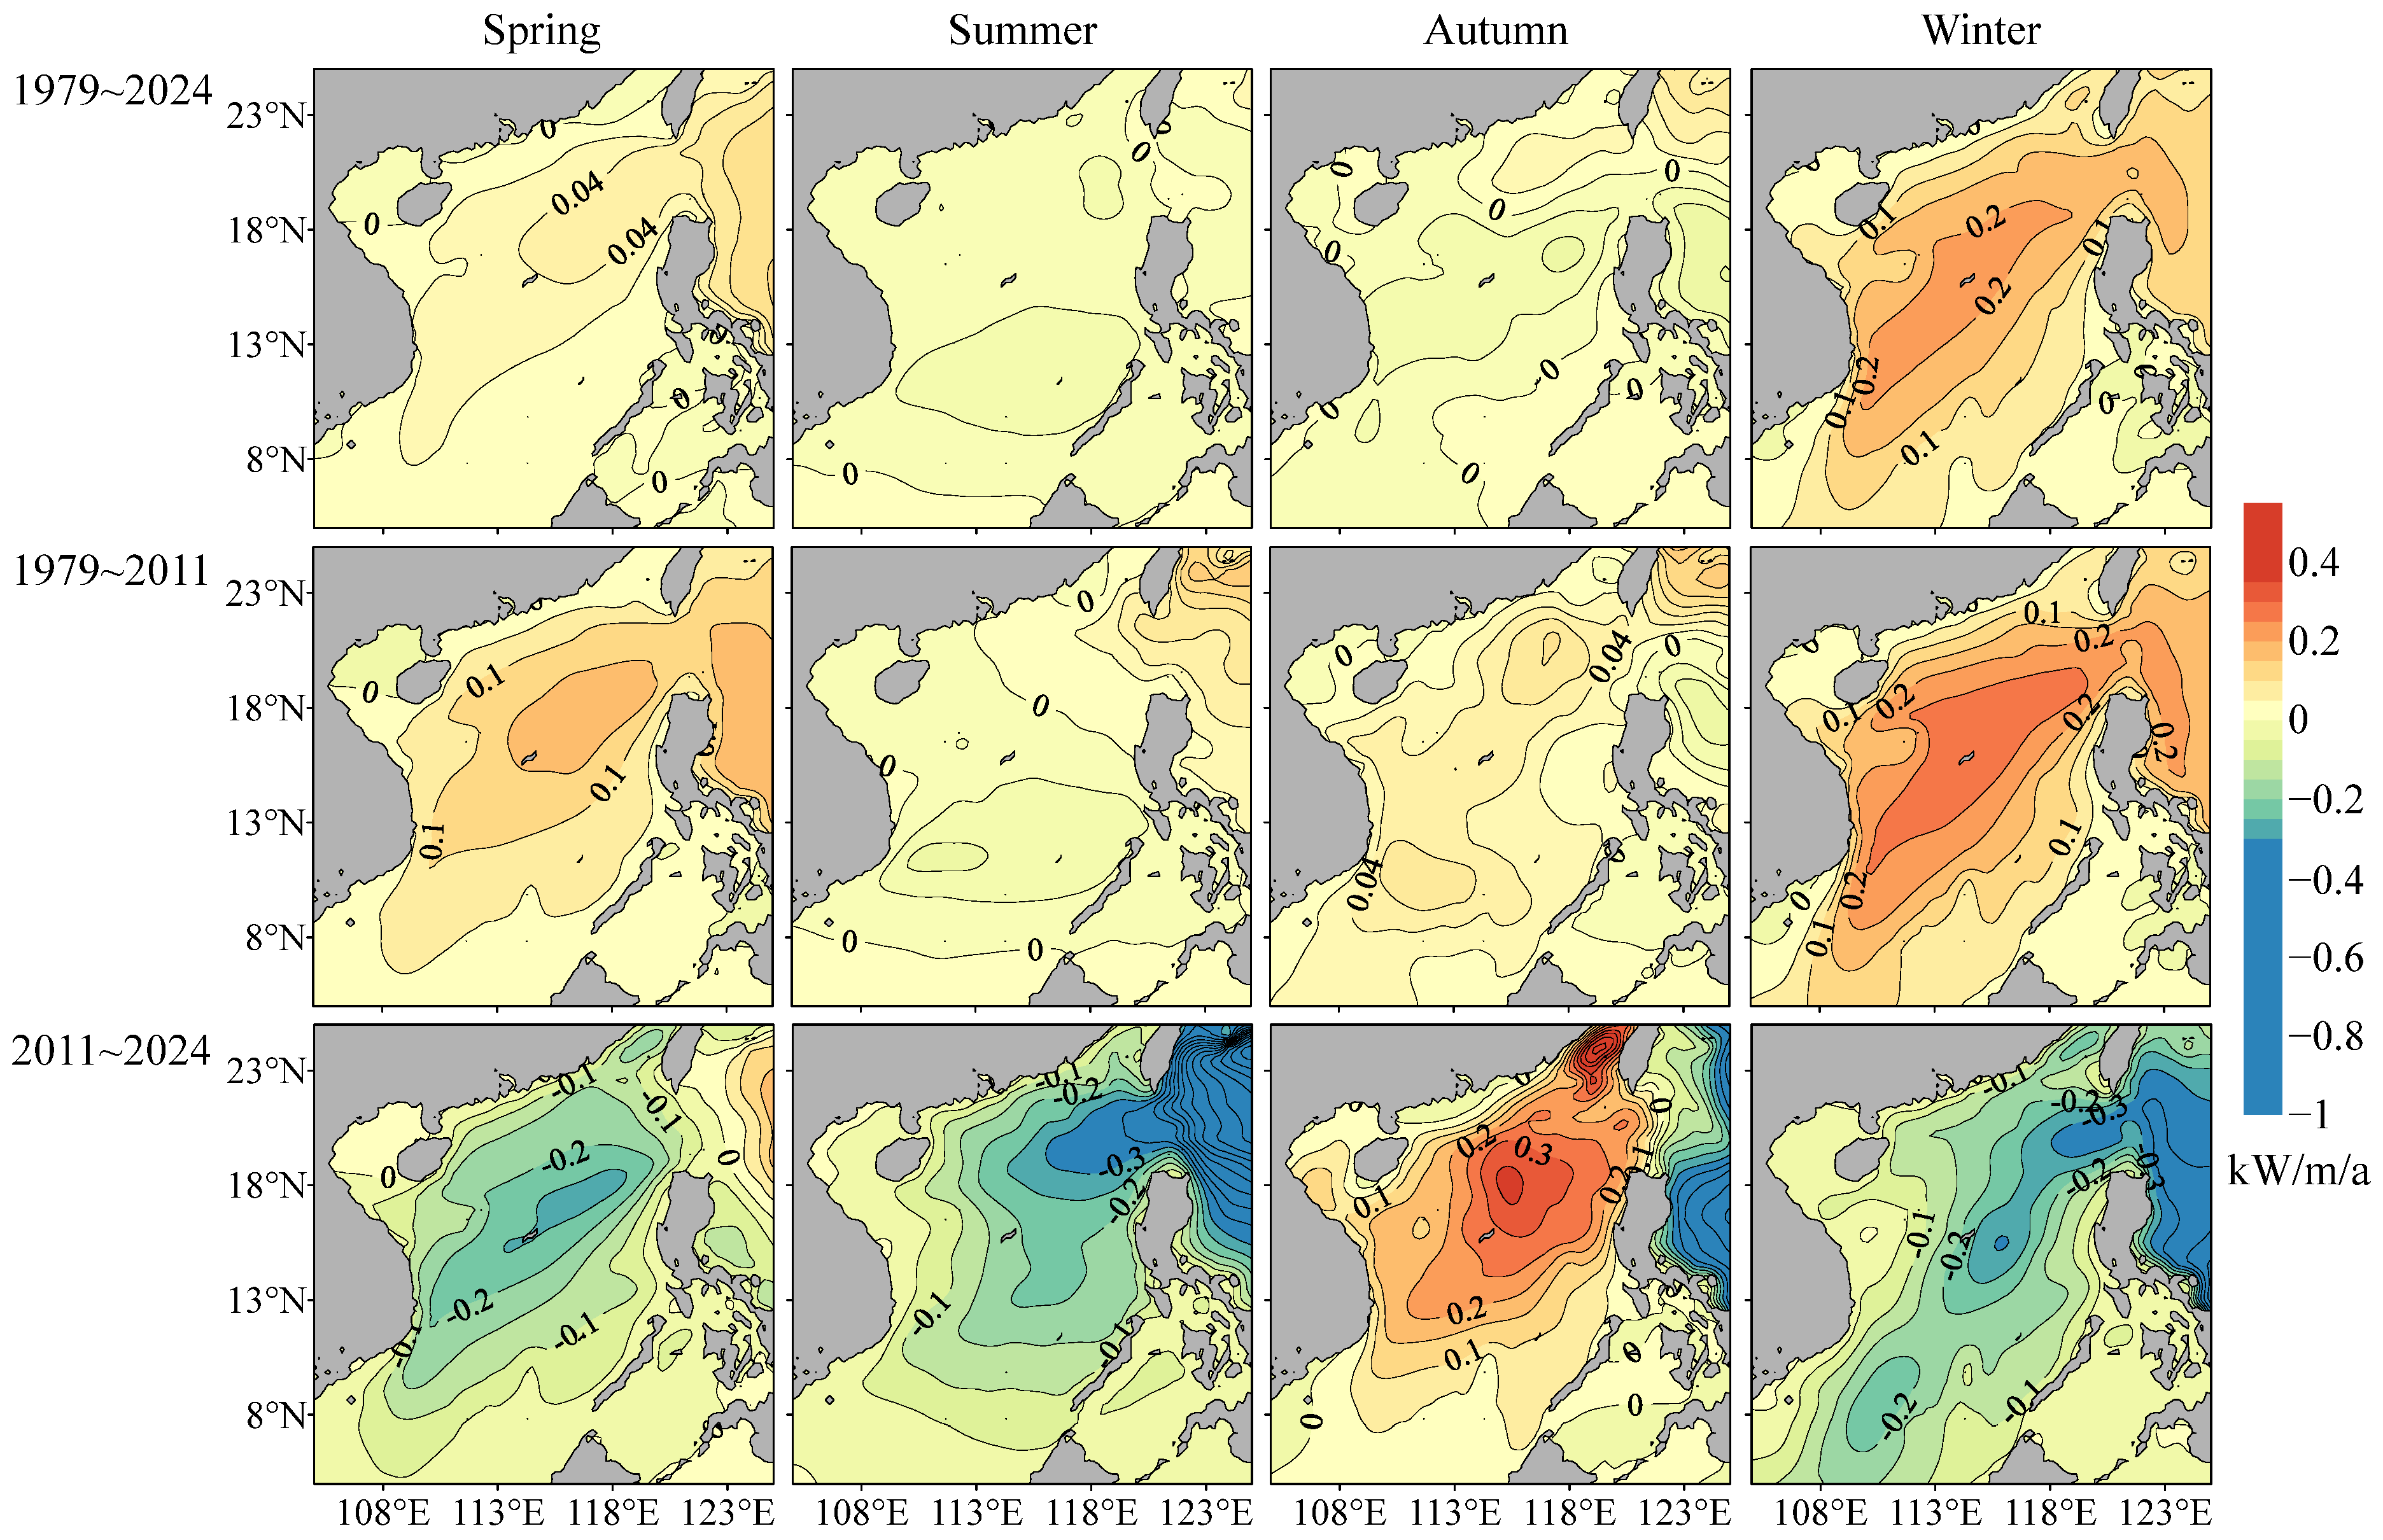
3.3. Seasonal Characteristics of WP Interannual Variations

The data were further divided into four seasons: spring (MAM), summer (JJA), autumn (SON), and winter (DJF), and then the interannual trend analysis from the previous section was further performed (Figure 5). The results show that the WP in spring and winter appears to have an upward trend before 2011 and a downward trend after 2011. The annual variation trend in WP in winter and spring is consistent with the yearly average variation trend of the SCS (Figure 2b). The upward trends in winter WP from 1979 to 2011 (p < 0.01) and from 1979 to 2024 (p = 0.03) and spring WP from 1979 to 2011 (p < 0.01) appear to be significant, with low p-values. The rising trend before 2011 and the falling trend after 2011 in winter are more potent than those recorded in other seasons. However, the WP trends in summer and autumn remain continuously downward and upward, respectively, from 1979 to 2024. Both trends after 2011 became more substantial than those before 2011 (Figure 4).
Further analysis of the spatial distribution of WP trends in the four seasons is presented in Figure 6. The figure shows that, for any statistical periods or seasons, the spatial patterns of the Pw trend are similar to those of the climatological mean Pw and the annual trends (Figure 4). The high-value areas of the trends always extend from the northeast to the southwest of the SCS (Figure 6). Section 3 presents the seasonal and spatial distribution of the long-term trend in WP. In the following Section 3, we focus on discussing the inner driving mechanisms behind these long-term trends.

4. Discussion

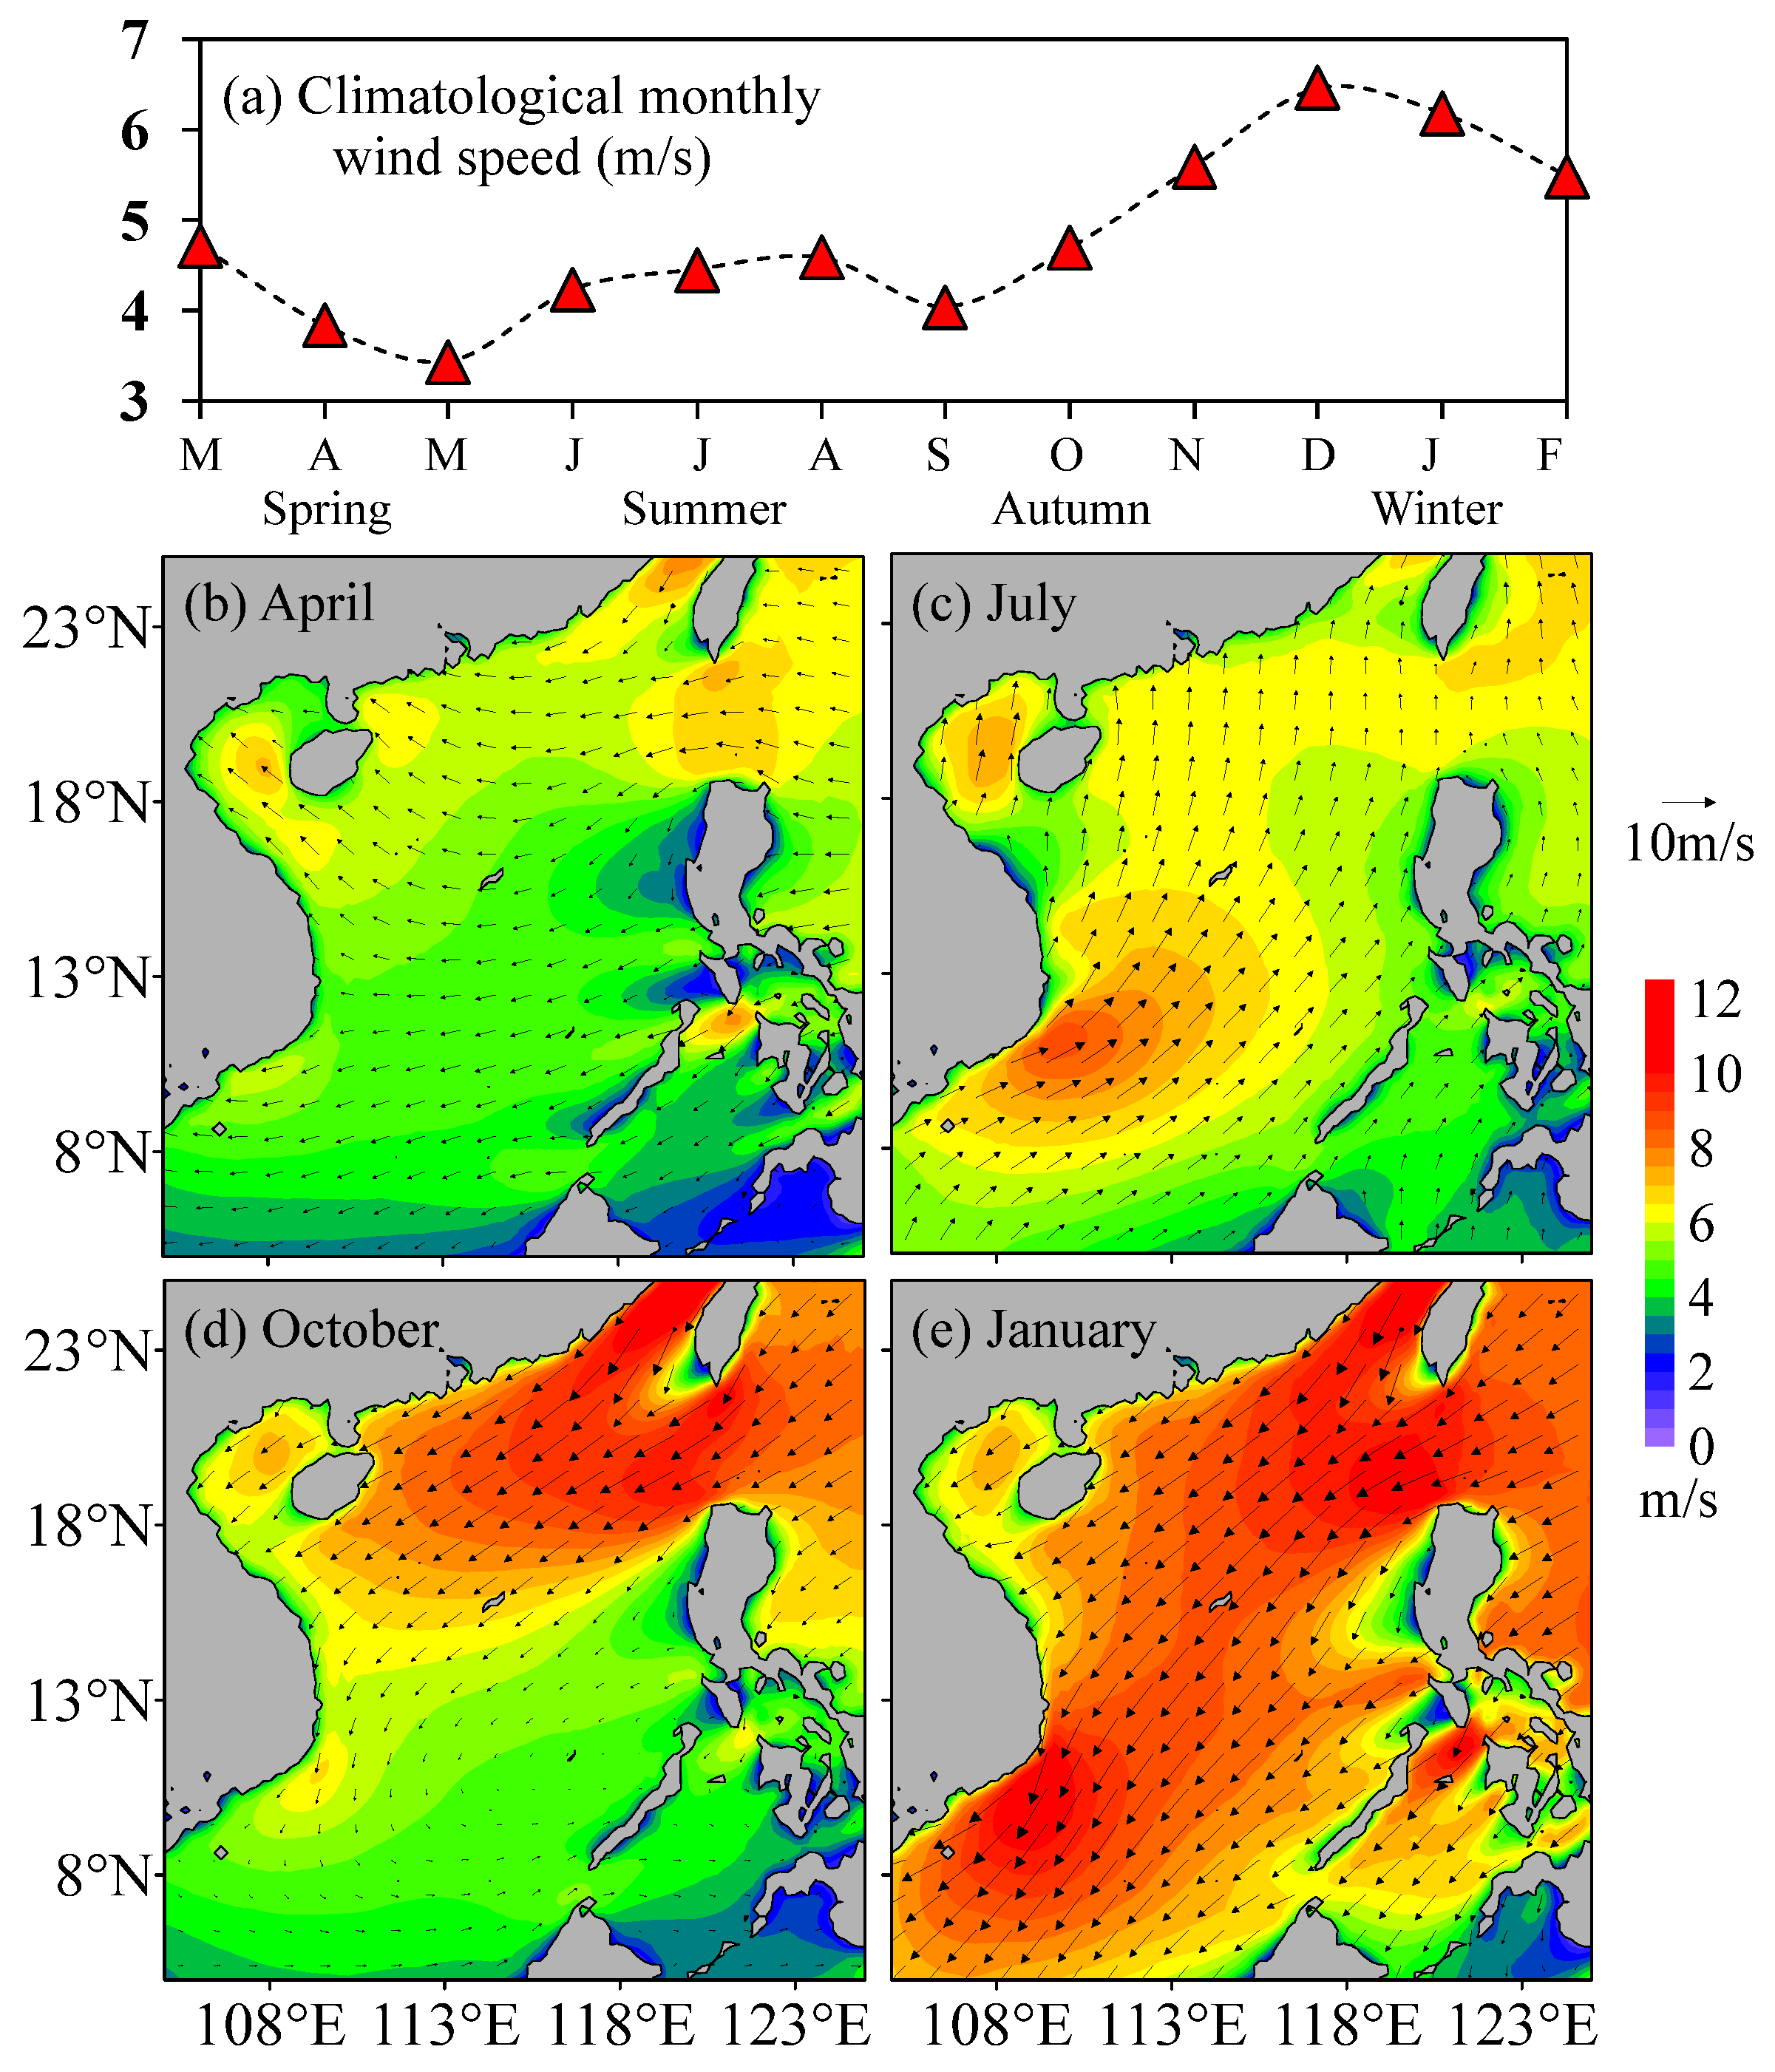
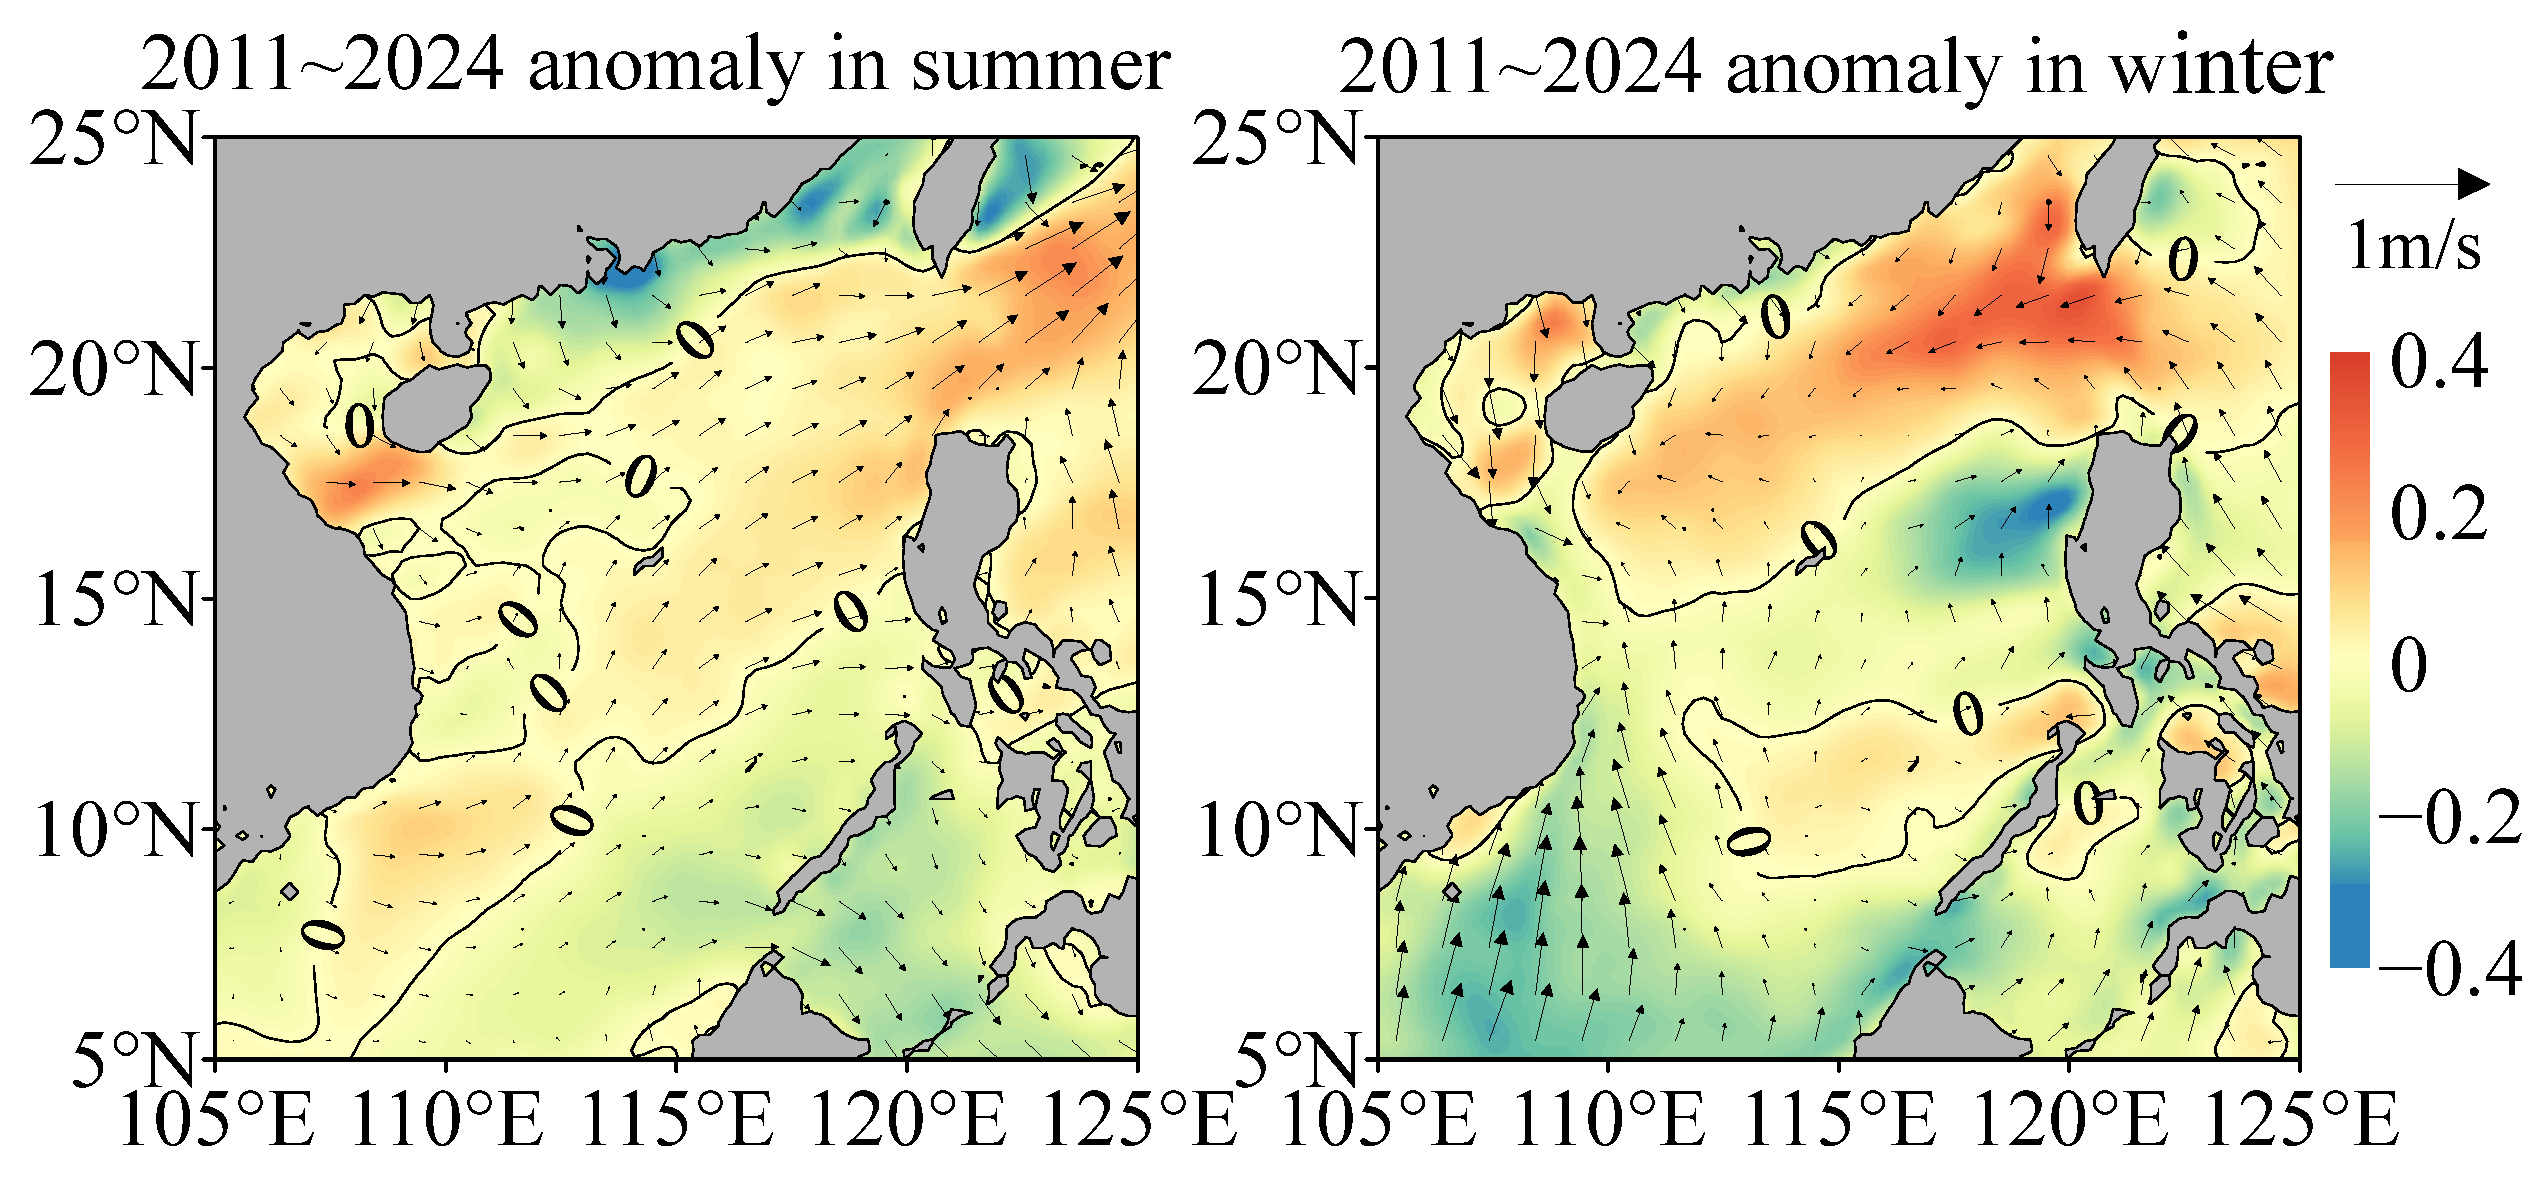
4.1. Effects of Seasonal Wind Fields on WP Variation

The above results reveal that the long-term trend in WP in the SCS from 1979 to 2024 can be divided into two parts: the increase from 1979 to 2011 and the decline from 2011 to 2024 (Figure 3 and Figure 4). The increased trends before 2011 obtained in this study are consistent with previous studies with respect to magnitude [18,19,20] and spatial distribution characteristics [11,12,18] of the trends. The main difference between this study and previous ones is that we extend the trend analysis to the most recent years and point out that the long-term trend in WP from 2011 to 2024 is opposite to the trend before 2011.
In recent years, due to climate change, wind fields in the Western Pacific, and even in the rest of the world, have changed interannually [19,43,44,45]. Studies have shown that the increase in the frequency of strong winds is the main reason for the rising global wave height and WP trend [19,20,44]. Considering that the wind field is an essential driving factor for waves, the relationship between the variation trend in WP and the wind fields is further discussed in this section. Dominated by seasonal monsoons, the sea surface wind field is controlled by the strong northeasterly monsoon in winter and the northeasterly monsoon in summer (Figure 7). By analyzing the interannual variation of the wind field in the SCS, it can be found that the annual and seasonal variation trends in wind speed are generally consistent with WP variation. Figure 8 shows that the wind fields appear to have an increasing trend before 2011 and a decreasing trend after 2011 in different seasons. Whether before or after 2011, the variation in wind fields and WP is consistent (Figure 3b and Figure 5). For example, wind speeds showed downward trends in summer from 1979 to 2011 and from 2022 to 2024; WP also exhibited such a trend.
Further analysis of the spatial distribution of wind variations in the SCS is shown in Figure 9. By comparing this figure with Figure 6, it can be found that the WP and wind speed trends are in good agreement in terms of spatial distributions, regardless of the season and decade from which they were computed. For example, Figure 9 shows that the overall weakening trend in the autumn wind field in 2011–2024 (Figure 8) is mainly the result of the weakening wind field in the southern SCS. The wind field appears to have an increasing trend in the northern SCS, a phenomenon which is entirely consistent with the trend in WP (Figure 6). These consistencies further demonstrate that wind-forcing variations can be the direct factor behind the WP variations over the 45 years investigated in this study.

4.2. Modulation of the Background Swell in Relation to the WP Variation

Although the wind fields in the SCS controlled by monsoons exhibit seasonal variations, the swells introduced from the Pacific always propagate from northeast to southwest throughout the year [12,29]. Our results also reflect the consistency between the long-term trend in WP and the propagation direction of swells (e.g., Figure 1b, Figure 4a and Figure 6). In this study, one notable phenomenon of the WP trends is that the high-value areas, regardless of the increasing trend during 1970–2011, 1979–2024, or the decreasing trend during 2011–2024, always extend from the northeast to the southwest of the SCS (Figure 4 and Figure 6), such areas being aligned with the swell propagation pattern. In addition, the area with the highest trends appears to be located, in most cases, around the Luzon strait, where oceanic swells from the Western Pacific propagate into the SCS, in agreement with the results reported in previous studies, e.g., [12,18]. These phenomena mainly result from the regulatory effect of oceanic swells on the variation in WP in the SCS.
Another notable result is that the long-term trends in WP in winter and spring are consistent, but those in summer and autumn are inconsistent with the annual trend (Figure 3 vs. Figure 5 and Figure 4 vs. Figure 6), indicating the vital contribution of these two seasons to the annual variations in WP. Note that, in winter and spring, the direction of wind vectors in most areas of the SCS is consistent with the direction of wave propagation, which is toward the southwest (Figure 7). In these circumstances, the variations in the wind field may form a combined effect with the swell, leading to a further increase in the impacts on the trends in WP.
Furthermore, it is worth noting that the long-term trend in the wind of 2011–2024 and the WP trend are inconsistent in their spatial distributions in the summer and winter. In both seasons, the wind fields in the northern SCS showed an increasing trend (Figure 9), while the WP showed a decreasing trend (Figure 6). The anomalies in the seasonal wind fields of 2011–2024 relative to their climatological seasonal means are illustrated in Figure 10 to explain the inconsistency. The figure reveals that it is probably due to the effects of the southwestward swells and local topography combined with the wind anomalies. For example, in the summer of 2011–2024, the abnormal wind field blowing toward the northeast was opposite in direction to that of the swells (Figure 10), so that the increase in wind speed may have weakened the WP. In the winter of 2011–2024, abnormal wind strengthening occurred around the northern coastal regions with shallow water (Figure 10), a phenomenon which may have attenuated wave energy [12,13]. Therefore, the effects of wind strengthening on waves may be limited. Previous studies have shown that, under specific environmental conditions, the interannual variations in WP are sensitive to the changes in speed and direction of winds [46,47]. Our results further confirm this sensitivity and indicate that the influence of swell and topography may be coupled with the effects of winds.

5. Conclusions

Based on the ERA5 (European Centre for Medium-Range Weather Forecasts Reanalysis v5) reanalysis data for 45 consecutive years from 1979 to 2024, this study systematically evaluates the interannual variation trend in wave power (WP) in the South China Sea (SCS). Based on the wind field data, the driving mechanism of the long-term WP trend is further discussed. The results can be summarized as the following points of conclusions.
(1) Although the WP experienced a general, long-term, increasing trend from 1979 to 2024, there was a remarkable turning point in 2011. Before 2011, the WP mainly exhibited an increasing trend, but such a trend reversed after 2011.
(2) The WP trend has remarkable seasonal and spatial variation characteristics. Seasonally, the trends in winter and spring are consistent, while the trends in summer and autumn are inconsistent with the annual trend. Spatially, the high-value area of the trend mainly extends from the northeast to the southwest over the deep basin.
(3) The variations in wind fields are the direct forcing factor leading to the long-term variation in WP. Meanwhile, the background swells propagating from the Western Pacific and the local shallow topography can also play essential roles in the modulation of the WP’s variation trend.
This study contributes to the continuously updated research on wave energy resources and their long-term trends in the SCS by extending the trend analysis to the most recent year. The results emphasize the opposite long-term trend in WP before and after 2011, and the mechanism can be related to coupled effects combining dynamic and environmental factors. However, our study still has limitations regarding the mechanisms by which global climate change affects wind fields and swells. Therefore, the complexity of the long-term variation in WP should be fully considered, and the mechanism for the variations still needs to be further clarified in future studies.

Author Contributions

Conceptualization, J.L.; methodology, Y.T.; software, Y.T.; validation, J.L.; formal analysis, Y.T. and W.C.; investigation, W.C.; resources, J.L. and B.L.; data curation, W.C.; writing—original draft preparation, Y.T. and J.L.; writing—review and editing, J.L.; visualization, W.C.; supervision, J.L. and B.L.; project administration, J.L.; funding acquisition, J.L. and B.L. All authors have read and agreed to the published version of the manuscript.

Funding

This research was funded by the Guangdong Basic and Applied Basic Research Foundation (2023A1515011497 and 2024A1515010286), the Hainan Provincial Natural Science Foundation of China (422MS160), and the development fund of the South China Sea Institute of Oceanology of the Chinese Academy of Sciences (SCSIO202207), and the Administrative Bureau of Sanya Yazhou Bay Science and Technology City.

Institutional Review Board Statement

Not applicable.

Informed Consent Statement

Not applicable.

Data Availability Statement

The data will be available on request.

Acknowledgments

The analysis in this study was supported by the High-Performance Computing Division at the South China Sea Institute of Oceanology.

Conflicts of Interest

The authors declare no conflicts of interest.

Abbreviations

The following abbreviations are used in this manuscript:
WPWave power
SCSSouth China Sea
ERA5European Centre for Medium-Range Weather Forecasts Reanalysis v5
CFSv2NCEP version 2 coupled forecast system model
NCEPNational Centers for Environmental Prediction
PDFProbability density function
CDFCumulative density function
MAEMean absolute error
RMSERoot means square error
SIScatter index
RCorrelation coefficient

References

  1. Iglesias, G.; López, M.; Carballo, R.; Castro, A.; Fraguela, J.A.; Frigaard, P. Wave energy potential in Galicia (NW Spain). Renew. Energy 2009, 34, 2323–2333. [Google Scholar] [CrossRef]
  2. Lehmann, M.; Karimpour, F.; Goudey, C.A.; Jacobson, P.T.; Alam, M.-R. Ocean wave energy in the United States: Current status and future perspectives. Renew. Sustain. Energy Rev. 2017, 74, 1300–1313. [Google Scholar] [CrossRef]
  3. Kilcher, L.; García Medina, G.; Yang, Z. A scalable wave resource assessment methodology: Application to U.S. waters. Renew. Energy 2023, 217, 119094. [Google Scholar] [CrossRef]
  4. Bouhrim, H.; El Marjani, A.; Nechad, R.; Hajjout, I. Ocean wave energy conversion: A review. J. Mar. Sci. Eng. 2024, 12, 1922. [Google Scholar] [CrossRef]
  5. Pazhouhan, M.; Karimi Mazraeshahi, A.; Jahanbakht, M.; Rezanejad, K.; Rohban, M.H. Wave and tidal energy: A patent landscape study. J. Mar. Sci. Eng. 2024, 12, 1967. [Google Scholar] [CrossRef]
  6. Li, B.; Chen, W.; Li, J.; Liu, J.; Shi, P. Integrated monitoring and assessments of marine energy for a small uninhabited island. Energy Rep. 2022, 8, 63–72. [Google Scholar] [CrossRef]
  7. Li, B.; Li, J.; Chen, W.; Liu, J.; Shi, P. Meteo-climatic conditions of wind and wave in the perspective of joint energy exploitation: Case study of Dongluo Island, Hainan. Atmosphere 2022, 13, 1076. [Google Scholar] [CrossRef]
  8. Zheng, C.W.; Pan, J.; Li, J.X. Assessing the China Sea wind energy and wave energy resources from 1988 to 2009. Ocean Eng. 2013, 65, 39–48. [Google Scholar] [CrossRef]
  9. Zhou, G.; Huang, J.; Zhang, G. Evaluation of the wave energy conditions along the coastal waters of Beibu Gulf, China. Energy 2015, 85, 449–457. [Google Scholar] [CrossRef]
  10. Chen, X.; Wang, K.; Zhang, Z.; Zeng, Y.; Zhang, Y.; O’Driscoll, K. An assessment of wind and wave climate as potential sources of renewable energy in the nearshore Shenzhen coastal zone of the South China Sea. Energy 2017, 134, 789–801. [Google Scholar] [CrossRef]
  11. Wang, Z.; Duan, C.; Dong, S. Long-term wind and wave energy resource assessment in the South China Sea based on 30-year hindcast data. Ocean Eng. 2018, 163, 58–75. [Google Scholar] [CrossRef]
  12. Sun, Z.; Zhang, H.; Xu, D.; Liu, X.; Ding, J. Assessment of wave power in the South China Sea based on 26-year high-resolution hindcast data. Energy 2020, 197, 117218. [Google Scholar] [CrossRef]
  13. Sun, Z.; Zhang, H.; Liu, X.; Ding, J.; Cai, Z. Wave energy assessment of the Xisha Group Islands zone for the period 2010–2019. Energy 2021, 220, 119721. [Google Scholar] [CrossRef]
  14. Chen, W.; Liu, J.; Li, J.; Sun, L.; Li, B.; Xing, H.; Shi, P. Wave energy assessment for the nearshore region of the northern South China Sea based on in situ observations. Energy Rep. 2022, 8, 149–158. [Google Scholar] [CrossRef]
  15. Li, B.; Chen, W.; Li, J.; Liu, J.; Shi, P.; Xing, H. Wave energy assessment based on reanalysis data calibrated by buoy observations in the southern South China Sea. Energy Rep. 2022, 8, 5067–5079. [Google Scholar] [CrossRef]
  16. Wen, Y.; Kamranzad, B.; Lin, P. Joint exploitation potential of offshore wind and wave energy along the south and southeast coasts of China. Energy 2022, 249, 123710. [Google Scholar] [CrossRef]
  17. Ching-Piao, T.; Ching-Her, H.; Chien, H.; Hao-Yuan, C. Study on the wave climate variation to the renewable wave energy assessment. Renew. Energy 2012, 38, 50–61. [Google Scholar] [CrossRef]
  18. Zheng, C.W.; Li, C.Y. Variation of the wave energy and significant wave height in the China Sea and adjacent waters. Renew. Sustain. Energy Rev. 2015, 43, 381–387. [Google Scholar] [CrossRef]
  19. Zheng, C.; Zhang, R.; Shi, W.; Li, X.; Chen, X. Trends in significant wave height and surface wind speed in the China Seas between 1988 and 2011. J. Ocean Univ. China 2017, 16, 717–726. [Google Scholar] [CrossRef]
  20. Zheng, C.-W. Global oceanic wave energy resource dataset—With the Maritime Silk Road as a case study. Renew. Energy 2021, 169, 843–854. [Google Scholar] [CrossRef]
  21. Sun, P.; Xu, B.; Wang, J. Long-term trend analysis and wave energy assessment based on ERA5 wave reanalysis along the Chinese coastline. Appl. Energy 2022, 324, 119709. [Google Scholar] [CrossRef]
  22. Sun, P.; Wang, J. Long-term variability analysis of wave energy resources and its impact on wave energy converters along the Chinese coastline. Energy 2024, 288, 129644. [Google Scholar] [CrossRef]
  23. Liu, J.; Li, R.; Li, S.; Meucci, A.; Young, I.R. Increasing wave power due to global climate change and intensification of Antarctic Oscillation. Appl. Energy 2024, 358, 122572. [Google Scholar] [CrossRef]
  24. Duan, Y.; Liu, Y.; Li, M.; Zhou, M.; Yang, Y. Survey of reefs based on Landsat 8 operational land imager (OLI) images in the Nansha Islands, South China Sea. Acta Oceanol. Sin. 2016, 35, 11–19. [Google Scholar] [CrossRef]
  25. Shaw, P.-T. The seasonal variation of the intrusion of the Philippine sea water into the South China Sea. J. Geophys. Res. Oceans 1991, 96, 821–827. [Google Scholar] [CrossRef]
  26. Zheng, C.W.; Zhuang, H.; Li, X.; Li, X.Q. Wind energy and wave energy resources assessment in the East China Sea and South China Sea. Sci. China Technol. Sci. 2012, 55, 163–173. [Google Scholar] [CrossRef]
  27. Wang, Z.; Dong, S.; Dong, X.; Zhang, X. Assessment of wind energy and wave energy resources in Weifang sea area. Int. J. Hydrogen Energy 2016, 41, 15805–15811. [Google Scholar] [CrossRef]
  28. Dong, S.; Gong, Y.J.; Wang, Z.F.; Incecik, A. Wind and wave energy resources assessment around the Yangtze River Delta. Ocean Eng. 2019, 182, 75–89. [Google Scholar] [CrossRef]
  29. Su, H.; Wei, C.; Jiang, S.; Li, P.; Zhai, F. Revisiting the seasonal wave height variability in the South China Sea with merged satellite altimetry observations. Acta Oceanol. Sin. 2017, 36, 38–50. [Google Scholar] [CrossRef]
  30. Molina, M.O.; Gutiérrez, C.; Sánchez, E. Comparison of ERA5 surface wind speed climatologies over Europe with observations from the HadISD dataset. Int. J. Climatol. 2021, 41, 4864–4878. [Google Scholar] [CrossRef]
  31. Hersbach, H.; Bell, B.; Berrisford, P.; Biavati, G.; Horányi, A.; Muñoz Sabater, J.; Nicolas, J.; Peubey, C.; Radu, R.; Rozum, I.; et al. ERA5 hourly data on single levels from 1940 to present. Copernic. Clim. Chang. Serv. (C3S) Clim. Data Store (CDS) 2023. [Google Scholar] [CrossRef]
  32. Liu, J.; Li, B.; Chen, W.; Li, J.; Yan, J. Evaluation of ERA5 wave parameters with in situ data in the South China Sea. Atmosphere 2022, 13, 935. [Google Scholar] [CrossRef]
  33. Wang, J.; Li, B.; Gao, Z.; Wang, J. Comparison of ECMWF significant wave height forecasts in the China Sea with buoy data. Weather Forecast. 2019, 34, 1693–1704. [Google Scholar] [CrossRef]
  34. Li, J.; Tong, Y.; Xu, Y.; Chen, W.; Shi, P. Reconstruction of significant wave height for bottom-mounted acoustic profilers with pressure sensor failure: A case study. Ocean Eng. 2025, 319, 120270. [Google Scholar] [CrossRef]
  35. Li, B.; Li, J.; Liu, J.; Tang, S.; Chen, W.; Shi, P.; Liu, Y. Calibration experiments of CFOSAT wavelength in the Southern South China Sea by artificial neural networks. Remote Sens. 2022, 14, 773. [Google Scholar] [CrossRef]
  36. Liu, Y.; Lin, M.; Jiang, X.; Sun, X.; Song, X. A comparison of multiplatform wind products in the South China Sea during summer and autumn in 2019. J. Oceanol. Limnol. 2021, 39, 2181–2194. [Google Scholar] [CrossRef]
  37. Jiang, Y.; Han, S.; Shi, C.; Gao, T.; Zhen, H.; Liu, X. Evaluation of HRCLDAS and ERA5 Datasets for Near-Surface Wind over Hainan Island and South China Sea. Atmosphere 2021, 12, 766. [Google Scholar] [CrossRef]
  38. Silva, K.; Abreu, T.; Oliveira, T.C.A. Inter- and intra-annual variability of wave energy in Northern mainland Portugal: Application to the HiWave-5 project. Energy Rep. 2022, 8, 6411–6422. [Google Scholar] [CrossRef]
  39. Zhang, W.; Zhao, H.; Chen, G.; Yang, J. Assessing the performance of SWAN model for wave simulations in the Bay of Bengal. Ocean Eng. 2023, 285, 115295. [Google Scholar] [CrossRef]
  40. Schuster, U.; Watson, A.J.; Bates, N.R.; Corbiere, A.; Gonzalez-Davila, M.; Metzl, N.; Pierrot, D.; Santana-Casiano, M. Trends in North Atlantic sea-surface fCO2 from 1990 to 2006. Deep Sea Res. Part II 2009, 56, 620–629. [Google Scholar] [CrossRef]
  41. Santos, F.; Gómez-Gesteira, M.; de Castro, M.; Álvarez, I. Upwelling along the western coast of the Iberian Peninsula: Dependence of trends on fitting strategy. Clim. Res. 2011, 48, 213–218. [Google Scholar] [CrossRef]
  42. Kim, K.-Y.; Kim, Y. A comparison of sea level projections based on the observed and reconstructed sea level data around the Korean Peninsula. Clim. Change 2017, 142, 23–36. [Google Scholar] [CrossRef]
  43. Li, C. Interaction between anomalous winter monsoon in East Asia and El Nino events. Adv. Atmos. Sci. 1990, 7, 36–46. [Google Scholar] [CrossRef]
  44. Young, I.R.; Zieger, S.; Babanin, A.V. Global trends in wind speed and wave height. Science 2011, 332, 451–455. [Google Scholar] [CrossRef] [PubMed]
  45. Bromirski, P.D.; Cayan, D.R.; Helly, J.; Wittmann, P. Wave power variability and trends across the North Pacific. J. Geophys. Res. Oceans 2013, 118, 6329–6348. [Google Scholar] [CrossRef]
  46. Reeve, D.E.; Chen, Y.; Pan, S.; Magar, V.; Simmonds, D.J.; Zacharioudaki, A. An investigation of the impacts of climate change on wave energy generation: The Wave Hub, Cornwall, UK. Renew. Energy 2011, 36, 2404–2413. [Google Scholar] [CrossRef]
  47. Kamranzad, B.; Etemad-Shahidi, A.; Chegini, V. Assessment of wave energy variation in the Persian Gulf. Ocean Eng. 2013, 70, 72–80. [Google Scholar] [CrossRef]
Figure 1. (a) Topography and (b) climatological mean (1979–2024) of significant wave height in the South China Sea (SCS), accompanied by the location of the buoy observation (black triangle) employed in this study. The contour lines in (a) represent the 100 and 1000 m isobaths.
Jmse 13 00524 g001
Figure 2. Comparison of wave power density (Pw) between buoy observations and ERA5 data in the form of (a) a time series, (b) a scatter diagram, (c) quantile–quantile plots, (d) a histogram, and (e) probability density function (PDF) and cumulative density function (CDF) graphs.
Jmse 13 00524 g002
Figure 3. Variations in the monthly and annual mean Pw in the SCS during 1979–2024.
Jmse 13 00524 g003
Figure 4. Spatial distribution of (a) the climatological mean (1979~2024) Pw in the SCS and the interannual variation trend in Pw during (b) 1979~2024, (c) 1979~2011, and (d) 2011~2024, respectively. The contour lines with numbers in (a) indicate the Pw values. The contour lines in (bd) represent the trend equal to zero.
Jmse 13 00524 g004
Figure 5. Annual variations and trends in the seasonal mean Pw in the SCS from 1979 to 2024.
Jmse 13 00524 g005
Figure 6. Spatial distribution of the interannual variation trend in Pw in the SCS in the four seasons during 1979–2024, 1979–2011, and 2011–2024, respectively.
Jmse 13 00524 g006
Figure 7. Climatological means (1979–2024) of (a) annual wind speed cycle and (be) monthly wind fields in the SCS in April, July, October, and January.
Jmse 13 00524 g007
Figure 8. Variations and trends in the annual and seasonal mean wind speed in the SCS from 1979 to 2024.
Jmse 13 00524 g008
Figure 9. Spatial distribution of the interannual variation trend in the wind speed in the SCS in the four seasons during 1979–2024, 1979–2011, and 2011–2024, respectively.
Jmse 13 00524 g009
Figure 10. The 2011–2024 anomalous seasonal wind fields relative to the climatological seasonal means in summer and winter.
Jmse 13 00524 g010
Disclaimer/Publisher’s Note: The statements, opinions and data contained in all publications are solely those of the individual author(s) and contributor(s) and not of MDPI and/or the editor(s). MDPI and/or the editor(s) disclaim responsibility for any injury to people or property resulting from any ideas, methods, instructions or products referred to in the content.

