1. Introduction
Due to the large amount of human-caused greenhouse gas emissions that have exacerbated global climate change, carbon emission reduction has become the consensus of all countries in the world [
1]. The Global Warming Potential (GWP) was developed to compare the contribution of different gases to global warming, expressed as CO
2-equivalent (CO
2-eq) [
2]. The Sixth Assessment Report of the Intergovernmental Panel on Climate Change (IPCC) states that global surface temperatures have risen faster in the last 50 years than in any of the last 2000 years [
3]. Therefore, immediate actions to reduce carbon emissions should be taken.
In recent years, ship emissions have become a growing concern. According to the 4th Greenhouse Gas study conducted by the International Maritime Organization (IMO), maritime transport operations emit approximately 1.056 billion tons of carbon dioxide per year, accounting for about 2.89 percent of global greenhouse gas emissions [
4]. Three ship types, namely, container shipping, bulk carriers, and oil tankers, are the primary contributors to international shipping’s greenhouse gas (GHG) emissions [
4]. Container shipping has been one of the fastest-growing sectors of the shipping industry for the past three decades and is likely to continue to grow rapidly in the future [
5]. Therefore, reducing CO
2 emissions is an important issue that the container shipping industry must combat to achieve environmental sustainability.
IMO continues to develop and introduce mandatory regulations for energy saving and emission reduction to achieve GHG-reduction targets as soon as possible. IMO implemented the Energy Efficiency Design Index (EEDI) to new ships and the Ship Energy Efficiency Management Plan (SEEMP) to all ships in 2011 [
1]. IMO adopted the Initial Strategy for Reducing Greenhouse Gas Emissions from Ships In 2018, followed by a set of guidelines in 2022 to facilitate the implementation of the short-term measure of GHG reduction for ships. Over the past decade, the IMO has taken further action, including further regulatory measures and the revised IMO Greenhouse Gas Strategy to be adopted in 2023 [
6]. To support the implementation of these programs, IMO has been implementing a comprehensive program of capacity building and technical assistance, including a series of global projects [
7].
Reducing the Carbon Footprint (CF) of the shipping industry can be achieved through certain technical measures, such as replacing traditional fossil fuels with clean fuels. Currently, heavy fuel oil (HFO) is the main fuel used in the shipping industry, which has a high carbon content and generates a lot of greenhouse gases through combustion [
8,
9]. The use of alternative fuels, such as natural gas, hydrogen, methanol, and biofuel, can help mitigate greenhouse gas emissions. The biofuels presented in this paper are considered “carbon neutral”, meaning that the greenhouse gases emitted from the combustion of biofuels are absorbed by the growing biomass, and the new biomass is further used in the production of biofuels.
Biomass energy has become the fourth largest energy source after coal, oil, and natural gas. It currently accounts for about 10% of the world’s primary energy consumption and it is the most widely used renewable resource with significant emission-reduction effects [
10]. According to an estimation by the World Wide Fund for Nature (WWF), the global potential availability of biomass energy amounts to 8212 million tons of standard oil per year. Bio-oil can be obtained by using biomass pyrolysis and is regarded as a promising alternative fuel for fossil fuels due to its advantages of renewability, low carbon emissions, and abundant raw materials.
As an energy product, energy consumption and carbon emissions are present throughout the whole life cycle of bio-oil, from raw material extraction and production to its use, which will affect the surrounding environment to varying degrees. Therefore, it is necessary to study the carbon emission intensity of bio-oil as a marine alternative fuel by using life cycle assessment.
Compared with fossil fuels, bio-oils can reduce CO
2 emissions by at least 70%. Wang et al. [
11] made a comparative life cycle assessment of marine diesel, liquefied natural gas, methanol, biodiesel, and hydrogen with various energy production methods and studied their environmental impacts on super yachts. Their study investigated energy consumption and the environmental impact of alternative low-emission fuels over the complete vessel lifetime. The results show that the GHG emission reduction of replacing marine gas oil with bio-methanol and bio-diesel is 78.9% and 19.2%, respectively. By conducting a life cycle assessment (LCA) on the first high-power prototype offshore wind farm in China, Chen et al. [
12] found that the construction and wind turbine manufacturing stages contribute the most to the environmental impact during the entire lifecycle of this wind farm case. This case can reduce energy consumption and greenhouse gas emissions by 9.23 MJ and 767.9 g CO
2-eq for every 1 kWh of electricity produced, respectively. Balcombe et al. [
13] applied a comprehensive LCA and life cycle assessment (LCCA) of Liquefied Natural Gas (LNG) as a marine fuel with new emission measurement and supply chain data. The results show that LNG improves the air quality impact, reduces fuel costs, and generates moderate climate benefits. With the best-performing LNG engine and the optimized LNG supply chain, the GWP can be reduced by 28%. Obydenkova et al. [
14] proposed a biomass solvolysis route for crude lignin oil (CLO) production from forest residues and applied both LCA and life cycle impact assessment (LCIA) to such a biorefinery concept. The results show that by using such CLO as drop-in biofuel for methanol-propelled ships, up to 84% GHG emission reduction can be achieved compared to fossil alternatives. Kesieme et al. [
15] evaluated a life cycle assessment of upstream pathways toward straight vegetable oil (SVO) and biodiesel for shipping. The results show that the cultivation location has a strong influence on the environmental impacts of various pathways due to the differences in yield. Watanabe et al. [
16] concluded that the climate mitigation potential of biofuels relative to fossil alternatives is 65–85% in the short term (GWP
20) and 78–87% in the long term (GWP
100) climate impact.
The purpose of this paper is to evaluate the environmental and economic impact of replacing diesel with bio-oil for ship propulsion. Taking container ships on the Yangtze River mainline in the Anqing–Nanjing section as an example, the GHG emission and life-cycle carbon costs of diesel and bio-oil are determined by full LCA and LCCA.
2. LCA Calculation Model
Life Cycle Assessment is a cradle-to-grave assessment. The main idea is to consider the impact throughout the whole life cycle from raw material acquisition, manufacturing, transportation, operation and use, and secondary use of key components to end-of-life recycling during the assessment [
17]. It is now widely used to evaluate the environmental impact of products, processes, and activities.
The LCA consists of four steps: definition of objectives and scope, inventory analysis, impact assessment, and interpretation of results [
18]. In this paper, the objective of the LCA is to investigate the environmental impact of diesel and bio-oil as ship fuels, focusing only on greenhouse gas emissions—that is, the carbon footprint released during a twenty-year ship lifetime. The scope defines the functional units, system boundaries, data allocation procedures, data requirements, and quality criteria for original data quality requirements for diesel and bio-oil. The functional unit is the carbon footprint released by the consumption of diesel and bio-oil for propulsion over the life of the ship, expressed in ton CO
2-eq (tCO
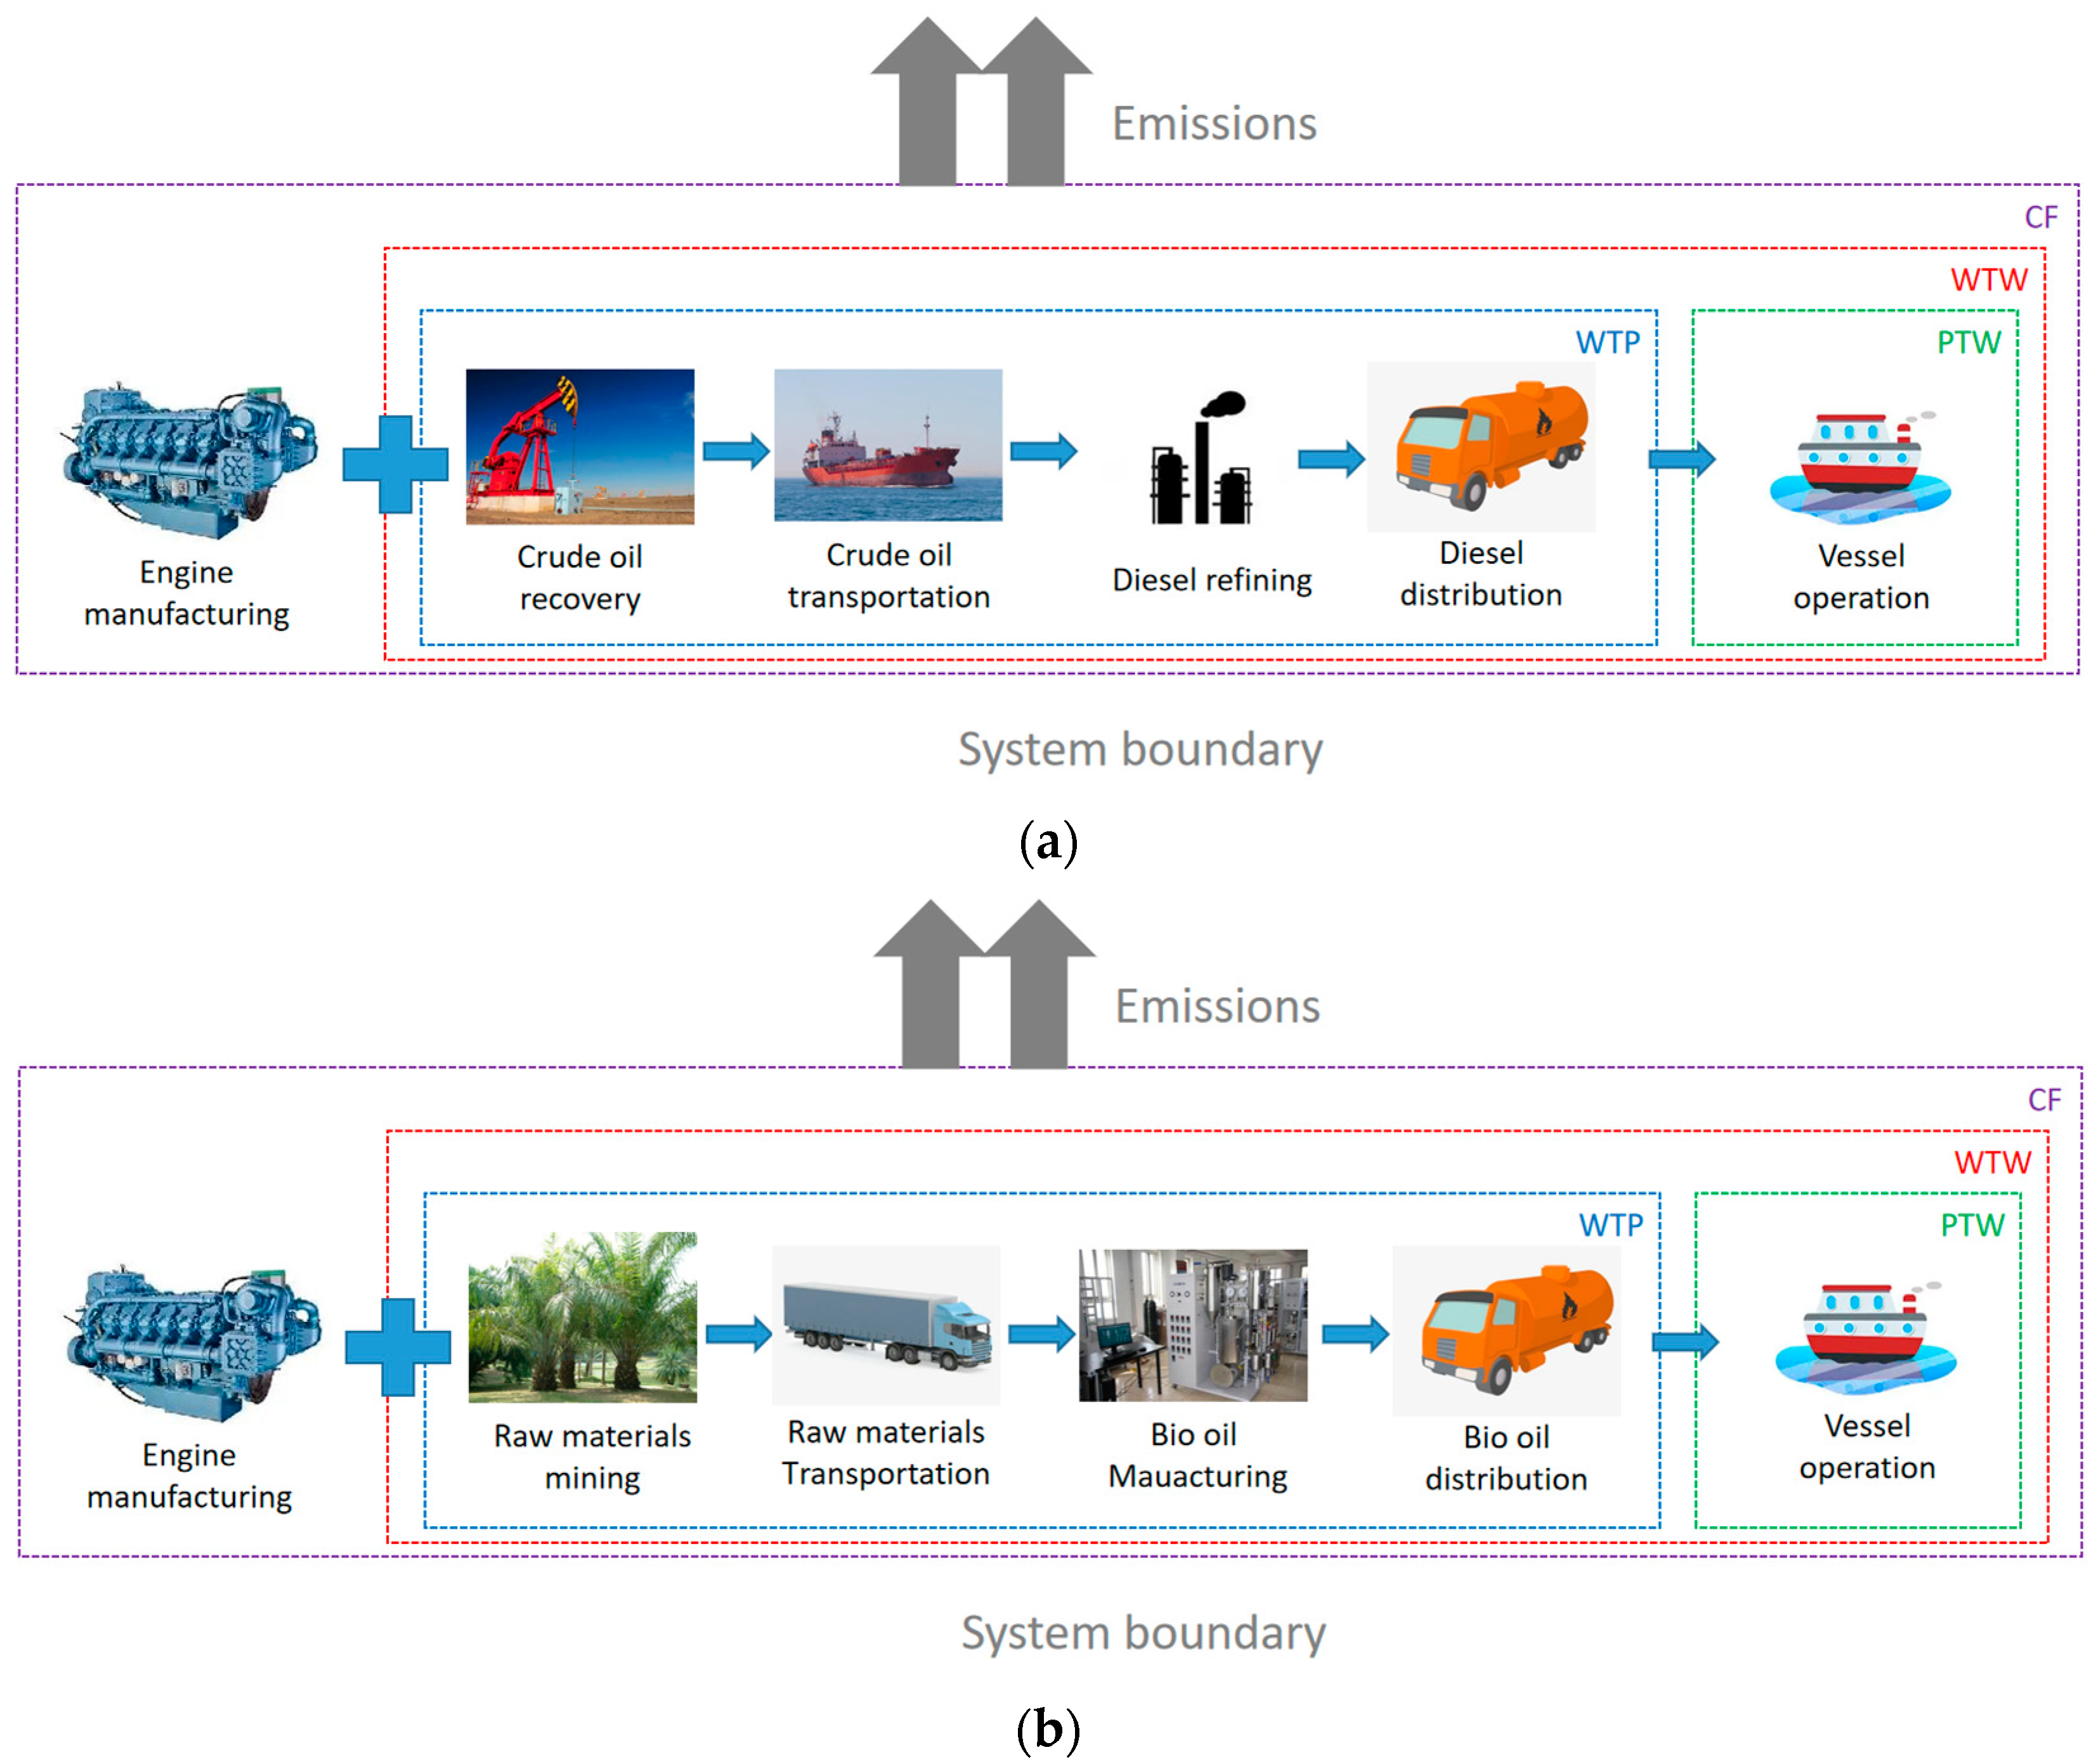
2-eq). The system boundary used in this paper is the “Well to Wheel (WTW)” approach, as shown in
Figure 1.
In this paper, the WTW is divided into two main stages, namely, the Well-to-Pump (WTP) stage and the Pump-to-Wheel (PTW) stage. The WTP stage, also known as the fuel production stage, includes crude oil or raw biomass extraction and transportation, fuel production and transportation, distribution, storage, and refueling processes. The PTW stage, also known as the fuel use stage, focuses on fuel consumption and greenhouse gas emissions of ship main engines [
19]. The assessment compares the total life-cycle emissions of bio-oils with that of diesel to provide insight into the feasibility of alternative fuels in the shipping industry.
2.1. WTP Stage
Total carbon emissions (E
WTP) from the production of 1 t of refined oil or bio-oil in the WTP stage are calculated by Equation (1). The WTP stage includes four sub-stages: raw material extraction (E
1), raw material transportation (E
2), oil refinery or bio-oil production (E
3), and refined oil transportation (E
4). The carbon emissions from each sub-stage are calculated separately for every 1 t of refined oil or bio-oil produced within the life mileage.
In this study, the crude oil for diesel production comes from the Jiangsu Oilfield. The crude oil is first transportation by tanker truck from Gaoyou, Yangzhou, to Zhoushan Port, Ningbo (510 km). Then, the crude oil is loaded into an oil tanker and shipped to Nanjing Wharf (556 km). Finally, it is transported through pipelines to the refinery (20 km). After diesel oil is produced, it is transported to the gas station (310 km) by tanker truck. The bio-oil is made from oil palms. The bio-oil refinery is built 20 km away from the oil palm plantation, and the harvested oil palm is transported to the refinery by truck. After the bio-oil is produced, it is first transported by tanker truck to Shuifu dock (1100 km) and then transported to Anqing gas station (2100 km) through the waterway.
2.1.1. Raw Material Extraction Stage
The raw material of diesel oil is crude oil, and the crude oil extraction stage mainly includes the steps of oil well exploration, crude oil extraction, crude oil gathering and handling, and crude oil storage and transportation. The carbon emissions in the crude oil extraction stage mainly come from the combustion of fuels used in various types of industrial boilers and engines and from the use of indirect energy such as electricity [
19]. This is calculated by multiplying the amount of crude oil required to produce 1 t of diesel or bio-oil (α, t/t) by the carbon emissions from the extraction of 1 t of crude oil (e
1, kg/t), such as in the following equation:
Based on the data from the National Bureau of Statistics, the average amount of crude oil consumption of 1 ton of diesel oil in China is 2.95 t. According to the carbon emission data regarding the unit crude oil exploitation stage in the GREET model (
https://greet.anl.gov/index.php?content=greetdotnet, accessed on 9 October 2023), the average CO
2 emission of 1 ton of crude oil exploitation is 0.03638 t after conversion [
20].
The raw materials of bio-oil are mainly biomass, such as oil palm, corn straw, and rapeseed hulls. The data on bio-oil in this paper are from bio-oil made from oil palm [
21]. In China, oil palm is mainly grown in tropical areas such as Hainan, Yunnan, Guangdong, and Guangxi. The residue of oil palm can be used as biomass fuel. Oil palm fruits grow in bunches, and they are orange-red when ripe, commonly known as oil palm fruit bunches. The fruit bunches are separated by hand or mechanically and split into palm fruit and palm empty fruit bunches. Palm fruit bunches contain about 60–70% moisture, and after mechanical crushing and drying, they become shredded, and the moisture can be reduced to less than 50%, which can be directly burned in boilers as biomass fuel. The palm fruit can be divided into three layers: the outer layer is the palm mesocarp, the middle layer is the palm shell, and the inner layer is the kernel. The mesocarp is pressed to extract palm oil, and the residue is Mesocarp Fiber (MF), which can be used as biomass fuel. The kernels are pressed to extract palm kernel oil, and the residue is a palm kernel cake (CAKE), which can also be used as a biomass fuel. The shell is hard, uniform in size, has good liquidity, is low in moisture, and is high in calorific value, making it a very good biomass fuel that can be burned directly in a furnace [
22]. Considering that oil palm absorbs carbon dioxide through photosynthesis during its growth process and taking into account land use change issues, this stage results in negative carbon emissions [
23].
2.1.2. Raw Material Transportation Stage
After extraction, the raw materials need to be transported to the refineries in various locations for processing. It is assumed that the loss of raw materials in the transportation stage is not considered. The carbon emission in the transportation stage mainly comes from the energy consumption of transportation means. Possible methods of raw material transportation include pipeline, rail, water, and road transportation. Given the different fuels used by various transportation modes, data on average distance, typical transportation means, and emission factors of each transportation mode are required to calculate carbon emissions at this stage (see
Table 1 for details [
24]). The carbon emissions of producing 1 ton of fuel in the crude oil transportation stage are calculated by Equation (3) as follows:
where α denotes the consumption of crude oil for production of 1 t fuel, t/t; L
1 refers to the average distance of each transportation mode, km; S refers to the energy intensity of each transportation mode, KJ/(t·km); β
1 denotes the proportion of fuel used by each transportation mode; m denotes the carbon emission factor of each transportation mode, g/MJ; and b denotes the proportion of each transportation mode.
2.1.3. Refinery Production Stage
Carbon emissions in the refinery production stage include direct emissions and indirect emissions. Direct emissions include combustion emissions, process emissions, and fugitive emissions. Combustion emissions are generated from the combustion of fossil fuels during the refinery production process, process emissions are generated during the refinery production process, and fugitive emissions are leakage or unintentional discharge of gases or vapors during the working process. Indirect emissions mainly include those generated from the use of purchased electricity and steam. The specific calculation method used in this paper is based on the standard of the Chinese petroleum and chemical industry [
25], as shown in Equation (4):
where P
r refers to the energy consumption used for producing 1 ton of fuel, t/t; E
a refers to the total carbon emission of the refinery, kg; and C refers to the total energy consumption equivalent of the refinery, kg.
2.1.4. Transportation of Refined Oil Products
The calculation method to determine the carbon emissions of the refined oil transportation stage is similar to that used in the raw material transportation stage. The only difference is that the carbon emissions are calculated per unit of refined oil transportation in this stage, as shown in Equation (5). To calculate the carbon emissions of this stage, the data on the transportation mode, average distance, typical transportation means in each transportation mode, and their emission factors are required. The data used in this study are listed in
Table 2.
where L
2 denotes the average distance of each transportation mode, km; β
2 denotes the proportion of fuel used by each transportation mode; m refers to the carbon emission factor of each transportation mode, g/MJ; and b refers to the proportion of each transportation mode.
2.2. PTW Stage
In this paper, the Anqing–Nanjing section of the Yangtze River was selected, as shown in
Figure 2. The details of the selected Yangtze River mainline container ship with an annual transportation plan are shown in
Table 3 [
26]. Assuming that the lifetime (LT) of this vessel is fifteen years, the life mile (LM) is calculated by Equation (6):
where N
A refers to the number of round trips per year.
The existing power system configuration with a new diesel engine is set as the baseline. Given that the ships have been in use for a short time, it is assumed that the new diesel engine will be replaced within the next 15 years. During this period, the emissions of the different fuels used on these ships are analyzed.
Due to the actual conditions, such as weather conditions and fuel consumption, the actual operating speed of the ship differs from the design speed (V
de). The average ship speed (V
ave) is the route length (l) divided by the trip duration (t). The average ship power (P
ave) is related to the main engine(s) power and is calculated by Equation (7) as follows:
Then, the energy consumption per unit distance (EC, kWh/nm) is calculated according to Equation (8):
Assuming that the energy requirements and energy consumption per unit distance are the same for different power system configurations on existing diesel-powered vessels, the fuel consumption per unit distance (FC, kg/nm) of the vessel is calculated by Equation (9):
SFC refers to the unit fuel consumption of different fuels, also known as the engine fuel consumption rate. The fuel consumption rates of bio-oil are relatively higher than that of diesel [
28].
In the shipping sector, the PTW stage means the fuel use stage—that is, the operation stage of the ship. This stage has exhaust emissions (TE, g/nm) from fuel combustion in the engine. The TE is calculated by multiplying the fuel consumption per unit distance of the ship by the greenhouse gas emission factor of various types of pollutants (EF
i), as shown in Equation (10):
where i denotes the different types of pollutants.
Greenhouse gases released during the life cycle of the ship by using diesel and bio-oil are expressed in CO
2-eq, as shown in Equation (11):
In summary, the total GHG emissions in the WTP phase and PTW stage are calculated in Equation (12) and Equation (13), respectively:
3. LCCA Calculation Model
In order to compare the cost of diesel and bio-oil power units, we need to perform a full life cycle cost assessment of both power systems, which means calculating the total cost of all units over the life of the ship. The total cost includes the investment cost and the development cost. Among them, the investment cost (C
in) includes the ship’s price, engine price, and conversion price. It is calculated by multiplying the average power of the ship by an assumed conversion factor of 1727 CNY/kW [
29], as shown in Equation (14):
The development cost includes the fuel cost, maintenance cost, and carbon emission cost. In China, the price of diesel fuel (PR
D) for diesel-powered ships is 6.2 CNY/kg, and the price of bio-oil (PR
B) is 5.9 CNY/kg. The life cycle fuel cost (LCFC) is calculated according to Equation (15):
where LM denotes life mileage and FC denotes fuel consumption per unit distance of the ship.
According to the work of Iannaccone [
30], the ship maintenance cost is assumed to be 0.097 CNY/kWh. The life cycle maintenance cost (LCMC) is calculated as follows:
where EC refers to the energy consumption of the ship.
Carbon tax refers to the cost of allowed CO
2 emissions, which is based on the price of CO
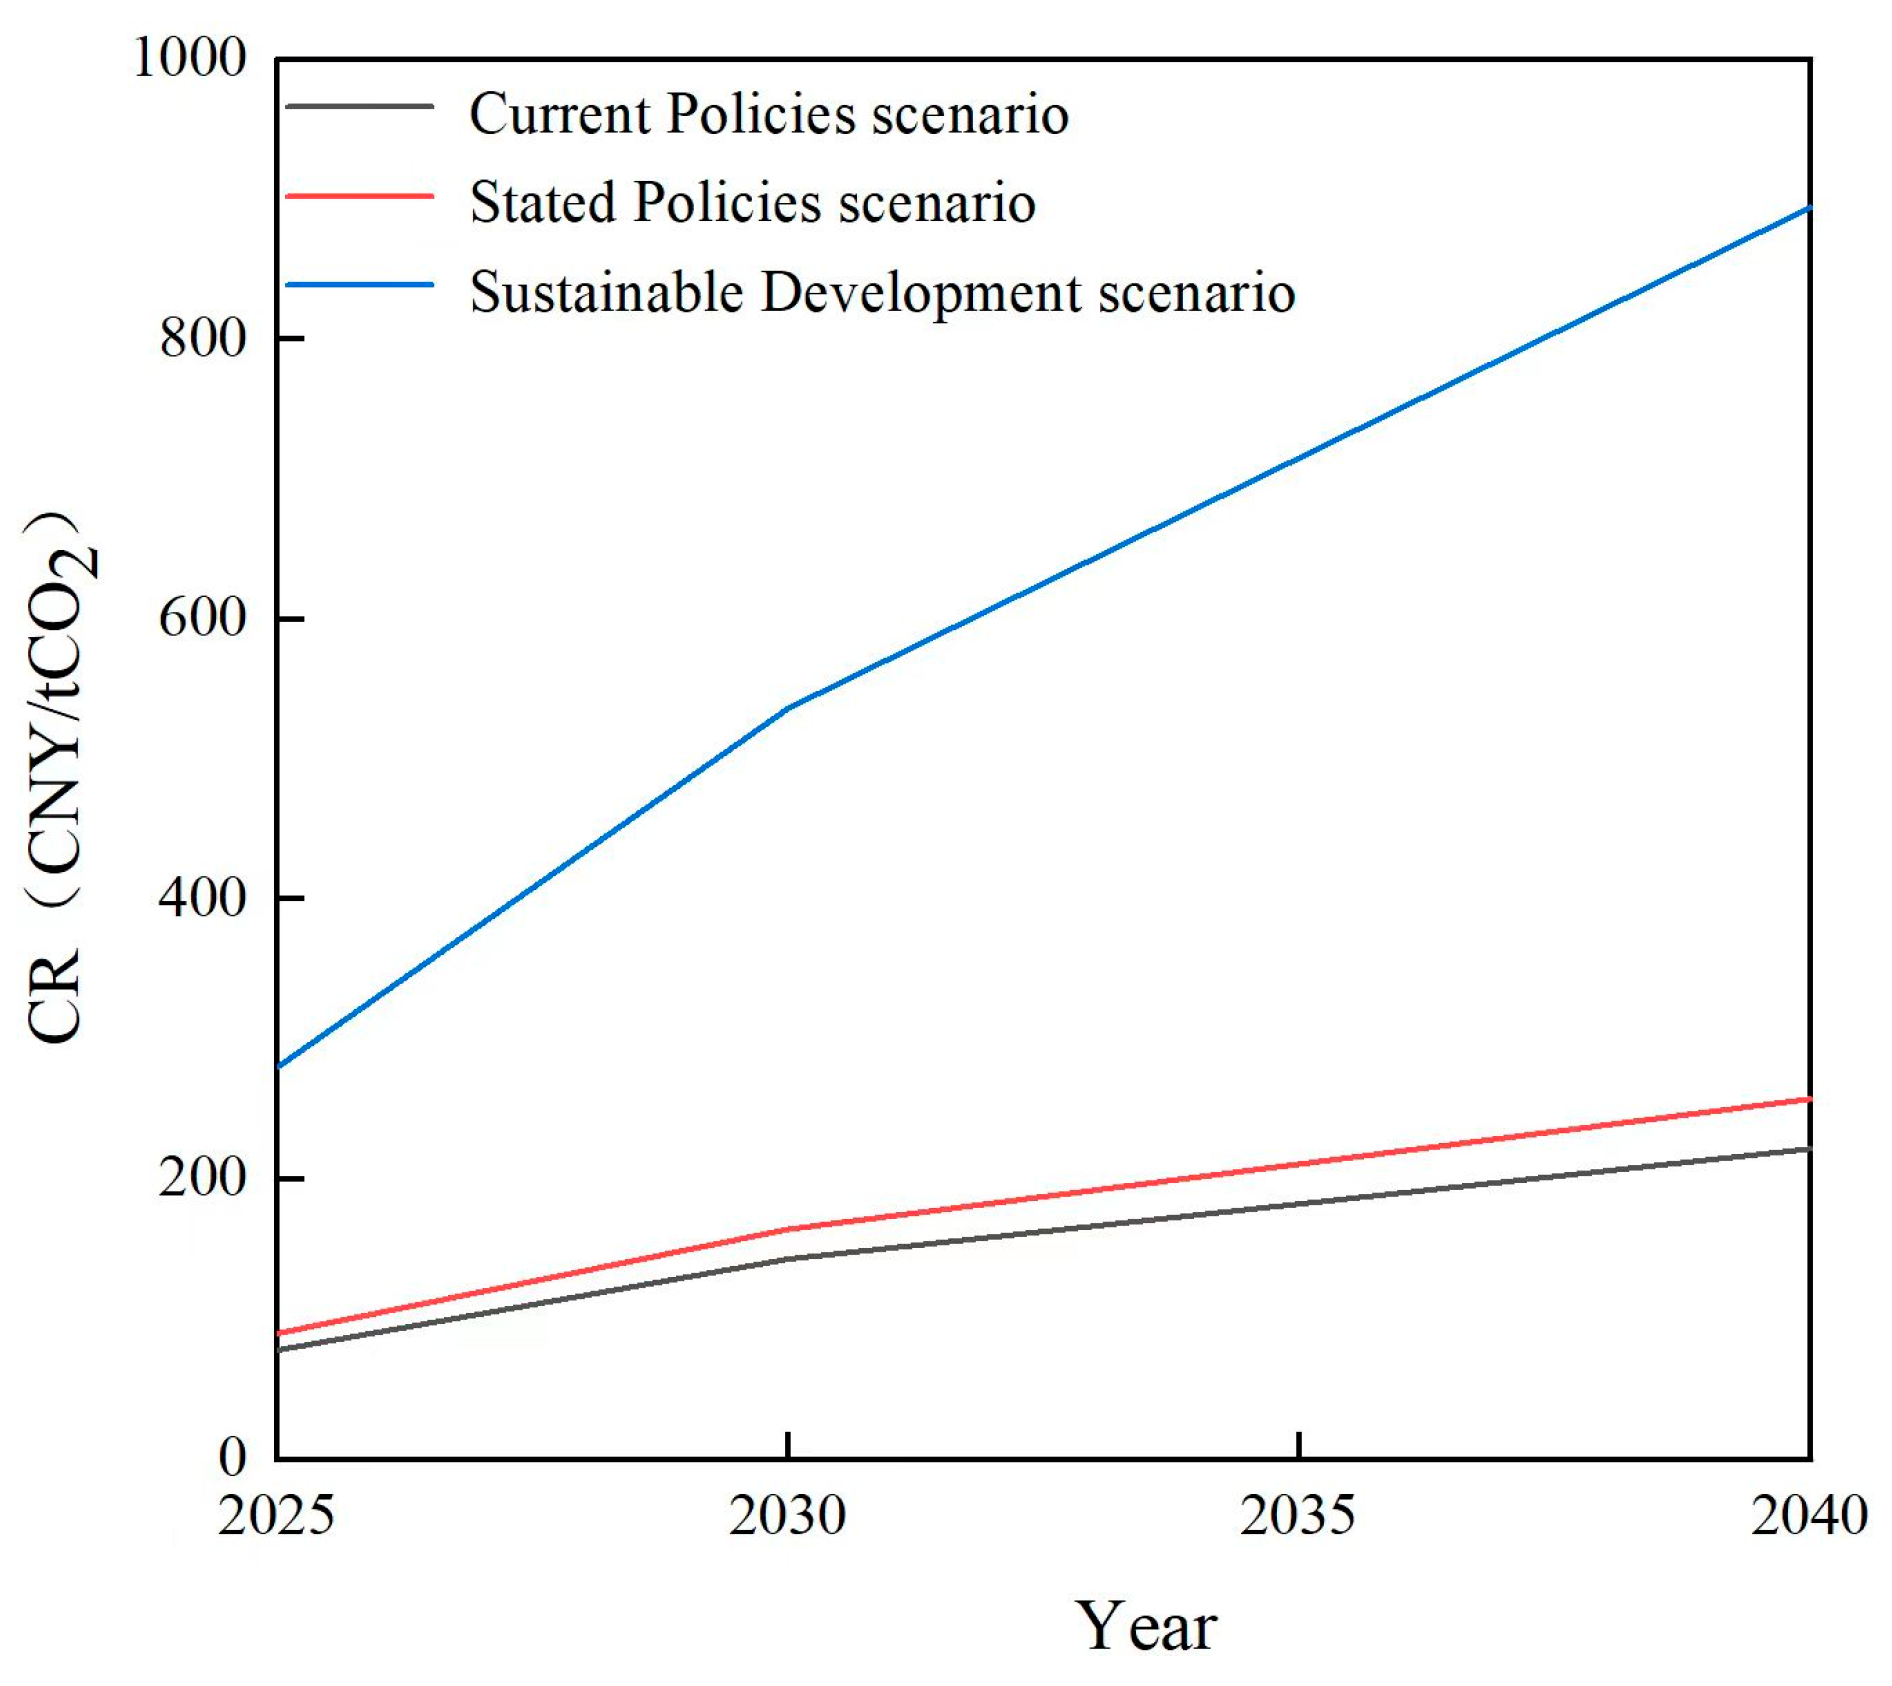
2 (CR). There is no cost of carbon emission in the shipping industry yet, but it is necessary to evaluate the cost of carbon emissions because such a carbon price will certainly lead to extra costs for shipping companies. Moreover, there may be a limit on carbon emission allowances in the future. The estimation of carbon tax for China from 2026 to 2040 (CNY/t CO
2) is adopted over a span of 15 years from the World Energy Outlook 2019 [
31]. The World Energy Outlook 2019 includes CO
2 prices in three different scenarios, and only the current policy scenario is discussed here. The current policy scenario refers to the policies implemented in the energy sector currently and does not consider any policy changes in the future. In addition to this, there are prescribed policy scenarios and sustainability scenarios shown in
Figure 3. The life cycle carbon emission cost (LCCEC) over a span of 15 years for different scenarios is calculated in the same way according to Equation (17):
where PTW
A,i refers to the average annual tailpipe emissions, and CR
i refers to the tax price of CO
2 in year i.
5. Conclusions
In this paper, the life cycle carbon emission and carbon emission cost of utilizing diesel and bio-oil as fuel for container ships on the Yangtze River mainline are calculated and compared based on the life cycle assessment theory. The WTW approach, which is further divided into the WTP and PTW stages, is adopted as the system boundary when applying LCA and LCCA analysis, while the data required for calculating the carbon emission in each stage are gathered.
According to the results of LCA and LCCA analysis, the total emissions of bio-oil fuels are only 34.58% lower than diesel, and the total cost is 8.22% higher than that of diesel; this fuel is still something to look forward to. Considering the global energy crisis, if fossil fuels are used all the time, this non-renewable energy source will be depleted at some point in the future. The abundance of biomass energy makes bio-oil fuel a highly desirable alternative fuel.
The accuracy and applicability of the data are the keys to the calculation of the whole life cycle carbon emissions, which requires a lot of data. Additionally, due to constraints in research duration, this paper only utilizes data pertaining to bio-oil derived from palm. A comparative analysis involving bio-oil from various alternative raw materials will be been conducted in further research. Using the progress of the research in this paper, taking the current research status of related aspects into account, the following perspectives are proposed for the research on the whole life cycle carbon emissions of bio-oil.
In the future, the ship power energy represented by bio-oil is undoubtedly a direction for shipping practitioners to work and a trend for the development of new energy power systems of ships in the future. In the face of the depletion of fossil energy and increasingly serious emission pollution, environmental protection measures have been strengthened, and supportive policies for the development of new clean energy sources have been implemented to promote development all over the world. With the continuous development and application of information technology, new energy research will develop faster and faster in the future. As a major oil importer, China consumes huge amounts of oil, so it is urgent to promote new energy power systems in China.


