Abstract
The micromechanical mechanism of pipe instability under lateral force actions on sloping sandy seabeds is unclear. This study investigated the effects of slope angle and instability direction (upslope or downslope) on pipe–soil interaction instability for freely laid and anti-rolling pipes using coupled discrete element method and finite element method (DEM–FEM) simulations. The numerical results were analyzed at both macro- and microscales and compared with the experimental results. The findings revealed that the ultimate drag force on anti-rolling pipes increased with slope angle and was significantly larger than that on freely laid pipes for both downslope and upslope instabilities. Additionally, the rotation-induced upward traction force was proved to be the essential reason for the smaller soil deformation around freely laid pipes. Moreover, the shape differences in the motion trajectories of pipes were successfully explained by variations in the soil supporting force distributions under different slope conditions. Additionally, synchronous movement between the pipe and adjacent particles was identified as the underlying mechanism for the reduced particle collision and shear wear on pipe surfaces under a high interface coefficient. Furthermore, an investigation of particle-scale behaviors revealed conclusive mechanistic patterns of pipe–soil interaction instability under different slope conditions. This study could be useful for the design of pipelines in marine pipeline engineering.
1. Introduction
Subsea pipelines are crucial components in offshore engineering, facilitating the transportation of oil, gas, and other resources from ocean to land [1,2,3,4]. These pipelines are usually installed on sloping seabeds and are often exposed to lateral hydrodynamic forces caused by ocean water flows or tides [5,6,7]. The interaction between the untrenched pipelines and granular soils under lateral hydrodynamic force actions on sloping seabeds is complex [6,8,9]. However, conventional pipeline designs are usually based on studies on horizontal seabeds, overlooking the lateral pipe–soil interaction instability under lateral oblique force actions on sloping seabeds [2,3,10]. It is evident that the slope condition introduces variations in forces and moments for pipe–soil interactions, leading to inaccurate estimation of pipe lateral instability and the intensity of pipe–soil interactions on the seabed [2,6]. Therefore, investigating pipe–soil interaction behavior and pipe stability under lateral oblique force actions on sloping seabeds is important for marine pipeline design and ensures engineering safety.
Previous studies have shown significant interest in understanding the behavior of marine pipe–soil interactions under lateral oblique force actions [1,10,11,12,13,14]. Researchers have conducted scaled model tests, including centrifugal tests, and field trials using mechanical-actuator methods to evaluate the instability of untrenched pipelines and explore the relationship between soil resistance and pipe displacements on soil seabeds [6,15,16,17,18]. These experimental tests have revealed that several factors, such as soil type, magnitude and direction of lateral force actions, pipe surface roughness, end constraint condition of pipes, and initial embedment, influence the untrenched pipe–soil interaction behaviors [6,8,19,20,21]. Among these factors, the slope angle and the direction of lateral force action play crucial roles in determining pipeline–soil interaction instability on seabeds [2,6]. However, the specific influence of slope on pipe–soil interactions under lateral oblique force actions has received limited attention thus far [3,6]. Additionally, over the past few decades, numerous numerical simulation studies have been conducted to enhance our understanding of progressive pipe–soil interactions under lateral oblique force actions [6,22,23]. These simulation studies have typically employed the Coulomb friction theory or other improved theories to develop empirical pipe–soil interaction models for predicting pipeline instability on seabeds [5,6,15,24]. Undoubtedly, these experimental tests and numerical simulations have contributed to the scientific understanding of pipe–soil interaction instability under lateral oblique force actions on sloping seabeds.
However, previous studies on untrenched pipe–soil interactions on sloping seabeds have primarily focused on soil resistance magnitude, macroscale pipe movement behaviors, and pipe instability [2,6,25]. Consequently, the mechanisms of microscale pipe–soil interactions on sloping seabeds remain unclear. Furthermore, previous continuous numerical methods, such as the finite element method (FEM), have failed to accurately simulate particle sliding and collision behaviors, as well as large deformation behaviors of the soil [6,22,23,26,27]. This limitation has reduced the precision of analyzing pipe–soil interaction in granular soil environments. Additionally, many pipe–soil interaction behaviors on underwater slopes observed in experimental studies, such as different soil deformation under downslope and upslope conditions, variable motion trajectories of pipes, and particle-slide induced shear wear on pipe surfaces, have not been systematically explained [3,5,6]. Currently, the discrete element method (DEM) is favored by many scientists for its ability to analyze microscopic granular soil behaviors and their interaction with structures [28,29,30,31]. The DEM also excels in discontinuity and large deformation analysis [28,32,33], making it a preferred choice for simulating various granular soil-related issues during pipe–granular soil interactions [34,35,36,37]. However, the DEM is weak in modeling the behaviors of continuous materials such as structures; this is due to the fact that in the DEM, structures are typically represented by rigid walls, which are unable to model continuous stress and deformation [35,38,39]. Therefore, investigating the stress, deformation, and shear wear of pipe structures (continuous materials) solely using the DEM has proven to be difficult. Therefore, it is desirable to combine the advantages of both the DEM and the FEM to analyze pipe–soil interactions under lateral oblique force actions, considering the strengths and weaknesses of each method. To the best of the authors’ knowledge, no studies in the current literature have utilized coupled DEM–FEM simulations to investigate pipe–soil interaction instability under lateral oblique force actions on sloping seabeds.
Accordingly, this study aims to explore lateral pipe–soil interaction instability on sloping sandy seabeds from micro- to macroscales through a series of three-dimensional coupled DEM–FEM simulations. The research begins by comparing lateral soil resistance–displacement curves obtained from model tests and numerical simulations, followed by examining macroscale soil resistance distributions and soil deformation phenomena. Subsequently, the detailed behaviors of the pipes, including their motion trajectory, stress and deformation, and surface shear intensity, are investigated, taking into account different slope angles and instability directions (upslope or downslope). Additionally, several conclusive patterns of lateral pipe–soil interaction on sloping seabeds are identified through further analysis of microparticle behaviors. The findings of this study provide new insights into understanding the lateral movement behaviors of submarine pipes and shed light on the mechanisms of pipe–soil interaction instability on sloping sandy seabeds.
2. Simulations of Pipe–Soil Interaction Behaviors with Coupled DEM–FEM
2.1. Brief Description of Pipeline Lateral Instability on Sloping Seabeds
With the expansion of oil and gas exploration into deeper waters, the lateral hydrodynamic action exerted by ocean water flow has become a dominant factor affecting submarine pipelines [22]. The on-bottom stability of long-distance untrenched pipelines varies significantly and is highly dependent on the end constraint conditions [3,6]. Two commonly encountered end constraint conditions (rotation conditions) for model pipes are as follows: (1) Anti-rolling condition, where the pipe’s rolling motion is restricted, but it can move freely parallel and perpendicular to the seabed surface. (2) Freely laid condition, where the pipe can rotate around its axis without any end constraint and can move freely in parallel and perpendicular directions to the seabed surface.
Unlike previous studies that primarily focused on the on-bottom stability of pipelines on horizontal seabeds, the on-bottom stability of pipelines on sloping seabeds is more complex. Figure 1 illustrates two different lateral on-bottom instability modes induced by the relative water flow actions on sloping seabeds: (a) Upslope instability, where the pipe moves upward along the sloping seabed (θ is positive). (b) Downslope instability, where the pipe moves downward along the sloping seabed (θ is negative). Additionally, the magnitude of the seabed slope angle should also be considered when analyzing the lateral on-bottom stability of pipelines. As mentioned earlier, the lateral on-bottom stability of a submarine pipeline under ocean wave/current involves complex flow–pipe–soil interaction, which refers to the interaction between hydrodynamic loading, the untrenched pipeline, and the surrounding soil. The ultimate lateral soil resistance (FRu) for pipe instability is mainly influenced by pipeline parameters, sand properties, and hydrodynamic load characteristics. Previous studies on pipe lateral instability [3,6] have provided expressions for the ultimate lateral soil resistance (FRu) parallel to the slope surface and the corresponding pipe–soil contact force (FCu) perpendicular to the slope surface, which can be expressed as follows:
where FDu is the ultimate drag force on the pipe; G is the submerged weight of the pipe per meter; and θ is the slope angle.
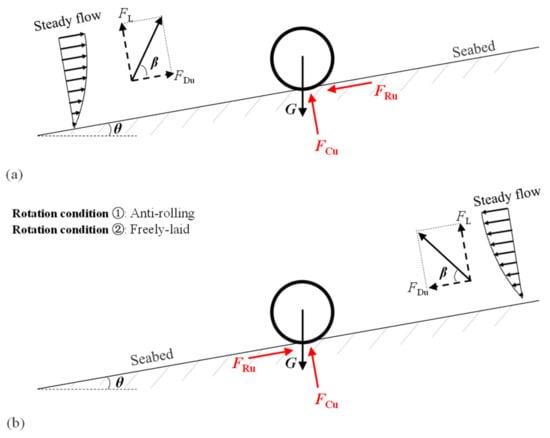
Figure 1.
Schematic diagrams illustrating the lateral on-bottom instability of a submarine pipeline on sloping seabeds: (a) upslope instability and (b) downslope instability.
2.2. The Adopted Model Tests
This study followed the large-scale model tests conducted by Gao et al. [3]. Silty fine sand with a particle median diameter (d50) of 0.11 mm was used in these model tests. The buoyant unit weight () of the sandy soil was 9.02 kN/m3 while the internal friction angle of the soil was 32°. The relative density of the sand was 16%. The pipe used in the tests had a diameter (D) of 0.35 m and a submerged weight of 0.801 kN/m. To simulate the lateral hydrodynamic action on the pipe during the experiments, a mechanical actuator simulation method was employed. The mechanical-loaded pipe–soil interaction facility (Figure 2) served as the main test facility for modeling pipe lateral instability on sloping sand beds. A displacement-controlled testing program was implemented in the mechanical actuator system. An inclined force was generated on the model pipe by a stepper motor through two cables: one connecting the pipe and the live pulley, and the other connecting the live pulley and the stepper motor via two fixed pulleys (Figure 2). Based on Jones’s study (1976), the resultant hydrodynamic load on the pipe was found to be obliquely upwards with an inclination angle ranging approximately between 53° and 57° (around 55°). Thus, the length of the front cable was adjusted to achieve a specific inclined load angle (approximately 55°) in the model tests. Detailed analysis of the loads on the submarine pipeline was provided by Gao et al. [3,15].
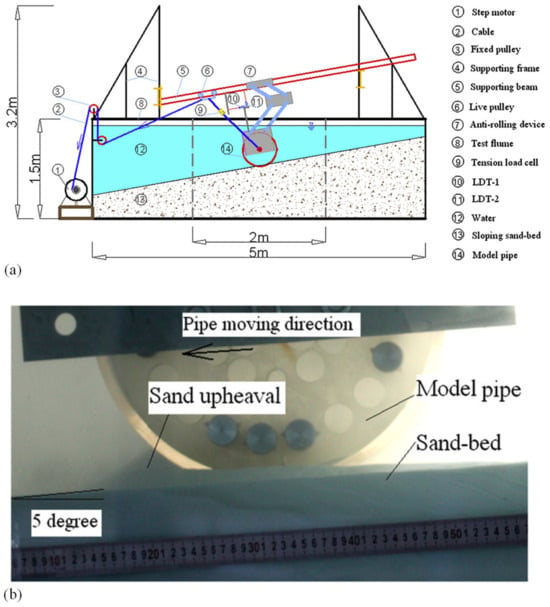
Figure 2.
Experimental model testing setup for simulating pipe lateral instability on sloping seabeds (modified from Gao et al. [3]): (a) schematic diagram illustrating the experimental tests and (b) photo of the experimental tests.
Non-contact measurements of pipe displacements were performed using two laser displacement transducers (LDT-1 and LDT-2): LDT-1 measured the lateral displacement of the pipe (parallel to the seabed surface), while LDT-2 measured the settlement perpendicular to the seabed. A tension load cell installed on the front cable was used to measure the inclined load exerted on the model pipe. Experimental observations were recorded using a digital video camera placed behind a transparent glass wall. The additional settlement, lateral displacement of the test pipe, and corresponding load were measured simultaneously during the loss of lateral stability of the pipe. Further details of the adopted model tests can be found in Gao et al. [3].
2.3. Methodology of Coupled DEM–FEM
In this study, a coupled approach combining the discrete element method (DEM) and the finite element method (FEM) was employed to investigate the lateral instability of submarine pipes on sloping sandy seabeds. The numerical models in the three-dimensional DEM–FEM simulations had the same pipe size, slope angle, and pulling direction as the model tests conducted by Gao et al. [3]. Granular soil is suited for simulation using DEM, while solid structures are suited for continuous numerical simulations [40,41,42,43,44,45]. As in previous DEM–FEM coupling research [33], commercial DEM-FEM softwares were used in this study. In this study, the granular soil was represented by spherical balls in the DEM part, while the pipe was simulated using finite element meshes in the FEM part. This approach has been previously validated as an effective method for simulating soil–structure interaction [43,46,47]. In the model tests, the pipes exhibited only slight deformation compared to their displacement, meeting the requirement for implementation of the one-way transient DEM–FEM coupling method [48,49]. As in previous studies [33,46,50,51], this one-way transient coupling algorithm involved computing boundary data (i.e., particle forces on the surface of the structure) using the DEM and subsequently integrating it into the FEM simulation as a condition at each step, without providing feedback from the FEM to the DEM. During the DEM–FEM coupling, the particle forces on the boundary of the pipe (triangular geometry) were collected first in the DEM part, and then the vertex force per boundary triangle was computed as the average of the values corresponding to the surrounding triangles. Next, these forces on the vertex were used for mechanical transient structure analysis in the FEM part.
As shown in Figure 3a, a three-dimensional (3D) particle domain with several fixed boundaries was used to model a thin slice of soil perpendicular to the pipe axis, following the approach of Macaro [34]. The boundaries of the container consisted of several frictionless walls. As shown in Figure 3b, the domain thickness adopted in the simulations presented here was 100 mm. The pipe segment was implemented via finite element mesh (triangular geometry) as a circular cylinder (the number of vertices was 6888), and the mechanical parameters for the pipe were based on the elastic properties of steel. In DEM-based simulations, particle size in the numerical simulation is usually much larger than that in model tests while the span of particle size distribution is narrower to obtain an acceptable computational cost, especially for three-dimensional engineering structure–soil interaction simulations, as presented in previous studies [34,38,52,53,54]. The diameters of particles in this simulation were between 12 and 24 mm while the median particle diameter (d50) was 16 mm, generated by the gravity deposition method [55]. In the gravity deposition method, as in previous studies [56,57], particles were released from the top of the container, and the slope angle for the sand deposit was controlled by adjusting the inclination angle of the deposition apparatus (wall boundary). Thus, the modeled mean grain size (d50) in the DEM simulations met the requirement that the d50 should be smaller than 1/5 (approximately 1/6 in this study) of the domain thickness to neglect the boundary effect in the out-of-plane direction [34,38]. Additionally, the particle size in the DEM met the criterion that the ratio of the pipe diameter to d50 should be larger than 10 (approximately 22 in this study), according to previous research [34,38,58,59,60]. The total number of particles generated in the simulations ranged from 100,032 to 173,284 in different slope angle cases.
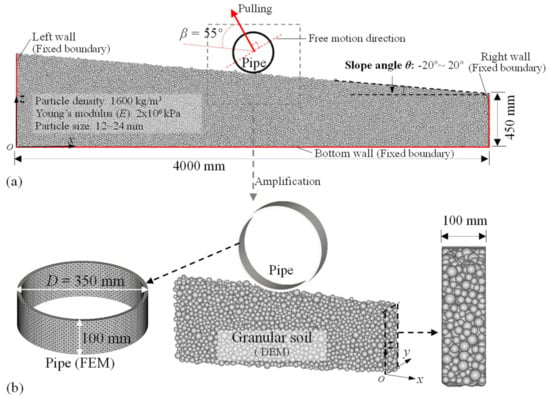
Figure 3.
DEM–FEM simulation model of the pipe–sand interaction on sloping seabeds: (a) front view, (b) local details.
In accordance with previous simulations [33,61], the Hertzian spring–dashpot model was used for calculating the normal contact behavior, while the linear spring Coulomb limit model was used for calculating the tangential contact force behavior. The tangential to normal stiffness ratio was set to the commonly recommended value of 1.0. To model the pulling behaviors observed in the model test conducted by Gao et al. [3], where the pulling direction was at an angle of 55° to the slope surface, the pulling direction was controlled with the same angle of 55° in the numerical simulations, as illustrated in Figure 3. The pulling actions were velocity-controlled, with a pulling velocity of 1.74 mm/s, consistent with the velocity used in previous model tests [3,6]. The relative density of the sandy soil in the model tests was matched in the DEM-based simulations, with a relative density of 16% (void ratio of 0.83); this value was obtained using the commonly used method proposed by Deluzarche et al. [32]. In the method proposed by Deluzarche et al. [32], the relative density of granular soil (void ratio) is controlled by the friction coefficient of particles during the gravity deposition process of soil: a small void ratio can be obtained with a particle friction coefficient of 0.0 with vibration, while the largest void ratio can be obtained with a high friction coefficient. Based on former DEM-based studies on pipe–soil interactions [34,35,36,38,39,59], the elasticity modulus (E) was set at 2.0 × 10⁶ kN/m2 and 2 × 10¹¹ kN/m2 for the particles and the pipes, respectively, while the particle–particle friction coefficient was 0.5. Based on previous experiences in considering particle shape effects [62,63,64,65,66,67], the widely used linear spring rolling limit model proposed by Wensrich and Katterfeld [65] was used, and the rolling resistance (RR) of the particles was set at the typical value of 0.10 to model particle shape effect. In the numerical simulations, the critical timestep (6.7 × 10⁻⁵ s) was determined through extensive preliminary simulation analyses to ensure the stability of the results. The timestep in the simulations was 4.5 × 10⁻⁵ s, smaller than the critical step.
The calibration of the DEM models was performed on the basis of force–displacement curves obtained from the experimental tests (Figure 4), following previous studies on large-scale soil–structure interaction [68,69,70,71]. According to previous studies based on the DEM [47,72,73], direct calibration using force–displacement curves in large-scale physical experiments offers a comprehensive reflection of the intensity of structure–soil interaction on a physical level; this method reflects both the action and the properties of the structure, as well as the properties of the soil, compared with other calibration methods, such as calibration solely by parameters in small-scale soil property tests [33,68,69,73]. The friction among the particles was 0.5 while the interface friction between the pipe and the granular soil was 0.45 after the calibration: all within a rational range according to previous DEM simulations [74,75,76]. Table 1 gives the main parameters adopted in the coupled DEM–FEM simulations.
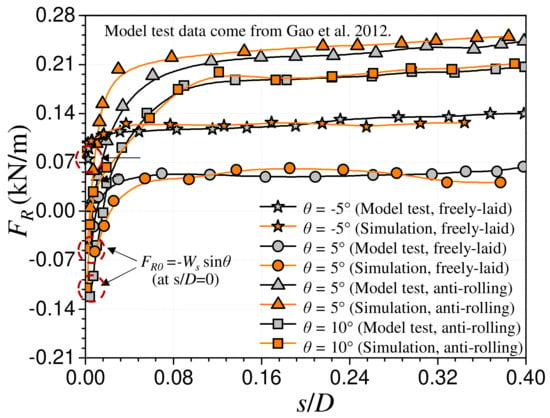
Figure 4.
Relationships between lateral soil resistance FR and lateral displacement s/D in the model tests and numerical simulations [3].

Table 1.
Main parameters used in the DEM–FEM simulations.
In the coupled DEM–FEM numerical study, the effect of fluid (water) in the experimental tests was simplified (not directly modeled). The simulations were based on well-drained conditions (with negligible excess pore water pressure) for the following three reasons [3,15]: a. the adopted model tests were based on sandy soil, a kind of soil that facilitates the dissipation of excess pore pressure; b. the pipe was moving on the surface of the seabed (not buried in the soil), a fine drainage boundary; c. the steady moving velocity of the pipes was moderate (1.74 mm/s) on the soil surface. However, it should be noted that the drained condition in the DEM–FEM simulations (which accounts for the effect of water by using the buoyant unit weight of particles) is a simplification of real experimental tests.
Note that unacceptable computational efficiency will result if particle details in a DEM simulation are the same as those in model tests [34,38,52,53,54]. Therefore, it is widely accepted that, in DEM-based simulations, many factors such as particle size, shape, and size distribution are simplified compared to those observed in model tests, in order to achieve acceptable computational efficiency [77,78,79,80,81,82]. Consequently, rather than aiming for precise numerical values, simulations based on the DEM often prioritize providing valuable insights into the micromechanical mechanisms and trends in soil behavior.
3. Results and Analyses
3.1. Soil Resistance and Macro Pipe–Soil Interactions
The evaluation of the ultimate drag force on pipes provides a comprehensive reflection of the intensity of pipe–soil interaction for pipe instability analyses on sloping seabeds [2,6,19]. Relationships between ultimate drag force FDu and slope angle θ in the numerical simulations are shown in Figure 5. Obviously, the ultimate drag force FDu in a downslope condition was much smaller than that in an upslope condition, which is consistent with the common sense that moving downward is easier than moving upward on slopes. When comparing the ultimate drag force FDu in anti-rolling and freely laid conditions, the FDu was significantly larger (more than double) in anti-rolling conditions. In freely laid conditions, as the slope angle increased to |θ| ≥ 10°, “static instability” occurred, indicating that the freely laid pipe is relatively unstable on slopes. In anti-rolling conditions, as the slope angle (θ) increased, the FDu increased significantly at first and then gradually tended to be stable, without the occurrence of “static instability” for |θ| ≤ 20°. This demonstrates that the end constraint (anti-rolling) noticeably enhances the stability of pipes on slopes. Therefore, both the slope effect and the end constraint effect on pipe–soil interactions warrant attention for evaluating pipe instability.
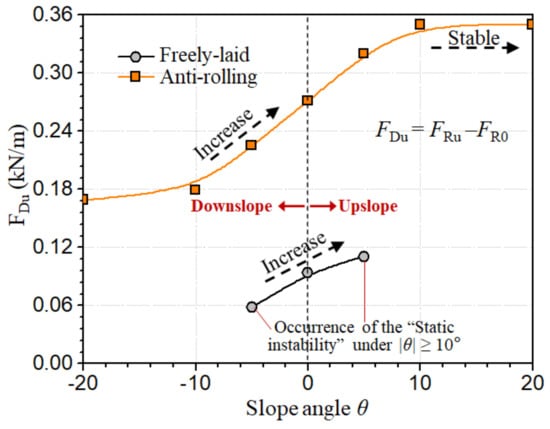
Figure 5.
Relationships between the ultimate drag force (FDu) and the slope angle θ as they affect pipe instability in the numerical simulations.
The soil deformation and the distribution of soil resistance (or supporting force) around pipes provide valuable insights into the manner of pipe–soil interaction on granular soil slopes. Figure 6 illustrates the progressive soil supporting force distributions and soil deformation around freely laid pipes under different slope angle conditions. In all cases, as the pipes rotated, a concave deformation beneath the pipe was formed due to particle slides under the weight effect of the pipes. In the case of a pipe experiencing downslope instability on a sloping seabed (see Figure 6a), the main supporting forces were consistently located on the downslope side of the pipes. In the case of a pipe experiencing instability on a flat seabed (see Figure 6b), the supporting forces were located on both sides of the pipes in the stationary conditions (S/D = 0), but the main supporting forces shifted to the pipe moving direction after noticeable pipe movement. In the case of a pipe experiencing upslope instability on a sloping seabed (see Figure 6c), the main supporting force zones underwent a location transition from being on the downslope side, to being on both sides, and, finally, to being on the upslope side, as the pipes rotated. Furthermore, in all cases, no significant soil upheaval in front of the pipe’s movement direction was observed, and the concave deformation beneath the pipe noticeably decreased after pipe rotation. These observed soil deformations will be further analyzed in subsequent sections of this paper.
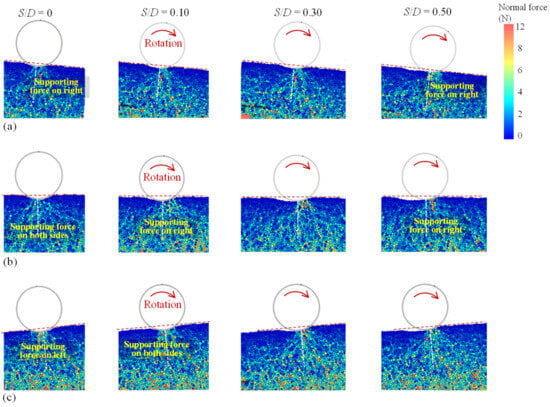
Figure 6.
Progressive soil supporting force distributions and soil deformation around freely laid pipes at different slope angle conditions: (a) θ = −5° (downslope), (b) θ = 0° (flat), and (c) θ = 5° (upslope).
Figure 7 illustrates the distribution of soil resistance and progressive soil deformation of anti-rolling pipes on slopes under different slope angle conditions. To better illustrate how the soil upheaval in the pipe moving direction can be especially small in downslope conditions, the progressive soil supporting force and soil deformation distributions under θ = −10° are presented in Figure 7a. On the whole, the zone of supporting force distributions was similar to that in Figure 6, but the magnitude of the supporting forces was larger, which aligns with the larger ultimate drag force observed under anti-rolling conditions in Figure 5. Additionally, soil upheaval emerged in front of the pipe’s movement direction, and the concave deformation of the slope surface and the soil upheaval increased with the slope angle θ in Figure 7, which is consistent with the increased ultimate drag force as slope angles increased in Figure 5. When comparing the settlement and soil deformation around freely laid pipes (see Figure 6) with that occurring around anti-rolling pipes (see Figure 7), it is notable that the settlement and soil deformation around anti-rolling pipes was significantly larger. This difference can be attributed to the influence of rotation-induced traction force on granular soil slopes, which will be further analyzed in the following sections.
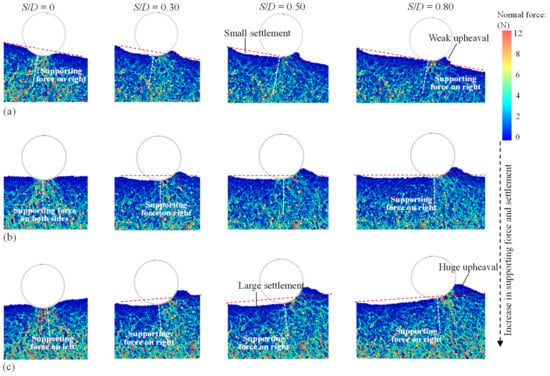
Figure 7.
Progressive soil supporting force and soil deformation distributions around anti-rolling pipes at different slope angle conditions: (a) θ = −10° (downslope), (b) θ = 0° (flat), and (c) θ = 5° (upslope).
It is important to note that the magnitude of soil deformation around pipes on a sloping seabed provides valuable insights into the intensity of pipe–soil interactions and is closely related to the magnitude of the ultimate drag force. Comparing Figure 6 and Figure 7 reveals that the soil deformation around pipes in freely laid conditions is significantly smaller than that in anti-rolling conditions, consistent with findings from previous experimental studies [3,6]. However, previous studies have provided only vague interpretations for the smaller settlement of pipes in freely laid conditions, attributing it to a smaller ultimate drag force affecting pipe instability. In fact, the smaller settlement of pipes in freely laid conditions can be clearly explained. To clarify the underlying reasons, it is crucial to prioritize the recognition that the soil deformation around pipes is primarily induced by the gravitational force of the pipes (G), based on the force analyses in Figure 1. As shown in Figure 8, in the freely laid condition, the rotation of a pipe on the concave soil surface would induce an obliquely upward force (FT), partially counteracting the pipe’s gravity (G). Consequently, the soil deformation around the pipe decreases after significant pipe rotation on the concave soil surface. In the anti-rolling condition, where there is no pipe rotation and, therefore, no obliquely upward traction force to counteract the pipe’s gravity (G) due to the pipe’s end constraint, the soil deformation caused by the pipe’s weight is pronounced. Therefore, the upward traction force induced by rotation is the main reason for the smaller soil deformation around pipes in freely laid conditions.
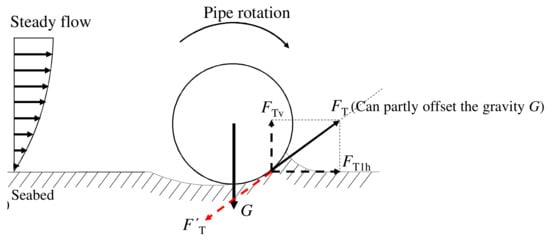
Figure 8.
Schematic diagram illustrating the effect of free rotation on pipe–soil interaction on a concave soil surface.
3.2. Progressive Pipe Behaviors on Sloping Seabeds
The evaluation of pipe–soil interactions on sloping seabeds can benefit from analysis of the motion trajectory, stress, deformation, and shear wear characteristics of pipes [83,84,85]. However, the existing literature on DEM-based analysis lacks specific studies examining the influence of granular soil slopes on the stress, deformation, and shear wear characteristics of pipes from a cross-sectional perspective [1,86,87,88]. As previously discussed, the intensity of anti-rolling pipe–soil interactions is significantly stronger than that of freely laid pipe–soil interactions on sloping seabeds. Consequently, this section primarily focuses on the behaviors of anti-rolling pipes.
The motion trajectory of pipes provides a comprehensive reflection of the intensity and manner of pipe–soil interactions on sloping seabeds. In scientific research, the motion trajectory of pipes is often compared using lateral displacement–settlement curves [6,15,18]. Previous studies [1,3] have pointed out the complexity of lateral displacement– settlement curves for pipes on sloping seabeds: sometimes a peak point exists in the lateral displacement–settlement curves, while at other times there is no peak point. To understand the pattern of pipe settlement development during lateral movement, lateral displacement–settlement curves for pipes under different slope angles (negative angle indicates downslope instability conditions) were produced and are presented in Figure 9. The lateral displacement and the settlements of pipes were normalized by the pipe diameter (D). By comparing the lateral displacement–settlement curves from the simulation results (see Figure 9), certain patterns can be observed. The pipe settlement continuously increased with lateral displacement when the slope angle was small (θ = −10° in typical downslope instability conditions). In contrast, the pipe settlement initially decreased and then increased with the increase in lateral displacement, exhibiting an obvious peak at lower values when the slope angle was large (θ = 10° and 20° in typical downslope instability conditions).
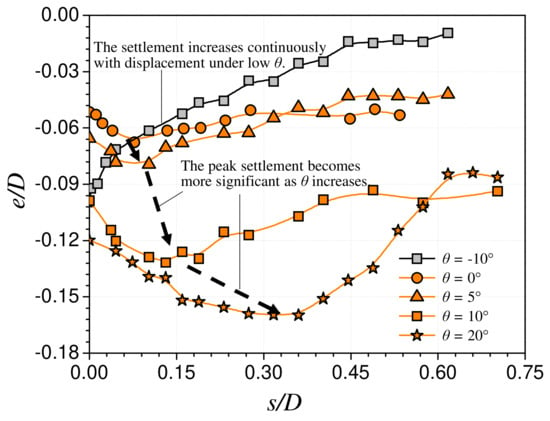
Figure 9.
Normalized pipe settlement (e/D) vs. normalized lateral displacement (s/D) for anti-rolling pipes on sloping seabeds.
In fact, the observed shape rules in pipe settlement–displacement curves can be further elucidated by the differences in soil supporting force distributions under different slope conditions. Under the condition of no pipe movement on sloping seabeds (Figure 10a), the primary supporting force is concentrated on the downslope side of the pipe tip on the sloping seabed (as verified by the images in Figure 7c). If we only consider the effect of an obliquely upward driving force, the settlement of pipes will continuously decrease after the driving force is applied, due to the counteracting effect on the pipe’s gravity. However, the change of soil support force distributions during lateral pipe movement also significantly affects the settlement of pipes. In the case of upslope instability (Figure 10b), the downslope supporting zone (contact zone) will be lost after the obliquely upward movement of pipes, resulting in an insufficient soil supporting force to counteract the pipe’s gravity G. Consequently, the settlement of the pipe will increase due to the unbalanced gravitational force acting on the pipe, and the main soil supporting force will be transferred to the upslope side. In the case of upslope instability, the combination of the obliquely upward driving force and the change in soil support force distributions would result in a turning point on the pipe settlement–displacement curves. In the case of downslope instability (see Figure 10c), although the contact area on the upslope is reduced (much smaller contact area) after the pipes move downward, the main soil supporting force on the downslope side, which counteracts the gravity (G) of the pipes, experiences less change. As a result, the settlement of the pipe is mainly influenced by the obliquely upward driving force, leading to a continuous reduction in pipe settlement as the pipe moves laterally.
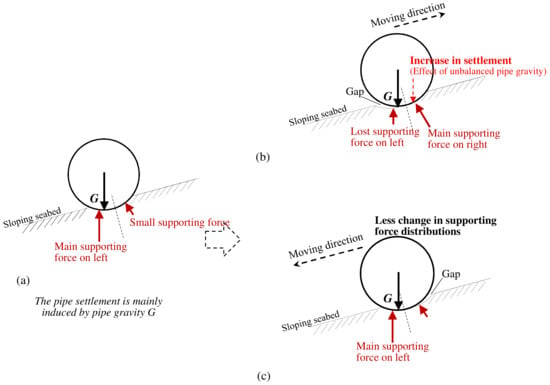
Figure 10.
Schematic diagram illustrating the mechanism of the shape rules in pipe settlement–displacement curves for anti-rolling pipes on granular soil slopes: (a) stationary (Initial position), (b) upslope instability (after applying obliquely upward action), and (c) downslope instability (after applying obliquely downward action).
In the study conducted by Gao et al. [3], no experimental data on pipe stress and deformation were provided. This section aims to analyze the stress and deformation of pipes in cross-sections, which serves as a supplementary analysis to the experimental tests. Figure 11 illustrates the typical pipe stress and deformation in the central cross-sections for downslope instability and upslope instability. In all cases, the largest pipe deformations were observed in the lower part of the pipes in the pipe moving direction, which corresponds well to the main contact zone of pipe–soil interactions (see Figure 7). Due to the significant soil resistance at the pipe–soil interface, concave pipe deformation appeared in the lower part of the pipes in the pipe moving direction. In the downslope instability condition (θ = −5° in Figure 11a), the zone of concave deformation rotated slightly counterclockwise as the lateral pipe displacement increased, owing to the slight rise in soil upheaval in front of the pipe’s movement direction. In the upslope instability condition (θ = 5° in Figure 11b), the stress and concave deformation of the pipes were larger than those in the downslope instability condition. Moreover, as a result of significant soil upheaval in front of the pipe’s movement direction, the zone of concave deformation on the pipes exhibited noticeable rotation as lateral pipe displacement increased. The numerical simulation results indicate that the lower position ahead of the pipe’s movement is relatively susceptible to deformation. In the upslope instability condition, the pipe deformation deserves more attention for failure analysis.
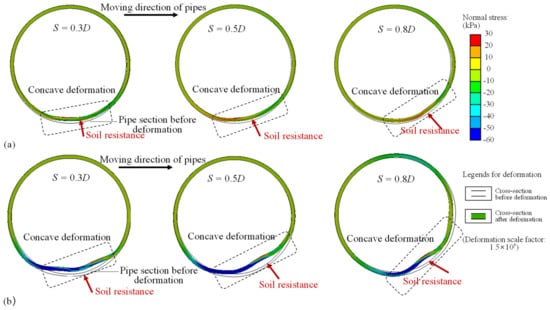
Figure 11.
Comparison of the deformation of anti-rolling pipes in cross-sections: (a) θ = −5° (downslope instability) and (b) θ = 5° (upslope instability).
The tendency for shear wear to occur is a crucial factor in determining the placement of monitoring equipment and coatings to protect against seawater corrosion on pipelines. The pipe–soil interaction behaviors depicted in Figure 7 indicate a complex tendency for shear wear to occur on the outer surface of pipes. The intensity of shear wear mainly depends on the shear intensity [89]. As previously discussed, the intensity of pipe–soil interactions for freely laid pipelines is significantly weaker than that of anti-rolling pipe–soil interactions on sloping seabeds; thus, the shear intensities of freely laid pipe–soil interactions in all cases were found to be weak. Figure 12 presents the typical shear intensities on the pipe bottoms under different slope angles (negative angles represent downslope instability conditions) and different interface friction coefficients. In all cases, the main areas of high shear intensity were observed on the side of the pipe moving direction due to the predominant soil resistance on the side (the side in front of the pipe’s movement direction). Moreover, the shear intensity increased with the slope angles (from downslope instability to upslope instability), which corresponds to the increased soil resistance in front of the pipe’s movement direction with the increase in slope angles, as reflected in Figure 7. According to common sense, a higher interface friction coefficient leads to a higher interface friction force and, consequently, higher interface shear intensity. However, an interesting phenomenon was observed: the shear intensity on the bottom of the pipes increased with a decrease in the interface friction coefficient, as shown in Figure 12d–f. The reasons for the decrease in interface shear intensity with an increasing friction coefficient will be explained in detail in the following sections.
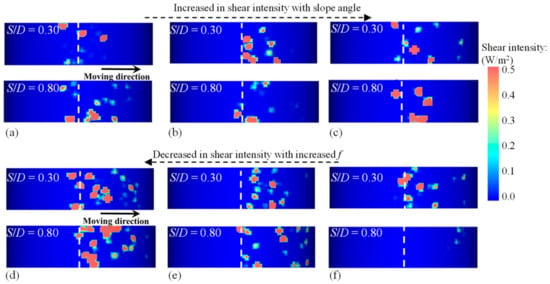
Figure 12.
Comparison of the position and shear intensity on the bottom of anti-rolling pipes: (a) θ = −10° (f = 0.45), (b) θ = −5° (f = 0.45), (c) θ = 0° (f = 0.45), (d) θ = 5° (f = 0.30), (e) θ = 5° (f = 0.45), and (f) θ = 5° (f = 0.60).
3.3. Particle-Scale Soil Behaviors and Patterns of Pipe–Soil Interaction on Sloping Seabeds
Understanding particle-scale behaviors is crucial for comprehending the complex mechanisms of soil deformation and the interactions between structures and soil [90,91]. This section provides a more in-depth exploration of the interface shear behaviors, soil shear bands, soil disturbance and deformation zones, and patterns of pipe–soil interaction instability on sloping seabeds, with a focus on particle-scale behaviors.
The shear intensity on the pipe surfaces is directly related to the sliding and collision behaviors of particles at the pipe–soil interfaces. Figure 13 provides the particle collision behaviors on pipe–particle interfaces under different interface friction coefficients (θ = 5°, for example). Numerous particle collisions were observed on the side of the pipe moving direction, which aligns with the zone of high shear intensity depicted in Figure 12. Additionally, the frequency of particle collisions and the sliding distances decreased with an increase in interface friction coefficients, consistent with the shear intensity shown in Figure 12d,e. This indicates that as the interface friction coefficients increase, the pipe and adjacent particles tend to move together to interact with the surrounding soil.

Figure 13.
Comparison of the position and slide distance of particle collisions on the surface of anti-rolling pipes (θ = 5°) under different interface friction coefficients: (a) f = 0.30, (b) f = 0.45, and (c) f = 0.60.
Furthermore, the particle rotation velocity distributions provide further evidence of the shear behaviors on the pipe surfaces. Previous studies [33,92] have shown that the zone of high particle rotation velocities in granular soil is indicative of the position of strong soil shear. Figure 14 explores the relationships between microparticle rotation velocity and shear bands or shear behaviors around pipes. In downslope instability conditions (θ = −5°, for example), significant particle rotation occurred around the downslope zone of the pipes, as shown in Figure 14a, reflecting a high shear intensity in the zone. Additionally, the zone of high particle rotation velocities was relatively small in Figure 14a, corresponding to a limited soil upheaval in front of the pipe’s movement direction. In upslope instability conditions (θ = 5°, for example), a soil shear band emerged below the interface shear zone in Figure 14b. This is associated with a pronounced soil upheaval in front of the pipe’s movement direction. Interestingly, no notable particle rotation velocity was observed at the pipe–soil interface when the interface friction coefficient increased to f = 0.6 in Figure 14c; in this scenario, only a significant soil shear band at some distance from the interface (the soil shear band below the interface shear zone) was observed, suggesting that the particles on the pipe–soil interface move together with the pipes rather than undergoing relative sliding. The weak surface shear wear (see Figure 12) and fewer particle collisions (see Figure 13) under high interface friction coefficient conditions also support the synchronous movement of the pipe and adjacent particles. Clearly, the particle rotation behaviors based on discrete element method (DEM) simulations effectively reflect the differences in soil shear induced by slope and interface friction effects.
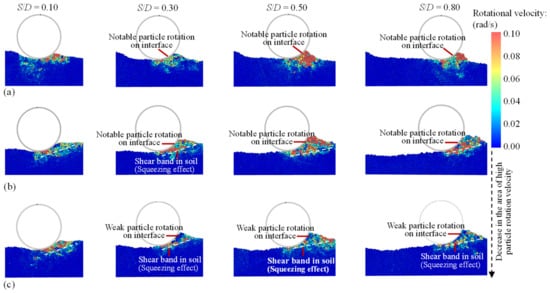
Figure 14.
Comparison of the particle rotation velocity and soil shear behaviors in the progressive soil deformation process around anti-rolling pipes on sloping seabeds: (a) θ = −5° (f = 0.45), (b) θ = 5° (f = 0.45), and (c) θ = 5° (f = 0.60).
The trajectories and the translation velocity of particles at each tracing point in the pipe–soil interaction process are fundamental for in-depth interpretation of soil failure behaviors [33,93]. Figure 15 illustrates the trajectories of the particles and their translation velocities at each tracing point. In cases with freely laid pipes (Figure 15a), the short particle trajectories and low particle translation velocities indicate limited soil disturbance and weak pipe–soil interaction on sloping seabeds. In cases with anti-rolling pipes (Figure 15b–f), the long particle trajectories and high particle translation velocities indicate significant settlement of pipes on sloping seabeds; in these cases, the long and oblique trajectories of particles were a result of the strong squeezing movement of the pipes. Within the particle trajectory zones, the velocity of particle translation decreased with soil depth as a result of the increasing confining effect in deeper soil. Furthermore, the area of strong pipe–soil interaction zones increased with slope angles (from downslope instability to upslope instability), as increased by the increased area of particle trajectory zones. In summary, the end constraint condition of pipes, instability directions (upslope or downslope), and slope angles significantly influence the extent of soil disturbance on sloping seabeds.
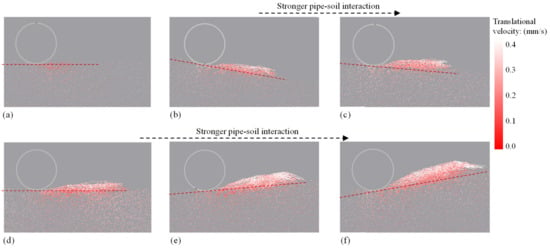
Figure 15.
Comparison of particle trajectories and particle translation velocities during the progressive pipe–soil interaction process on sloping seabeds: (a) θ = 0° (freely laid), (b) θ = −10° (anti-rolling), (c) θ = −5° (anti-rolling), (d) θ = 0° (anti-rolling), (e) θ = 5° (anti-rolling), and (f) θ = 10° (anti-rolling).
3.4. Patterns of Pipe–Soil Interaction on Sloping Seabeds
In the field of marine pipeline engineering, pipelines are often found on sloping seabeds [1,11,14]. Therefore, it is crucial to analyze the patterns of lateral pipe–soil interactions under lateral oblique force actions on sloping seabeds. This study’s macro- and microscale analyses of pipe–soil interaction yielded the mechanistic patterns of pipe–soil interactions on sloping seabeds, as shown in Figure 16. For freely laid pipes, without restraint, on sloping seabeds (Figure 16a), the pipes are able to rotate freely. As a result, the pipe–soil interaction is characterized by small pipe settlement and relatively mild soil disturbance, regardless of the instability directions (upslope or downslope). For anti-rolling pipes in downslope instability conditions (Figure 16b), the pipe–soil interaction is characterized by reduced pipe settlement and relatively weak soil upheaval as the pipe moves along the slope surface. For anti-rolling pipes in upslope instability conditions (Figure 16c), the pipe–soil interaction is characterized by an arc settlement trajectory and huge soil upheaval in front of the pipe’s movement direction. In summary, the end constraint condition of pipes, instability directions (upslope or downslope), and slope angles significantly affect the patterns of interaction between pipes and granular soil on sloping seabeds. Therefore, applying conventional design theory while ignoring the effect of deformable slopes can lead to misjudging of the soil failure behaviors and the intensity of pipe–soil interactions under lateral oblique force actions, posing a hidden danger to engineering safety.
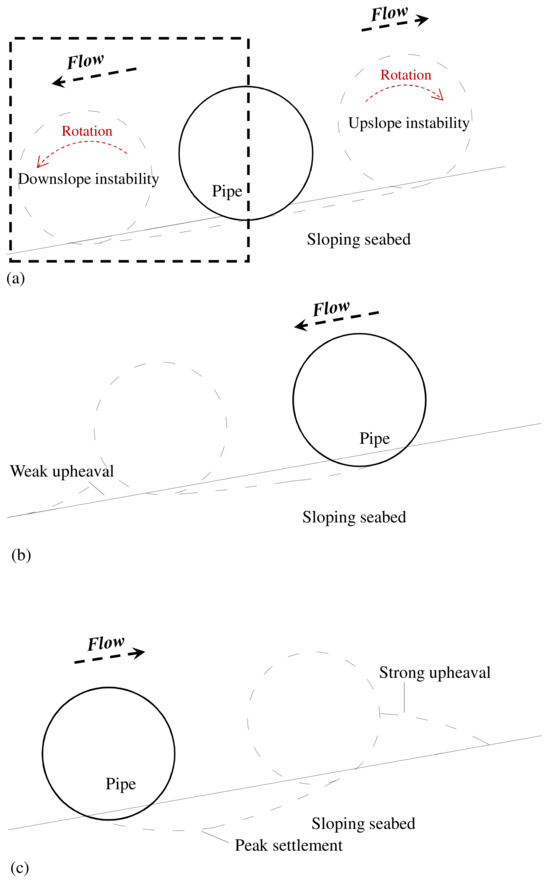
Figure 16.
Schematics of the patterns of pipe–granular soil interaction under lateral oblique force actions on sloping seabeds: (a) freely laid pipe, (b) anti-rolling pipe (downslope instability), and (c) anti-rolling pipe (upslope instability).
This study focused on the effect of upslope and downslope, as well as the effects of pipe rotation. However, it should be noted that the lateral on-bottom stability of a submarine pipeline subject to ocean waves/currents involves complex flow–pipe–soil interaction. Many factors could be further considered in future research. For example, loading speed plays a significant role in the hydrodynamic forces acting on the pipeline. Higher loading speeds, such as those caused by rapidly changing wave conditions or strong currents, can result in increased dynamic forces acting on the pipeline. This, in turn, may lead to larger soil deformations and potentially affect the lateral stability of the pipeline. In addition, soil liquefaction is another important factor that is worthy of consideration. In certain conditions, such as during seismic events or cyclic loading, some parts of the soil may undergo liquefaction, resulting in a loss of shear strength. This could significantly impact the lateral stability of the pipeline, potentially leading to instability and movement. Such further investigations would contribute to the development of more accurate models and design guidelines for submarine pipelines in various marine environments.
4. Conclusions
This study investigated the underlying mechanisms behind the lateral pipe–soil interaction instability on sloping sandy seabeds, examining the effects of slope angle and instability direction on the behavior of pipe–soil interaction for freely laid and anti-rolling pipes subject to lateral oblique force actions, through a series of 3D coupled DEM–FEM simulations. The key findings can be summarized as follows:
- (1)
- The pipe–soil interaction instability on downslopes and upslopes was compared using coupled DEM–FEM simulations. The ultimate drag force of anti-rolling pipes was found to be much larger than that of freely laid pipes on both downslope and upslope instabilities. In addition, progressive soil resistance and deformation distributions around pipes under different slope angles and instability directions were discovered and found to be increased with slope angles. Furthermore, the rotation-induced obliquely upward traction force was proved to be the essential reason for the smaller soil resistance and smaller soil deformation around freely laid pipes.
- (2)
- The effects of slope angle and instability direction on motion trajectory, stress, deformation, and shear wear of pipes were discovered and analyzed in detail. The difference in shapes of lateral displacement–settlement curves in upslope instability and downslope instability was compared and successfully explained by the difference in position distributions of soil supporting forces after obvious lateral pipe movement. Moreover, pipe stress and deformation under upslope instability conditions were found to be larger than those under downslope instability conditions, primarily concentrated around the contact position of pipe–soil interactions. In addition, the shear intensity on the pipe–soil interface was found to increase with slope angles and decrease with interface friction coefficients.
- (3)
- The pipe–soil interaction in the upslope and downslope instabilities was further analyzed at particle scales. Particle trajectories, translation velocities, and rotation velocities were found to be advantageous in identifying granular soil behaviors, such as soil disturbance zones and shear bands. The synchronous movement of the pipe and adjacent particles, as indicated by soil shear bands, was identified as the mechanism behind the low particle collision and weak shear intensity on the pipe surfaces with high interface friction coefficients. As instability direction changed from downslope to upslope, the area of shear bands and soil disturbance exhibited a notable increase. Finally, several conclusive mechanistic patterns of pipe–soil interaction instability on sloping seabeds were identified by macro- to micro-analyses.
In conclusion, this study has highlighted the significant effects of slope angle and instability direction on the behavior of pipe–soil interaction for freely laid and anti-rolling pipes subject to lateral oblique force actions. The finding that slope angle and instability direction not only influence the magnitude of various pipe–soil interaction behaviors on slopes, but also shape the patterns of soil deformation and pipe movement, has significant implications for pipeline construction in marine engineering.
Author Contributions
Conceptualization, L.Q.; numerical simulations and data analyses L.Q. and Y.P.; writing—original draft preparation, Y.P.; All authors have read and agreed to the published version of the manuscript.
Funding
No special Funding was provided for this work.
Institutional Review Board Statement
Not applicable.
Informed Consent Statement
Not applicable.
Data Availability Statement
The data presented in this study are available on request from the corresponding author.
Conflicts of Interest
The authors declare no conflict of interest.
References
- Wang, N.; Qi, W.; Gao, F. Predicting the Instability Trajectory of an Obliquely Loaded Pipeline on a Clayey Seabed. J. Mar. Sci. Eng. 2022, 10, 299. [Google Scholar] [CrossRef]
- Yang, H.; Guo, Z.; Wang, L.; Dou, Y.; Liu, Z. Experimental study on wave-induced seabed response and force on the pipeline shallowly buried in a submerged sandy slope. Ocean Eng. 2022, 251, 111153. [Google Scholar] [CrossRef]
- Gao, F.-P.; Han, X.-T.; Cao, J.; Sha, Y.; Cui, J.-S. Submarine pipeline lateral instability on a sloping sandy seabed. Ocean Eng. 2012, 50, 44–52. [Google Scholar] [CrossRef]
- Wang, H.; Wang, K.; Guo, Z.; Rui, S.; Wang, Z. Resistance mechanism of partially embedded pipelines considering the influence of temperature fields. Ocean Eng. 2023, 281, 114720. [Google Scholar] [CrossRef]
- Qi, W.-G.; Shi, Y.-M.; Gao, F.-P. Uplift soil resistance to a shallowly-buried pipeline in the sandy seabed under waves: Po-ro-elastoplastic modeling. Appl. Ocean Res. 2020, 95, 102024. [Google Scholar] [CrossRef]
- Gao, F.-P.; Wang, N.; Li, J.; Han, X.-T. Pipe–soil interaction model for current-induced pipeline instability on a sloping sandy seabed. Can. Geotech. J. 2016, 53, 1822–1830. [Google Scholar] [CrossRef]
- Jones, W.T. On-Bottom Pipe line Stability in Steady Water Currents. In Proceedings of the Offshore Technology Conference, Houston, TX, USA, 2–5 May 1976. [Google Scholar]
- White, D.; Cathie, D. Geotechnics for Subsea Pipelines. In Frontiers in Offshore Geotechnics II; CRC Press: Boca Raton, FL, USA, 2010. [Google Scholar]
- Rui, S.; Zhou, Z.; Jostad, H.P.; Wang, L.; Guo, Z. Numerical prediction of potential 3-dimensional seabed trench profiles considering complex motions of mooring line. Appl. Ocean Res. 2023, 139, 103704. [Google Scholar] [CrossRef]
- Ameh, S.E.; Ameh, N.I. On-bottom stability design of submarine pipelines: The fundamentals. J. Appl. Sci. Environ. Manag. 2019, 23, 1985–1990. [Google Scholar] [CrossRef]
- Zhang, W.; Askarinejad, A. Behaviour of buried pipes in unstable sandy slopes. Landslides 2019, 16, 283–293. [Google Scholar] [CrossRef]
- Lyons, C. Soil Resistance to Lateral Sliding of Marine Pipelines. In Proceedings of the Fifth Annual Offshore Technology Conference, Houston, TX, USA, 30 April–2 May 1973. [Google Scholar]
- Verley, R.; Lund, K.M. A Soil Resistance Model for Pipelines Placed on Clay Soils; American Society of Mechanical Engineers: New York, NY, USA, 1995. [Google Scholar]
- Zhang, J.; Stewart, D.P.; Randolph, M.F. Modeling of Shallowly Embedded Offshore Pipelines in Calcareous Sand. J. Geotech. Geoenviron. Eng. 2002, 128, 363–371. [Google Scholar] [CrossRef]
- Gao, F.-P.; Yan, S.-M.; Yang, B.; Luo, C.-C. Steady flow-induced instability of a partially embedded pipeline: Pipe–soil interaction mechanism. Ocean Eng. 2011, 38, 934–942. [Google Scholar] [CrossRef]
- Verley, R.L.P.; Sotberg, T. A Soil Resistance Model for Pipelines Placed on Sandy Soils. J. Offshore Mech. Arct. Eng. 1994, 116, 145–153. [Google Scholar] [CrossRef]
- Foray, P.; Bonjean, D.; Michallet, H.; Mory, M. Fluid-Soil-Structure Interaction in Liquefaction around a Cyclically Moving Cylinder. J. Waterw. Port Coastal Ocean Eng. 2006, 132, 289–299. [Google Scholar] [CrossRef][Green Version]
- White, D.; Cheuk, C. Modelling the soil resistance on seabed pipelines during large cycles of lateral movement. Mar. Struct. 2008, 21, 59–79. [Google Scholar] [CrossRef]
- Xu, P.; Du, Z.; Zhang, T.; Chen, B. Vector form intrinsic finite element analysis of deepwater J-laying pipelines on sloping seabed. Ocean Eng. 2022, 247, 110709. [Google Scholar] [CrossRef]
- Shi, Y.-M.; Wang, N.; Gao, F.-P.; Qi, W.-G.; Wang, J.-Q. Physical modeling of the axial pipe-soil interaction for pipeline walking on a sloping sandy seabed. Ocean Eng. 2019, 178, 20–30. [Google Scholar] [CrossRef]
- Wu, S.; Jeng, D.-S. Effects of dynamic soil permeability on the wave-induced seabed response around a buried pipeline. Ocean Eng. 2019, 186, 106132. [Google Scholar] [CrossRef]
- Chen, R.; Wu, L.; Zhu, B.; Kong, D. Numerical modelling of pipe-soil interaction for marine pipelines in sandy seabed subjected to wave loadings. Appl. Ocean Res. 2019, 88, 233–245. [Google Scholar] [CrossRef]
- Lin, Z.; Guo, Y.; Jeng, D.-S.; Liao, C.; Rey, N. An integrated numerical model for wave–soil–pipeline interactions. Coast. Eng. 2016, 108, 25–35. [Google Scholar] [CrossRef]
- Wagner, D.A.; Murff, J.D.; Brennodden, H.; Sveggen, O. Pipe-soil interaction model. J. Waterw. Port Coast. Ocean Eng. 1989, 115, 205–220. [Google Scholar] [CrossRef]
- Liu, R.; Guo, S.; Yan, S. Study on the Lateral Soil Resistance Acting on the Buried Pipeline. J. Coast. Res. 2015, 73, 391–398. [Google Scholar] [CrossRef]
- Mallikarachchi, H.E.; Pelecanos, L.; Soga, K. Nonlinear Finite-Element Analysis of Soil-Pipe Interaction for Laterally-Loaded Buried Offshore Pipelines. In Numerical Methods in Geotechnical Engineering IX; CRC Press: Boca Raton, FL, USA, 2018; Volume 2. [Google Scholar]
- Liang, W.; Zhao, J. Multiscale modeling of large deformation in geomechanics. Int. J. Numer. Anal. Methods Geomech. 2019, 43, 1080–1114. [Google Scholar] [CrossRef]
- Horabik, J.; Molenda, M. Parameters and contact models for DEM simulations of agricultural granular materials: A review. Biosyst. Eng. 2016, 147, 206–225. [Google Scholar] [CrossRef]
- Chen, Q.; Peng, W.; Yu, R.; Tao, G.; Nimbalkar, S. Laboratory Investigation on Particle Breakage Characteristics of Calcareous Sands. Adv. Civ. Eng. 2021, 2021, 8867741. [Google Scholar] [CrossRef]
- Yin, Z.-Y.; Wang, P.; Zhang, F. Effect of particle shape on the progressive failure of shield tunnel face in granular soils by coupled FDM-DEM method. Tunn. Undergr. Space Technol. 2020, 100, 103394. [Google Scholar] [CrossRef]
- Peng, Y.; Yin, Z.-Y.; Ding, X. Micromechanical analysis of the particle corner breakage effect on pile load performance in coral sand. Acta Geotech. 2023, 18, 6353–6370. [Google Scholar] [CrossRef]
- Deluzarche, R.; Cambou, B.; Fry, J. Modeling of rockfill behavior with crushable particles. In Numerical Modeling in Micromechanics Via Particle Methods; Routledge: Abingdon, UK, 2017; pp. 219–224. [Google Scholar]
- Peng, Y.; Yin, Z.-Y. Micromechanical analysis of suction pile-granular soil interaction under inclined pulling load of mooring line: Mooring depth effect. Mar. Struct. 2023, 92, 103499. [Google Scholar] [CrossRef]
- Macaro, G.; Utili, S.; Martin, C.M. DEM simulations of transverse pipe–soil interaction on sand. Géotechnique 2021, 71, 189–204. [Google Scholar] [CrossRef]
- Yimsiri, S.; Soga, K. DEM analysis of soil-pipeline interaction in sand under lateral and upward movements at deep embedment. Geotech. Eng. 2006, 37, 83–94. [Google Scholar]
- Jiang, M.J.; Zhang, W.C.; Liu, F.; Shen, Z.F. Investigating Particle-Size Effect on Uplift Mechanism of Pipes Buried in Sand Using Distinct Element Method. Adv. Mater. Res. 2012, 361–363, 505–509. [Google Scholar] [CrossRef]
- Peng, Y.; Liu, H.; Li, C.; Ding, X.; Deng, X.; Wang, C. The detailed particle breakage around the pile in coral sand. Acta Geotech. 2021, 16, 1971–1981. [Google Scholar] [CrossRef]
- Macaro, G.; Utili, S.; Martin, C. DEM analyses of pipe–soil interaction for offshore pipelines on sand. In Geomechanics from Micro to Macro; Soga, K., Kumar, K.K., Biscontin, G., Eds.; Taylor and Francis: London, UK, 2015. [Google Scholar]
- Durmus, S.E. DEM Modelling of Soil Pipeline Interaction under Combined Vertical and Horizontal Loading. Master’s Thesis, Politecnico di Milano, Milan, Italy, 2021. [Google Scholar]
- Wang, Y.; Liu, J.; Guo, P.; Zhang, W.; Lin, H.; Zhao, Y.; Ou, Q. Simplified Analytical Solutions for Tunnel Settlement Induced by Axially Loading Single Pile and Pile Group. J. Eng. Mech. 2021, 147, 04021116. [Google Scholar] [CrossRef]
- Liu, F.; Yi, J.; Cheng, P.; Yao, K. Numerical simulation of set-up around shaft of XCC pile in clay. Geomech. Eng. 2020, 21, 489–501. [Google Scholar]
- Zheng, Z.; Zang, M.; Chen, S.; Zhao, C. An improved 3D DEM-FEM contact detection algorithm for the interaction simulations between particles and structures. Powder Technol. 2017, 305, 308–322. [Google Scholar] [CrossRef]
- Cui, X.; Zhou, R.; Guo, G.; Du, B.; Liu, H. Effects of Differential Subgrade Settlement on Slab Track Deformation Based on a DEM-FDM Coupled Approach. Appl. Sci. 2021, 11, 1384. [Google Scholar] [CrossRef]
- Qu, L.; Yang, C.; Ding, X.; Kouroussis, G.; Zheng, C. A continuum-based model on axial pile-head dynamic impedance in inhomo-geneous soil. Acta Geotech. 2021, 16, 3339–3353. [Google Scholar] [CrossRef]
- Wu, Z.; Barosh, P.J.; Wang, L.; Hu, D.; Wang, W. Numerical modeling of stress and strain associated with the bending of an oil pipeline by a migrating pingo in the permafrost region of the northern Tibetan Plateau. Eng. Geol. 2008, 96, 62–77. [Google Scholar] [CrossRef]
- Dratt, M.; Katterfeld, A. Coupling of FEM and DEM simulations to consider dynamic deformations under particle load. Granul. Matter 2017, 19, 49. [Google Scholar] [CrossRef]
- Peng, Y.; Yin, Z.-Y.; Ding, X. Analysis of particle corner-breakage effect on pile penetration in coral sand: Model tests and DEM simulations. Can. Geotech. J. 2023, 60, 749–765. [Google Scholar] [CrossRef]
- Kešner, A.; Chotěborský, R.; Linda, M.; Hromasová, M.; Katinas, E.; Sutanto, H. Stress distribution on a soil tillage machine frame segment with a chisel shank simulated using discrete element and finite element methods and validate by experiment. Biosyst. Eng. 2021, 209, 125–138. [Google Scholar] [CrossRef]
- Orosz, Á.; Tamás, K.; Rádics, J.P.; Zwierczyk, P.T. Coupling Finite And Discrete Element Methods Using an Open Source and A Commercial Software. In Proceedings of the 32nd European Conference on Modelling and Simulation, Wilhelmshaven, Germany, 22–25 May 2018. [Google Scholar]
- Castaneda, E.A.; Pineda Leon, R.; Cornejo, J. FEM and DEM Simulations of Tire-Soil and Drill-Soil Interactions in Off-Road Condi-tions for Mechanical Design Validation of a Space Exploration Rover. In Proceedings of the 2021 12th International Conference on Mechanical and Aerospace Engineering (ICMAE), Athens, Greece, 16–19 July 2021. [Google Scholar]
- Munir, H.A.; Zakaria, A.; Ponniran, A.; Rahman, T.A.; Marimuthu, T. Investigation of The Dynamic Deflection of Conveyor Belts Via Simulation Modelling Methods on Idler Factor. J. Phys. Conf. Ser. 2022, 2312, 012027. [Google Scholar] [CrossRef]
- Wang, P.; Yin, Z.-Y. Micro-mechanical analysis of caisson foundation in sand using DEM: Particle breakage effect. Ocean Eng. 2020, 215, 107921. [Google Scholar] [CrossRef]
- Falagush, O.; McDowell, G.R.; Yu, H.-S. Discrete Element Modeling of Cone Penetration Tests Incorporating Particle Shape and Crushing. Int. J. Géoméch. 2015, 15, 04015003. [Google Scholar] [CrossRef]
- Zhao, H.; Zhang, J.; Qiu, P.; Ji, S. Hierarchical Modeling Method for DEM Simulation and Its Application in Soil–Pile–Cap Interaction and Impact Case. Int. J. Géoméch. 2019, 19, 04019076. [Google Scholar] [CrossRef]
- Dai, B.; Yang, J.; Zhou, C.; Luo, X. DEM investigation on the effect of sample preparation on the shear behavior of granular soil. Particuology 2016, 25, 111–121. [Google Scholar] [CrossRef]
- Nakashima, H.; Shioji, Y.; Kobayashi, T.; Aoki, S.; Shimizu, H.; Miyasaka, J.; Ohdoi, K. Determining the angle of repose of sand under low-gravity conditions using discrete element method. J. Terramech. 2011, 48, 17–26. [Google Scholar] [CrossRef]
- Peng, Y.; Yin, Z.-Y. Micromechanical analysis of suction pile-granular soil interaction under inclined pulling load: Effect of pulling angle. Ocean Eng. 2023, 270, 113615. [Google Scholar] [CrossRef]
- Arroyo, M.; Butlanska, J.; Gens, A.; Calvetti, F.; Jamiolkowski, M. Cone penetration tests in a virtual calibration chamber. Géotechnique 2011, 61, 525–531. [Google Scholar] [CrossRef]
- Calvetti, F.; di Prisco, C.; Nova, R. Experimental and Numerical Analysis of Soil–Pipe Interaction. J. Geotech. Geoenviron. Eng. 2004, 130, 1292–1299. [Google Scholar] [CrossRef]
- Yimsiri, S. Distinct Element Analysis of Soil-Pipeline Interaction in Sand under Upward Movement at Deep Embedment Condition. In Proceedings of the 16th International Conference on Soil Mechanics and Geotechnical Engineering, Osaka, Japan, 12–16 September 2005. [Google Scholar]
- Zhou, C.; Qian, J.; Yin, Z. Microscopic investigation of the influence of complex stress states on internal erosion and its impacts on critical hydraulic gradients. Int. J. Numer. Anal. Methods Géoméch. 2022, 46, 3377–3401. [Google Scholar] [CrossRef]
- Jensen, R.P.; Edil, T.B.; Bosscher, P.J.; Plesha, M.E.; Ben Kahla, N. Effect of Particle Shape on Interface Behavior of DEM-Simulated Granular Materials. Int. J. Géoméch. 2001, 1, 1–19. [Google Scholar] [CrossRef]
- Khazeni, A.; Mansourpour, Z. Influence of non-spherical shape approximation on DEM simulation accuracy by multi-sphere method. Powder Technol. 2018, 332, 265–278. [Google Scholar] [CrossRef]
- Suhr, B.; Six, K. Simple particle shapes for DEM simulations of railway ballast: Influence of shape descriptors on packing behaviour. Granul. Matter 2020, 22, 43. [Google Scholar] [CrossRef]
- Liu, G.; Jing, G.; Ding, D.; Shi, X. Micro-Analysis of Ballast Angularity Breakage and Evolution by Monotonic Triaxial Tests. In Proceedings of the 7th International Symposium on Environmental Vibration and Transportation Geodynamics, Hangzhou, China, 28–30 October 2016. [Google Scholar]
- Hossain, Z.; Indraratna, B.; Darve, F.; Thakur, P.K. DEM analysis of angular ballast breakage under cyclic loading. Géoméch. Geoengin. 2007, 2, 175–181. [Google Scholar] [CrossRef]
- Wensrich, C.; Katterfeld, A. Rolling friction as a technique for modelling particle shape in DEM. Powder Technol. 2012, 217, 409–417. [Google Scholar] [CrossRef]
- Tohidifar, H.; Jafari, M.K.; Moosavi, M. Downwards force–displacement response of buried pipelines during dip–slip faulting in sandy soil. Can. Geotech. J. 2021, 58, 377–397. [Google Scholar] [CrossRef]
- Khanal, M.; Elmouttie, M.; Poulsen, B.; Olsson, A.; Adhikary, D. Effect of Loading Rate on Sand Pile Failure: 2D DEM Simulation. Geotech. Geol. Eng. 2017, 35, 889–896. [Google Scholar] [CrossRef]
- Coetzee, C.; Els, D. Calibration of granular material parameters for DEM modelling and numerical verification by blade–granular material interaction. J. Terramech. 2009, 46, 15–26. [Google Scholar] [CrossRef]
- Peng, Y.; Yin, Z.-Y.; Zhou, C.; Ding, X. Micromechanical analysis of capillary suction effect on bearing capacity of unsaturated fine granular foundation soil using coupled CFD-DEM method. Comput. Geotech. 2023, 153, 105092. [Google Scholar] [CrossRef]
- Mondal, S.; Disfani, M.; Narsilio, G.A. Battered minipiles in fine-grained soils: Soil-structure interaction. Comput. Geotech. 2022, 147, 104762. [Google Scholar] [CrossRef]
- Brunelli, A.; de Silva, F.; Piro, A.; Parisi, F.; Sica, S.; Silvestri, F.; Cattari, S. Numerical simulation of the seismic response and soil–structure interaction for a monitored masonry school building damaged by the 2016 Central Italy earthquake. Bull. Earthq. Eng. 2021, 19, 1181–1211. [Google Scholar] [CrossRef]
- Qian, J.-G.; Li, W.-Y.; Yin, Z.-Y.; Yang, Y. Influences of buried depth and grain size distribution on seepage erosion in granular soils around tunnel by coupled CFD-DEM approach. Transp. Geotech. 2021, 29, 100574. [Google Scholar] [CrossRef]
- Nitka, M.; Combe, G.; Dascalu, C.; Desrues, J. Two-scale modeling of granular materials: A DEM-FEM approach. Granul. Matter 2011, 13, 277–281. [Google Scholar] [CrossRef]
- Nguyen, T.K.; Combe, G.; Caillerie, D.; Desrues, J. FEM × DEM modelling of cohesive granular materials: Numerical homogenisation and multi-scale simulations. Acta Geophys. 2014, 62, 1109–1126. [Google Scholar] [CrossRef]
- Wang, X.; Yin, Z.-Y.; Su, D.; Wu, X.; Zhao, J. A novel approach of random packing generation of complex-shaped 3D particles with controllable sizes and shapes. Acta Geotech. 2021, 17, 355–376. [Google Scholar] [CrossRef]
- Zhang, J.; Shao, X.; Wang, X.; Hu, F.; Zuo, H. Discrete element simulation of crushing behavior of calcareous sands during pile jacking. Rock Soil Mech. 2015, 36, 272–278. [Google Scholar]
- Qu, T.; Wang, M.; Feng, Y. Applicability of discrete element method with spherical and clumped particles for constitutive study of granular materials. J. Rock Mech. Geotech. Eng. 2022, 14, 240–251. [Google Scholar] [CrossRef]
- Wang, X.; Yin, Z.Y.; Xiong, H.; Su, D.; Feng, Y.T. A spherical-harmonic-based approach to discrete element modeling of 3D irregular particles. Int. J. Numer. Methods Eng. 2021, 122, 5626–5655. [Google Scholar] [CrossRef]
- Du, L.; Liu, X.; Han, Y.; Deng, Z. Generation of irregular particle packing with prescribed statistical distribution, spatial arrangement, and volume fraction. J. Rock Mech. Geotech. Eng. 2022, 15, 375–394. [Google Scholar] [CrossRef]
- Yin, Z.-Y.; Wang, P. Micro-mechanical analysis of caisson foundation in sand using DEM: Particle shape effect. Appl. Ocean Res. 2021, 111, 102630. [Google Scholar] [CrossRef]
- Boot, J.; Naqvi, M.; Gumbel, J. A new method for the structural design of flexible liners for gravity pipes of egg-shaped cross section: Theoretical considerations and formulation of the problem. Thin-Walled Struct. 2014, 85, 411–418. [Google Scholar] [CrossRef]
- Zhang, J.; Liang, Z.; Zhang, H.; Feng, D.; Xia, C. Failure analysis of directional crossing pipeline and design of a protective device. Eng. Fail. Anal. 2016, 66, 187–201. [Google Scholar] [CrossRef]
- Li, Z.; Yu, Y.; Zhao, M.; Li, C.; Ma, J.; Su, O.; Xu, L. Buckling analysis of offshore buried pipeline under the combination of strike-slip faulting and pressure loading. Ocean Eng. 2022, 265, 112531. [Google Scholar] [CrossRef]
- Cheuk, C.Y.; White, D.J.; Bolton, M.D. Uplift Mechanisms of Pipes Buried in Sand. J. Geotech. Geoenviron. Eng. 2008, 134, 154–163. [Google Scholar] [CrossRef]
- Thusyanthan, N.; Mesmar, S.; Wang, J.; Haigh, S. Uplift Resistance of Buried Pipelines and DNV-RP-F110 Guidelines. In Proceedings of the Offshore Petroleum Technology (OPT), Amsterdam, The Netherlands, 24–25 February 2010. [Google Scholar]
- Wu, J.; Kouretzis, G.; Suwal, L.; Ansari, Y.; Sloan, S.W. Shallow and deep failure mechanisms during uplift and lateral dragging of buried pipes in sand. Can. Geotech. J. 2020, 57, 1472–1483. [Google Scholar] [CrossRef]
- Katinas, E.; Chotěborský, R.; Linda, M.; Kuře, J. Sensitivity analysis of the influence of particle dynamic friction, rolling resistance and volume/shear work ratio on wear loss and friction force using DEM model of dry sand rubber wheel test. Tribol. Int. 2021, 156, 106853. [Google Scholar] [CrossRef]
- Wang, P.; Yin, Z.-Y.; Zhou, W.-H.; Chen, W.-B. Micro-mechanical analysis of soil–structure interface behavior under constant normal stiffness condition with DEM. Acta Geotech. 2021, 17, 2711–2733. [Google Scholar] [CrossRef]
- Fu, Z.; Chen, S.; Liu, S. Discrete Element Simulations of Shallow Plate-Load Tests. Int. J. Géoméch. 2016, 16, 04015077. [Google Scholar] [CrossRef]
- Hazeghian, M.; Soroush, A. DEM-aided study of shear band formation in dip-slip faulting through granular soils. Comput. Geotech. 2016, 71, 221–236. [Google Scholar] [CrossRef]
- Zhou, C.; Qian, J.-G.; Yin, Z.-Y.; Xiong, H. Suffusion in gap-graded granular soils subjected to strain-controlled cyclic loading with coupled CFD-DEM method. Transp. Geotech. 2023, 42, 101098. [Google Scholar] [CrossRef]
Disclaimer/Publisher’s Note: The statements, opinions and data contained in all publications are solely those of the individual author(s) and contributor(s) and not of MDPI and/or the editor(s). MDPI and/or the editor(s) disclaim responsibility for any injury to people or property resulting from any ideas, methods, instructions or products referred to in the content. |
© 2024 by the authors. Licensee MDPI, Basel, Switzerland. This article is an open access article distributed under the terms and conditions of the Creative Commons Attribution (CC BY) license (https://creativecommons.org/licenses/by/4.0/).