Article

Prediction Model of the Sound Speed of Seafloor Sediments on the Continental Shelf of the East China Sea Based on Empirical Equations

1
Key Laboratory of Marine Geology and Metallogeny, First Institute of Oceanography, Ministry of Natural Resources, Qingdao 266061, China
2
Laboratory for Marine Geology, Laoshan Laboratory, Qingdao 266237, China
3
Key Laboratory of Submarine Acoustic Investigation and Application of Qingdao (Preparatory), Qingdao 266061, China
4
College of Marine Geoscience, Ocean University of China, Qingdao 266100, China
*
Author to whom correspondence should be addressed.
J. Mar. Sci. Eng. 2024, 12(1), 27; https://doi.org/10.3390/jmse12010027
Submission received: 17 October 2023 / Revised: 23 November 2023 / Accepted: 14 December 2023 / Published: 21 December 2023
(This article belongs to the Special Issue Advances in Marine Engineering: Geological Environment and Hazards II)

Abstract

:
Based on the data of the acoustic and physical properties of seafloor sediments obtained on the continental shelf area of the East China Sea (ECS), prediction equations of the sediment sound speed based on single and dual parameters were established, and the correlation of the sound speed with physical parameters was discussed. The results show that the sediment sound speed (c) is strongly correlated with water content (w), density (ρ), void ratio (e), mean grain size (Mz) and median grain size (Md), and the coefficient of determination R2 of the empirical regression equation is generally greater than 0.80, while the empirical regression equation coefficient of determination R2 of the compression coefficient (a) and compression modulus (E) are slightly lower, with 0.79 and 0.73, respectively. The coefficients of determination of the dual parameter regression equations between sediment sound speed with physical property parameters are generally higher than those of the single parameter equations, which are all higher than 0.90 indicating better prediction performance. The sensitivity of the physical parameters to the sound speed was analyzed, and the result shows that the sequence of sensitivity from high to low influence on sediment sound speed is void ratio, density, compressibility coefficient, median grain size and mean grain size. The prediction equations established in this study are a good extension and supplement to marine geoacoustic models and is of great significance for obtaining the acoustic properties of the seafloor sediments on the shelf of the East China Sea.

1. Introduction

The seafloor, as an important boundary of the underwater sound field, is a common concern of various disciplines, including marine acoustics [1,2], oceanography [3], marine geology and marine geophysics [4,5]. The acoustic properties of seafloor sediments have significant practical value in many fields such as marine environmental security guarantees, underwater target detection, submarine engineering survey and seafloor resource exploration [6,7,8,9,10,11]. Furthermore, the research of seafloor sediment acoustic properties represents the forefront and focal points of marine acoustics, marine geology and marine geophysics. In general, technologies for obtaining the acoustic properties of seafloor sediments mainly include the in situ measurement technique, laboratorial measurement technique, acoustic inversion technique and model-based prediction technique [12,13,14,15]. The in situ measurement technique, laboratorial measurement technique and acoustic inversion technique all usually use instruments and equipment to obtain the seafloor sediment acoustic properties on site at sea or in the laboratory. On the other hand, the model-based prediction method usually utilizes previously obtained physical and mechanical properties of seafloor sediments to predict the acoustic properties of the sediment, which is an effective method to obtain the acoustic properties of seafloor sediments with the merit of allowing for rapid and large-scale acquisition of seafloor sediment acoustic properties.
Analyzing the correlation between the acoustic properties and physical characteristics of seafloor sediments and constructing a prediction model is a key step to predicting the acoustic properties of sediments. Some research works have shown the relation between the acoustic properties of sediments and physical parameters and established prediction models for sediment acoustic properties in relevant sea areas [14,16,17,18,19,20,21]. The correlation between acoustic properties and physical parameters and models for the relationship between sediment acoustic properties and physical characteristics were constructed in many sea areas around the world [14,16,18,22,23,24,25,26,27,28,29,30]. Bachman [26,31] and other researchers [14,32] analyzed the correlation of the acoustic properties and physical parameters of continental shelves, deep-sea plains, and deep-sea ridges based on sediment environment and sediment type, and established the corresponding prediction equations. Lu Bo et al. [18,27,33], Tang Yonglu [28], and Zou Dapeng et al. [29] studied the acoustic properties of shallow-sea sediments in the Yellow Sea and the northern South China Sea. They established single parameter prediction equations for sediment sound speed based on one certain physical parameters of seafloor sediments in the corresponding research areas and analyzed the relevant prediction curves. Pan Guofu [34] conducted correlation analyses between shear wave speed and sediment physical parameters in the East China Sea continental shelf and Hangzhou Bay, but the sound speeds of longitudinal waves were not involved. Wang Jingqiang et al. [30] constructed single parameter prediction equations for sound speed and sound attenuation coefficients based on in situ measured data, but dual parameter prediction equations were not studied. At present, the prediction models for the acoustic properties of seafloor sediments in the East China Sea are mainly single parameter prediction equations. This paper aims to establish single parameter and dual parameter prediction equations for sediment sound speed to expand the marine geoacoustic model database and present models for seafloor sediment sound speed prediction on the shelf of the East China Sea. This paper also analyzes the sensitivity of the different physical parameters to sediment sound speed and compares the differences between the prediction equations of this research and those established by other researchers.

2. Study Area and Methodology

2.1. Location of Study Area

The study area is located on the shelf of the East China Sea at a water depth of 30 m to 107 m. As one of the widest continental shelves worldwide, it has considerable terrigenous input and is an important area for studying land–ocean interactions and source–sink processes [35]. The deposition of terrigenous sediments in this area is primarily controlled by the coastal upwelling and down welling of the southern continental shelf of the East China Sea [36]. Owing to the inflow of small coastal rivers such as the Yangtze River and the influence of the Yellow River, the continental shelf of the East China Sea has received a high input of terrigenous materials. The sediment types in the study area can be classified into three main regions: the clayey sand subregion in the north, the fine sand subregion in the central area, and clayey silt subregion in the south. The specific sediment types include fine sand, silty sand, clayey sand, coarse silt, sandy clay, sandy silt and clayey silt.

2.2. Data Source

The sediment samples were collected at 44 stations in the study area using box corers or gravity cores. The sound speed and physical mechanical properties of the collected sediment samples were measured at the Seafloor Acoustic Laboratory in First Institute of Oceanography, Ministry of Natural Resources with a measurement frequency of 100 kHz, using the longitudinal transmission method. The measurement equipment includes a seafloor sediment cylindrical sample sound speed measurement platform, an integrated sediment acoustic measurement system and acoustic transducers [15]. The formula for calculating seafloor sediment sound speed is as follows:
c = L t t 0 .
In Equation (1), c is the sound speed of sediment samples in meters per second (m/s), L is the sample length in meters (m), t is the traveling time for the sound wave to penetrate through the sample in seconds (s) and t0 is the zero-time correction value in seconds (s). During the sound speed measurement, the sediment sample was first cut and segmented according to actual requirements. Typically, it was cut into 30 cm segments and placed on the cylindrical sample measurement platform for sound speed measurement. After completing the sound speed measurement for the 30 cm section, a 10 cm section was then cut from the 30 cm section and the remaining 20 cm section of sediment continued to be measured for sound speed. After sound speed measurement, the physical property parameters of both segments were tested, including sediment water content, density, void ratio, compressibility coefficient, compressibility modulus, mean grain size, median grain size. The average values of the 10 cm and 20 cm segments are taken to obtain the physical properties of the 30 cm sediment sample. The measurement accuracy of the sediment core length of the measurement platform was 0.l mm, and the integrated sediment acoustic measurement system had a sampling rate of 10 MHz (that is, the accuracy of travel time is ±0.1 μs). So, the accuracy of the sound speed measurement equipment is estimated to be better than ±0.1% for a typical sample with a length of 30 cm and velocity of 1500 m/s. In order to eliminate the influence of temperature, the sound speed is corrected to the in situ temperature of about 18 °C according to the sea water temperature near the seafloor measured using CTD.
A total of 284 datasets pertaining to sediment sound speed and physical properties were meticulously acquired, with a comprehensive synthesis presented in Table 1. The analytical examination underscores the predominant classification of sediment within the study area into seven distinct types: fine sand, silty sand, clayey sand, coarse silt, sandy clay, sandy silt and clayey silt. Notably, clayey silty sand and medium silty sand manifest as comparatively prevalent, while fine sand sediment assumes a less prominent occurrence. The sound speed of sediment spans a range from 1709.78 m/s to 1492.86 m/s, with an average sound speed of 1642.96 m/s. Remarkably, the extremes in sound speed correspond to silty sand and clayey silty sand, respectively. Silty sand sediment attains maximal values for density (2.00 g/cm3), compressibility modulus (11.37 MPa), mean grain size (3.50 ϕ) and median grain size (2.20 ϕ), concurrently registering minimal values for water content (21.00%), void ratio (0.62), and compressibility coefficient (0.86 MPa¹). Conversely, clayey silt exhibits the highest compressibility coefficient (2.06 MPa¹) and concurrently, the lowest values for density and compressibility modulus (1.56 MPa). Coarse silty sand manifests as the extreme in water content (81.10%) and void ratio (2.14). Notably, the minimum values for mean grain size (8.23 ϕ) and median grain size (8.22 ϕ) correspond to sandy clay and silty clay, respectively.

2.3. Methods

Using the least squares method, regression equations for sediment sound speed were derived as a function of water content, density, void ratio, compressibility coefficient, compressibility modulus, mean grain size and median grain size, and the single parameter prediction equations for sediment sound speed were established. Among the seven physical and mechanical parameters mentioned above, the void ratio is derived from the water content, and they are closely related. The compressibility coefficient and compressibility modulus are reciprocal, reflecting the compressibility of the sediment. Considering the correlation between sediment sound speed and physical parameter as well as the correlation among different physical properties, five physical parameters including density, void ratio, compressibility coefficient, mean grain size and median grain size were selected from the seven physical parameters mentioned above to conduct the dual parameter prediction equations by using the least squares method.
By employing the Sobol method, the sensitivity of each physical-mechanical parameter to sound speed in the dual parameter equations were analyzed to assess the magnitude of the sensitivity for each parameter on sound speed, consequently to determine the extent of the influence and the key factors among the various physical parameters [37,38]. The main effect index S in the Sobol method characterizes the impact of each physical parameter on the sound speed. The larger the value of S, the greater the impact of this parameter on the sound speed, indicating that it is a sensitive parameter. The total effect index ST in the Sobol method characterizes the main effect of an individual physical and its interaction effect between itself and other parameters. A higher value of ST implies a stronger influence of the physical parameter on the sound speed, and the higher inter-action effect with another input physical parameter [37,38].

3. Result

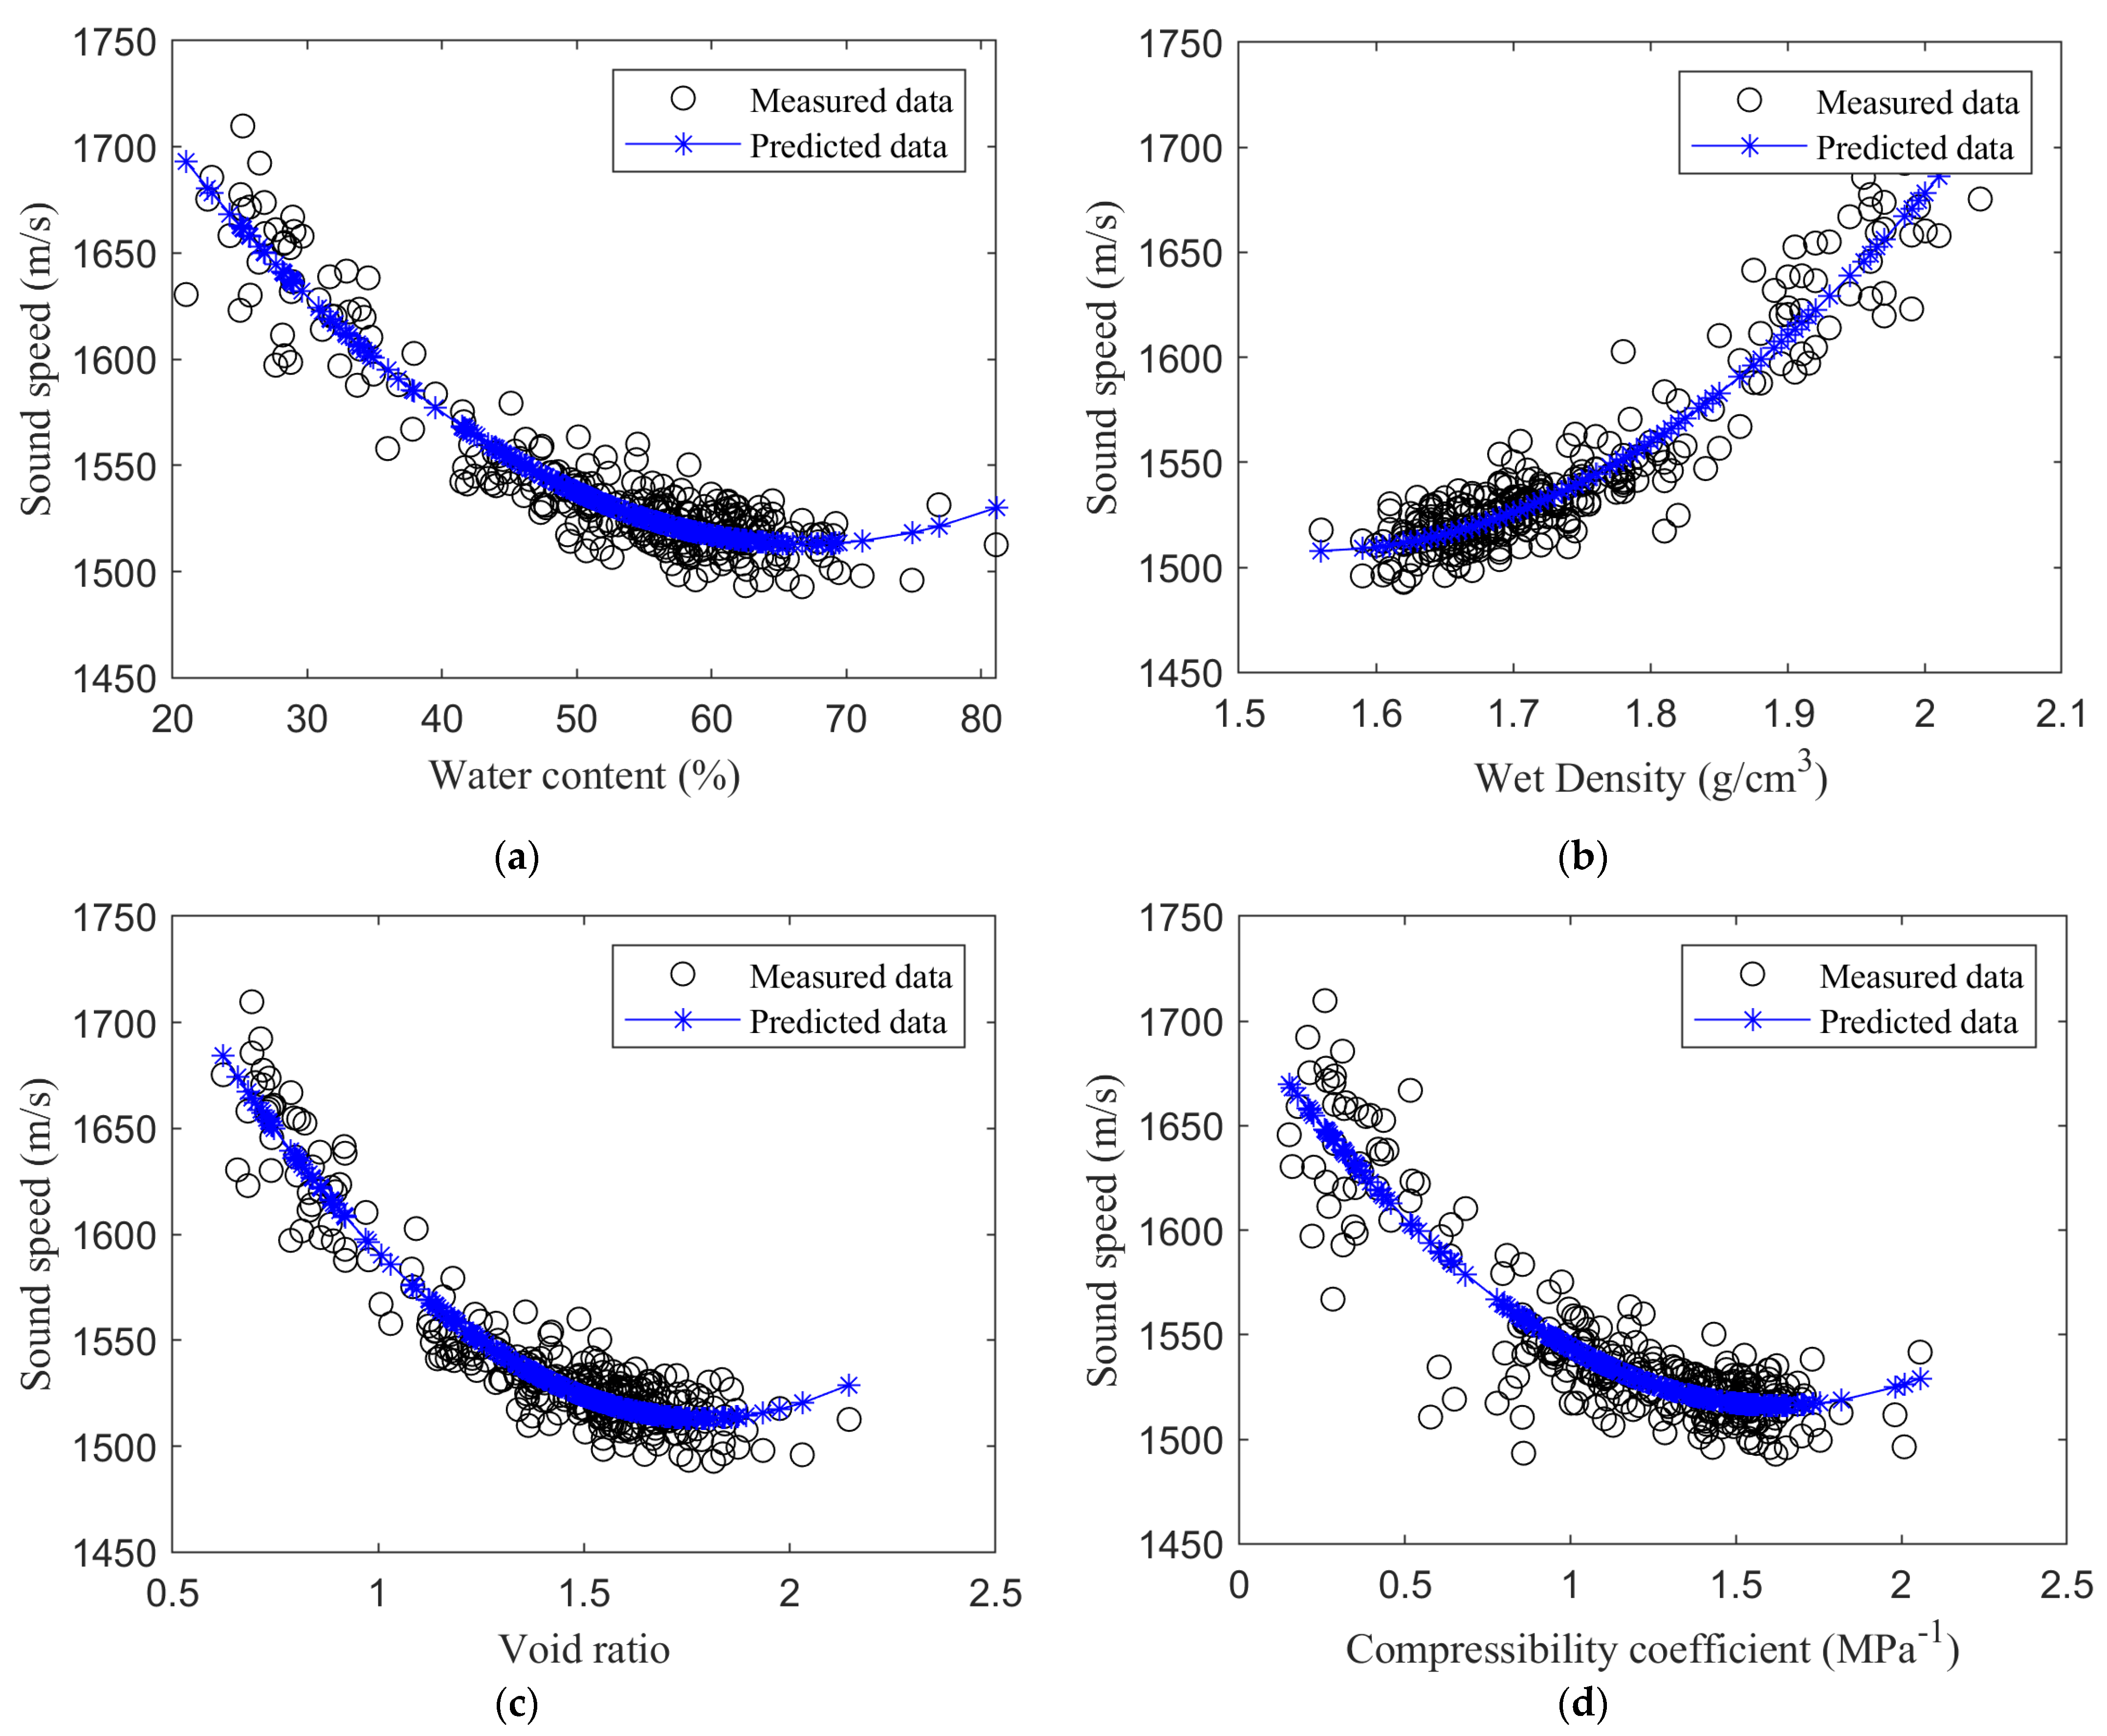
3.1. Single Parameter Prediction Equations for Sediment Sound Speed

The single parameter prediction equations and the correlation diagrams between sediment physical parameters and sound speed are shown Table 1 and Figure 1. According to Figure 1 and Table 2, it can be seen that sediment sound speed exhibits a good correlation with water content, density, void ratio, mean grain size, median grain size, compressibility coefficient and compressibility modulus, with the determination coefficients (R2) greater than 0.70 for all these parameters. Especially, the determination coefficients (R2) of the prediction equations for sound speed with respect to water content, density, void ratio, mean grain size and median grain size are greater than 0.8, indicating stronger correlations. As shown in Figure 1, sediment sound speed is positively correlated with density, median grain size and mean grain size, meaning that as these parameters increase, sediment sound speed also increases. It’s important to note that in Figure 1, median grain size and mean grain size are represented in ϕ values, where an increase in ϕ values corresponds to a decrease in median and mean grain size. Conversely, sound speed is negatively correlated with water content and void ratio. As water content and void ratio increase, sediment sound speed decreases. This is because sediment sound speed is closely related to its compactness. The increase of water content and void ratio results in more pores between sediment particles, reducing the density of the sediment, which, in turn, increases the compactness of the sediment and leads to a decrease in sediment sound speed. Saturated seafloor sediment is composed of particles and pore water and exhibits the characteristics of a two-phase medium. Wet bulk density and porosity indicate the ratio of particle specific gravity and pore water and the degree of compaction [39]. The calculation results based on the theory of elastic wave propagation in two-phase media indicate that the fast longitudinal wave velocity (i.e., sediment sound speed) of sediment decreases with the increase of porosity, which is consistent with the results of this study [40].

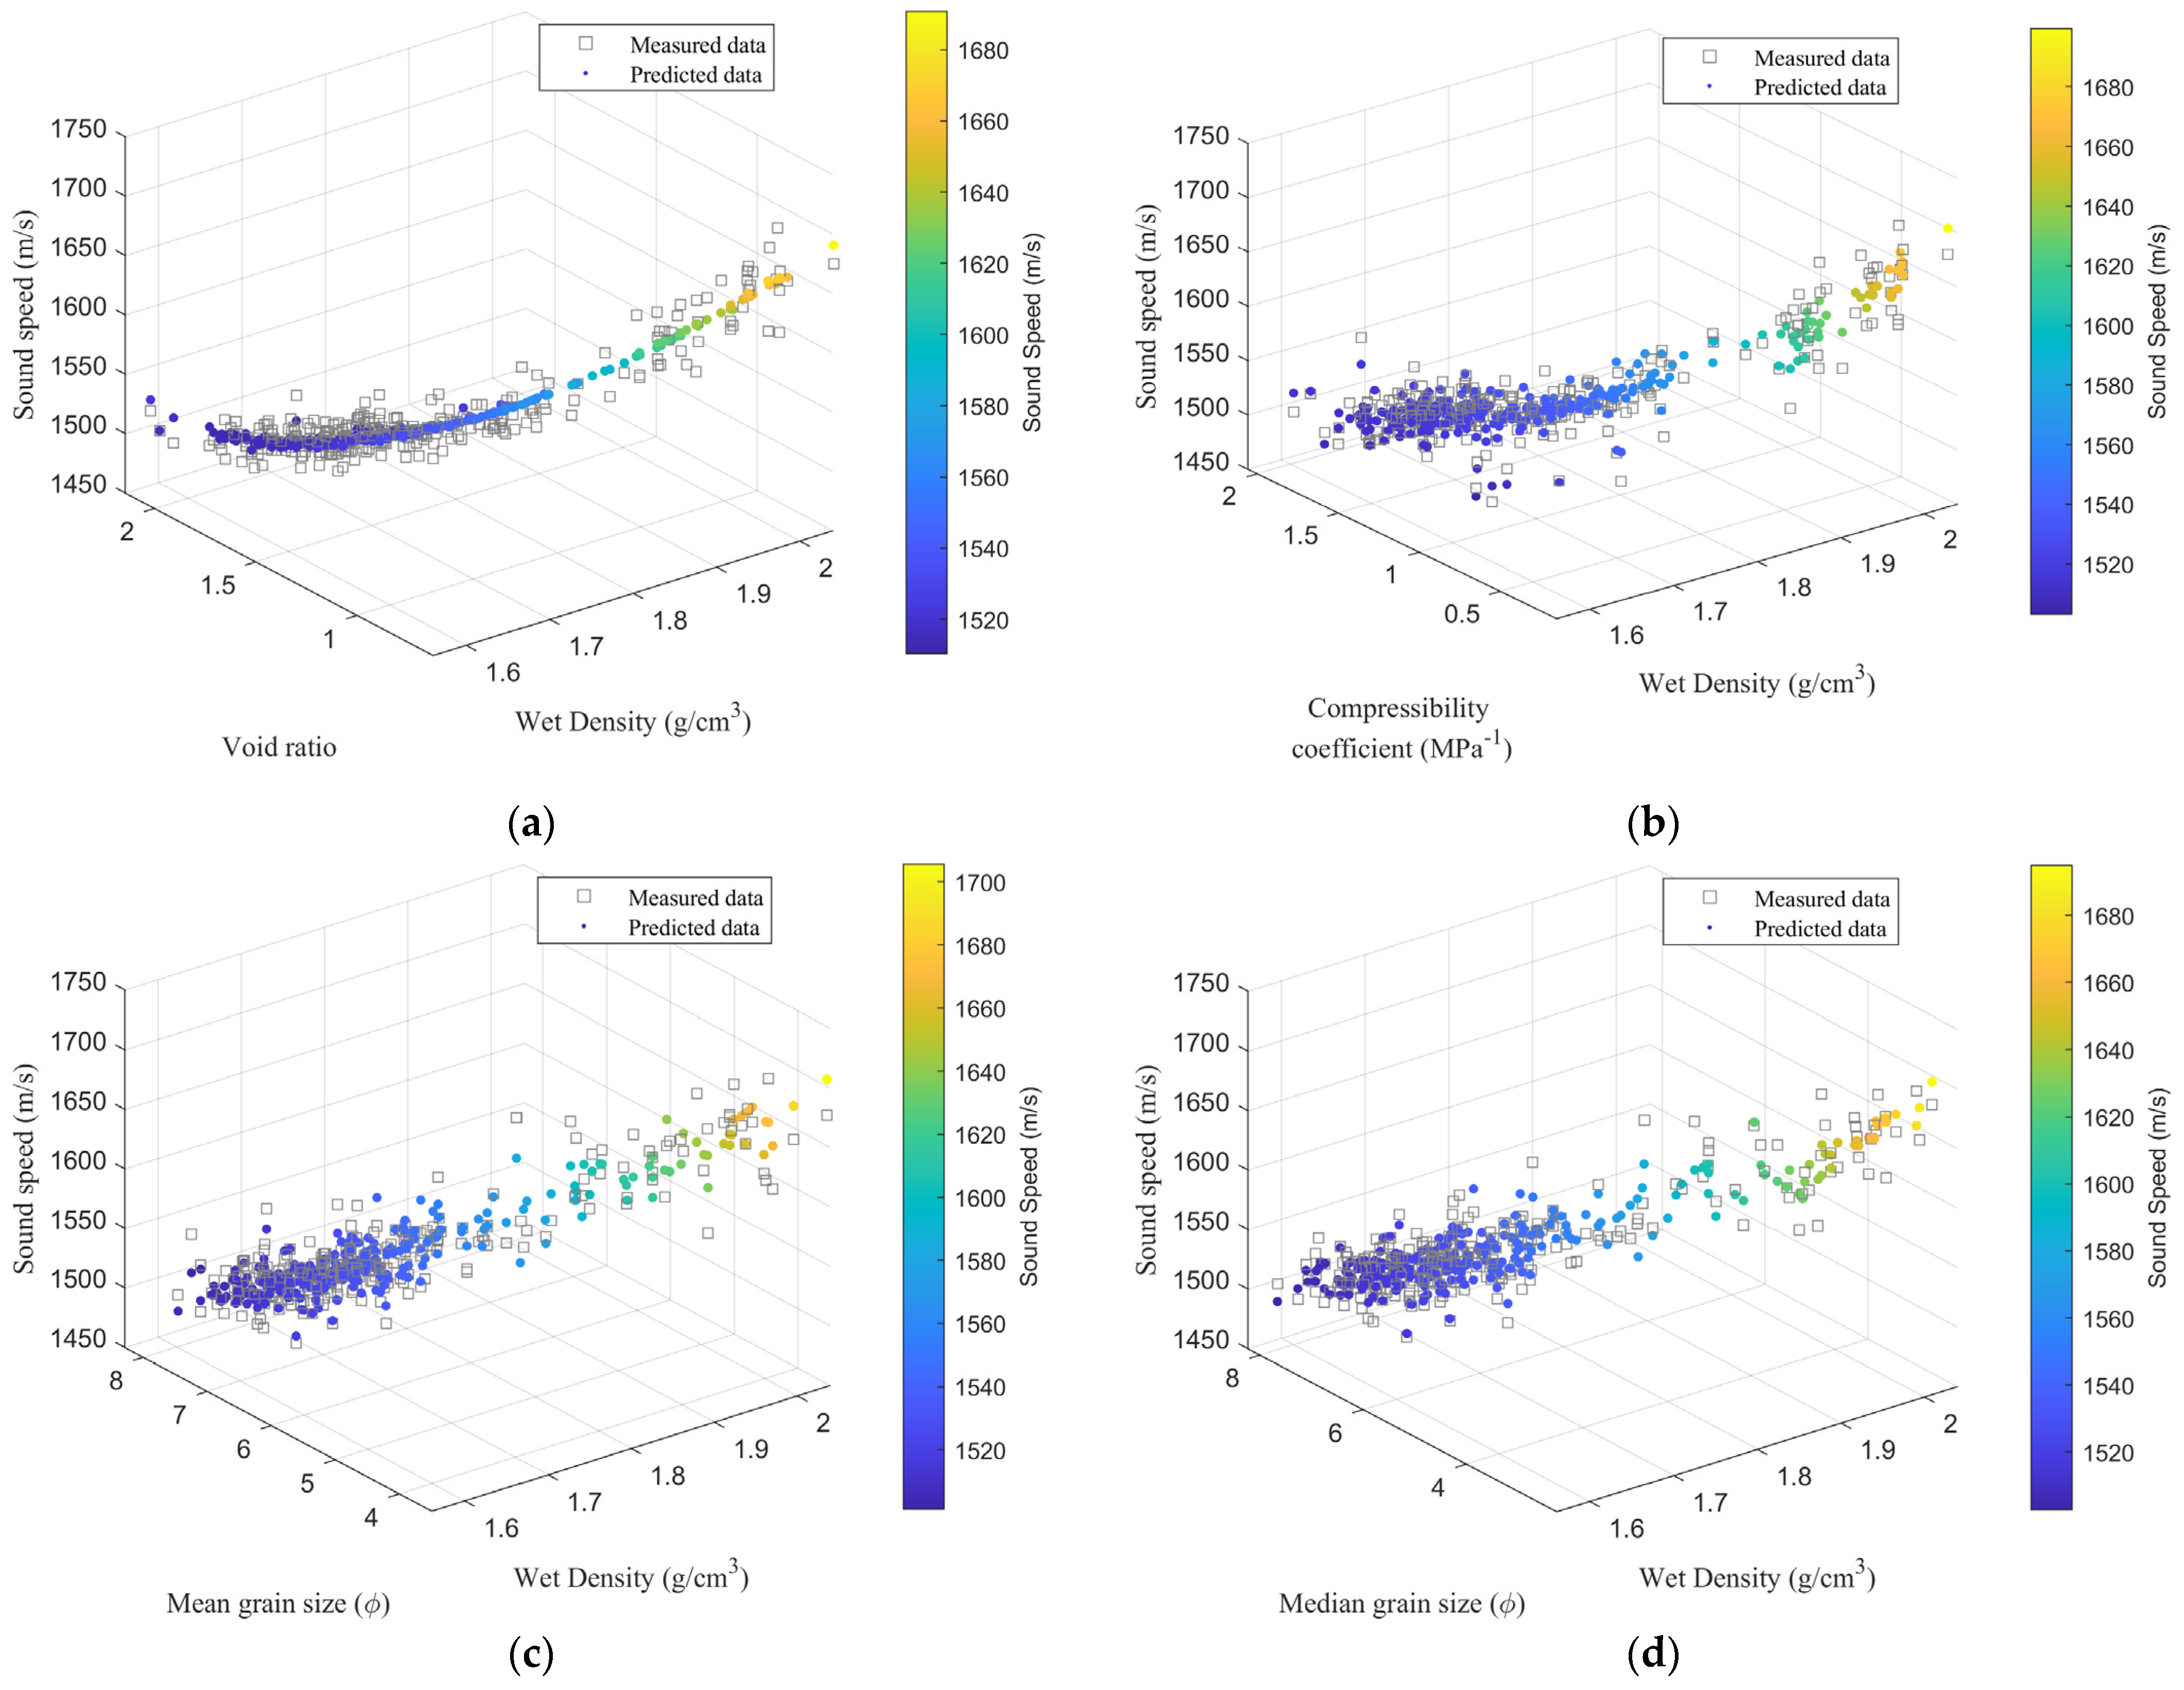
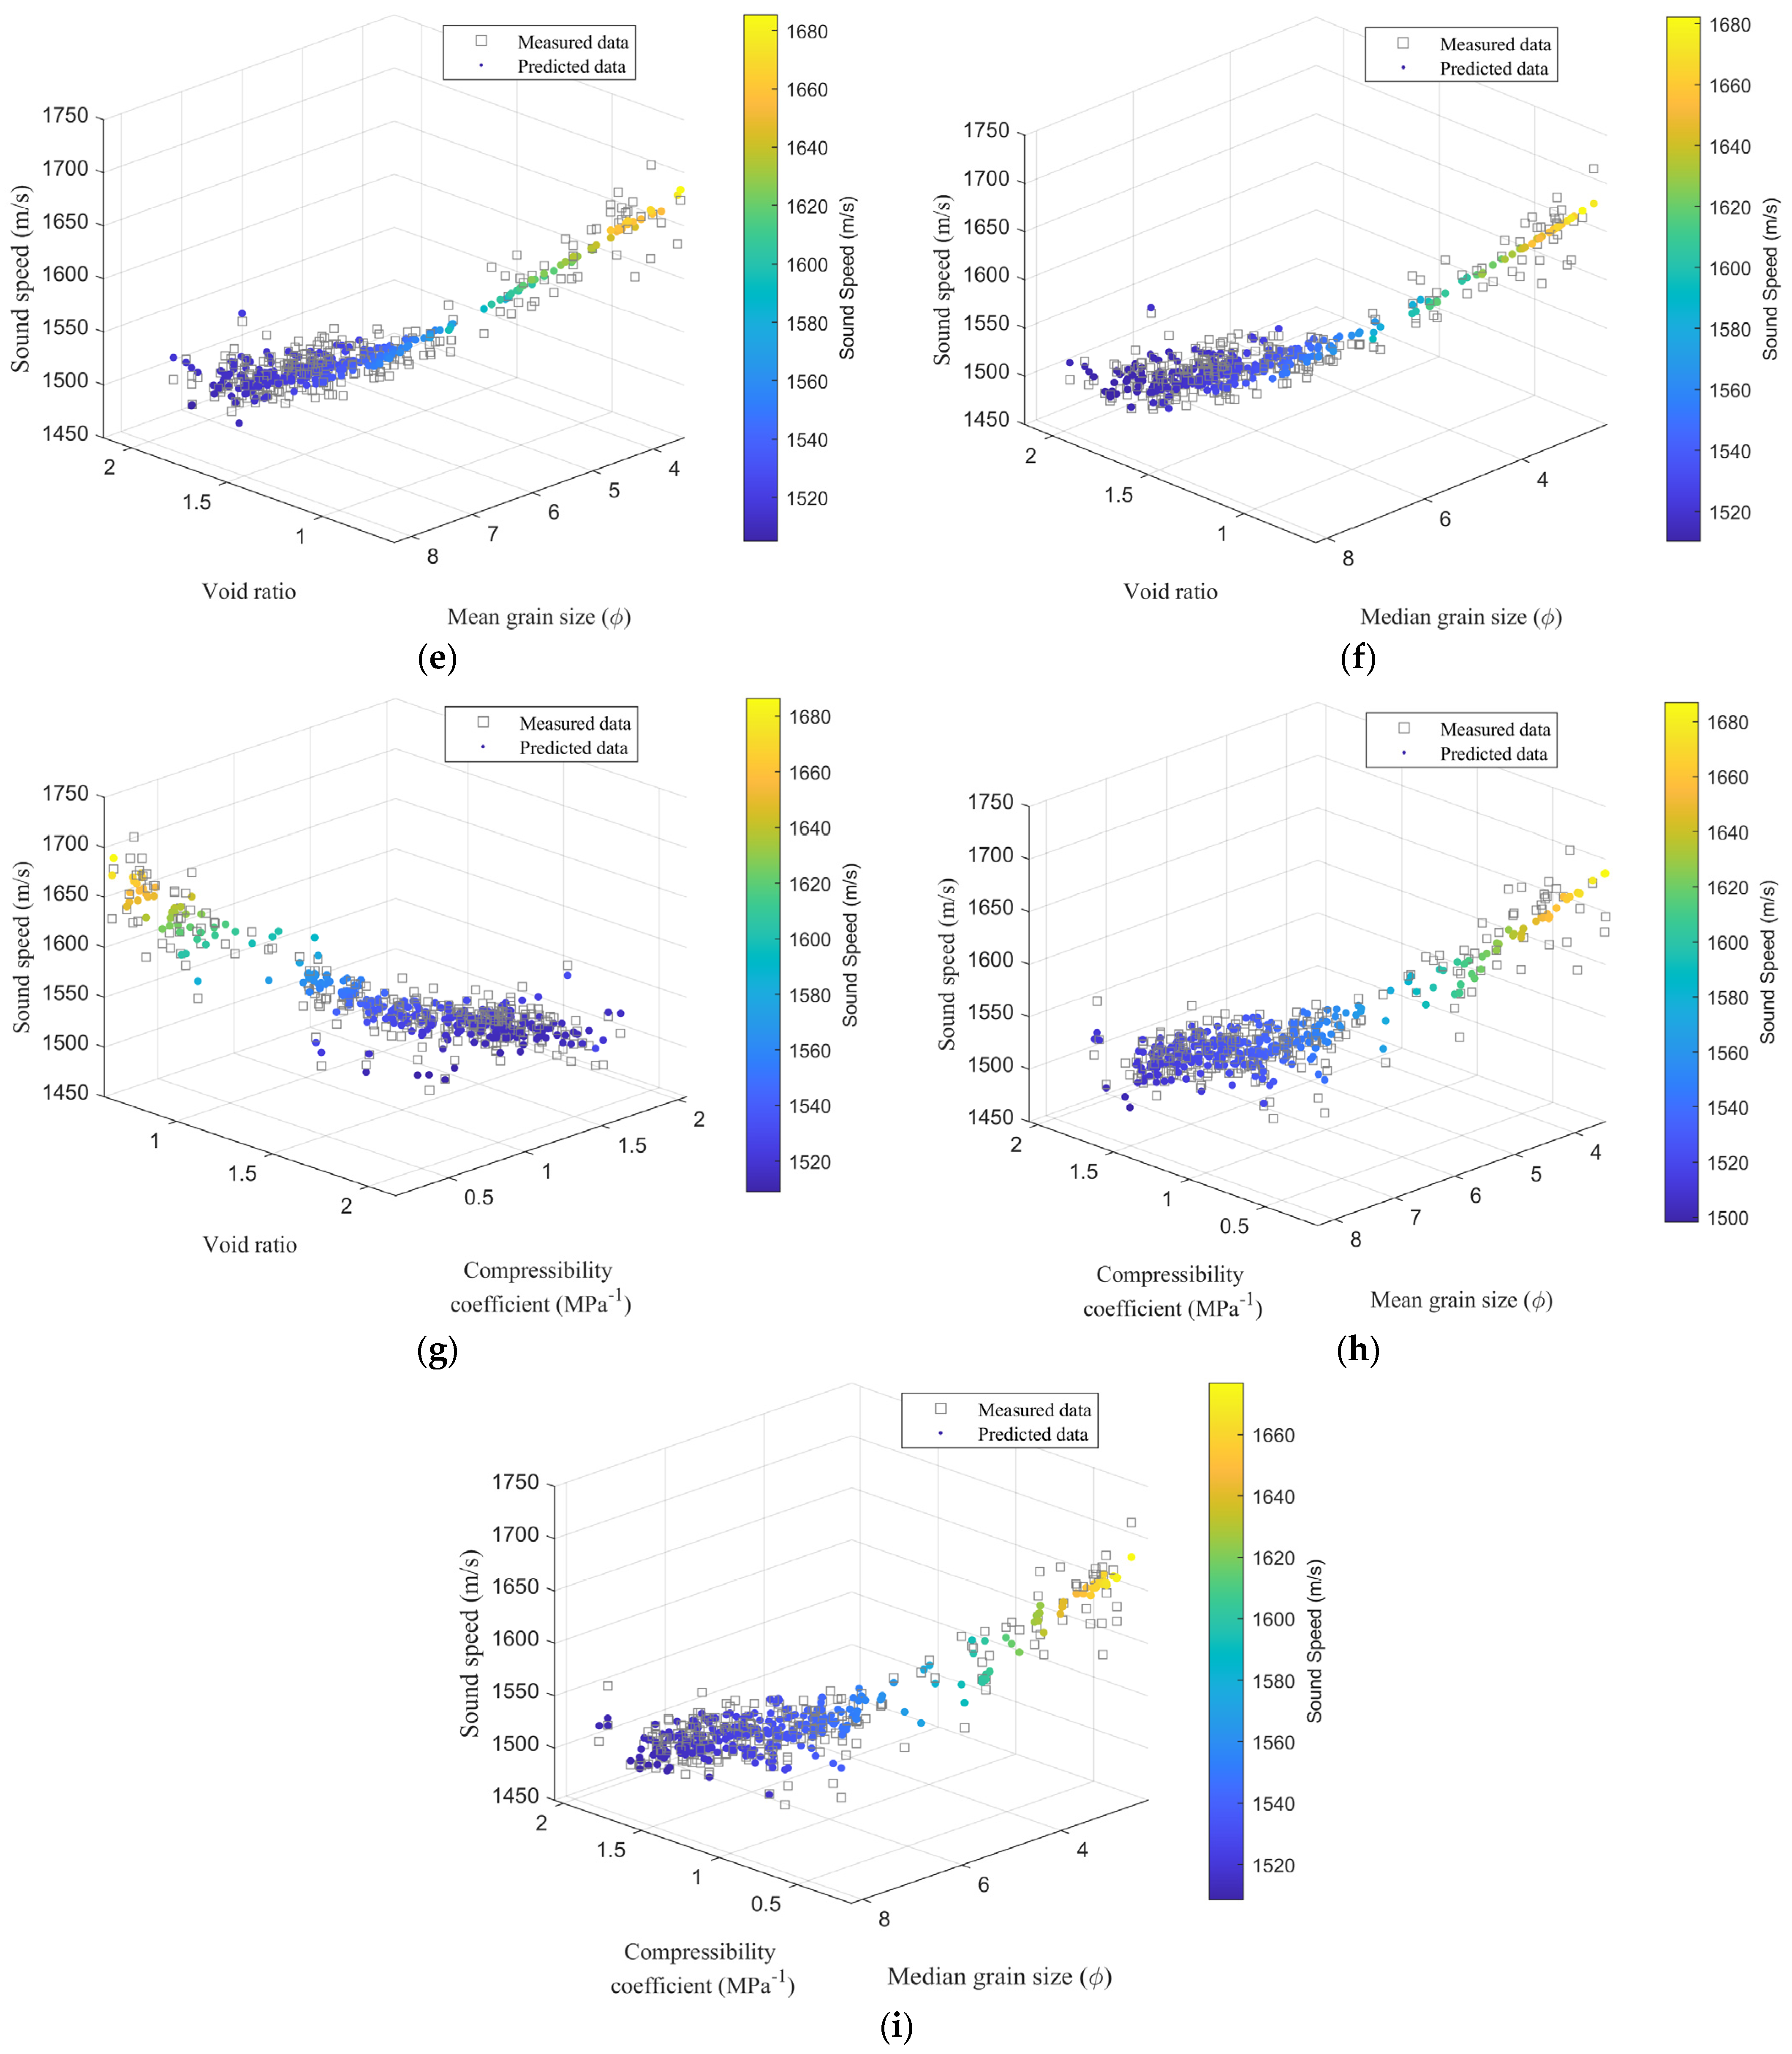
3.2. Dual Parameter Prediction Equations for Sediment Sound Speed

Based on the measured data of 284 sets of sound speed and physical property data, dual parameter prediction equations for sediment sound speed were established, including the sound speed-density-void ratio, sound speed-density-compressibility coefficient, sound speed-density-mean grain size, sound speed-density-median grain size, sound speed-void ratio-compressibility coefficient, sound speed-void ratio-mean grain size, sound speed-void ratio-median grain size, sound speed-compressibility coefficient-mean grain size, and sound speed-compressibility coefficient-median grain size (Table 3). The determination coefficients (R2) for the dual parameter regression equations all exceed 0.85, which are higher than the single parameter prediction equations. The three-dimensional correlation diagrams between sediment sound speed and two parameters were drawn (Figure 2).
The density is a physical parameter that measures the compactness of the sediment, while the void ratio represents the ratio of pore volume to the volume of solid particles within the sediment. For saturated seafloor sediment, the calculation formula for sediment density is:
ρ = n ρ w + ( 1 n ) ρ s .
In Equation (2), n, ρw and ρs represent sediment porosity, pore water density and sediment particle density, respectively. From Equation (2), it can be seen that there is a certain correlation between density and porosity (or void ratio). Generally, as porosity (void ratio) increases, density decreases, indicating a negative correlation between the two parameters. However, the density and void ratio have a certain degree of independence. Due to differences in material source, mineral content, and other factors, there are significant differences in particle density among different types of sediment even when the void ratio is the same. Therefore, establishing a dual parameter sound speed prediction equation based on density and void ratio provides a more comprehensive reflection of the influence of different sediment parameters on sound speed. The compressibility coefficient is a parameter that describes the compressibility of sediment, and the higher the compressibility coefficient, the slower the speed at which sound waves propagate. According to the difference between sediment properties characterized by the two parameters, the compressibility coefficient is an indicator of sediment mechanical properties, while density represents the physical property indicator of sediment compactness. Although they exhibit a certain degree of correlation, they are relatively independent mechanical and physical indicators. Hence, a dual parameter sound speed prediction equation based on the density and compressibility coefficient was established to predict the sediment sound speed more accurately. Hamilton provided a regression relationship between density and mean grain size [24,32]:
ρ = 2.374 0.175 M z + 0.008 M z 2 .
The relationship shown in Formula (3) indicates that there is a certain correlation between density and particle size. However, Hamilton [22] also pointed out that sediments with the same mean grain size may have significant variations in density due to differences in sediment sources, mineral content, and sedimentary environments. For example, sediments with the same mean grain size increase density through compaction, while the grain size remains unchanged [41]. Therefore, density and mean grain size characterize different aspects of sediment physical properties. Based on this, this paper establishes a dual parameter prediction equation for sound speed based on density and mean grain size. The median grain size is also a parameter that characterizes sediment granularity, usually referring to the size of the particle located in the middle position when particles are sorted by size, which differs from the mean grain size [41]. Therefore, a dual parameter prediction equation based on the density and median grain size is necessary.
As shown in Figure 2, the variation trend of sound speed and dual parameters can be divided into two regions: a slow change region with small variation and a rapid change region with high variation. It can be seen that sound speed increases with an increase of density and decreases as the void ratio increases as a whole. When the void ratio is about 1.6–2.2 and sediment density is about 1.56–1.8 g/cm3, the sediment sound speed exhibits relatively small variations, ranging from about 1490–1530 m/s. Subsequently, as the void ratio further decreases and sediment density further increases, the sediment sound speed enters a high-value and high-variation region with a variation range of 1520–1700 m/s (Figure 2a). When the density is in the range of 1.56–1.8 g/cm3 and the sediment compressibility coefficient is about 1.1–2.0 MPa−1, the sediment sound speed exhibits relatively small variations, with a range of about 1490–1530 m/s. As the compressibility coefficient further decreases and the sediment density further increases, the sediment sound speed starts to enter a rapid change region with a significant range of variation between 1520–1700 m/s (Figure 2b). As shown in Figure 2c, when density falls within the range of 1.56–1.8 g/cm3 and sediment mean grain size ranges from 5.7–8.3 ϕ, the sediment sound speed exhibits relatively small variation, with a range of about 1490–1530 m/s. As the mean grain size and the density further begin to increase, the sediment sound speed enters a high-value region with a significant range of variation between 1520–1700 m/s. Similarly, when the density is in the range of 1.56–1.8 g/cm3 and the median grain size of sediment is between 5.1–8.2 ϕ, the variation in sediment sound speed is relatively small, with a range of about 1490–1530 m/s. When the median grain size and density of sediment continue to increase further, the sediment sound speed is in the high-value zone, with a larger range of variation, about 1520–1700 m/s.
The void ratio, a critical parameter, characterizes the proportion of pores within sediment, whereas the mean grain size delineates the size of sediment particles. These parameters represent distinct sediment properties, albeit exhibiting correlation to some extent. As mentioned earlier, the compressibility coefficient, a mechanical parameter, characterizes sediment compressibility, differing from both the void ratio and particle size parameters. A void ratio within the range of 1.6–2.2 and a mean grain size within the range of 5.7–8.3 ϕ corresponds to a relatively minor change in sediment sound speed, ranging from approximately 1490–1530 m/s (Figure 2e). A decrease in the void ratio and a simultaneous increase in the mean grain size of sediment lead to higher values in sediment sound speed, exhibiting a variation range of approximately 1520–1700 m/s, signifying a more substantial variation (Figure 2e). The sediment sound speed resides in the slow change region when the median grain size falls within the range of 5.1–8.2 ϕ, and the void ratio is approximately 1.6–2.2. It transitions into the rapid change region, featuring a high variation of 1520–1700 m/s, as the median grain size increases and the sediment void ratio decreases (Figure 2f). Figure 2g illustrates the range of the compressibility coefficient (1.1–2.1 MPa−1) and void ratio (1.6–2.2) associated with the slow change region of sound speed.
Although there is some correlation between the compressibility coefficient and grain size, they are relatively independent determinants of sediment physical properties. The compressibility coefficient, ranging from 1.1 to 2 MPa−1, and the sediment mean grain size, approximately 5.7–8.3 ϕ, exhibit a relatively small variation in sediment sound speed, with the range stabilizing around 1490–1530 m/s (Figure 2h). However, when the compressibility coefficient starts to decrease from 1.1 to 0.2 MPa−1 and the sediment mean grain size increases from 3.5 to 5.7 ϕ, the sediment sound speed enters a higher value range with a variation range of about 1520–1700 m/s, indicating a larger change in sound speed (Figure 2h). The slow change region of sound speed is situated within the compressibility coefficient range of 1.1–2.1 MPa−1 and the median grain size range of 5.1–8.2 ϕ (Figure 2i). Conversely, the rapid change region is delineated by the compressibility coefficient ranging from 1.1 to 0.2 MPa−1 and the median grain size ranging from 5.1 to 2.2 ϕ (Figure 2i).

4. Discussion

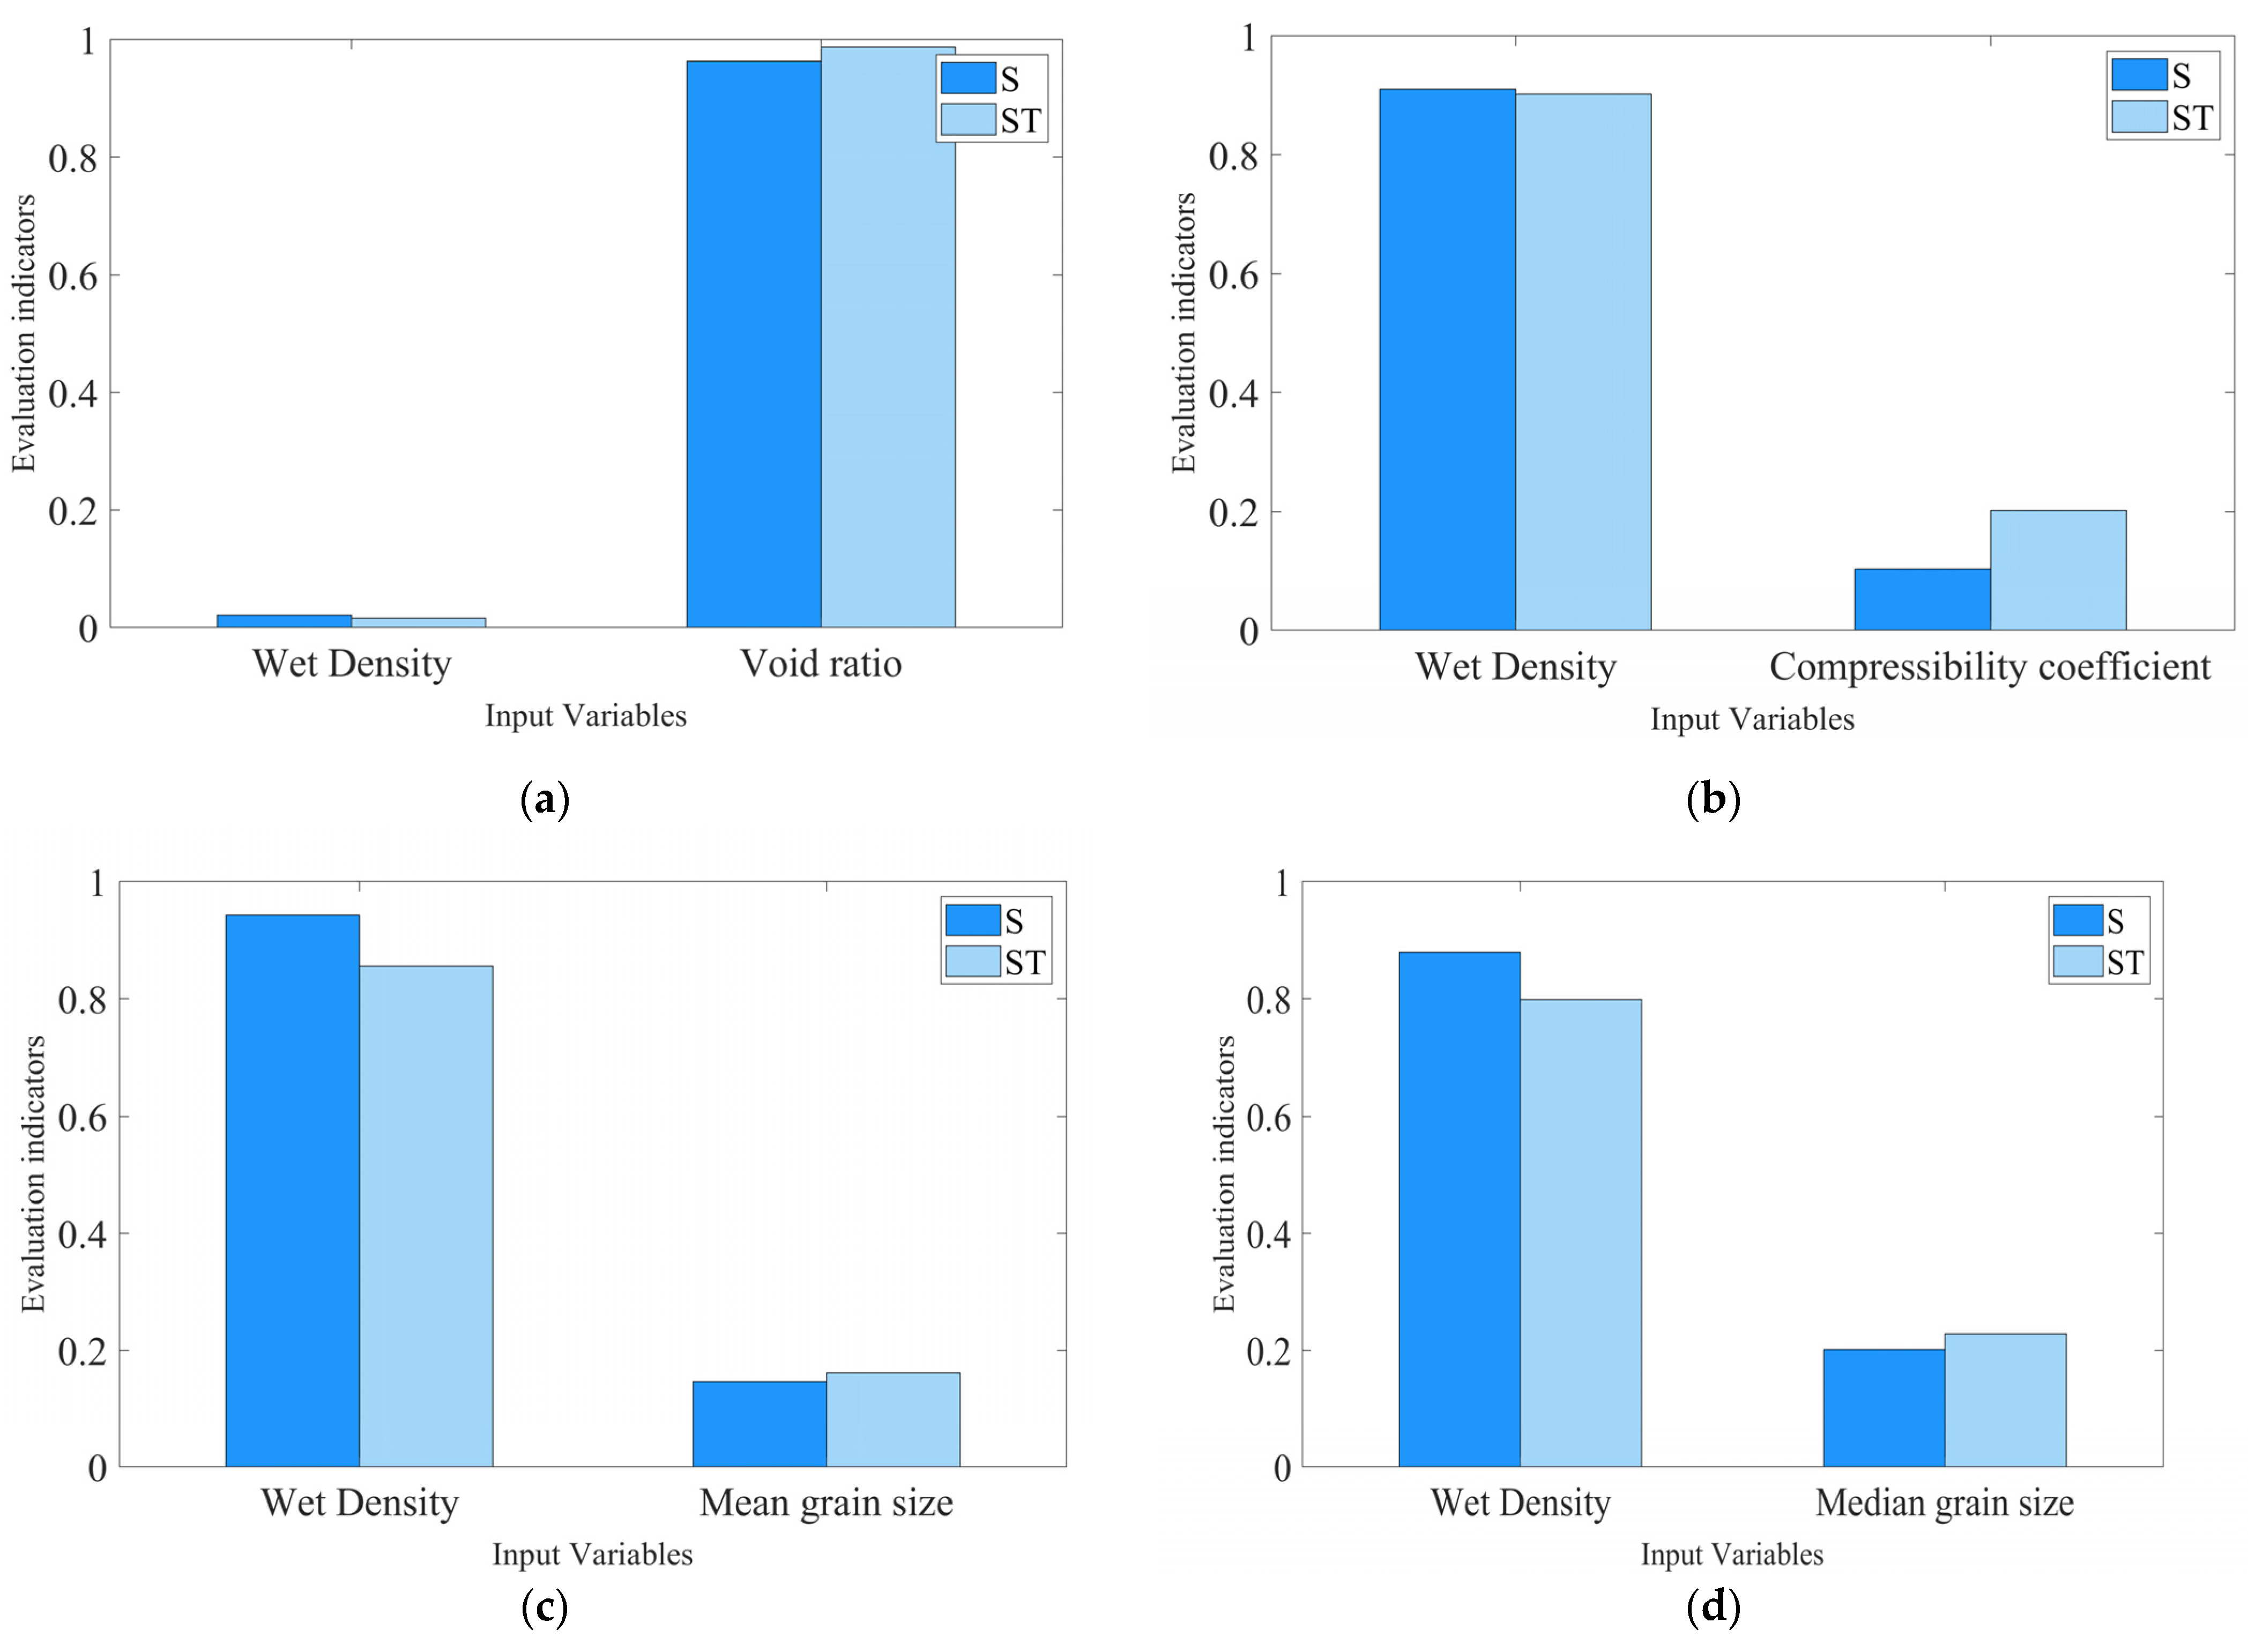
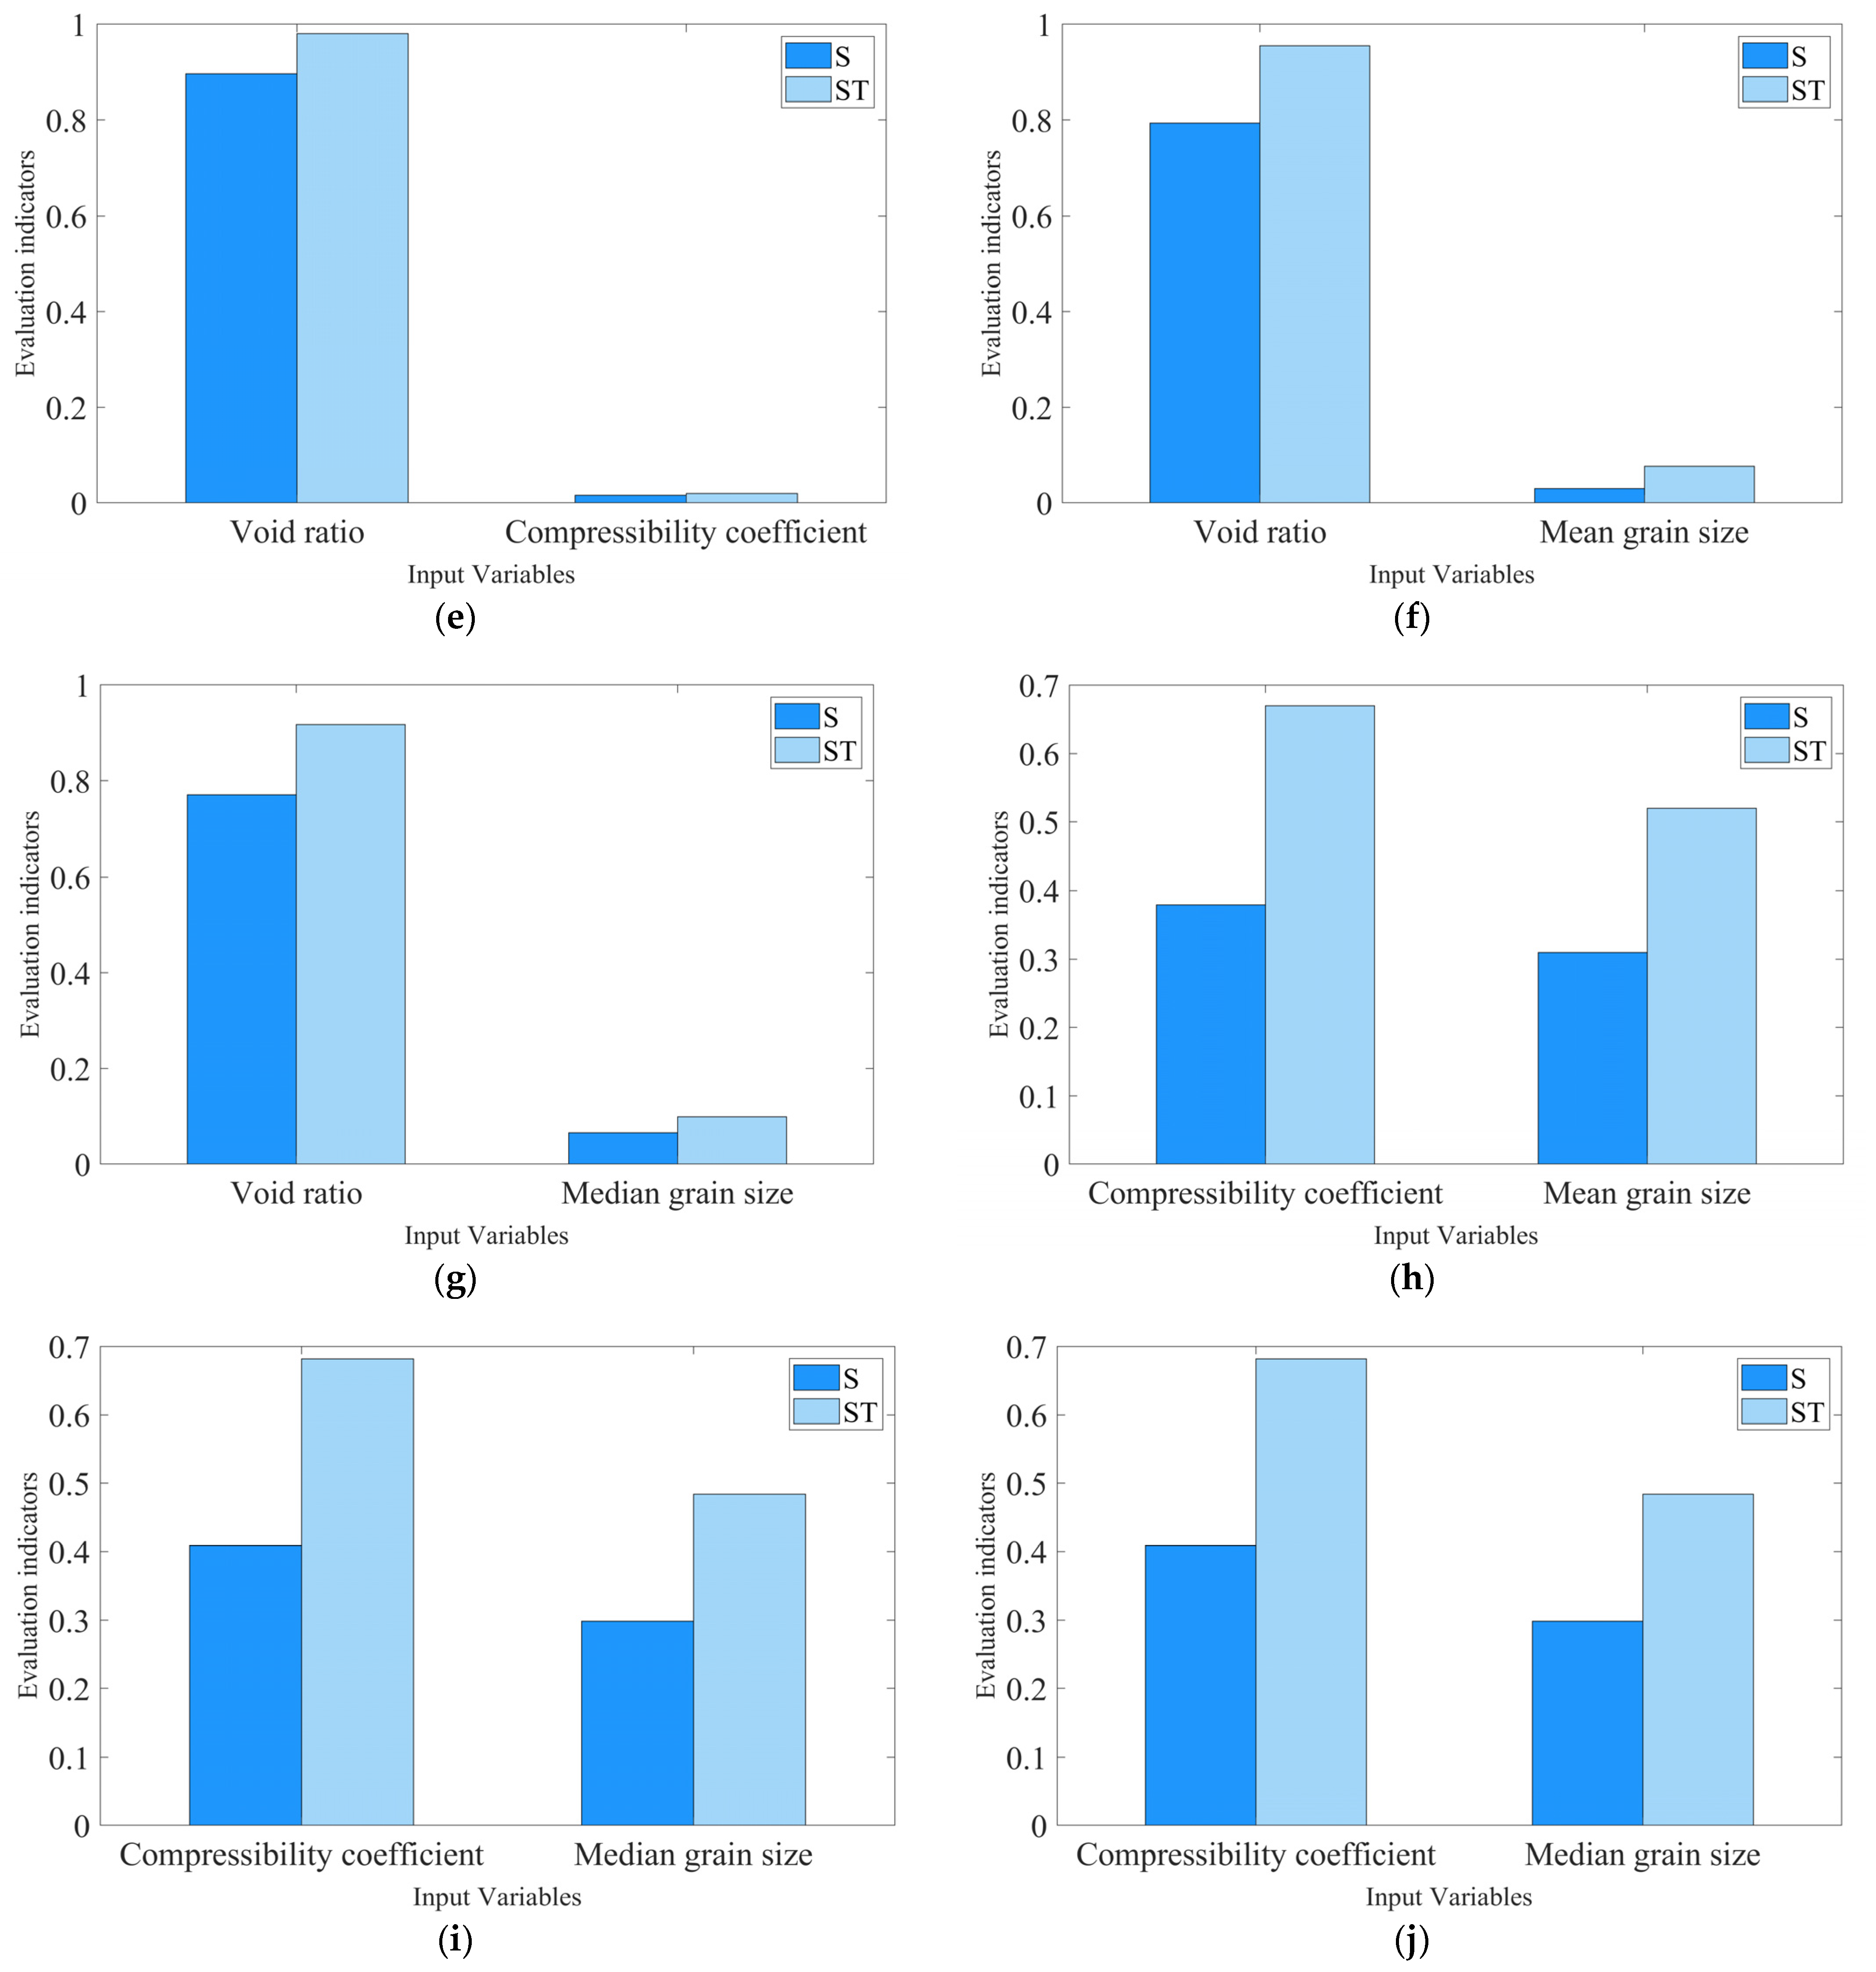
4.1. Sensitivity of Physical Parameters to Sediment Sound Speed

Normalization was performed on these parameters to eliminate the influence of dimensionality and the dual parameter prediction equations for sediment sound speed were established after parameter normalization, as shown in Table 4. For the sake of comparing the sensitivity of mean grain size and median grain size, an additional normalized dual-parameter prediction equation for sediment sound speed with mean grain size and median grain size was established. The main effect index (S) and total effect index (ST) for each parameter in the ten normalized dual parameter prediction equations are shown in Figure 3.
According to the value of the evaluation indicator among ten equations, it is evident that the total effect index of the void ratio remains relatively stable, basically remaining in the range of 0.8 to 1. This indicates that the sediment void ratio not only has high influence on sediment sound speed but also has favorable interaction effects with other parameters. The total effect index of sediment density exhibits stability among ten equations, and the equation involving density and the compressibility coefficient has the highest total effect index. It signifies that the density has a high impact on sound speed and demonstrates a higher degree of interaction with the compressibility coefficient than other physical parameters. The compressibility coefficient, relative to the median grain size and the mean grain size, exhibits higher impact on speed and displays a greater level of interaction with median grain size (Figure 3h,i). The total effect index of the median grain size is slightly higher than that of the mean grain size (Figure 3j). By synthesizing the main and total effect indices of the physical parameters in the ten equations listed in Table 4, the sensitivity of physical parameters to sediment sound speed can be ranked in descending order as follows: void ratio, density, compressibility coefficient, median grain size, and mean grain size.

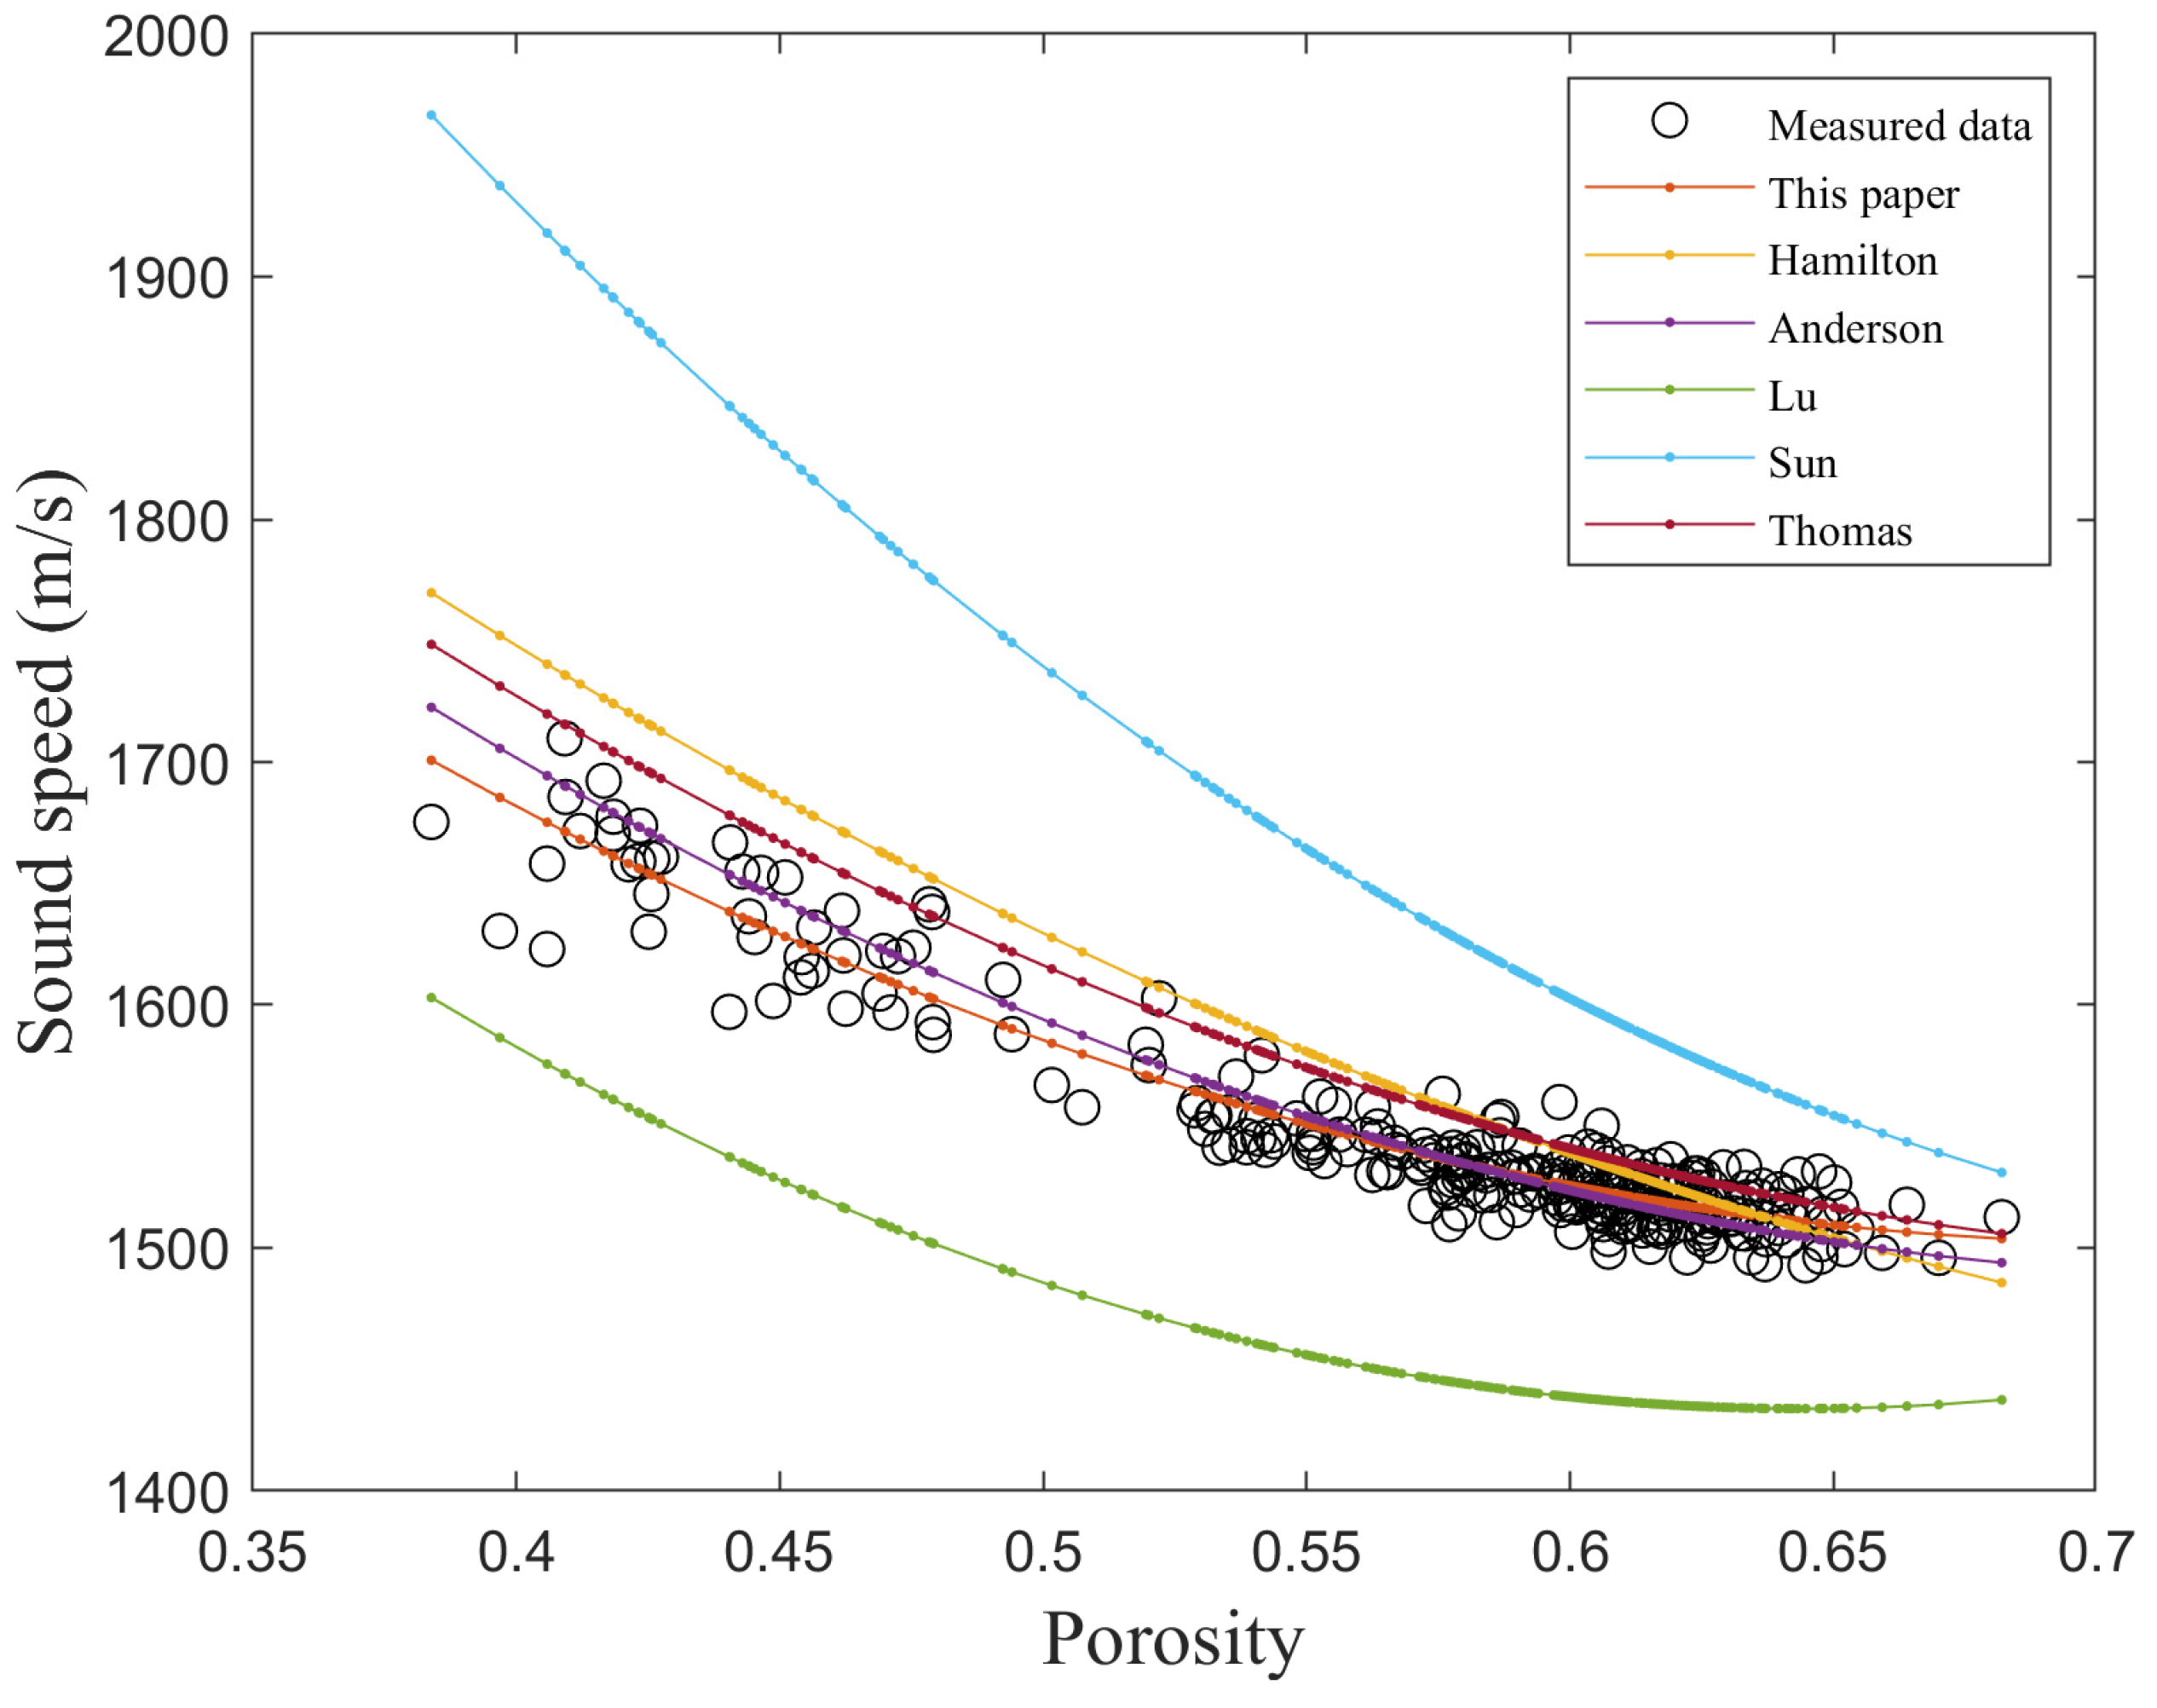
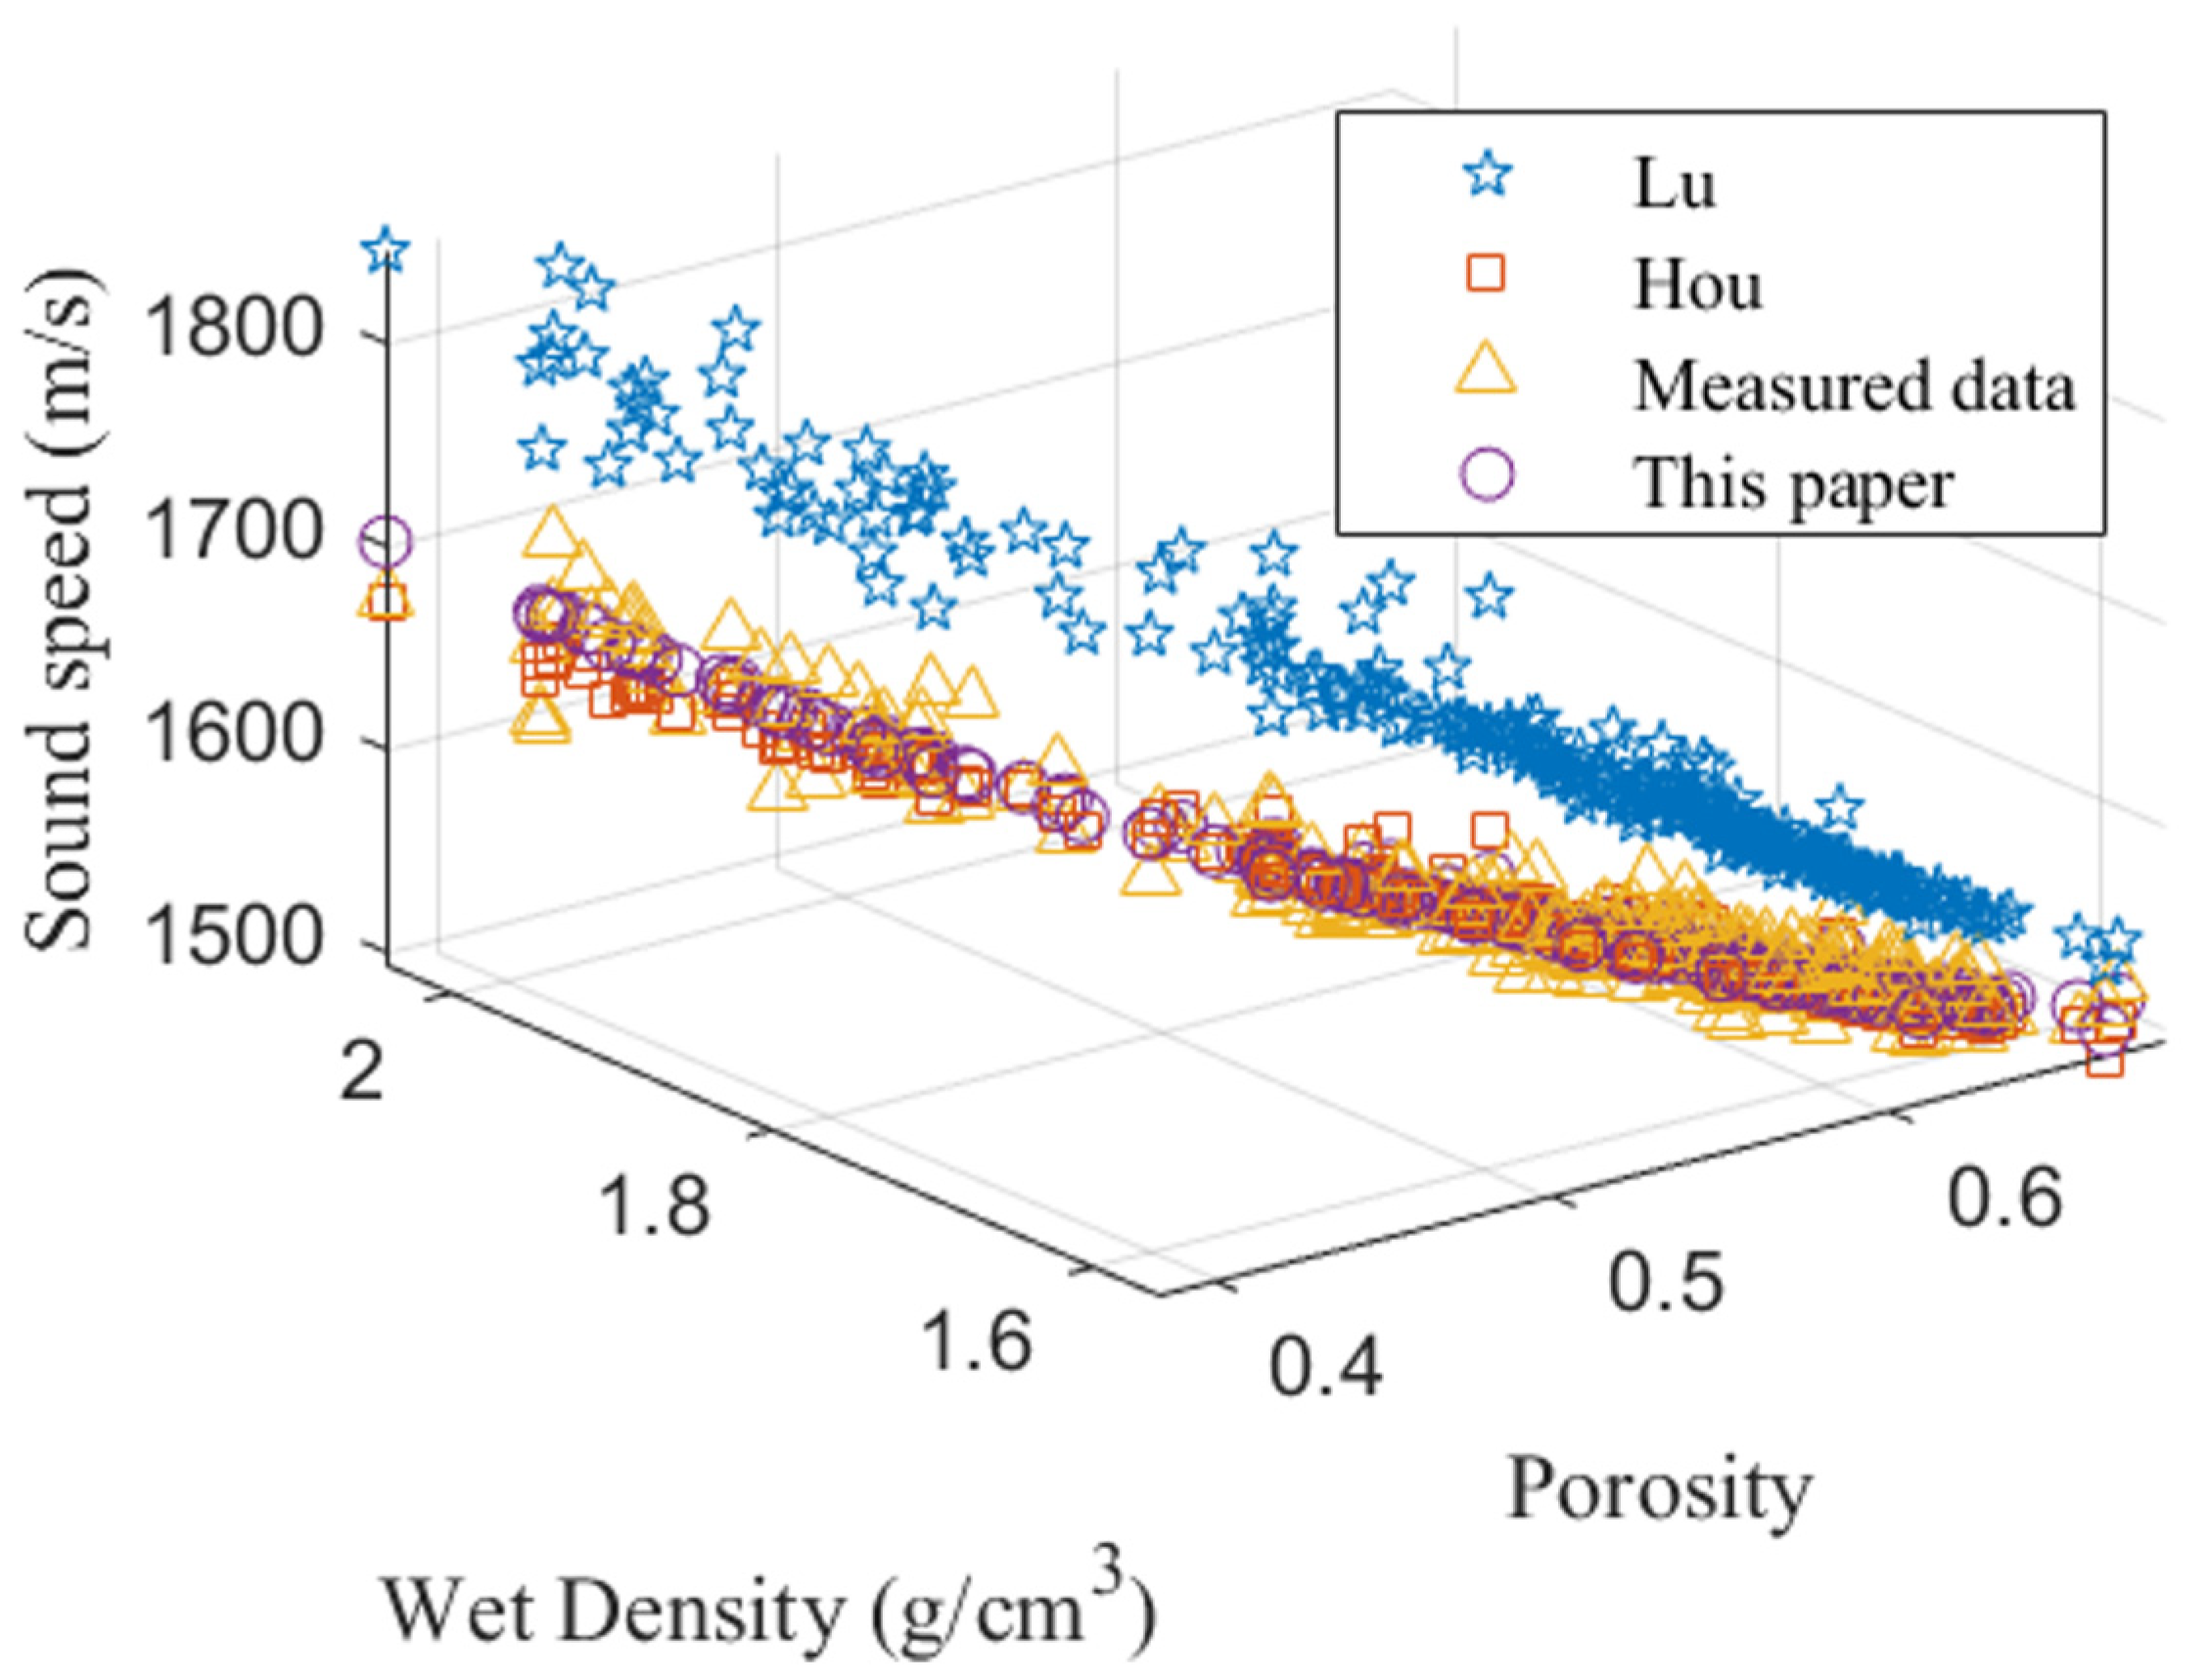
4.2. Comparison between Different Prediction Equations

Due to the close relationship between the acoustic properties of seafloor sediments and the physical-mechanical properties, researchers have conducted extensive research on the relationship between them and established a lot of prediction equations. Based on the sensitivity analysis of physical parameters discussed above, the void ratio, which can be used to calculate the porosity, exhibits the highest sensitivity to sediment sound speed. Therefore, several single parameter sound speed prediction equations based on porosity established by Hamilton [14], Anderson [19], Lubo [27], Thomas [20] and Sun [42] are selected to compare and analyze the differences between the prediction equations established in this study and those established by them (Table 5).
As shown in Figure 4, the prediction result of this study is closest to that of Anderson’s equation with the maximum bias of 21.81 m/s at the porosity of 0.38, and their bias is very small in the porosity range of 0.53–0.62. The maximum bias of prediction result between this study and Hamilton’s equation is 69.00 m/s, which is larger than that of Anderson’s equation. The curves of the results predicted by Hamilton and Anderson are both above the prediction curve of this study when the porosity is lower than 0.63, while the prediction curve is below that of this study in the entire porosity range. Moreover, there is a significant difference between the prediction curve in this study and that of Lu’s equation, with a maximum difference of 120 m/s. Lu’s prediction equation was based on data from multiple sea areas, including the East China Sea continental shelf, Taiwan Strait, and the northern South China Sea, and the scatteration of data used in Lu’s study is relatively high, which may explain the significant differences compared to this study’s results. Another possible reason for the differences in the prediction results could be the difference in measurement frequencies, for example, measurement frequency of the sediment sound speed of Hamilton’s equation is at 200 kHz, while that of this study is at 100 kHz. In addition, different marine environmental conditions such as water depth and in situ temperature of seafloor caused by different sea areas are also reasons for the above differences.
In order to compare the prediction results of different dual parameter prediction equations, we chose dual parameter prediction equations based on the porosity and density established by Lu and Hou to compare and analyze the differences between the prediction equations established in this study and those established by them, which are listed in Table 6 [18,21]. The prediction results of the prediction equation established in this study is relatively close to those of Hou’s equation with a maximum, minimum and average bias of 30.63 m/s, 0.0442 m/s, and 4.68 m/s, respectively, but differ significantly from those of Lu’s equation, with a maximum, minimum and average bias of 173.67 m/s, 28.80 m/s, and 80.27 m/s (Figure 5).

5. Conclusions

  • Establishment of Single and Dual Parameter Prediction Equations: Through regression analysis, single parameter and dual parameter prediction equations for sediment sound speed in the East China Sea shelf area have been established. Judging from the coefficient of determination (R2) of the single equations, sediment sound speed is strongly correlated with water content, density, void ratio, mean grain size and median grain size with the R2 greater than 0.80. The dual parameter prediction equations all have R2 values greater than 0.85, which is higher than the R2 values of the single parameter prediction equations. This indicates that the dual parameter prediction equations have a better performance for the sediment sound speed prediction. The prediction equations established in this study serve as a valuable supplement to the acoustic property prediction equations for coastal seafloor sediments.
  • Order of Sensitivity of Physical-Mechanical Parameters to Sound Speed: In terms of sensitivity to sediment sound speed, the sensitivity of physical parameters ranks from the highest to the lowest as follows: void ratio, density, compressibility coefficient, median grain size and mean grain size. This is helpful for the selection of sediment physical parameters when establishing the sound velocity prediction equation for seafloor sediments.
  • Comparative Analysis of Prediction Equations: The comparison of the prediction results of sediment sound speed among different prediction equations indicates that there may be significant differences between different prediction equations. The maximum difference of the single parameter prediction equations based on porosity is 120 m/s. For the dual parameter prediction equations based on density and porosity, it reaches 173.67 m/s. These differences remind us that it is necessary to select appropriate prediction equations which are suitable to the study sea area when using prediction equations for sound velocity prediction.

Author Contributions

Conceptualization, G.K., X.M. and J.L.; methodology, G.K., X.M. and J.L.; software, Q.H.; validation, M.C., J.L. and G.K.; formal analysis, G.K., J.L. and M.C.; investigation, J.W. and L.Z.; resources and data curation, J.W. and L.Z.; writing—original draft preparation, G.K. and J.L.; writing—review and editing, G.L.; visualization, J.L.; supervision, B.L. All authors have read and agreed to the published version of the manuscript.

Funding

This study was supported by the National Natural Science Foundation of China under Grant No. 42376076, 42049902, U2006202, 42176191; and by the Central Public-interest Scientific Institution Basal Research Fund under Grant No. GY0220Q09.

Institutional Review Board Statement

Not applicable.

Informed Consent Statement

Not applicable.

Data Availability Statement

Data are contained within the article.

Acknowledgments

Data acquisition and sample collections were supported by the National Natural Science Foundation of China Open Research Cruise (Cruise No. NORC2021-02+NORC2021-301), funded by the Ship Time Sharing Project of the National Natural Science Foundation of China. This cruise was conducted onboard the R/V “XiangYang Hong 18” by The First Institute of Oceanography, Ministry of Natural Resources, China.

Conflicts of Interest

The authors declare no conflict of interest.

References

  1. Beebe, J.; McDaniel, S.; Rubano, L. Shallow-water transmission loss prediction using the Biot sediment model. J. Acoust. Soc. Am. 1982, 71, 1417–1426. [Google Scholar] [CrossRef]
  2. Collins, M.D. A higher-order parabolic equation for wave propagation in an ocean overlying an elastic bottom. J. Acoust. Soc. Am. 1989, 86, 1459–1464. [Google Scholar] [CrossRef]
  3. Chen, S.; Wu, L.; Zhang, R.; Li, Z.; James, F.L.; Timothy, F.D.; Arthur, E.N. Internal wave characteristics in the South China Sea and the associated fluctuations in the acoustic field. Prog. Nat. Sci. 2004, 14, 1163–1170. [Google Scholar]
  4. Kim, D.C.; Kim, G.Y.; Yi, H.I.; Seo, Y.K.; Lee, G.S.; Jung, J.H.; Kim, J.C. Geoacoustic provinces of the South Sea shelf off Korea. Quat. Int. 2012, 263, 139–147. [Google Scholar] [CrossRef]
  5. Schock, S.G. Remote estimates of physical and acoustic sediment properties in the South China Sea using chirp sonar data and the Biot model. IEEE J. Ocean. Eng. 2004, 29, 1218–1230. [Google Scholar] [CrossRef]
  6. Yang, K.; Lei, B.; Ma, Y. Subcritical scattering field and signal-to-reverberation ratio from buried objects. Tech. Acoust. 2007, 26, 1081–1088. [Google Scholar]
  7. Hodges, R.P. Underwater Acoustics: Analysis, Design and Performance of Sonar; John Wiley & Sons: Hoboken, NJ, USA, 2011. [Google Scholar]
  8. Zhang, S. Geoacoustics: An important subject in the study of the seabed. Physics 1997, 26, 280–285. [Google Scholar]
  9. Panda, S.; LeBlanc, L.R.; Schock, S.G. Sediment classification based on impedance and attenuation estimation. J. Acoust. Soc. Am. 1994, 96, 3022–3035. [Google Scholar] [CrossRef]
  10. Kim, G.Y.; Richardson, M.D.; Bibee, D.L.; Kim, D.C.; Wilkens, R.H.; Shin, S.R.; Song, S.T. Sediment types determination using acoustic techniques in the Northeastern Gulf of Mexico. Geosci. J. 2004, 8, 95–103. [Google Scholar] [CrossRef]
  11. Pszonka, J.; Schulz, B. SEM Automated Mineralogy applied for the quantification of mineral and textural sorting in submarine sediment gravity flows. Gospod. Surowcami Miner.-Miner. Resour. Manag. 2022, 38, 105–131. [Google Scholar]
  12. Stoll, R.D. Acoustic waves in ocean sediments. Geophysics 1977, 42, 715–725. [Google Scholar] [CrossRef]
  13. Buckingham, M.J. Compressional and shear wave properties of marine sediments: Comparisons between theory and data. J. Acoust. Soc. Am. 2005, 117, 137–152. [Google Scholar] [CrossRef] [PubMed]
  14. Hamilton, E.L.; Bachman, R.T. Sound velocity and related properties of marine sediments. J. Acoust. Soc. Am. 1982, 72, 1891–1904. [Google Scholar] [CrossRef]
  15. Meng, X.; Liu, B.; Kan, G.; Li, G. An experimental study on acoustic properties and their influencing factors of marine sediment in the southern Huanghai Sea. Acta Oceanol. Sin. 2012, 34, 74–83. [Google Scholar]
  16. Kan, G.; Liu, B.; Han, G.; Li, G.; Zhao, Y. Application of in-situ measurement technology to the survey of seafloor sediment acoustic properties in the Huanghai Sea. Acta Oceanol. Sin. 2010, 32, 88–94. [Google Scholar]
  17. Wang, J.; Li, G.; Liu, B.; Kan, G.; Sun, Z.; Meng, X.; Hua, Q. Experimental study of the ballast in situ sediment acoustic measurement system in South China Sea. Mar. Georesources Geotechnol. 2018, 36, 515–521. [Google Scholar] [CrossRef]
  18. Lu, B.; Ganxian, L.; Shaojian, H. Correlation between sound speed and physical parameters of shallow sediments in Nansha sea area. In Proceedings on Sound and Light Fields in Nansha Sea Area; China Ocean Press: Beijing, China, 1996; pp. 9–22. [Google Scholar]
  19. Anderson, R.S. Statistical correlation of physical properties and sound velocity in sediments. In Physics of Sound in Marine Sediments; Springer: Berlin/Heidelberg, Germany, 1974; pp. 481–518. [Google Scholar]
  20. Orsi, T.H.; Dunn, D.A. Sound velocity and related physical properties of fine-grained abyssal sediments from the Brazil Basin (South Atlantic Ocean). J. Acoust. Soc. Am. 1990, 88, 1536–1542. [Google Scholar] [CrossRef]
  21. Hou, Z. The Correlation of Seafloor Sediment Acoustic Properties and Physical Parameters in the Southern South China Sea; Insitute of Oceannology, Chinese Academy of Sciences: Qingdao, China, 2016. [Google Scholar]
  22. Hamilton, E.L. Sound velocity as a function of depth in marine sediments. J. Acoust. Soc. Am. 1985, 78, 1348–1355. [Google Scholar] [CrossRef]
  23. Hamilton, E.L. Geoacoustic modeling of the sea floor. J. Acoust. Soc. Am. 1980, 68, 1313–1340. [Google Scholar] [CrossRef]
  24. Hamilton, E.L. Elastic properties of marine sediments. J. Geophys. Res. 1971, 76, 579–604. [Google Scholar] [CrossRef]
  25. Hamilton, E.L. Low sound velocities in high-porosity sediments. J. Acoust. Soc. Am. 1956, 28, 16–19. [Google Scholar] [CrossRef]
  26. Bachman, R.T. Acoustic and physical property relationships in marine sediment. J. Acoust. Soc. Am. 1985, 78, 616–621. [Google Scholar] [CrossRef]
  27. Lu, B.; Li, G.; Liu, Q.; Huang, S.; Zhang, F. Sea floor sediment and its acouso-physical properties in the southeast open sea area of Hainan Island in China. Mar. Georesources Geotechnol. 2008, 26, 129–144. [Google Scholar] [CrossRef]
  28. Tang, Y. The Relationship between porosity of sea bed sediment and sound velocity. Acta Oceanol. Sin. 1998, 20, 39–43. [Google Scholar]
  29. Zou, D.; Wu, B.; Lu, B. Analysis and study on the sound velocity empirical equations of seafloor sediments. Acta Oceanol. Sin. 2007, 29, 43–50. [Google Scholar]
  30. Wang, J.; Kan, G.; Li, G.; Meng, X.; Zhang, L.; Chen, M.; Liu, C.; Liu, B. Physical properties and in situ geoacoustic properties of seafloor surface sediments in the East China Sea. Front. Mar. Sci. 2023, 10, 1195651. [Google Scholar] [CrossRef]
  31. Bachman, R.T. Estimating velocity ratio in marine sediment. J. Acoust. Soc. Am. 1989, 86, 2029–2032. [Google Scholar] [CrossRef]
  32. Hamilton, E.L. Prediction of in-situ acoustic and elastic properties of marine sediments. Geophysics 1971, 36, 266–284. [Google Scholar] [CrossRef]
  33. Lu, B.; Liang, Y. Statistical correlation between physical parameters of marine sediments and sound velocity in the southeast coast of China. Sci. Sin. 1994, 24, 556–560. [Google Scholar]
  34. Pan, G.; Ye, Y.; Lai, X.; Chen, X.; Lü, X. Shear wave velocity of seabed sediment from laboratory measurements and its relationship with physical properties of sediment. Acta Oceanol. Sin. 2006, 28, 64–68. [Google Scholar]
  35. Liu, S.; Shi, X.; Fang, X.; Dou, Y.; Liu, Y.; Wang, X. Spatial and temporal distributions of clay minerals in mud deposits on the inner shelf of the East China Sea: Implications for paleoenvironmental changes in the Holocene. Quat. Int. 2014, 349, 270–279. [Google Scholar] [CrossRef]
  36. Zhang, K.; Li, A.; Huang, P.; Lu, J.; Liu, X.; Zhang, J. Sedimentary responses to the cross-shelf transport of terrigenous material on the East China Sea continental shelf. Sediment. Geol. 2019, 384, 50–59. [Google Scholar] [CrossRef]
  37. Saltelli, A.; Andres, T.; Homma, T. Sensitivity analysis of model output: An investigation of new techniques. Comput. Stat. Data Anal. 1993, 15, 211–238. [Google Scholar] [CrossRef]
  38. Saltelli, A. Making best use of model evaluations to compute sensitivity indices. Comput. Phys. Commun. 2002, 145, 280–297. [Google Scholar] [CrossRef]
  39. Jackson, D.; Richardson, M. High-Frequency Seafloor Acoustics; Springer Science & Business Media: Berlin/Heidelberg, Germany, 2007. [Google Scholar]
  40. Williams, K.L.; Jackson, D.R.; Thorsos, E.I.; Tang, D.; Schock, S.G. Comparison of sound speed and attenuation measured in a sandy sediment to predictions based on the Biot theory of porous media. IEEE J. Ocean. Eng. 2002, 27, 413–428. [Google Scholar] [CrossRef]
  41. Pszonka, J.; Schulz, B.; Sala, D. Application of mineral liberation analysis (MLA) for investigations of grain size distribution in submarine density flow deposits. Mar. Pet. Geol. 2021, 129, 105109. [Google Scholar] [CrossRef]
  42. Sun, Z.; Sun, L.; Li, G.; Kan, G.; Guo, C.; Wang, J.; Meng, X. The relationship between the acoustic characteristics and physical properties of deep-sea sediments in the Philippine Sea. Mar. Sci. 2018, 5, 12–22. [Google Scholar]
Figure 1. Two−dimensional correlation diagrams between sediment sound speed and single physical parameters. (a) Sound speed versus water content; (b) sound speed versus density; (c) sound speed versus void ratio; (d) sound speed versus compressibility coefficient; (e) sound speed versus compressibility modulus; (f) sound speed versus mean grain size; (g) sound speed versus median grain size.
Jmse 12 00027 g001aJmse 12 00027 g001b
Figure 2. Three−dimensional correlations between sediment sound speed and dual-parameter pairs: (a) sound speed versus the dual-parameter pair of density and void ratio; (b) sound speed versus the dual-parameter pair of density and compressibility coefficient; (c) sound speed versus the dual-parameter pair of density and mean grain size; (d) sound speed versus the dual-parameter pair of density and median grain size; (e) sound speed versus the dual-parameter pair of void ratio and mean grain size; (f) sound speed versus the dual-parameter pair of void ratio and median grain size; (g) sound speed versus the dual-parameter pair of void ratio and compressibility coefficient; (h) sound speed versus the dual-parameter pair of compressibility coefficient and mean grain size; (i) sound speed versus the dual-parameter pair of compressibility coefficient and median grain size.
Jmse 12 00027 g002aJmse 12 00027 g002b
Figure 3. Evaluation indicators of sensitivity (S and ST) of the physical parameters on sound speed for the normalized dual-parameter prediction equation. (a) density and void ratio; (b) density and compressibility coefficient; (c) density and mean grain size; (d) density and median grain size; (e) void ratio and compressibility coefficient; (f) void ratio and mean grain size; (g) void ratio and median grain size; (h) compressibility coefficient and mean grain size; (i) compressibility coefficient and median grain size; (j) mean grain size and median grain size.
Jmse 12 00027 g003aJmse 12 00027 g003b
Figure 4. Comparison of prediction results of different single parameter sound speed prediction equations.
Jmse 12 00027 g004
Figure 5. Comparison of predictions from different dual parameter sediment sound speed prediction equations.
Jmse 12 00027 g005
Table 1. Statistical summary of the acoustic and physical-mechanical properties of sediment on the shelf of the East China Sea.
Sediment Typec
(m/s)
w
(%)
ρ
(g/cm3)
ea
(MPa−1)
E
(MPa)
Mz
(ϕ)
Md
(ϕ)
Fine SandMaximum1692.31 27.65 1.99 0.79 0.22 9.88 3.78 2.91
Minimum1597.16 26.45 1.92 0.71 0.18 8.28 4.29 3.00
Average1649.53 26.98 1.96 0.74 0.20 8.86 3.98 2.95
Silty SandMaximum1636.47 39.50 1.92 1.08 0.86 5.46 4.77 4.12
Minimum1583.60 28.30 1.81 0.80 0.34 2.45 5.41 4.99
Average1610.51 32.11 1.89 0.89 0.49 4.36 5.14 4.59
Clayey SandMaximum1673.75 32.40 2.00 0.89 0.61 6.40 4.172.73
Minimum1596.91 25.70 1.90 0.70 0.27 3.19 4.80 2.98
Average1650.60 28.48 1.97 0.77 0.36 5.42 4.34 2.86
Coarse SiltMaximum1598.47 81.10 1.88 2.14 1.62 6.53 5.214.88
Minimum1509.69 28.75 1.59 0.86 0.28 1.58 7.53 7.53
Average1537.90 53.23 1.73 1.42 1.16 2.28 6.32 6.08
Sand ClayMaximum1533.33 65.60 1.73 1.86 1.69 1.89 7.03 7.09
Minimum1503.61 54.80 1.61 1.44 1.39 1.69 8.29 8.23
Average1513.73 60.97 1.65 1.67 1.54 1.77 7.67 7.74
Sandy SiltMaximum1709.78 37.90 2.04 1.09 0.86 11.37 3.49 2.24
Minimum1587.96 21.00 1.78 0.62 0.15 2.51 5.60 5.01
Average1642.96 29.35 1.93 0.82 0.40 5.40 4.49 3.36
Clayey SiltMaximum1638.27 76.85 1.90 2.03 2.06 4.56 5.70 5.06
Minimum1492.86 32.05 1.56 0.90 0.42 1.25 7.74 7.97
Average1524.68 56.29 1.69 1.53 1.31 2.02 6.94 6.89
Note: c: sound speed; w: water content; ρ: density; e: void ratio; a: compressibility coefficient; E: compressibility modulus; Mz: mean grain size; Md: median grain size.
Table 2. Single parameter prediction equations of sound speed on the shelf of the East China Sea.
ParametersEquationsR2
Water content (w) c = 0.085 w 2 11.419 w + 1895.432 0.886
Density (ρ) c = 274.743 ρ 2 443.644 ρ + 1682.547 0.868
Void ratio (e) c = 125.867 e 2 450.420 e + 1916.038 0.894
Compressibility coefficient (a) c = 70.492 a 2 229.339 a + 1702.653 0.792
Compressibility modulus (E) c = 3.344 E 2 + 54.941 E + 1433.321 0.730
Mean grain size (Mz) c = 6.797 M z 2 120.551 M z + 2033.322 0.808
Median grain size (Md) c = 3.944 M d 2 71.822 M d + 1831.579 0.827
Table 3. Dual parameter prediction equations of sound speed on the shelf of the East China Sea.
ParametersEquationsR2
Density-void ratio (ρ, e) c = 145.321 ρ 2 414.143 ρ + 92.615 e 2 253.597 e 56.950 ρ e + 2125.148 0.895
Density-compressibility coefficient (ρ, a) c = 251.544 ρ 2 404.277 ρ 3.098 a 2 + 321.840 a 189.758 ρ a + 1497.356 0.873
Density-mean grain size (ρ, Mz) c = 467.958 ρ 2 1212.456 ρ 0.846 M z 2 + 47.442 M z 28.129 ρ M z + 2277.411 0.885
Density-median grain size (ρ, Md) c = 269.877 ρ 2 540.511 ρ + 0.152 M d 2 + 38.781 M d 28.918 ρ M d + 1728.658 0.891
Void ratio-compressibility coefficient (e, a) c = 148.337 e 2 506.679 e + 2.712 a 2 + 31.706 a 18.500 e a + 1939.992 0.896
Void ratio-mean grain size (e, Mz) c = 86.574 e 2 420.296 e 2.511 M z 2 + 3.539 M z + 15.014 e M z + 1899.443 0.900
Void ratio-median grain size (e, Md) c = 72.368 e 2 330.327 e + 0.011 M d 2 18.337 M d + 8.364 e M d + 1895.848 0.904
Compressibility coefficient-mean grain size (a, Mz) c = 9.141 a 2 207.244 a 2.269 M z 2 15.281 M z + 22.939 a M z + 1786.873 0.855
Compressibility coefficient-median grain size (a, Md) c = 5.865 a 2 152.869 a 0.514 M d 2 25.968 M d + 16.696 a M d + 1766.918 0.869
Table 4. Normalized dual parameter prediction equations of the sound speed on the shelf of the shelf of the East China Sea.
ParametersEquationsR2
Density-void ratio (ρ, e) c = 33.482 ρ 2 + 1.813 ρ + 214.260 e 2 345.330 e 41.578 ρ e + 1655.344 0.895
Density—compressibility coefficient (ρ, a) c = 57.956 ρ 2 + 167.573 ρ 11.256 a 2 + 47.438 a 173.606 ρ a + 1478.017 0.873
Density—mean grain size (ρ, Mz) c = 107.817 ρ 2 + 71.741 ρ 19.490 M z 2 11.240 M z 64.805 ρ M z + 1526.925 0.885
Density—median grain size (ρ, Md) c = 62.180 ρ 2 + 113.604 ρ + 5.438 M d 2 33.846 M d 83.136 ρ M d + 1528.803 0.891
Void ratio-compressibility coefficient (e, a) c = 1343.170 e 2 493.755 e + 9.851 a 2 + 40.015 a 53.632 e a + 1684.994 0.896
Void ratio—mean grain size (e, Mz) c = 200.283 e 2 395.549 e 57.854 M z 2 22.201 M z + 109.605 e M z + 1685.618 0.900
Void ratio—median grain size (e, Md) c = 167.418 e 2 336.757 e + 0.403 M d 2 78.317 M d + 76.196 e M d + 1688.771 0.904
Compressibility coefficient—mean grain size (a, Mz) c = 33.208 a 2 237.282 a 52.265 M z 2 132.789 M z + 209.853 a M z + 1687.095 0.855
Compressibility coefficient—median grain size (a, Md) c = 21.306 a 2 216.671 a 18.445 M d 2 154.340 M d + 190.601 a M d + 1688.933 0.869
Mean grain size—median grain size (Mz, Md) c = 407.073 M z 2 29.894 M z 179.921 M d 2 307.723 M d + 731.483 M z M d + 1695.085 0.829
Table 5. Single parameter prediction equations of sound speed in the shelf of the ECS.
AuthorSingle Parameter Prediction EquationBackground of Equation Establishment
Hamilton [14] c = 2502.0 24.45 n + 0.14 n 2 Based on data collected in continental shelf
Anderson [19] c = 2506 27.58 n + 0.1868 n 2 Based on data of sediments from the less than 1500 m deep seafloor
Thomas [20] c = 2527.4 27.132 n + 0.1782 n 2 Based on sediment core samples collected from the offshore margin of the Brazilian continental shelf to the Pernambuco deep-sea plain, with an average water depth of 5047 m.
Bo Lu [27] c = 2470.7 32.2 n + 0.25 n 2 Based on the data collected in the northern continental shelf of South China Sea
Sun [42] c = 3239.1 4358.7 n + 2718.7 n 2 Based on sediment core Samples collected from the seabed at depths ranging from 3164 to 5592 m in the Philippine deep sea
This study c = 1823.5 2604.2 n + 1823.5 n 2 Based on the data collected in the shelf of East China Sea
Table 6. Dual parameter prediction equations of sound speed in the study area.
AuthorSingle Parameter Prediction EquationBackground of Equation Establishment
Lu [18] c = 1895.78 2525.29 ρ + 1014.88 ρ 2
+ 51.05 n 0.31 n 2 9.42 ρ n
Based on the data collected in continental shelf of South China Sea
Hou [21] c = 3342 1177 ρ 29.23 n + 269.5 ρ 2
+ 7.018 ρ n + 0.1236 n 2
Based on the data of data in the southern South China Sea
This study c = 265.50 + 1516.39 ρ + 255.03 n 262.37 ρ 2
1016.00 ρ n + 899.87 n 2
Based on the data collected in the shelf of the East China Sea
Disclaimer/Publisher’s Note: The statements, opinions and data contained in all publications are solely those of the individual author(s) and contributor(s) and not of MDPI and/or the editor(s). MDPI and/or the editor(s) disclaim responsibility for any injury to people or property resulting from any ideas, methods, instructions or products referred to in the content.

