The water entry process generally refers to the progression from the moment when the head of the underwater projectile makes contact with the water surface to the time when the torpedo is completely wet, which is divided into the shock wave stage, flow formation stage, cavity open stage, cavity closed stage, cavity collapse stage and full wetting stage.
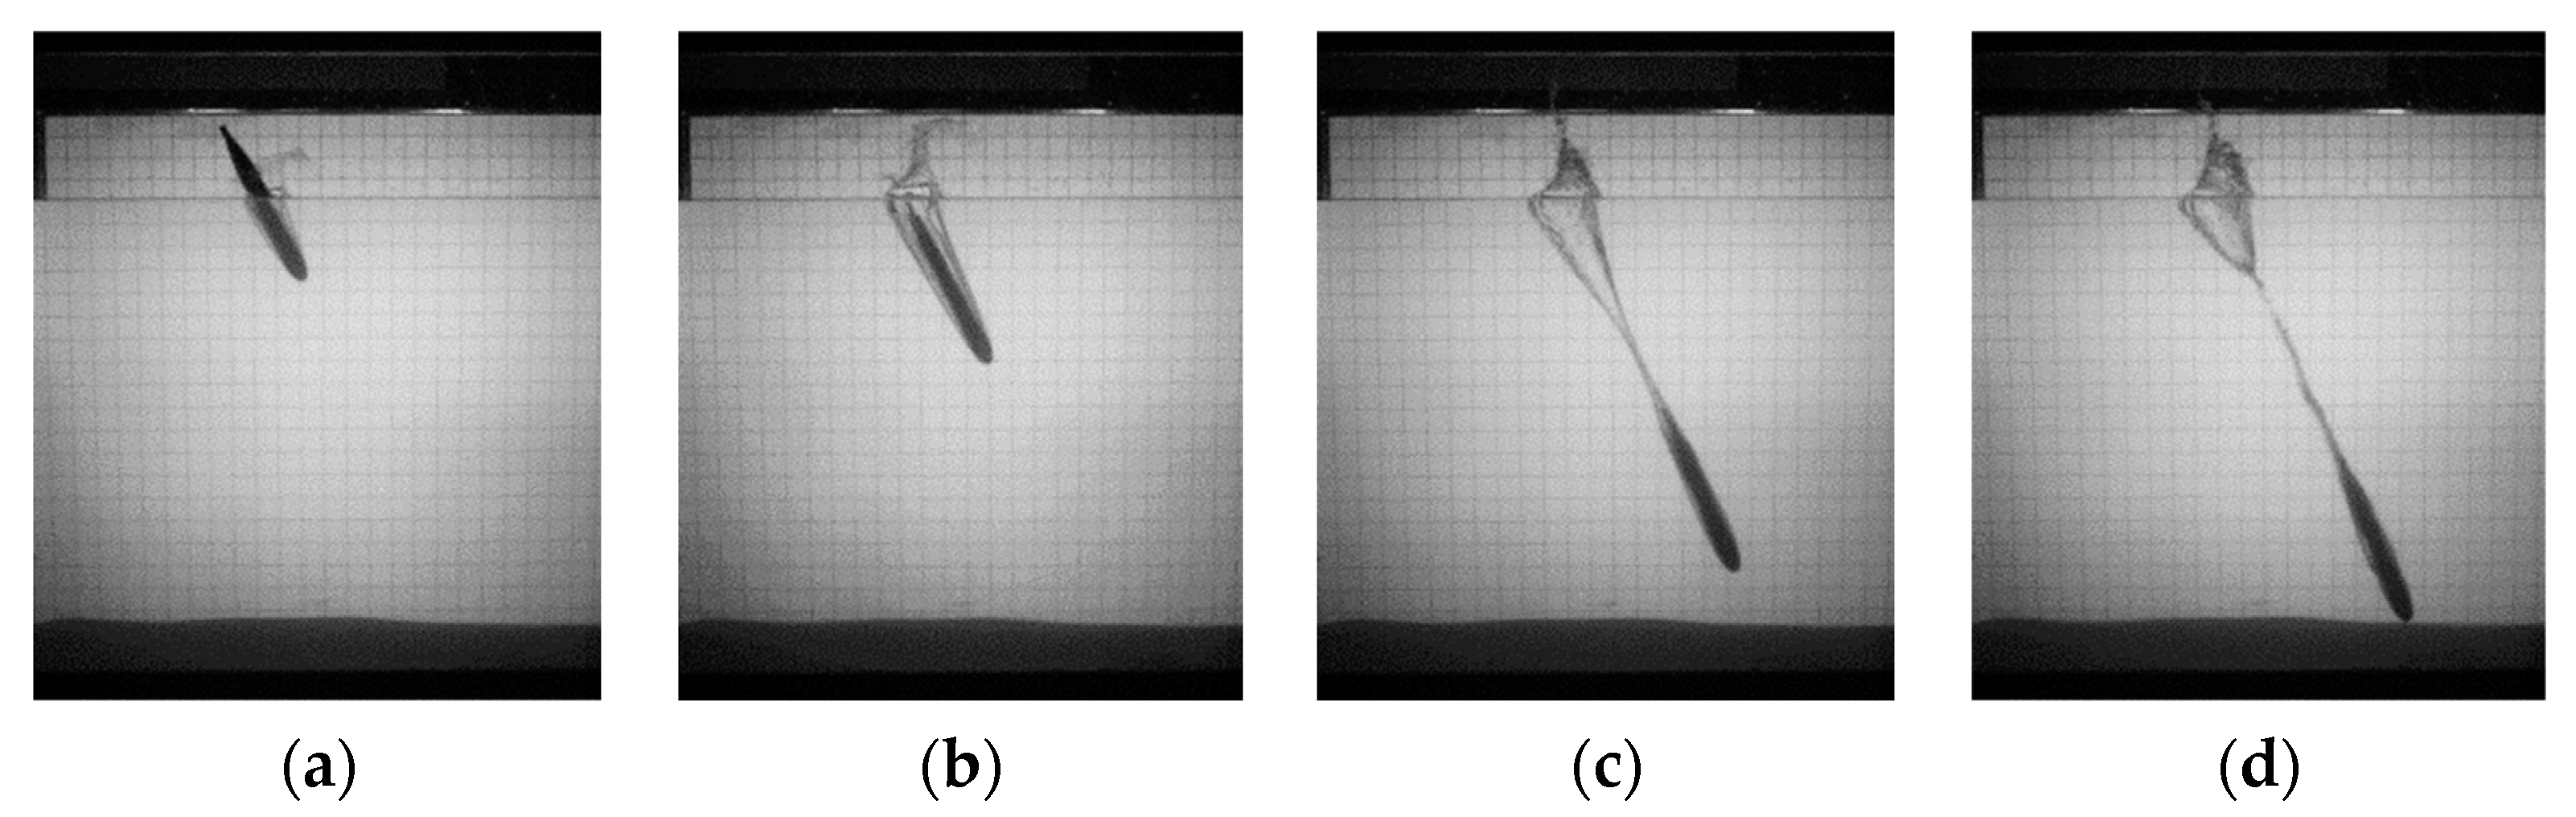
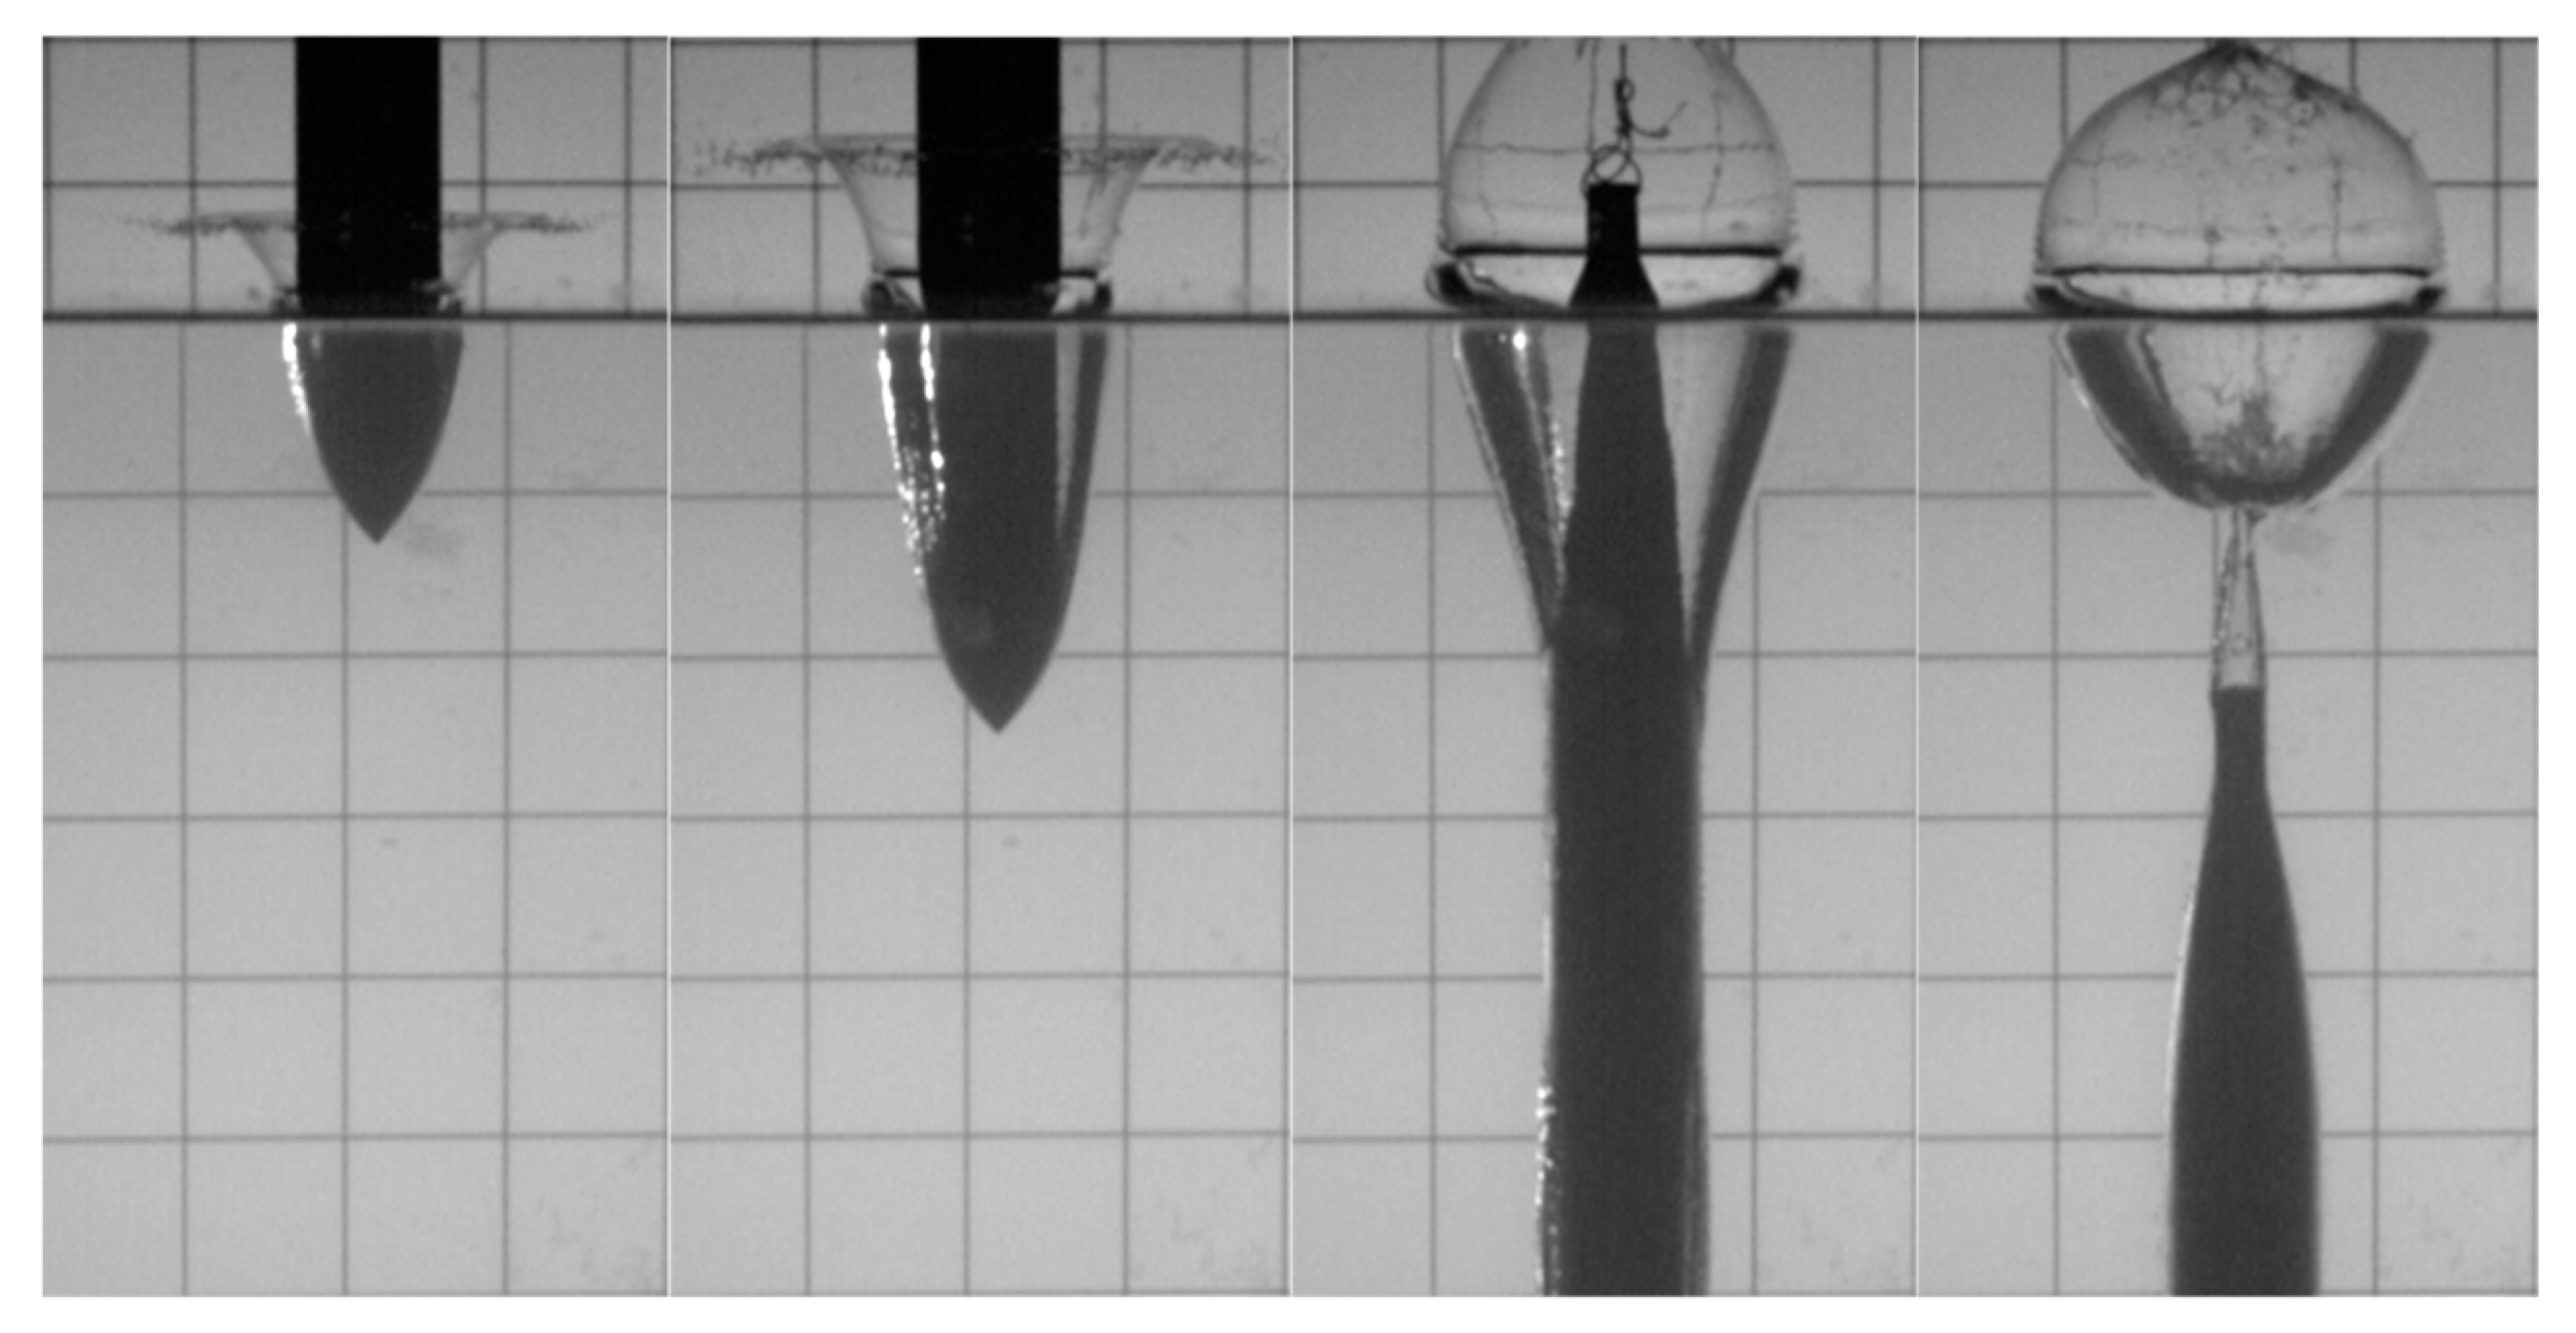
The following is an example of the process of water entry of a model with a hemispherical angle β = 57° at the speed of 12.45 m/s and an impact angle of 60°, used to show the general process of the projectile entering the water. As shown in
Figure 8a, the model water entry process has passed the shock wave stage and is in the flow formation stage. The model interacts violently with the free liquid surface, and the surrounding fluid forms a sputtering flow that sputters horizontally outward. This sputtering flow expands radially, and as the model falls, the sputtering flow diverges outward in the horizontal direction. It gradually turns upward, forming an upward spray of the liquid surface. As shown in
Figure 8b, the model head completely penetrates the free liquid surface and forms an open cavity. At this stage, during the falling process of the model, through the exchange of kinetic energy, the surrounding fluid gains the radial expansion speed, so that the opening diameter of the cavity gradually increases and expands below the free liquid surface. The water entry cavities increase rapidly in both the lateral and vertical dimensions, and at this time, the entry cavities remain open and are connected to the external atmosphere. As shown in
Figure 8c, as the model continues to fall, under the combined actions of the hydrostatic pressure and the change in the internal pressure of the cavity, the outward expansion speed of the cavity slows down and changes direction. The scale begins to shrink and the cavities close. As shown in
Figure 8d, the vacuoles are divided into upper and lower parts. The upper cavity moves to the free surface, and the volume gradually decreases. The lower cavity follows the model and continues to fall and gradually collapse.
In this paper, the free liquid surface, at rest, is defined as the position zero-point z = 0 mm, and the time when the model head makes contact with the free liquid surface is the time zero point t = 0 s.
3.1. Influences of the Surface Properties and Head Shapes on the Splash Profile
Considering that the water entry velocity has significant effects on the splash and cavity morphology of the vertical entry, the water entry velocity and surface properties affect the model splash and cavity in a coupled manner. In this paper, two release heights were proposed for the low-speed vertical experiment, which were 20 cm and 80 cm, respectively. For each height, the models of the five types of hydrophilic heads and five types of hydrophobic heads were subjected to water entry experiments. The corresponding water entry motion parameters are shown in
Table 2.
In the table, is the water entry velocity; is the dynamic viscosity of the water; is the surface tension coefficient of the water; is the acceleration of gravity; is the maximum cross-sectional diameter of the model; and is the density of the water.
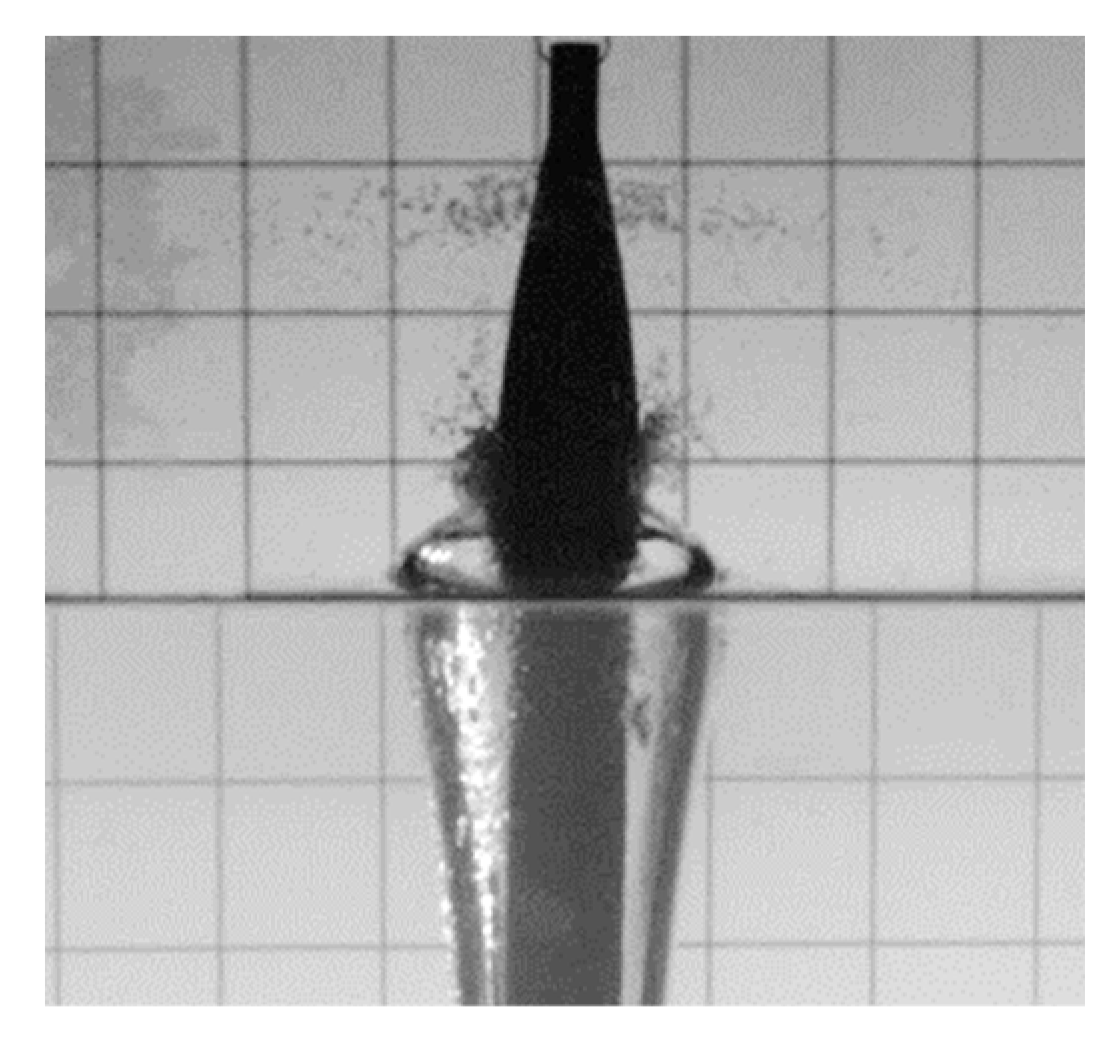
Through experimental observation, it was found that no clear splashing of the hydrophilic model could be identified when it entered the water, especially when the water entry speed was low. When the water entry height was 20 cm, during the model’s entry into the water, only a small splash along the surface of the sailing body occurred when the model first entered the water, and a small mass of water splashed after the entire model entered the water.
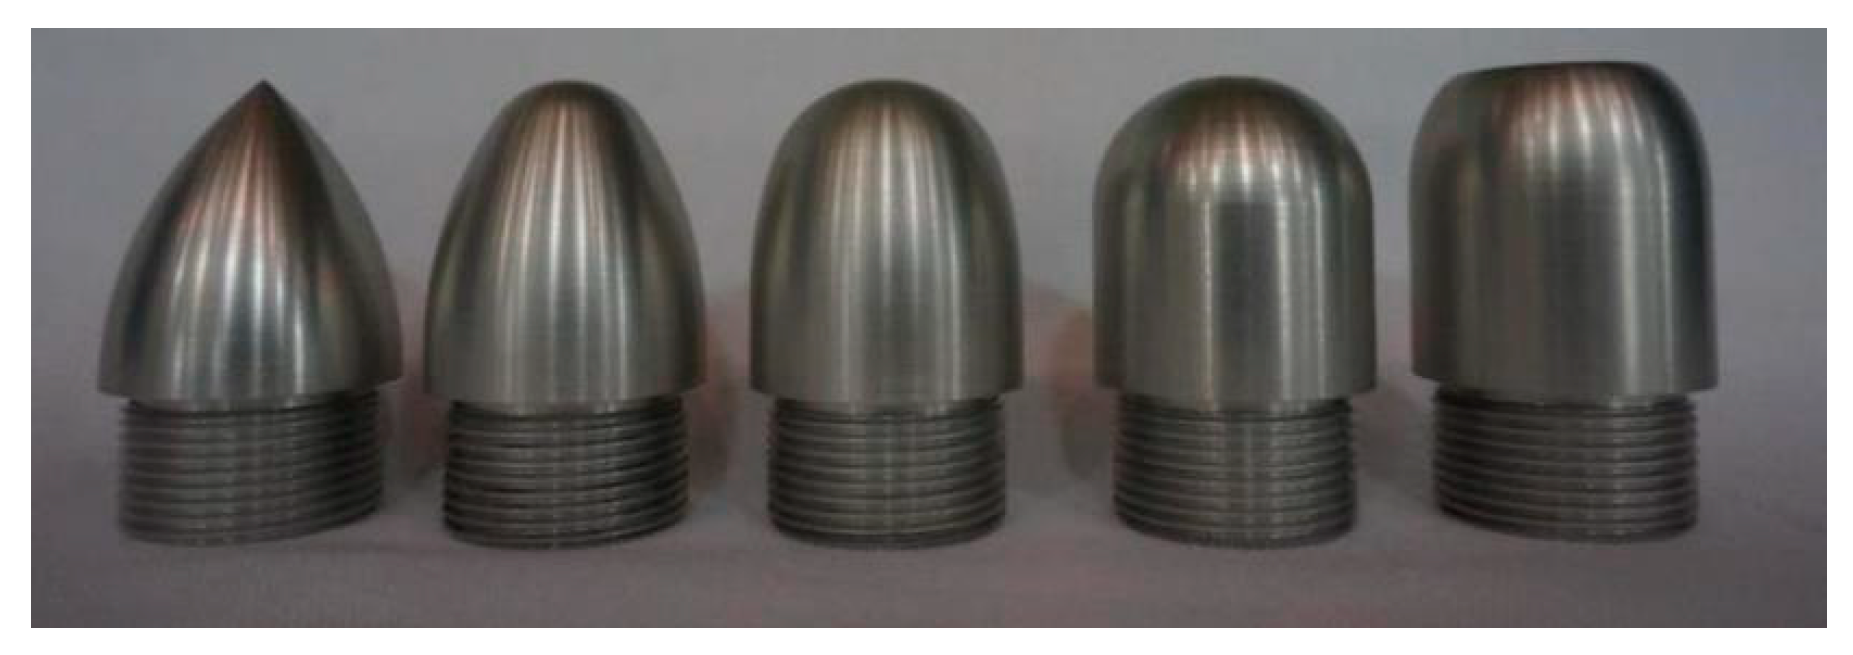
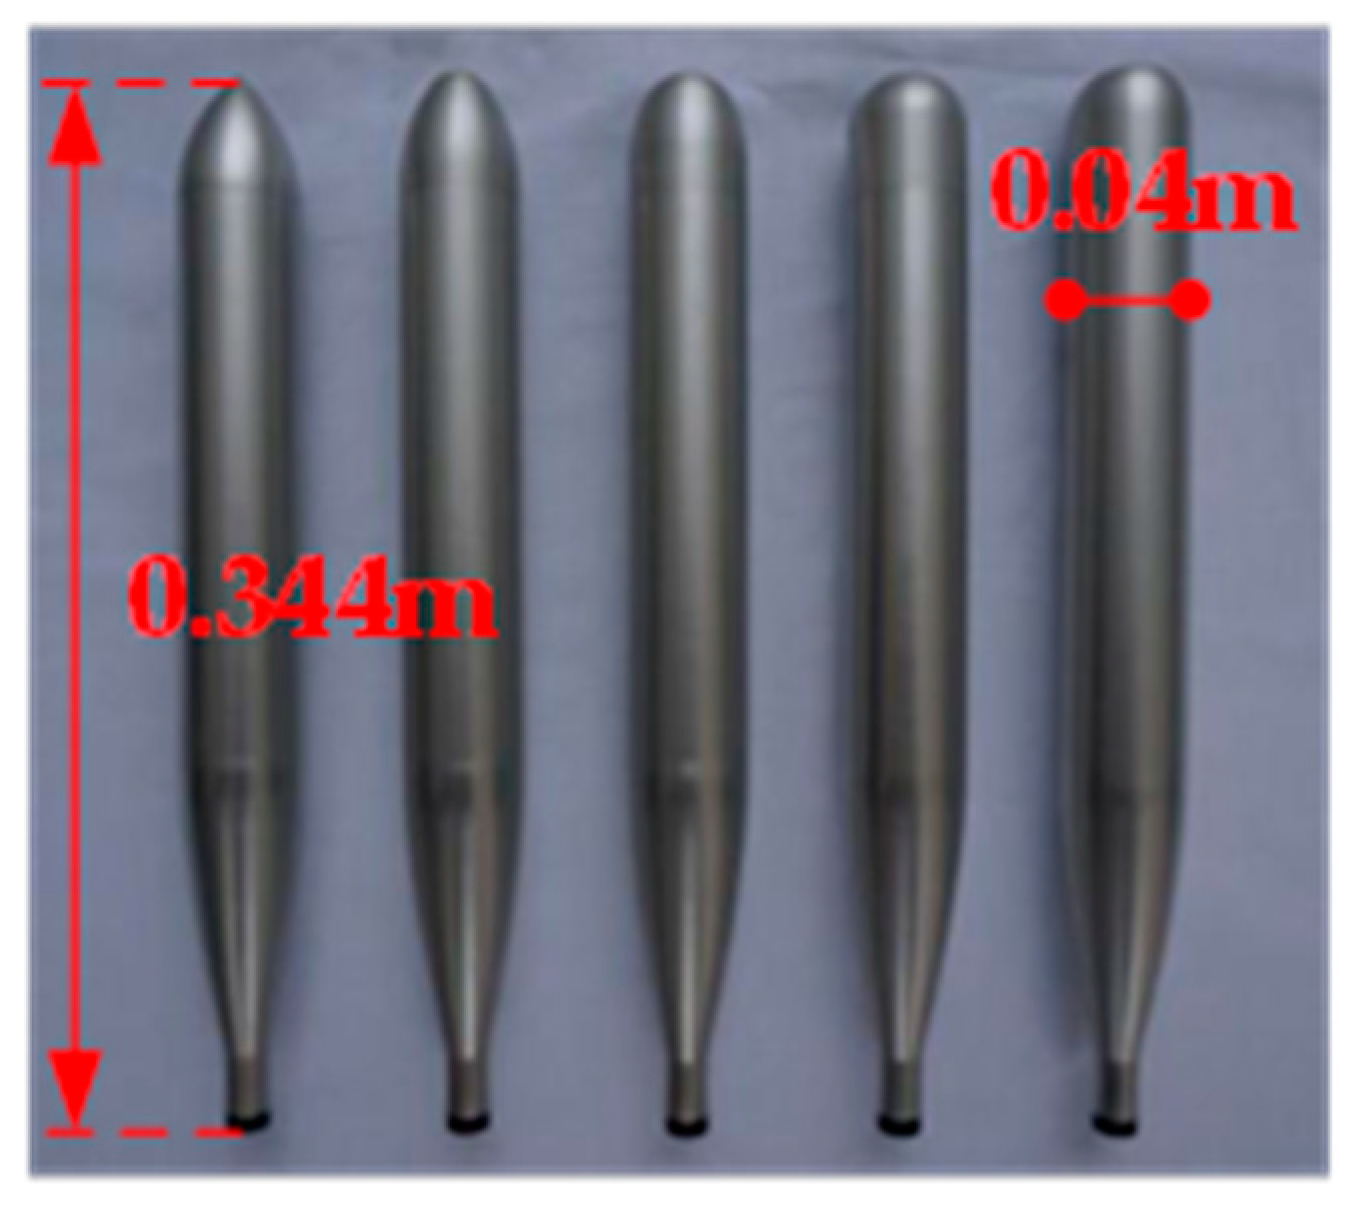
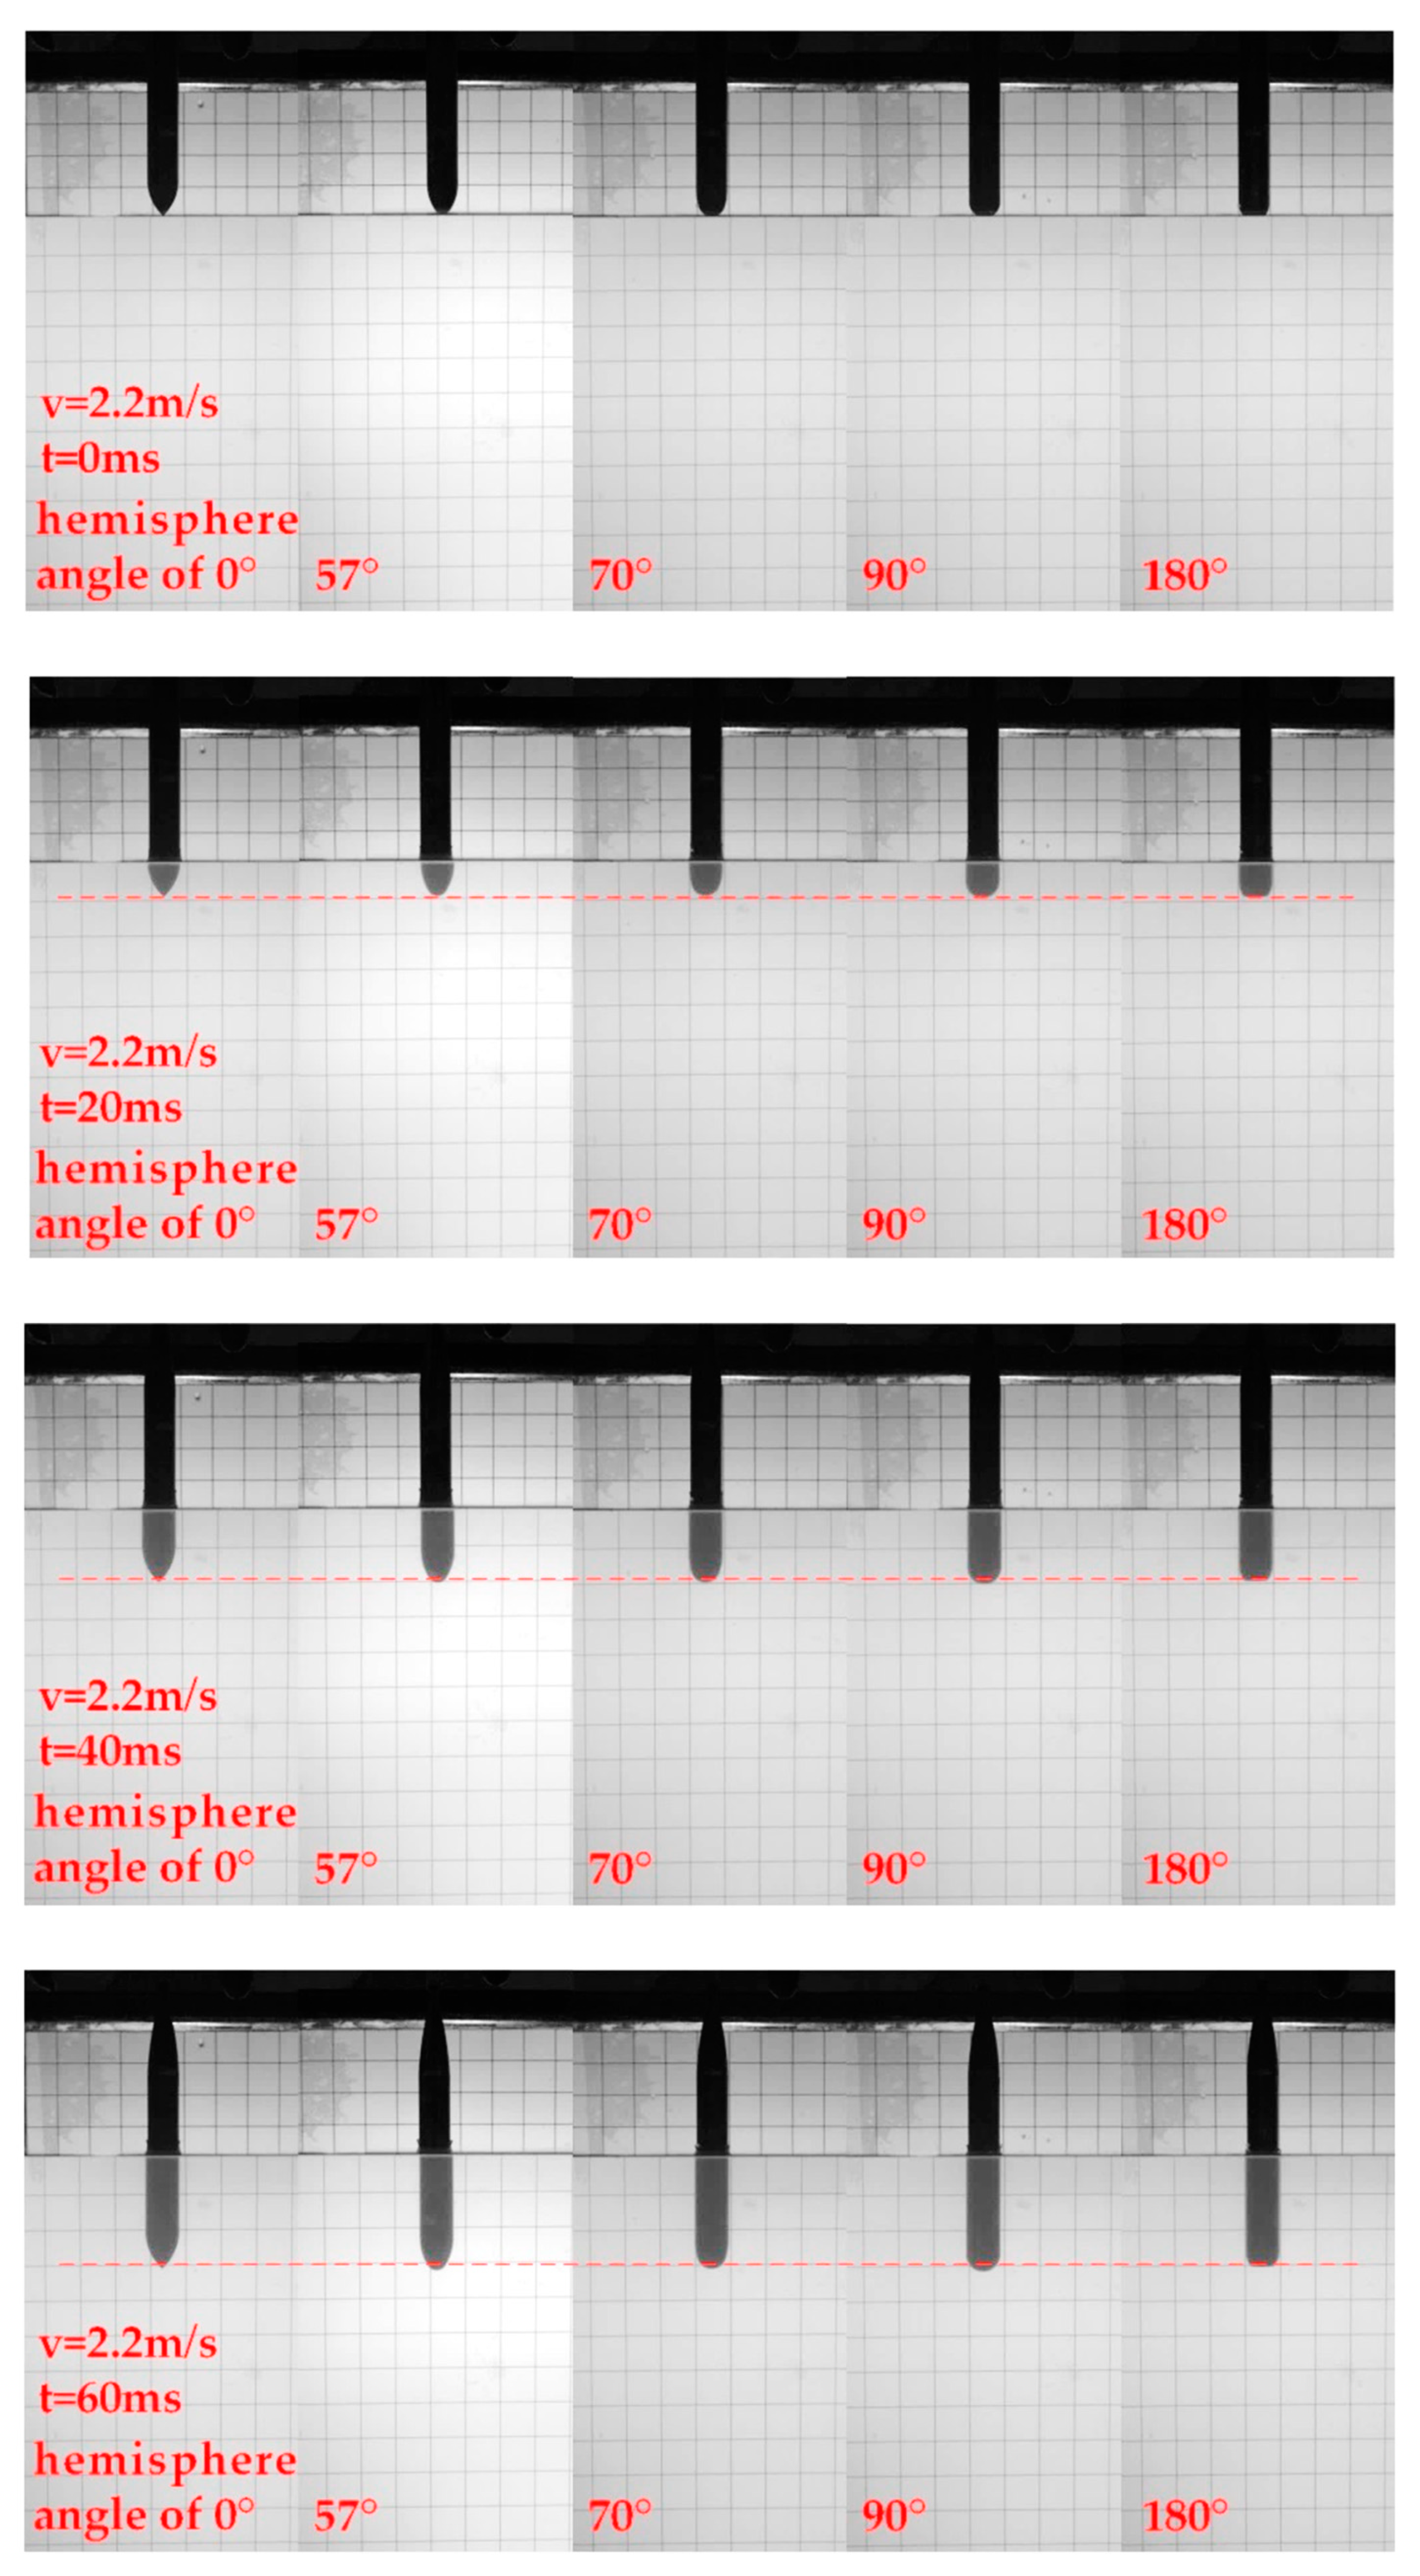
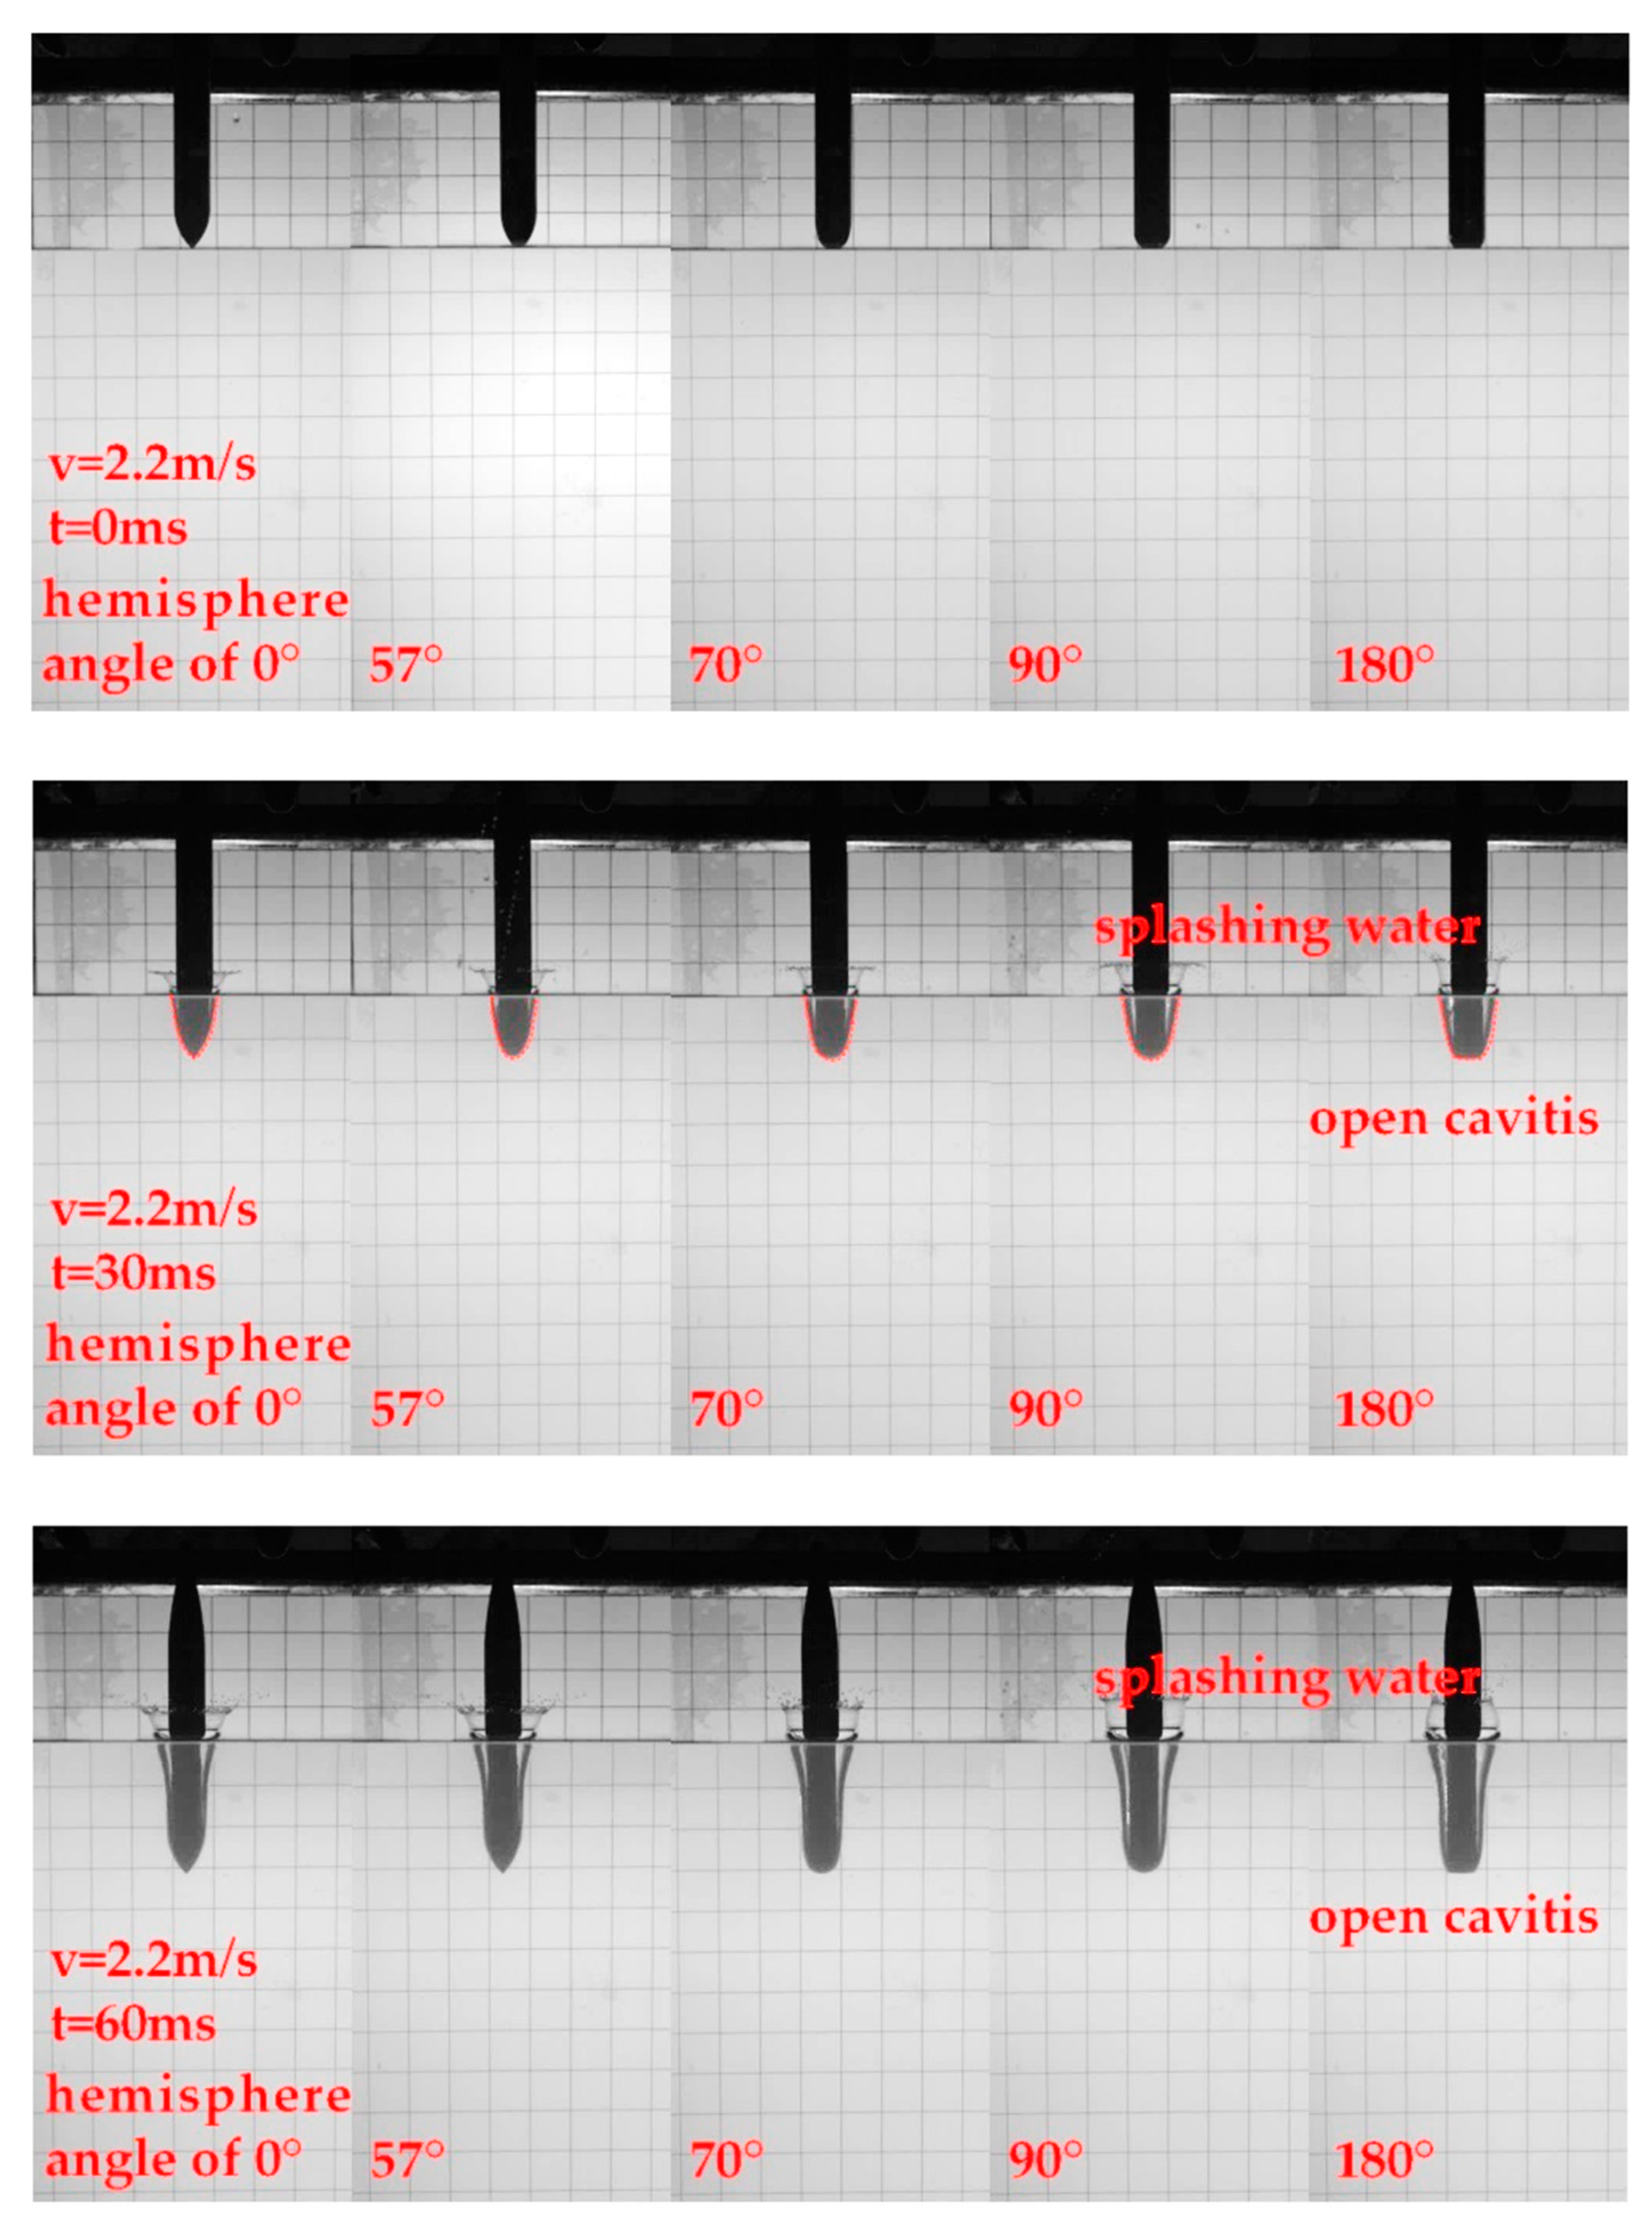
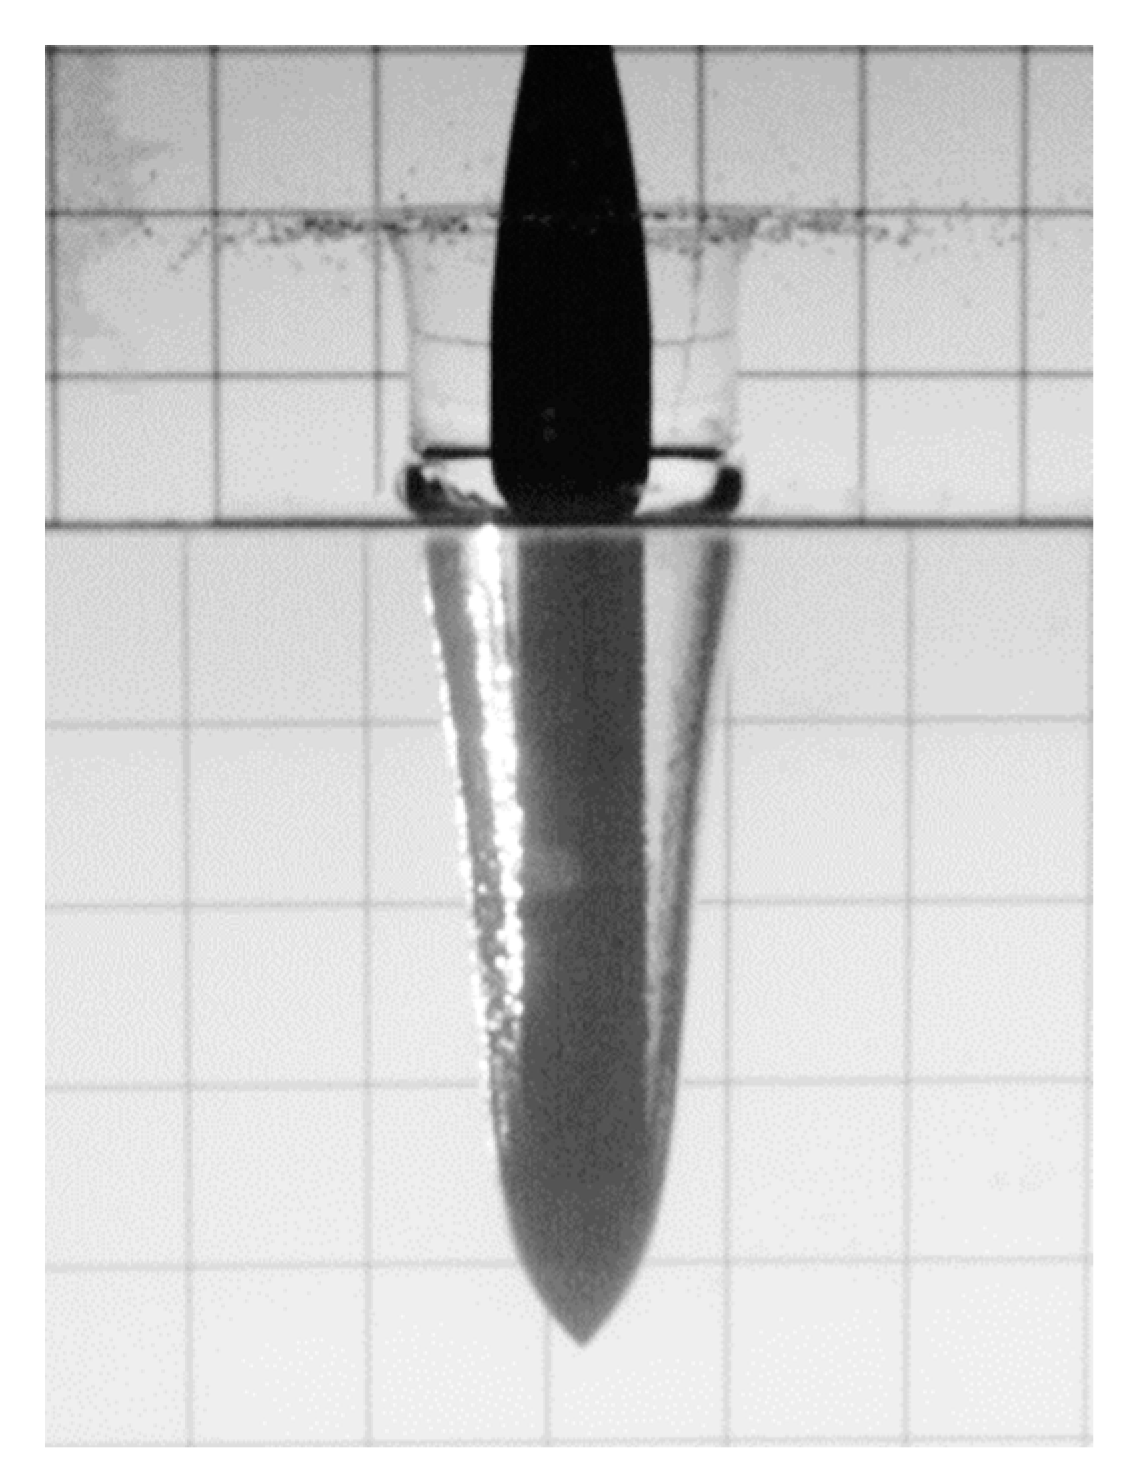
Figure 10 is an image of the experimental process of the model of the hydrophilic surface entering the water vertically. The hemispherical angles of the model are 0°, 57°, 70°, 90° and 180° from left to right, and the water entry speed is 2.2 m/s. During the water-entry process, a jet slowly rises along the model, and the water at the top of it bends slightly outward. After the jet reaches the highest point, it begins to descend in the horizontal direction. As the model continues to fall, a small swell of water will appear on the water surface, as shown in
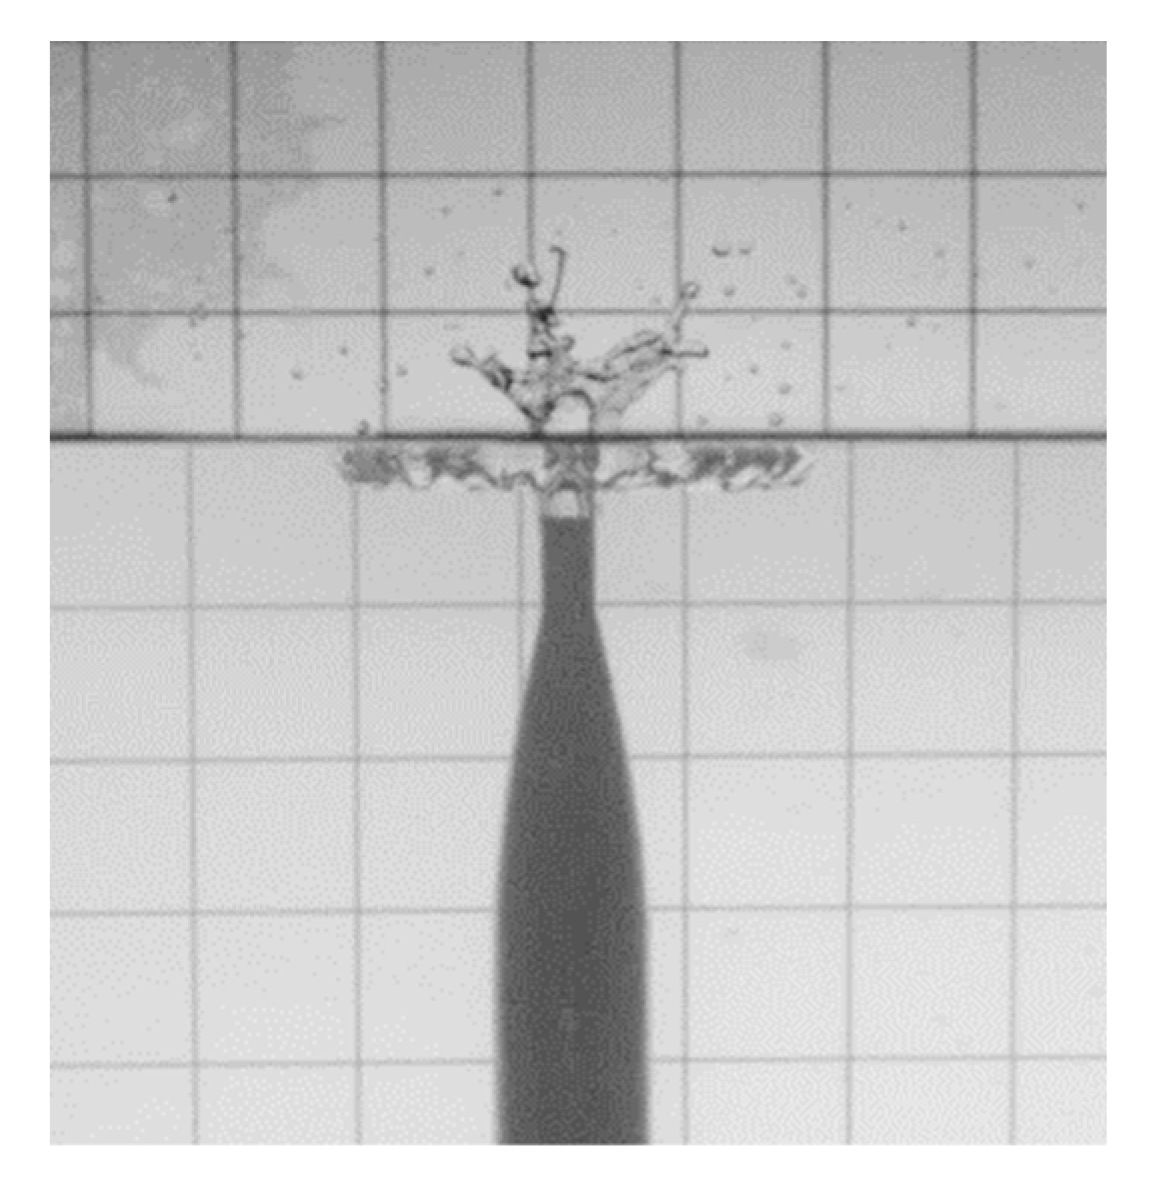
Figure 11, until the model is completely submerged.
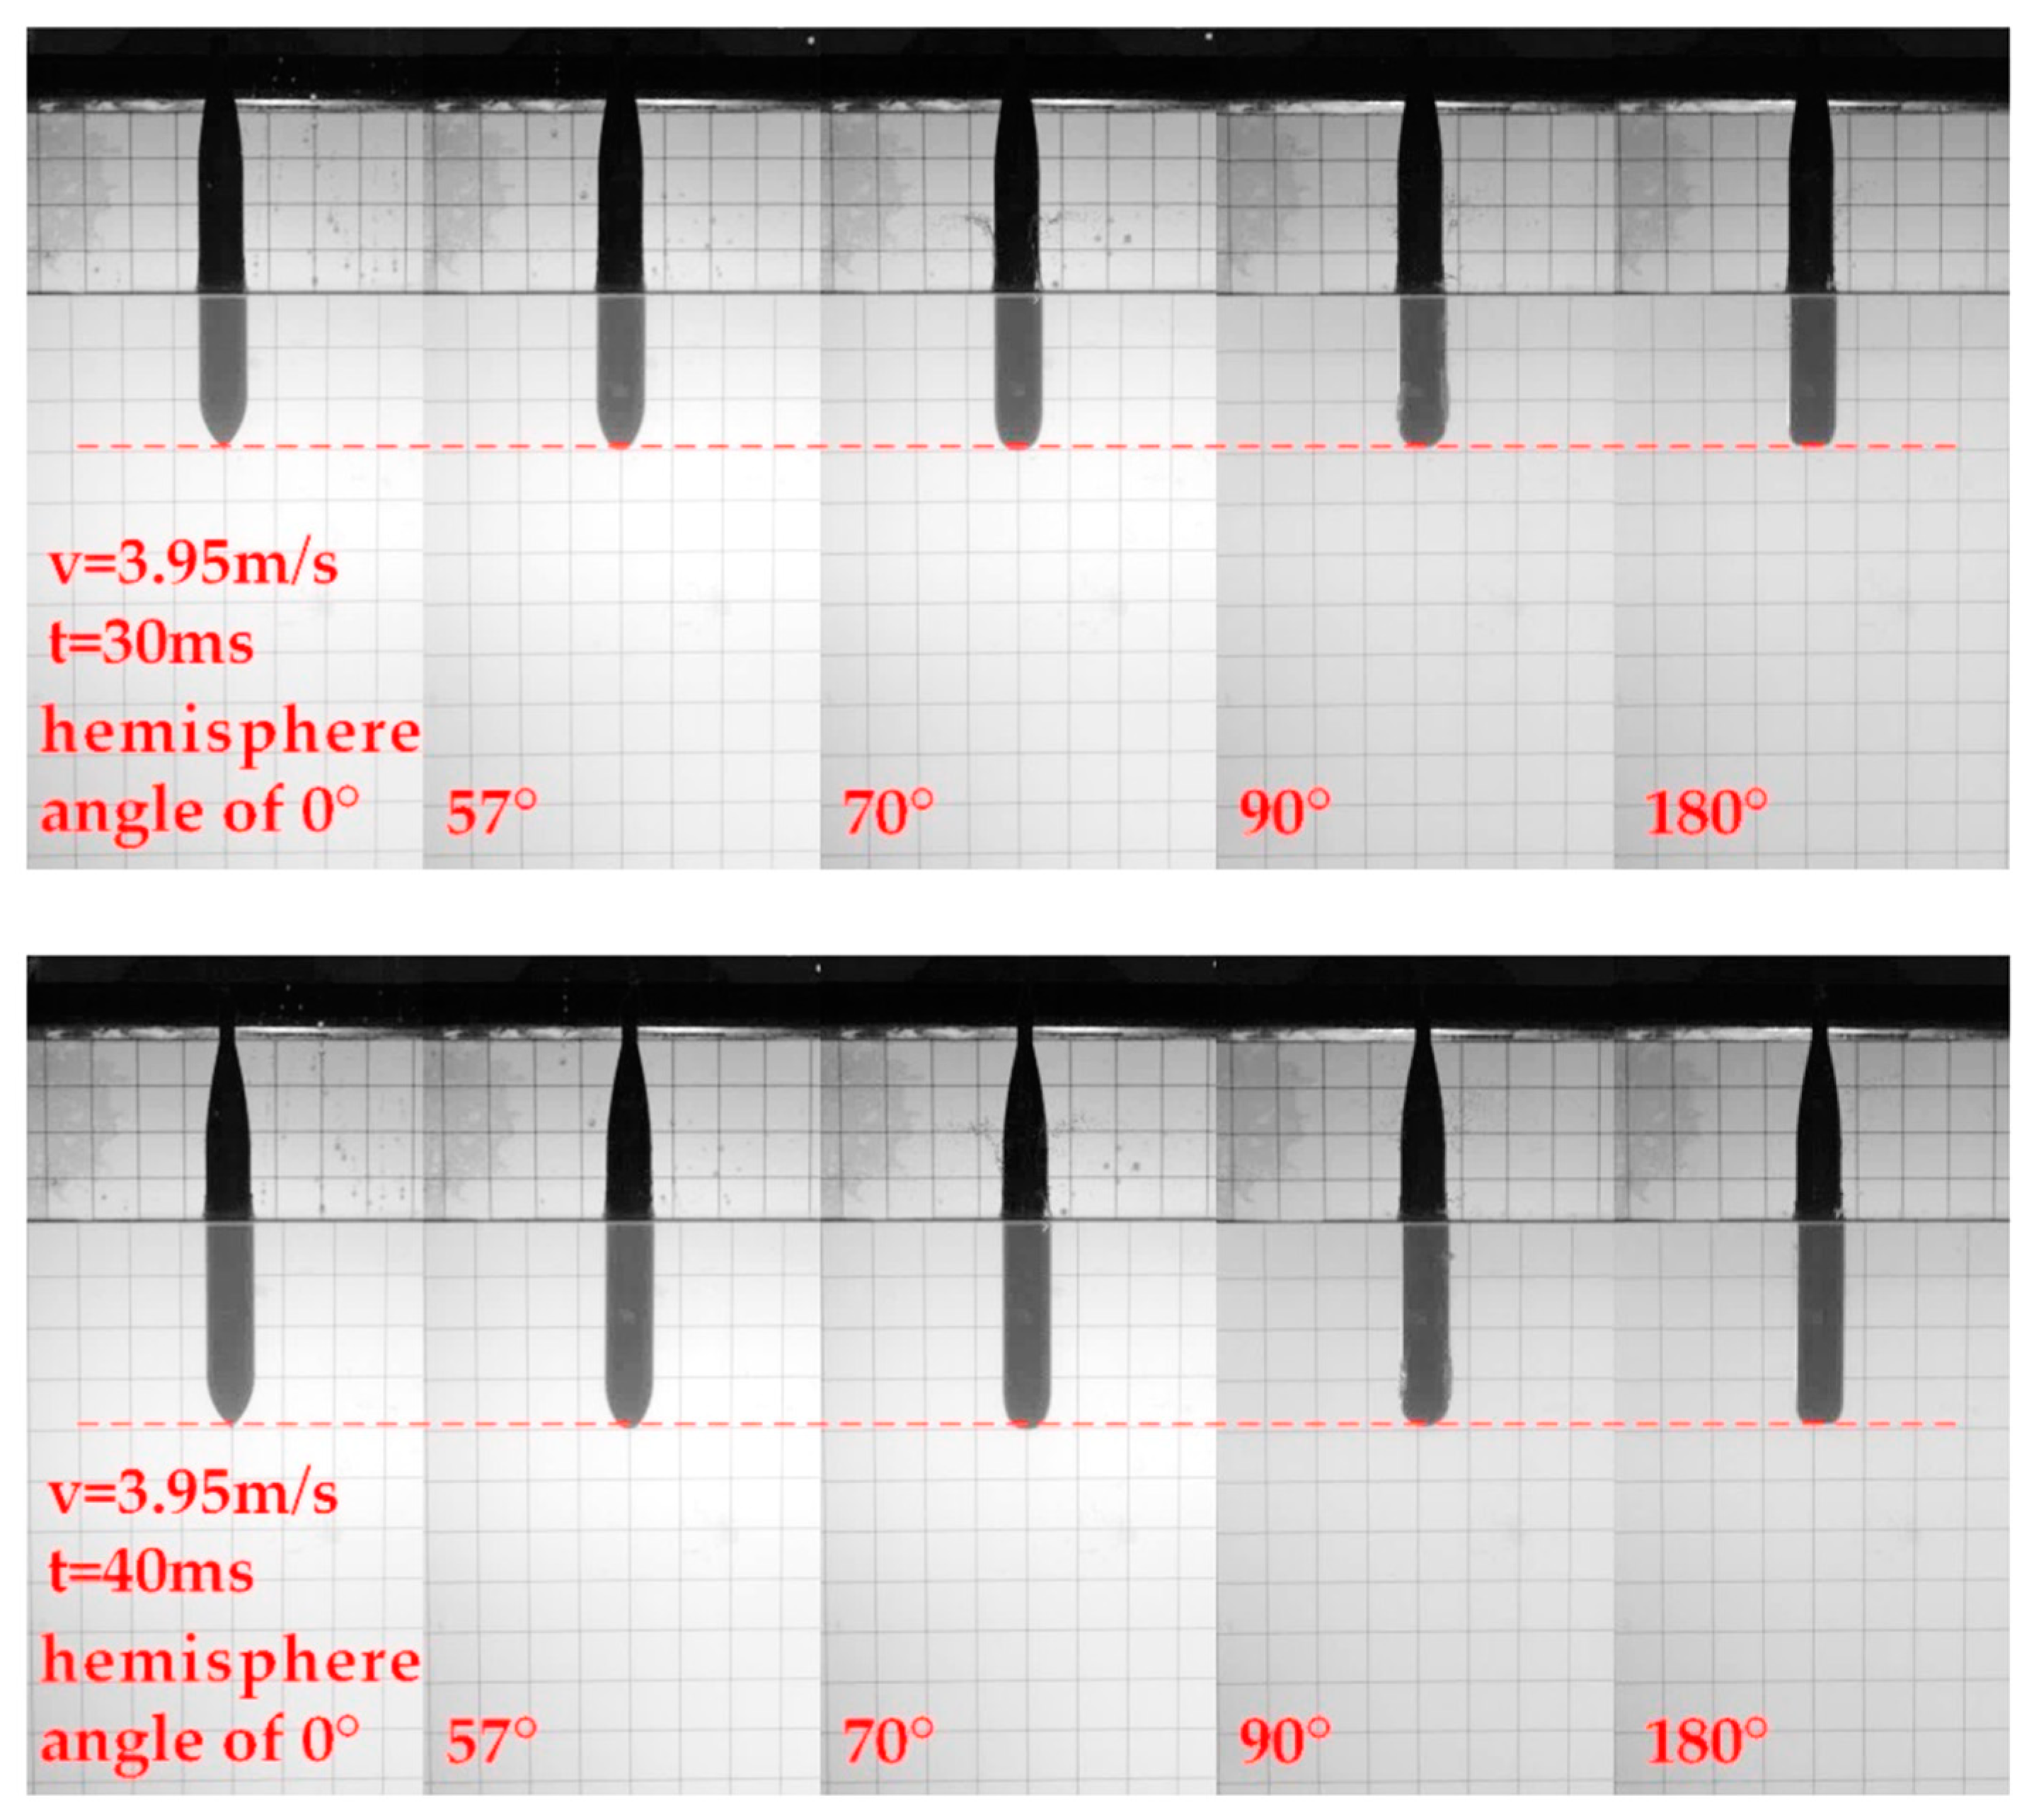
Figure 12 is a chart comparing the splashing of the water for hydrophilic models with different hemispherical angles at a water entry height of 80 cm. Compared with the hydrophilic model with an initial velocity of 2.2 m/s, when entering the water at 3.95 m/s, the top of the splashing water expands outwardly to a greater extent. When the hemispherical angle is 0° and 57°, the splashed droplets in the water are relatively thin and gradually disperse into water mist. After 10 ms, the splashed droplets are thin to the extent that they are almost non-existent. In the early stage, it can be observed that there is a conical water curtain around the model, and then the splash becomes thinner as it expands upward and outward and finally disappears into the air. After the middle of the model enters the water, it splashes to create a jet, just as when the model first entered the water at a speed of 2.2 m/s, as shown in
Figure 13.
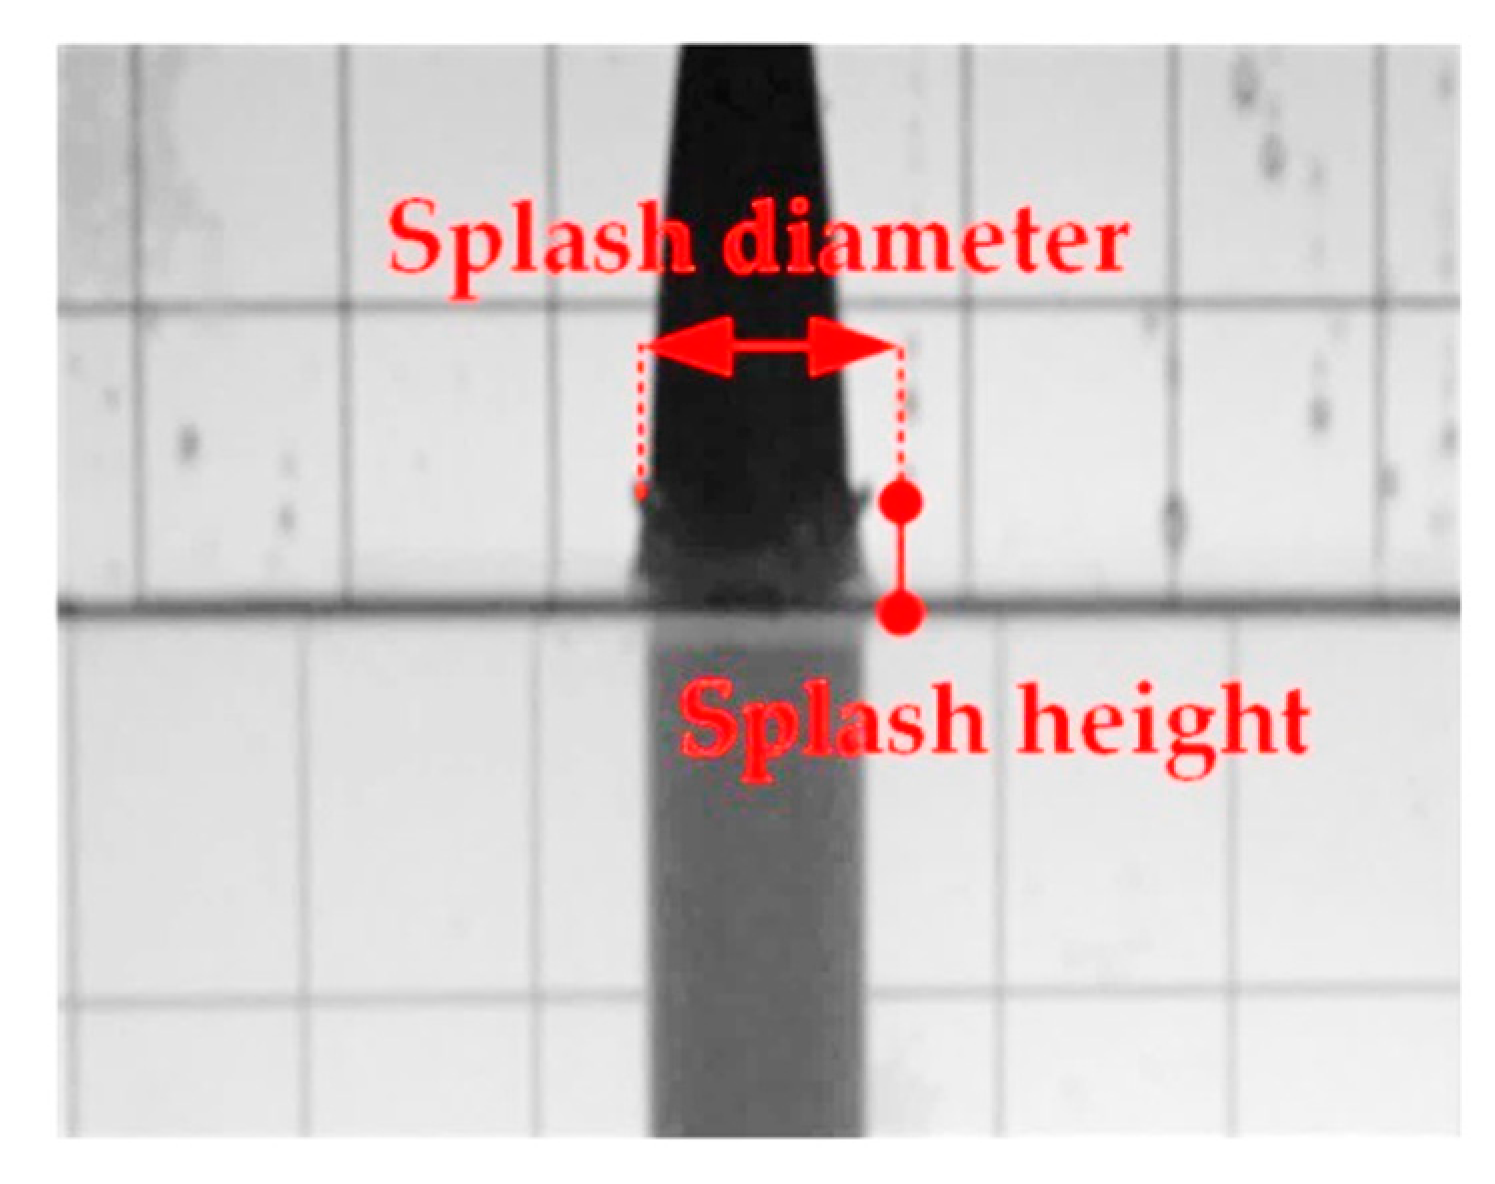
Since the splash of the hydrophilic model cannot be observed clearly, the position of its highest point is measured here as the splash height, and the farthest horizontal distance from the top of the splash is the splash diameter. Among these parameters, at 3.95 m/s, since the splash spreads out, the highest point at which the splash does not spread out was selected in order to measure the data. The data obtained are summarized in
Table 3.
At 2.2 m/s, the maximum height of the splash is basically about 20 mm and it takes longer to reach the maximum height when the head shape is 0° and 57°, indicating that the smoother head shape is more prone to splashing. At 3.95 m/s, due to the high speed, the maximum splash height of the latter three head types is significantly greater than that of the first two. Thus, the time taken is not significantly less than that of the first two, or even longer. However, from the perspective of the degree and size of the splash, the latter three head types are more likely to generate splashes, and of the three head types, the 180° head type has a weaker ability to generate splashes.
As shown in
Figure 14, it is the experimental image of the model of the hydrophobic surface entering the water vertically. The hemispherical angles of the model are 0°, 57°, 70°, 90° and 180° from left to right, and the water entry speed is 2.2 m/s in each case. When t = 30 ms, the water splashes and the five working conditions are all conical. That is, the diameter of the circle at the top of the splash is the largest, and the diameter that is closer to the horizontal plane is the smallest. Then, in the case of 0° and 57° hemispherical angles, both the upper and lower circumferences of the splashes expand, so that the splashes maintain a conical state. For the other three cases, the splash shape becomes cylindrical (the same size at the top and bottom) over time. Among them, in the case of 90°, after the splash becomes cylindrical, it shows an inconspicuous arc shape (large in the middle and small at both ends). In the case of 180°, the shape of the arc is evident, and the shape of the cone appears after the arc shape (large at the bottom and small at the top). In all five cases, the splash quickly fell to the base level after rising to the highest point. After 120 ms, there is a more obvious splash (as shown in
Figure 15) due to the smaller diameter of the tail end of the model.
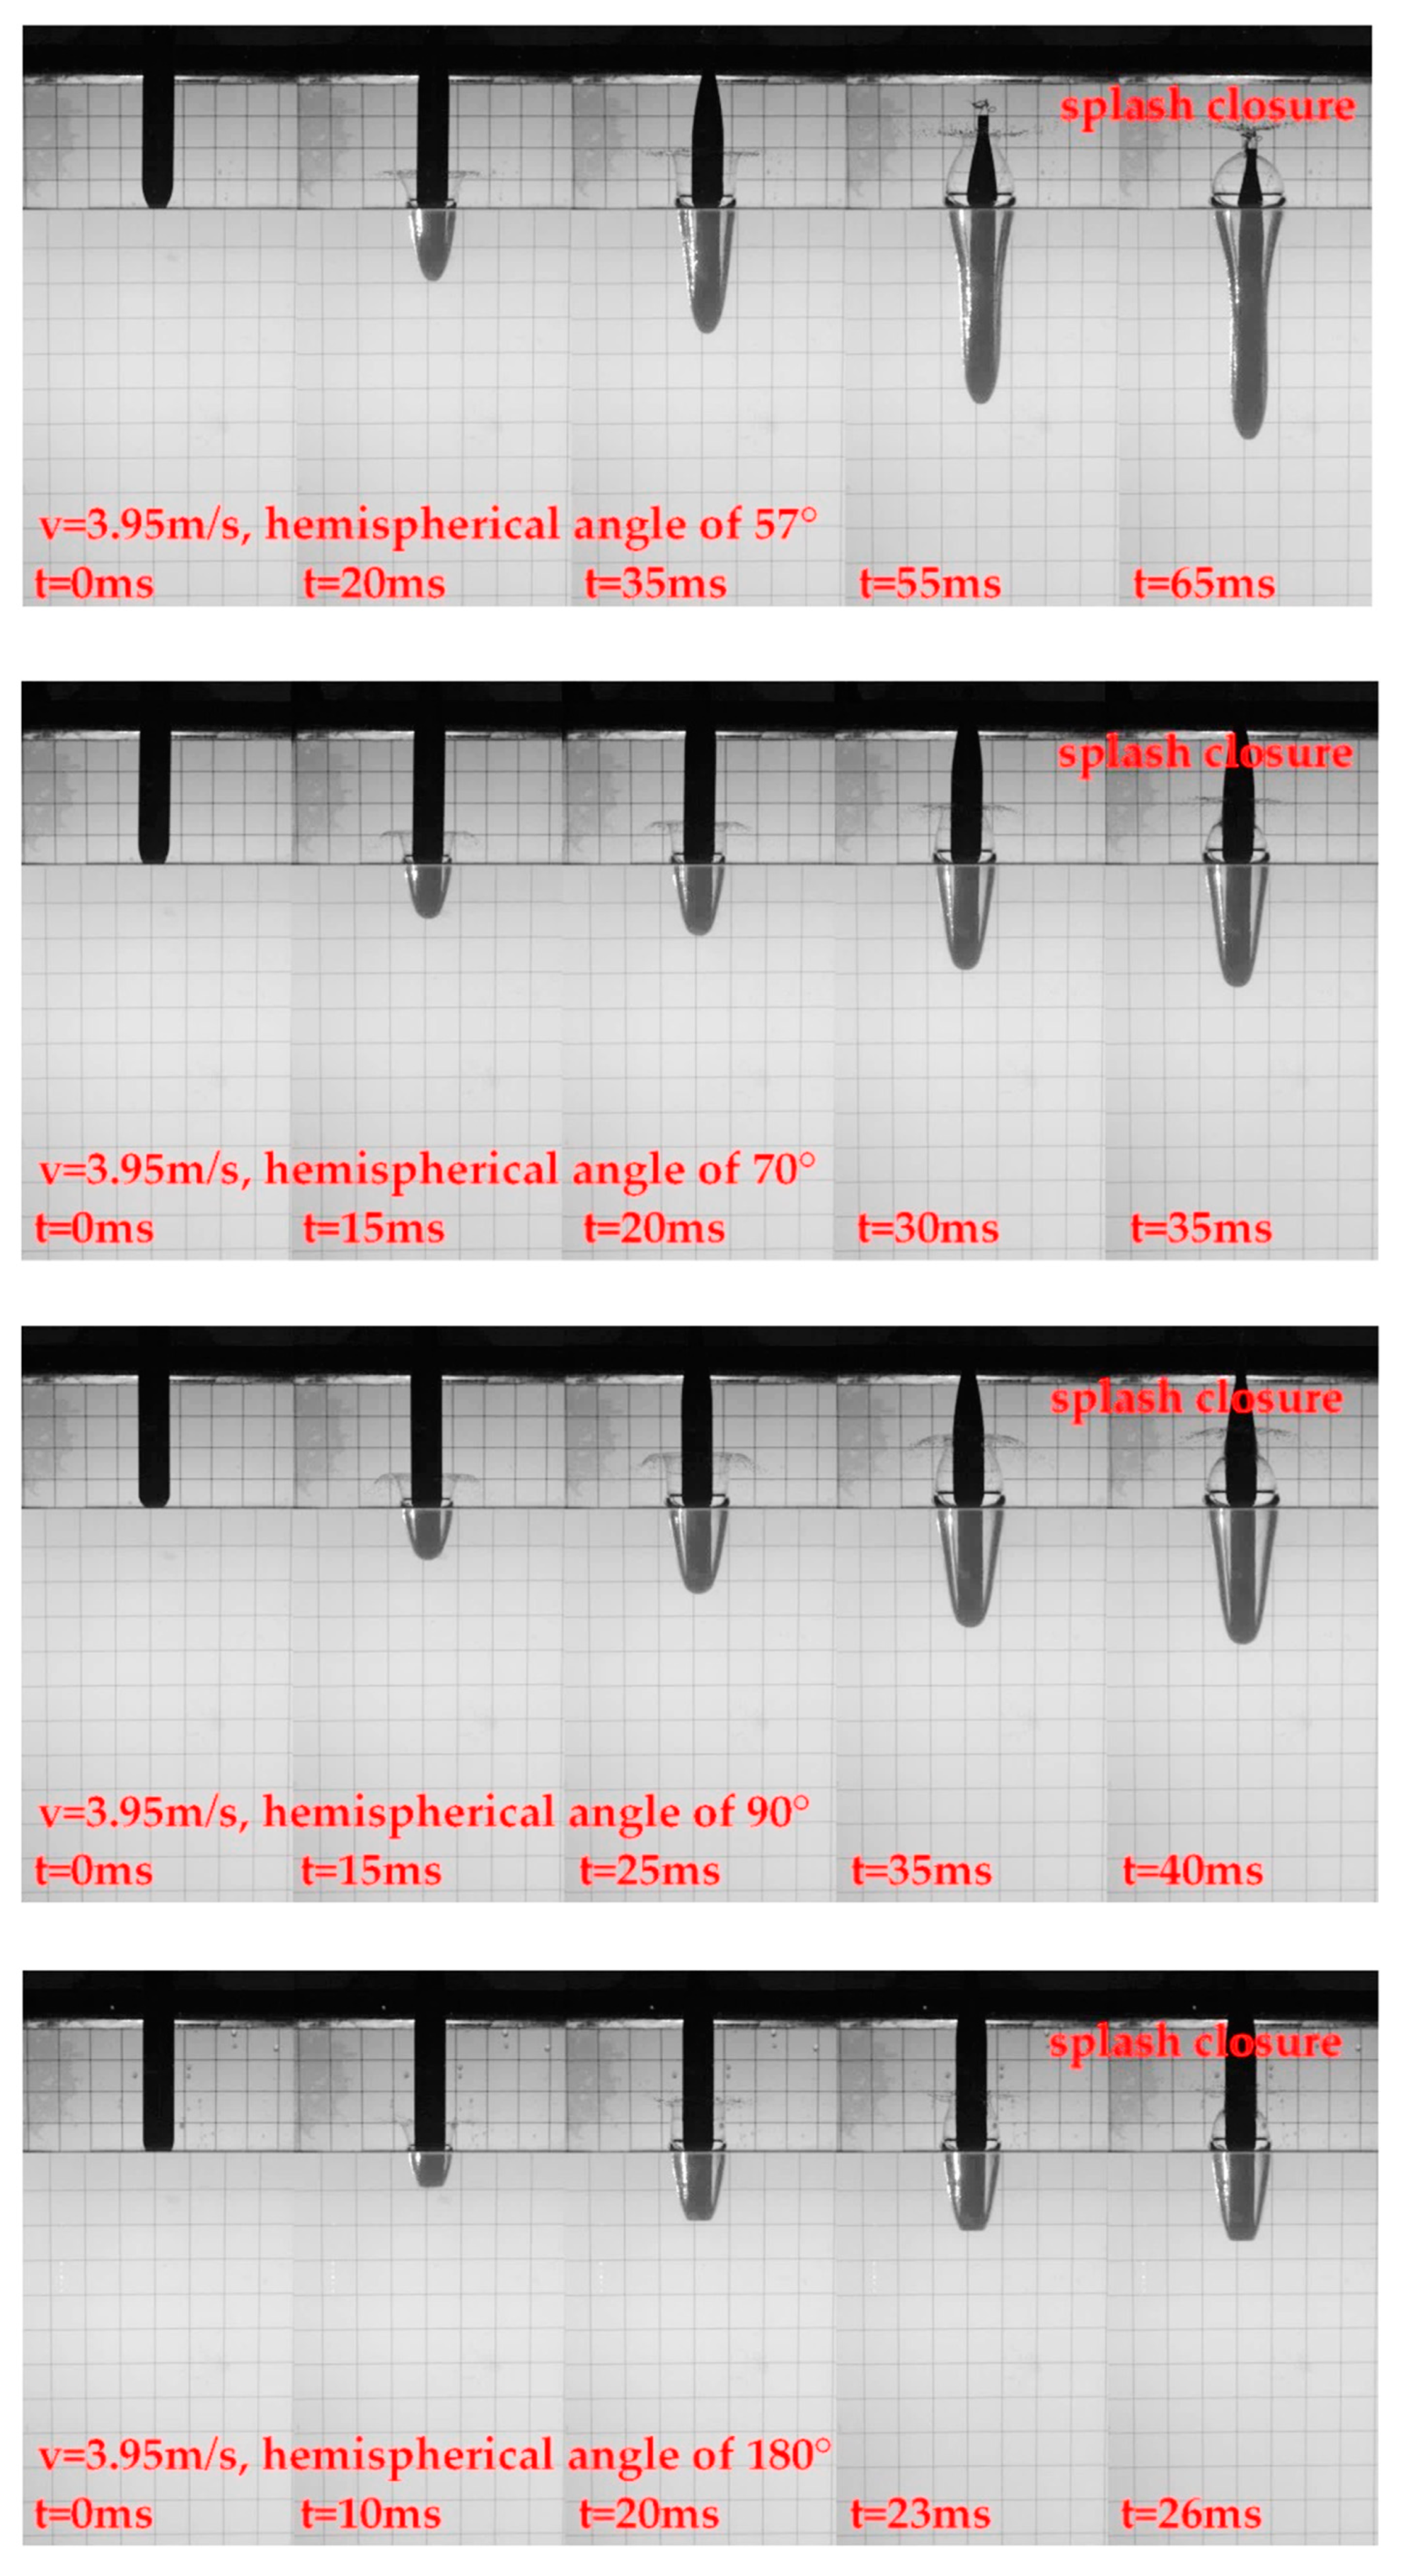
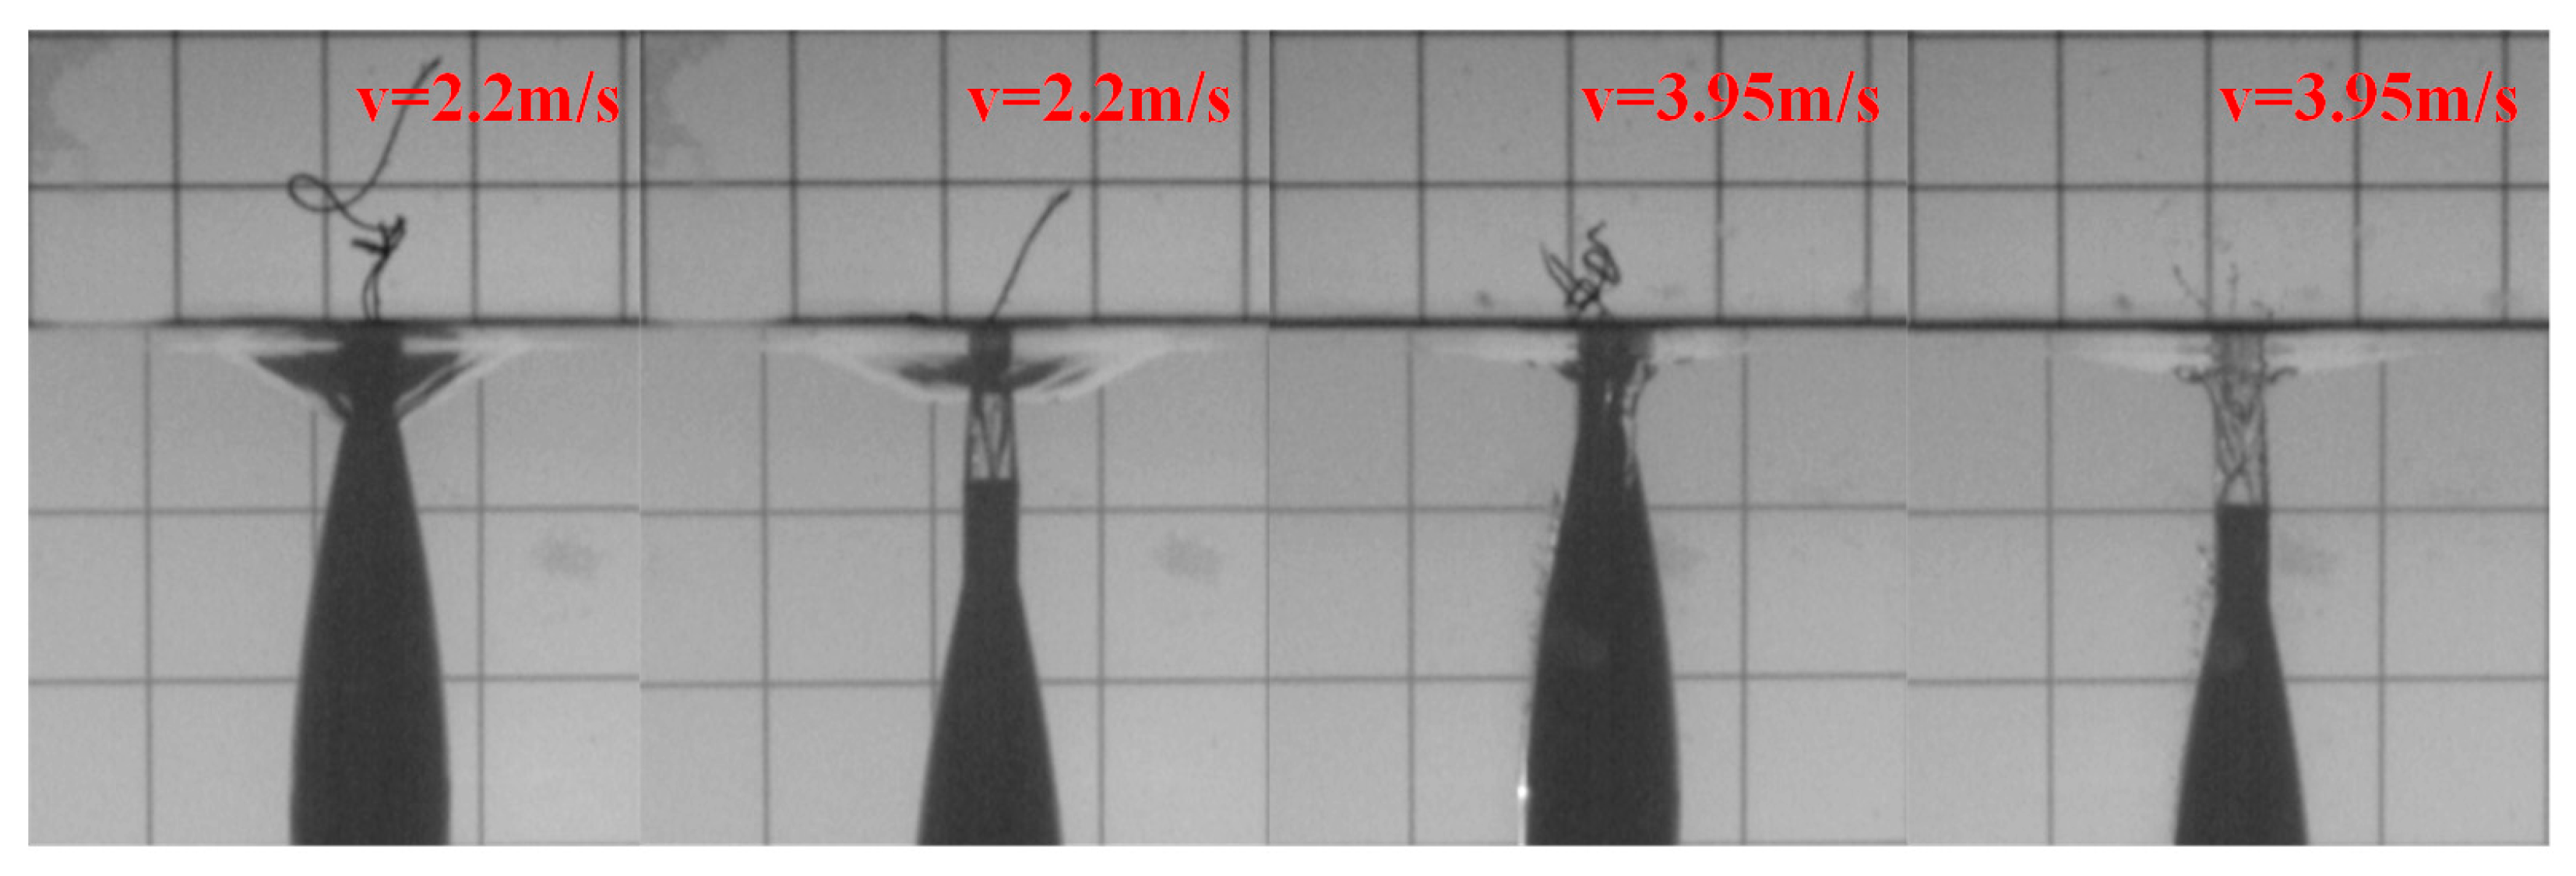
Figure 16 shows the experimental process of the hydrophobic surface model entering the water at an initial velocity of 3.95 m/s. Since the splash occurrence times of the five head types are quite different, the splash occurrence processes of each head type are listed separately. Under the five head types, the splash is initially conical, and then the shape of the splash becomes cylindrical. Then, the top of the splash necks down slightly and reaches the highest point during necking. When the diameter is 0 or 40 mm, the droplets above it are broken and scattered, and the lower part is hemispherical. With the increase in the hemispherical angle, the development time of the splash basically decreases. When the hemispherical angle is 0° and 57°, after the splash closes above the model, it maintains a hemispherical shape and gradually falls. The cavity at the tail of the model rises after falling off, and this impact means that the height of the splash is basically unchanged. Afterwards, a secondary splash that penetrates the cavity and the splash rushes upward from the bottom of the tail cavity. When the hemispherical angle is 0°, only the semi-spherical splash appears to be penetrated, and the semi-spherical splash continues to fall to the water surface (as shown in
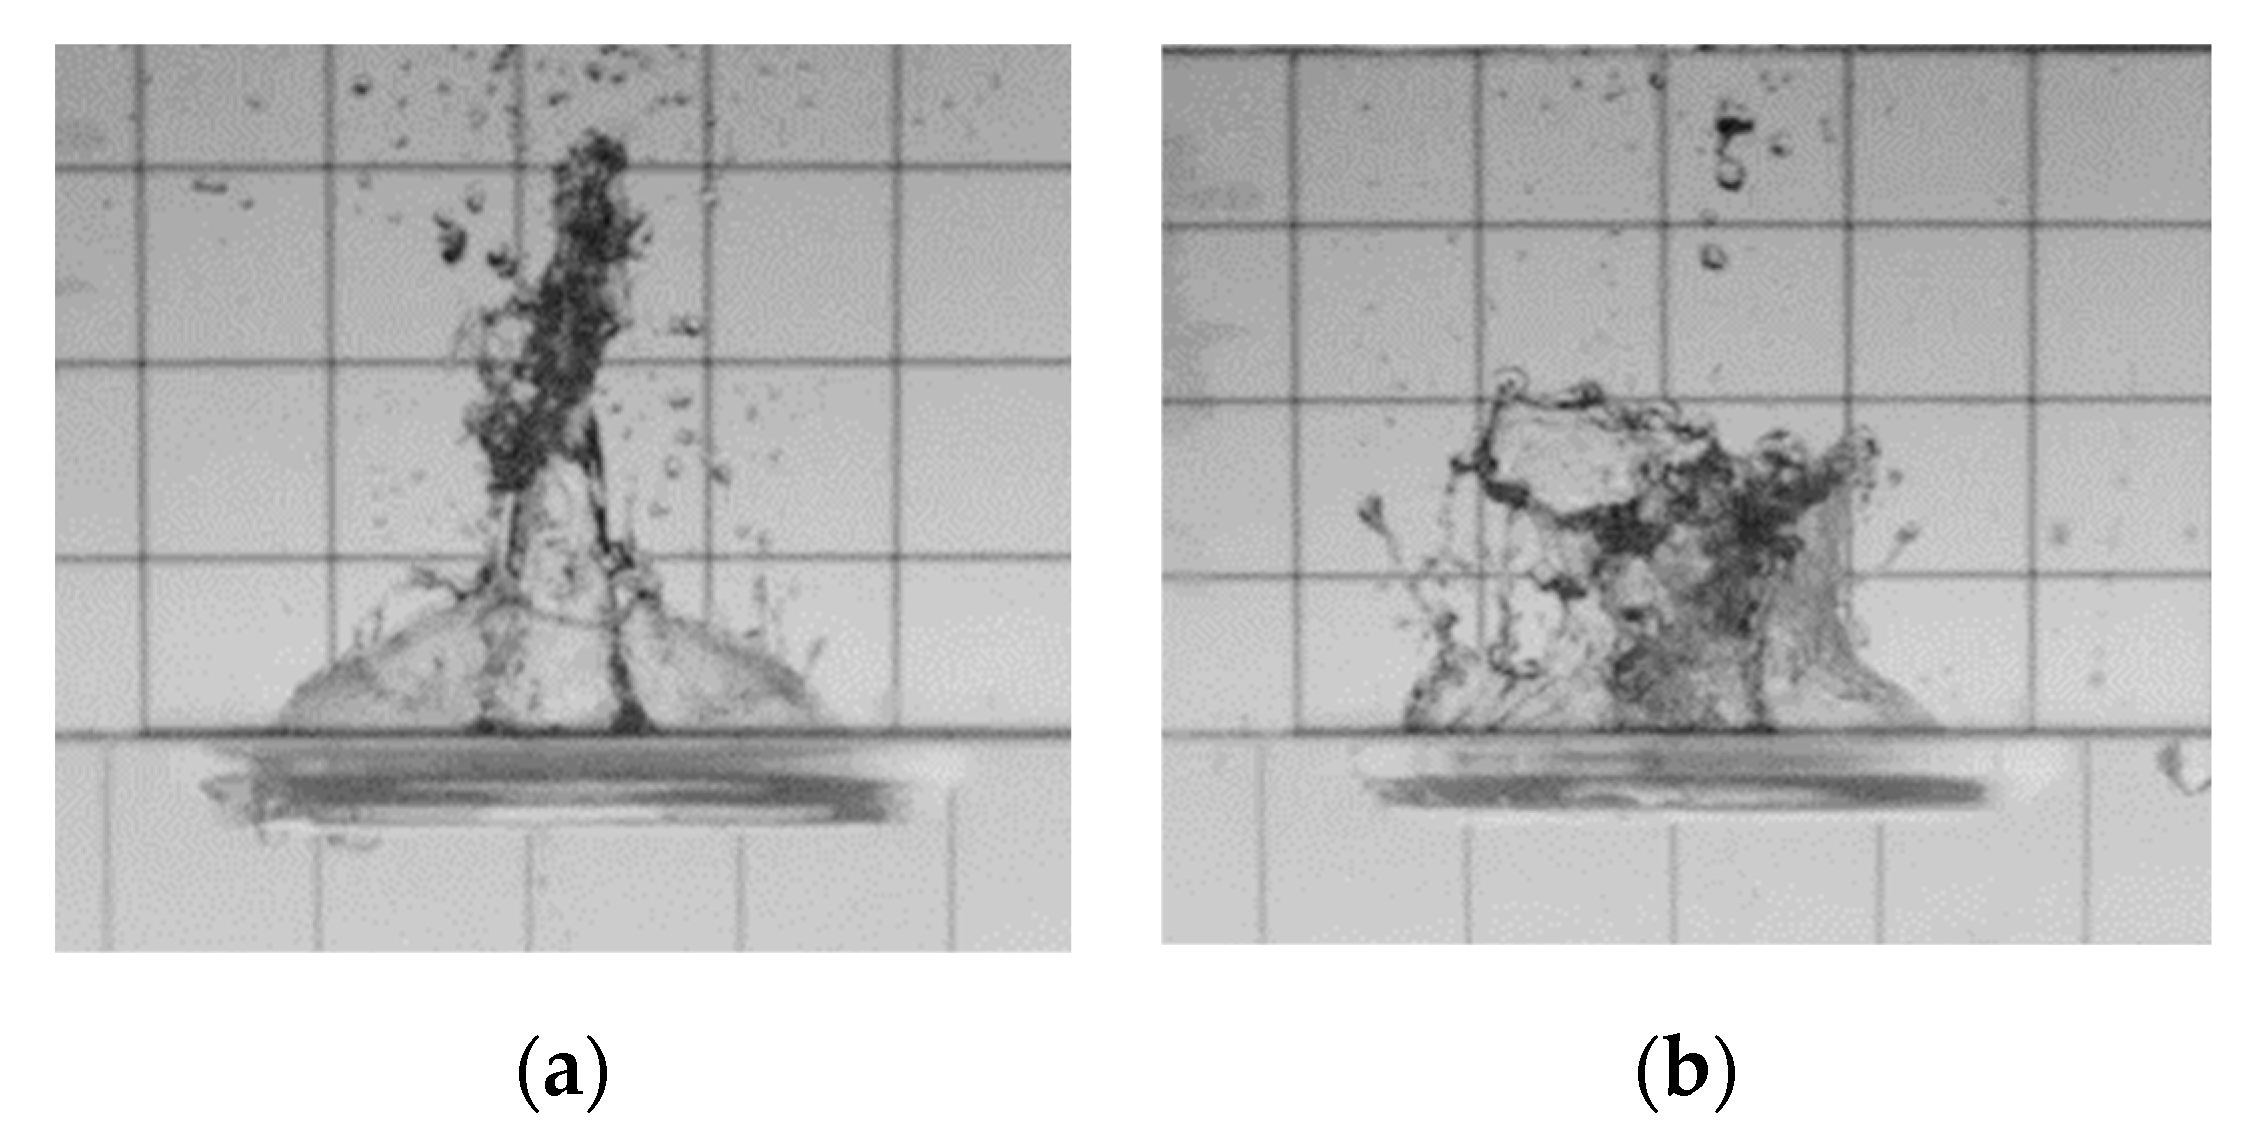
Figure 17a). In the case of a hemispherical angle of 57°, the splashes break apart under this impact (as shown in
Figure 17b). In the other three hemispherical angles, the development time of the splash is short, and the model is not under the splash when the splash necks, so that the top of the splash fits the model. Then, it falls with the splash, and many fine droplets splash out at the point of connection between the splash and the model (as shown in
Figure 18). When the model drops below the splash, the splash becomes a complete hemisphere and continues to fall. A slight difference from the first two hemispherical angles is observed, as the rise of the tail cavity causes the hemispherical splash to rise slightly, and then the splash is broken by the impact.
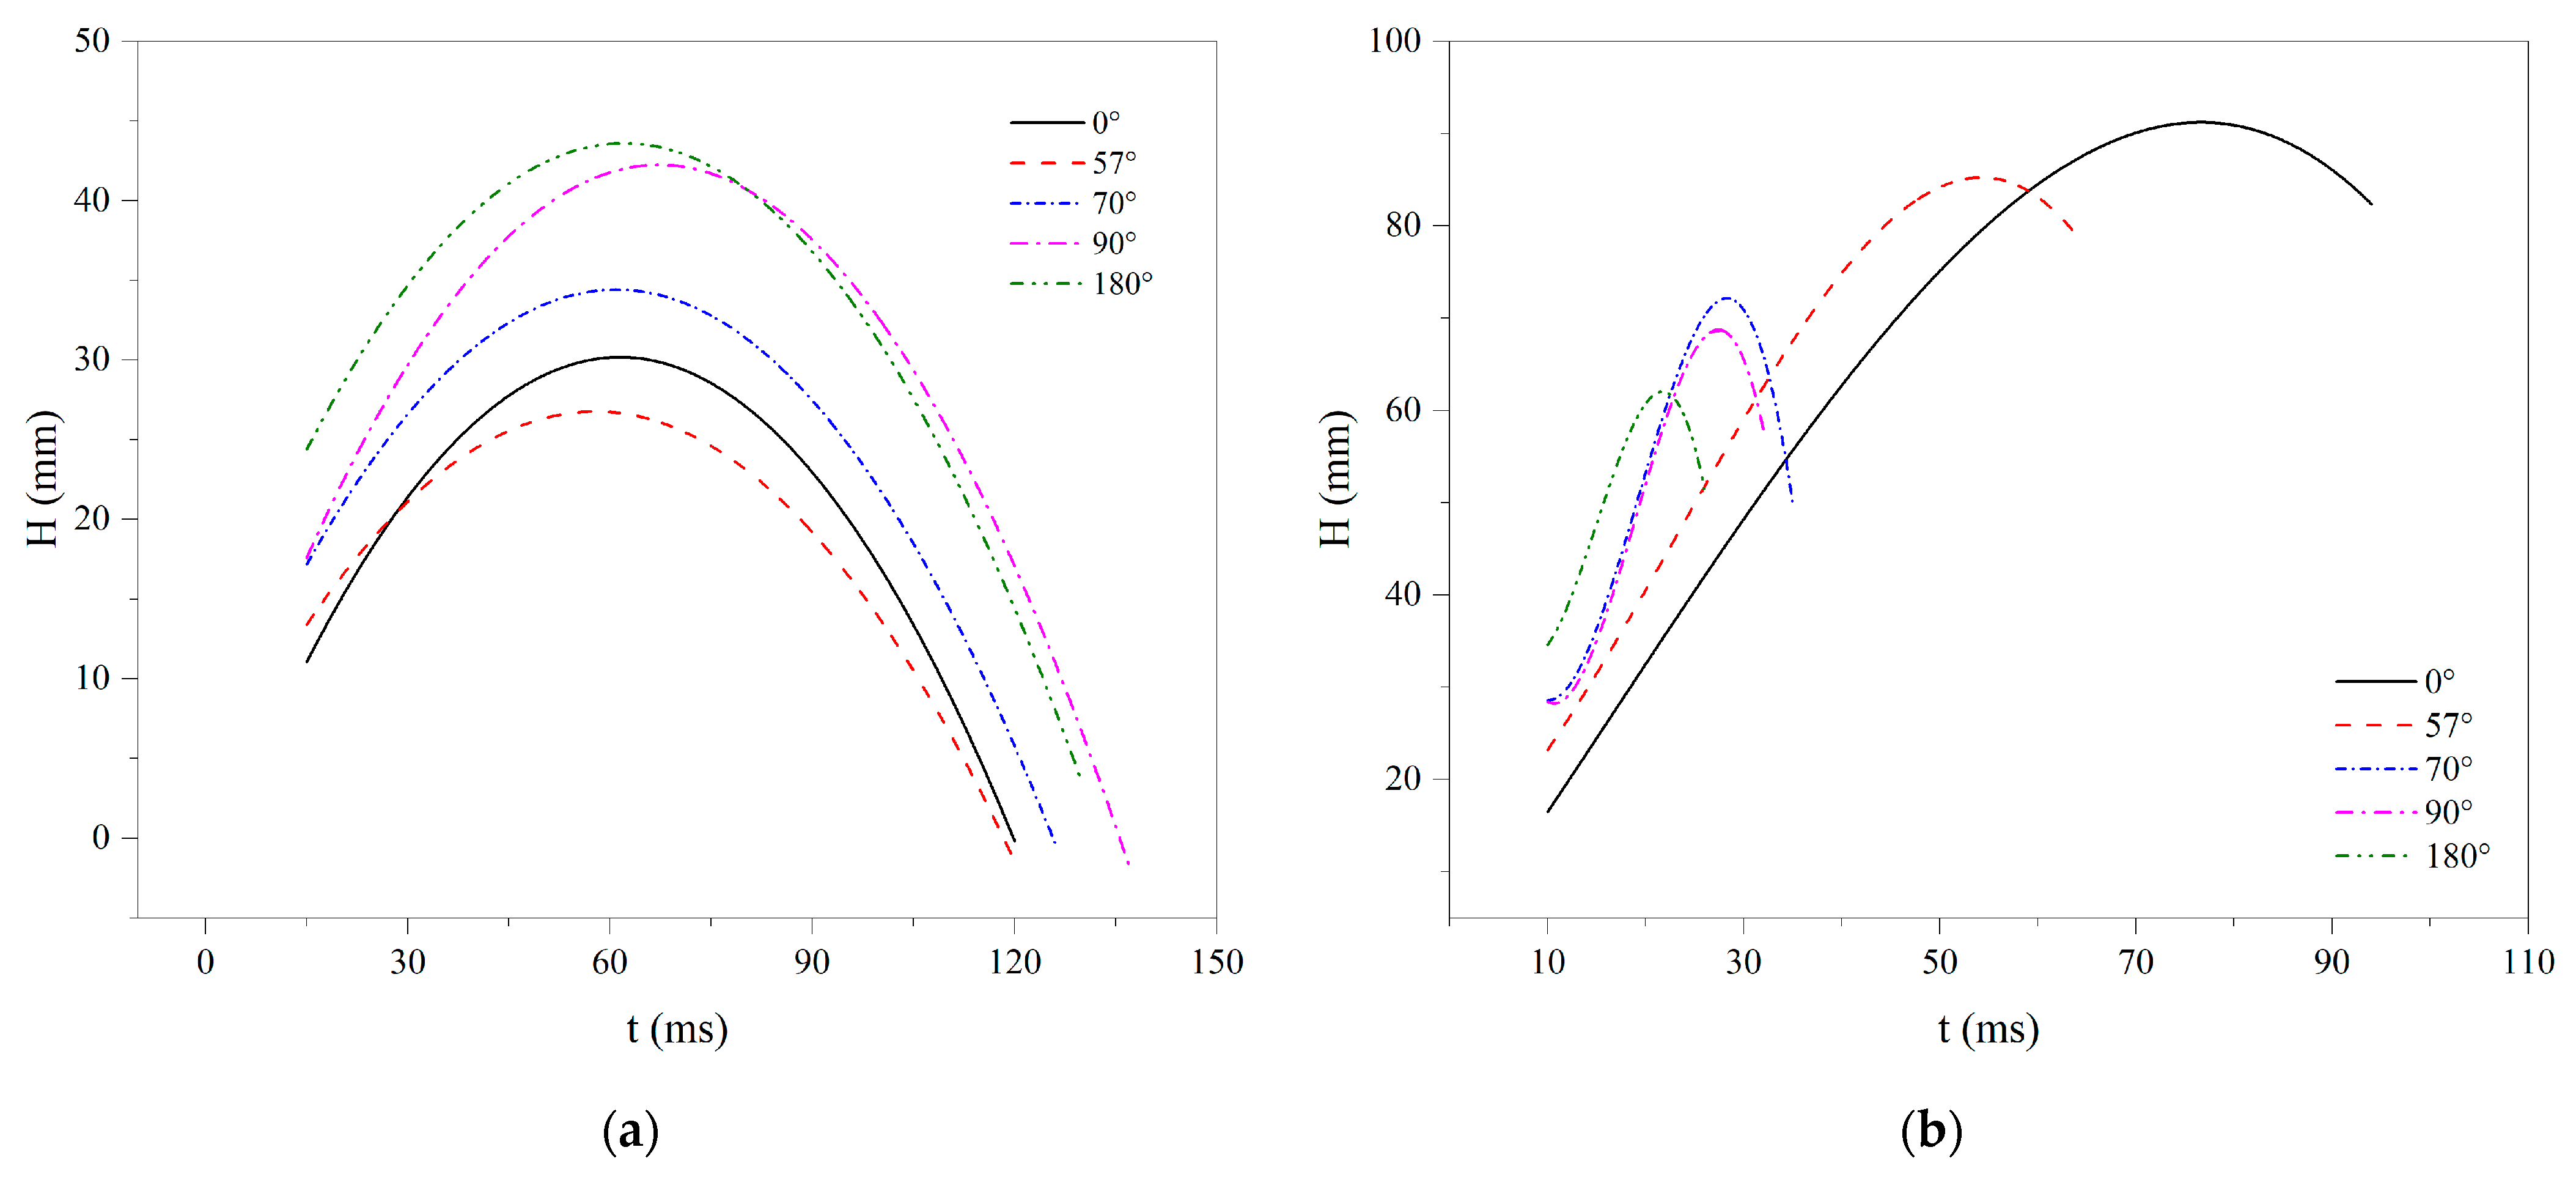
Since the splash of the hydrophobic model forms an obvious water curtain, when measuring the height and diameter of the splash, the fine droplets at the edge of the splash are ignored, and the diameter at the highest point is taken as the splash diameter. At 3.95 m/s, since the secondary splash formed after the tail enters the water destroys the shape of the primary splash, the splash height and diameter are measured until the splash closes. The curves of the splash height and diameter over time under the hydrophobic conditions are shown in
Figure 19.
In the initial splash stage, at both speeds, the larger the head shape’s hemispherical angle is, the larger the splash height is. As for the maximum splash height at 2.2 m/s, basically, a larger head hemispherical angle produces a greater maximum splash height. At 3.95 m/s, basically, the larger the head shape hemispherical angle is, the smaller the maximum splash height is. This is because the entire development time of the splash is short, and the splash cannot be extended upward to the necessary extent. Similarly, the splash closure height is related to the way in which it is closed, and the closure height above the model is the same, and the closure height on the surface of the model is the same. When the speed is 2.2 m/s, the time required for different head shapes to reach the maximum splash height ranges between 50–60 ms, and the time for the splash to fall to the water surface ranges between 120–140 ms. At 3.95 m/s, with a larger hemispherical angle of the head shape, the splash reaches its maximum height, and the upper end of the splash closes faster.
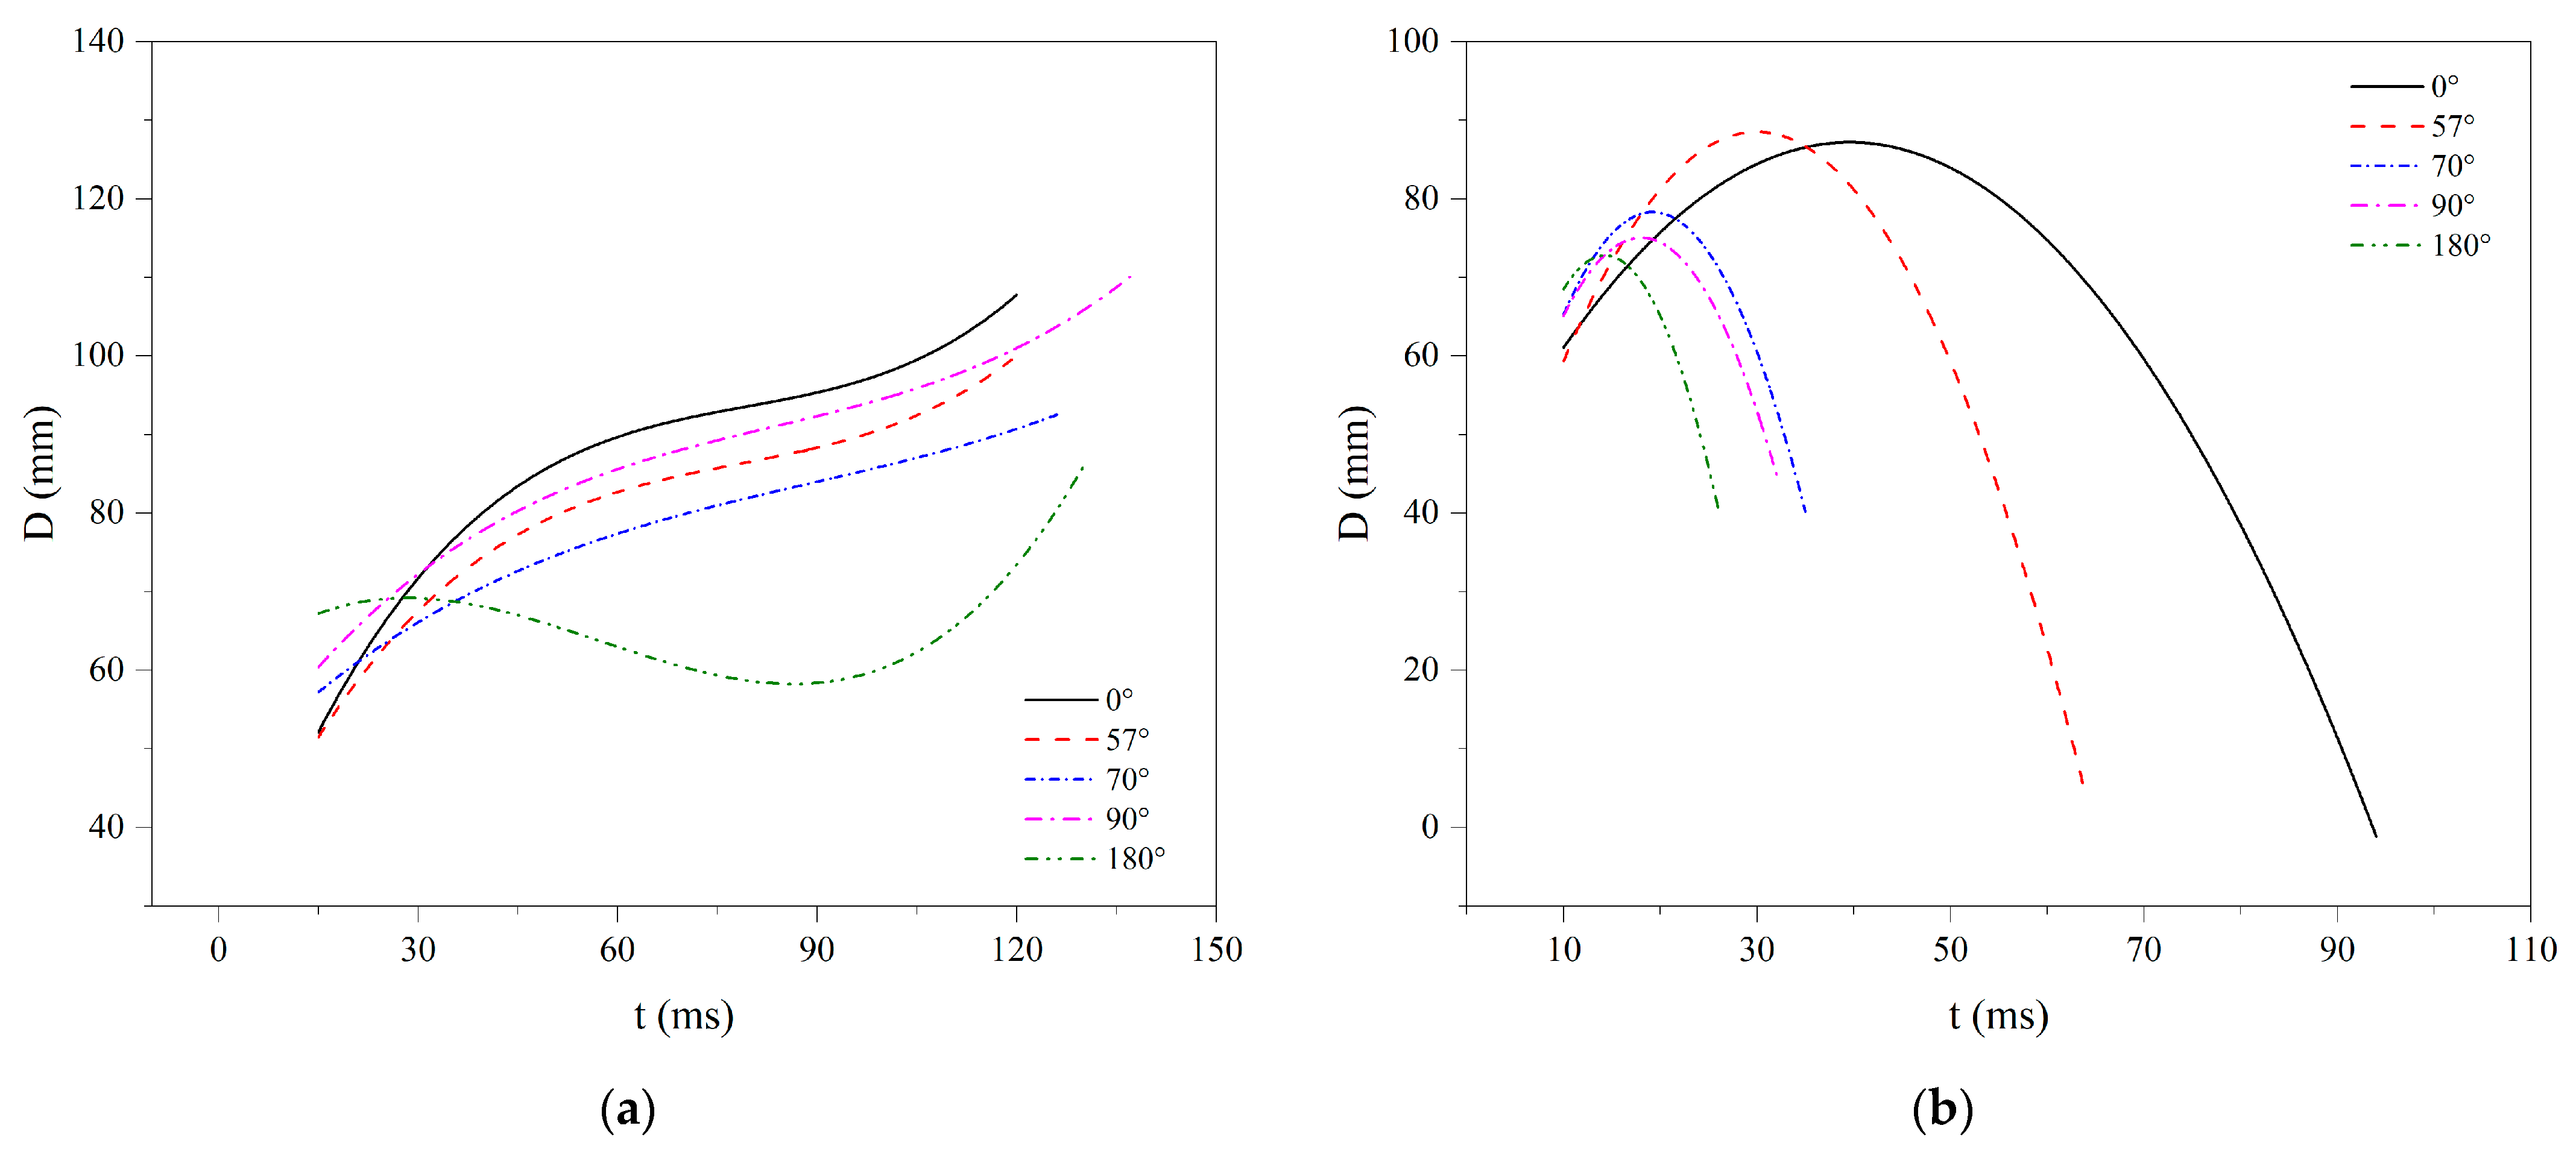
As for the splash diameter, since the processes of the change in the shape of the splash at the two speeds are completely different, the processes of the change in the splash diameter with time are also completely different. At 2.2 m/s, except for the 180° hemispherical angle condition, the development trend of the diameter is basically similar, and the splash continues to expand slowly after the initial rapid expansion. For the 180° hemispherical angle condition, when the shape of the splash changes into a truncated cone, the diameter of the upper part decreases. After the diameter is reduced for a period, as the splash falls, the overall diameter increases rapidly. At 3.95 m/s, basically, the larger the head shape hemispherical angle is, the smaller the splash diameter is and the earlier the splash closes.
Figure 20 shows the splash diameter over time.
3.2. Influences of the Model Surface Properties on the Cavity
In the hydrophilic model experiment, the free liquid surface is close to the model surface and does not separate. With the falling of the model, the surface of the outer cylinder, except for the tail section, is enwrapped by the surrounding liquid, and only a slight solid–liquid separation occurs at the tail position, forming tail vacuoles. The tail cavity closes closer to the free surface. Among the experiments, when the speed of water entry is 2.2 m/s, the cavity in the tail is more apparent. When the speed is 3.95 m/s, the trace of the cavity in the tail is very shallow, and the cavity is almost absent, as shown in
Figure 21.
For the hydrophobic model, an obvious solid–liquid separation occurs at the model shoulder, forming open vacuoles. With the falling of the cylinder, it undergoes the process of expansion, dragging and closing the cavity as it moves into the water. In the hydrophobic model, the closure of the vacuole occurs twice. In one cases, the closure of the cavity is caused by the head on the surface of the model cylinder; in the other, after the first closure, the cavity is separated into upper and lower parts, and the upper cavity shrinks to meet the free surface and finally closes for the second time, as shown in
Figure 22.
When the water entry speed is 2.2 m/s, the expansion range and drag depth of the open cavities are small, and they quickly shrink to the surface of the model, and the separated upper cavity shrinks down along the model to the horizontal plane. At 3.95 m/s, the expansion range and drag depth of the open cavity are larger, the cavity is more apparent, and the separated upper cavity is separated from the surface of the model. Moreover, for some head shapes, at a speed of 3.95 m/s, the separated upper cavities will appear wrinkled. The process of the expansion and contraction of the cavity wall can be observed simultaneously, as shown in
Figure 23.
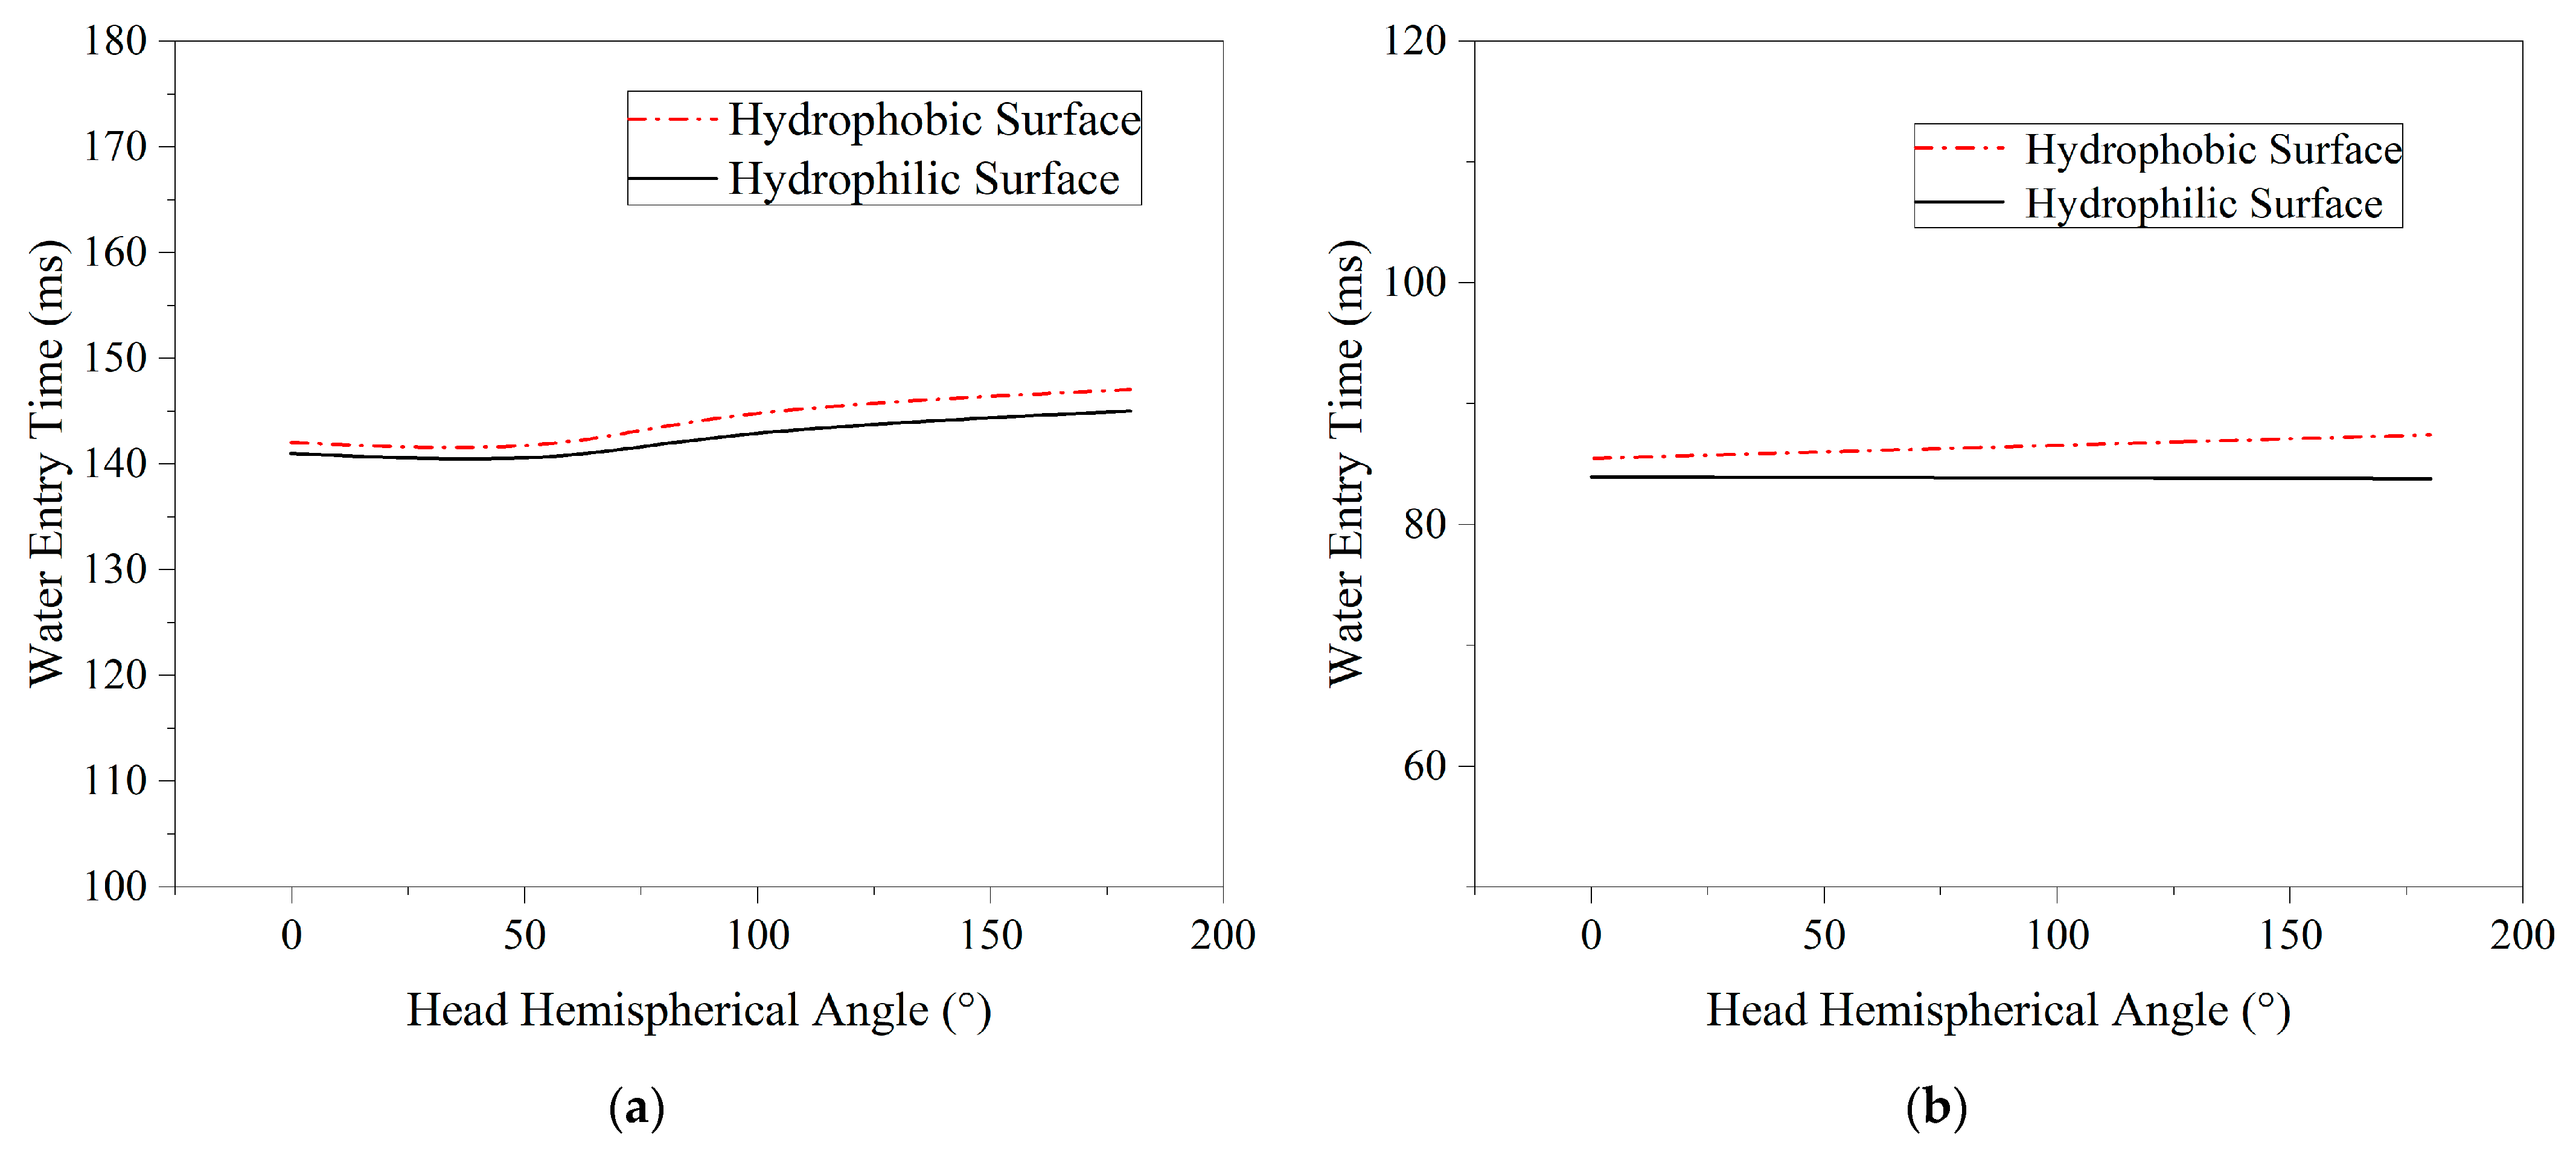
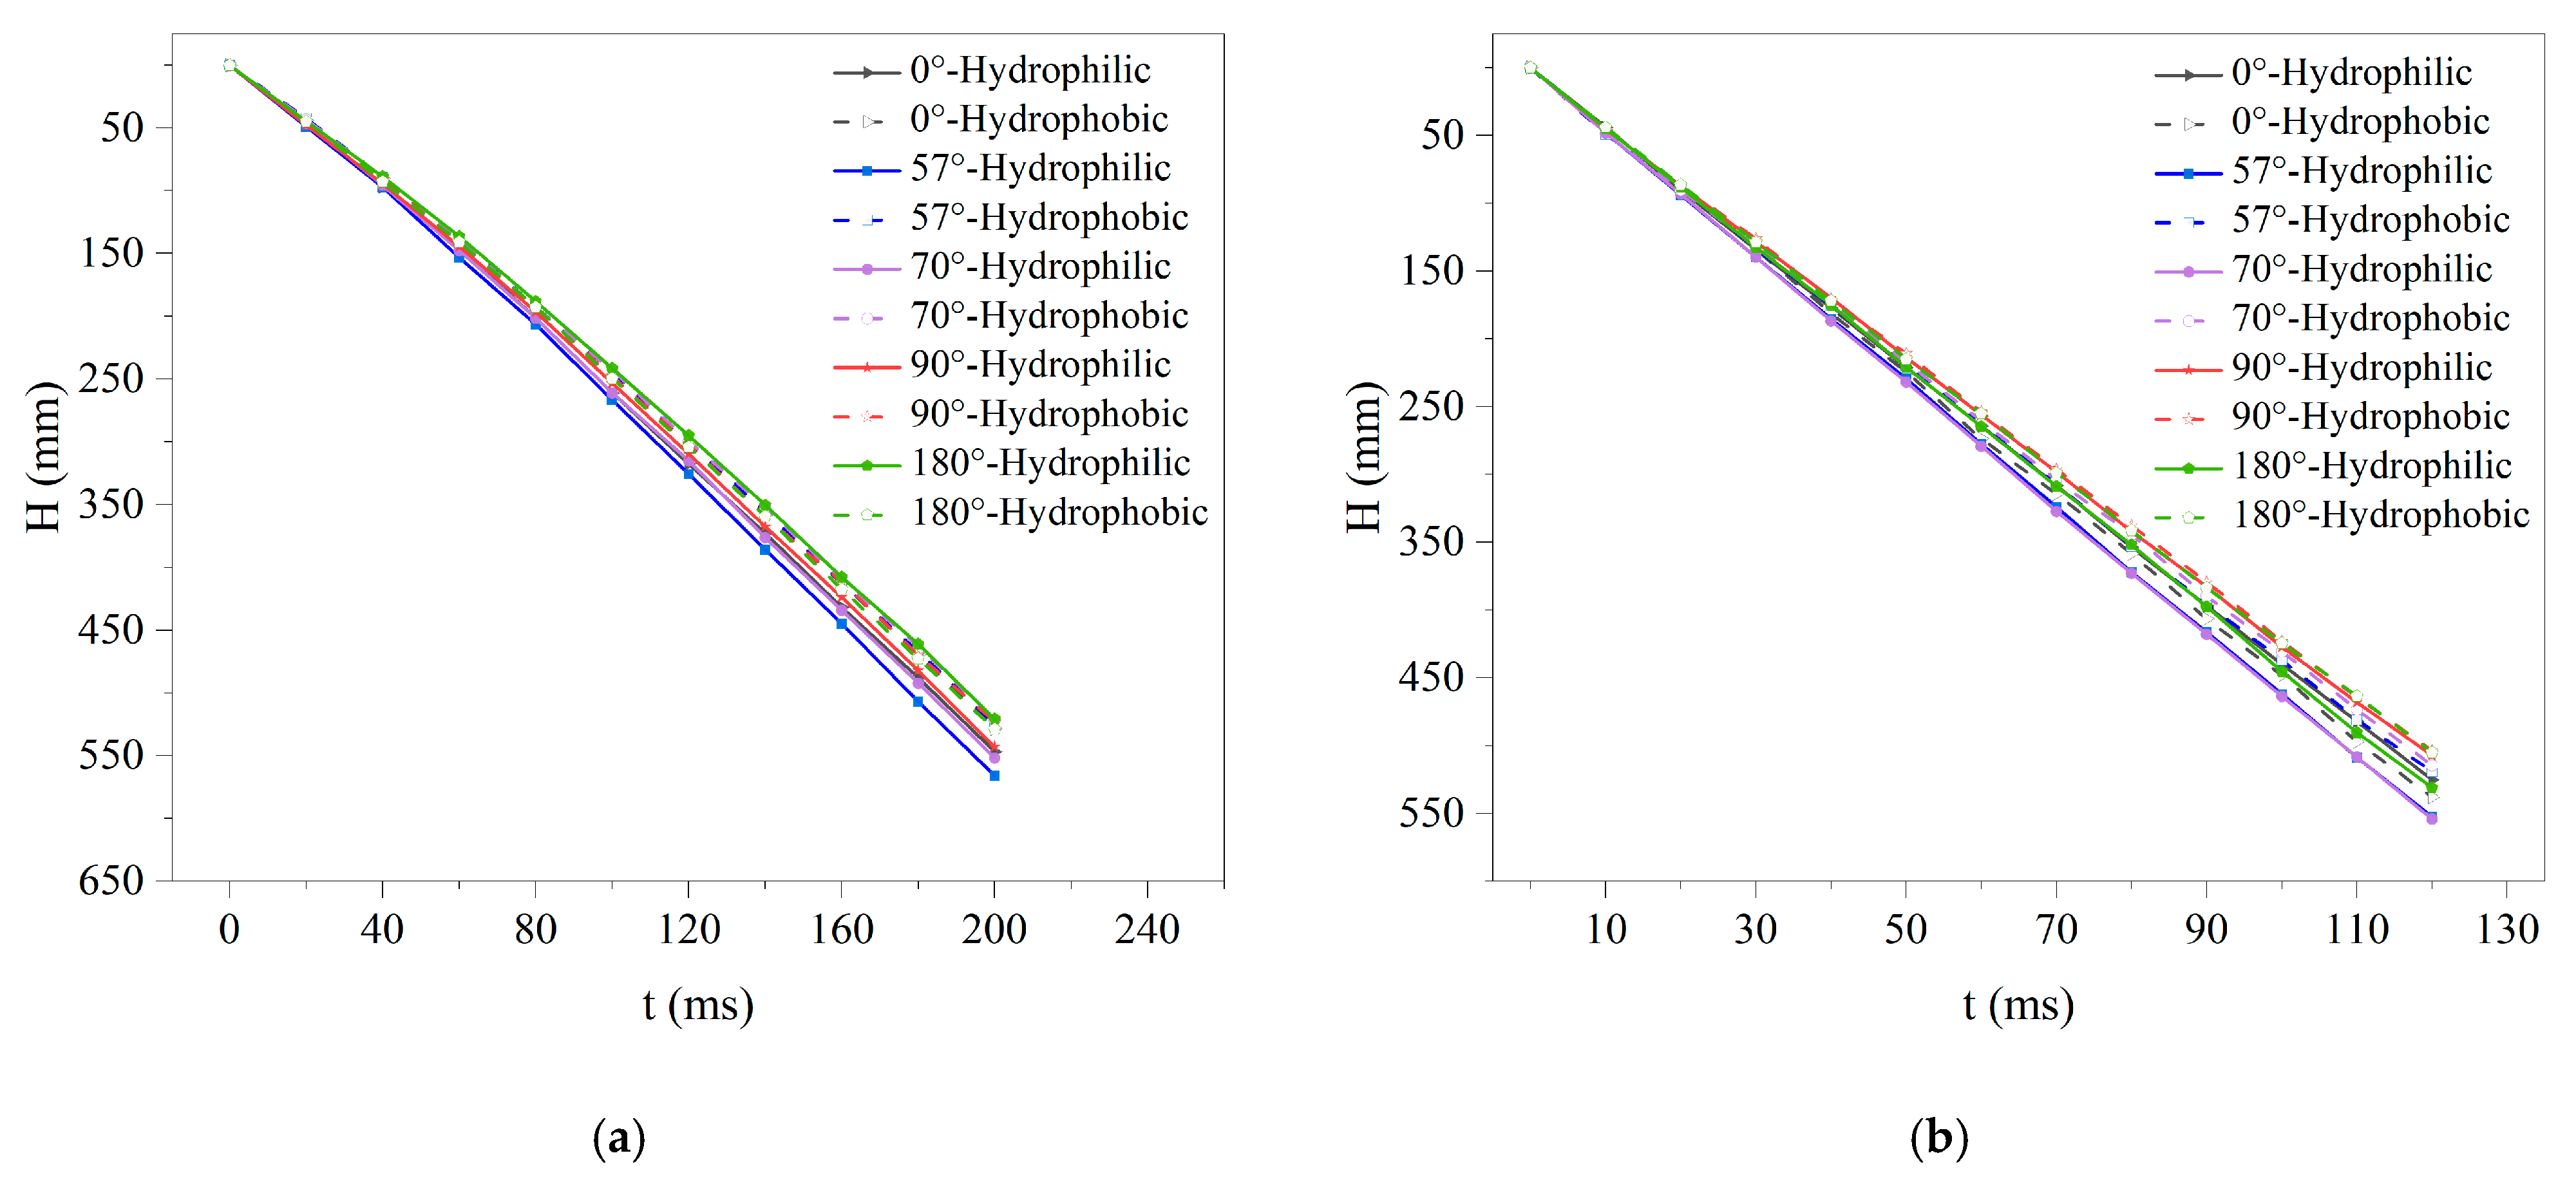
Figure 24a is a chart comparing the water entry times of different head shape hemispherical angle models when the initial water entry velocity is v = 2.2 m/s. It can be seen from the figure that the water entry times of the different head shape models are almost on the same horizontal line. This is because the models with different head types show little difference in terms of the cavity generated during the water entry process (the hydrophilic model does not generate a cavity at this speed), and the difference in energy loss during the model entry process is also minimal. At the same time, the water entry time of the hydrophobic model, represented by the dotted line in the figure, should be higher than the water entry time of the hydrophilic model, represented by the solid line. This is because the hydrophobic model generates a certain number of water entry vacuoles during the water entry process. The model’s cavity-free entry into the water transfers more kinetic energy to the nearby fluid, with greater energy and velocity losses and a longer entry time.
Figure 24b shows the comparison of the water entry times of the hydrophilic and hydrophobic models of different hemispherical angular head shapes at a water entry velocity of 3.95 m/s. It can be seen from the figure that, after increasing the speed, although the water entry times of the hydrophilic and hydrophobic models of different head types decrease, they remain on almost the same horizontal line. Likewise, the entry time of the hydrophobic model, represented by the red line, is greater than the entry time of the hydrophilic model, represented by the black line.
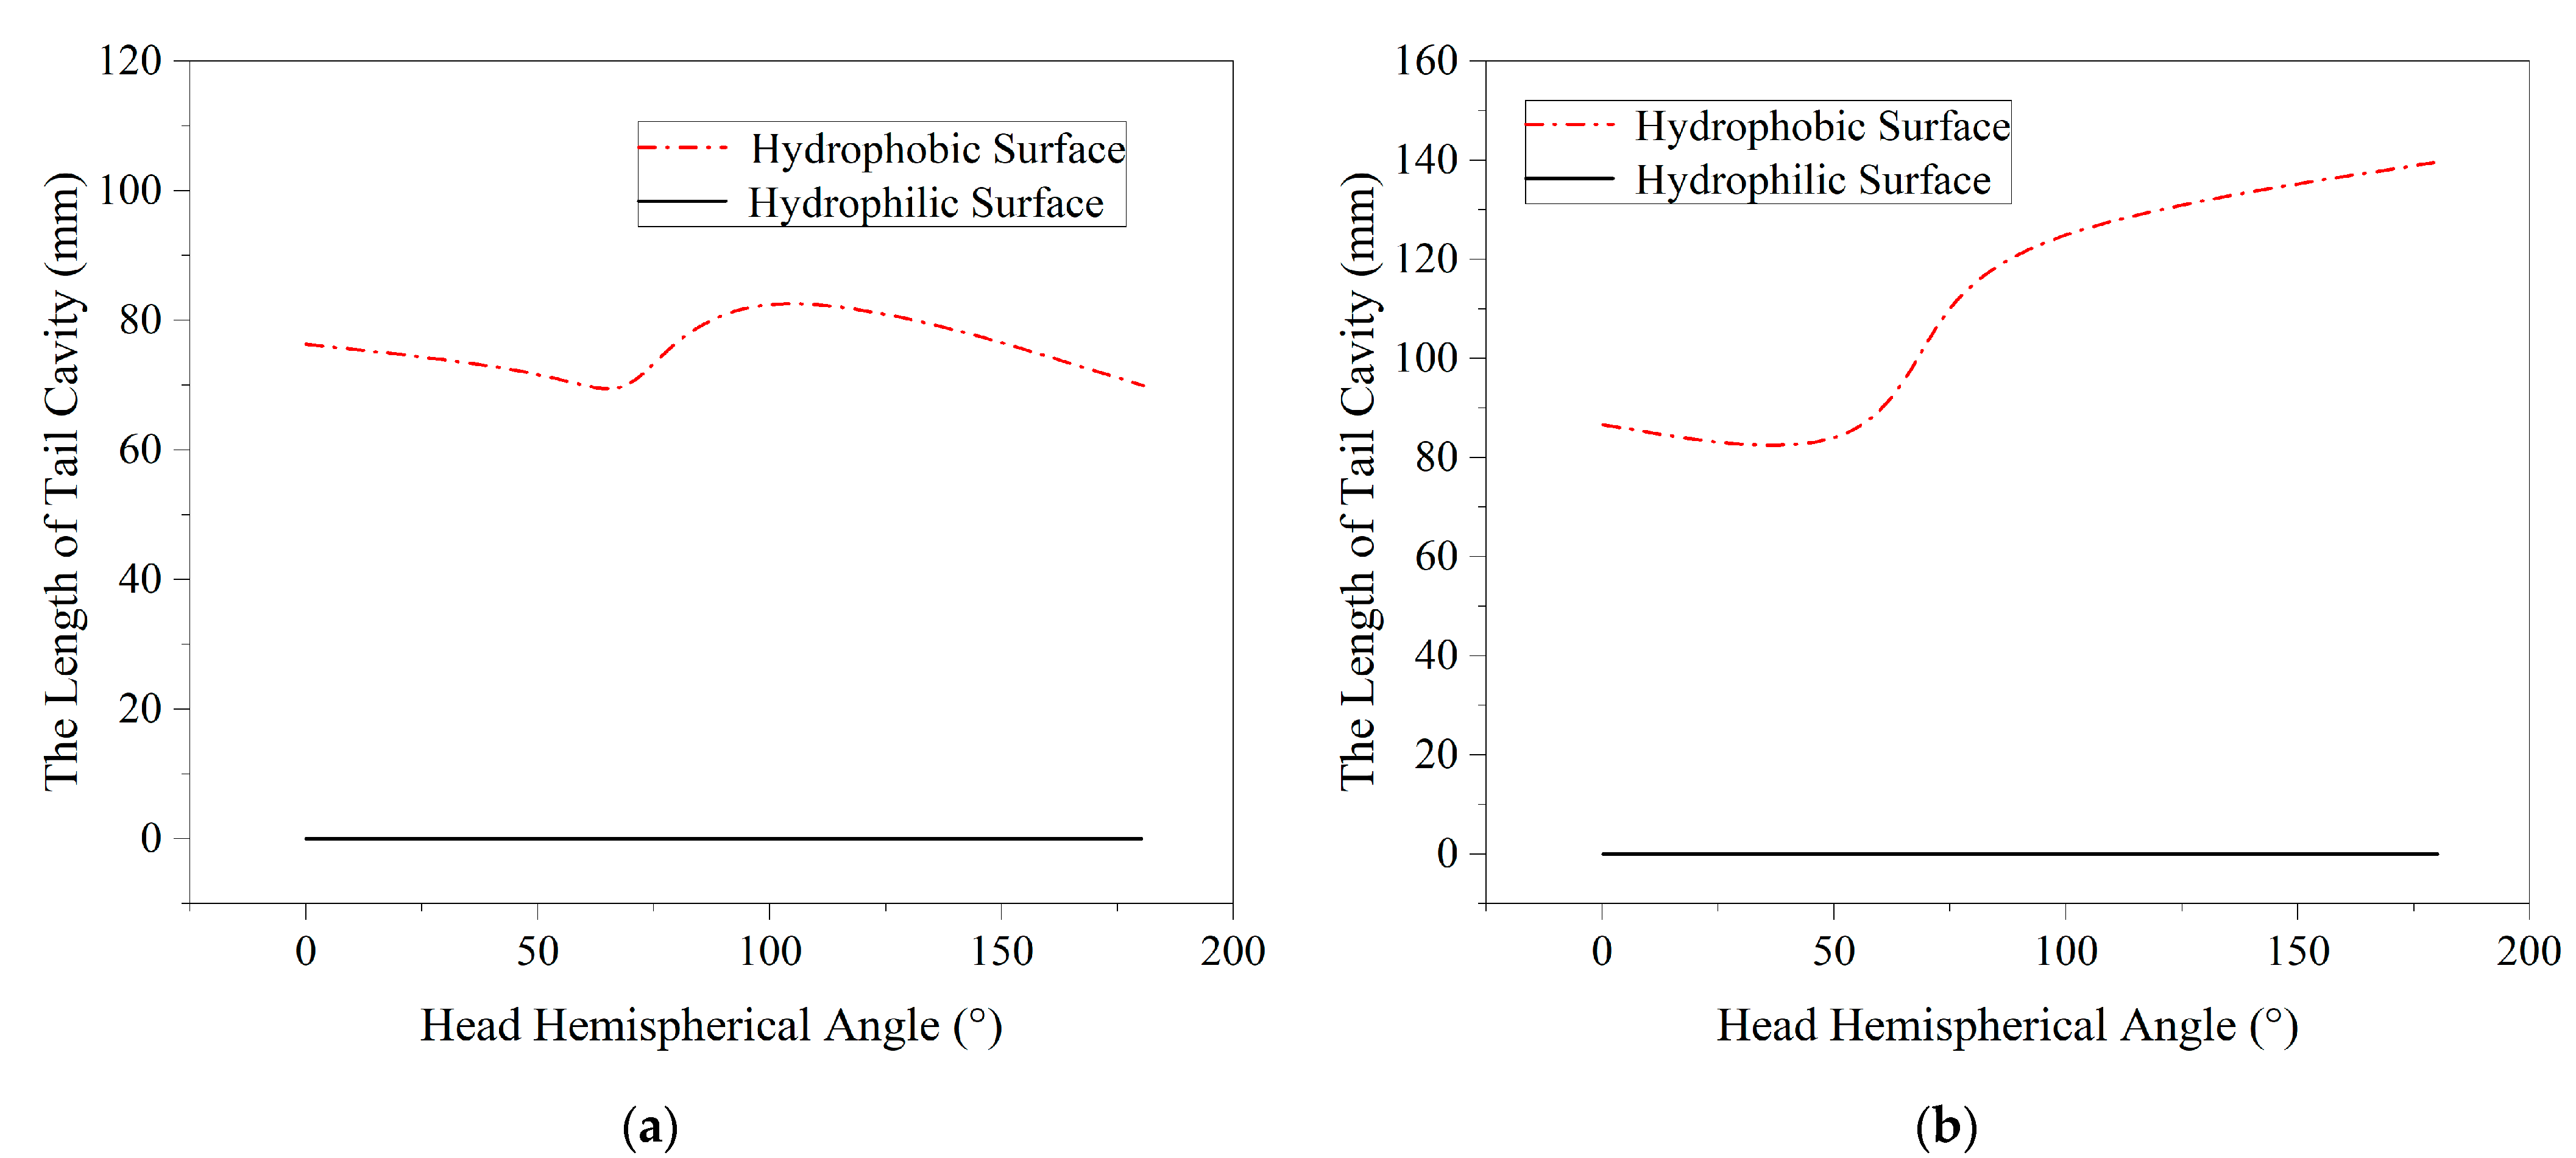
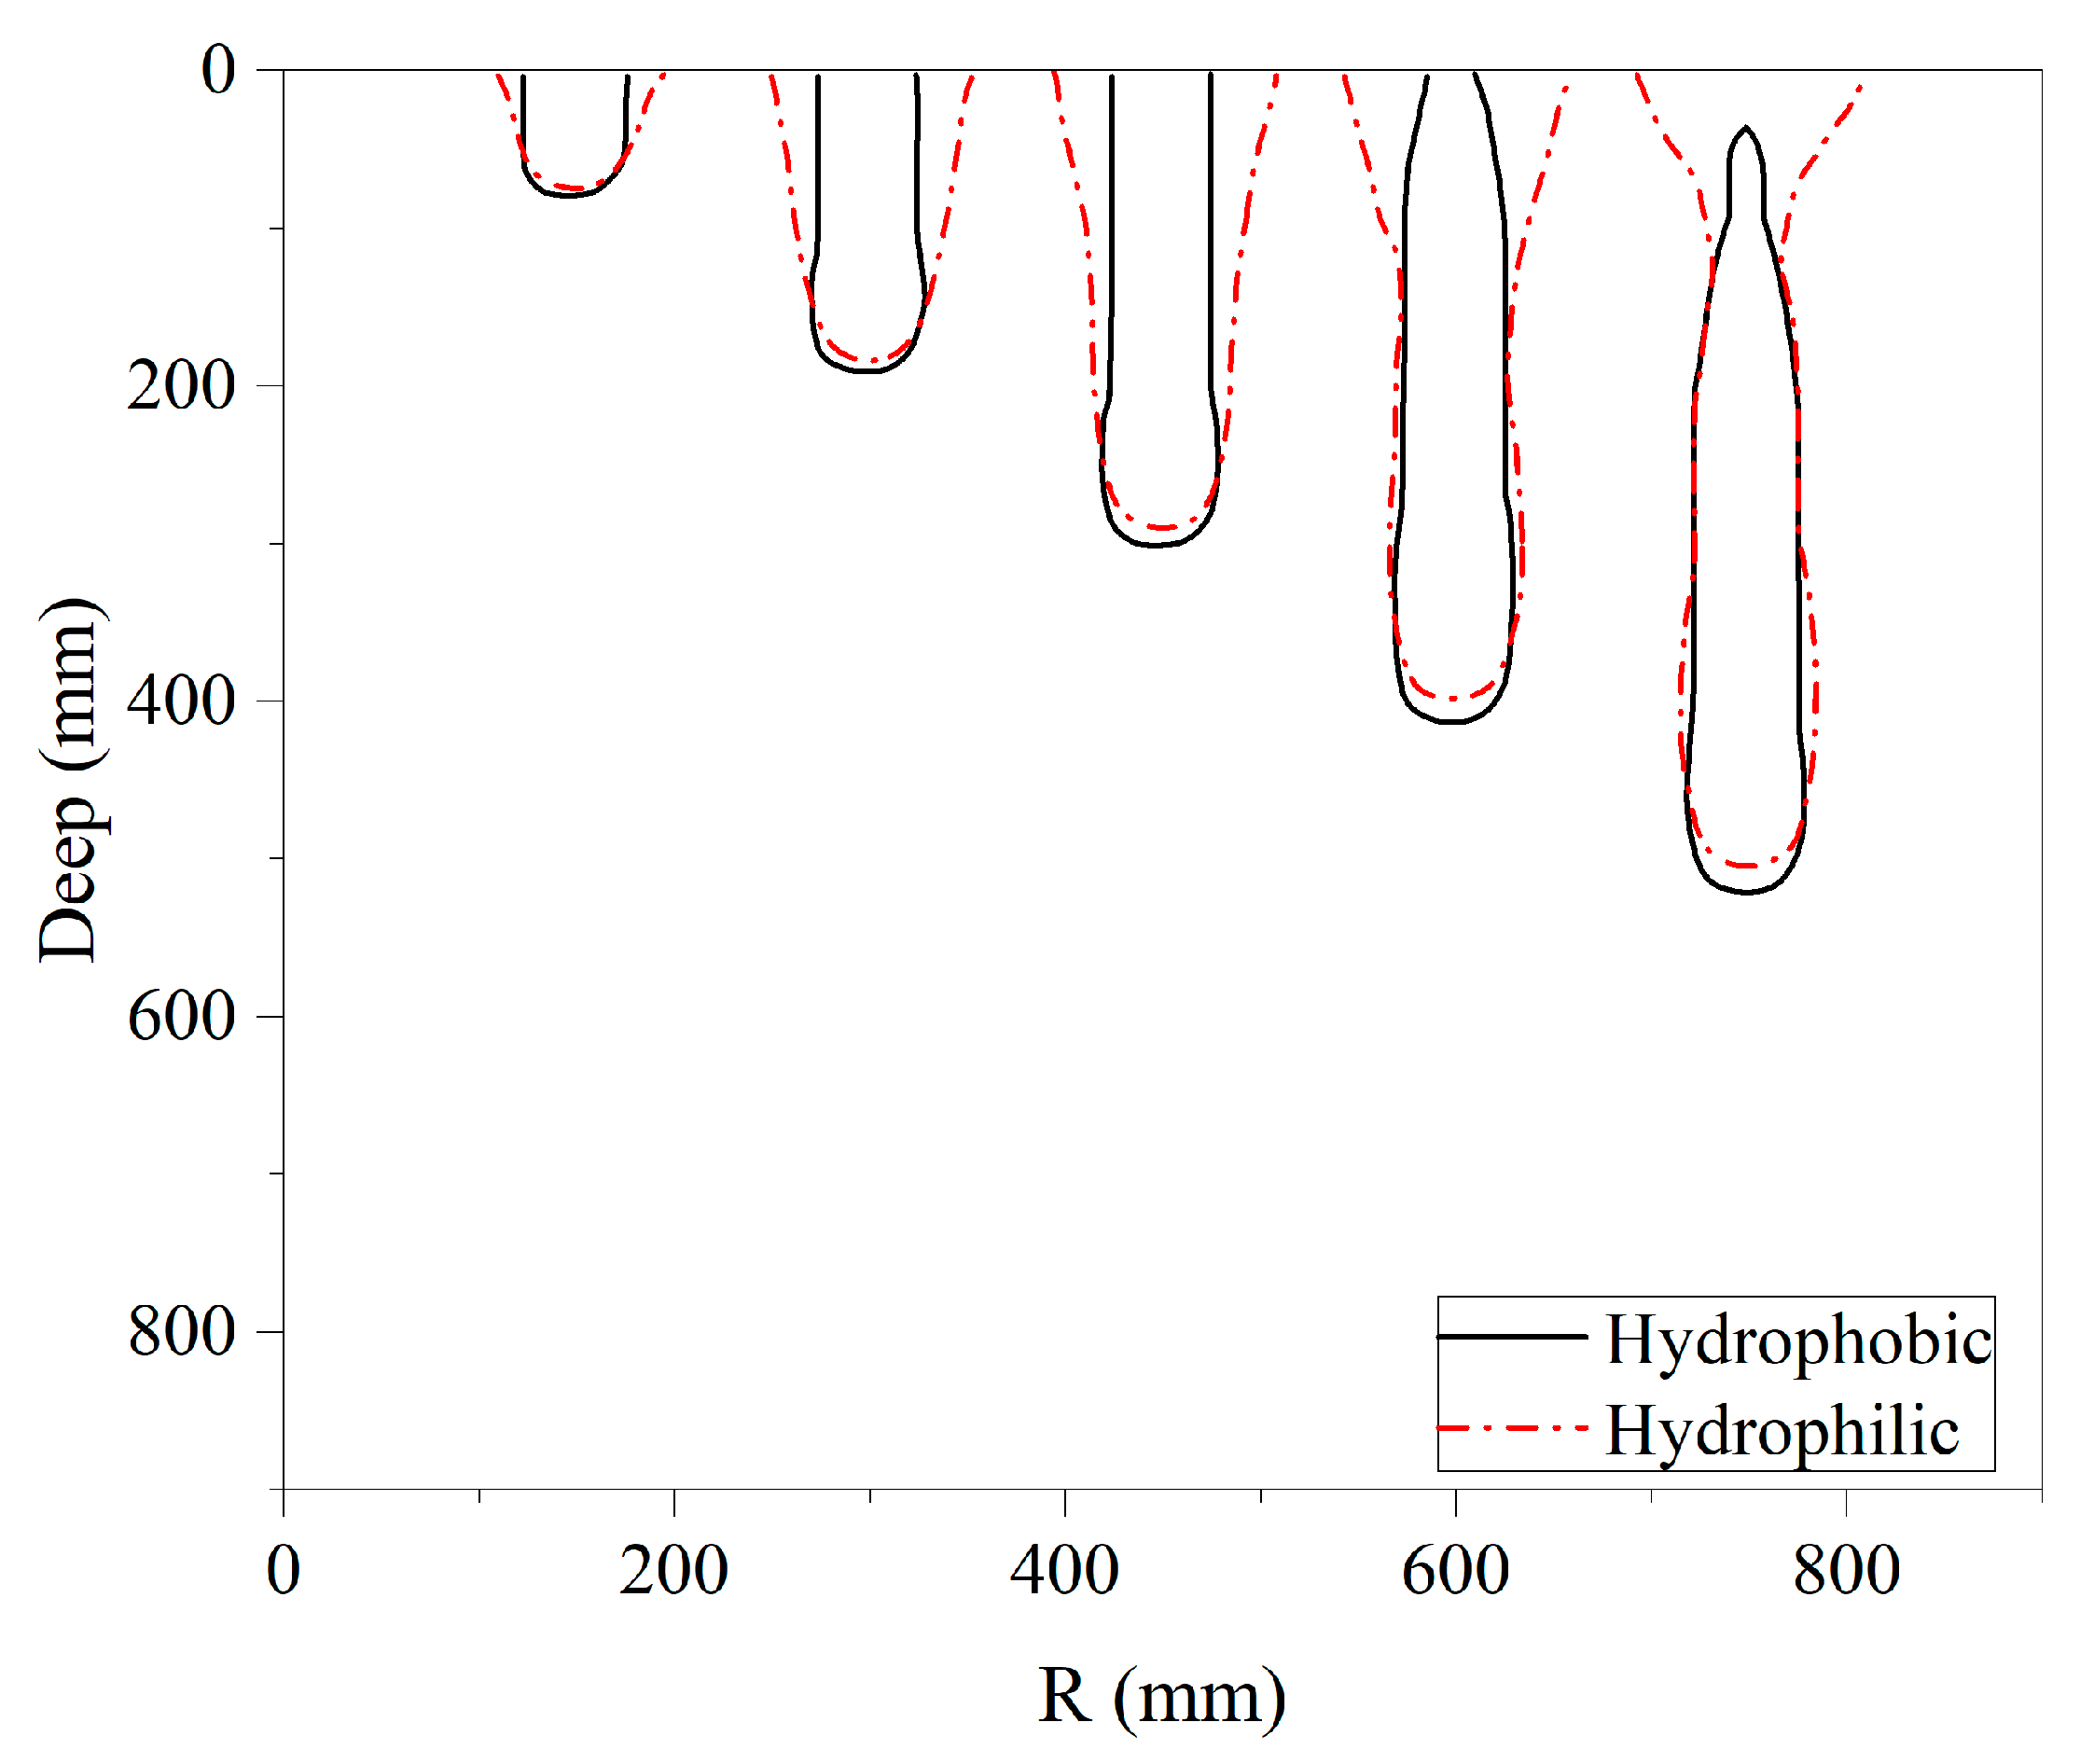
Figure 25a,b shows the comparison of the depth of the vacuoles at the tails and heads of the hydrophilic and hydrophobic models of different hemispherical angular head shapes at a water entry velocity of 3.95 m/s. It can be seen from the figure that the hydrophilic model does not generate water entry cavities during the entire water entry process. For the hydrophobic model entering the water, the model with a head hemispherical angle produces the smallest head cavity, and the model with a head hemispherical angle is slightly larger. When the head hemispherical angle is greater than the generated head cavity, the head cavity generated by the model entering the water increases with the increase in the head hemispherical angle. For the tail vacuole generated by the hydrophobic model entering the water, the sizes of the tail vacuoles produced by the head hemispherical angle of 0° and by the 57° model are basically the same. For the models with head hemispherical angles of 70°, 90° and 180°, the size of the tail vacuoles is affected by the folds and breakage of the tail vacuoles, so that the 70° and 180° models have smaller tail vacuoles, while the 90° models have larger tail vacuoles. The model is less affected by folds, and its tail vacuoles are larger.
To further analyze the characteristics of the vacuoles generated by the hydrophobic model, the process of the change in the vacuolar diameters of different head shapes over time at a speed of 3.95 m/s was plotted as a curve, as shown in
Figure 26. In this analysis, the maximum cavity diameter is used as the cavity diameter. When the center of the cavity shrinks, the maximum diameter of the head cavity is measured as the cavity diameter.
Before the cavity shrinks, except for the 90° model, the cavity sizes of the other models are basically the same. After the cavity shrinks, the cavity diameter of the 0° model is slightly larger than that of the 57° model. After that, with the increase in the head shape hemispherical angle, the cavity diameter increases, which is consistent with the rule of the cavity depth in the previous experiments. This means, in part, that a flatter head shape will transfer more kinetic energy to the surrounding fluid, resulting in a longer entry time and larger head cavity.
3.3. Influences of the Surface Properties and Head on the Ballistics
The water entry ballistics of the craft refer to the motion trajectory of the craft from the time when the craft makes contact with the free liquid surface to the time when the cavity collapses and the craft is fully wetted. The period coincides with the development time of the water entry cavity, and the water entry ballistic is closely connected with the cavity; thus, it is also called the cavity section ballistic. The head shape, water entry speed, impact angle, surface wetness and water environment of the projectile all affect the water entry ballistics of the projectile.
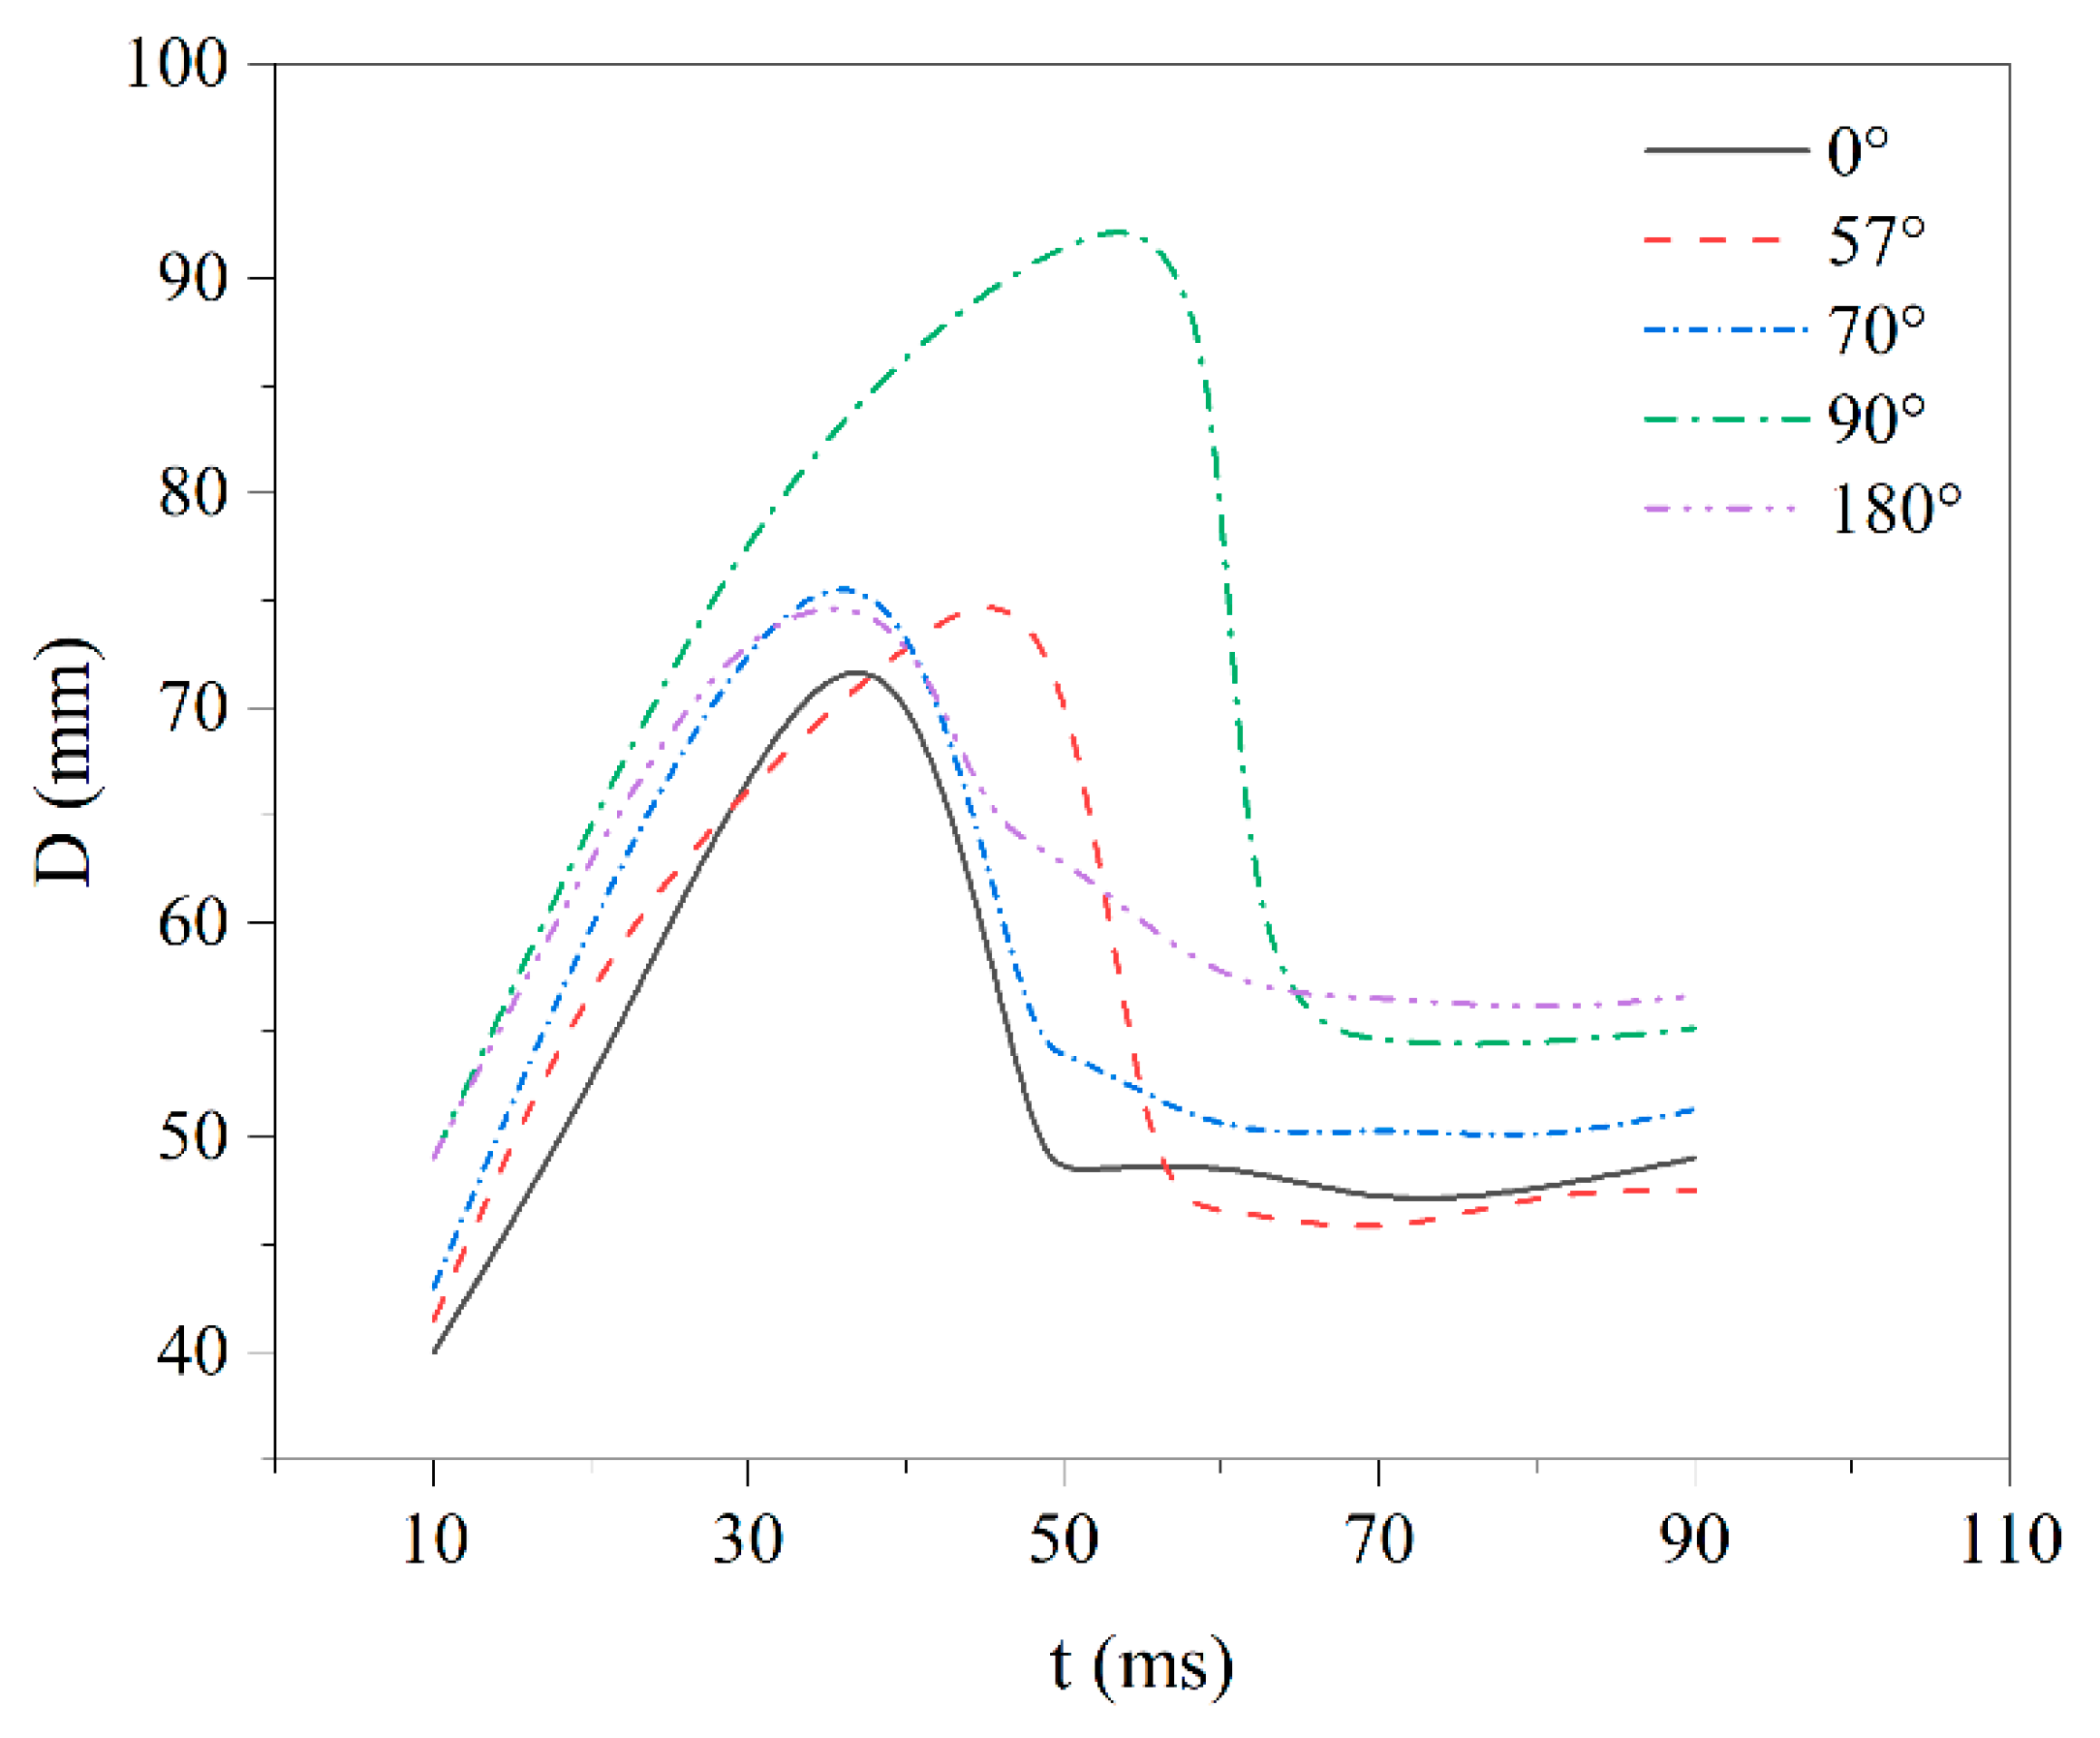
The influence of the impact angle on the water entry ballistics is mainly reflected in the initial stage. The low-pressure effect and resistance of a projectile during water invasion are related to the impact angle. The influence of the water entry velocity is directly reflected by the influence of gravity. When a model enters the water at high speed, the effect of gravity will be weakened, which will increase the possibility of the projectile raising its head or even flooding. The influence of the water environment is based on the fact that the air flow, wind and waves on the sea surface affect the insertion of the projectile into the water, thereby affecting the subsequent ballistics. The surface properties will affect the shape of the cavity, which in turn affects the trajectory of the projectile moving into the water, as shown in
Figure 27. By comparison, it was found that at different speeds, with the head hemisphere angle of the hydrophilic surface of 57 degrees, the speed of the model entering the water is the fastest.
To further study the process of the ballistic changes to the model, this paper includes the water entry cavity diagram of the hydrophilic and hydrophobic models with a water entry velocity of 3.95 m/s and a head shape hemispherical angle (as shown in
Figure 28). The solid line in the figure represents the extraction map of the hydrophilic model entering the water, and the dotted line is the extraction map of the hydrophobic model entering the water. It can be seen from the figure that, throughout the whole process of the hydrophobic model entering the water, the vacuoles produced from the head entering the water to the cavity left by the tail entering the water are always larger than those produced by the hydrophilic model entering the water. During the entire water entry process, the water entry cavities of the hydrophilic model represented by the solid line are always on the dotted line, that is, above the water entry cavities of the hydrophobic model. The hydrophobic model shows a larger displacement in the water and a smaller attenuation of the velocity. This is consistent with the conclusion obtained above.


