Review

Advancing Intercropping Research and Practices in Industrialized Agricultural Landscapes

by
K. Ann Bybee-Finley
* and
Matthew R. Ryan
Section of Soil and Crop Sciences in the School of Integrative Plant Sciences, Cornell University, Ithaca, NY 14853, USA
*
Author to whom correspondence should be addressed.
Agriculture 2018, 8(6), 80; https://doi.org/10.3390/agriculture8060080
Submission received: 2 May 2018 / Revised: 6 June 2018 / Accepted: 6 June 2018 / Published: 8 June 2018
(This article belongs to the Special Issue Sustainable Crop Production Intensification)

Abstract

:
Sustainable intensification calls for agroecological and adaptive management of the agrifood system. Here, we focus on intercropping and how this agroecological practice can be used to increase the sustainability of crop production. Strip, mixed, and relay intercropping can be used to increase crop yields through resource partitioning and facilitation. In addition to achieving greater productivity, diversifying cropping systems through the use of strategic intercrops can increase yield stability, reduce pests, and improve soil health. Several intercropping systems are already implemented in industrialized agricultural landscapes, including mixed intercropping with perennial grasses and legumes as forage and relay intercropping with winter wheat and red clover. Because intercropping can provide numerous benefits, researchers should be clear about their objectives and use appropriate methods so as to not draw spurious conclusions when studying intercrops. In order to advance the practice, experiments that test the effects of intercropping should use standardized methodology, and researchers should report a set of common criteria to facilitate cross-study comparisons. Intercropping with two or more crops appears to be less common with annuals than perennials, which is likely due to differences in the mechanisms responsible for complementarity. One area where intercropping with annuals in industrialized agricultural landscapes has advanced is with cover crops, where private, public, and governmental organizations have harmonized efforts to increase the adoption of cover crop mixtures.

1. Introduction

Calls for sustainable intensification (SI) have been resounding in the globally-scaled rhetoric of agrifood systems to produce food for a growing population, while minimizing the negative environmental impact. However, the conceptualization of SI varies based on the ascribed agricultural philosophy of the user of the term [1]. Here, we consider SI to be a holistic concept best described by Struik and Kuyper (2017) as one that considers societal negotiations, institutional innovations, justice, and adaptive management for improving agrifood systems [2].
In this paper, we discuss the potential of intercropping as an agroecological land management practice for SI. Intercropping is the practice of growing multiple crop species at the same time in the same place and has widely been utilized throughout the history of agriculture. Traditionally, intercropping has been used to increase crop production and the efficiency of the land, as well as a strategy to mitigate risk. It is an essential component of smallholder cropping systems, but in industrialized production where nutrient cycles are more externally regulated, intercropping is underutilized.

2. Fundamentals of Intercropping

Intercropping is different from other strategies that farmers use to increase diversity in cropping systems such as crop rotation, insectary strips, and buffer plantings. Crop rotations are a more common strategy than intercropping in large-scale agriculture and often involve growing different crops in the same field at different times (i.e., temporal diversification). Because different crops are grown in different fields, (i.e., spatial diversification), competition between crop species does not typically occur as with intercropping. However, the spatial scale of crop diversification is much larger (i.e., farm-scale rather than field-scale). Other forms of diversification also exist, such as insectary strips and buffer plantings of non-crop vegetation that provide many of the ecosystem services but with less crop-crop competition than intercropping.

2.1. Types of Intercropping

Crops can be grown together as intercrops in a variety of ways. Mixed intercropping is the practice of growing two or more crop species together at the same time in a field without using any particular spatial configuration (Figure 1). In contrast, strip intercropping is the practice of growing two or more crop species in separate, but adjacent, rows at the same time. Whereas these types of intercropping vary by spatial configuration, crops can also be intercropped in different ways that vary temporally. Relay intercropping involves the staggered planting of two or more crops together in a way whereby only parts of their life cycles overlap.

2.2. Mechanisms

Complementarity is a general term used to describe the positive effects that can result from intercropping. Primarily, there are two mechanisms that contribute to complementarity: resource partitioning and facilitation. Resource partitioning, also known as niche partitioning and niche differentiation, describes the more complete utilization of available resources by crops that are intercropped compared to when they are grown separately. Resources are partitioned as a result of differentiation in resource acquisition traits. Selecting for differences in rooting depth, phenology, and vegetative architecture between crop species grown in an intercrop can minimize competition and increase resource partitioning [3]. A classic example is the Three-Sisters mixed intercrop of corn-beans-squash (Zea mays L., Phaseolus vulgaris L., and Cucurbita pepo L., respectively) used by indigenous people in North America [4]. In this case, resource partitioning is driven by differences in traits among the nitrogen-fixing beans, the low-growing squash that covers the soil and suppresses weeds, and the tall corn that acts as a trellis for the beans.
Facilitation refers to processes by which one crop species provides a limiting resource or improves the environmental condition to another crop species. The most common example is a legume providing nitrogen to a grass. However, other examples exist, such as one species with a deep taproot supplying water to other species by hydraulic lift. In their review of complementarity and soil microorganisms, Duchene et al. (2017) categorized facilitation as being indirect, where a beneficial change in the rhizosphere improves nutrient availability, or direct, where the rhizosphere acts as an interface for the transfer of nutrients from one plant to another [5].
In this paper, we focus our attention on intercropping with multiple species. While this is the most common intercropping approach, it is not the only way to intercrop. Rather than species diversity, selecting for functional diversity is a pragmatic approach that aims to maximize complementarity. As function is often context-dependent, selecting for greater phylogenetic diversity (i.e., evolutionary distance) has been suggested as a method to increase resource partitioning [6,7]. Another way to intercrop is to plant multiple varieties of the same species together. Increasing the genetic diversity of a species in the field has been shown to extend the growing season, mitigate the transfer of diseases, and increase productivity in crops such as wheat, corn, and oats [8,9,10,11]. A meta-analysis of 91 studies with more than 3600 observations of intraspecific mixtures found a 2.2% increase in yield compared to their monoculture components [12]. Greater diversity effects were seen under higher stress conditions (e.g., low nutrient availability, high pest pressure) [12]. Moreover, varietal mixtures exhibited significantly higher yield stability compared to monocultures, especially in response to annual weather variability at a site over time [12].

2.3. Benefits of Intercropping

2.3.1. Productivity and Yield Stability

Increased crop productivity is among the most important and frequently cited benefits of intercropping. Overyielding occurs when the productivity of an intercrop is increased relative to the average of each component species grown in a monoculture. This is the most common way that crop productivity is increased with intercropping, and is often driven by resource partitioning. Transgressive overyielding is when the productivity of an intercrop is increased relative to the highest-yielding component species grown in monoculture. This occurs less frequently and is typically the result of facilitation, rather than simply resource partitioning. In addition to increased productivity, there are other benefits that intercropping can provide, including yield stability, pest suppression, and soil health.
Intercropping has been shown to decrease the risk of crop failure by increasing the crop yield stability over time and across locations [13,14]. The crop yield stability can be increased by reducing the variation over years at the same site, or by increasing the production consistency throughout the year. For example, growing a mixture of cool and warm season perennials for forage can counter seasonal slumps in production [15]. Crop yield stability can also be increased spatially by reducing the variability in production within fields (e.g., wet spots) and by maintaining production across different fields. The coefficient of variation (CV) is a metric used to evaluate the production consistency across space and over time. This is calculated by dividing the standard deviation of crop biomass in each treatment by the mean biomass of that treatment. It is a measure of dispersion with a lower number, indicating greater yield stability. A meta-analysis of 69 intercropped systems found greater yield stability in grass-grain legume intercrops compared to those crops in monoculture, with CVs of 0.25, 0.30, and 0.19 for the grass monocultures, legume monocultures, and intercrops, respectively [13,14]. Another study with nine site-years which compared four annual species in monoculture and five intercropping treatments of those species found that the four-species mixture had similar yields to the highest-producing grass monoculture, but greater yield stability [13]. Despite the lack of transgressive overyielding in that study, the average CVs were 0.55, 0.47, and 0.36 for the monocultures, three-species mixtures, and the four-species mixture, respectively [13].

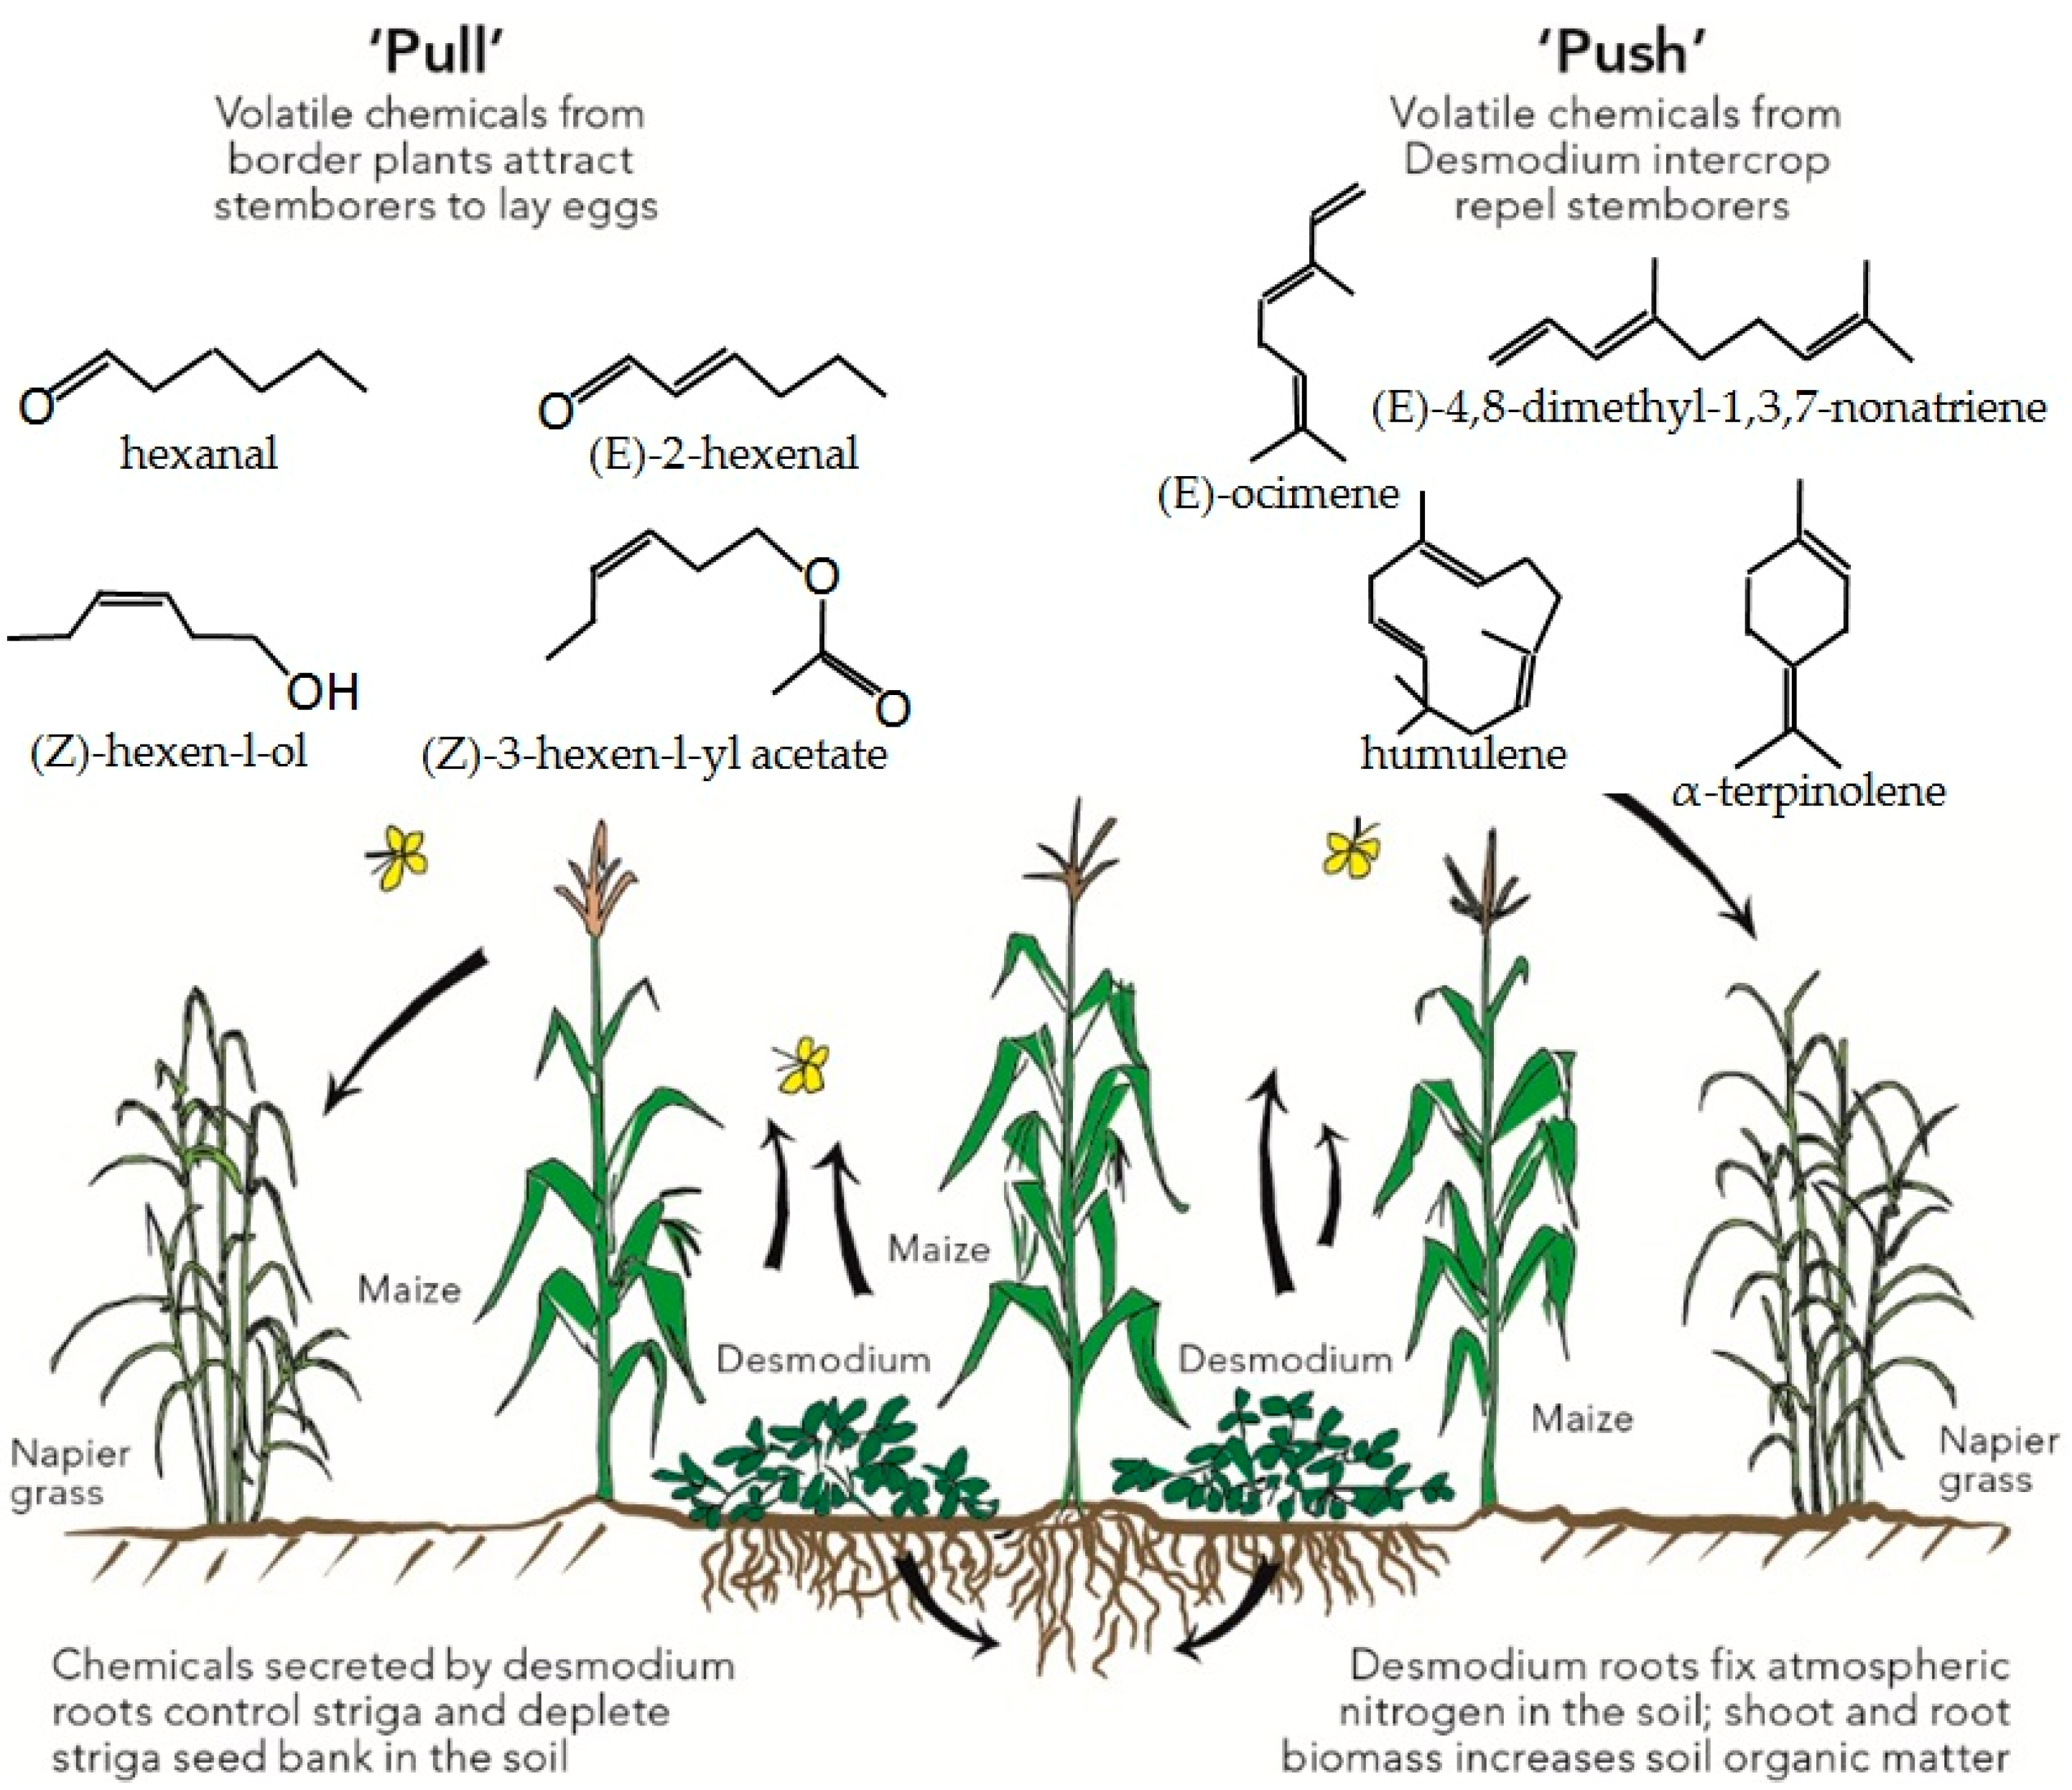
2.3.2. Pest Reduction

Intercropping has been shown to reduce the risk of weeds, insects, and diseases, a benefit that partially explains the increased yield and yield stability. Typically, intercrops can more effectively utilize available resources (e.g., light, water, nutrients) than if crops were grown separately, thus reducing the amount of resources that are available to weeds. In a review by Liebman and Dyck (1993), a cash crop intercropped with a “smother” crop had lower weed biomass in 47 out of 51 cases [16]. Trends were similar when the intercrop was composed of two cash crops, but not to the same degree [16]. A recent meta-analysis of 34 articles about cash crops (e.g., corn or forage) intercropped with legume companion crops containing 476 experimental units (site × year × cash crop × legume companion plant species × agricultural practices) determined that intercropping decreased weed biomass by 56% relative to non-weeded monoculture treatments [17].
More generally, intercrops can diminish the damage by pests and diseases by reducing the number of susceptible hosts (dilution effect), resistant plants acting as a physical barrier to susceptible plants (barrier effect), inducing resistance by increasing the diversity of pests and diseases, reducing the speed by pest adaption through disruptive selection, and compensation of one species that performs poorly [8]. A meta-analysis of 21 agroecosystem studies of diversified cropping systems showed a moderate reduction in herbivorous insect populations compared to more simplified cropping systems that served as the controls [18]. Another meta-analysis of 43 studies found that increasing the complexity of plant architecture resulted in a significant increase in predator and parasitoid natural enemies, mainly driven by increased plant detritus in intercropped systems [19]. In a review of more than 200 studies of foliar fungi, intercropped systems had, on average, a 73% reduction of disease compared to their respective monocultures [20].
Trap crops that attract pests away from main crops as well as crops that repel pests can be intercropped for enhanced pest management. One of the most well-known examples using trap and repellent crops together is the push-pull system that is used to manage corn stemborers (Busseola fusca Fuller.) and weeds like Striga spp. [21]. The strip intercropping method involves planting corn (the cash crop), a “pull” crop, like Napier grass (Pennisetum purpureum Schumach.) that uses semiochemicals to attract corn stemborers, and a “push” crop like the legume Desmodium spp. planted between rows to repel corn stemborers from the corn (Figure 2) [22]. The Desmodium spp. also elicits a fatal germination response from the parasitic weed Striga spp., reducing weed density and competition with the corn. A review article by Khan et al. in 2011, stated that the push-pull system increased corn yields from below 1 to over 3.5 t ha−1 largely in smallholder farms in East Africa [21].

2.3.3. Soil Health

In addition to crop yield benefits, intercropping can increase soil health and reduce nonpoint source pollution by decreasing nitrogen losses [24,25]. A seven-year study in Northwestern China found that soil organic carbon and nitrogen contents in the top 20 cm were approximately 4% and 11% greater in two-species strip intercropped systems of corn, wheat, and faba beans (Vicia faba L.) compared to those species in monoculture rotations, which led to sequestration rate increases of approximately 184 and 45 kg ha−1 year−1 for carbon and nitrogen, respectively [26]. Additionally, the study found 23% more root biomass in the intercropped systems compared to the species in monocultures [26]. Increased plant diversity has been shown to increase soil microbial diversity making nutrient uptake by plants more effective and decreasing the effects of plant pathogens in the soil [27]. Although increased plant diversity is typically associated with more complete resource use, substantial benefits can be gained by intercropping even two crop species, especially if they are grass and legume crops. As grasses are typically dominant in soils with high nitrogen availability, and legumes have an advantage in soils with low nitrogen availability due to their symbiotic relationships with nitrogen-fixing bacteria, grass-legume intercrops are able to self-regulate based on soil nitrogen levels [28]. Self-regulation can play an important role in reducing the amount of reactive nitrogen in the soil, therefore reducing nitrate leaching and denitrification, which are major contributors to water quality problems and greenhouse gas emissions, respectively. For instance, a 3-year study in China on strip intercropping with sweet corn and soybean (Glycine max (L.) Merr.) showed a 40% reduction in soil mineral N at the time of harvest compared to the corn monoculture [29].

3. Examples of Successful Intercropping Systems

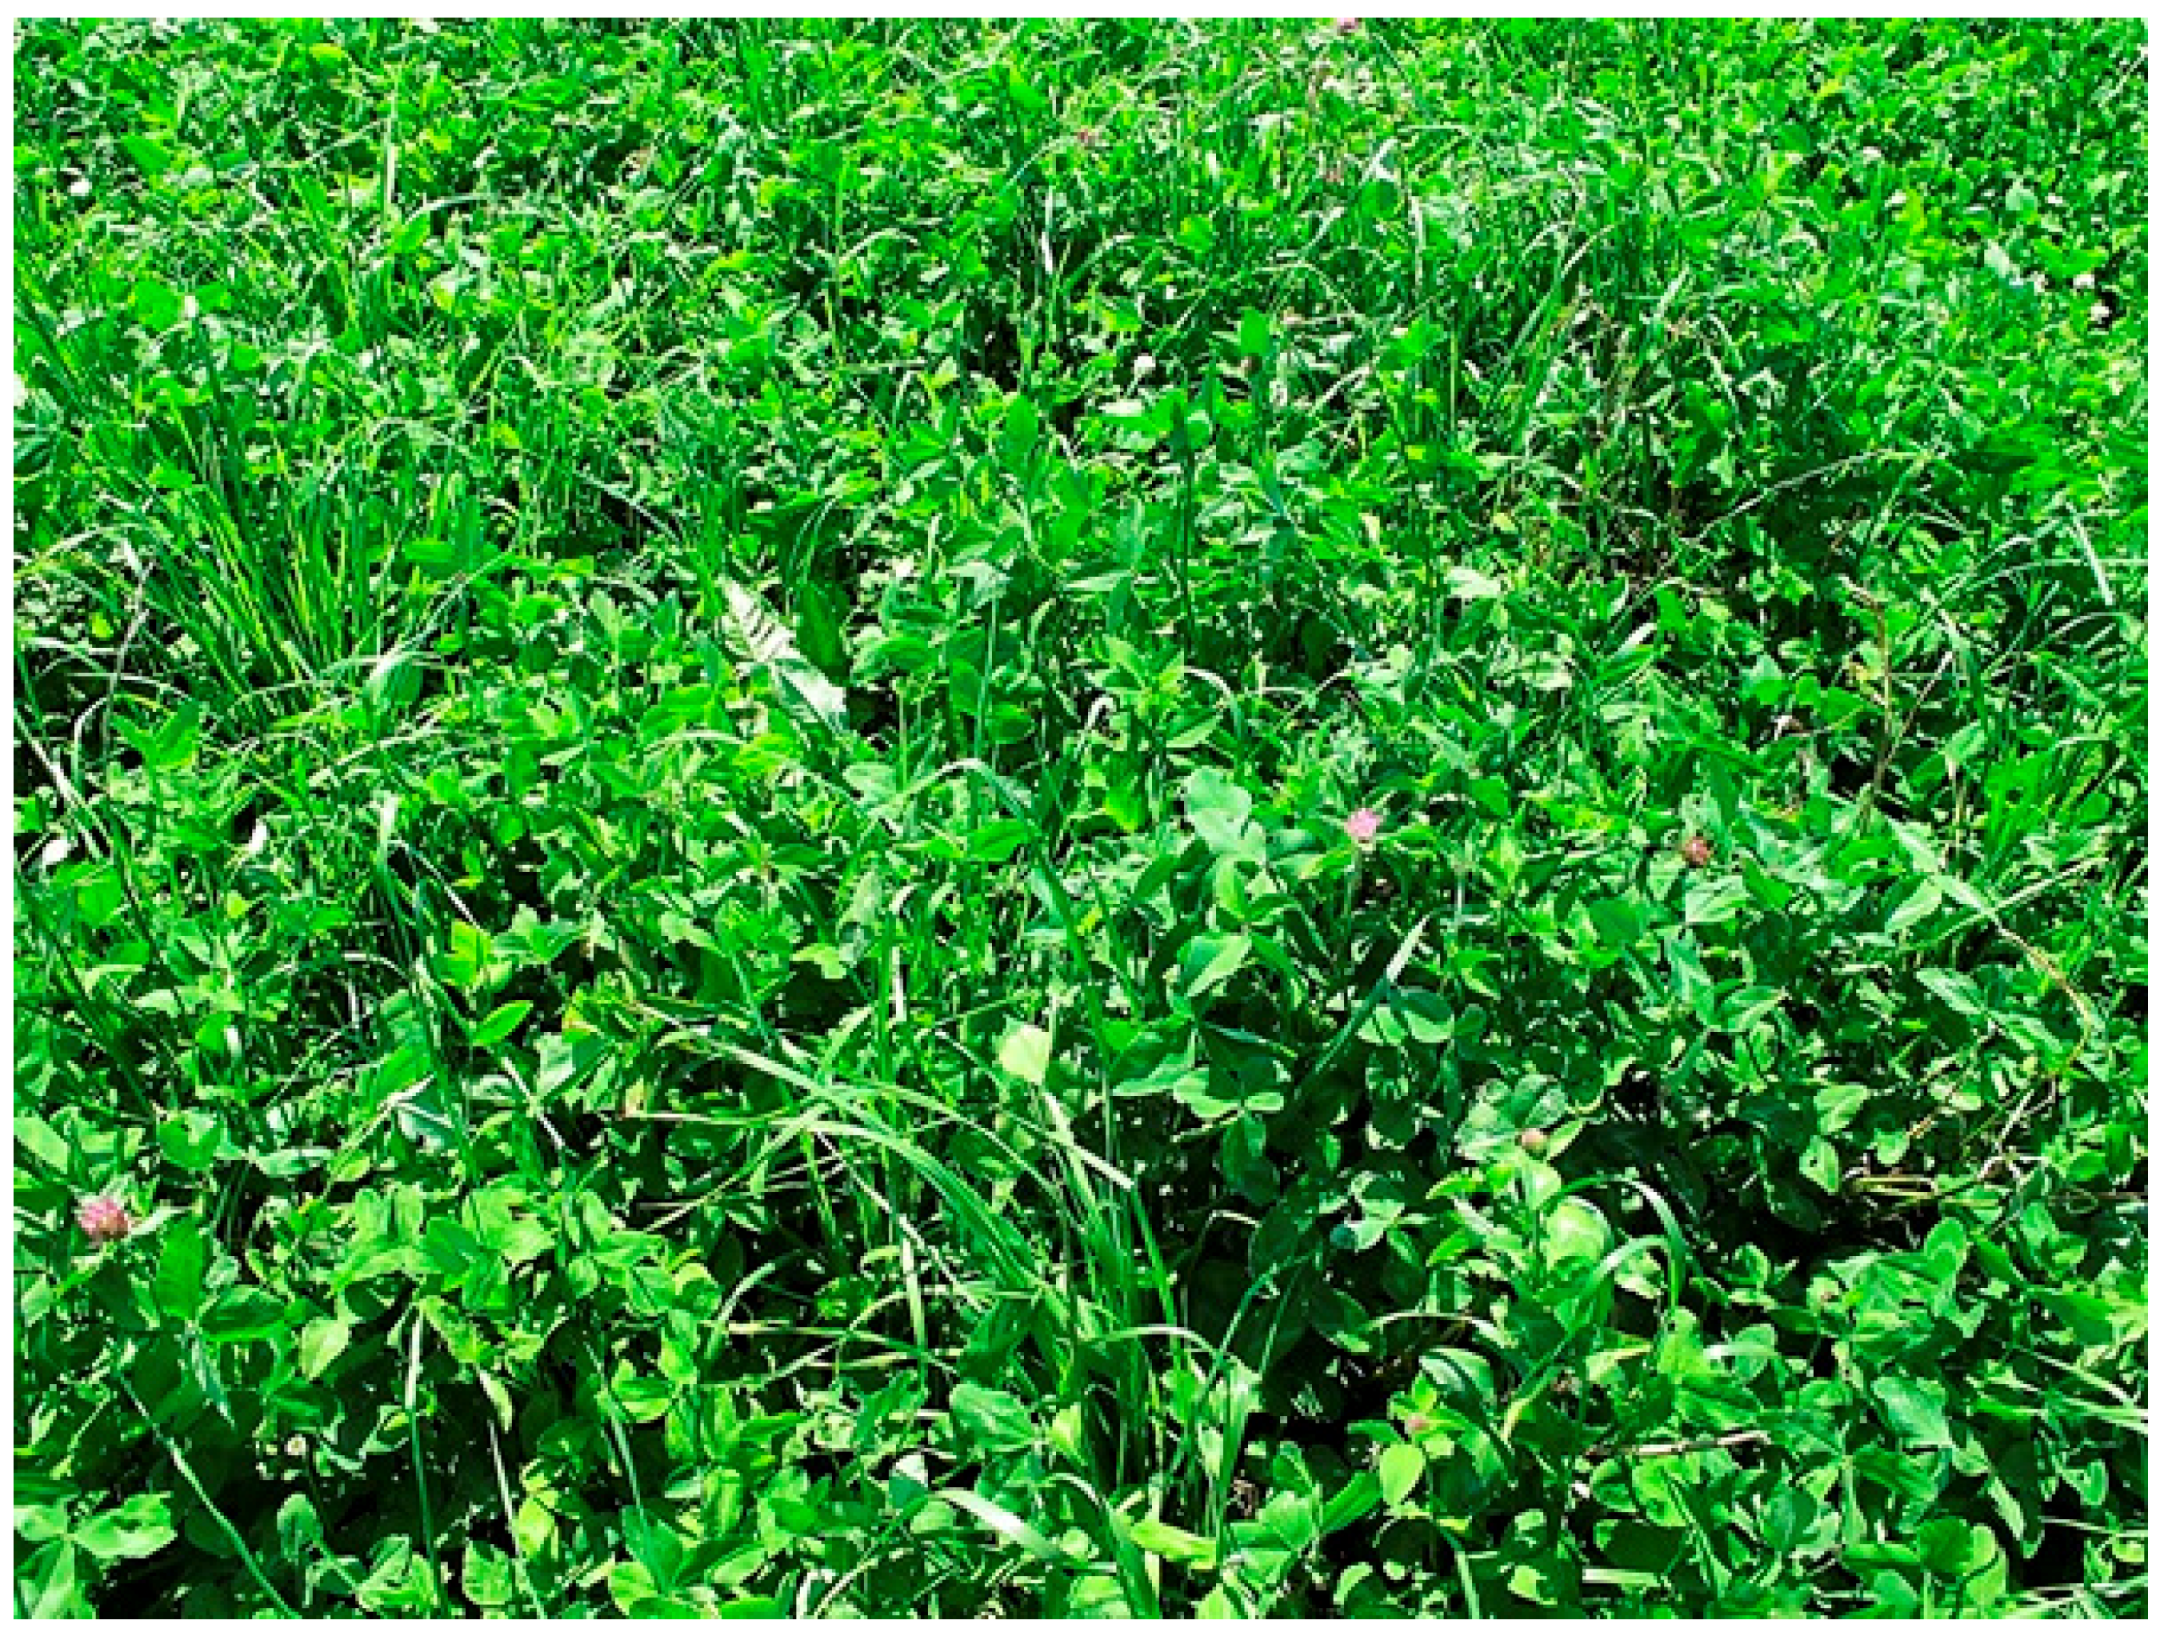
3.1. Grass-Legume Hay

Perennial intercropped systems are a way that farmers can mimic natural systems with native plant species. Pasture and rangeland often resemble traditional grassland landscapes and are the setting for a large amount of intercropping research [30,31]. More managed systems include perennial forage crops typically grown for silage or dry hay (Figure 3). Grass-legume intercropping can be useful for forage production as forage quality in grass monocultures drops precipitously if the grass is harvested after peak maturity (~3 days) whereas, if a legume is included with the grass, forage quality can be maintained for a longer duration (~2 weeks) [32]. Alfalfa (Medicago sativa L.) and cool season perennial grasses are often grown in a mixed intercrop. This intercrop can be particularly beneficial in locations with suboptimal soil drainage because the grasses can fill in areas that are too wet for good alfalfa growth [33]. Common cool season grasses for forage are tall or meadow fescue (Festuca arundinacea Schreb. and pratensis Huds., respectively), timothy (Phleum pratense L.) or orchardgrass (Dactylis glomerata L.). However, having more than one grass species can make the mixture difficult to manage due to variation in the maturity rates of the species, and thus cause difficulty in achieving cuttings at peak forage quality. Mixed stands tend to outperform in yield but have similar forage quality to pure stands of alfalfa in high fertility soils [34].

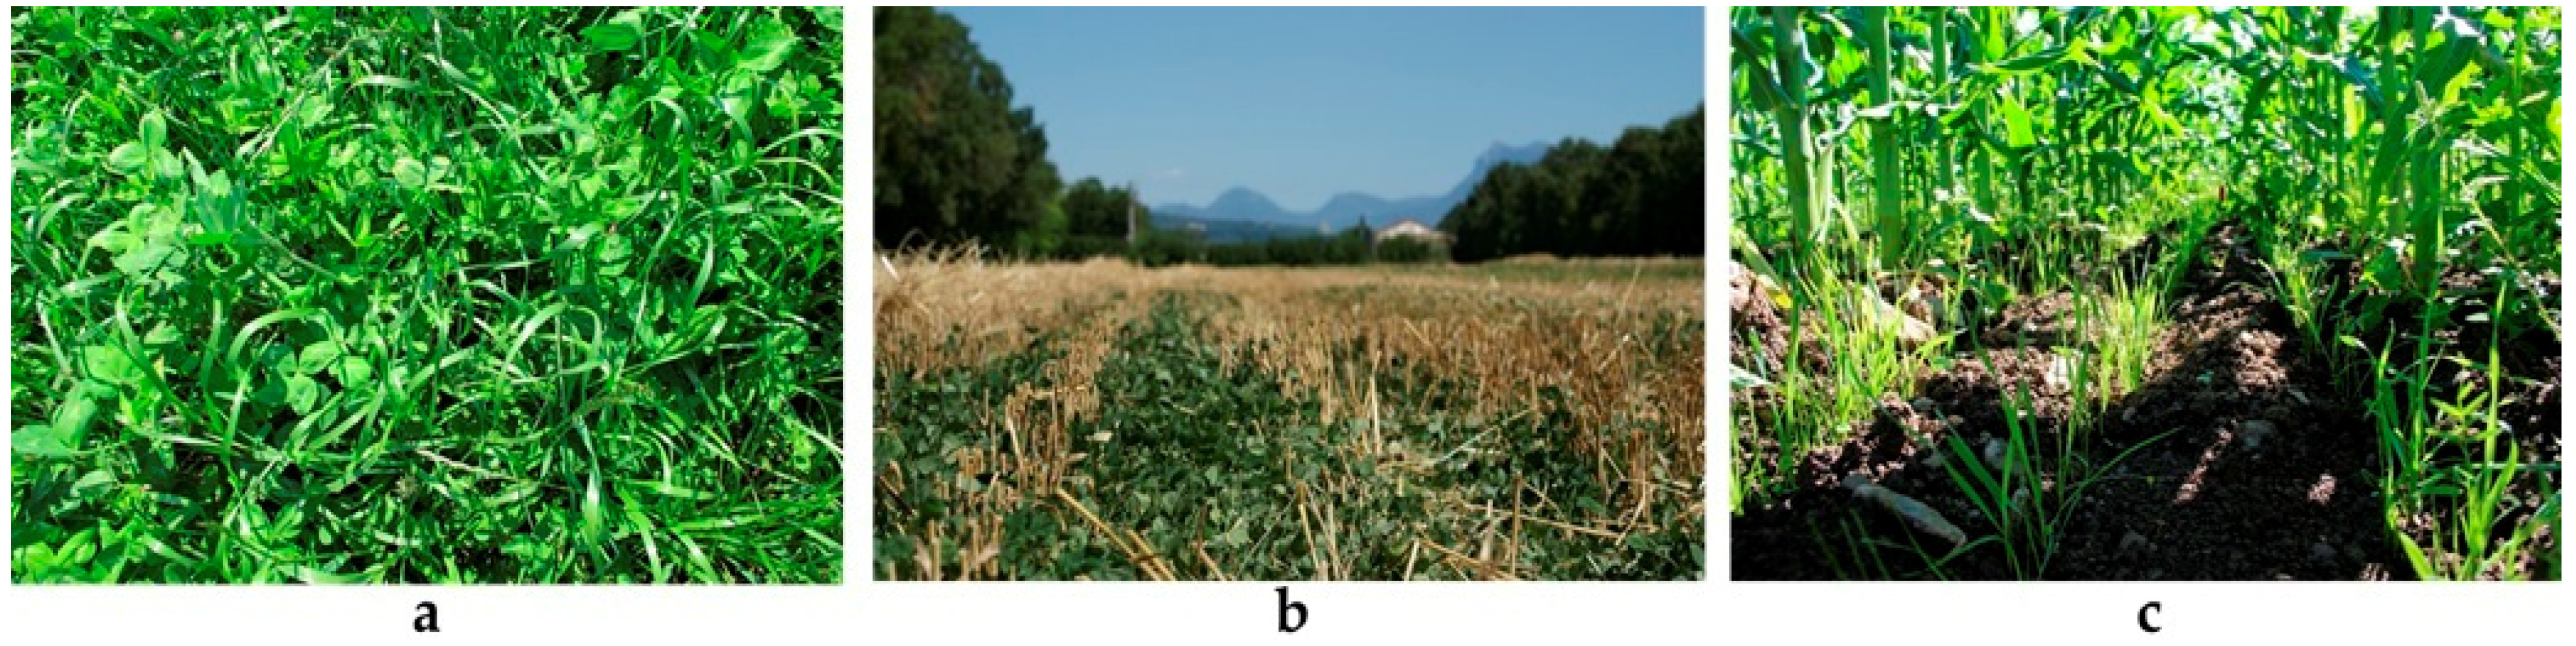
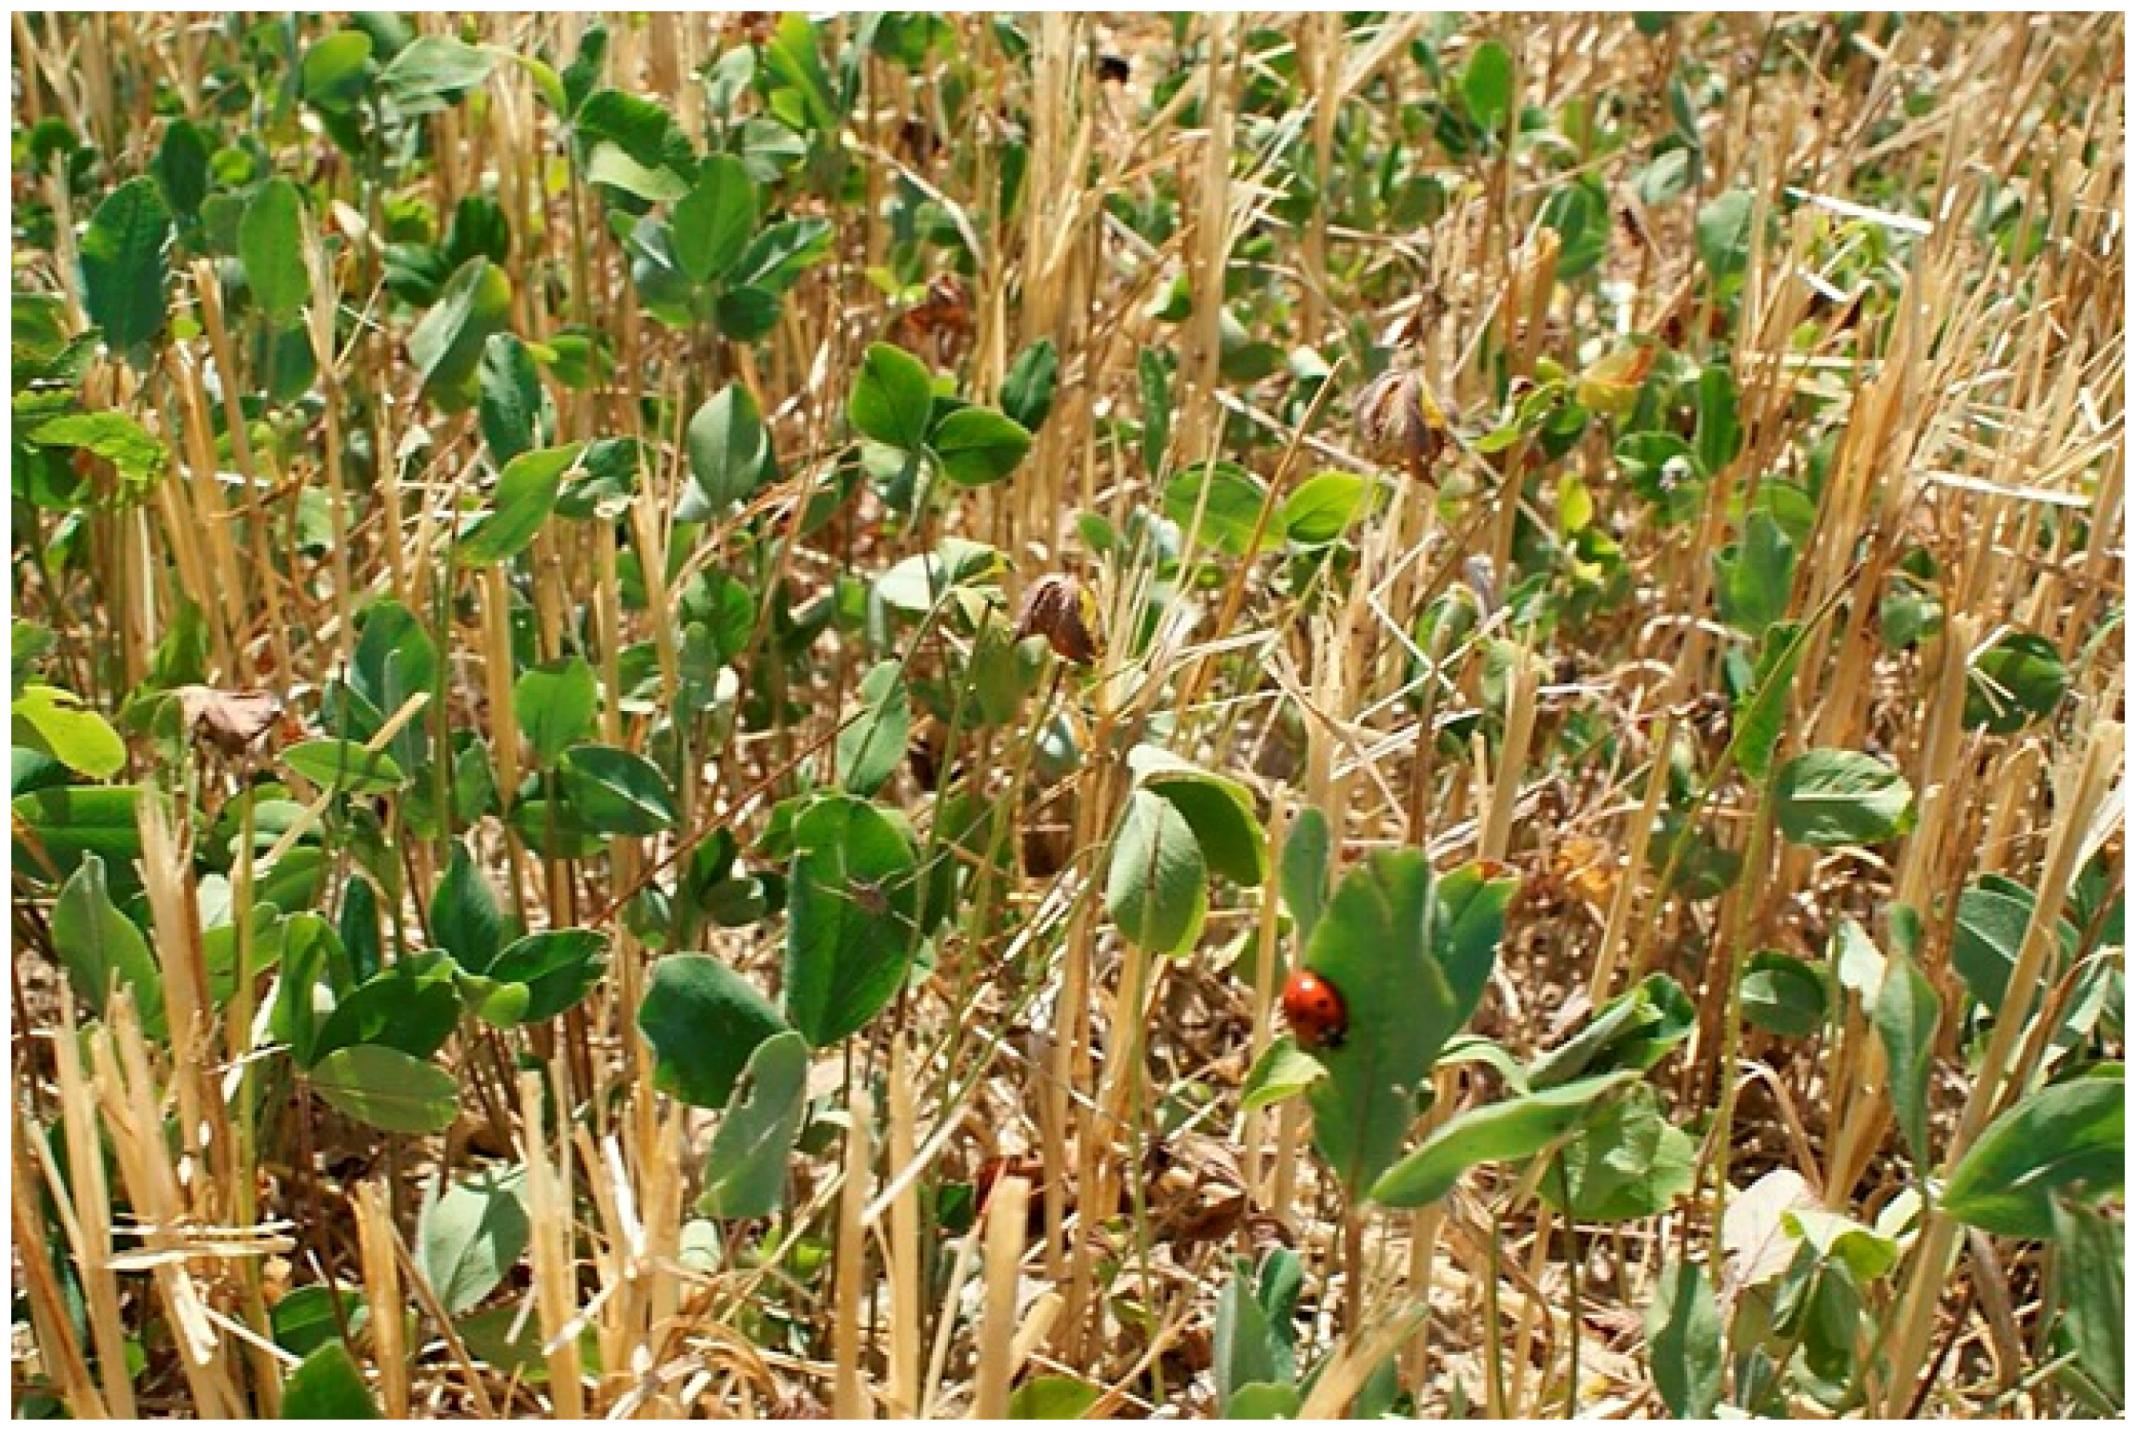
3.2. Winter Wheat and Red Clover

Grain crop farmers often intercrop red clover into winter wheat as a way to increase crop diversity, add ground cover during the winter, and increase labile nitrogen pools [35]. This relay mixed intercropping system works particularly well because of the different phenologies of the two crops which minimizes light competition, as well as differences in nutrient acquisition (Figure 4). While winter wheat is established in the fall, red clover, which persists for 2–3 years, is generally frost-seeded in the early spring when the soil is in a period of freeze-thaw cycles. Generally, the clover establishes, but does not compete with, the wheat and stays small until the wheat is harvested, at which point the clover grows considerably. Interseeded clover typically does not affect the yield of the wheat, and because the clover fixes its own nitrogen, it can decrease nitrogen fertilizer requirements for the subsequent crops [36]. Red clover that is intercropped with wheat also fixes a greater proportion of nitrogen than red clover grown in monoculture. Soil samples across 15 farm fields in Northeastern USA showed more than a 10% increase in biological nitrogen fixation by the red clover intercropped with winter wheat compared to red clover in monoculture [36].

3.3. Cover Crop Mixtures

Cover crops are usually grown between cash crops and are not harvested. Farmers use cover crops to reduce soil erosion, prevent nutrient losses, and suppress weeds, as well as provide other ecosystem services [37]. In areas where soil moisture is an issue, farmers have begun “planting green”, that is, planting their cash crop into overwintering cover crops. A 2017 survey of over 1400 farmers in the USA conducted by the Conservation Technology Initiative Center (CTIC) showed that almost 40% of farmers “plant green”, and more than half of those think that the practice helps with moisture management [38]. A 2-year study in Kansas, USA, found that cover crops increased soil moisture in the spring in comparison to chemical fallow, due to increased crop residue [39]. Most cover crop mixtures are planted after the final harvest of a summer annual crop, and establishment timing often shapes which species are planted [38]. Thus, the majority of the growth happens in the spring. However, most species could also be relay intercropped in mid-summer and that could increase the species options and more evenly distribute labor during the field season. Before planting the cash crop, cover crops are often terminated with mechanical or chemical means and release nutrients during their decomposition. Over the past decade, intercropping with highly diverse (e.g., eight species) mixtures of cover crops has received a fair amount of attention (Figure 5). For example, the CTIC survey showed that 76% of farmers plant cover crop mixtures with 13% planting mixtures of eight or more species [38]. Some of this increased interest in cover crop mixtures can be attributed to early adoption by farmers like Steve Groff [40] and promotion by Natural Resources Conservation Service (NRCS) officials, like Ray Archulata [41].

4. Considerations for Research and Practice

As intercropping can increase crop productivity and the overall sustainability of cropping systems, it is an important tool to facilitate sustainable intensification. Increasing crop diversity with intercropping can be used to provide supporting, regulating, and cultural ecosystem services. However, intercropping can be knowledge intensive and likely requires a greater understanding of ecology and the interconnectedness between crops and their environment to fully realize the potential benefits. Researchers can help to advance intercropping by carefully considering experiment designs and metrics to assess intercropping. Concurrently, farmers can improve their management practices by thinking critically and strategically about what intercropping practices would be most beneficial for their intended goals.

4.1. Fundamental Measurements

Measuring plant-plant interactions and gathering empirical evidence is important for understanding how, and to what degree, plants affect each other when planted together. If complementarity is the general positive effect, we define interference as the general negative effect from intercropping, for example, competition or allelopathy. Competition is a specific type of interference involving the capture of limited resources.

4.1.1. Species Selection and Seeding Rates

It might seem obvious, but when selecting species for intercropping, all species should have a reasonable chance of growth and survival for a period after sowing. For example, in relatively cold regions such as the Northeastern United States, highly diverse crop mixtures that contain warm season annuals (e.g., soybean) might not establish well when planted in the fall, which can add to seed costs and increase the cost-to-benefit ratio of the intercrop [42]. Likewise, some species are simply poorly suited for intercropping; these species are often highly (e.g., buckwheat (Fagopyrum esculentum Moench.) [43] or weakly (e.g., cowpea) competitive [13]. Thus, including them in an intercrop may lead to asymmetric competition when one or more species suppresses the growth of another species.
Selecting justifiable seeding rates is tantamount to intercropping research because it likely shapes the outcome of the experiment. There is no one universally correct seeding rate for a species because the goals and the conditions of an intercrop are context-specific. Two main approaches exist when selecting seeding rates. The first uses an equal number of plants from each species for an intercrop and assumes that plants of different species are equivalent. This introduces a discernable bias into the experiment design because species are not equivalent, but this approach might be simpler to explain and could serve as a good starting point for exploratory research. A second approach uses equal proportions of seed based upon the standard seeding rate for each species. While this does not assume that different crop species are equal, it often means that the number of individual plants differ greatly among crop species. For instance, if you are making a biculture with each species seeded at 50% of their standard seeding rate, you might end up planting 50 seeds of the first species and 500 seeds of the second species.
Another reason to consider standard seeding rates when intercropping is because it allows one to account for size bias. Size bias occurs in many intercropping experiments because the competitive effects of larger plants are exaggerated compared to smaller species [44]. The effects of size bias are greater in shorter duration experiments and tend to diminish over time [45]. One approach for addressing size bias is to grow candidate species in monocultures in a range of densities and then use a response variable (e.g., biomass production, weed suppression, nitrogen uptake, etc.) to determine the functional equivalents of each species that result in similar responses. Poffenbarger et al., 2015, used this approach to study weed–crop competition by growing corn in a replacement design with giant foxtail (Setaria faberi L.) or smooth pigweed (Amaranthus hybridus L.) after determining that four corn plants were functionally equivalent to 36 plants of either weed species in terms of nitrogen uptake [46].

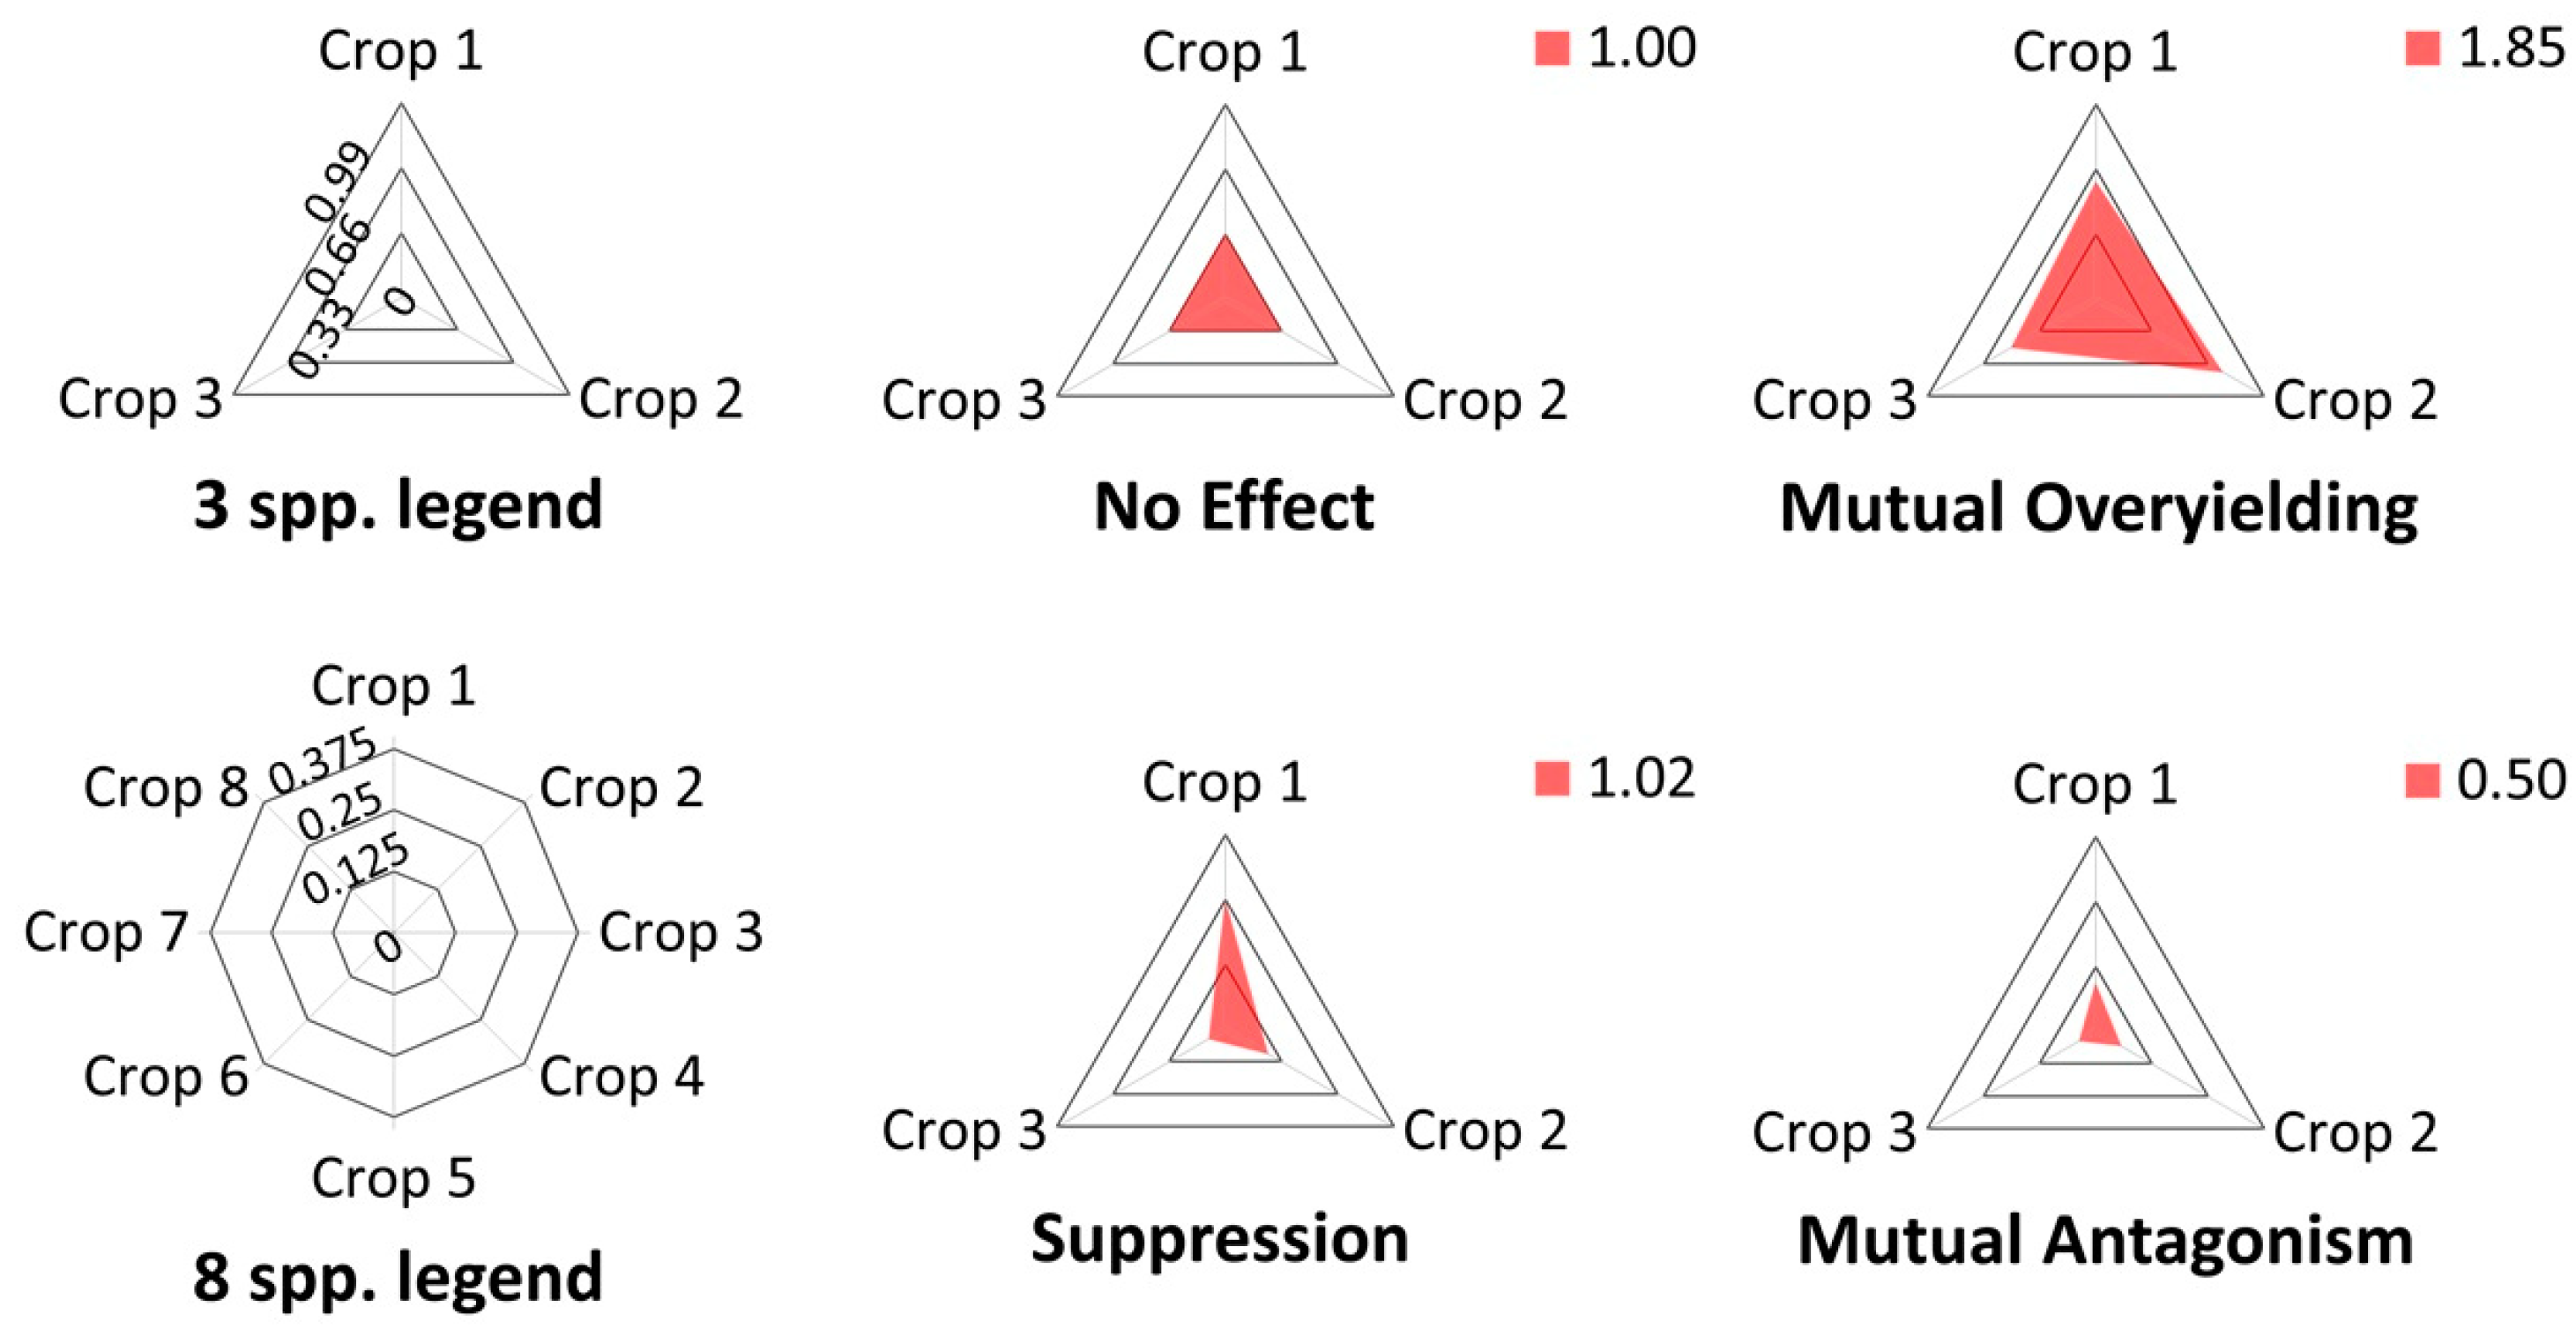
4.1.2. Evenness and Crop Growth Rate

To understand the dynamics of an intercrop, one can measure crop growth at different times throughout the season and calculate the crop growth rates (CGR) of the species in the intercrop (Equation (1)). As faster-growing species can often dominate slower-growing species when grown together in a mixed intercrop scenario, CGR can be interpreted as a measure of competitiveness. If multiple mixtures are being compared, the CGRs for species in the different mixtures can be used to evaluate differences in competition across the mixtures. In the following equation for CGR, t1 and t2 are the times of sampling:
C G R =   B i o m a s s t 2   B i o m a s s t 1 t 2   t 1
Species evenness measured from crop biomass data is another metric that can be used to evaluate competition outcomes (Equation (2)). It a measure of the relative abundance of species in an intercrop. Ranging from 0 and 1, an evenness value of 1 means that there is an equal amount of biomass for each species in the intercrop. The numerator is the proportion (P) of the amount of biomass of a species (i) in an intercrop multiplied by the natural log (ln) of that proportion and summed across the species present in the intercrop. The denominator is the natural log of the number of species (S) in the intercrop. In a comparison of warm season annuals that were grown in monoculture and in three- and four-species intercrops, the intercrops with high species evenness were often composed of species that had similar growth rates, and species evenness tended to be lower in intercrops that were composed of species with different growth rates [14]:
S p e c i e s   e v e n n e s s = P i l n P i ln ( S )

4.1.3. Stability

As discussed in Section 2.3.1 above, a greater CV indicates a greater dispersion across environments, and thus, a decrease in stability. Despite the simplicity of evaluating CVs and assessing yield stability in intercropping studies, such analyses are rare in the intercropping literature. Reiss and Drinkwater noted in their 2018 meta-analysis of intraspecific diversity that only a few of the 91 studies evaluated stability, despite having results over multiple years and/or sites [12].
Another way to measure the stability of intercrops across sites and/or years is to conduct a stability analysis. Mostly used in plant breeding programs, stability analysis assesses the variability of crop performance across different environments [47]. Typically a stability analysis involves linear regression between the mean crop biomass for each treatment (y-axis) and the environmental mean yield, which is the mean crop biomass for all treatments in one environment (x-axis) [48,49]. Regressions with high intercepts and low slopes indicate good performance across a range of environments, while steeper slopes indicate a greater yield response due to improved conditions, but depending on the intercept, also poor performance in sub-optimal environments.

4.2. Quantifying Complementarity

In general, plants can experience two types of competition. Intraspecific competition pertains to the competition among individuals of the same species, i.e., the competition a crop faces from increasing its density. Interspecific competition pertains to the competition between different species. Importantly, both components of competition occur simultaneously and are often not parsed out by researchers. When exploring complementarity, it is important to recognize that experimental design dictates the types of analyses that are possible and what kind of conclusions can be made. While not a review of competition metrics, for which we recommend the works of Weigelt and Jolliffe (2003), Bedoussac and Justes (2011), and Connoly et al. (2001) [44,50,51], we highlight how experiment design and data collection methods influence options for analyses.

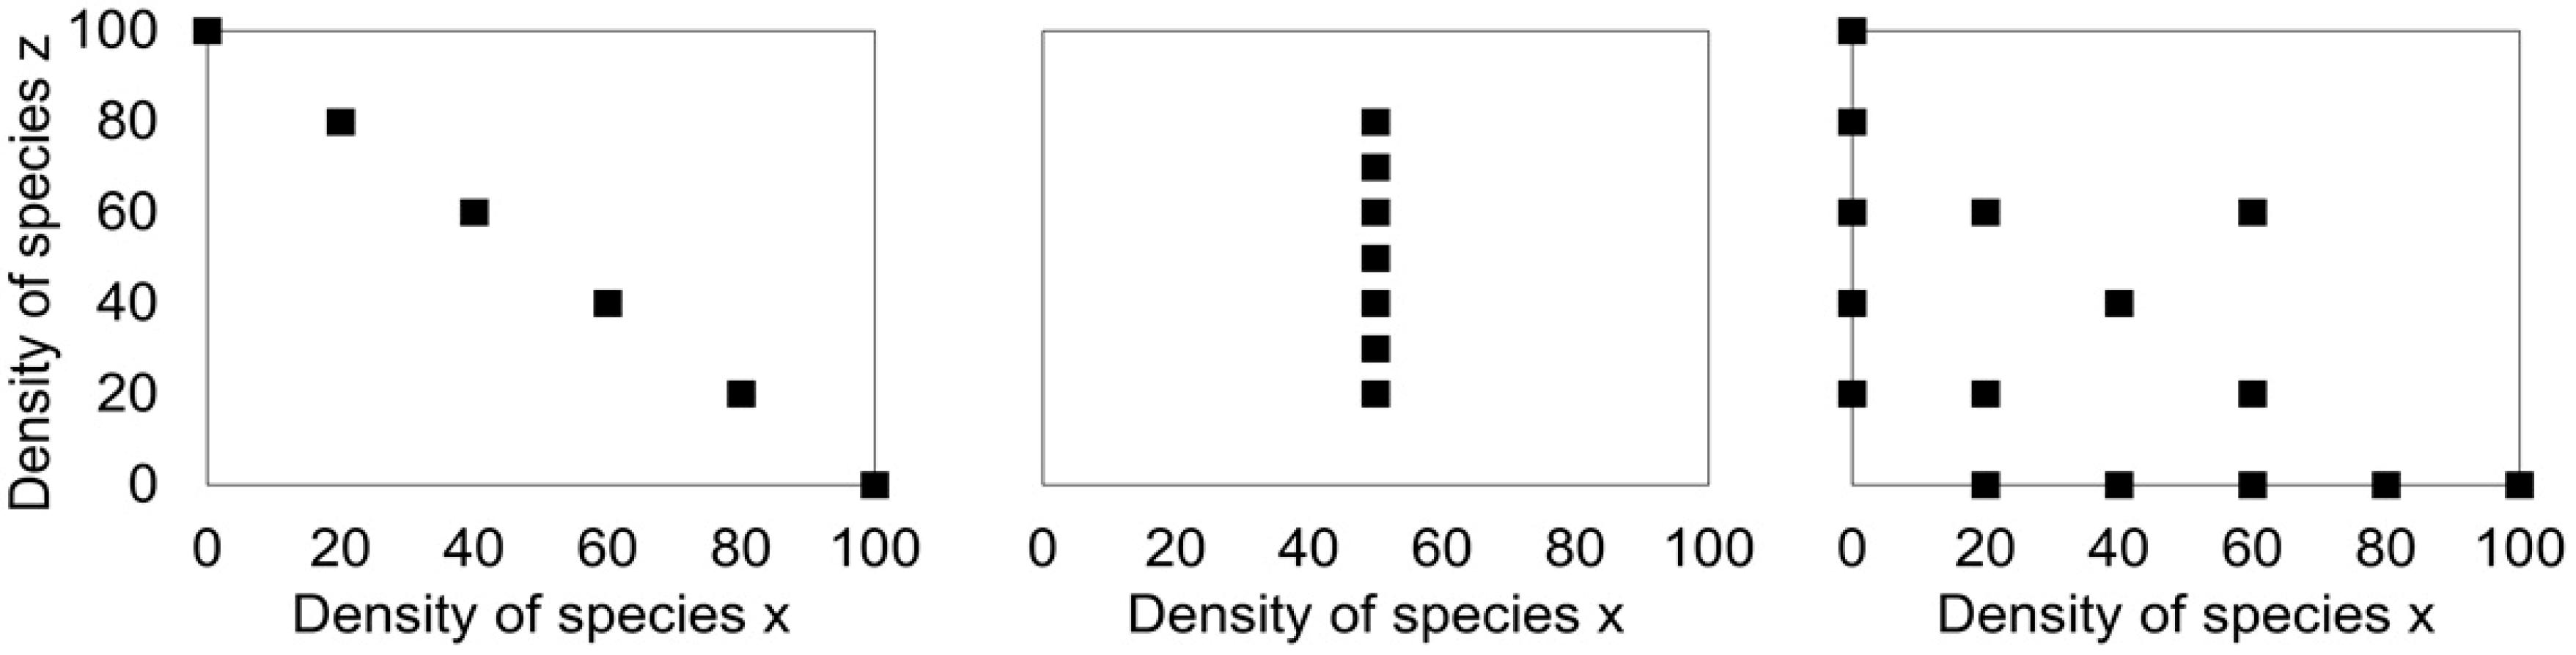
4.2.1. Replacement and Additive Experimental Designs

Replacement and additive designs are the two most commonly used experimental frameworks for intercropping research [52]. Many intercropping studies examine mixtures at only one seeding rate. In a biculture, replacement and additive design refers simply to whether the seeding rate of the biculture is similar to a monoculture or doubled (e.g., if 2 is the standard monoculture seeding rate for species A and B, in a biculture, a replacement design would be 2A + 2B = 1A1B and an additive design would be 2A + 2B = 2A2B). However, an intercropping study where the mixture is grown at a single seeding rate provides limited insight into the potential for complementarity between the species.
Replacement, sometimes called substitutive, designs hold the total density of the intercrop constant and vary the ratio among included species (Figure 6), meaning that the results of the experiment will depend on the total density. Rather than holding a specific density constant, replacement designs are also constructed when a proportion of a monoculture seeding rate is used for each species and the sum of those proportions do not surpass 1. For example, a replacement design is used to construct a three-species intercrop when the proportions of each species are one-third of their respective monoculture rates. Whether the total density of the intercrop is held constant or the monoculture seeding rate of each species is held constant, the crop densities need to be justified (e.g., standard seeding rates or functional equivalents). Moreover, because the densities of all species are being changed in replacement designs, the effects of intraspecific and interspecific competition are confounded.
Additive designs hold the density of one species constant while varying the density of other species (Figure 6). Because changes in the constant-density species can be measured as an effect of changing the other species’ densities, interspecific competition can be measured, but intraspecific competition cannot. However, similar to replacement designs, the density of the main species (e.g., species x in Figure 6b) must be justified. A main criticism of additive designs is that the observed benefits of the intercrop (e.g., greater biomass than the monocultures) are confounded with the greater plant density in the intercrop compared to the monocultures. Since farmers are often interested in reducing input costs, the greater amount of seed required for intercrops when using an additive design may result in lower adoption unless other benefits from higher plant densities are clear.

4.2.2. Comparing Intercrops to Monocultures

Many intercropping experiments also grow the intercropped species in monoculture. Although this adds more treatments to an experiment, growing species in monoculture allows for greater quantification of complementarity. Land equivalent ratio (LER) (Equation (3)) is the most common metric used to assess intercrops compared to their respective monocultures [53]. It is the sum of ratios of the biomass of each species in an intercrop to the biomass of those species in monoculture and describes the amount of land that would be required to obtain the yield of each species in an intercrop if grown as a monoculture.
LER =   I C a M a +   I C b M b + +   I C n M n
where IC is the intercrop biomass and M is the monoculture biomass and a, b, …, n are the species. An LER of 1 means that neither species performs better or worse in an intercrop than they do in monoculture. An LER above 1 means that the intercrop uses land more efficiently, and below 1, less efficiently. The Relative Yield Total (RYT) is calculated in exactly the same way [54].
A partial LER, a single term in the LER equation (i.e., I C a M a ), can provide an indication of competitive interactions between different species grown together [13,51]. When illustrated in radar plots across treatments and environments, partial LER values detail the size and shape of the total LER and visualize emergent patterns in competition (Figure 7). Partial LER values contribute to a more substantial understanding of competition and complementarity than simply whether the LER was above or below 1.

4.2.3. Response Surface Experimental Designs

Response surface designs are more powerful than replacement or additive designs because the effects of both intra- and interspecific competition can be measured (Figure 6). They have also been referred to as factorial designs, complete additive designs, replacement series, or addition series [55]. Response surface designs vary the densities of two or more species. Treatments include a range of monoculture densities and different proportions of each species in an intercrop. In addition to the treatment structure in the response surface design that is illustrated above, Inouye (2001) compared various forms of response surface designs and their effects on model output [55]. The downside to this design is its complexity which likely requires a greater number of experiment plots. If regression is the primary tool for data analysis, the inclusion of multiple levels across the range of crop densities is more important than treatment replication at a specific density in response surface designs [55].

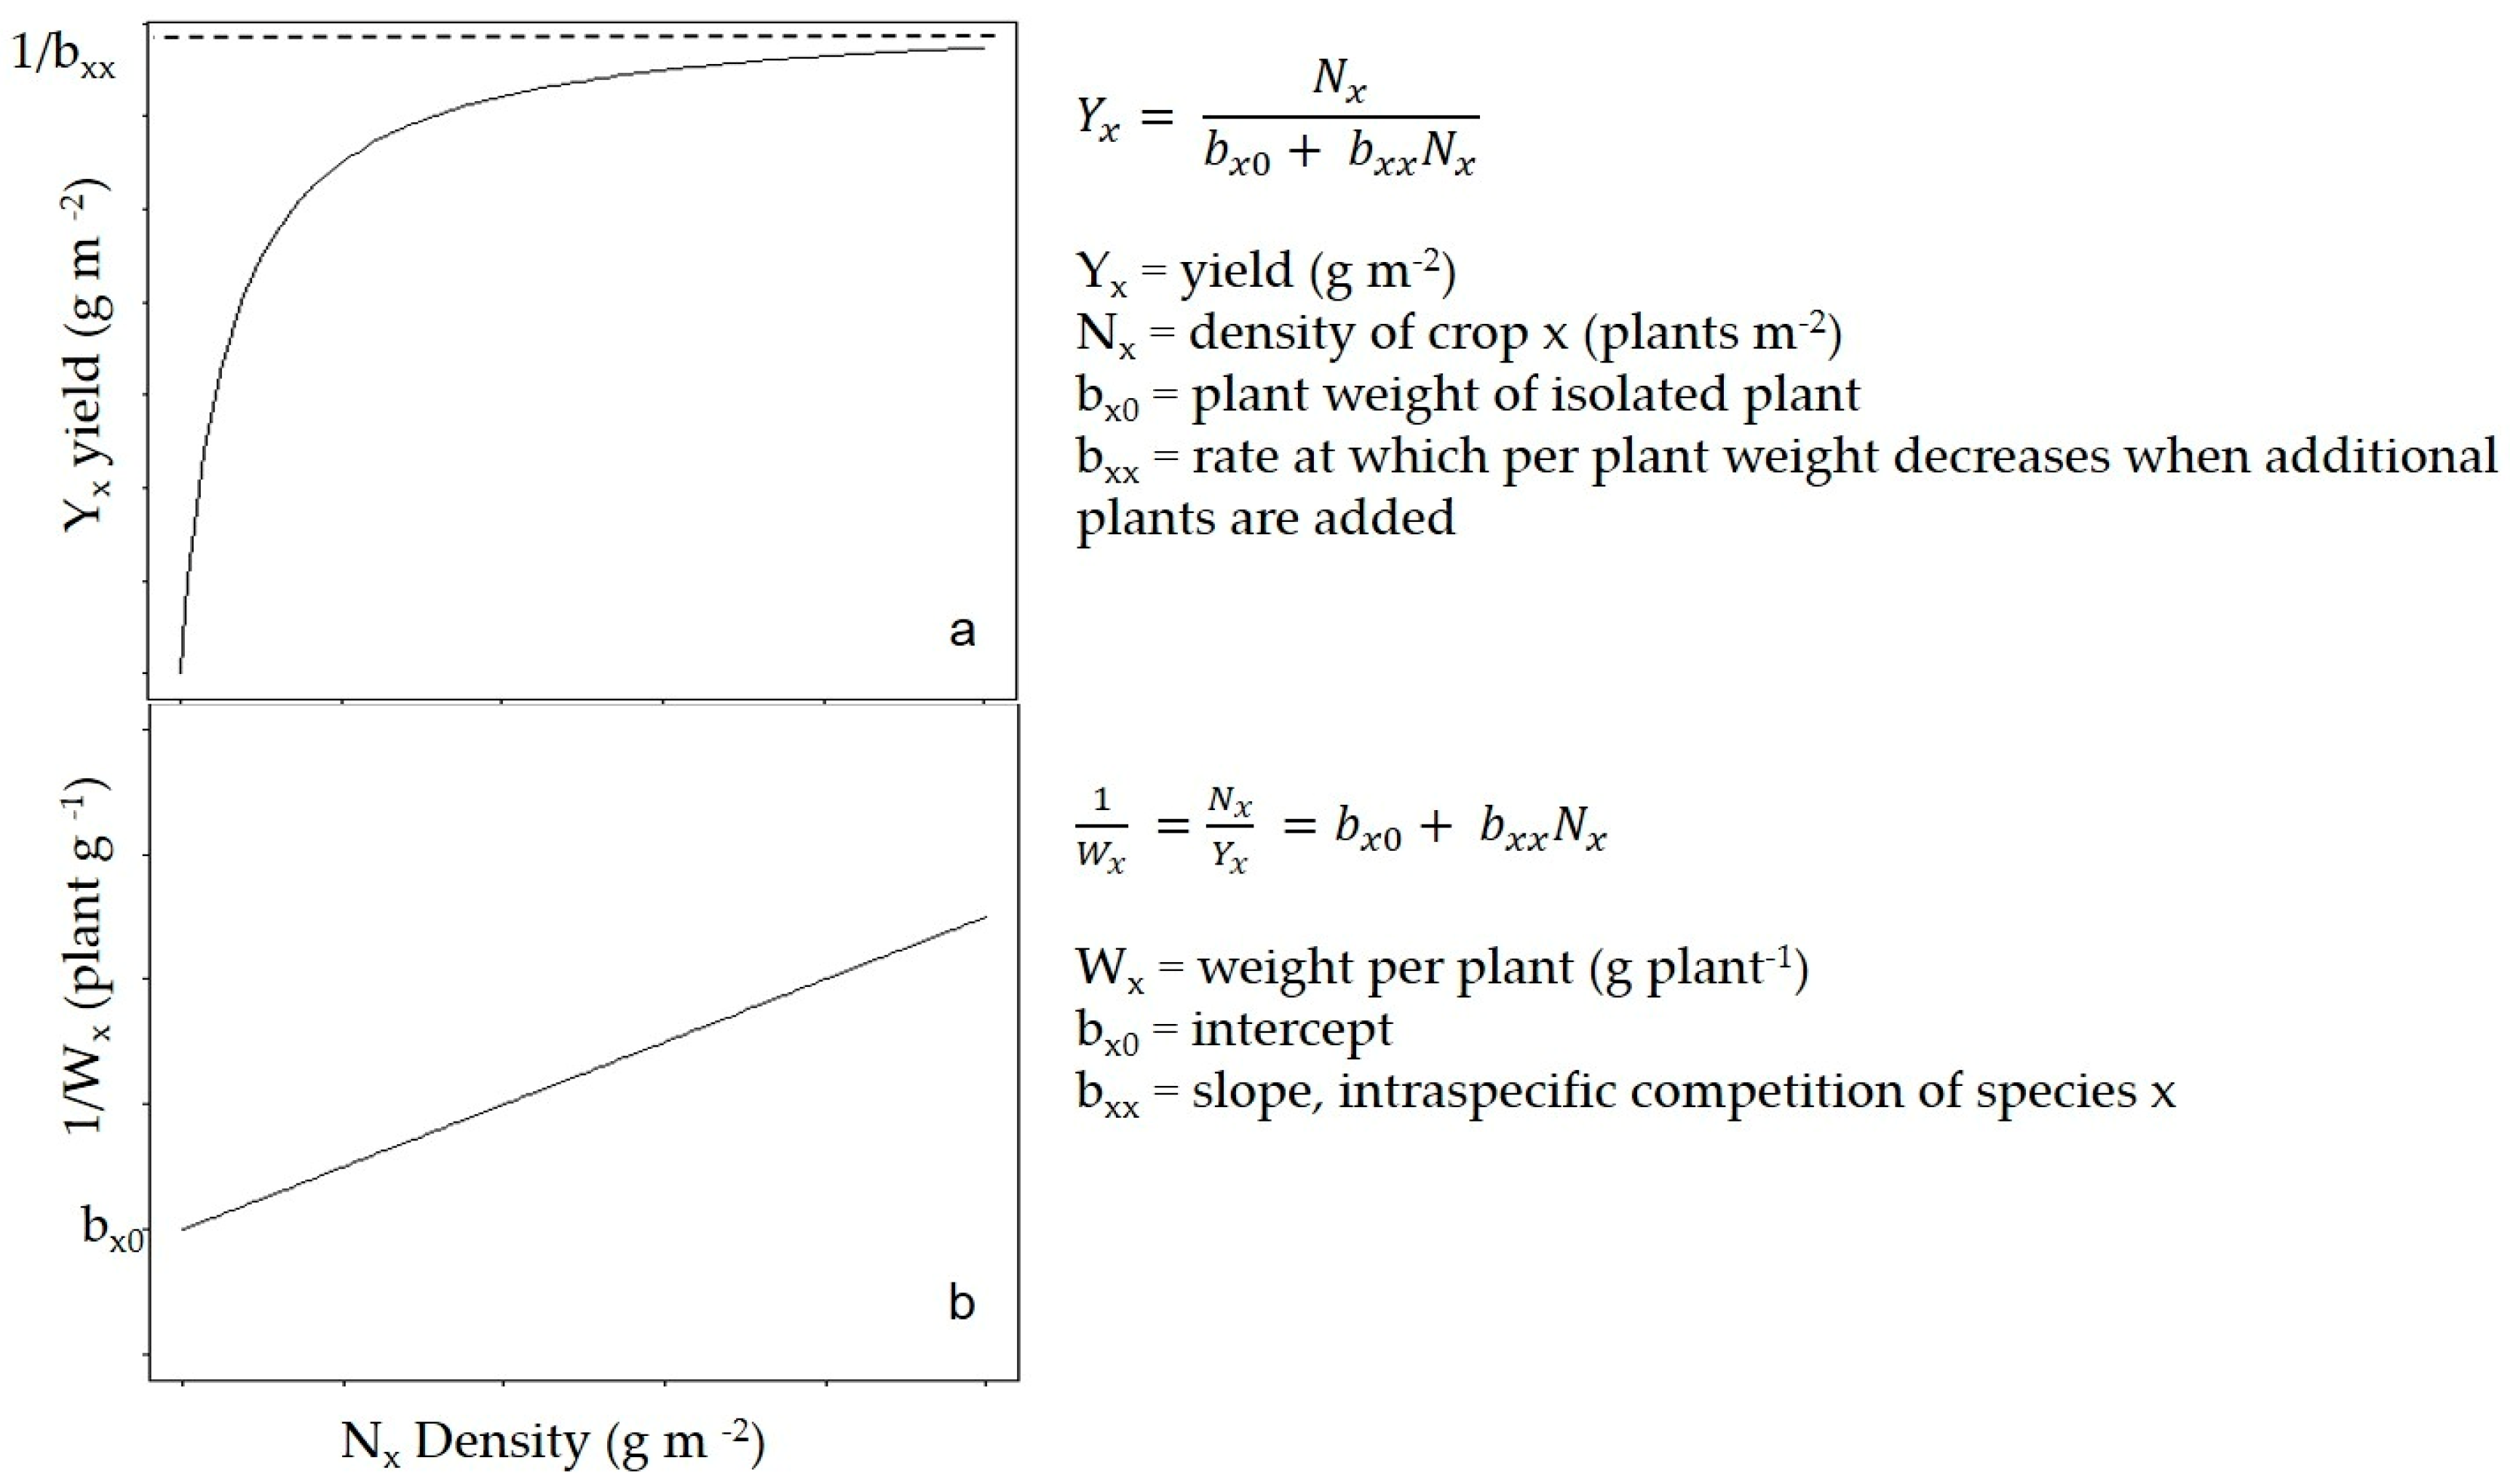
4.2.4. Parsing out Intra- and Interspecific Competition

Response surface designs allow for more direct connection between simulation models and empirical agronomic approaches. Although data from simpler experiment designs can be used to fit competition models and calculate competition coefficients of species, the manipulation of the densities of both species at the same time by response surface designs, leads to more accurate calculation of coefficients. Knowing the competition coefficients means that more effective intercrop mixtures can be designed to limit competition and increase complementarity [55].
The fundamental variables of crop competition models are yield and density. Willey and Heath (1969) described the hyperbolic relationship between these variables (Figure 8) [56].
The average weight per plant can be calculated from a regression analysis of the yield-density relationship. That is, we can understand how increasing the density can increase the yield and the per plant weight, up to a point where adding more plants does not change the yield and the per plant weight declines. The reciprocal of this hyperbolic relationship is linear. Thus, the reciprocal of the average weight per plant is equal to the intercept, bx0 (plant g−1), and the slope, bxx (m2 g−1). The term 1/bx0 (g plant−1) describes the predicted biomass of an isolated plant that faces no intraspecific competition (i.e., the theoretical maximum weight of a plant) (Figure 8). The slope describes how the per plant weight (Wx) decreases when additional plants of the same species are added. Thus, bxx represents intraspecific competition. Dividing bxx by bx0 (i.e., taking the ratio of the rate of weight change and the theoretical maximum weight of a plant) normalizes the intraspecific competition and allows for comparison of intraspecific competition across species regardless of size.
Spitters in 1983 [57] assumed that additional species also affect 1/Wx in a linear fashion, allowing the hyperbolic and linear equations to be expanded (Equation (4)). In this work, Spitters used an additive design with corn at different densities, in the presence and absence of groundnut (Arachis hypogaea L.). The presence of the second species caused an explicit shift in the y-intercept as a result of interspecific competition [58]. The causal effects of an additional species are more dynamic when using a response surface design as data from both species are accounted for simultaneously to determine more realistic competition coefficients. Regardless of the design, the term bxz is a measure of interspecific competition of species z on species x. Because it is important in intercropping to understand how both species affect each other, calculating the influence of species x on species z can also be done by adjusting the equation and replacing variables and parameters associated with species x with variables and parameters associated with species z. These interspecific competition coefficients can also be normalized by dividing the term by the appropriate y intercept (e.g., bxz/bx0):
Y x =   N x b x 0 +   b x x N x +   b x z N z
More conclusions about competition can be drawn by taking the ratio of intraspecific competition to interspecific competition. The relative competitive ability (RC) of species x to species z refers to the number of plants of species x that can be replaced by plants of species z without changing the weight per plant of species z (Equation (5)) [58]. The inverse of RC is the substitution rate and provides a measure of equivalence between species [59]. Both are independent of the density of either species in an intercrop:
R C =   b x x b x z
The niche differentiation index (NDI) is another ratio that uses the four competition coefficients (Equation (6)). If the ratio is above 1, niche differentiation is thought to exist because intraspecific competition is greater than interspecific competition, meaning that the plants of one species are more competitive with other plants of that species than to the plants of a different species. Niche differentiation points to more resource partitioning by the intercrop, and hence, greater complementarity [58]:
NDI   =   b x x × b z z b x z × b z x

4.3. Standardizing Data Collection

Researchers should be clear about their research questions and base their experiment design, data collection, and analyses on the hypotheses they are testing. We recommend Competition and Succession in Pastures [60] and the Statistical Design and Analysis for Intercropping Experiments [61] as useful resources when designing experiments.
For greater, wider use of intercropping research, methods and site conditions need to be reported in as much detail as possible. Here we list some suggestions on criteria to include when reporting intercropping studies, along with some units we think would be most useful as a starting point (Table 1).
Sharing data can increase the impact of intercropping research by allowing researchers to validate research results, reuse data for further analyses and modeling, and conduct synthetic and comparative studies [62]. Many publishers or funders require data to be shared either in a data repository [63] or a discipline-specific data center. Some of these places require specific formats and might come with templates, easing the burden of preparing data for sharing. Currently, no accessible, agriculture-specific data center exists, but Table 2 describes a list of possible homes for intercropping data sets in agricultural landscapes. Characteristics for a good repository are that data is discoverable, accessible, and preserved for the long-term [64].

4.4. Temporal and Spatial Aspects of Complementarity and Multifunctionality

It is important to recognize how time influences intercropping outcomes and how valuing ecosystem services beyond crop productivity can affect which strategies are best. Indeed, managing multiple ecosystem services reduces the need to focus narrowly on intercrops that result in facilitation and transgressive overyielding. Increased crop biomass in an intercrop can increase some ecosystem services, like weed suppression [69,70]. However, there are many ecosystem services, like providing a habitat for beneficial insects and increasing the forage quality, which are not driven by biomass production. Finney and Kaye (2017) called for a shift in focus away from increasing biomass production and towards increasing ecosystem services [71].
Interactions between crop species in an intercrop vary across temporal and spatial scales. Although many researchers acknowledge the differences between annual and perennial systems and are aware that annual systems do not allow for the slow-emerging benefits of diversity found in perennial systems [71,72], findings from perennial systems are often used to justify expectations for annual intercrops, particularly from grassland experiments [30,73,74,75]. The reasoning behind this is likely two-fold: (1) ecological studies of agricultural landscapes draw from ecological literature that is largely based in “wild” or “natural” ecosystems and (2) practices that aim to increase crop diversity are pragmatically incremental so that other changes to management are minimized [76]. In an experiment conducted in Illinois in corn–soybean-based cropping systems, Exner et al. (1999) found that despite the clear benefits from strip intercropping the two cash crops, farmers were reluctant to adopt the practice due to the management changes that are required [77,78].
The dynamics of perennial cropping systems are more complex regarding potential nitrogen limitations with legume nitrogen-fixation, symbiotic relationships with soil microbiota (e.g., rhizobacteria, arbuscular mycorrhizal fungi), and relationships with macrofauna (e.g., habitats). Since perennial intercrops persist for multiple years, decomposition, and thus mineralization of nitrogen, has greater time to occur, leading to increased potential for facilitation and transgressive overyielding. Perennial species in an intercrop also have a longer time to fill into their respective niches, leading to a potentially wider range of resource partitioning and also allowing for greater differences in species maturity (e.g., agroforestry, silvopasture).
Annual intercrops, on the other hand, are more likely to exhibit resource partitioning than facilitation [6], particularly in grass-legume intercrops, as the amount of rhizodeposition of nitrogen from legume to non-legume species is often negligible [79,80]. Some researchers have suggested that transgressive overyielding should be a goal of intercropping (e.g., Duchene et al., 2017). However, transgressive overyielding might be an unnecessarily high bar to determine if an intercrop is preferable to its respective monocultures. Rather, similar performance to the monocultures seems to be a more reasonable goal in annual intercropping systems, especially if the increased crop species diversity enhances an ecosystem service. Moreover, the goal of transgressive overyielding is inherently biased against highly diverse mixtures as it becomes increasingly difficult for species to perform better in an intercrop than in each monoculture as more species are included. This is also the case for the mutual overyielding discussed above, where it becomes increasingly unlikely that mutual overyielding will occur as the crop species richness of an intercrop increases (Figure 8). In a meta-analysis of biodiversity and productivity, Cardinale (2011) found that polycultures rarely outperformed their most productive species [81]. This corroborates early reviews of such literature and findings from earlier meta-analyses of grassland and agronomic studies [82,83].
Annual species have been bred for their rapid productivity and have a relatively short lifecycle. Relay intercropping is one strategy to circumvent competition in annual intercrops, but is typically used with only two crop species. A quantitative synthesis of intercrop system properties and species trait combinations found that the temporal niche differentiation contributed substantially to high LERs in systems combining C3 and C4 species [84]. In addition to relay intercropping and managing to promote temporal niche differentiation, asymmetric competition in intercrops can be minimized by (1) selecting crop species with similar growth rates [13]; (2) seeding crop species at appropriate densities [46]; and (3) managing crop growth to reduce competitiveness of the dominant species. For example, farmers can tailor the seeding rates of each species to account for differences in competitive ability, to adjust ratios based on soil nutrient conditions or timing, and to mow intercrops to reduce the dominance of aggressive species.

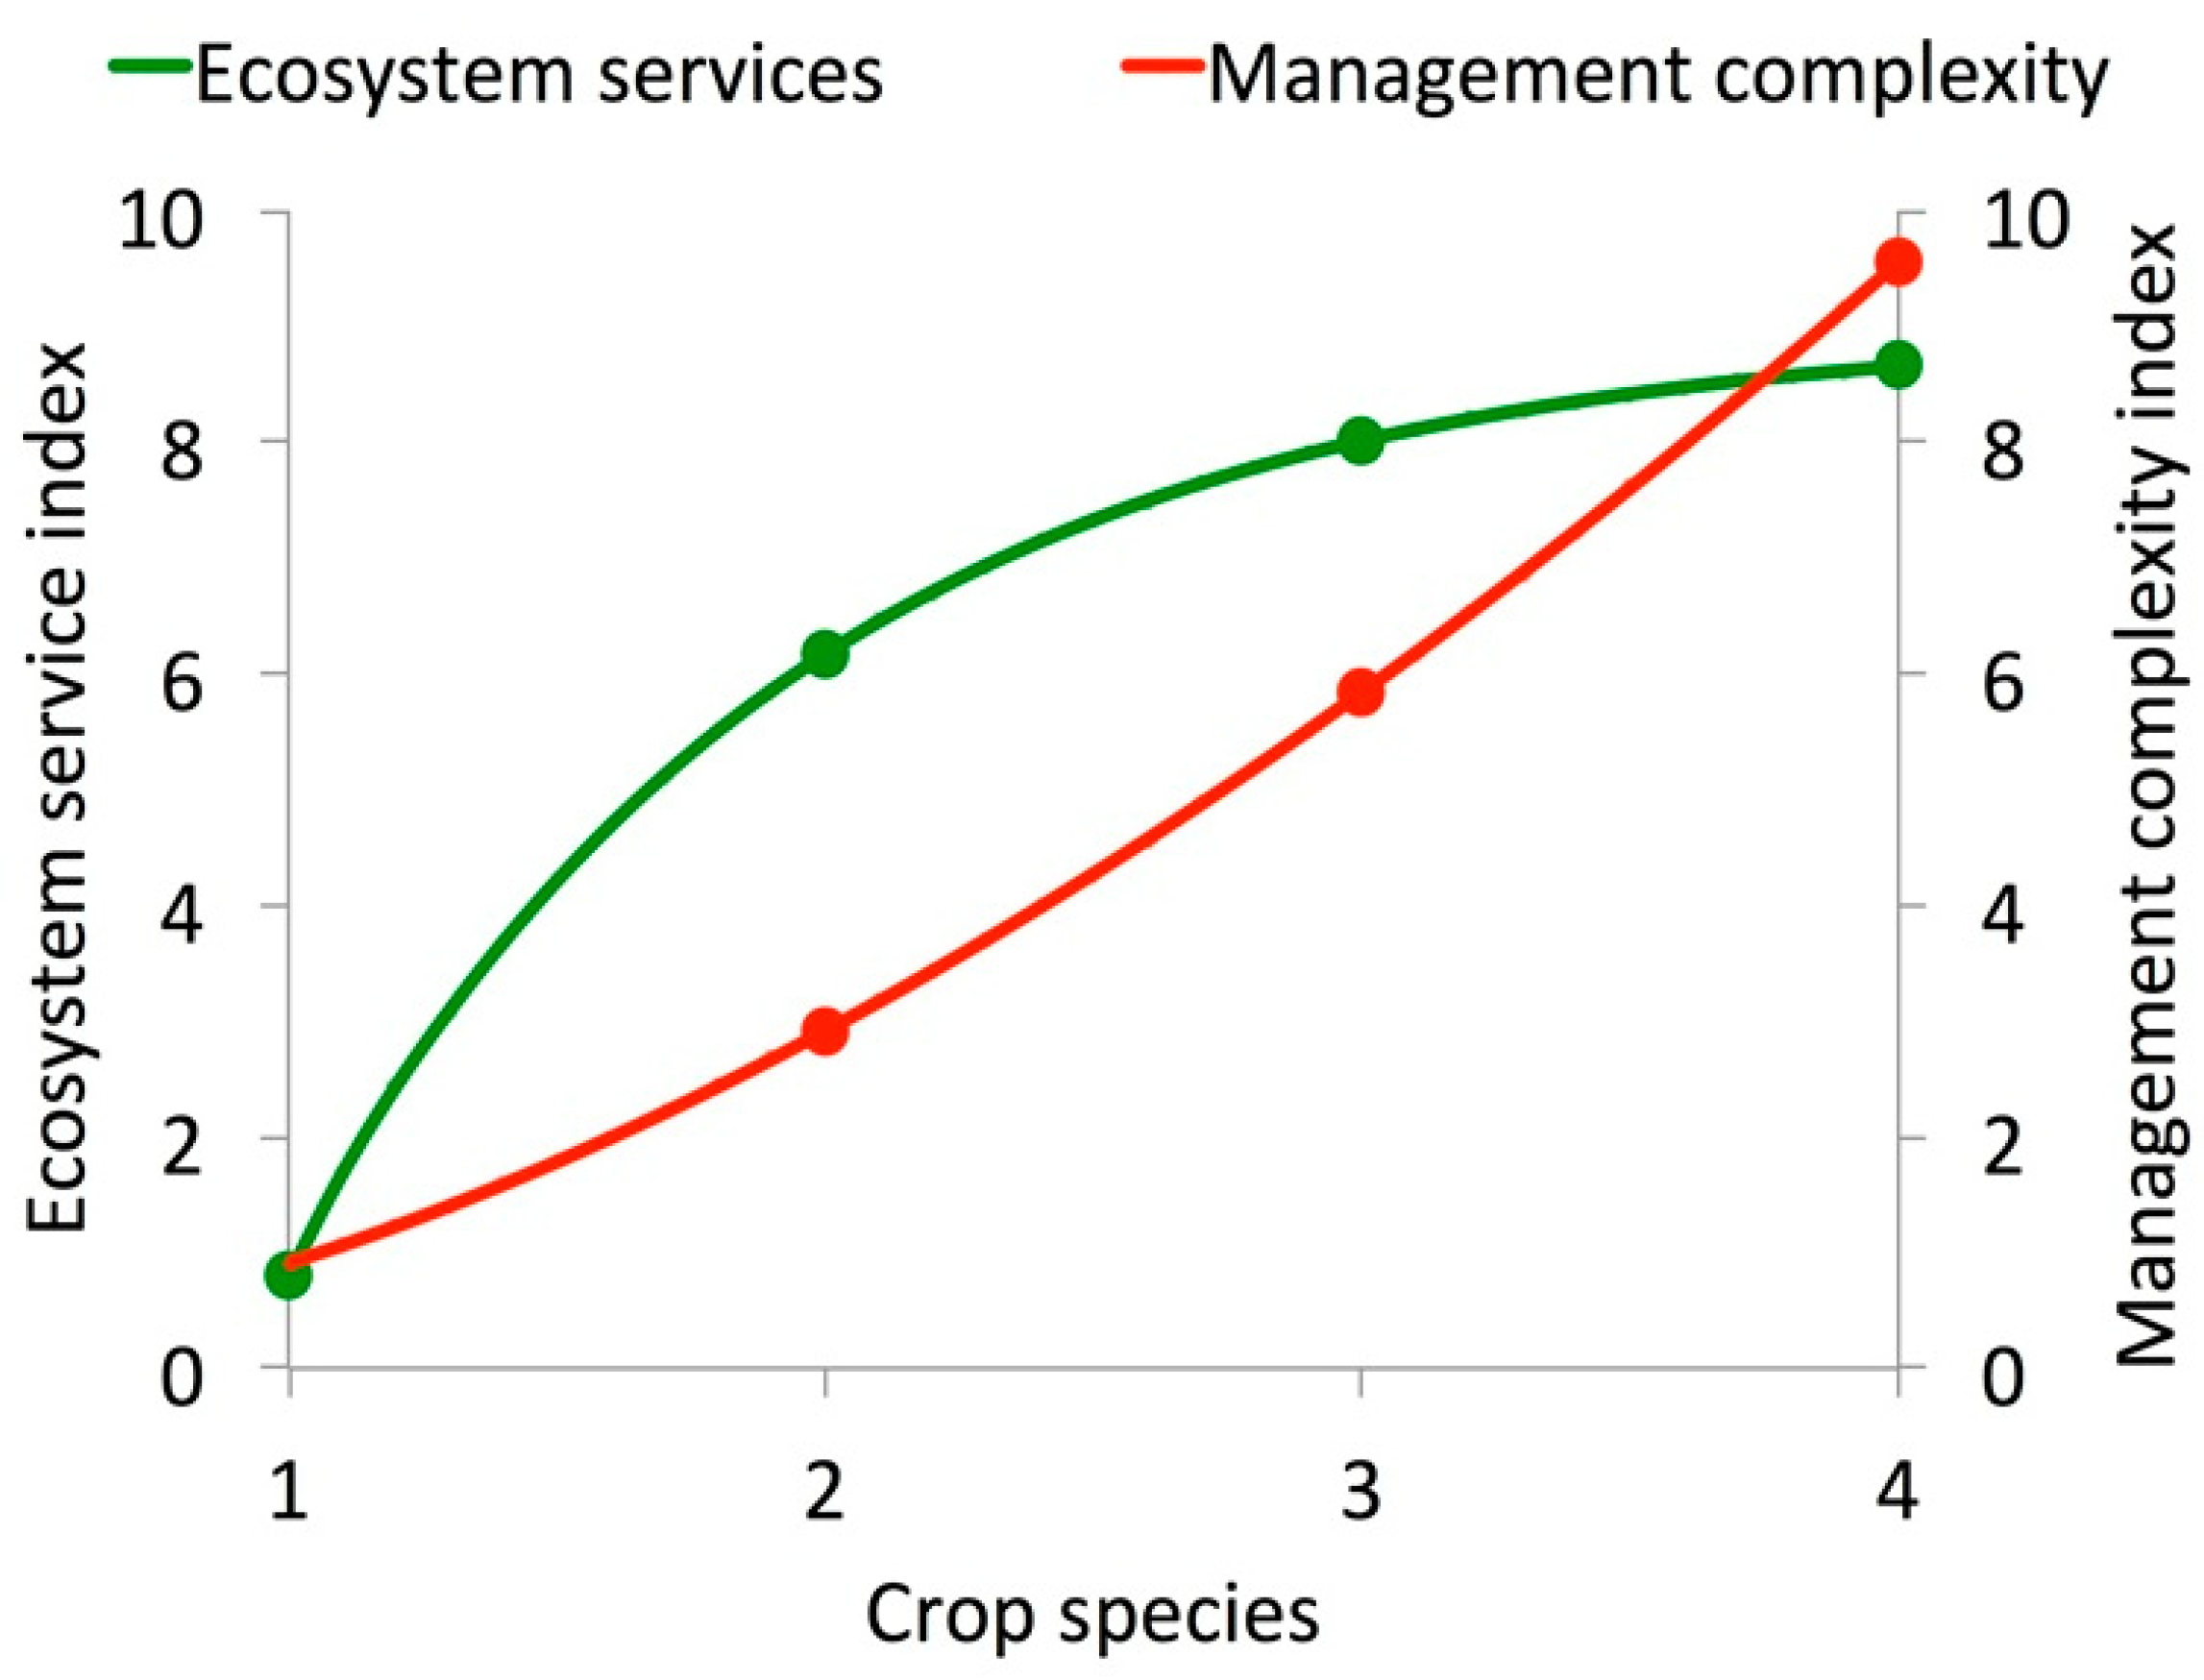
4.5. Balancing Multifunctionality and Management Complexity

The optimal number of species to include in an intercrop depends on the intercropping goals, management practices, and environmental conditions, including soil nutrients, pest status, and weather. If the primary goal of intercropping is simply to produce more biomass, then a highly diverse mixture is likely no better than a mixture with fewer species. However, if the goal is to provide multiple benefits (e.g., high yield, increased yield stability, enhanced pest suppression, and improved soil health), the optimal number of species to include might be unclear.
Research in natural systems suggests that ecosystem function is heavily influenced by species richness [85,86], and so, more crop species might be able to provide additional ecosystem services and help to maintain greater stability over variable environments. Typically ecosystem function in natural systems declines more rapidly with increasing species loss [81]. Thus, redundancy is a characteristic of a functioning ecosystem, and after a point, functionality disproportionally decreases with additional species losses. Applied to agricultural landscapes, such insights suggest that functionality can be rapidly increased by intercropping and that the greatest gains come from the first few species that are grown together. This implies that after some number of crop species, the benefits from additional crop species become difficult to measure and evaluate, and therefore, more difficult to justify.
Intercropping often affects the management complexity. For example, the herbicide options available to a farmer with a grass-legume intercrop are limited and require knowledge of alternatives. Asymmetric competition is a major concern when intercropping, as abiotic factors (e.g., weather, topography, soil nitrogen) and biotic factors (e.g., particular pests or weeds) can influence the relative abilities of crop species. Thus, knowledge of the field conditions and history is needed to optimize species selection and seeding rates in an intercrop. Sanderson et al. (2013) studied seeding ratios of grass-legume intercrops and found that a wide range of ratios led to the targeted 30–40% legume proportion, indicating some flexibility for farmers in choosing seeding rates, but difficulty in providing a prescriptive intercropping seeding rates [87]. In some situations, asymmetric competition might be tolerable if adding the poor competitor species to the mixture provides some benefit other than biomass (e.g., pollination or disease resistance), provided it is present enough for those benefits to occur. Addressing the management complexity of intercropping requires integrating different kinds of knowledge than called for by current monoculture practices. For example, a farmer intercropping multiple grain crops must determine how to coordinate the plant growth and maturation of multiple species—changes required for farm equipment to mechanically harvest different crops together—and how to separate the seeds of different species. The management complexity is compounded when intercropping is integrated within a crop rotation, a more common practice for crop diversification in industrialized agricultural landscapes.
While crop diversity affects ecosystem function in agricultural landscapes, the degree of crop diversity necessary for maintaining select ecosystem services remains undetermined [88]. Theoretically, an optimum point exists when ecosystem services are maximized and management complexity is minimized (Figure 9). Fortunately, farmers can strategically select crops to maximize ecosystem services and minimize complexity, thus reducing the burden of adopting intercropping practices.

5. Understanding the Socio-Political Context of Adoption through Cover Crop Mixtures

Although considerable evidence exists for the benefits of intercropping as a practice to increase sustainable crop production intensification, wide adoption of such practices will only occur with the support of policies, institutions, and markets that create the social structure and norms that influence individual farmer behavior. An effective strategy builds alliances across the research community, the farming community, advocacy groups, the private sector, and governmental organizations, predominantly at the state or national scales. Here, we aim to raise the awareness of some of the organizations in the United States and their actions within the context of cover crop mixtures.
We identify cover crop mixtures as an entry point for more transformative systems of intercropping, since the planting of cover crops is relatively compatible with the current cash crop production system (i.e., it is much more feasible for farmers to adopt cover crop mixtures than to adopt a silvopasture system or even strip intercropping with annual grain crops within the current agrifood system). While we suggest that intercropping with cover crops is a good starting point, we recognize that cover crops are only planted on 2–4% of the land involved in crop production in the United States due to perceived risks of yield loss and planting and termination timing [90] as well as enduring structural and normative barriers [91,92,93]. However, to reiterate, 76% of the farmers who have adopted cover crops are planting mixtures, according to the 2017 Cover Crop Survey by the CTIC, indicating the high use of intercropping with cover crops [38]. As we highlight below, new coalitions and concerted efforts are setting the foundation for wider adoption of intercropping mixtures, so there is a continuing need for scientific actors to strengthen the technical basis for integration and progress of intercropping in management practices.

5.1. Government

Economic incentives remain the main policy instrument for encouraging the adoption of cover cropping. Incentives take the form of subsidies, cost-share programs, or conditioning financial support upon evidence of cover crops. The United States Department of Agriculture (USDA) Environmental Quality Incentives Program (EQIP) is an example of a federal program that offers incentives to farmers who plant cover crops, including mixtures. Between 2009–2014, the total farm acres receiving funding from the EQIP for cover cropping increased from 127,000 to 334,000 ha [94]. There is also evidence of policy shifts at the level of state governments as well. For instance, the State of Maryland, through the Water Quality Cost-Share Program, pays its farmers to plant cover crops mixtures to alleviate nitrogen leaching and phosphorous run-off from entering the Chesapeake Bay Watershed [95]. The State of Iowa is also developing a program to subsidize crop insurance for farmers who plant cover crops [96]. Incentives could lead to direct adoption by farmers who receive payments, as well as other farmers who are able to witness the demonstrable benefits of the practice.

5.2. Advocacy

Non-profit organizations and advocacy groups are also promoting intercropping. Groups like the Midwest Cover Crops Council, composed of researchers and farmers and agribusinesses [97], and the Practical Farmers of Iowa, a farmer-based group that advocates for more ecological practices, push state governments towards policies that are likely to improve cover crop adoption by increasing the availability of resources and forming the community that farmers need to do so [98]. Cover Crops Councils in other parts of the United States, like the Northeastern and Southern regions, have also formed in recent years [99]. In the future, coordinated efforts among the Cover Crops Councils may lead to policy changes at the federal level. As mentioned before, the CTIC is a national, public-private partnership among the USDA, Environmental Protection Agency (EPA), agribusinesses, and universities that aggregates resources and news articles about cover crops [100]. Since 2013, they have been conducting a national survey of cover cropping practices, capturing important longitudinal information about specific management practices [101]. Another example of multi-stakeholder efforts was a public policy roadmap to increased cover crop adoption that was spearheaded by the National Wildlife Foundation [102].
In addition to advocacy from non-profit organizations, on-farm research and farmer networks can play powerful roles in enhancing the adoption of intercropping practices. They represent two characteristics of the successful diffusion of innovations: trialability and observability [77]. Farmers and researchers alike can try out a practice using farm-scale equipment and see firsthand the barriers and opportunities for such practices. Involving farmers early-on in the research process allows for farmers’ perspectives to be actively taken into account by other stakeholders (e.g., researchers, non-profit organizations, government), and likely leads to improved outcomes for the farmers. The Soil Health Partnership is one such network with more than 100 farms. Established in 2014, based on an initiative from the National Corn Growers Association, on-farm measurements are taken for participating farms that implement practices like planting cover crop mixtures [103].

5.3. Private Sector

On the consumer side, large companies can set purchasing standards that shift farmer behavior. For example, Walmart asked their suppliers to promote the planting of cover crop mixtures after calculating that the nitrogen fertilizer used by their producers was one of their largest sources of greenhouse gases [104]. Meanwhile, on the producer side, agribusinesses have begun to get involved. For example, many seed companies are already offering special blends of multi-species mixtures for forage or cover crops, making cover crop inputs more widely accessible. Similarly, agricultural machinery companies are offering equipment like interseeders, drills and air seeders with variable rate technology that will allow large farms to include cover cropping as a part of their operation (Figure 10) [105,106]. Futuristic equipment that links high-resolution GIS maps to pre-determined intercrop mixtures and precision fertilizer application offers a bright vision for increasing crop diversity through intercropping with a reduced burden of management complexity [107,108]. On a smaller scale, robots that fit in between rows can interseed cover crops when cash crops are too tall for other equipment to pass over [109].

5.4. Cultural Change with Technological Tools.

Several programs exist to calculate intercrop mixtures, keep field-level records based on GPS that sync with their farm equipment, check markets and weather forecasts, and access real-time, county-level yield estimations. These technological tools ease some of the burden of more complex management practices of intercropping on an industrial scale. Moreover, some of these applications allow for information sharing to occur farmer-to-farmer which can enhance sharing across a wider social network of farmers. This, in addition to public information platforms, like eXtension [110], create a cultural context that supports more complex management.

6. Conclusions

Intercropping can contribute to sustainable intensification of industrialized agricultural landscapes and plays an important role in increasing productivity, stability, and other ecosystem services. The concepts of multifunctionality and restoring ecosystem services call for increasing crop diversity at their core. Realistic expectations of complementarity in annual cropping systems, thoughtful research, and comprehensive reporting are key strategies to increasing intercropping adoption and aggregating knowledge of the intercropping discipline. Recent progress with cover crops provides a template for advancing intercropping in cash crops, but management complexity will need to be minimized to encourage the widespread adoption of intercropping.

Author Contributions

K.A.B.-F. and M.R.R. conceived the sections of the review article, K.A.B.-F. wrote most of the paper, and M.R.R. provided edits and suggestions over many drafts.

Funding

This material is based on work that is supported by the National Institute of Food and Agriculture, USDA, Hatch Project 2013-14-425: Expanding the role of cover crops in sustainable cropping systems; Northeast Sustainable Agriculture Research and Education Graduate Student Project GNE14-073: Selecting seeding rates for diverse summer annual forage crop mixtures; and Organic Research and Extension Initiative 2016-25-8468: Building resilience in the northeast through double cropping and forage diversity.

Acknowledgments

Thanks to Collin Edwards, Emily Reiss, Wendy Kozlowski, Ritwick Ghosh, Chris Pelzer, and Cynthia Bartel for their thoughts and suggestions.

Conflicts of Interest

The authors declare no conflict of interest.

References

  1. Loos, J.; Abson, D.J.; Chappell, M.J.; Hanspach, J.; Mikulcak, F.; Tichit, M.; Fischer, J. Putting meaning back into “sustainable intensification”. Front. Ecol. Environ. 2014, 12, 356–361. [Google Scholar] [CrossRef]
  2. Struik, P.C.; Kuyper, T.W. Sustainable intensification in agriculture: The richer shade of green. A review. Agron. Sustain. Dev. 2017, 37, 39. [Google Scholar] [CrossRef]
  3. Litrico, I.; Violle, C. Diversity in plant breeding: A new conceptual framework. Trends Plant Sci. 2015, 20, 604–613. [Google Scholar] [CrossRef] [PubMed]
  4. Mt. Pleasant, J.; Burt, R.F. Estimating productivity of traditional Iroquoian cropping systems from field experiments and historical literature. J. Ethnobiol. 2010, 30, 52–79. [Google Scholar] [CrossRef]
  5. Duchene, O.; Vian, J-F.; Celette, F. Intercropping with legume for agroecological cropping systems: Complementarity and facilitation processes and the importance of soil microorganisms: A review. Agric. Ecosyst. Environ. 2017, 240, 148–161. [Google Scholar] [CrossRef]
  6. Brooker, R.W.; Bennett, A.E.; Cong, W-F.; Daniell, T.J.; George, T.S.; Hallett, P.D.; Hawes, C.; Iannetta, P.P.M.; Jones, H.G.; Karley, A.J.; et al. Improving intercropping: A synthesis of research in agronomy, plant physiology and ecology. New Phytol. 2015, 206, 107–117. [Google Scholar] [CrossRef] [PubMed] [Green Version]
  7. Cadotte, M.W.; Cavender-Bares, J.; Tilman, D.; Oakley, T.H. Using phylogenetic, functional and trait diversity to understand patterns of plant community productivity. PLoS ONE 2009, 4, e5695. [Google Scholar] [CrossRef] [PubMed]
  8. Borg, J.; Kiær, L.P.; Lecarpentier, C.; Goldringer, I.; Gauffreteau, A.; Saint-Jean, S.; Barot, S.; Enjalbert, J. Unfolding the potential of wheat cultivar mixtures: A meta-analysis perspective and identification of knowledge gaps. Field Crops Res. 2017, 221, 298–313. [Google Scholar] [CrossRef]
  9. Chateil, C.; Goldringer, I.; Tarallo, L.; Kerbiriou, C.; Le Viol, I.; Ponge, J.-F.; Salmon, S.; Gachet, S.; Porcher, E. Crop genetic diversity benefits farmland biodiversity in cultivated fields. Agric. Ecosyst. Environ. 2013, 171, 25–32. [Google Scholar] [CrossRef] [Green Version]
  10. Smithson, J.B.; Lenné, J.M. Varietal mixtures: A viable strategy for sustainable productivity in subsistence agriculture. Ann. Appl. Biol. 1996, 128, 127–158. [Google Scholar] [CrossRef]
  11. Tooker, J.F.; Frank, S.D. Genotypically diverse cultivar mixtures for insect pest management and increased crop yields. J. Appl. Ecol. 2012, 49, 974–985. [Google Scholar] [CrossRef] [Green Version]
  12. Reiss, E.R.; Drinkwater, L.E. Cultivar mixtures: A meta-analysis of the effect of intraspecific diversity on crop yield. Ecol. Appl. 2018, 28, 62–77. [Google Scholar] [CrossRef] [PubMed]
  13. Bybee-Finley, K.A.; Mirsky, S.B.; Ryan, M.R. Functional diversity in summer annual grass and legume intercrops in the northeastern United States. Crop Sci. 2016, 56, 2775. [Google Scholar] [CrossRef]
  14. Raseduzzaman, M.; Jensen, E.S. Does intercropping enhance yield stability in arable crop production? A meta-analysis. Eur. J. Agron. 2017, 91, 25–33. [Google Scholar] [CrossRef]
  15. Williamson, J. Extending the Grazing Season—Preparing for the Summer Slump. Available online: https://extension.psu.edu/extending-the-grazing-season-preparing-for-the-summer-slump (accessed on 8 March 2018).
  16. Liebman, M.; Dyck, E. Crop rotation and intercropping strategies for weed management. Ecol. Appl. 1993, 3, 92. [Google Scholar] [CrossRef] [PubMed]
  17. Verret, V.; Gardarin, A.; Pelzer, E.; Médiène, S.; Makowski, D.; Valantin-Morison, M. Can legume companion plants control weeds without decreasing crop yield? A meta-analysis. Field Crops Res. 2017, 204, 158–168. [Google Scholar] [CrossRef]
  18. Tonhasca, A.; Byrne, D.N. The effects of crop diversification on herbivorous insects: A meta-analysis approach. Ecol. Entomol. 1994, 19, 239–244. [Google Scholar] [CrossRef]
  19. Langellotto, G.A.; Denno, R.F. Responses of invertebrate natural enemies to complex-structured habitats: A meta-analytical synthesis. Oecologia 2004, 139, 1–10. [Google Scholar] [CrossRef] [PubMed]
  20. Boudreau, M.A. Diseases in intercropping fystems. Annu. Rev. Phytopathol. 2013, 51, 499–519. [Google Scholar] [CrossRef] [PubMed]
  21. Khan, Z.; Midega, C.; Pittchar, J.; Pickett, J.; Bruce, T. Push-pull technology: A conservation agriculture approach for integrated management of insect pests, weeds and soil health in Africa. Int. J. Agric. Sustain. 2011, 9, 162–170. [Google Scholar] [CrossRef]
  22. Eigenbrode, S.D.; Birch, A.N.E.; Lindzey, S.; Meadow, R.; Snyder, W.E. Review: A mechanistic framework to improve understanding and applications of push-pull systems in pest management. J. Appl. Ecol. 2016, 53, 202–212. [Google Scholar] [CrossRef]
  23. How Push-Pull Works: A Platform Technology for Improving Livelihoods of Resource Poor Farmers. Available online: http://www.push-pull.net/how_it_works.shtml (accessed on 17 March 2018).
  24. Sanderson, M.A.; Archer, D.; Hendrickson, J.; Kronberg, S.; Liebig, M.; Nichols, K.; Schmer, M.; Tanaka, D.; Aguilar, J. Diversification and ecosystem services for conservation agriculture: Outcomes from pastures and integrated crop–livestock systems. Renew. Agric. Food Syst. 2013, 28, 129–144. [Google Scholar] [CrossRef] [Green Version]
  25. Lemaire, G.; Franzluebbers, A.; de Faccio Carvalho, P.C.; Dedieu, B. Integrated crop–livestock systems: Strategies to achieve synergy between agricultural production and environmental quality. Agric. Ecosyst. Environ. 2014, 190, 4–8. [Google Scholar] [CrossRef]
  26. Cong, W.-F.; Hoffland, E.; Li, L.; Six, J.; Sun, J.-H.; Bao, X.-G.; Zhang, F.-S.; Van Der Werf, W. Intercropping enhances soil carbon and nitrogen. Glob. Chang. Biol. 2015, 21, 1715–1726. [Google Scholar] [CrossRef] [PubMed]
  27. Vukicevich, E.; Lowery, T.; Bowen, P.; Urbez-Torres, J.R.; Hart, M. Cover crops to increase soil microbial diversity and mitigate decline in perennial agriculture. A review. Agron. Sustain. Dev. 2016, 36, 48. [Google Scholar] [CrossRef]
  28. Chapman, D.F.; Parsons, A.J.; Schwinning, S. Management of clover in grazed pastures: Expectations, limitations and opportunities. Spec. Publ.-Agron. Soc. N. Z. 1996, 11, 55–64. [Google Scholar]
  29. Tang, Y.; Yu, L.; Guan, A.; Zhou, X.; Wang, Z.; Gou, Y.; Wang, J. Soil mineral nitrogen and yield-scaled soil N2O emissions lowered by reducing nitrogen application and intercropping with soybean for sweet maize production in southern China. J. Integr. Agric. 2017, 16, 2586–2596. [Google Scholar] [CrossRef]
  30. Tilman, D.; Reich, P.B.; Knops, J.; Wedin, D.; Mielke, T.; Lehman, C. Diversity and productivity in a long-term grassland experiment. Science 2001, 294, 843–845. [Google Scholar] [CrossRef] [PubMed]
  31. Picasso, V.D.; Brummer, E.C.; Liebman, M.; Dixon, P.M.; Wilsey, B.J. Crop species diversity affects productivity and weed suppression in perennial polycultures under two management strategies. Crop Sci. 2008, 48, 331. [Google Scholar] [CrossRef]
  32. Barnes, R.F.; Nelson, C.J.; Collins, M.; Moore, K.J. (Eds.) Forages, Volume 1: An Introduction to Grassland Agriculture, 6th ed.; Wiley-Blackwell: Ames, IA, USA, 2003; ISBN 978-0-8138-0421-7. [Google Scholar]
  33. Alfalfa-Grass Mixtures Are Complex. Available online: https://hayandforage.com/article-permalink-1578.html (accessed on 28 December 2017).
  34. Cherney, J.J. Cornell University: Ithaca, NY, Unpublished work. 2018.
  35. Gaudin, A.C.M.; Westra, S.; Loucks, C.E.S.; Janovicek, K.; Martin, R.C.; Deen, W. Improving resilience of northern field crop systems using inter-seeded red clover: A review. Agronomy 2013, 3, 148–180. [Google Scholar] [CrossRef]
  36. Schipanski, M.E.; Drinkwater, L.E. Nitrogen fixation of red clover interseeded with winter cereals across a management-induced fertility gradient. Nutr. Cycl. Agroecosyst. 2011, 90, 105–119. [Google Scholar] [CrossRef]
  37. Schipanski, M.E.; Barbercheck, M.; Douglas, M.R.; Finney, D.M.; Haider, K.; Kaye, J.P.; Kemanian, A.R.; Mortensen, D.A.; Ryan, M.R.; Tooker, J.; et al. A framework for evaluating ecosystem services provided by cover crops in agroecosystems. Agric. Syst. 2014, 125, 12–22. [Google Scholar] [CrossRef]
  38. CTIC. Report of the 2016-17 National Cover Crop Survey. Joint publication of the Conservation Technology Information Center, the North Central Region Sustainable Agriculture Research and Education Program, and the American Seed Trade Association. West Lafayette, IN, USA, 2017. Available online: https://www.sare.org/Learning-Center/From-the-Field/North-Central-SARE-From-the-Field/2017-Cover-Crop-Survey-Analysis (accessed on 28 December 2017).
  39. Kuykendall, M.B. Biomass Production and Changes in Soil Water with Cover Crop Species and Mixtures Following no-Till Winter Wheat. Master’s Thesis, Kansas State University, Manhattan, KS, USA, 2015. [Google Scholar]
  40. Groff, S. Mixtures and cocktails: Soil is meant to be covered. J. Soil Water Conserv. 2008, 63, 110A–111A. [Google Scholar] [CrossRef]
  41. USDA NRCS East National Technology Support Center Under Cover Farmers—Feature Length. Available online: https://www.youtube.com/watch?v=nWXCLVCJWTU&t=3s (accessed on 28 December 2017).
  42. Finney, D.M.; White, C.M.; Kaye, J.P. Biomass production and carbon/nitrogen ratio influence ecosystem services from cover crop mixtures. Agron. J. 2016, 108, 39. [Google Scholar] [CrossRef]
  43. Berglund, D.R. Buckwheat Production. Available online: https://www.ag.ndsu.edu/pubs/plantsci/crops/a687.pdf (accessed on 28 December 2017).
  44. Connolly, J.; Wayne, P.; Bazzaz, F.A.; Gaines, A.E.S.D. Interspecific competition in plants: How well do current methods answer fundamental questions? Am. Nat. 2001, 157, 107–125. [Google Scholar] [CrossRef] [PubMed]
  45. Grace, J.B.; Keough, J.; Guntenspergen, G.R. Size bias in traditional analyses of substitutive competition experiments. Oecologia 1992, 90, 429–434. [Google Scholar] [CrossRef] [PubMed]
  46. Poffenbarger, H.J.; Mirsky, S.B.; Teasdale, J.R.; Spargo, J.T.; Cavigelli, M.A.; Kramer, M. Nitrogen competition between corn and weeds in soils under organic and conventional management. Weed Sci. 2015, 63, 461–476. [Google Scholar] [CrossRef]
  47. Berzsenyi, Z.; Gy-Horffy, B.; Lap, D. Effect of crop rotation and fertilisation on maize and wheat yields and yield stability in a long-term experiment. Eur. J. Agron. 2000, 13, 225–244. [Google Scholar] [CrossRef]
  48. Finlay, K.W.; Wilkinson, G.N. The analysis of adaptation in a plant-breeding programme. Crop Pasture Sci. 1963, 14, 742–754. [Google Scholar] [CrossRef] [Green Version]
  49. Grover, K.K.; Karsten, H.D.; Roth, G.W. Corn grain yields and yield stability in four long-term cropping systems. Agron. J. 2009, 101, 940. [Google Scholar] [CrossRef]
  50. Weigelt, A.; Jolliffe, P. Indices of plant competition. J. Ecol. 2003, 91, 707–720. [Google Scholar] [CrossRef] [Green Version]
  51. Bedoussac, L.; Justes, E. A comparison of commonly used indices for evaluating species interactions and intercrop efficiency: Application to durum wheat–winter pea intercrops. Field Crops Res. 2011, 124, 25–36. [Google Scholar] [CrossRef]
  52. Cousens, R. Design and interpretation of interference studies: Are some methods totally unacceptable? N. Z. J. For. Sci. 1996, 26, 5–18. [Google Scholar]
  53. Mead, R.; Willey, R.W. The concept of a “land equivalent ratio” and advantages in yields from intercropping. Exp. Agric. 1980, 16, 217–228. [Google Scholar] [CrossRef]
  54. De Wit, T.C. On Competition; Pudoc: Wageningen, The Netherlands, 1960; p. 82. [Google Scholar]
  55. Inouye, B.D. Response surface experimental designs for investigating interspecific competition. Ecology 2001, 82, 2696–2706. [Google Scholar] [CrossRef]
  56. Willey, R.W.; Heath, S.B. The quantitative relationships between plant population and crop yield. In Advances in Agronomy; Brady, N.C., Ed.; Academic Press: New York, NY, USA, 1969; Volume 21, pp. 281–321. [Google Scholar]
  57. Spitters, C.J.T. An alternative approach to the analysis of mixed cropping experiments. Estimation of competition effects. Neth. J. Agric. Sci. 1983, 31, 1–11. [Google Scholar]
  58. Helenius, J.; Jokinen, K. Yield advantage and competition in intercropped oats (Avena sativa L.) and faba bean (Vicia faba L.): Application of the hyperbolic yield-density model. Field Crops Res. 1994, 37, 85–94. [Google Scholar] [CrossRef]
  59. Connolly, J. On the use of response models in mixture experiments. Oecologia 1987, 72, 95–103. [Google Scholar] [CrossRef] [PubMed]
  60. Tow, P.G.; Lazenby, A. Competition and Succession in Pastures; CABI: New York, NY, USA, 2000; ISBN 978-0-85199-703-2. [Google Scholar]
  61. Federer, W.T. Statistical Design and Analysis for Intercropping Experiments: Volume 1: Two Crops; Springer: Berlin, Germany, 2012; ISBN 978-1-4613-9305-4. [Google Scholar]
  62. Piwowar, H.A.; Day, R.S.; Fridsma, D.B. Sharing detailed research data is associated with increased citation rate. PLoS ONE 2007, 2, e308. [Google Scholar] [CrossRef] [PubMed] [Green Version]
  63. Search|re3data.org. Available online: https://www.re3data.org/search?query=agriculture (accessed on 17 March 2018).
  64. Data Management Planning|Research Data Management Service Group. Available online: https://data.research.cornell.edu/content/data-management-planning (accessed on 17 March 2018).
  65. The Organization—Dryad. Available online: https://datadryad.org/pages/organization (accessed on 17 March 2018).
  66. KNB. Available online: https://knb.ecoinformatics.org/#about (accessed on 17 March 2018).
  67. Data Publisher for Earth & Environmental Science. Available online: https://www.pangaea.de/ (accessed on 17 March 2018).
  68. Home|National Agricultural Library. Available online: https://data.nal.usda.gov/ (accessed on 17 March 2018).
  69. Smith, R.G.; Atwood, L.W.; Warren, N.D. Increased productivity of a cover crop mixture is not associated with enhanced agroecosystem services. PLoS ONE 2014, 9, e97351. [Google Scholar] [CrossRef] [PubMed]
  70. Bybee-Finley, K.A.; Mirsky, S.B.; Ryan, M.R. Crop biomass not species richness drives weed suppression in warm-season annual grass–legume intercrops in the northeast. Weed Sci. 2017, 65, 669–680. [Google Scholar] [CrossRef]
  71. Finney, D.M.; Kaye, J.P. Functional diversity in cover crop polycultures increases multifunctionality of an agricultural system. J. Appl. Ecol. 2017, 54, 509–517. [Google Scholar] [CrossRef]
  72. Murrell, E.G.; Schipanski, M.E.; Finney, D.M.; Hunter, M.C.; Burgess, M.; LaChance, J.C.; Baraibar, B.; White, C.M.; Mortensen, D.A.; Kaye, J.P. Achieving diverse cover crop mixtures: Effects of planting date and seeding rate. Agron. J. 2017, 109, 259–271. [Google Scholar] [CrossRef]
  73. Tilman, D. The ecological consequences of changes in biodiversity: A search for general principles 101. Ecology 1999, 80, 1455–1474. [Google Scholar]
  74. Hector, A.; Bagchi, R. Biodiversity and ecosystem multifunctionality. Nature 2007, 448, 188–190. [Google Scholar] [CrossRef] [PubMed]
  75. Naeem, S.; Duffy, J.E.; Zavaleta, E. The Functions of Biological Diversity in an Age of Extinction. Science 2012, 336, 1401–1406. [Google Scholar] [CrossRef] [PubMed]
  76. Schipanski, M.E.; Drinkwater, L.E. Nitrogen fixation in annual and perennial legume-grass mixtures across a fertility gradient. Plant Soil 2012, 357, 147–159. [Google Scholar] [CrossRef]
  77. Rogers, E.M. Diffusion of Innovations, 5th ed.; Free Press: New York, NY, USA, 2003; ISBN 978-0-7432-2209-9. [Google Scholar]
  78. Exner, D.N.; Davidson, D.G.; Ghaffarzadeh, M.; Cruse, R.M. Yields and returns from strip intercropping on six Iowa farms. Am. J. Altern. Agric. 1999, 14, 69–77. [Google Scholar] [CrossRef]
  79. Ledgard, S.F.; Steele, K.W. Biological nitrogen fixation in mixed legume/grass pastures. Plant Soil 1992, 141, 137–153. [Google Scholar] [CrossRef]
  80. Ledgard, S.F.; Freney, J.R.; Simpson, J.R. Assessing nitrogen transfer from legumes to associated grasses. Soil Biol. Biochem. 1985, 17, 575–577. [Google Scholar] [CrossRef]
  81. Cardinale, B.J.; Matulich, K.L.; Hooper, D.U.; Byrnes, J.E.; Duffy, E.; Gamfeldt, L.; Balvanera, P.; O’Connor, M.I.; Gonzalez, A. The functional role of producer diversity in ecosystems. Am. J. Bot. 2011, 98, 572–592. [Google Scholar] [CrossRef] [PubMed] [Green Version]
  82. Trenbath, B.R. Biomass productivity of mixtures. In Advances in Agronomy; Academic Press: New York, NY, USA, 1974; Volume 26, pp. 177–210. ISBN 978-0-08-056339-8. [Google Scholar]
  83. Cadotte, M.W.; Cardinale, B.J.; Oakley, T.H. Evolutionary history and the effect of biodiversity on plant productivity. Proc. Natl. Acad. Sci. USA 2008, 105, 17012–17017. [Google Scholar] [CrossRef] [PubMed] [Green Version]
  84. Yu, Y.; Stomph, T.-J.; Makowski, D.; van der Werf, W. Temporal niche differentiation increases the land equivalent ratio of annual intercrops: A meta-analysis. Field Crops Res. 2015, 184, 133–144. [Google Scholar] [CrossRef]
  85. Cardinale, B.J.; Wright, J.P.; Cadotte, M.W.; Carroll, I.T.; Hector, A.; Srivastava, D.S.; Loreau, M.; Weis, J.J. Impacts of plant diversity on biomass production increase through time because of species complementarity. Proc. Natl. Acad. Sci. USA 2007, 104, 18123–18128. [Google Scholar] [CrossRef] [PubMed] [Green Version]
  86. Therond, O.; Duru, M.; Roger-Estrade, J.; Richard, G. A new analytical framework of farming system and agriculture model diversities. A review. Agron. Sustain. Dev. 2017, 37. [Google Scholar] [CrossRef] [Green Version]
  87. Sanderson, M.A.; Brink, G.; Stout, R.; Ruth, L. Grass–legume proportions in forage seed mixtures and effects on herbage yield and weed abundance. Agron. J. 2013, 105, 1289. [Google Scholar] [CrossRef]
  88. Szumigalski, A.R.; Van Acker, R.C. The agronomic value of annual plant diversity in crop-weed systems. Can. J. Plant Sci. 2006, 86, 865–874. [Google Scholar] [CrossRef] [Green Version]
  89. Ryan, M.R.; Crews, T.E.; Culman, S.W.; DeHaan, L.R.; Hayes, R.C.; Jungers, J.M.; Bakker, M.G. Managing for multifunctionality in perennial grain crops. BioScience 2018. [Google Scholar] [CrossRef] [PubMed]
  90. Gonzalez-Ramirez, J.; Kling, C.; Arbuckle, J.G., Jr.; Wright-Morton, L.; McGuire, J.; Ingels, C.; Benning, J. Cover Crop Adoption Decisions in Iowa: Insights from an in-Person Survey CARD Agricultural Policy Review. Available online: https://www.card.iastate.edu/ag_policy_review/article/?a=67 (accessed on 23 April 2018).
  91. Roesch-McNally, G.; Basche, A.; Arbuckle, J.G.; Tyndall, J.; Miguez, F.; Bowman, T.; Clay, R. The trouble with cover crops: Farmers’ experiences with overcoming barriers to adoption. Renew. Agric. Food Syst. 2017. [Google Scholar] [CrossRef]
  92. Dunn, M.; Ulrich-Schad, J.D.; Prokopy, L.S.; Myers, R.L.; Watts, C.R.; Scanlon, K. Perceptions and use of cover crops among early adopters: Findings from a national survey. J. Soil Water Conserv. 2016, 71, 29–40. [Google Scholar] [CrossRef]
  93. Plastina, A.; Liu, F.; Miguez, F.; Carlson, S. Cover crops use in midwestern US agriculture: Perceived benefits and net returns. Renew. Agric. Food Syst. 2018, 1–11. [Google Scholar] [CrossRef]
  94. Wade, T.; Claassen, R.L.; Wallander, S. Conservation-Practice Adoption Rates Vary Widely by Crop and Region; United States Department of Agriculture, Economic Research Service: Washington, DC, USA, 2015.
  95. Cover Crop Program. Available online: http://mda.maryland.gov/resource_conservation/pages/cover_crop.aspx (accessed on 28 December 2017).
  96. Bryant, L. Iowa Breaks New Ground with Innovative Cover Crop Incentive. Available online: https://www.nrdc.org/experts/lara-bryant/iowa-breaks-new-ground-innovative-cover-crop-incentive (accessed on 28 December 2017).
  97. MCCC—The Goal of the Midwest Cover Crops Council (MCCC) Is to Facilitate Widespread Adoption of Cover Crops throughout the Midwest, to Improve Ecological, Economic, and Social Sustainability. Available online: http://mccc.msu.edu/ (accessed on 28 December 2017).
  98. Mission, Vision, Values. Practical Farmers of Iowa. Available online: https://www.practicalfarmers.org/about/mission-vision-values/ (accessed on 14 February 2018).
  99. SARE, The Northeast Cover Crops Council: Building the Network and Online Decision Support Tools. Available online: https://projects.sare.org/sare_project/ene16-144/ (accessed on 14 February 2018).
  100. About CTIC. Available online: http://www.ctic.purdue.edu/CTIC%20HOME/ABOUT%20CTIC/ (accessed on 11 March 2018).
  101. Cover Crops. Available online: http://www.ctic.purdue.edu/Cover%20Crops/ (accessed on 11 March 2018).
  102. Roadmap-to-Increased-Cover-Crop-Production_Print.pdf. Available online: http://mccc.msu.edu/wp-content/uploads/2016/10/Roadmap-to-Increased-Cover-Crop-Production_Print.pdf (accessed on 28 December 2017).
  103. About Us. Available online: http://soilhealthpartnership.org/about-us.html (accessed on 5 June 2018).
  104. Agriculture—Walmart Sustainability. Available online: https://www.walmartsustainabilityhub.com/project-gigaton/agriculture (accessed on 11 March 2018).
  105. Cover Crop Interseeder and Spplicator. Available online: https://extension.psu.edu/cover-crop-interseeder-and-applicator (accessed on 2 April 2018).
  106. Hagie Manufacturing Company. Available online: http://www.hagie.com/hagie_manuals.aspx?bd=Virtual|Manuals|Cover%20Crop%20Interseeder (accessed on 2 April 2018).
  107. Canadian Monster Drill Clean Seed Offers New Level of Seed Accuracy. Available online: https://www.futurefarming.com/Machinery/Articles/2018/2/Canadian-monster-drill-Clean-Seed-offers-new-level-of-seed-accuracy-3663WP/ (accessed on 2 April 2018).
  108. The CX-6 SMART Seeder—The New Benchmark in Precision Seeding. Available online: http://www.cx6smartseeder.com/home (accessed on 2 April 2018).
  109. Cover Crop Seeding Results on Earth Day. Available online: http://rowbot.com/blog-posts/2016/4/22/cover-crop-seeding-results-on-earth-day (accessed on 2 April 2018).
  110. Featured Articles—eXtension. Available online: http://articles.extension.org/ (accessed on 18 March 2018).
Figure 1. Examples of intercropping in (a) mixed perennial forage crop; (b) mixed relay intercrop of red clover (Trifolium pratense L.) into winter wheat (Triticum aestivum L.); and (c) strip relay intercropping of corn (Zea mays L.) and cereal rye (Secale cereale L.). Photographs by Sarah Ziegler, Joséphine Peigné, and Sandra Wayman, respectively.
Agriculture 08 00080 g001
Figure 2. Scheme developed by the African Insect Science for Food and Health at the International Centre of Insect Physiology and Ecology (ICIPE) of the push-pull system in corn which illustrates the semiochemical ecology of attracting or detracting the corn stemborer and suppressing weeds. Used with permission from ICIPE [23].
Agriculture 08 00080 g002
Figure 3. Photo of perennial ryegrass (Lolium perenne L.), orchardgrass (Dactylis glomerata L.), meadow fescue (Festuca pratensis Huds.), red clover (Trifolium pratense L.), white clover (Trifolium repens L.), and chicory (Cichorium intybus L.). Photograph by Sarah Ziegler.
Agriculture 08 00080 g003
Figure 4. A relay mixed intercrop of red clover after winter wheat harvest. Photograph by Joséphine Peigné.
Agriculture 08 00080 g004
Figure 5. A mixed intercrop of summer annual cover crops consisting of pearl millet (Pennisetum glaucum (L.) R. Br.), sunn hemp (Crotalaria juncea L.), and cowpea (Vigna unguiculata (L.) Walp.) can be grown after winter wheat or other crops that are harvested in mid-summer. Photograph by K. Ann Bybee-Finley.
Agriculture 08 00080 g005
Figure 6. Examples of different experimental designs for intercropping research: (a) replacement; (b) additive; and (c) response surface designs of a biculture intercrop. Replacement and additive designs are one-dimensional (linear) and components of competition cannot be parsed out, whereas response surface designs are two-dimensional (planar) and intra-and interspecific competition can be parsed out.
Agriculture 08 00080 g006
Figure 7. Radar plot framework for evaluating species interactions for a three-species intercrop (triangle) and for an eight-species intercrop (octagon). The numbers in the top right corner denote the LER of each example. No effect occurs when all species in the intercrop have partial land equivalent ratios (LERs) that are 0.33 for a three-species intercrop or 0.125 for an eight-species intercrop. Mutual overyielding occurs when all species in a three-species intercrop have partial LERs that greater than 0.33 for a three-species intercrop or 0.125 for an eight-species intercrop. Mutual antagonism occurs when all species in a three-species intercrop have partial LERs that are less than 0.33 or 0.125 for an eight-species intercrop. Suppression is a result of asymmetric competition and occurs when a species performs better in an intercrop by suppressing the growth of other species in the intercrop. Modified from Bybee-Finley et al., 2016 [13].
Agriculture 08 00080 g007
Figure 8. Graphical depictions of the relationships between crop yield, crop density, and per plant weight, and their related equations used to model competition for species x: (a) illustrates the rectangular hyperbolic relationship between plant density and yield, where increasing plant density results in an increase in yield until a maximum limit is approached, denoted by the equation to the right of the graph; (b) is the linear reciprocal of the first equation and describes the relationship between plant density and the reciprocal of the per plant weight, denoted by the equations on the right of the graph.
Agriculture 08 00080 g008
Figure 9. Hypothesized relationships between ecosystem services (green line, left y-axis) and management complexity (red line, right y-axis) as a function of crop species in an intercrop. Modified from Ryan et al., 2018 [89].
Agriculture 08 00080 g009
Figure 10. A high-clearance drill interseeder passes over a young crop of soybeans and plants a cover crop in mid-summer. Photograph by Matthew Ryan.
Agriculture 08 00080 g010
Table 1. Suggested criteria to be described in intercropping publications and their metadata to ease the difficulty of meta-analyses and build empirical evidence of intercropping outcomes across experiments.
TopicCriteriaUnitsFrequency
EnvironmentLocationsGPS coordinates, name of site of experiment, town state/province
YearsYearsAnnually
Heat unitsTemperature in degrees Celsius, growing days with base unit specifiedMonthly or daily
Precipitationmm Monthly or daily
SoilTypeName and taxonomic class
Organic matter contentPercentage of distribution of regional soils with similar textureBefore experiment starts
pH1–14 scaleBefore experiment starts
Nutrient statusField-level, report N-P-K in ppm Before experiment starts
Hypothesis testingPurpose(s) of intercrope.g., for forage and water quality
Experimental designe.g., additive, replacement, response surface
Seeding rate approachConstant density, recommended seeding rates, or functional equivalent
Intercrop treatmentsSpeciesScientific name
CultivarsName
Seeding rate(s)kg ha−1
Duration of plantingDays
ManagementSeeding dateDay-month-year
Seeding depth cm, specify if varied by speciesEvery planting
Fertilizer applicationType, equipment used, concentration and rate of practiceEvery application
Water managementRainfed or irrigated, specify details in mm Daily
Pest controlType, equipment used, product and rate
Tillage practicesType, equipment used, depth in cmEvery tillage event
Termination practicesType, equipment used, product and rate
ResultsSampling date(s)Day-month-year
BiomassTotal and by species, kg ha−1 Every sampling
Crop growth ratekg ha−1 day−1Every sampling
Pest pressureAbundance, species
Meta-dataData repositoryDescription of where data are stored
Data licenseDescription of how you want to be acknowledged for your data
Persistent identifierUnique code for identification (e.g., digital object identifier (DOI))
Table 2. Description of possible data repositories for agricultural intercropping research [65,66,67,68].
NameDescriptionRequirements
DryadNot agriculture-specificAffiliation with publication
KNB Ecological and environmental sciencesEcological metadata language (EML)
PanagaeaEarth and environmental sciences
Ag Data CommonsUS National Agricultural LibrariesUnited States Department of Agriculture-funded research

