1. Introduction
Seed vigor is an important indicator for evaluating the physiological quality of seeds and directly affects germination rate, seedling emergence uniformity, and field establishment capacity. Finch-Savage and Bassel pointed out that seed vigor determines the ability of seeds to establish rapidly, uniformly, and robustly under varying environmental conditions and serves as a key parameter linking laboratory quality assessment with field performance [
1]. In soybean, reduced seed vigor can easily lead to delayed emergence, uneven plant populations, and increased production risk. Therefore, the development of a rapid, stable, and non-destructive method for vigor assessment is of great importance.
At present, seed vigor assessment still mainly relies on the standard germination test and its derived indices, supplemented by methods such as accelerated aging, electrical conductivity, and cold stress tests. Xing et al. reported that although these methods can reflect the physiological status of seeds, they generally suffer from several limitations, including long testing periods, labor-intensive procedures, substantial sample consumption, and difficulty in achieving rapid single-seed detection [
2]. In soybean research, artificial accelerated aging is commonly used to simulate vigor deterioration during storage and can effectively enlarge vigor differences among samples. Cheng et al. found significant differences in vigor-related indices among soybean lines after artificial aging [
3]. Ding et al. further established a comprehensive evaluation system for soybean seed vigor, demonstrating that aging treatment combined with germination index analysis can provide a reliable basis for seed vigor assessment [
4].
With the development of non-destructive sensing technologies, hyperspectral imaging has attracted considerable attention in seed quality evaluation because it can simultaneously acquire spatial information and continuous spectral information from samples. Feng et al. reviewed how hyperspectral imaging has shown strong application potential in seed variety identification, vigor detection, damage recognition, and quality evaluation [
5]. In seed vigor research, Xu et al. used hyperspectral imaging combined with multivariate analysis to identify maize seed vigor [
6]. Cheng et al. integrated hyperspectral and image information for vegetable seed vigor detection, confirming the feasibility of this technique for rapid seed assessment [
7]. Huang et al. further reported that hyperspectral imaging combined with chemometric methods could be used for the non-destructive detection of sunflower seed vigor and moisture content [
8]. These studies indicate that hyperspectral technology can capture subtle optical responses associated with changes in seed physiological status, thereby providing a new technical approach for seed vigor classification.
Recent years have witnessed increasing interest in the application of deep learning to seed phenotyping, seed quality evaluation, and vigor-related detection. Compared with conventional machine learning methods, deep learning models can automatically learn hierarchical features from image or spectral data, thereby reducing the dependence on manually designed features and showing strong potential in high-throughput seed analysis [
9]. Existing studies can be broadly organized according to their feature-learning architectures. Conventional convolutional neural networks (CNNs) are effective in extracting local spatial features from seed images or local spectral patterns from hyperspectral data. Gulzar et al. developed a CNN-based seed classification system with transfer learning for 14 common seed types, while Loddo et al. proposed SeedNet for seed image classification and retrieval, demonstrating the effectiveness of convolutional architectures in multi-class seed recognition [
10,
11]. In hyperspectral seed analysis, Yu et al. applied hyperspectral imaging combined with deep learning to identify hybrid okra seed varieties, and Li et al. used a one-dimensional CNN for soybean variety identification, indicating that convolutional models can extract discriminative information from spectral data [
12,
13].
Beyond standard CNNs, residual network-based and transformer-based models have also been introduced into seed- and crop-related visual analysis. Residual architectures use shortcut connections to improve deep feature representation and alleviate training degradation in deeper networks. For example, Hoang et al. [
14] used ResNet18 as a teacher model in a knowledge-distillation framework for rice seed variety identification, showing that residual networks can provide strong feature representation for seed image classification. Transformer-based models, especially Vision Transformer and convolutional Vision Transformer variants, use attention mechanisms to capture global feature relationships. Erukude et al. [
15] developed a convolutional Vision Transformer framework for hierarchical corn kernel analysis and compared it with ResNet-50 and DenseNet-121, indicating the potential of attention-based architectures in seed quality workflows. In general, CNNs are more efficient for local feature extraction, residual networks enhance deep hierarchical representation, and transformer-based models are more suitable for modeling global dependencies. These architectures provide useful methodological references for seed image and spectral analysis, but their applicability depends on the specific task, input form, sample size, and computational cost.
For seed vigor detection, hyperspectral imaging combined with machine learning or deep learning has also shown promising potential. Wu et al. proposed a weighted-loss deep convolutional neural network for rice seed vigor detection under sample-imbalanced conditions, and Xu et al. reported that CNN-based models achieved good performance in maize seed vigor identification [
16,
17]. In soybean seed vigor assessment, Hu et al. evaluated naturally aged soybean seeds using polarized hyperspectral imaging combined with ensemble learning algorithms, confirming the feasibility of hyperspectral methods for soybean vigor identification [
18]. Pang et al. further developed a hyperspectral prediction model for seed vigor under imbalanced sample conditions and pointed out that model performance is highly dependent on feature representation and algorithm design [
19]. These studies demonstrate that learning-based models can effectively support non-destructive seed vigor evaluation. However, seed vigor classification differs from general seed species or variety recognition because its labels should reflect the physiological status of seeds rather than only external category differences. For soybean seed vigor classification based on hyperspectral data, most existing studies still focus on validating individual algorithms under specific sample conditions, while less attention has been paid to how different spectral preprocessing strategies, dimensionality reduction methods, and classifiers jointly affect classification performance and model robustness. In addition, vigor labels defined only by aging duration may not fully represent the actual physiological status of seeds. Establishing vigor classes based on germination percentage, germination energy, and germination index can strengthen the correspondence between spectral classification results and actual seed vigor [
20,
21,
22,
23].
Accordingly, this study used soybean seeds with artificially accelerated aging as the research material to construct physiologically meaningful vigor classes and to evaluate a complete hyperspectral machine learning pipeline. Hyperspectral images of individual seeds were acquired, and seed vigor was labeled in combination with the results of standard germination tests. Based on germination percentage, germination energy, and germination index, high-, medium-, and low-vigor classes were determined through significance analysis. On this basis, the performances of different spectral preprocessing methods, dimensionality reduction methods, and classification models were systematically compared to construct a vigor classification model for artificially aged soybean seeds. This study aims to provide a methodological reference for the rapid and non-destructive detection of soybean seed vigor and to offer experimental support for the application of hyperspectral technology in seed quality evaluation.
2. Materials and Methods
2.1. Experimental Materials and Artificial Aging Treatment
Four soybean cultivars widely cultivated in Heilongjiang Province, including Heihe 49, Jiamidou 12, Jiyu 201, and Heike 59, were selected as experimental materials in this study. All seed samples were supplied by the College of Agriculture, Northeast Agricultural University, and were harvested in 2024. The seeds were screened in accordance with the national standard GB 4404.2-2010 Seeds of Food Crops [
24].
For each cultivar, 1 kg of seeds was collected, from which 1500 seeds with full kernels, uniform size, intact seed coats, and no visible disease, insect damage, or mechanical injury were selected for subsequent artificial aging treatment and hyperspectral data acquisition. The 100-seed weights of Heihe 49, Jiamidou 12, Jiyu 201, and Heike 59 were 18.7 ± 0.2 g, 19.4 ± 0.3 g, 17.9 ± 0.2 g, and 21.2 ± 0.4 g, respectively.
This screening procedure also helped reduce morphology-induced spectral variability. Seed size, shape, and seed coat condition can influence hyperspectral reflectance by altering surface scattering, local shadowing, optical path length, and curvature-related reflection differences [
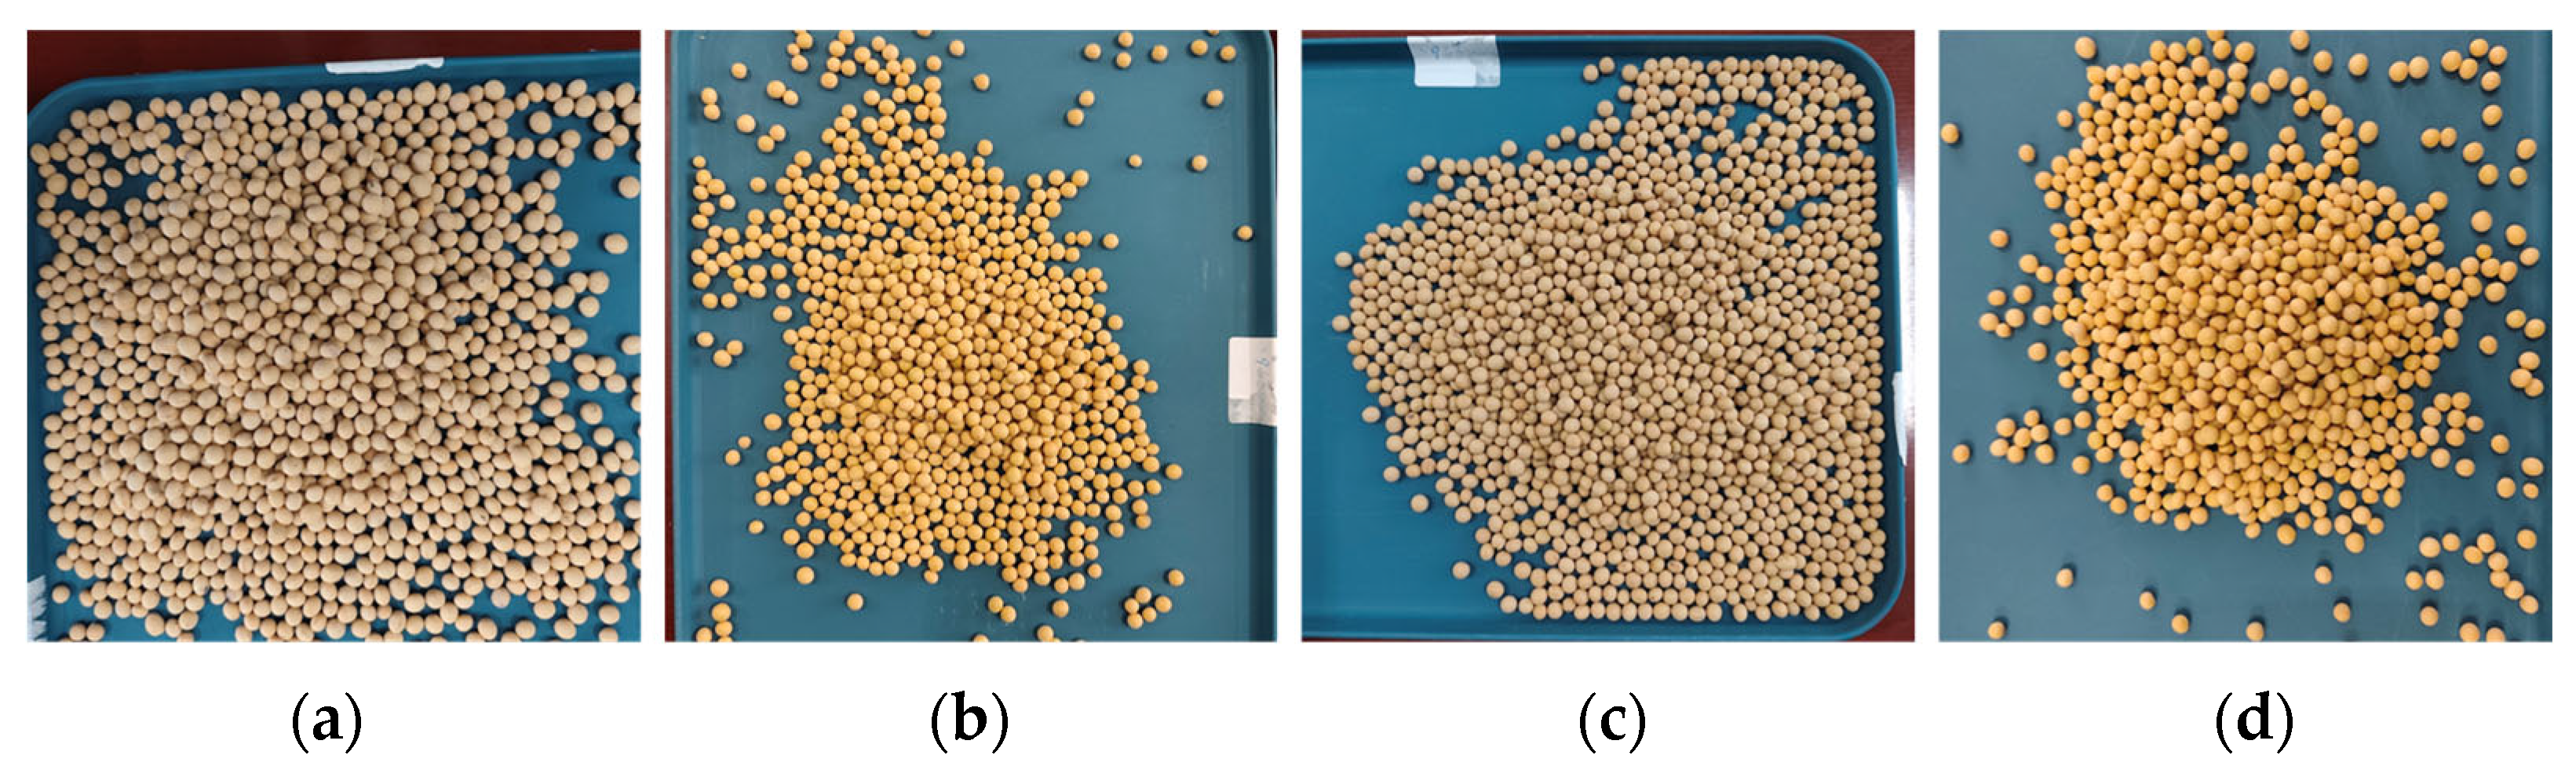
25]. Therefore, the use of seeds with relatively uniform external morphology was intended to reduce the interference of morphology-related optical variation and to make the extracted spectral differences more closely associated with aging-induced vigor changes. Representative images of the soybean seed samples are presented in
Figure 1.
To construct soybean seed samples with different vigor levels, an artificial accelerated aging method was employed to simulate seed deterioration under high-temperature and high-humidity storage conditions. The aging treatment was conducted in an RGX-360F artificial climate chamber (Zhejiang Lichen Scientific Instruments Co., Ltd., Shaoxing City, Zhejiang Province, China), and the main technical parameters of the chamber are presented in
Table 1. According to the experimental objectives and the operating conditions of the device, the aging treatment was conducted at 40 °C and 90% relative humidity to establish a stable high-temperature and high-humidity stress environment.
All four soybean cultivars were subjected to artificial aging under a unified treatment scheme. For each cultivar, 1500 seeds were selected from the screened seed lot and divided into five groups of 300 seeds each. Each group contained three parallel replicates, with 100 seeds per replicate. To obtain samples with different aging durations while ensuring consistency in the time of sample removal, the treatment groups were arranged using a staggered-start and same-batch termination design. As a result, five aging gradients were established: 0, 24, 48, 72, and 96 h, with 0 h serving as the non-aged control. This treatment design facilitated the construction of soybean seed samples with different degrees of aging under unified sampling conditions, thereby providing a consistent material basis for subsequent germination tests, vigor classification, and hyperspectral classification modeling.
2.2. Hyperspectral Image Acquisition and Spectral Extraction
In this study, hyperspectral data of artificially aged soybean seeds were acquired using a GaiaSorter-Dual dual-camera full-band hyperspectral sorting system (Jiangsu Dualix Spectral Imaging Technology Co., Ltd., Wuxi City, Jiangsu Province, China). The system consisted of a dome reflectance light source, two hyperspectral camera modules, a sample stage, and a computer control unit. The dual-camera configuration enabled spectral acquisition across both the visible–near-infrared (VNIR) and short-wave-infrared (SWIR) regions, allowing the simultaneous collection of spatial and continuous spectral information from soybean seeds. Specifically, the VNIR camera covered 394.8–1000.9 nm with 304 bands, whereas the SWIR camera covered 866.95–2635.59 nm with 512 bands. The adjustable working distance of the system was 180–300 mm. The main technical parameters of the hyperspectral imaging system are summarized in
Table 2. This broad spectral coverage provided a reliable basis for subsequent soybean seed vigor classification.
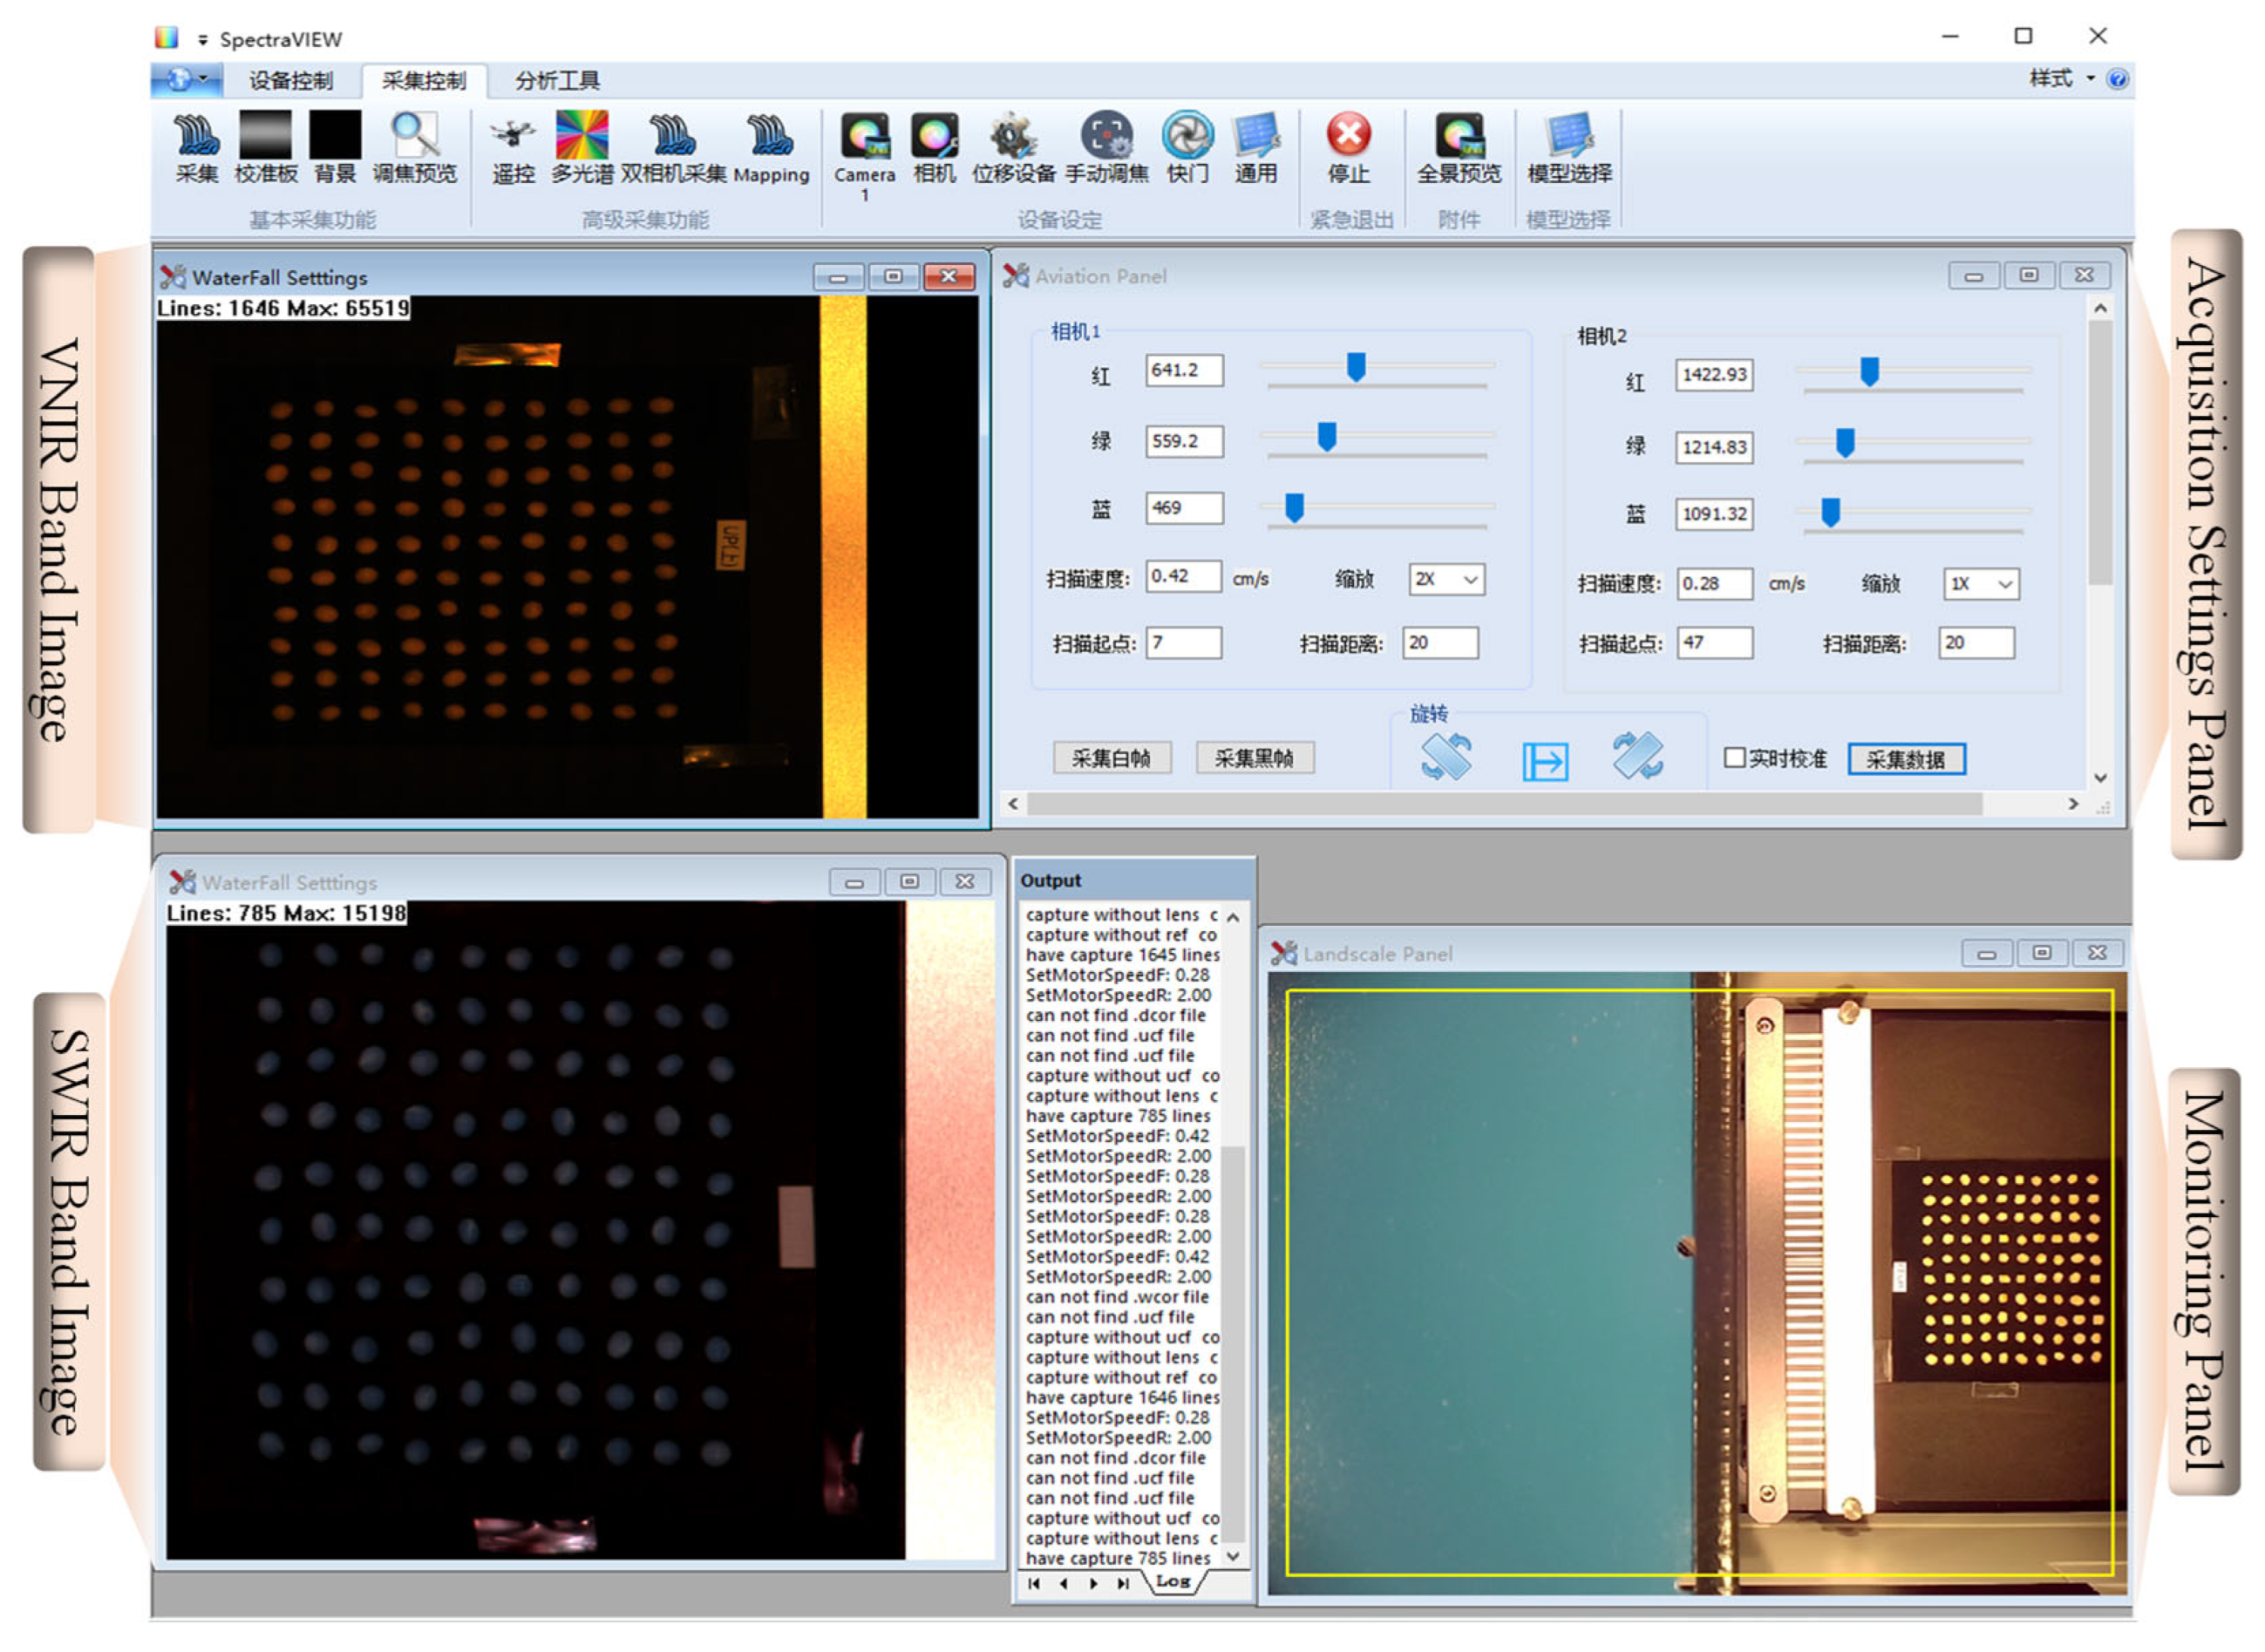
Hyperspectral image acquisition and device control were performed using SpectraVIEW software v2.9.4.38 (
Figure 2). Because both hyperspectral cameras were fixed during acquisition, line-scan imaging was achieved by moving the sample stage at a constant speed. During image acquisition, the exposure times of the VNIR and SWIR cameras were set to 9 ms and 19.7 ms, respectively. For VNIR image acquisition, the sample stage was scanned over the range of 7–27 cm at a speed of 0.42 cm/s, whereas for SWIR image acquisition, the scanning range was 47–67 cm at a speed of 0.28 cm/s. The acquired VNIR and SWIR images had dimensions of 1600 × 1646 pixels and 640 × 785 pixels, respectively. These settings were kept consistent across all sample batches to ensure the comparability of hyperspectral images obtained under different aging treatments.
To ensure stable positioning of individual seeds during scanning and to reduce background interference, a custom-made black light-absorbing perforated acrylic plate (15 × 15 cm) containing 10 × 10 arranged holes was used in this study. Soybean seeds were placed individually into the holes for hyperspectral imaging. This arrangement reduced the influence of seed displacement during scanning and improved the consistency of subsequent single-seed spectral extraction.
After image acquisition, black-and-white calibration was applied to the raw hyperspectral images to reduce the effects of uneven illumination, dark current noise, and differences in instrument response, thereby converting the raw images into relative reflectance images [
26]. The calibration formula is as follows:
where
is the calibrated reflectance image,
is the raw hyperspectral image,
is the dark-reference image, and
is the white-reference image.
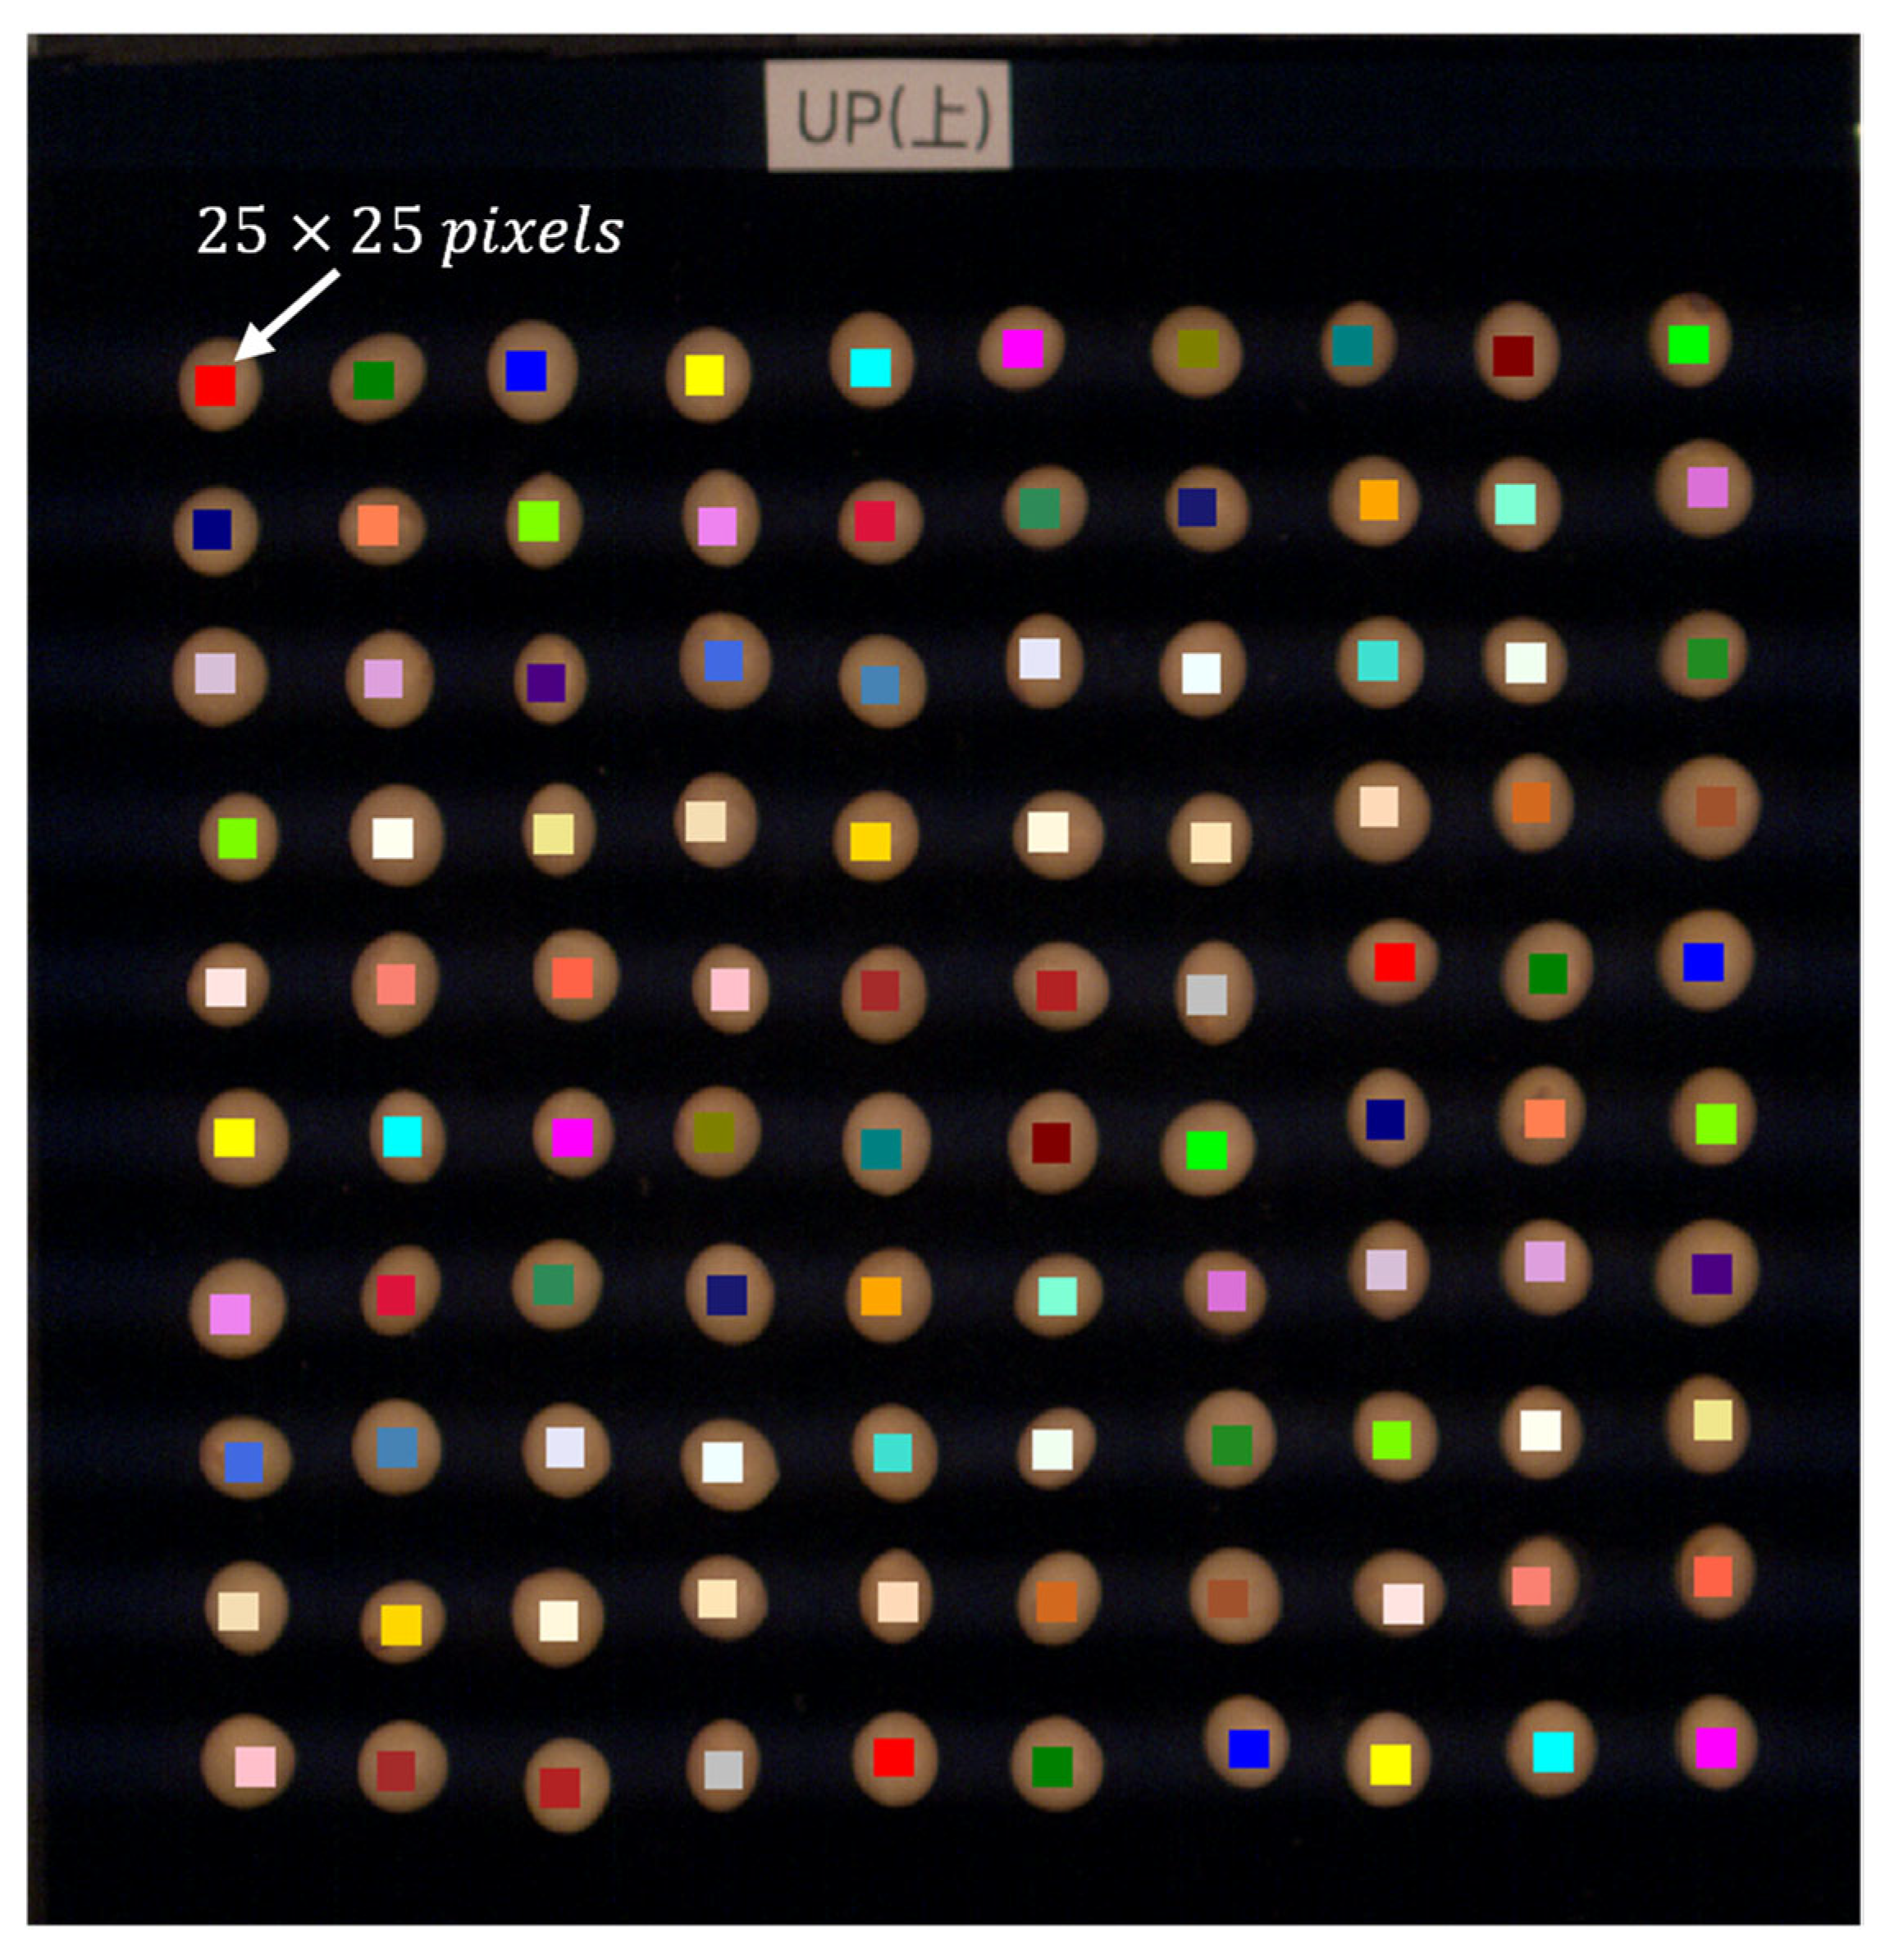
Based on the calibrated reflectance images, a region of interest (ROI) was defined for each individual seed (
Figure 3). Specifically, a 25 × 25 pixel square region located at the geometric center of each seed was selected, and the mean reflectance of all pixels within this region was extracted as the spectral representation of that seed. This central-ROI strategy was adopted because reflectance near seed edges is more susceptible to curvature effects, shadowing, and local surface heterogeneity, whereas the central region generally provides more stable spectral responses. Previous studies on seed-sized objects and segmented kernels have also shown that central pixels are less affected by curvature-related distortion and that relatively small centrally located ROIs can still provide reasonably accurate classification results [
27,
28]. Therefore, using the mean reflectance from the central region helped reduce the interference caused by edge shadows, background contamination, and local morphological variation, thereby improving the stability of single-seed spectral extraction.
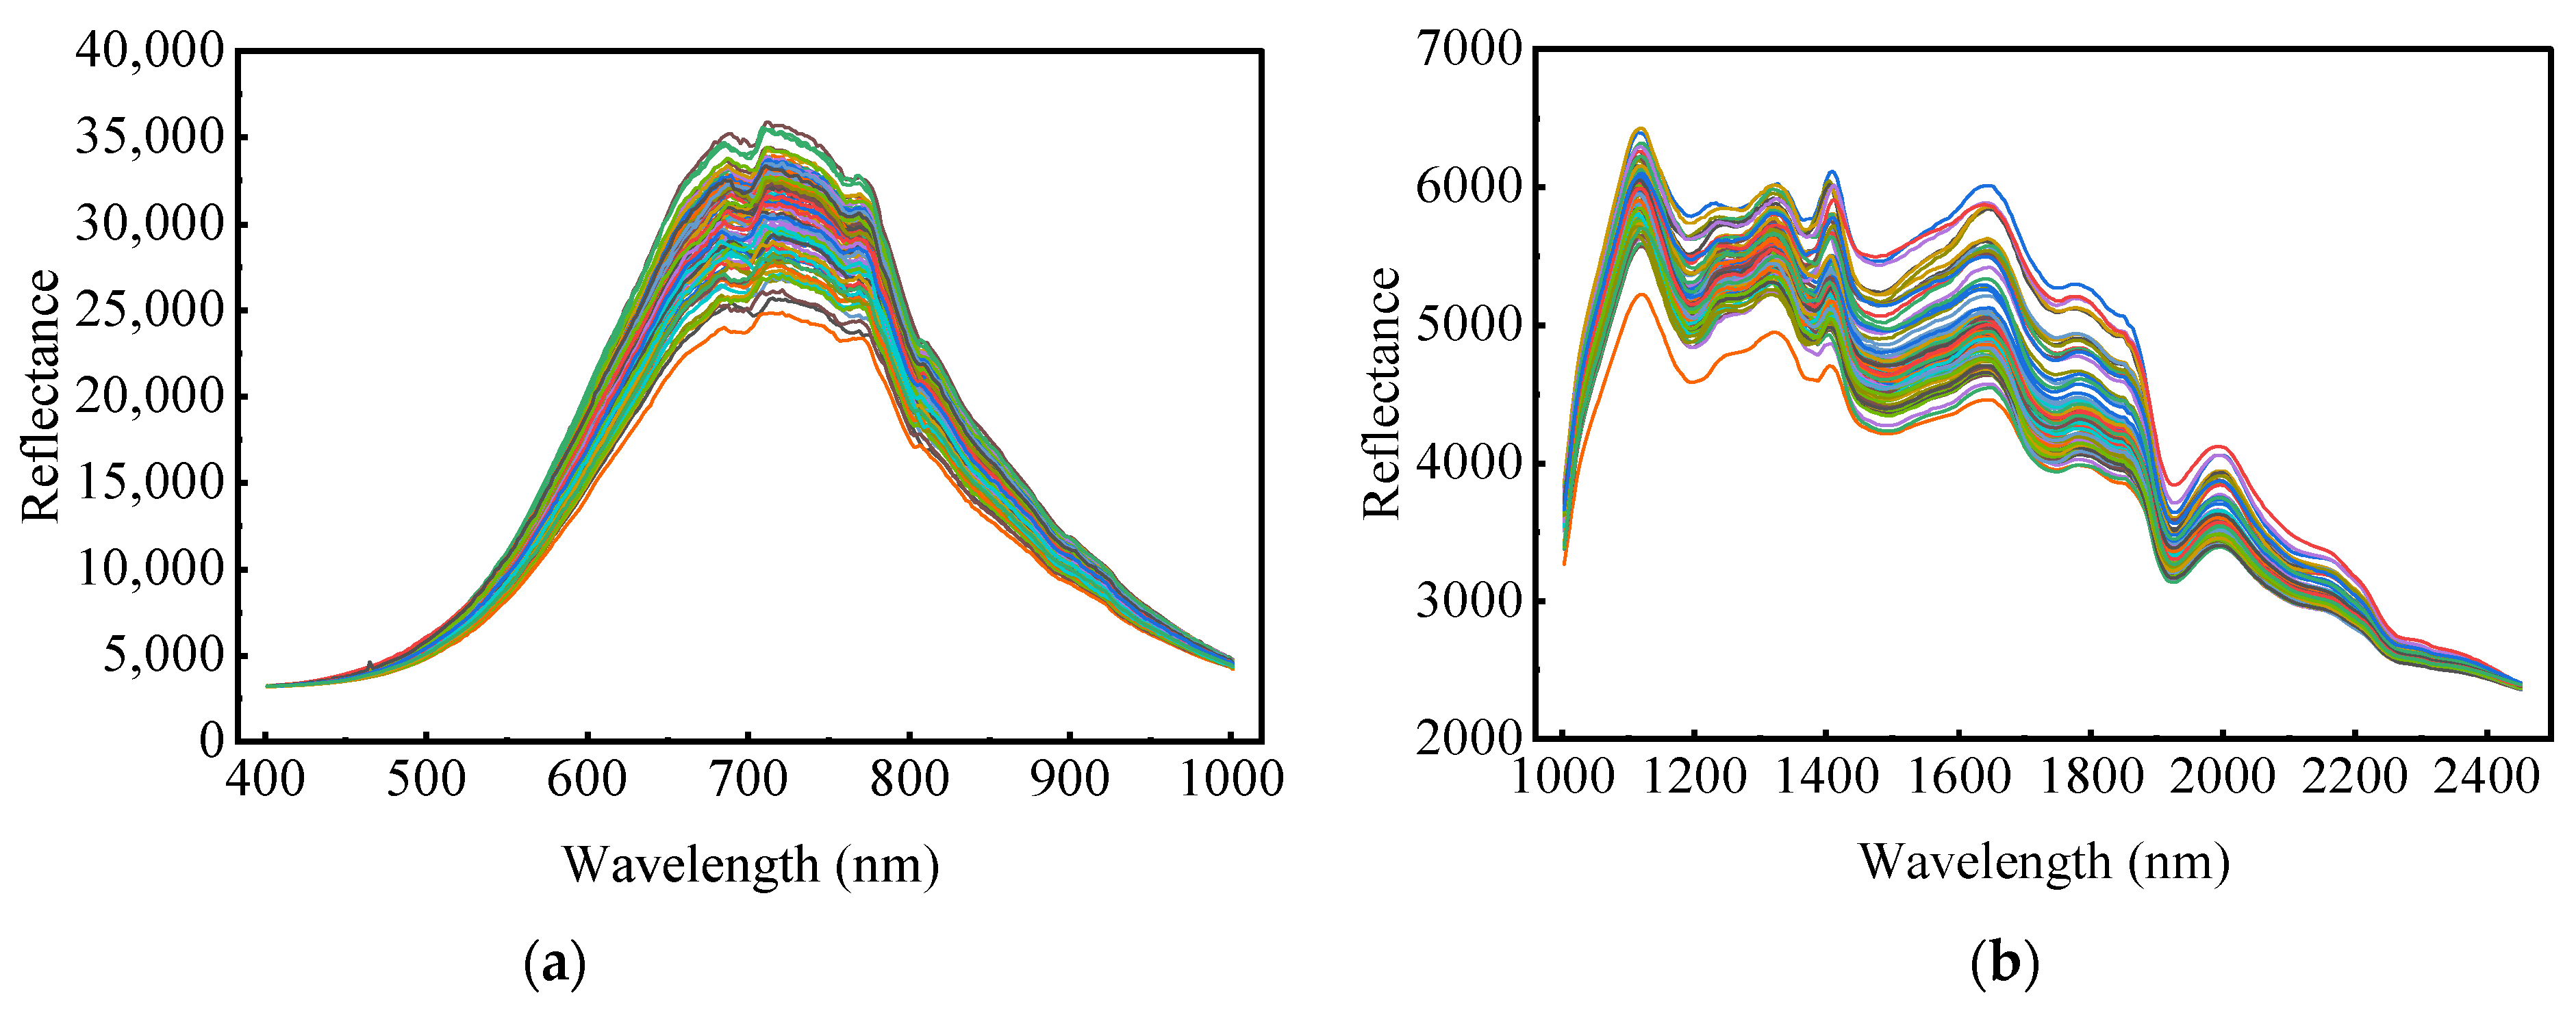
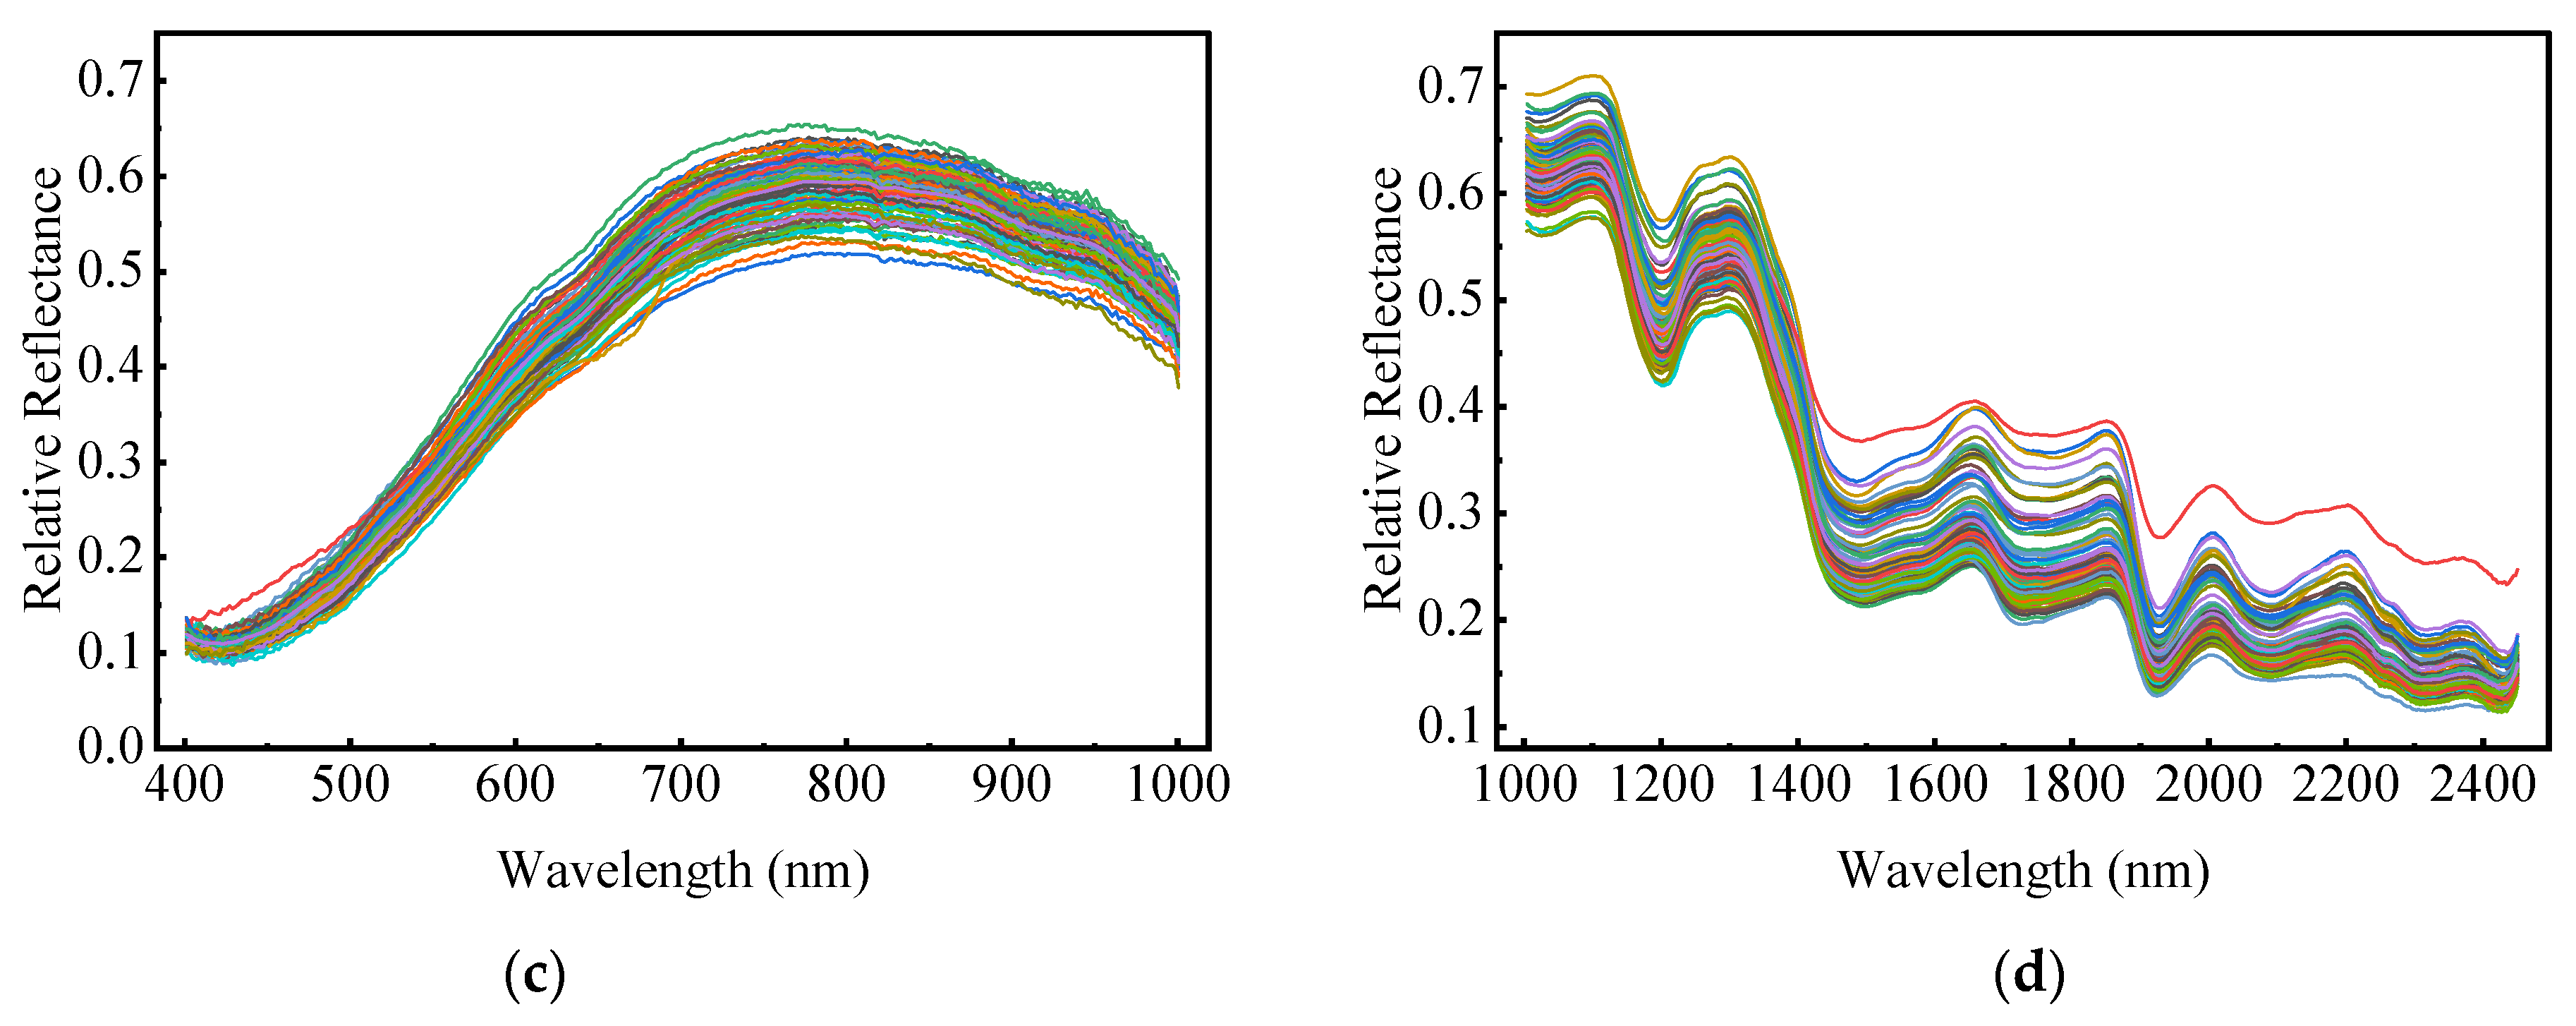
After calibration, relatively large fluctuations and poor stability were still observed at both ends of the spectral acquisition range, especially in the SWIR region. Such instability at edge bands is common in hyperspectral imaging and is generally attributed to reduced detector response and increased noise near the limits of the sensor range [
29,
30].
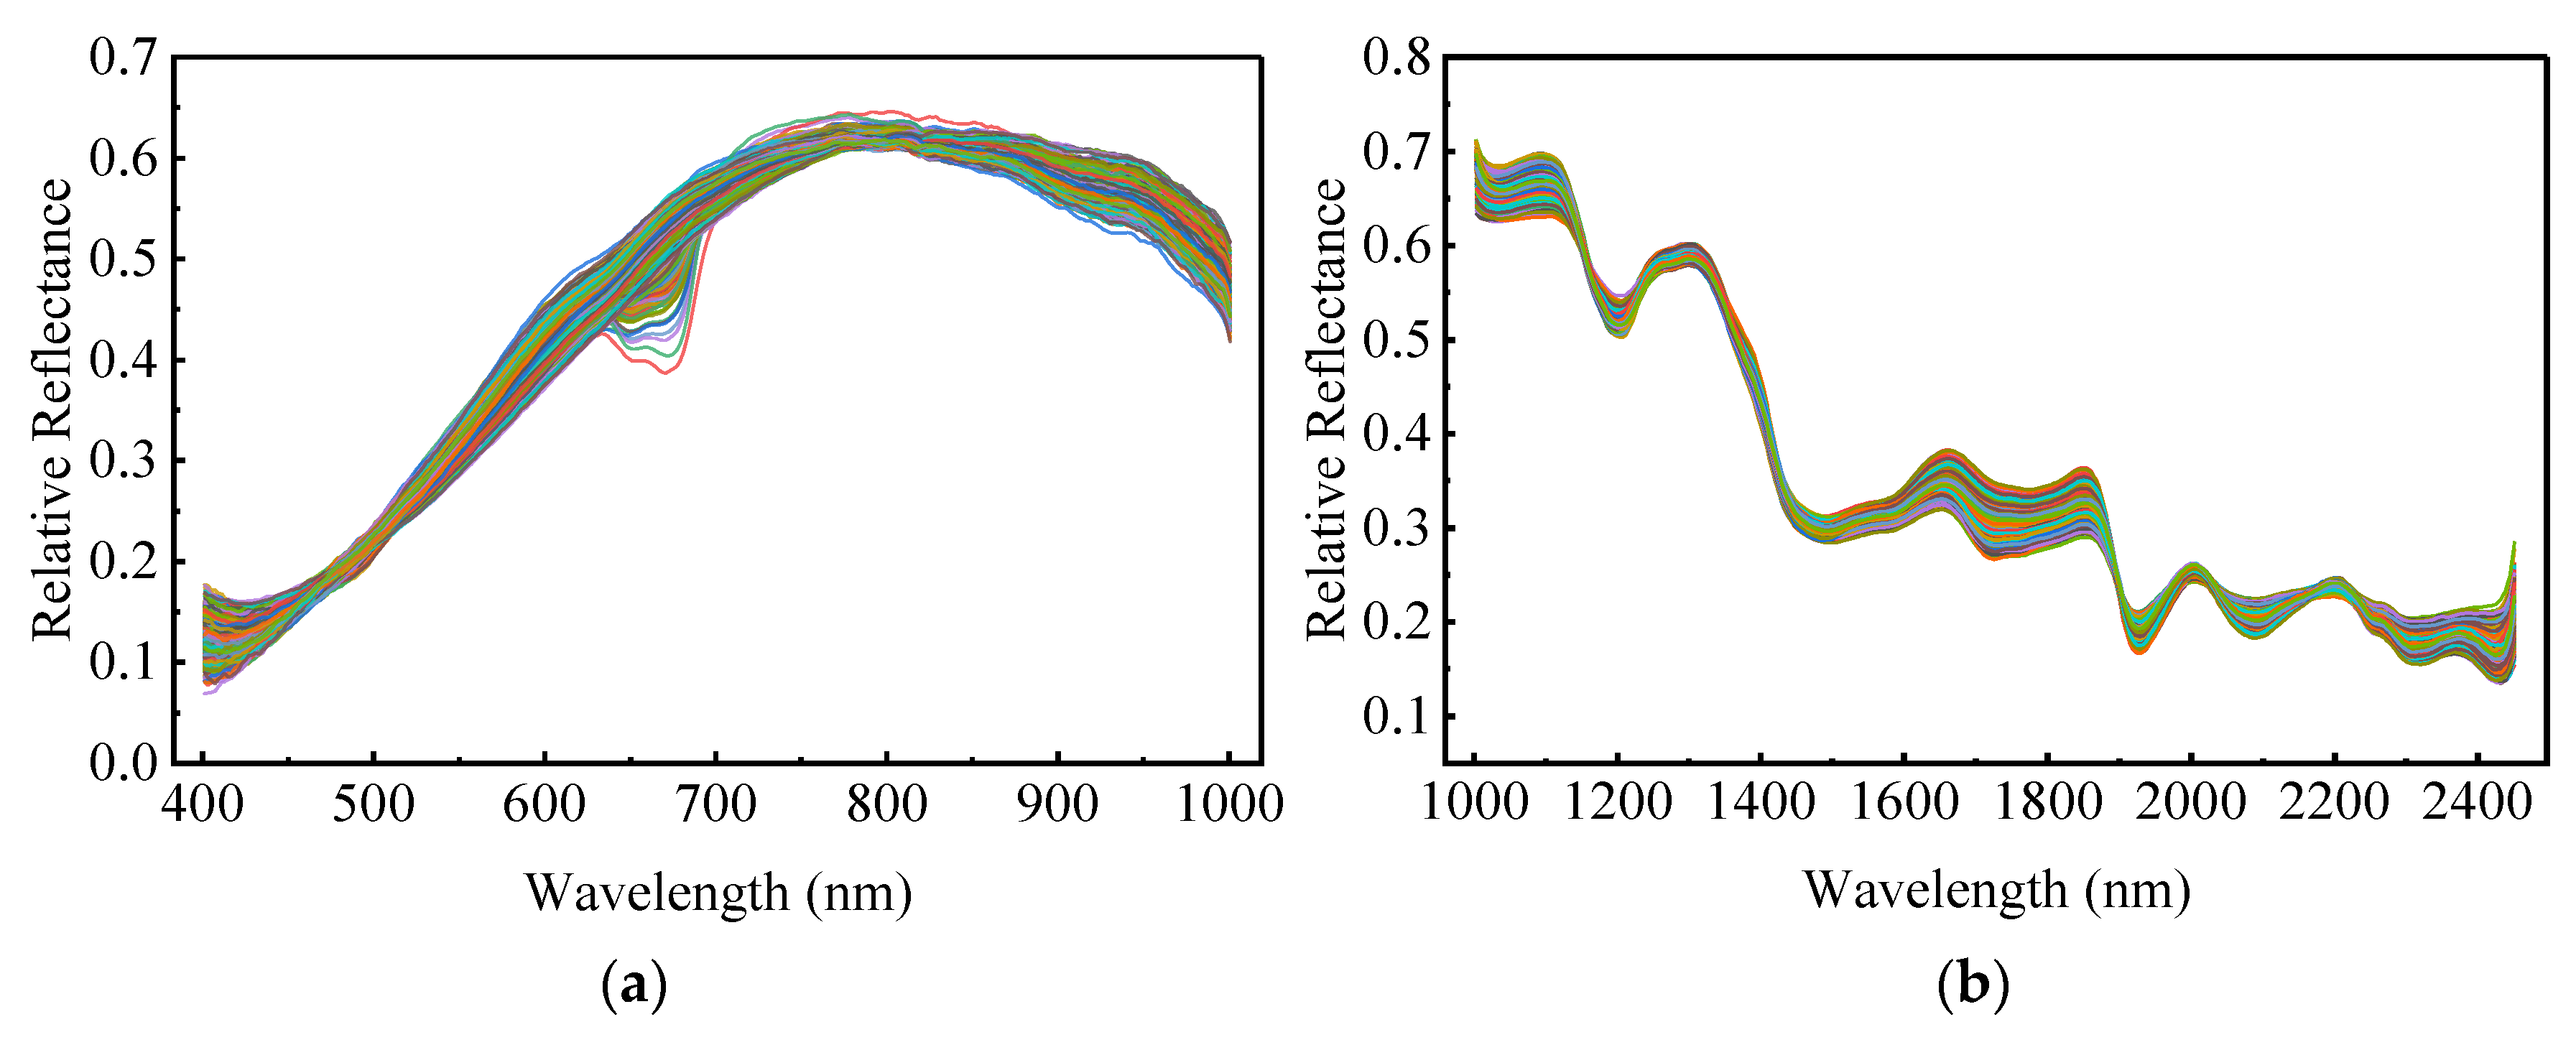
Figure 4 displays the comparison of ROI-extracted mean spectra before and after black-and-white calibration within the retained effective spectral ranges. Therefore, only the effective spectral ranges of 401.0–1000.9 nm and 1003.7–2450.79 nm were retained for subsequent analysis. These corresponded to 301 and 418 bands, respectively, for a total of 719 bands.
2.3. Standard Germination Test and Determination of Vigor-Related Indices
After hyperspectral data acquisition, a standard germination test was conducted to evaluate differences in the germination performance among soybean seeds subjected to different artificial aging durations and to provide physiological indices for subsequent vigor classification. The germination test was performed in accordance with GB/T 3543.4-2025, Rules for Agricultural Seed Testing—Germination Test [
31], and GB/T 5520-2011, Inspection of Grain and Oils—Seed Germination Test [
32]. The tested samples included seeds from four soybean cultivars subjected to five aging durations (0, 24, 48, 72, and 96 h), with the 0 h treatment used as the non-aged control.
For each cultivar at each aging duration, three biological replicates were prepared, with 100 seeds per replicate. The germination test was carried out in sterile germination trays (30 cm × 20 cm) lined with double-layer quantitative filter paper as the germination bed. To minimize the influence of surface moisture differences caused by the aging treatment, all aged seeds were naturally air-dried for 24 h in a well-ventilated laboratory environment at 25 °C before the germination test. All samples were then tested under the same incubation conditions.
Three vigor-related indices, namely germination rate, germination energy, and germination index, were used to characterize the physiological performance of soybean seeds after artificial aging. Germination rate was used to reflect the final ability of seeds to produce normal seedlings within the specified test period [
33]. Germination energy was used to characterize the speed and uniformity of germination at the early stage [
34]. Germination index was used to describe the dynamic characteristics of the germination process by taking into account the number of newly germinated seeds at different time points [
23]. These three indices were jointly used to characterize vigor differences among artificially aged soybean seeds.
Germination rate was expressed as the percentage of normal seedlings on the 8th day relative to the total number of tested seeds, and it was calculated as follows:
where
is the germination rate,
is the number of normal seedlings on Day 8, and
is the total number of tested seeds.
Germination energy was expressed as the percentage of normal seedlings on the 4th day relative to the total number of tested seeds, and it was calculated as follows:
where
is the germination energy,
is the number of normal seedlings on Day 4, and
is the total number of tested seeds.
Germination index was used to reflect the dynamic progression of germination and was calculated as follows:
where
is the germination index,
is the number of newly formed normal seedlings on Day
,
is the corresponding day of germination, and
is the final day of observation.
The measured values of these three indices were subsequently subjected to comprehensive analysis and used as the basis for subsequent vigor classification.
2.4. Spectral Data Processing
2.4.1. Spectral Data Preprocessing
In this study, multiplicative scatter correction (MSC), standard normal variate transformation (SNV), Savitzky–Golay smoothing (SG), and Savitzky–Golay second-derivative transformation (D2) were applied to the raw spectra, and the effects of different preprocessing methods on subsequent classification performance were compared [
5,
35,
36,
37]. The parameter settings for each preprocessing method are listed in
Table 3.
Among these methods, MSC and SNV were mainly used to reduce the influence of scattering effects on spectral intensity. SG smoothing was used to smooth the spectral curves and reduce random noise, whereas D2 was used to enhance local spectral variations while weakening baseline drift. Subsequently, based on the same training set and evaluation strategy, the results obtained from different preprocessing methods were compared, and the optimal preprocessing method was selected for subsequent dimensionality reduction and classification modeling.
2.4.2. Spectral Data Dimension Reduction
After preprocessing, the spectral data still exhibited a large number of bands, strong inter-variable correlations, and substantial information redundancy. Therefore, dimensionality reduction was further performed on the preprocessed spectral data to reduce the feature dimensionality.
Principal component analysis (PCA) and minimum noise fraction (MNF) were selected as the dimensionality reduction methods. PCA maps the original spectral bands into a set of mutually uncorrelated principal components through linear transformation, thereby compressing the data dimensionality [
38]. MNF, by contrast, takes noise information into account during the transformation process and is used to improve the separation between useful signals and noise [
39]. Both methods were implemented based on the same preprocessed data, and their applicability was compared in combination with subsequent classification results. The final dimensionality reduction method for vigor classification of artificially aged soybean seeds was then determined.
2.5. Model Construction and Evaluation Method
2.5.1. Construction of Classification Model
Three representative machine learning models, Random Forest (RF), Extreme Gradient Boosting (XGBoost), and Support Vector Classifier (SVC), were used for soybean seed vigor classification. These models represent different classification strategies, including ensemble learning and kernel-based methods, and provide complementary perspectives for exploring the relationships between hyperspectral features and seed vigor classes.
Among them, the RF model was also used for screening preprocessing methods and dimensionality reduction methods. Based on the same training set and evaluation strategy, the classification performances under different preprocessing results and different dimensionality reduction results were compared, and the optimal preprocessing method and dimensionality reduction method for subsequent modeling were determined accordingly. On this basis, RF, XGBoost, and SVC classification models were further constructed using the optimal feature data, and their classification performances were comparatively analyzed.
2.5.2. Data Set Division and Evaluation Method
Based on the comprehensive analysis of the germination test results, the samples aged for 0, 48, and 96 h were used to represent the high-, medium-, and low-vigor classes, respectively, and a classification dataset was constructed accordingly. With four soybean cultivars and 300 seeds per selected aging duration for each cultivar, the final dataset contained 3600 seed samples in total, including 1200 samples for each vigor class (
Table 4).
The dataset was divided into a training set and an independent test set at a ratio of 8:2 using stratified random sampling. The training set contained 2880 samples, and the independent test set contained 720 samples, corresponding to 960 and 240 samples in each vigor class, respectively. The independent test set was used only for the final evaluation of model generalization performance.
Five-fold cross-validation was performed within the training set. In each fold, four-fifths of the training set was used for model training and one-fifth for validation, yielding 2304 CV training samples and 576 CV validation samples per fold. Based on this framework, preprocessing methods were first compared to determine the optimal preprocessing strategy, followed by comparison of dimensionality reduction methods under the selected preprocessing condition. RF, XGBoost, and SVC models were then constructed using the selected features, and their final performances were evaluated on the independent test set. Accuracy, Recall, and F1-score were used as the main evaluation metrics [
40].
3. Results and Analysis
3.1. Seed Germination Test Results and Vigor Grade Division
3.1.1. Germination Dynamics Under Different Aging Durations
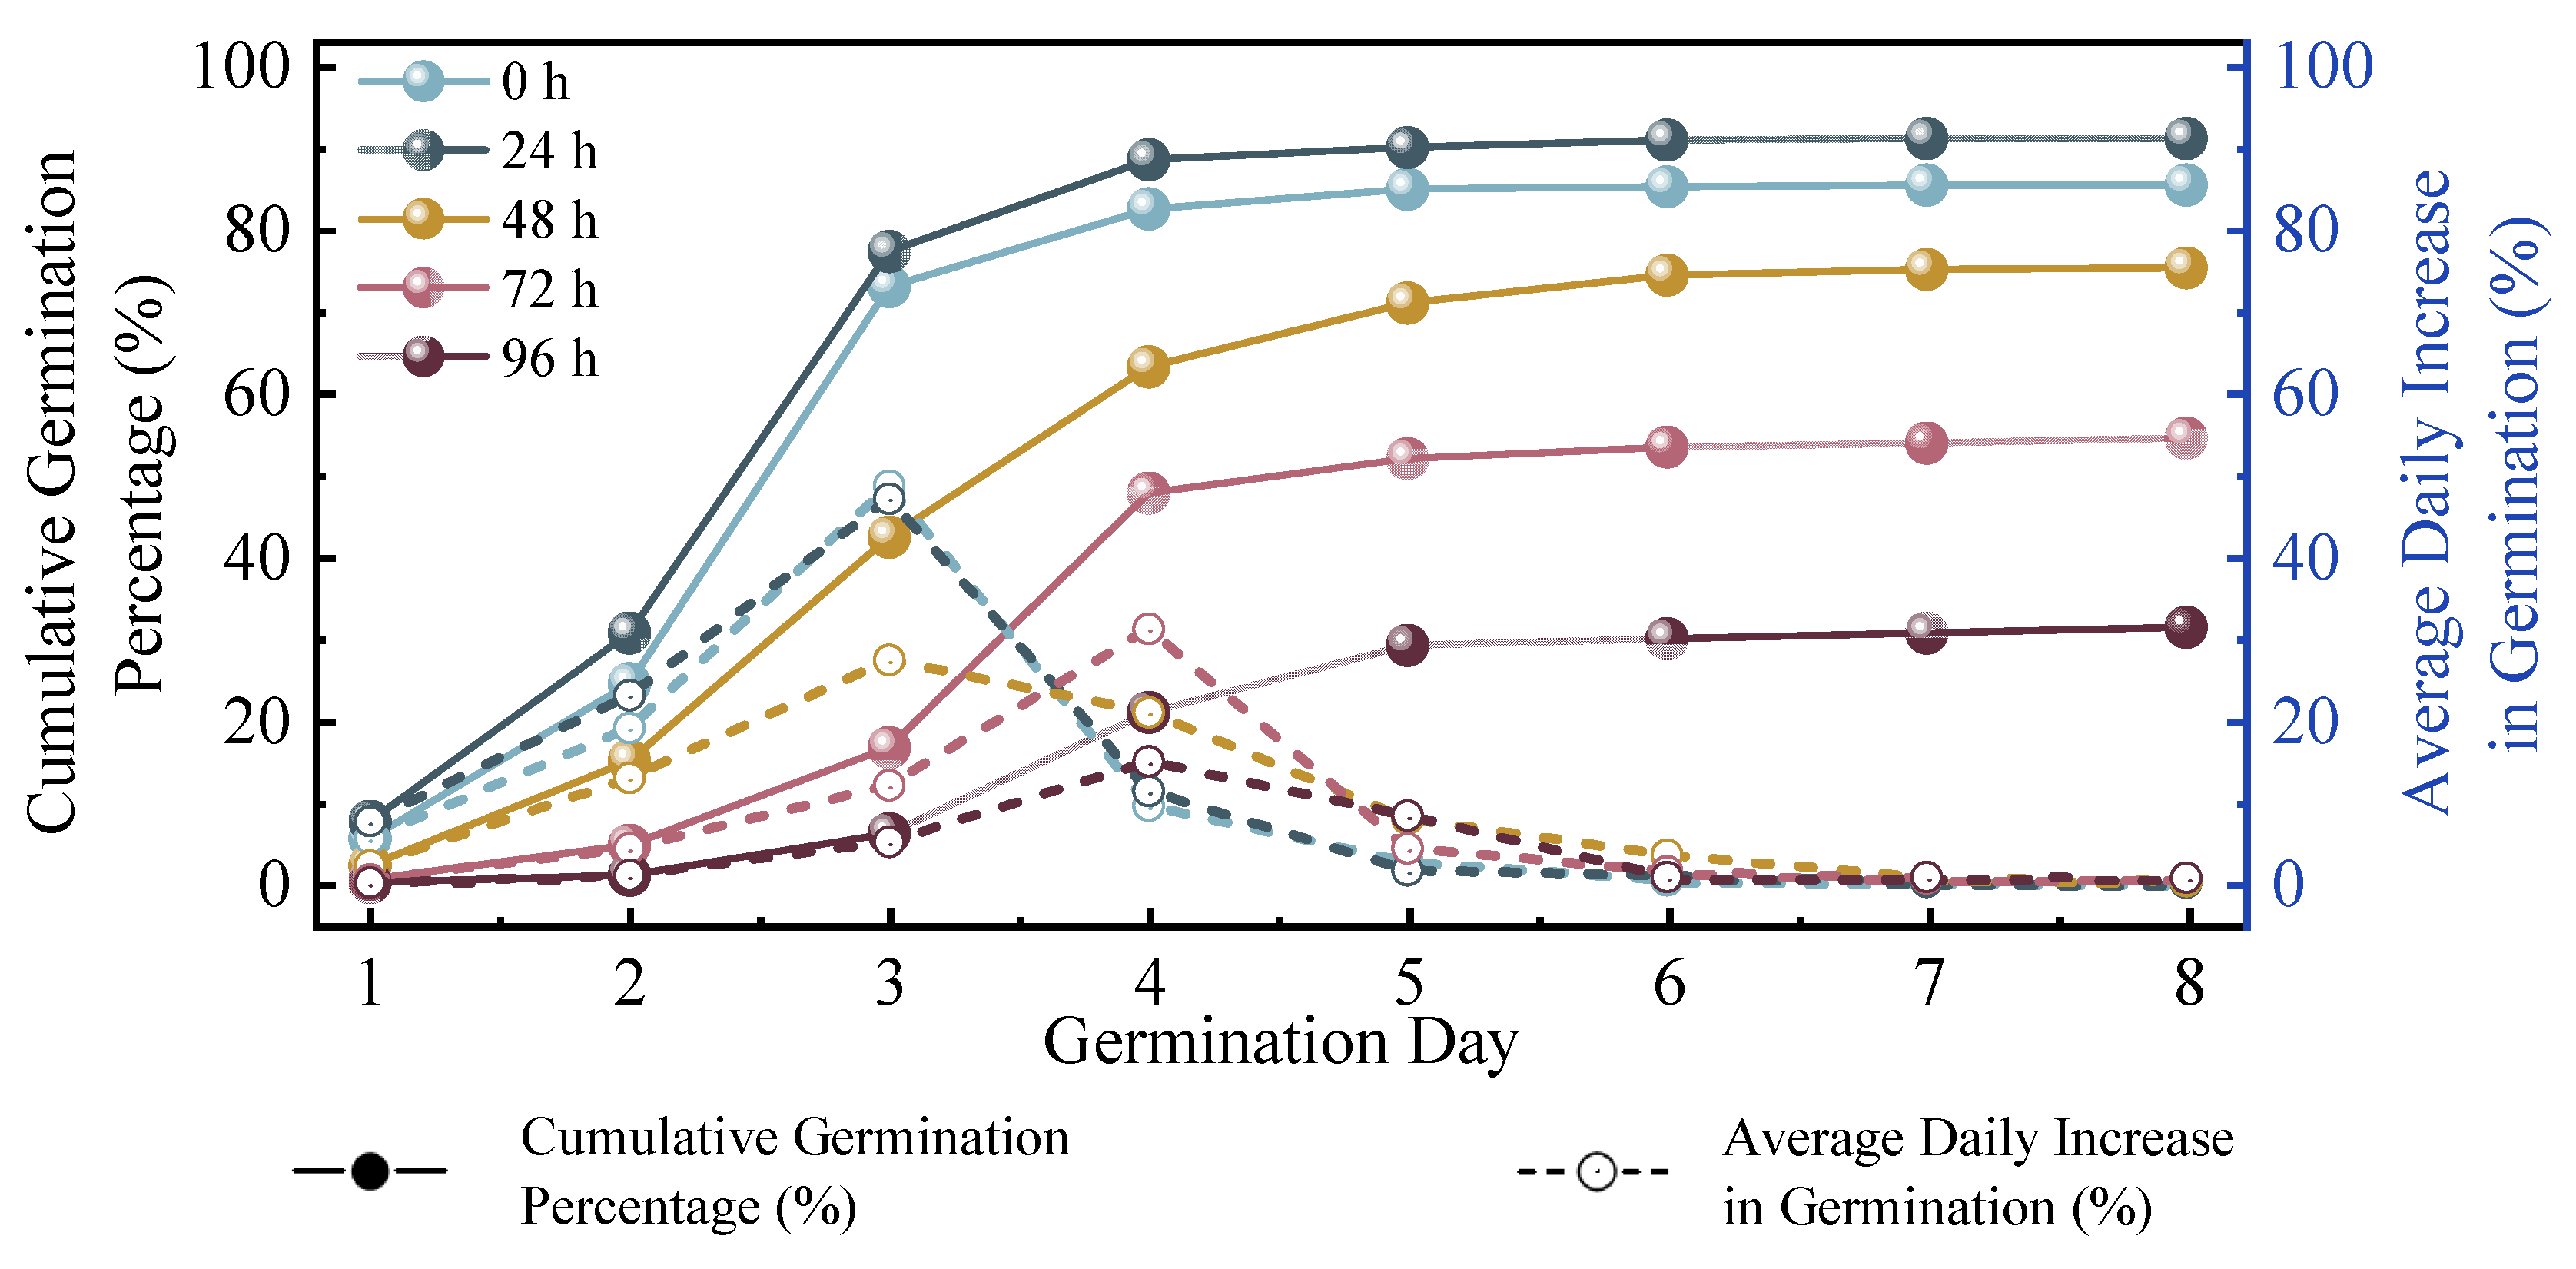
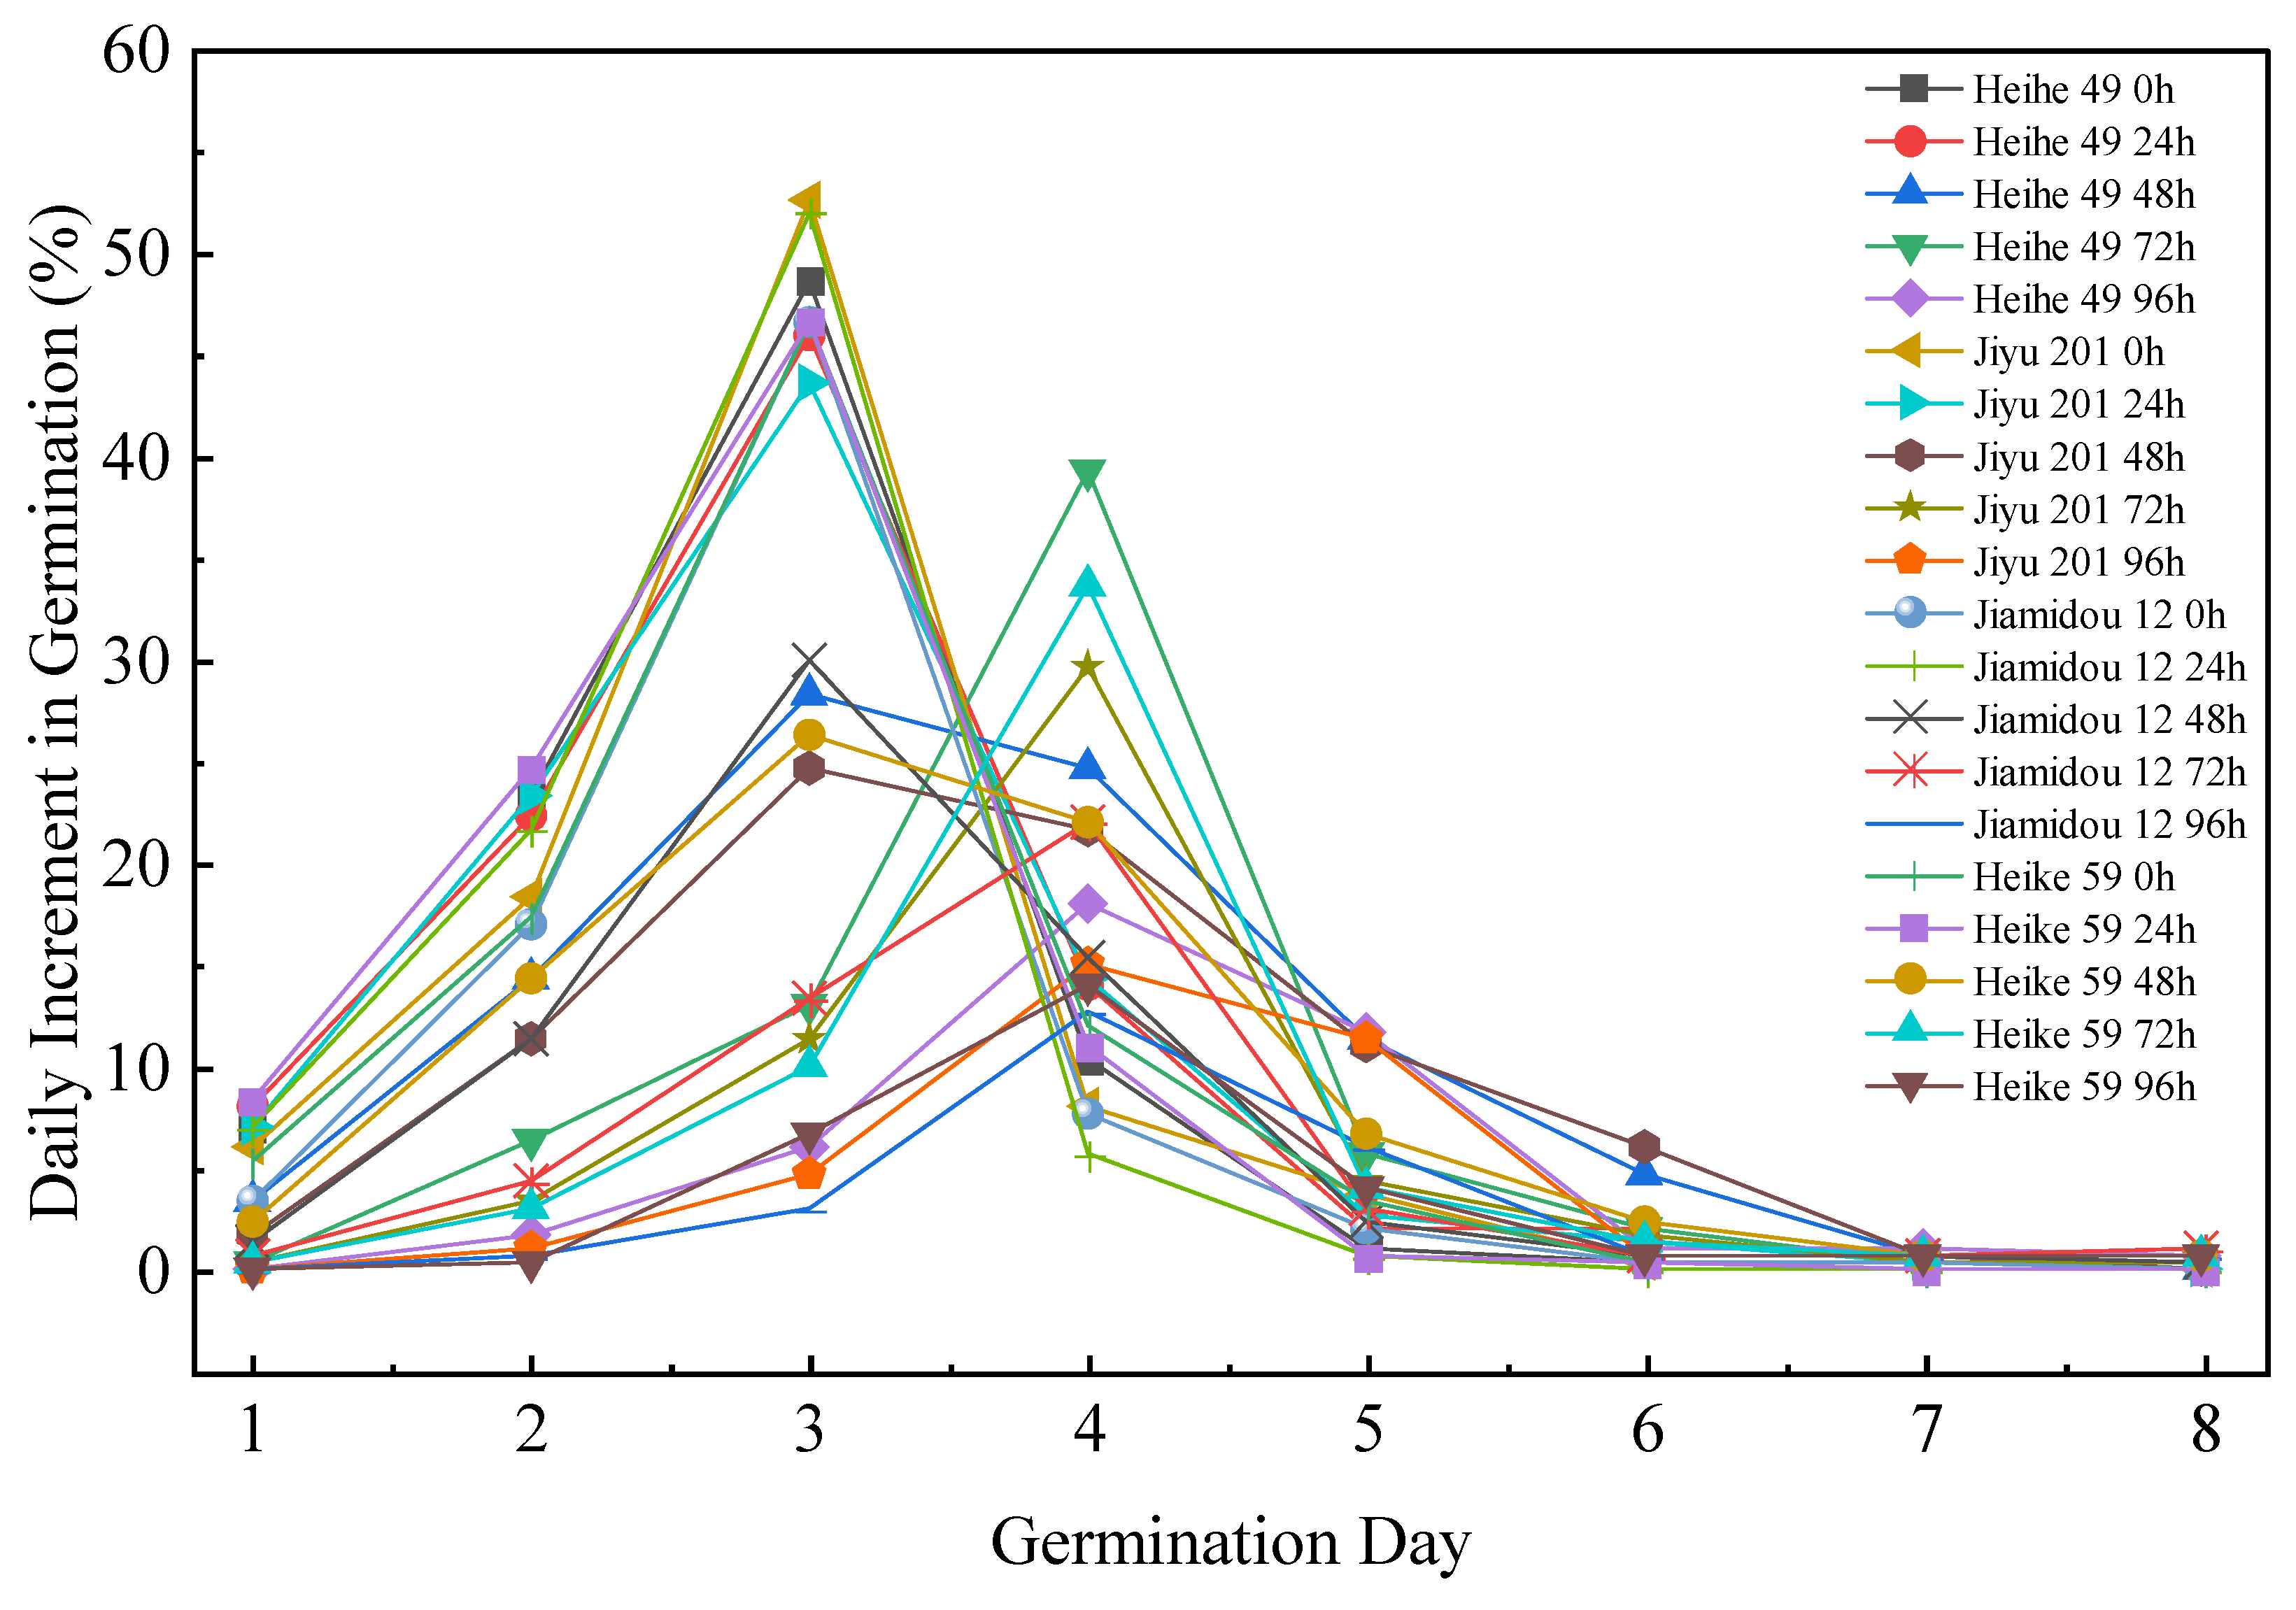
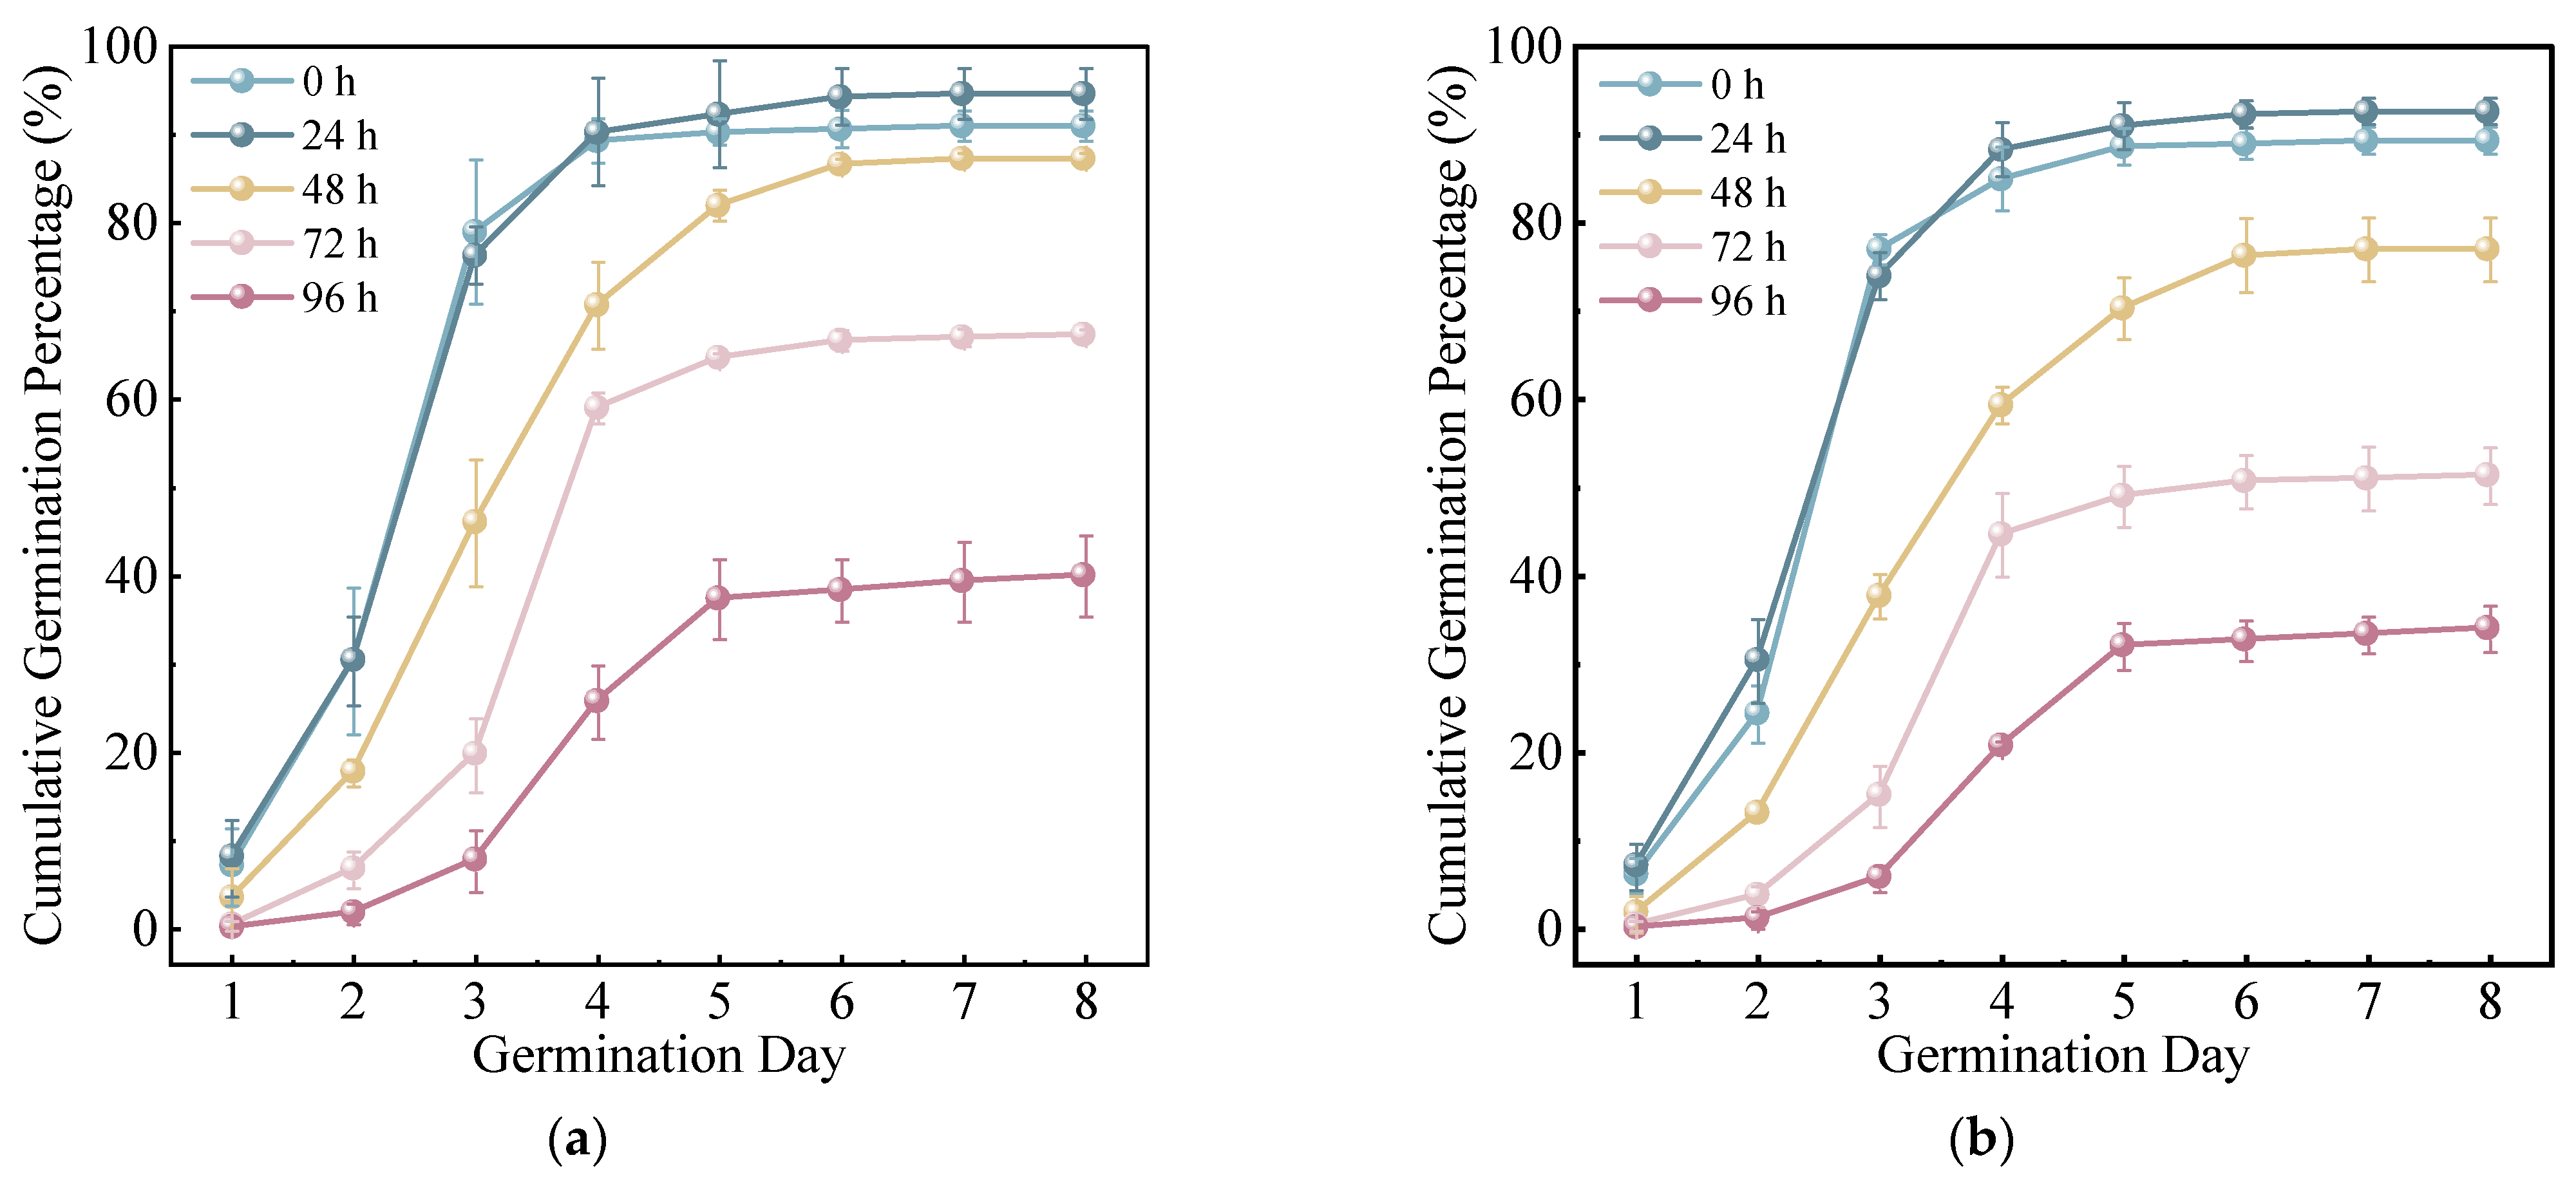
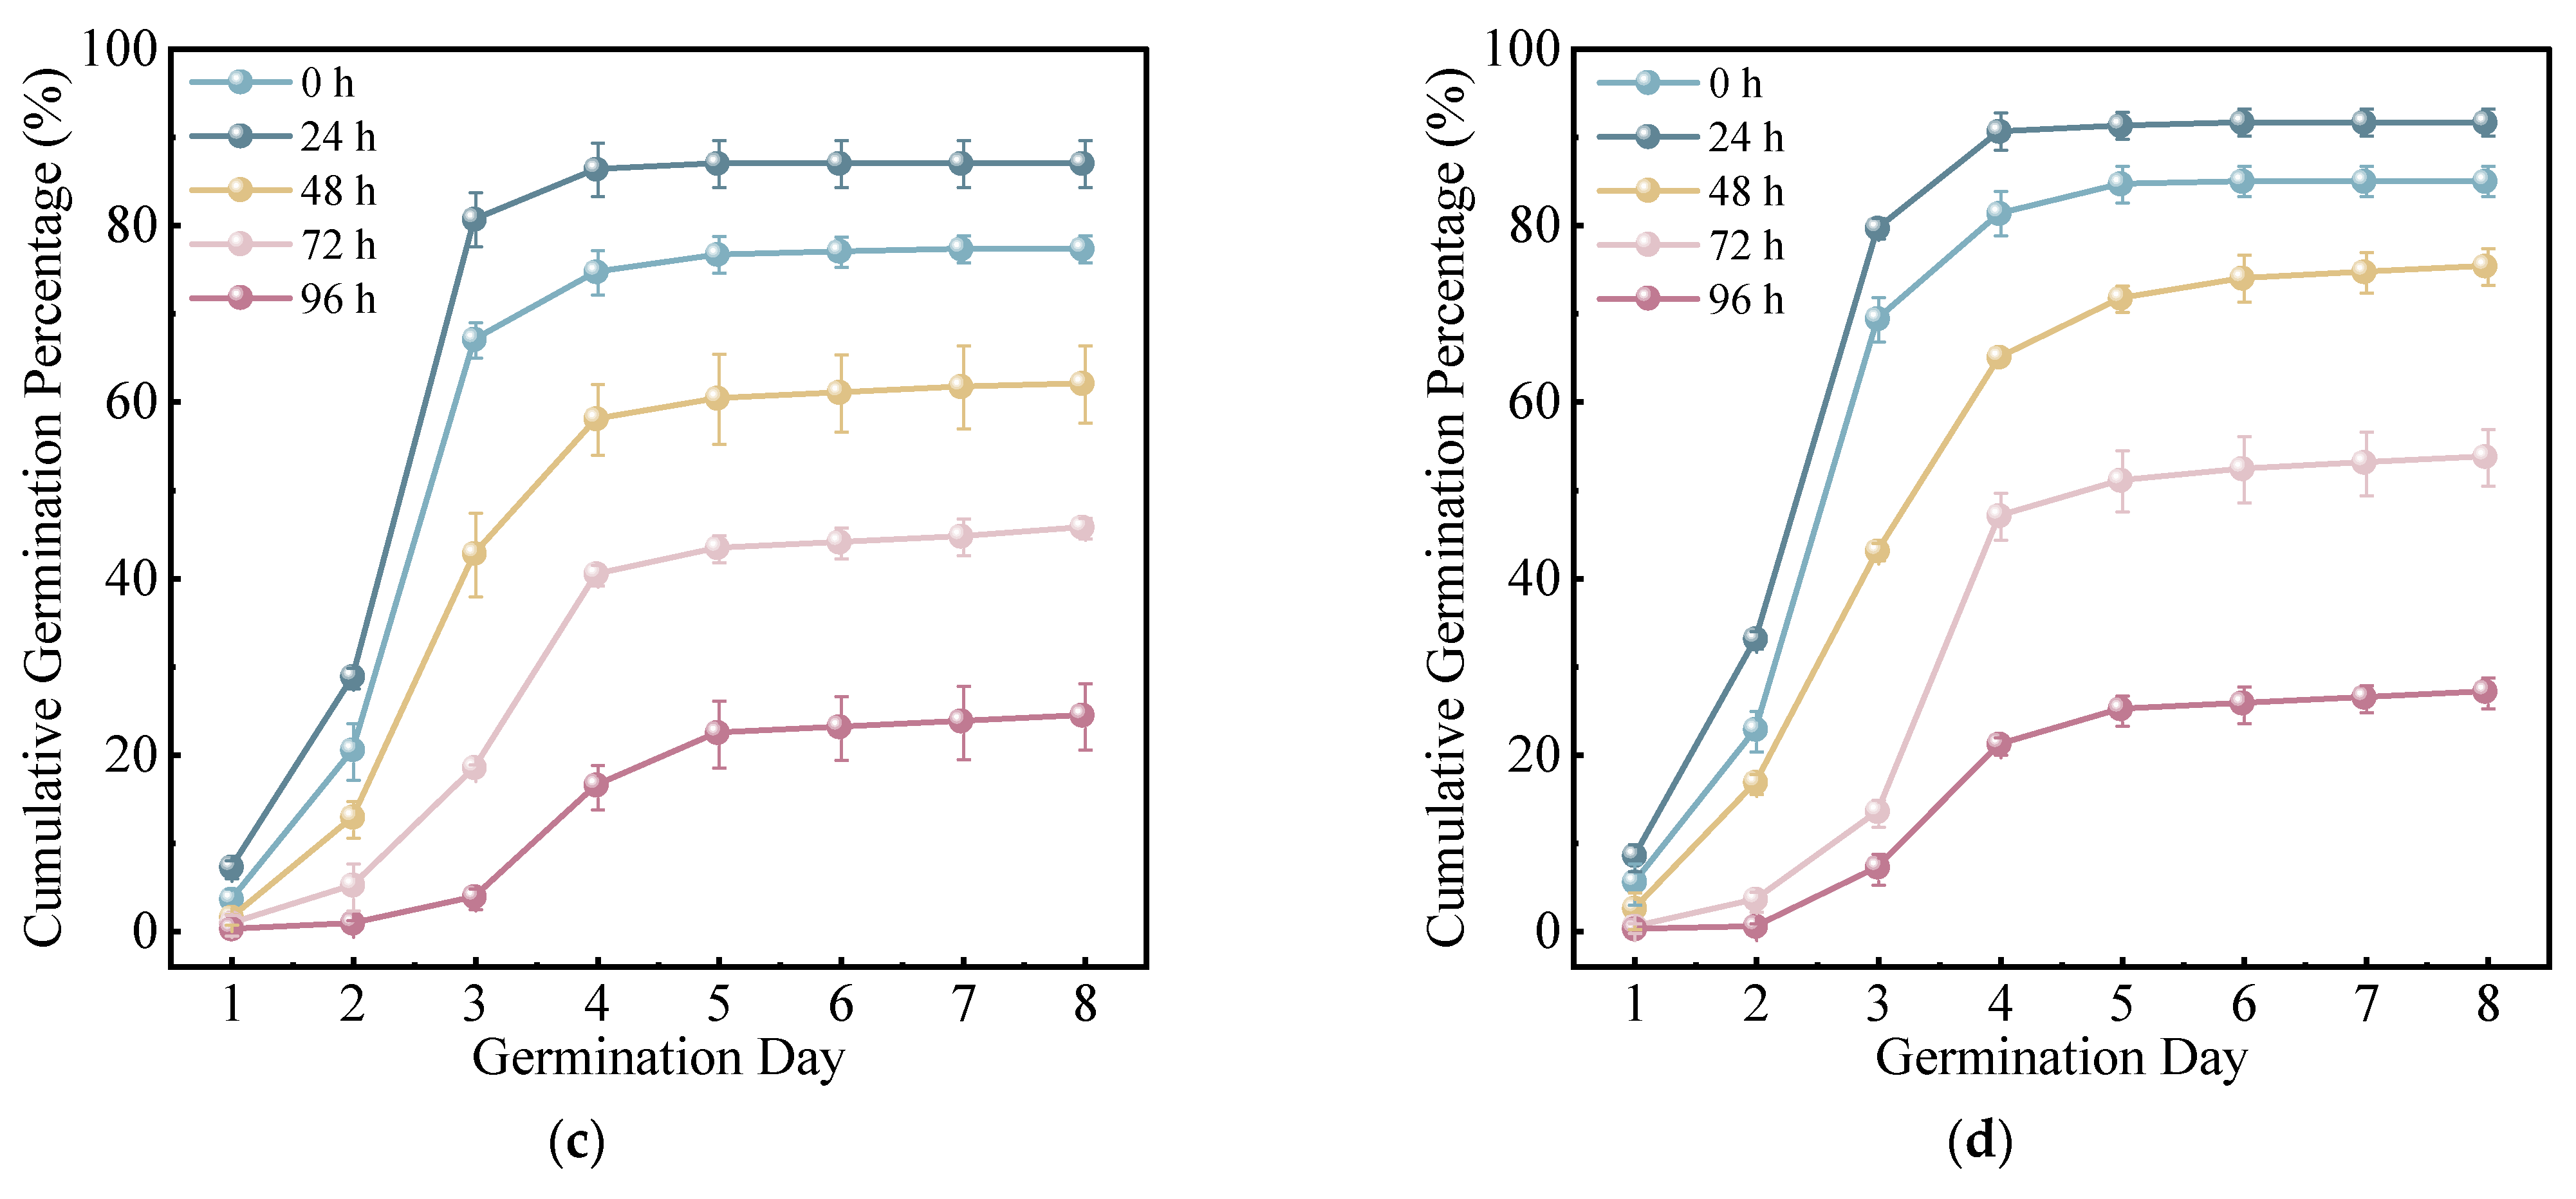
To evaluate the effect of artificial accelerated aging on soybean seed germination behavior, daily germination and cumulative germination were compared under different aging durations at both the overall and cultivar-specific levels (
Figure 5,
Figure 6 and
Figure 7). When cultivar differences were not considered, the germination process showed a clear aging-dependent pattern. Seeds subjected to 0 h and 24 h aging initiated germination earlier, exhibited a concentrated daily germination peak on Days 2–3, and reached a stable cumulative germination plateau by Days 4–5. With increasing aging duration, germination onset was progressively delayed, the daily germination peak became lower and more dispersed, and the cumulative germination curve rose more slowly and stabilized at a lower final level. The 96 h treatment showed the strongest inhibition, indicating severe deterioration of both germination capacity and germination synchrony.
The cultivar-specific germination curves showed the same general trend, although the magnitude of decline varied among cultivars. Under 0 h and 24 h aging, all four cultivars maintained relatively rapid and synchronized germination. After 48 h aging, daily germination peaks declined markedly and cumulative germination curves became less steep, indicating a clear reduction in germination speed and uniformity. Under 72 h and 96 h aging, these changes became more pronounced, and inter-cultivar differences were more evident. Overall, the germination dynamics consistently demonstrated that artificial aging established a continuous vigor deterioration gradient from mild to severe aging.
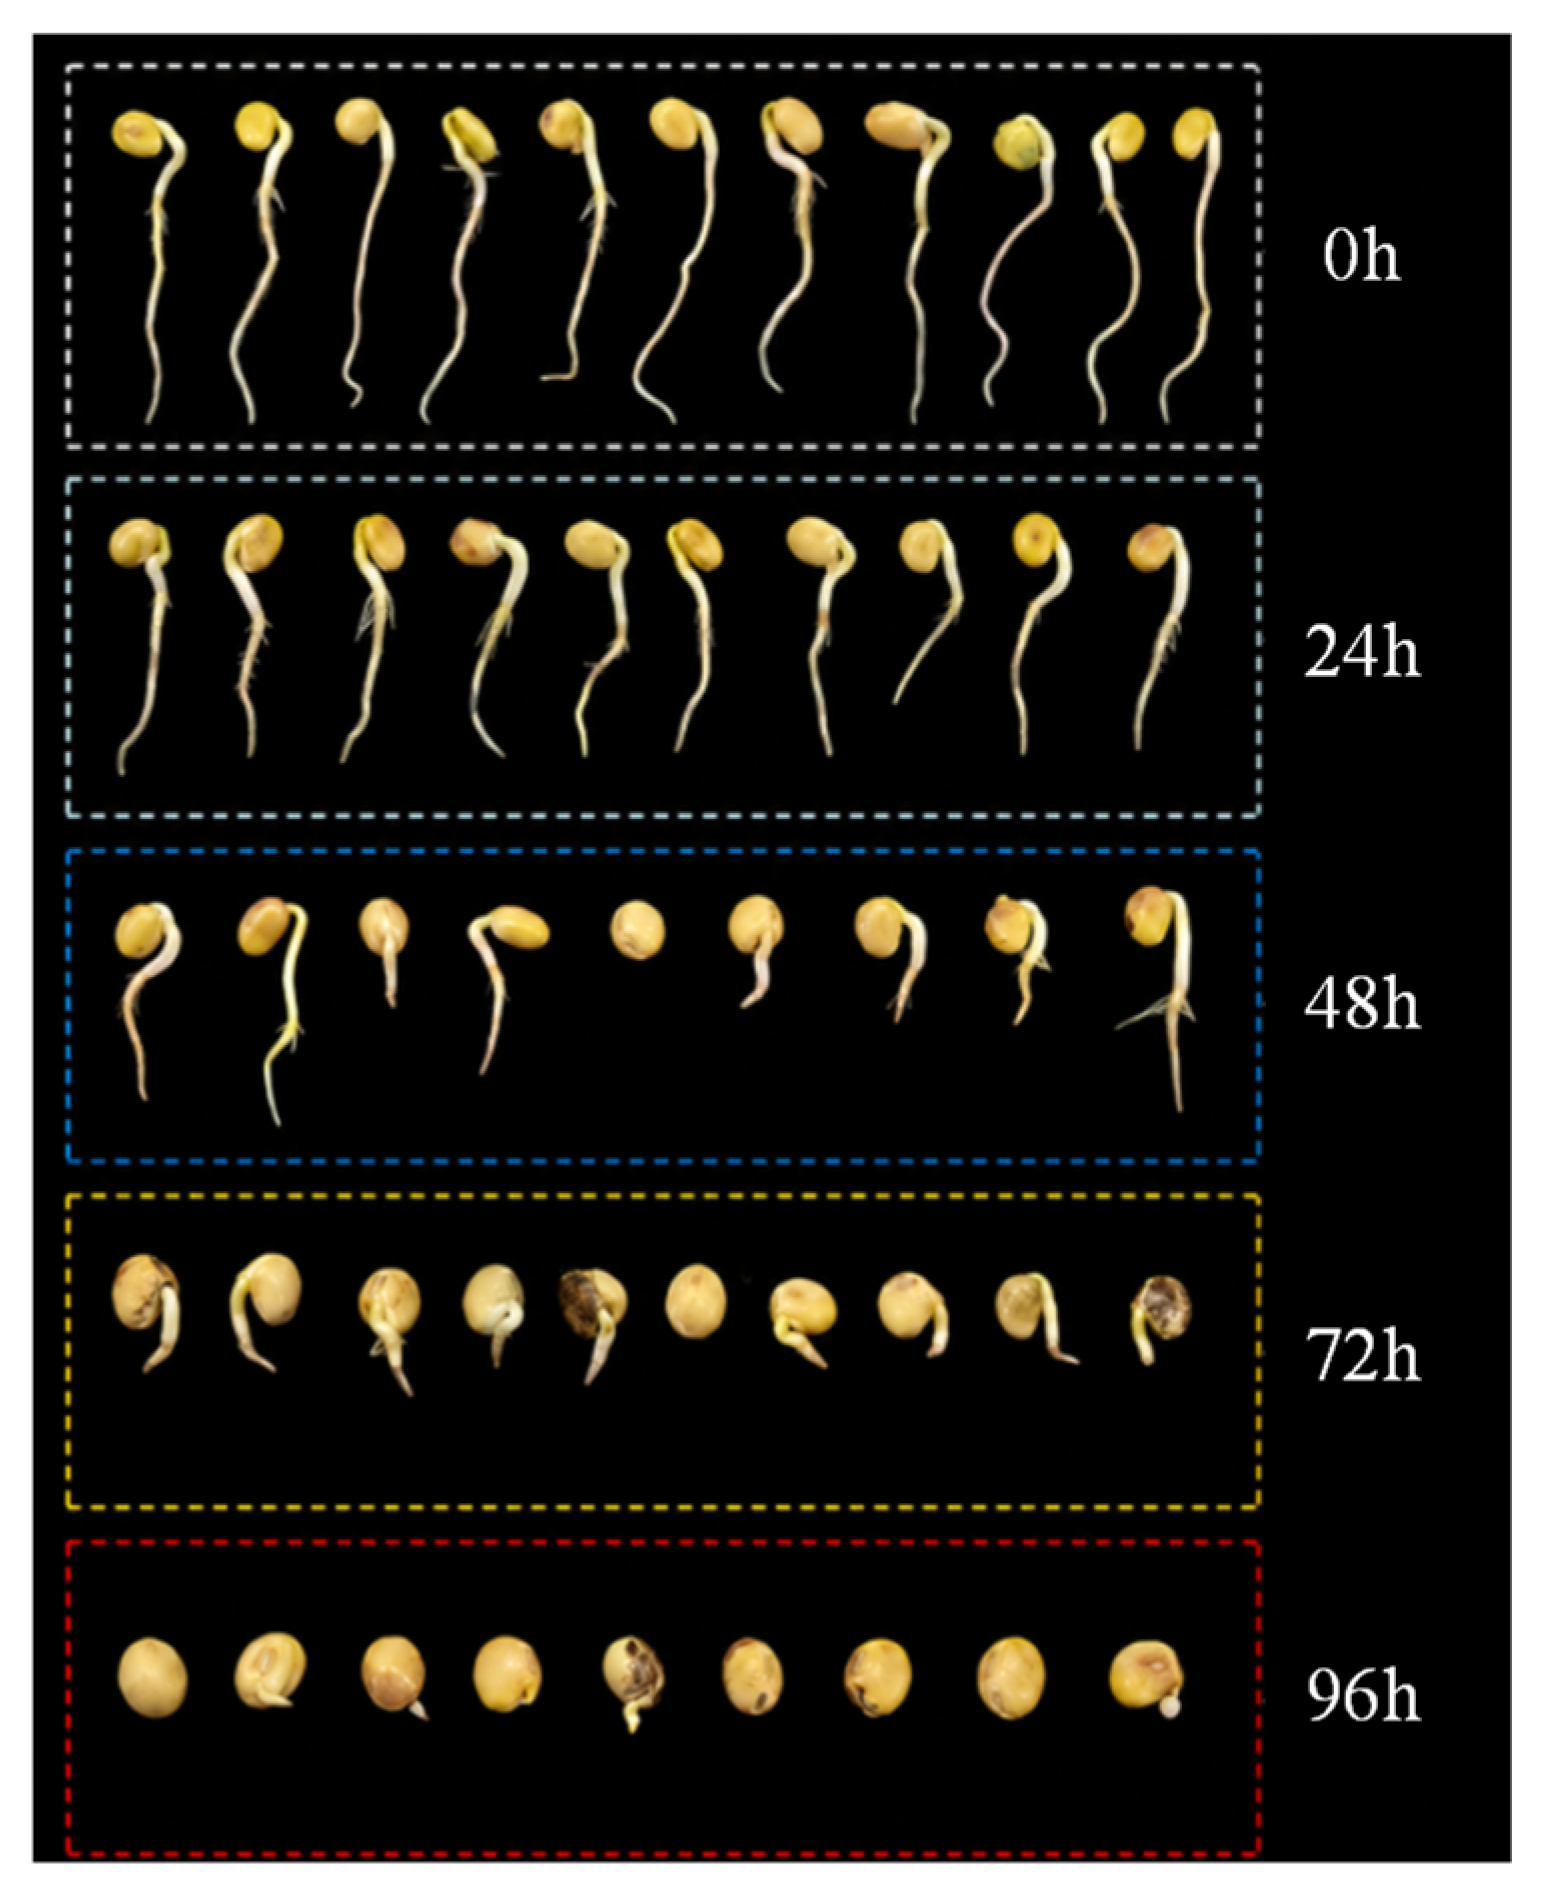
In addition to the germination curves, the representative seedling images further illustrated the changes in germination status under different aging durations (
Figure 8). In the 0 h treatment, most seeds germinated normally, with elongated radicles and relatively uniform seedling development. The 24 h treatment showed a similar growth pattern, although slight differences in radicle length and germination uniformity were observed. After 48 h of aging, normal germination decreased, and radicle elongation was evidently weakened, indicating that seed vigor had begun to decline. Under the 72 h and 96 h treatments, germination inhibition became more pronounced. Many seeds showed only short radicle emergence or failed to germinate, and abnormal or weak germination was more frequently observed. These phenotypic changes were consistent with the declining trends in germination rate, germination energy, and germination index, confirming that the artificial aging treatment produced a progressive deterioration in soybean seed vigor.
3.1.2. Variation in Vigor-Related Indices and Determination of Vigor Classes
For the subsequent hyperspectral analysis and classification modeling, the objective was not to distinguish all five aging durations as five final classes but to construct three relative-vigor groups with clear physiological meaning and sufficiently distinct class boundaries. Therefore, vigor classification was determined based on the combined behavior of germination rate, germination energy, and germination index rather than on aging duration alone. This classification strategy was expected to satisfy two conditions: first, the selected groups should show stable and interpretable hierarchical differences in germination performance; second, they should reflect progressive vigor deterioration while minimizing excessive overlap between adjacent categories, thereby providing reliable labels for subsequent model training [
2,
4,
22].
The statistical results of germination rate, germination energy, and germination index supported this strategy (
Table 5). Across the four cultivars, all three indices showed a consistent downward trend with increasing aging duration. The 0 h and 24 h treatments generally maintained relatively high values, whereas clear declines appeared after 48 h and became more pronounced at 72 h and 96 h. Among the three indices, germination energy and germination index showed stronger sensitivity to aging than germination rate, indicating that early germination ability and germination uniformity were impaired earlier than final germination capacity [
2]. Thus, the combined use of these three indices provided a more complete characterization of vigor deterioration than any single indicator alone. Since seed vigor is generally regarded as a complex physiological trait associated with germination speed, uniformity, and seedling establishment potential rather than a single endpoint variable, a multi-index evaluation is more biologically appropriate for vigor classification [
22].
The 0 h treatment was identified as the high-vigor class because it consistently showed high germination rate, high germination energy, and high germination index across cultivars. These features indicate that the seeds remained in a physiologically intact state and can therefore represent the relatively optimal vigor level before aging damage occurred. In contrast, the 96 h treatment was identified as the low-vigor class because it consistently exhibited the lowest germination-related performance, including the lowest daily germination peak, the lowest cumulative germination plateau, and the lowest values of germination rate, germination energy, and germination index. This pattern indicates severe deterioration of seed physiological activity under prolonged aging stress.
The determination of the medium-vigor class was more critical. The 24 h treatment was not selected because its germination-related indices remained close to those of the 0 h treatment and in some cases did not show a consistent decline. This suggests that short-term aging had not yet produced a sufficiently distinct and stable vigor level and would therefore lead to substantial overlap with the high-vigor group. By contrast, the 48 h treatment showed coordinated declines in germination rate, germination energy, and germination index across the four cultivars, while still maintaining clearly better performance than the 96 h treatment. This pattern is consistent with a transitional physiological state between high and low vigor.
Although the 72 h treatment showed further deterioration, its overall performance was already closer to the low-vigor range in most indicators, especially in terms of reduced cumulative germination, germination energy, and germination index. If the 72 h treatment were defined as the medium-vigor class, the distinction between the medium- and low-vigor groups would be compressed. In comparison, the 48 h treatment not only avoided the substantial overlap between 24 h and 0 h, but also remained sufficiently separated from the strongly deteriorated 72 h and 96 h treatments. Therefore, based on the comprehensive analysis of germination rate, germination energy, and germination index, together with the statistical grouping results in
Table 5, the 0, 48, and 96 h treatments were finally used to represent high-, medium-, and low-vigor classes, respectively.
This classification strategy is also biologically reasonable. Seed aging progressively impairs membrane integrity, reserve mobilization, and metabolic homeostasis, so reductions in germination speed and germination uniformity generally occur before complete loss of final germination capacity [
41]. Therefore, defining vigor classes according to the integrated behavior of multiple germination-related indices is more biologically meaningful than assigning classes directly according to treatment duration alone.
3.2. Spectral Characteristics Analysis of Soybean Seeds with Different Aging Gradients
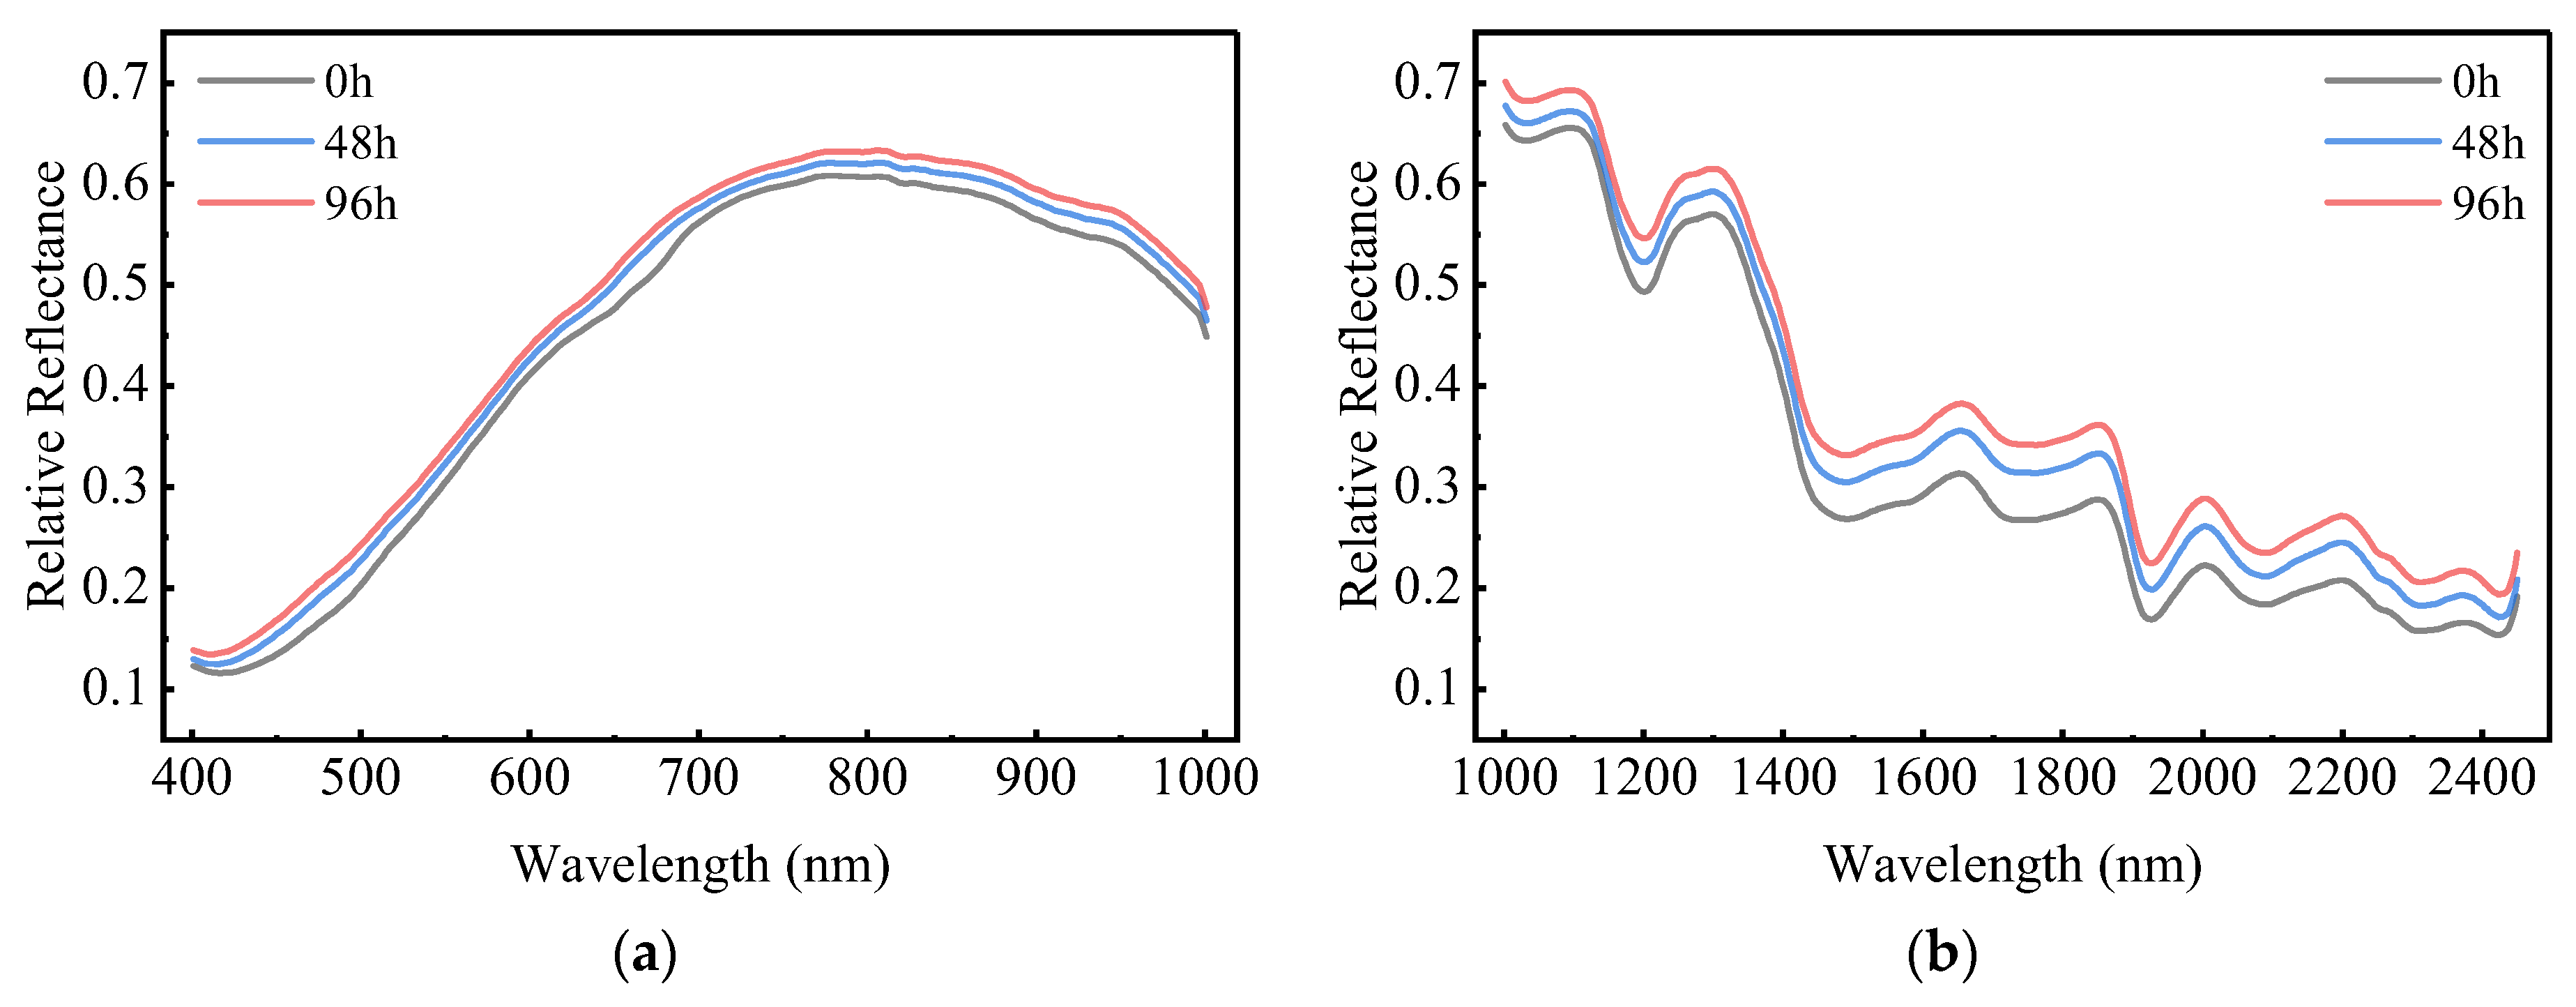
Based on the vigor classes defined above, the average spectral responses of high-vigor (0 h), medium-vigor (48 h), and low-vigor (96 h) soybean seeds were compared (
Figure 9). In both the VNIR and SWIR regions, the three classes showed similar overall spectral shapes but stable differences in reflectance level. This indicates that seed aging did not fundamentally alter the general spectral profile of soybean seeds, but it did produce measurable optical differences associated with vigor deterioration [
8].
In the 400–1000 nm region, the separation among the three vigor classes was present but relatively moderate. The low-vigor seeds generally showed slightly higher reflectance than the medium- and high-vigor seeds across much of this region. Because the VNIR region is influenced by both absorption and scattering, these differences may be related to changes in seed surface condition, internal tissue organization, and overall light-scattering behavior after aging [
42]. However, the class separation remained limited, indicating that the VNIR region captured only part of the vigor-related variation.
By contrast, the 1000–2500 nm region showed clearer and more stable separation among vigor classes. Across much of the SWIR range, the low-vigor seeds maintained relatively higher reflectance, the medium-vigor seeds were intermediate, and the high-vigor seeds showed relatively lower reflectance. This stronger separation is biologically plausible because the SWIR region is more sensitive to compositional information associated with O–H, C–H, and N–H bonds and is therefore more closely related to variation in lipids, proteins, water status, and other reserve substances [
43,
44]. Seed aging is known to involve oxidative stress, membrane lipid peroxidation, phospholipid degradation and remodeling, increased membrane permeability, and loss of intracellular stability [
44]. Such biochemical and structural changes can alter both absorption and scattering characteristics, thereby contributing to the clearer spectral differentiation observed in the SWIR region.
Overall, the spectral results were consistent with the physiological classification results. The three vigor classes shared a common spectral shape because they belonged to the same crop and seed type, but their reflectance levels differed systematically, particularly in the SWIR region. These differences suggest that aging-induced changes in seed composition and tissue condition can be reflected by hyperspectral responses. Since the experimental materials included four soybean cultivars, the possible influence of varietal differences on spectral characteristics was further examined.
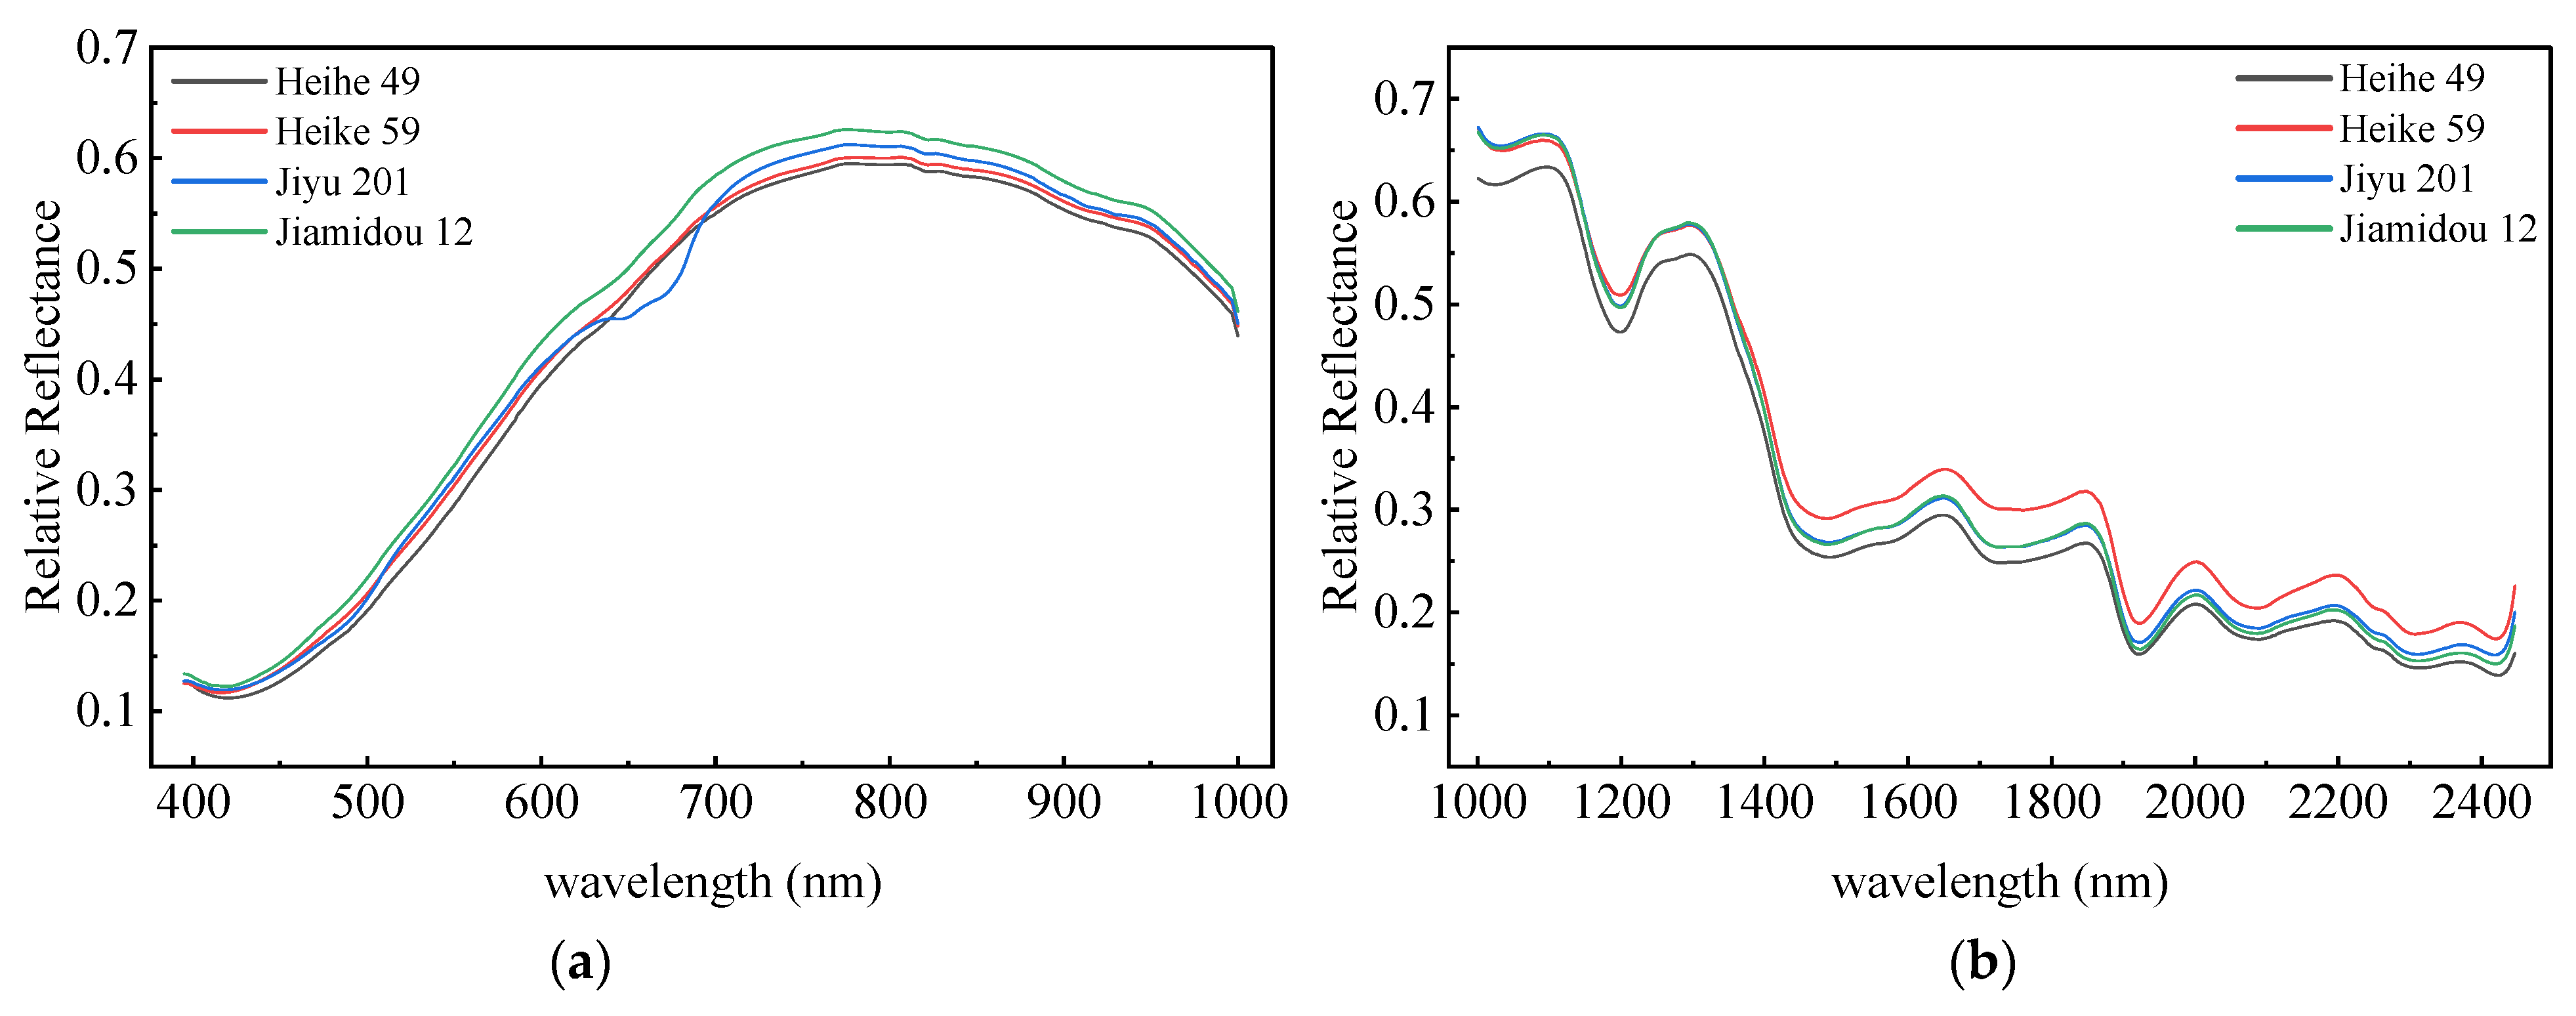
The average spectra of the four soybean cultivars were compared in the retained effective spectral ranges (
Figure 10). The four cultivars showed similar overall spectral profiles in both the 400–1000 nm and 1000–2500 nm regions, indicating that the common physicochemical characteristics of soybean seeds dominated the general spectral pattern. However, cultivar-related differences were observed at specific wavelength intervals. In the 400–1000 nm region, one cultivar maintained relatively higher reflectance over most wavelengths. In the 1000–1400 nm region, three cultivar curves were close to each other and higher than the remaining cultivar curve, whereas in the 1400–2500 nm region, the relative order of the curves changed and local crossings among the curves appeared. These results indicate that the influence of cultivar on spectral data was wavelength-dependent rather than a simple overall shift in reflectance. Such differences may be associated with varietal variation in seed coat properties, internal structure, and chemical composition.
3.3. Screening Results of Pretreatment Methods
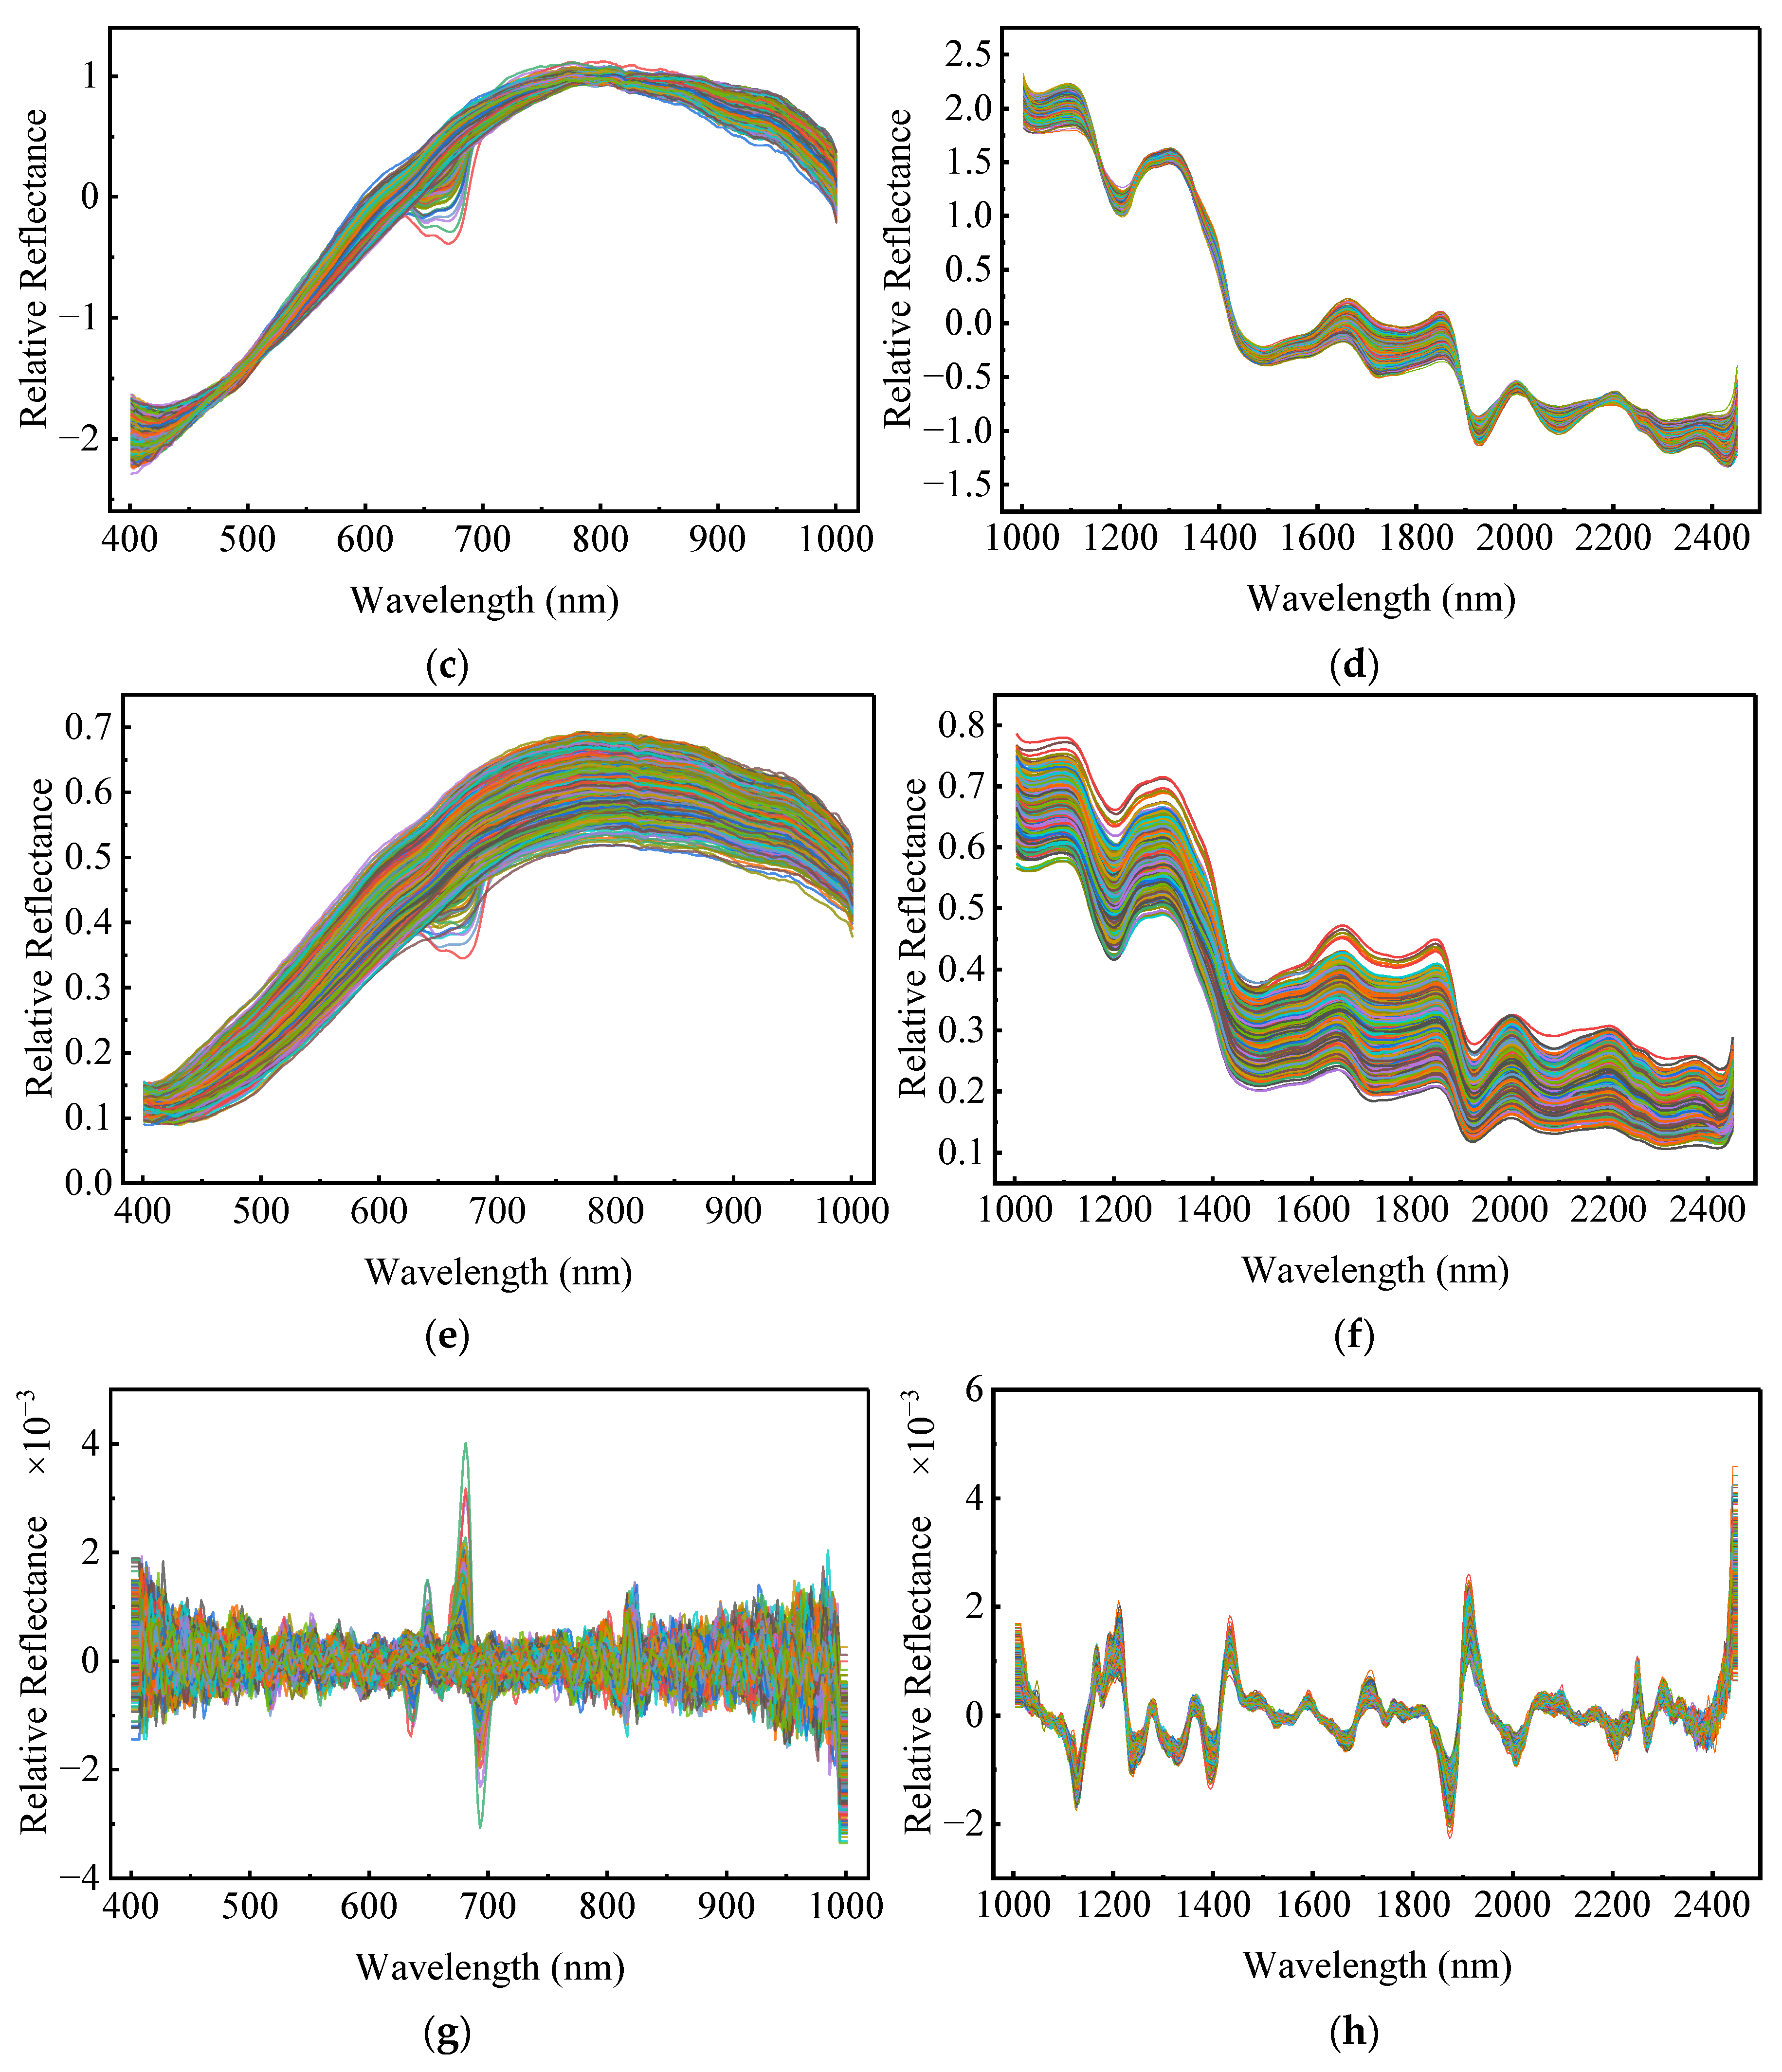
The spectral curves of soybean seeds under different preprocessing methods are shown in
Figure 11. As can be seen, the raw spectra exhibited a certain degree of baseline drift and differences in reflectance magnitude among samples. After MSC and SNV processing, the overall spectral shape remained stable, and the dispersion among sample curves was reduced, especially in the visible–near-infrared region, where the curve distribution became more concentrated. In contrast, SG processing mainly smoothed the spectral curves, but its effect on reducing differences among samples was relatively limited. D2 processing enhanced local spectral shape variations and made some characteristic peaks more prominent, but it also introduced more obvious fluctuations, resulting in reduced spectral stability. Overall, different preprocessing methods had markedly different effects on spectral morphology, among which MSC and SNV showed more evident advantages in improving spectral consistency.
The classification results obtained under different preprocessing methods are presented in
Table 6, and model performance was evaluated using Accuracy, Recall, and F1-score [
40]. As shown in the table, the effects of different preprocessing methods on model performance varied considerably. Compared with the raw spectra, SNV, MSC, and SG preprocessing improved the classification performance to different extents, indicating that appropriate preprocessing can effectively reduce spectral noise and redundant information and thereby enhance model stability and discrimination ability. Among these methods, SNV achieved the best performance, with training accuracy, recall, and F1-score of 82.29%, 82.34%, and 82.45%, respectively, and validation accuracy, recall, and F1-score of 80.18%, 80.09%, and 80.11%, respectively. MSC also showed relatively good performance, while SG led to only limited improvement. In contrast, the D2 preprocessing method resulted in lower performance than the raw spectra on both the training and validation sets, suggesting that this method may have amplified noise or weakened useful spectral information in the present dataset. Therefore, not all preprocessing methods were equally effective, and selecting an appropriate preprocessing method was essential for the vigor classification of aged soybean seeds.
Among the four preprocessing methods, SNV achieved the best classification performance. As shown in
Table 6, after SNV preprocessing, the model reached accuracy, recall, and F1-score values of 82.29%, 82.34%, and 82.45%, respectively, on the training set, and 80.18%, 80.09%, and 80.11%, respectively, on the test set. All of these metrics were higher than those obtained with the other preprocessing methods, and the results for the training and test sets were relatively close, indicating that this method improved classification accuracy while maintaining good stability. The classification performance of MSC was slightly lower than that of SNV, but it was still generally better than that of SG, D2, and the raw spectra, suggesting that scatter-correction-based preprocessing methods are more suitable for the data used in this study.
The performance improvement achieved by SG was relatively limited, with training and test accuracies of 77.71% and 74.34%, respectively, indicating that simple smoothing alone had little effect on enhancing vigor-related features. The classification results of D2 were comparatively poor, with a test accuracy of only 67.19%, which was even lower than that of the raw spectra. Combined with the intensified fluctuations observed in the D2 curves in
Figure 11, these results suggest that although derivative processing enhanced local spectral shape variations, it also amplified noise, thereby adversely affecting the stability of the subsequent classification model.
3.4. Dimensionality Reduction Method Screening Results
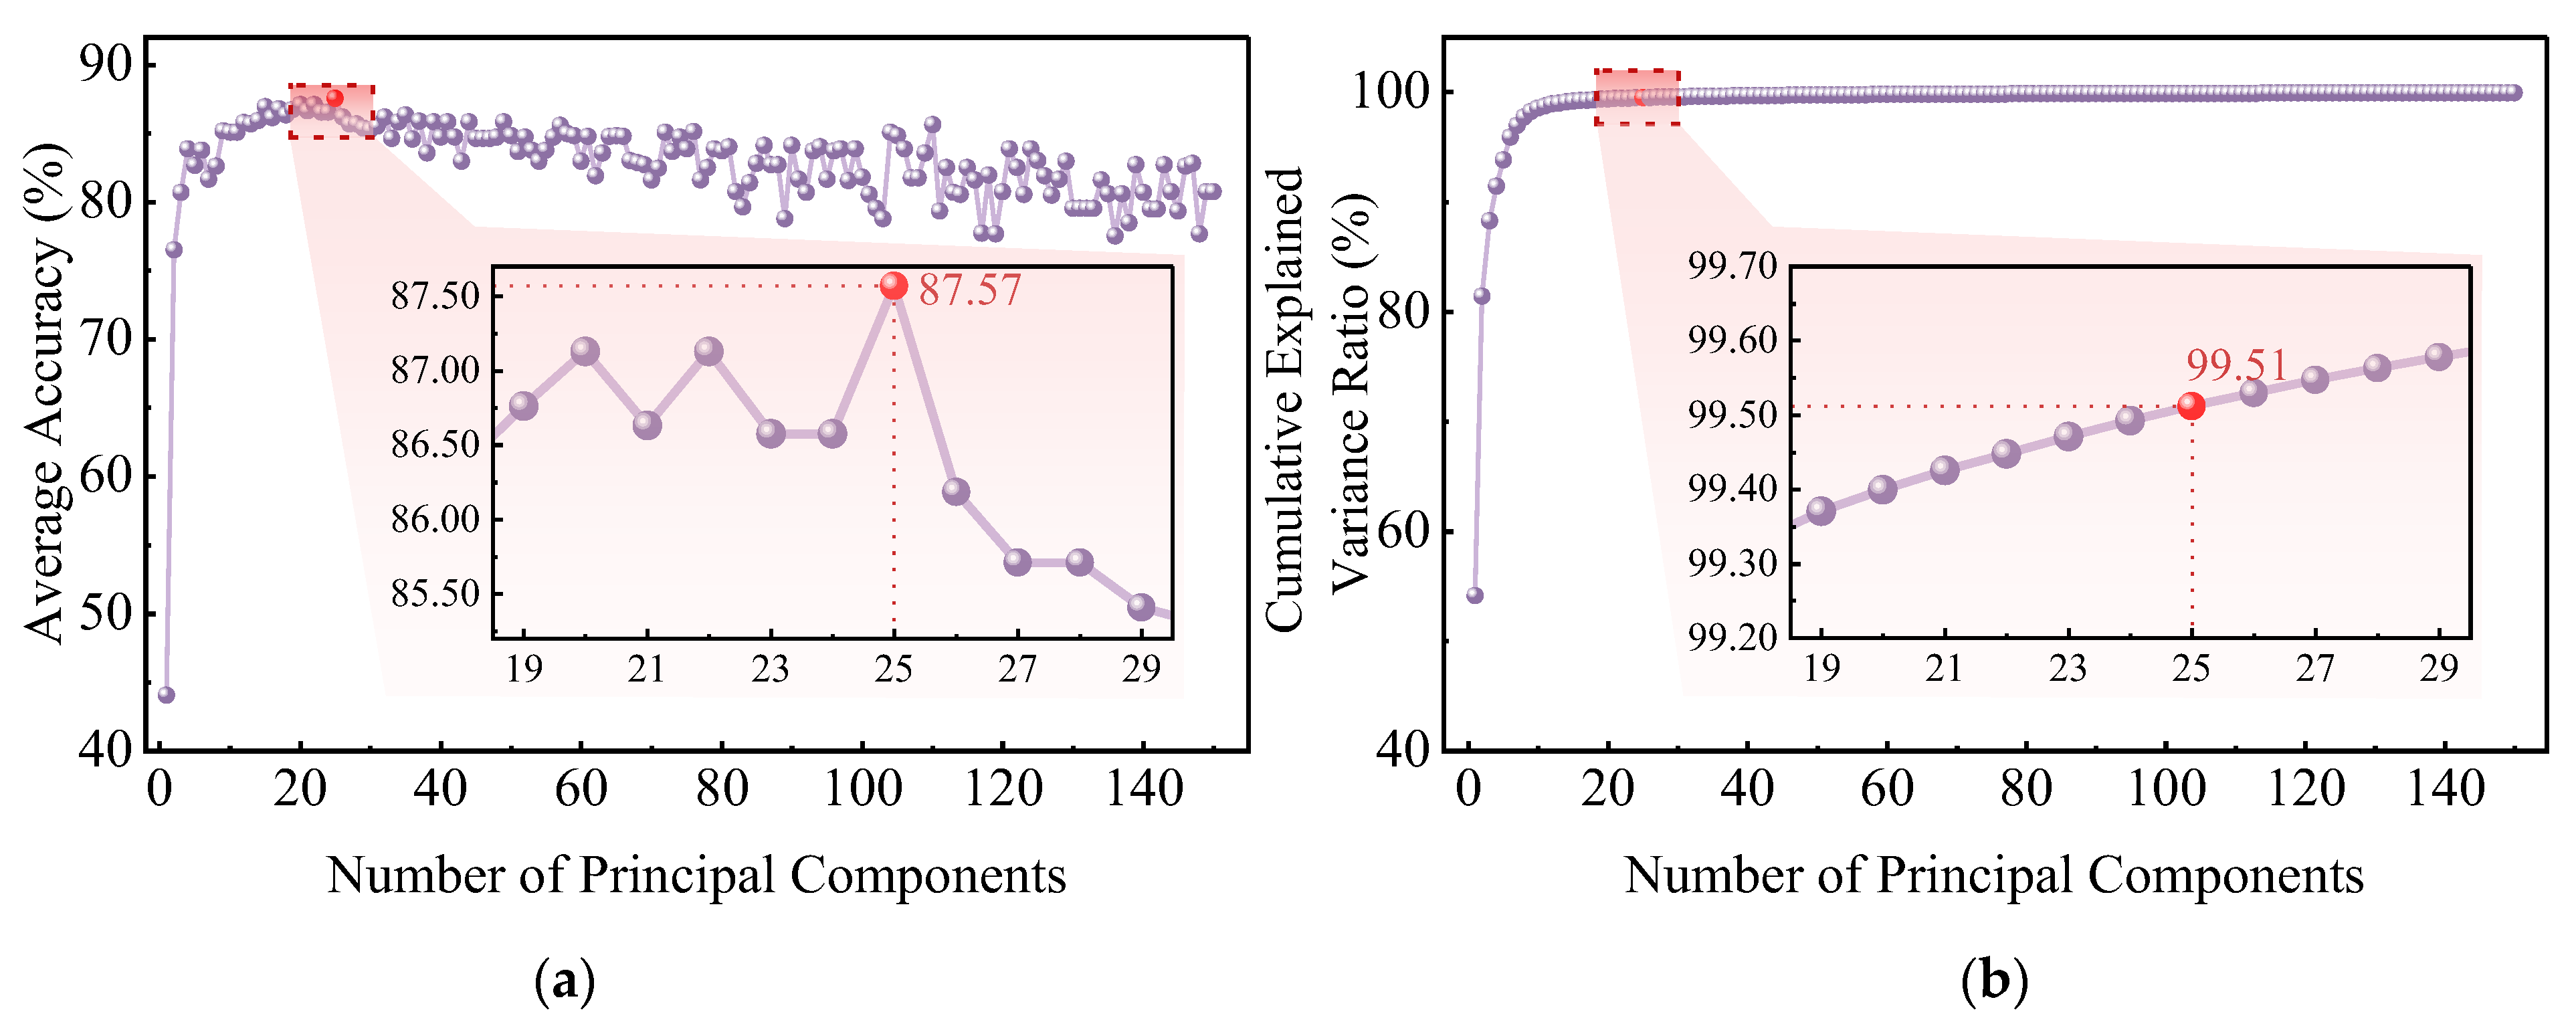
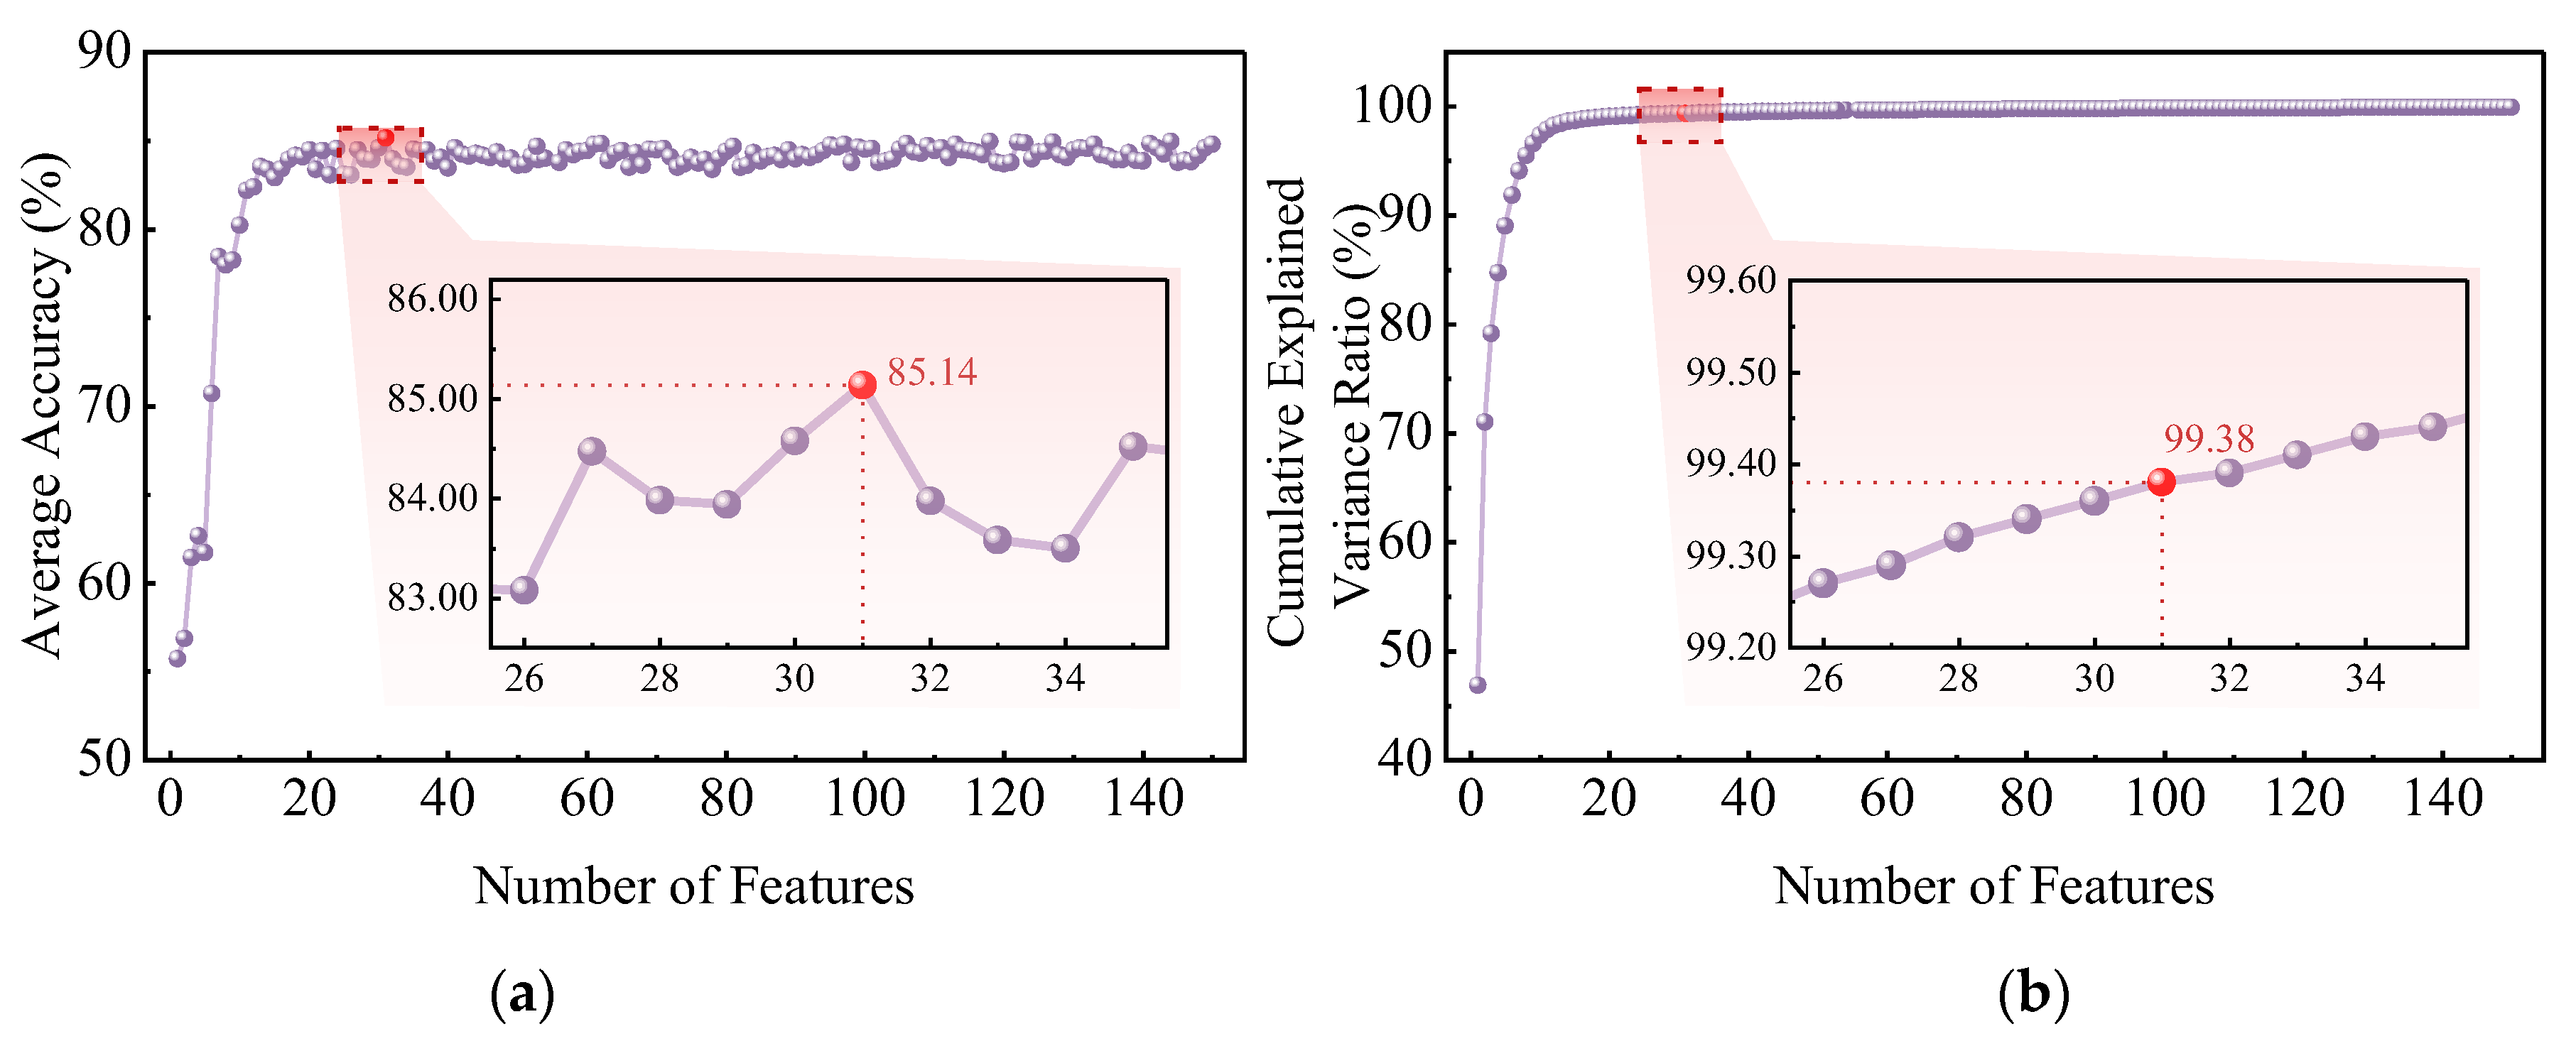
After determining SNV as the optimal preprocessing method, dimensionality reduction was further performed on the preprocessed spectral data. In this study, PCA and MNF were selected for comparison, and the corresponding results are shown in
Figure 12 and
Figure 13, with the overall comparison summarized in
Table 7.
As shown in
Figure 12, the classification accuracy obtained by PCA increased rapidly as the number of principal components increased and then showed slight fluctuation after reaching a maximum. The highest accuracy was achieved when 25 principal components were retained, at which point the cumulative explained variance ratio reached 99.51%. For MNF, classification accuracy also increased initially and then tended to stabilize. The best result was obtained when 31 features were retained, with a cumulative explained variance ratio of 99.38%. These results indicate that both PCA and MNF effectively reduced spectral redundancy while preserving most of the useful information.
Table 7 further shows that both dimensionality reduction methods substantially improved computational efficiency compared with full-spectrum modeling. After PCA reduced the input variables from 719 bands to 25 principal components, the five-fold cross-validation accuracy increased to 89.66 ± 0.71%, the validation independent test accuracy reached 87.57 ± 0.47%, and both training and inference times were markedly reduced. MNF also improved classification performance and efficiency, but its validation accuracy (85.14 ± 0.39%) was lower than that of PCA, despite showing slightly higher training-set accuracy. This suggests that PCA provided a better balance between feature compression, computational efficiency, and generalization performance. Therefore, PCA was selected as the dimensionality reduction method for subsequent vigor classification, and the number of retained principal components was set to 25.
To further interpret the spectral information retained by PCA, PCA loading analysis was performed. The results indicated that wavelengths with relatively high loadings were mainly distributed in four intervals, namely 425–479 nm, 628–737 nm, 1035–1373 nm, and 2110–2388 nm. To quantify the contribution of these intervals, the squared loading values of wavelengths were weighted by the explained variance ratios of the corresponding principal components and then normalized across all retained wavelengths. The four identified intervals jointly accounted for 76.71% of the normalized PCA-loading contribution. Among them, 2110–2388 nm contributed the most, accounting for 31.45%, followed by 1035–1373 nm with a contribution of 24.72%. The contributions of 628–737 nm and 425–479 nm were 12.18% and 8.36%, respectively, while the remaining wavelengths accounted for 23.29%.
The quantitative results show that the near-infrared and short-wave infrared regions provided the dominant information for PCA-based feature extraction, whereas the visible-region intervals provided auxiliary information. The visible and near-infrared intervals may be associated with seed surface condition, seed coat characteristics, internal tissue organization, and optical scattering behavior, whereas the near-infrared and short-wave infrared intervals may contain compositional information related to lipids, proteins, water status, and other reserve substances [
42,
44,
45]. These results further support the effectiveness of PCA-based feature extraction for soybean seed vigor discrimination.
3.5. Performance Comparison of Different Classification Models
After identifying SNV as the optimal preprocessing method and PCA as the optimal dimensionality reduction method, three models—RF, XGBoost, and SVC—were further selected for comparative classification analysis, and the results are presented in
Table 8.
Based on the results on the training set, all three models achieved high classification performance. Among them, XGBoost showed the highest training-set accuracy, recall, and F1-score, followed by RF, whereas SVC showed slightly lower training-set performance. These results indicate that all three models were able to effectively learn the feature distributions of samples with different vigor levels after spectral preprocessing and dimensionality reduction.
However, clearer differences emerged on the independent test set. SVC achieved the highest accuracy, recall, and F1-score, reaching 93.33%, 93.33%, and 93.37%, respectively, which were superior to those of XGBoost and RF. XGBoost ranked second, with corresponding values of 88.75%, 88.75%, and 88.77%, whereas RF showed the lowest independent test performance, with values of 85.42%, 85.42%, and 85.50%, respectively. Taken together, although XGBoost and RF showed stronger fitting ability on the training set, their performance declined more noticeably on the independent test set. In contrast, SVC exhibited the best generalization ability and was therefore more suitable for vigor discrimination of artificially aged soybean seeds.
The computational efficiency of the three models is summarized in
Table 9. In terms of single-sample training time, XGBoost required the longest time, followed by RF, whereas SVC showed the shortest training time. A similar trend was observed for single-sample inference time, where SVC was the most efficient model, followed by RF, while XGBoost required the longest inference time. These results indicate that, after dimensionality reduction by PCA, SVC not only achieved the best classification performance on the independent test set but also maintained high computational efficiency.
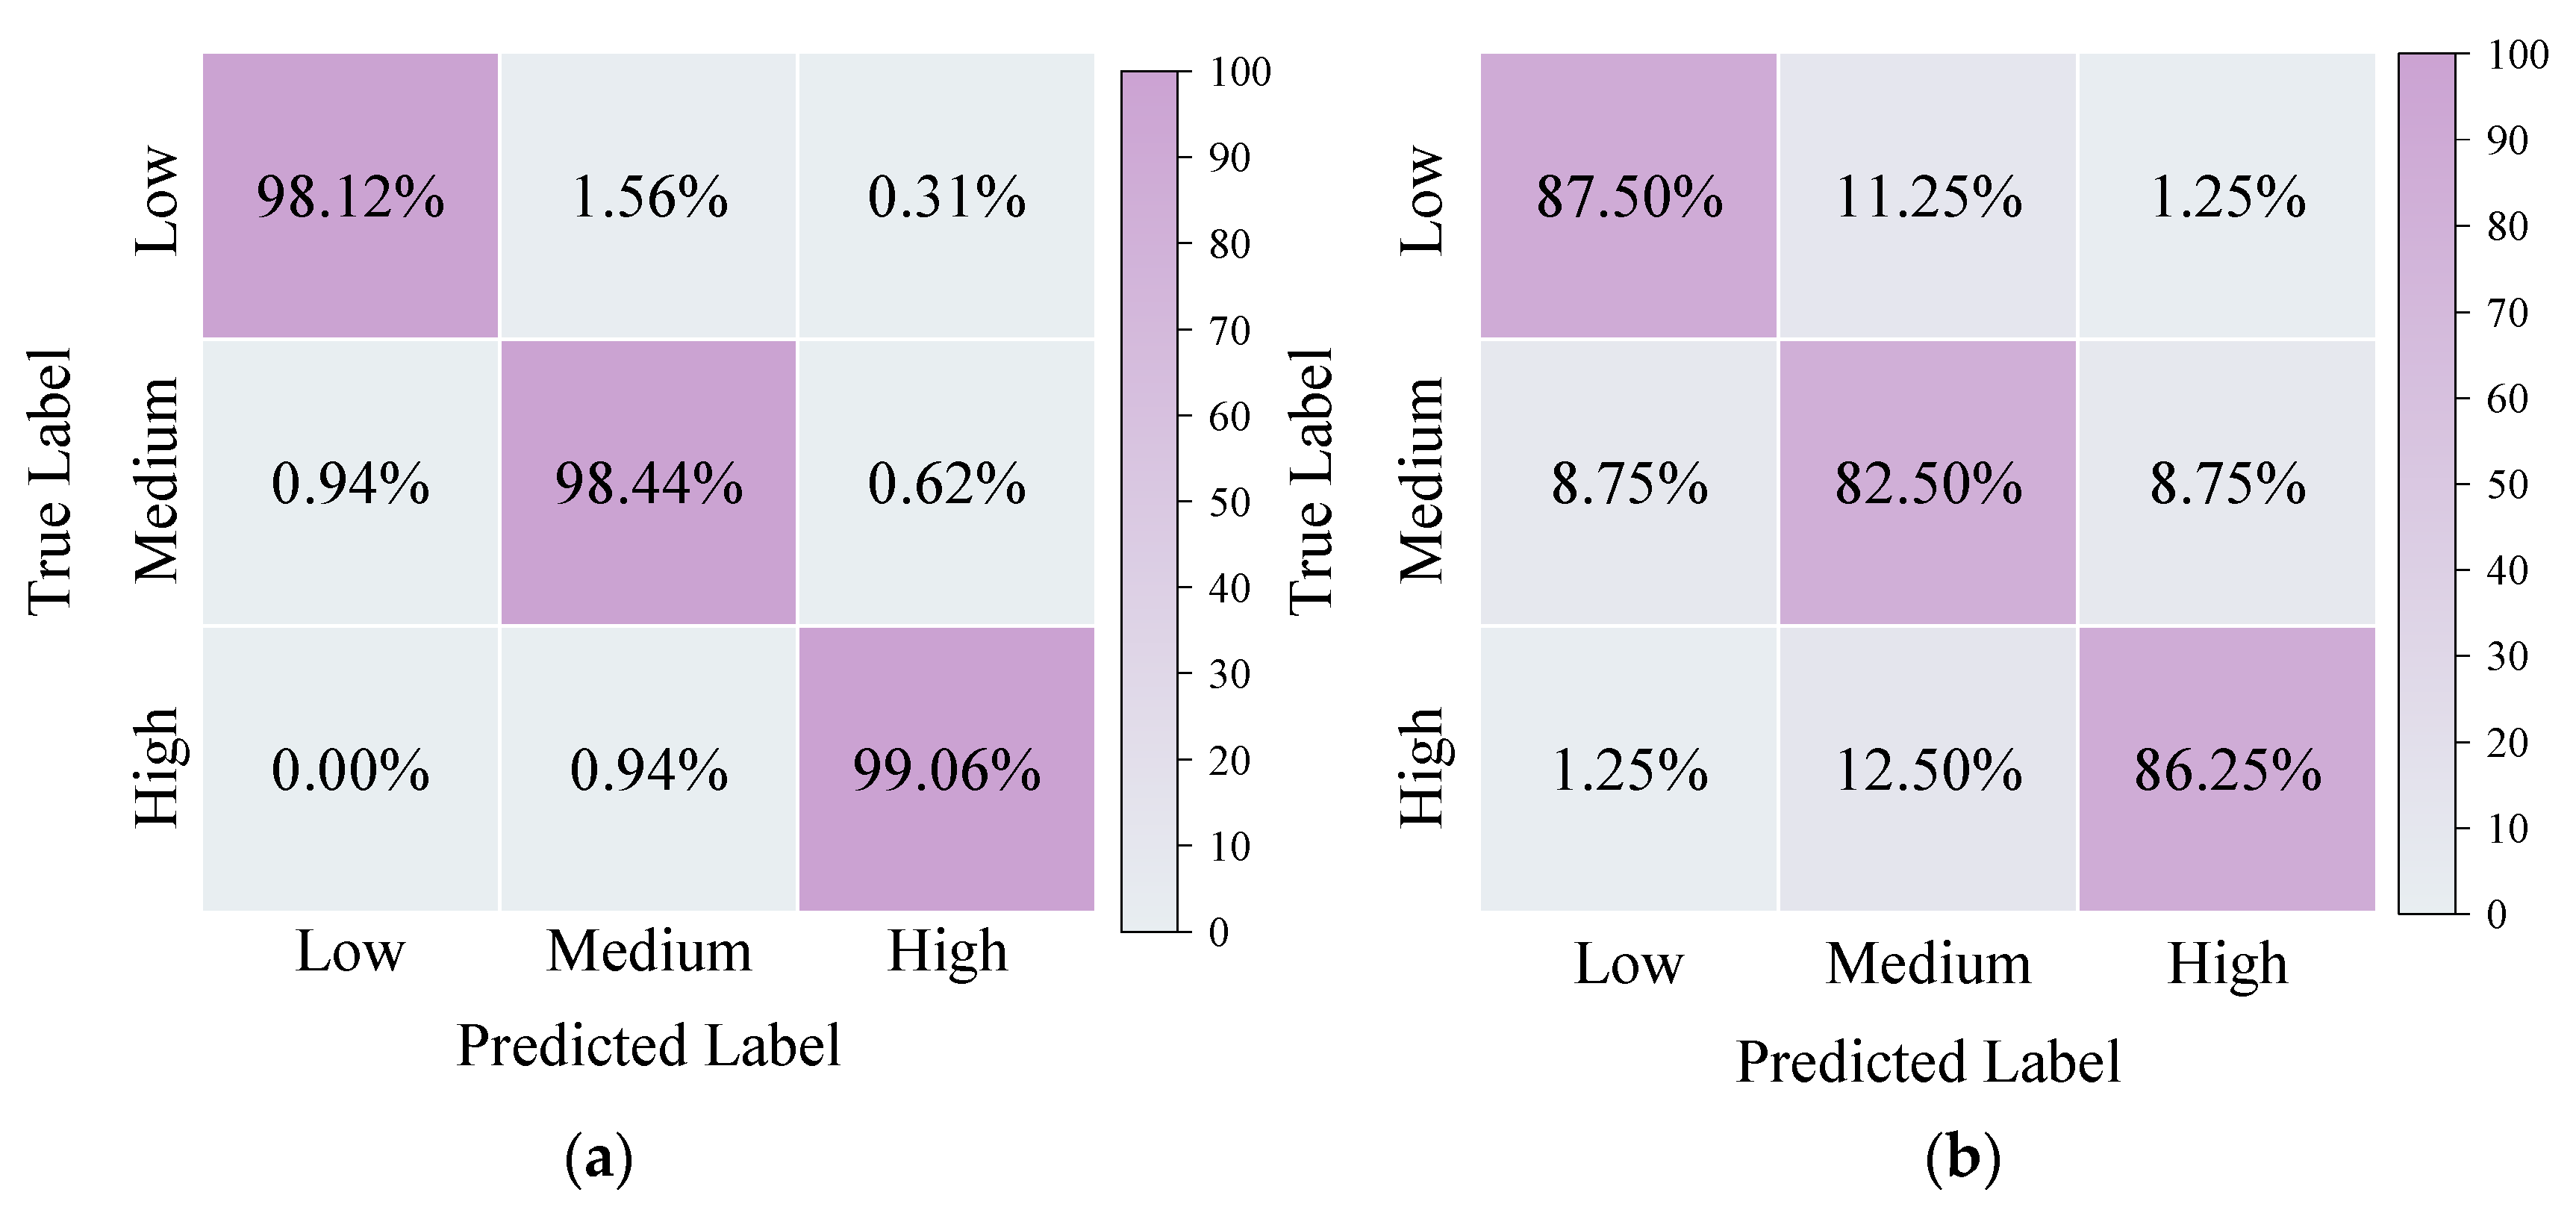
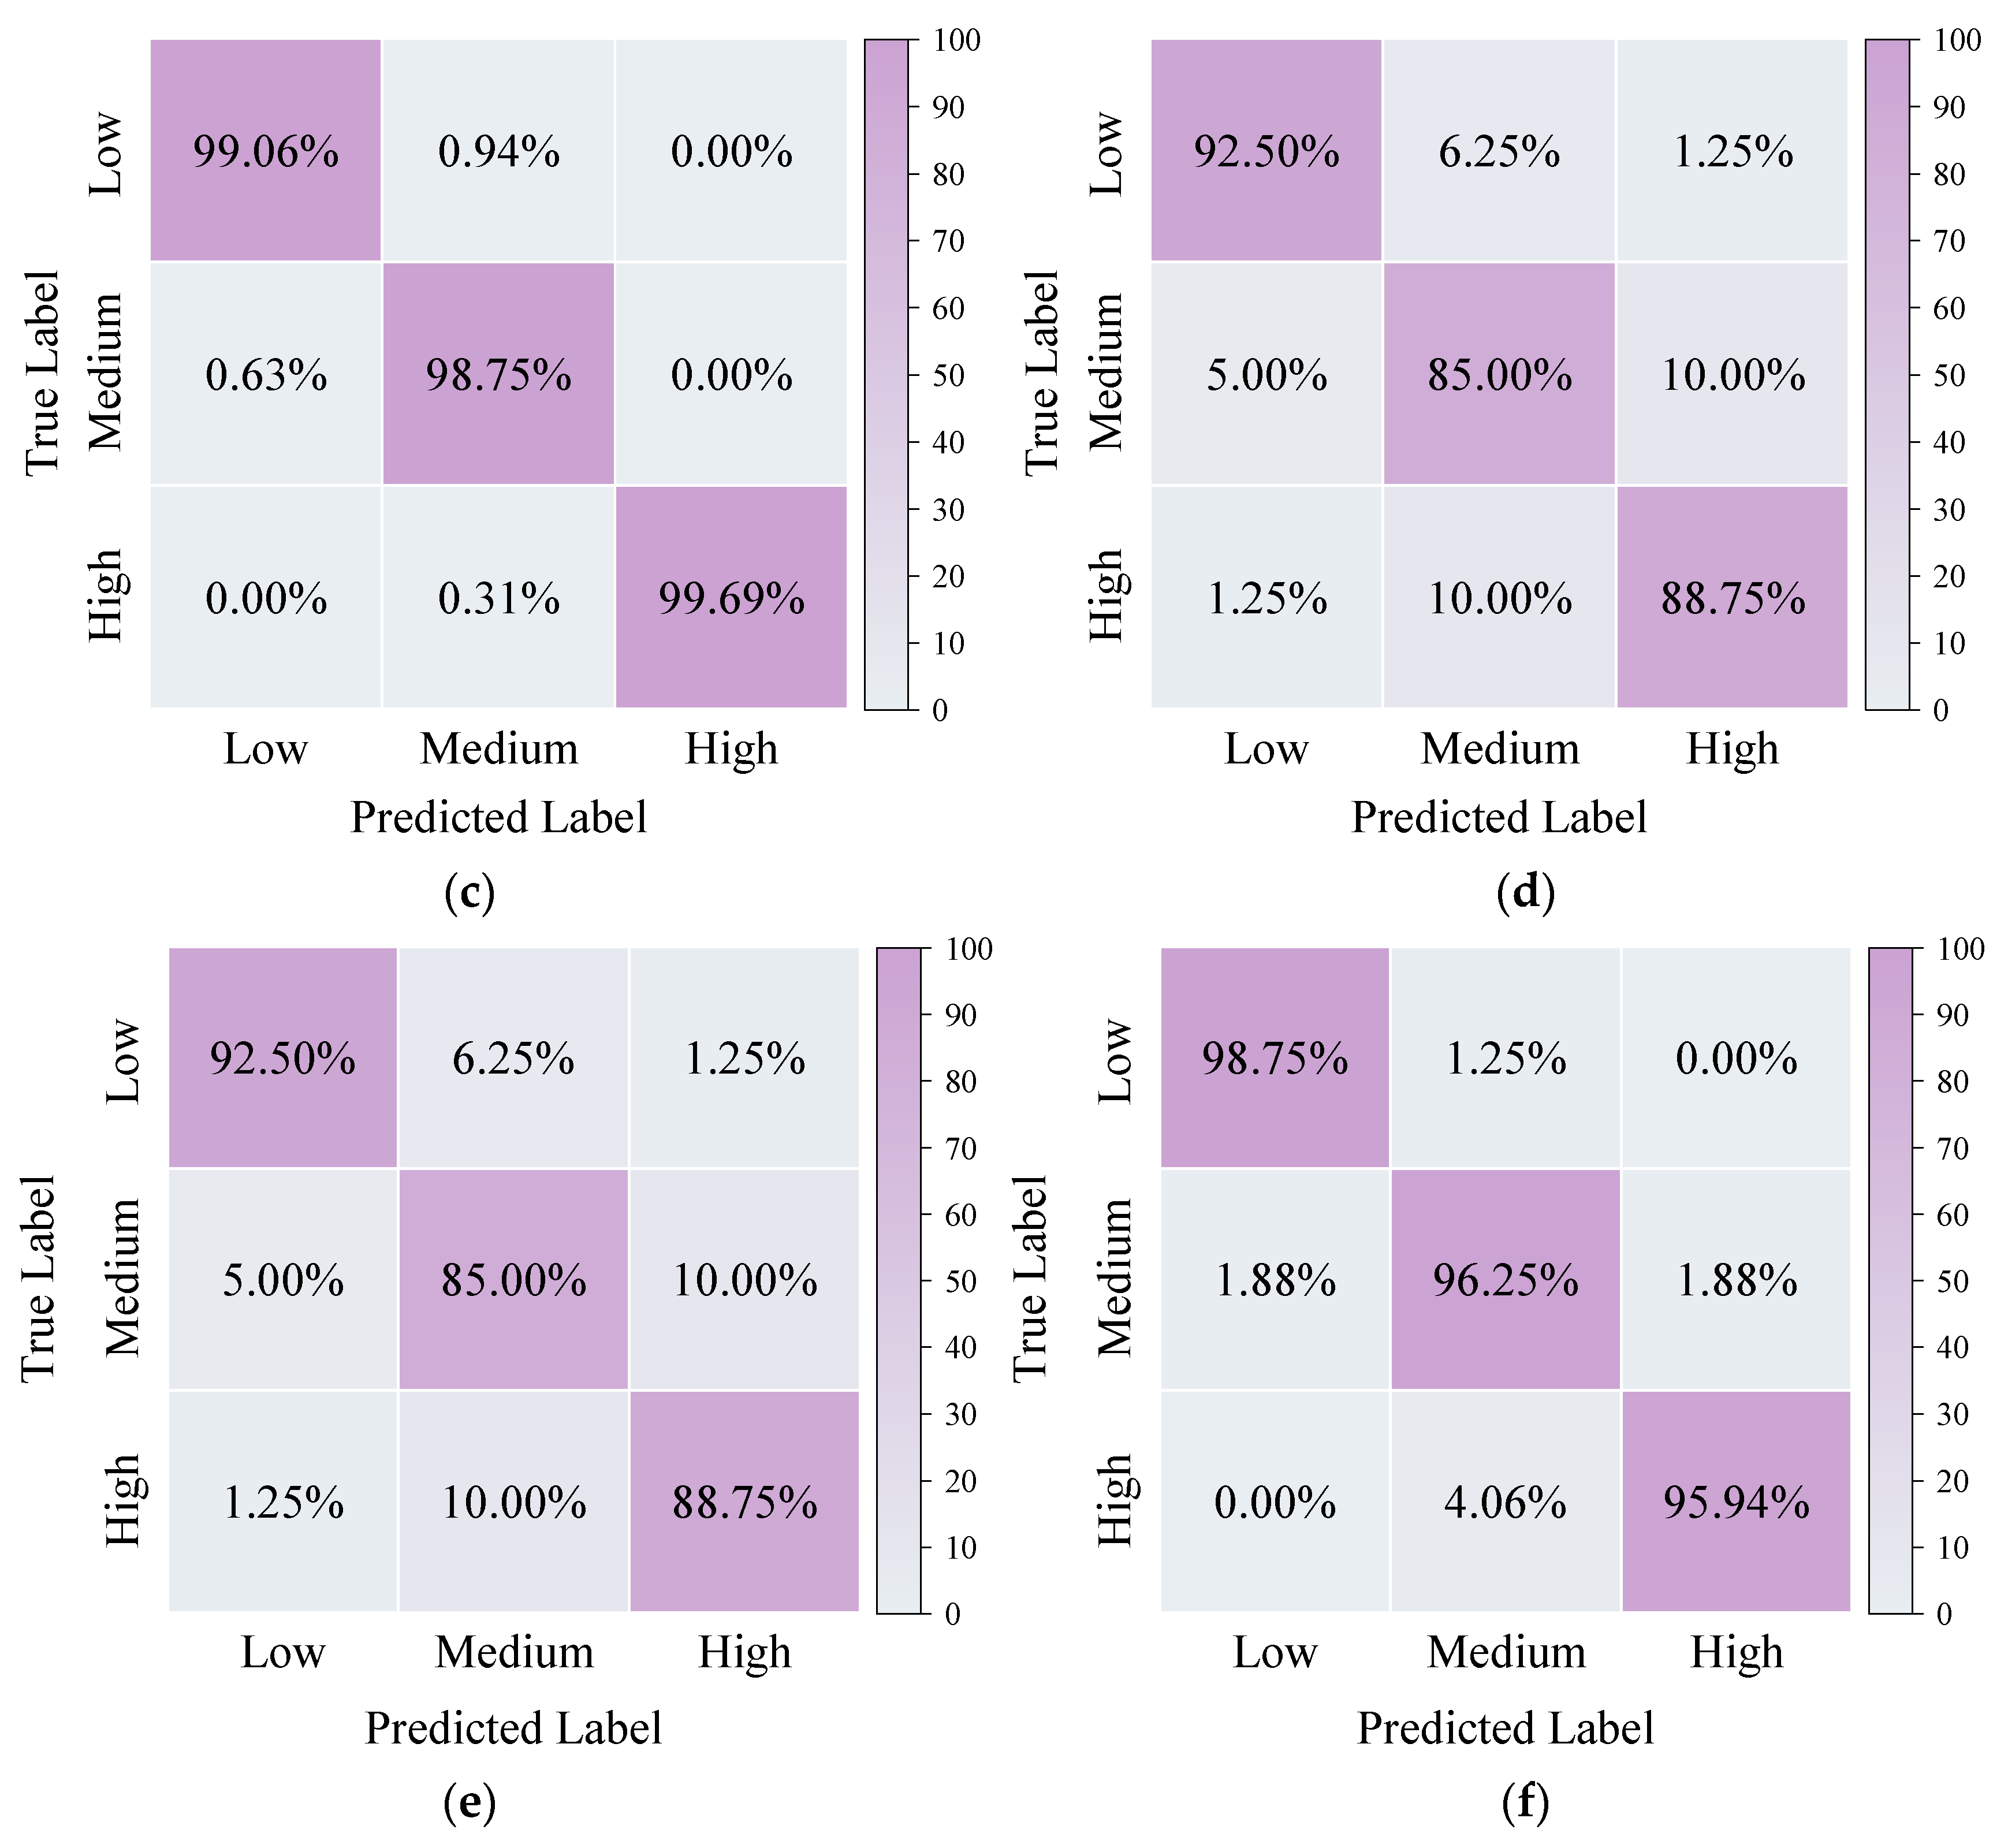
The confusion matrices of the three models on the training set and the independent test set are shown in
Figure 14. On the training set, all three models achieved high recognition rates for both high-vigor and low-vigor samples, indicating that the extracted features could effectively characterize the differences between the two extreme vigor levels. By contrast, medium-vigor samples were more difficult to classify, and some of them were misclassified into adjacent classes, suggesting that the medium-vigor class occupied a transitional position in the feature space. On the independent test set, RF showed relatively frequent misclassification of medium-vigor samples, while XGBoost maintained good recognition of high-vigor samples but still showed reduced discrimination for the medium-vigor class. In comparison, SVC achieved more balanced recognition rates across all three vigor classes and exhibited better overall classification stability.
Taken together, the results in
Table 8 and
Table 9 and
Figure 14 show that all three models were capable of classifying soybean seeds with different vigor levels after standard normal variate preprocessing and PCA-based dimensionality reduction. Among them, SVC showed the best overall performance in terms of classification accuracy on the independent test set, computational efficiency, and class-wise discrimination balance. Therefore, SVC was selected as the optimal classification model for vigor grading of artificially aged soybean seeds.
4. Conclusions
This study established a nondestructive method for vigor classification of artificially aged soybean seeds by integrating hyperspectral imaging with machine learning. The main conclusions are as follows.
(1) Artificial accelerated aging effectively generated soybean seed samples with distinct vigor differences. With increasing aging duration, germination rate, germination energy, and germination index all declined, accompanied by delayed germination onset, reduced germination speed, and weakened germination synchrony, indicating progressive deterioration of seed vigor. Based on the comprehensive analysis of these germination-related indices, the samples aged for 0, 48, and 96 h were finally used to represent high-, medium-, and low-vigor classes, respectively, thereby providing physiologically meaningful and relatively well-separated labels for subsequent hyperspectral analysis and classification modeling.
(2) Stable spectral differences were observed among vigor classes within the retained effective spectral ranges of 401.0–1000.9 nm and 1003.7–2450.79 nm. Clearer class separation was found in the 1000–2500 nm region, indicating that the short-wave infrared region provided stronger discriminatory information for soybean seed vigor classification. PCA loading analysis identified four important wavelength intervals, namely 425–479 nm, 628–737 nm, 1035–1373 nm, and 2110–2388 nm. Quantitative analysis based on normalized PCA-loading contribution showed that these four intervals jointly accounted for 76.71% of the retained spectral information. Among them, the 2110–2388 nm and 1035–1373 nm intervals contributed 31.45% and 24.72%, respectively, indicating that near-infrared and short-wave infrared information played a dominant role. The 628–737 nm and 425–479 nm intervals contributed 12.18% and 8.36%, respectively, suggesting that visible wavelengths provided auxiliary information for vigor discrimination.
(3) Spectral preprocessing, dimensionality reduction, and model selection all had important effects on classification performance. Among the tested preprocessing methods, SNV showed the best overall effect, and among the dimensionality reduction methods, PCA achieved a better balance between feature compression, computational efficiency, and generalization performance than MNF. Among the three classification models evaluated, the support vector classifier showed the best overall performance after standard normal variate preprocessing and PCA-based dimensionality reduction, achieving an accuracy, recall, and F1-score of 93.33%, 93.33%, and 93.37%, respectively, on the independent test set.
In summary, the proposed method enables effective and nondestructive discrimination of soybean seed vigor levels and provides practical support for rapid seed quality evaluation and vigor grading. Nevertheless, this study was conducted under artificial aging conditions and involved a limited number of soybean cultivars. Further work should evaluate the robustness of the method using naturally aged seeds, broader genotype backgrounds, and field-related vigor performance.




 ,
,