Article

Optimizing Seasonal Nitrogen Allocation Reduces Reliance on High Fertilizer Inputs While Maintaining Productivity in Intensive Rice–Wheat Rotations in the Upper Yangtze River Basin of China


1
Crop Research Institute of Sichuan Academy of Agricultural Sciences/Crop Germplasm Innovation and Genetic Improvement Key Laboratory of Sichuan Province, Chengdu 610066, China
2
Environment-Friendly and Efficient Water-Saving Technology and Equipment for Hilly Agriculture Key Laboratory of Sichuan Province, Chengdu 610066, China
3
Key Laboratory of Wheat Biology and Genetic Improvement on Southwestern China, Ministry of Agriculture and Rural Areas, Chengdu 610066, China
*
Author to whom correspondence should be addressed.
These authors contributed equally to this work.
Agriculture 2026, 16(11), 1176; https://doi.org/10.3390/agriculture16111176
Submission received: 22 April 2026 / Revised: 21 May 2026 / Accepted: 25 May 2026 / Published: 27 May 2026
(This article belongs to the Section Agricultural Systems and Management)

Abstract

Intensive rice–wheat (RW) rotations in the Yangtze River Basin often rely on excessive nitrogen (N) inputs, leading to low N use efficiency and environmental risks. To test whether high productivity can be sustained with lower N inputs, a two-year field experiment was conducted in the Upper Yangtze River Basin to evaluate seasonal N allocation strategies across the annual rotation. A moderately reduced annual N input of 315 kg ha−1 maintained annual grain yields of 18.2–19.3 Mg ha−1, statistically comparable to traditional high-input practices using 360 kg N ha−1. Wheat yield was mainly determined by current-season N supply, and no significant yield carry-over effect of rice-season N input on subsequent wheat yield was detected. Instead, higher rice-season N input tended to increase nitrate accumulation in deeper soil layers, particularly at 40–60 cm. Optimized seasonal N allocation significantly improved the partial factor productivity of N while maintaining a positive apparent system N balance under full straw return. These results indicate that strategically limiting and reallocating seasonal N inputs according to crop demand can sustain high annual productivity, improve N use efficiency, and reduce potential N-related environmental risks in intensive RW rotations.

1. Introduction

The rice–wheat (RW) rotation system is one of the predominant intensive double-cropping systems in the Yangtze River Basin of China, covering approximately 4.67 million hectares [1]. The Yangtze River Basin is a major grain-producing region and contributes substantially to regional food security. In this context, the RW rotation system is particularly important because it allows the cultivation of two major staple crops within a single annual cropping cycle. Ensuring the sustainability of this intensive double-cropping pattern is consequently pivotal for regional food security. To maximize grain yields, however, current management practices involve excessive nitrogen (N) inputs, frequently exceeding 400 kg N ha−1 yr−1 [2,3]. This intensity substantially exceeds the global average N input [4], yet the crop recovery efficiency of applied N (REN) remains notoriously low, often falling below 30–40% [4]. Consequently, a substantial fraction of reactive N may be lost to the environment via ammonia volatilization, nitrate leaching, and runoff, contributing to N pollution risks in air and water systems [1]. Notably, the alternating flooding and drainage in rice–wheat rotations trigger severe denitrification, leading to substantial N losses to the environment [5].
Optimizing N management is therefore essential to synergistically enhance grain yield and N use efficiency (NUE). The most direct approach to improving NUE is to reduce N rates to biologically optimal thresholds. Recent evidence suggests that yield gains plateau rapidly as N inputs rise; for instance, increasing N rates beyond 200 kg N ha−1 in rice systems often fails to confer significant yield benefits [6,7]. Conversely, exceeding these thresholds dramatically escalates environmental N loading with negligible agronomic return [7]. Similarly, in winter wheat, reducing N inputs from farmer practices to optimized levels has been shown to maintain or even marginally increase grain yield while substantially curbing N losses, particularly via nitrate leaching [8]. While precision agriculture techniques—such as site-specific nutrient management (SSNM)—can theoretically optimize these inputs by accounting for spatial heterogeneity in soil fertility [9,10], their adoption remains constrained by the fragmented nature of smallholder farming. In this context, regionalized N management strategies based on robust field experimentation offer a more pragmatic and scalable pathway for farmer adoption.
Beyond optimizing individual crop seasons, the scientific allocation of N across the entire annual rotation remains a critical yet often overlooked challenge. The Yangtze River Basin spans diverse climatic and edaphic zones, necessitating tailored management; generally, the annual N recommendations in the Middle and Lower reaches (500–600 kg ha−1) exceed those in the Upper reaches (350–450 kg ha−1) [11,12,13]. Historically, farmers have biased N allocation heavily toward rice (60–70% of annual input) due to its higher yield stability and economic value, relegating wheat—often rainfed and vulnerable to climatic stress—to a secondary status with lower inputs [14,15]. However, the adoption of conservation tillage in the Upper Yangtze River Basin has improved soil structure, soil moisture retention, and nutrient conservation, thereby enhancing the yield potential of wheat after rice [16]. Meanwhile, widespread straw return supplies organic carbon and nutrients, promotes soil aggregation and microbial activity, and gradually increases soil organic matter, thereby modifying indigenous N supply through mineralization [17,18]. These changes provide an agronomic basis for reassessing traditional fertilizer recommendations. Despite these agronomic advances, fertilization regimes remain largely entrenched in historical experience. We posit that under current production conditions, a moderate reduction in total N input, coupled with strategic re-allocation between rice and wheat seasons, can maintain system productivity while reducing reliance on excessive N inputs.
A critical uncertainty in optimizing rotational N management is whether N applied in the preceding crop season produces measurable carry-over effects on the subsequent crop. Although a fraction of unutilized fertilizer N may remain in the soil and become available to the following crop [19,20], the availability and agronomic contribution of such residual N vary greatly with management strategy and hydrological regime. In dryland systems, deep-rooted crops may recover leached nitrate [20]. However, in paddy-upland rotations, the alternating wetting and drying cycles complicate this dynamic. Significant quantities of reactive N in paddy soils are prone to rapid loss rather than retention [21], making the agronomic contribution of residual N to the following wheat crop uncertain. To address these knowledge gaps, we conducted a two-year field experiment (2016–2018) in a typical RW rotation in the Upper Yangtze River region, comparing four N-reduction and re-allocation strategies against two traditional practices. This study aimed to determine (1) whether optimized annual N allocation affects system productivity; (2) whether rice-season N input has a significant yield carry-over effect on subsequent wheat yield; (3) the extent to which these regimes enhance NUE; and (4) the impact of these strategies on the annual apparent N balance.

2. Materials and Methods

2.1. Field Experiment

A field experiment was conducted at the experimental station of the Sichuan Academy of Agricultural Sciences in Guanghan, Sichuan Province, China, during two consecutive rice–wheat rotation cycles from 2016 to 2018. The first cycle comprised the 2016 rice season and the subsequent 2016/2017 wheat season, whereas the second cycle comprised the 2017 rice season and the subsequent 2017/2018 wheat season. The experimental station is located in the upper reaches of the Yangtze River Basin on the Chengdu Plain, Sichuan Province, China (31°0′22.09″ N, 104°23′54.61″ E; 476 m above sea level). The study site is a part of the Dujiangyan irrigation area, where rice and wheat have been cultivated in sequence for several decades. Test results indicated that the soil in this area was derived from river alluvium and is clayloamy (0–20 cm soil layer: 40–43% clay, 28–29% silt, and 27–31% sand).
The experimental field had been under a typical rice–wheat rotation before the start of the experiment, and no other crop was grown between the rice and wheat seasons during the study period. The crop immediately preceding the first experimental rice season was wheat under local conventional fertilization and management, and no treatment-specific fertilization had been imposed before the experiment. Before the experiment began, the fields in the station were managed uniformly. Rice is generally harvested from late September to late October, after which wheat is sown beginning in late October. Wheat is typically harvested in mid-May, and land preparation for the subsequent rice crop begins immediately after wheat harvest.
The soil chemical properties of the 0–20 cm soil layer before rice transplanting in the two growing seasons are presented in Table 1. Because the two rice–wheat cycles were conducted in two adjacent fields, the soil data for 2016 and 2017 represent the baseline soil fertility conditions of the corresponding field before treatment establishment in each cycle. The lower values of some soil chemical properties in 2017 should be interpreted mainly as initial field-to-field variability between the adjacent fields.
Rice is the most important staple food in Southern China, and the annual fertilization strategy in the RW system is typically determined before rice transplanting. A previous on-farm investigation in the area where the experiment was conducted revealed that the fertilizer N rate for the system ranges from 360 to 400 kg ha−1, with 50~60% applied to irrigated rice and the remainder to wheat. Thus, two prevailing farmers’ fertilization practices were selected as controls: one was 225 kg N ha−1 for rice and 135 kg N ha−1 for wheat (R225W135), and the other was 180 kg N ha−1 for rice and 180 kg N ha−1 for wheat (R180W180). Four N reduction regimes were set, i.e., 180 kg N ha−1 for rice and 135 kg N ha−1 for wheat (R180W135, N reduction for wheat), 180 kg N ha−1 for rice and 90 kg N ha−1 for wheat (R180W90, further N reduction for wheat), 135 kg N ha−1 for rice and 180 kg N ha−1 for wheat (R135W180, N reduction for rice), and 135 kg N ha−1 for rice and 135 kg N ha−1 for wheat (R135W135, N reduction for both crops). A zero-N treatment was also included to determine NUE parameters.
Details regarding the six systemic N fertilization treatments and the zero-N control are listed in Table 2. These seven N regimes were randomly assigned within each replicate block in each field/cycle. The same treatment assignment was maintained from the rice season to the subsequent wheat season within each plot. The various N combinations yielded three annual N application rates: 270, 315, and 360 kg ha−1. Additionally, the plots were treated with N via a split application of urea. Specifically, during the rice-growing season, 70% of the N was applied as a basal application, and the remaining 30% was applied at the tillering stage. During the wheat-growing season, 60% of the N was applied as a basal, with the remaining 40% applied at the stem elongation stage.
Two complete rice–wheat cycles were conducted in two adjacent fields at the same experimental station. The first field was used for the 2016/2017 rice–wheat cycle, and the second adjacent field was used for the 2017/2018 rice–wheat cycle. The two fields were not used as replicate blocks; rather, they represented the two experimental years/cycles. Within each field/cycle, the experiment was arranged as a randomized complete block design with three replicate blocks.
Each block contained all N regimes, and the treatments were randomly assigned to individual plots within each block. Therefore, each field/cycle contained 21 plots in total, corresponding to seven N regimes × three replicates. Each plot was 4.5 m × 5.0 m, and the same plot received the assigned N rates for rice and wheat seasons continuously within a single annual rice–wheat cycle. Plots were separated by inserting plastic film into the soil to a depth of 50 cm to minimize lateral movement of water and nutrients among plots. A schematic illustration of the experimental layout is provided in Supplementary Table S1.
Rice seedlings (cultivar: Dexiang 4103) were manually transplanted according to the spacing used in mechanical transplanting (30 cm × 21 cm; 3 or 4 seedlings per hill) on 30 May 2016, and 2 June 2017, respectively. The planting density and hill spacing were consistent with those used in local mechanical transplanting systems, while manual transplanting was adopted to ensure uniform plant density and reduce plot-level variation. The fields were irrigated and managed according to standard local practices.
Wheat was sown under zero-tillage conditions on 27 October 2016 and 30 October 2017, respectively. To enhance the uniformity of seedling emergence, we implemented a traditional seeding technique involving digging holes and manual sowing under zero-tillage conditions. Each sowing hole was approximately 4.9 cm in diameter and 2.5 cm in depth. Seven wheat seeds were planted in each hole, then fertilized and covered with rice straw as mulch. Zero-tillage wheat sowing after rice harvest and rice straw mulching are common or increasingly promoted practices in the Upper Yangtze River Basin because of the short interval between rice harvest and wheat sowing and the high soil moisture during this period. Manual hole sowing was used in this experiment to obtain uniform emergence and precise plot management. In 2016, 225 L of water per plot was applied after wheat seeds were sown. In 2017, no water was applied because of the timely rainfall after seeds were sown.
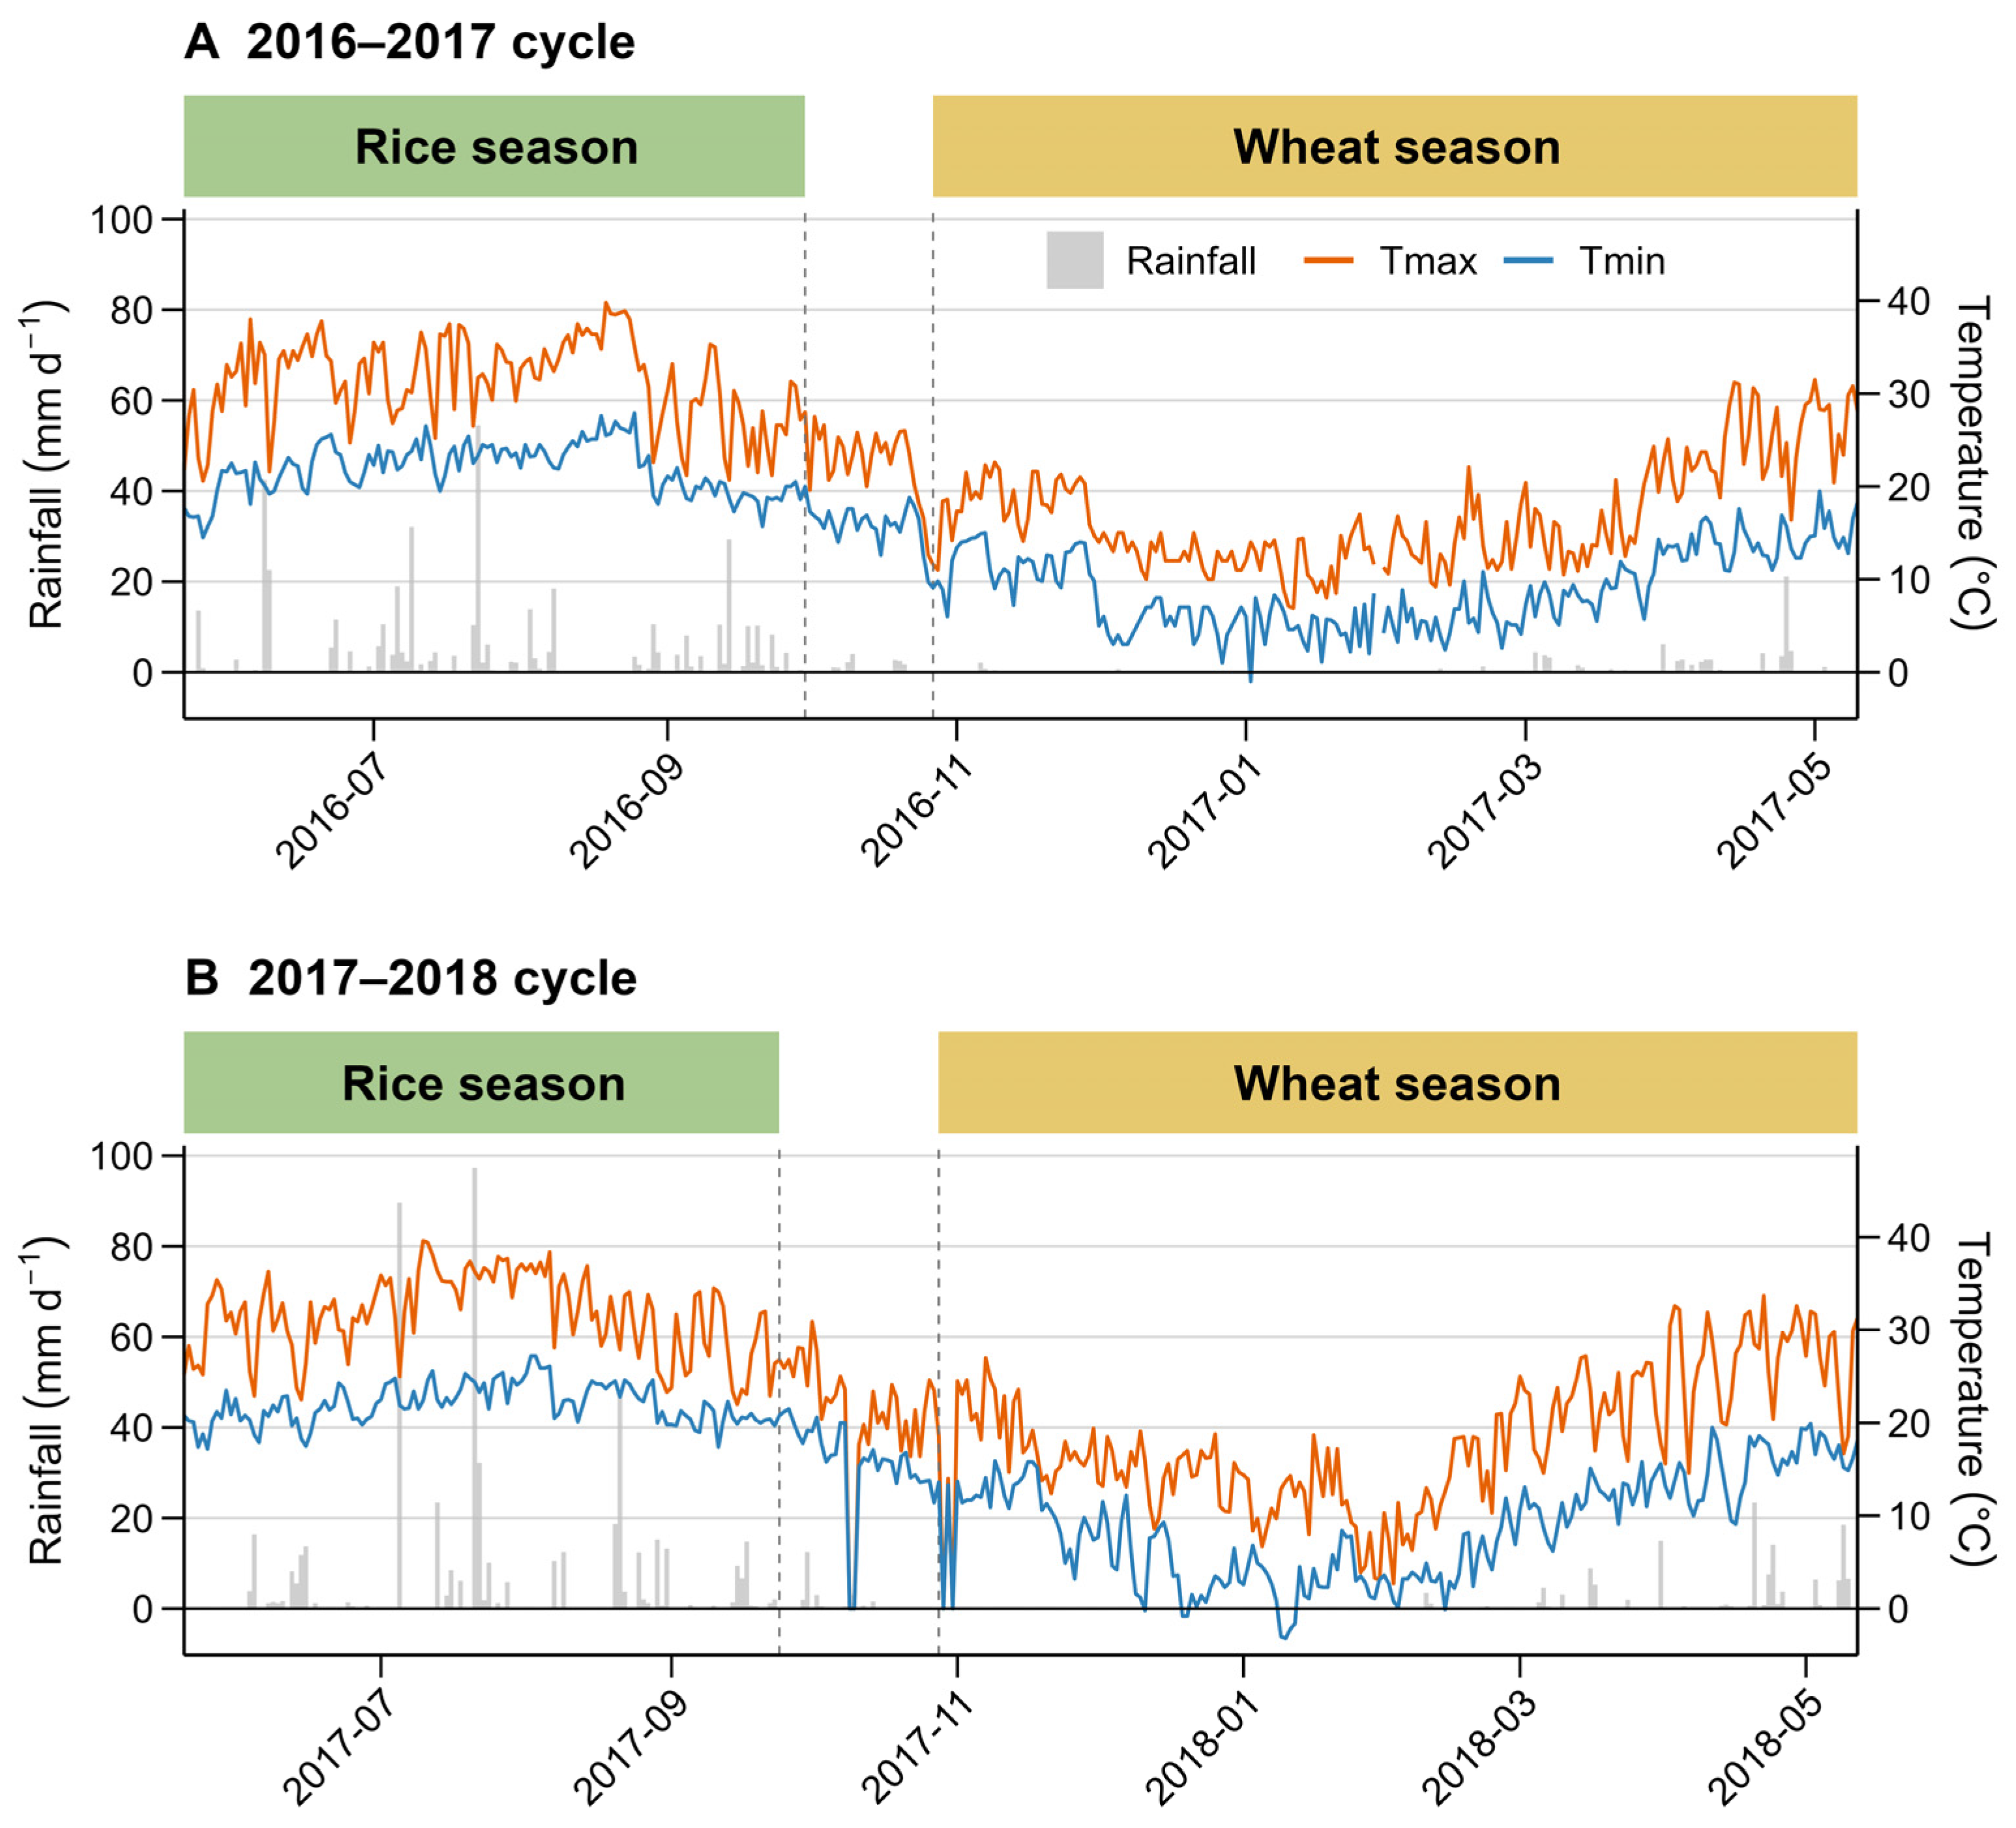
On the basis of local practices, each plot received a basal application of phosphorus (P2O5, 90 kg ha−1 for rice and 75 kg ha−1 for wheat) and potassium (K2O, 90 kg ha−1 for rice and 75 kg ha−1 for wheat) fertilizers in the form of superphosphate and potassium chloride, respectively. Diseases and insect pests were effectively controlled, and crop growth was not severely affected by major biotic or abiotic stresses during the experimental period. Daily air temperature and rainfall during the field experiment were obtained from an on-site weather station (Figure 1). These data represent observed weather conditions during the two experimental rice–wheat cycles rather than long-term climatic averages. Guanghan is located on the Chengdu Plain and has a humid subtropical monsoon climate. Based on long-term meteorological records for the Chengdu Plain, the mean annual air temperature is approximately 16.0–16.5 °C, and the mean annual precipitation is approximately 850–950 mm, with most rainfall occurring from May to October. Compared with these long-term climatic conditions, the two experimental cycles, 2016/2017 and 2017/2018, were generally within the region’s historical climatic range and were not considered unusually wet or dry years. Nevertheless, rainfall distribution differed between the two cycles, reflecting normal inter-annual climatic variability in this monsoon region.

2.2. Plant Sampling, Yield Determination, and Plant Analysis

Two types of plant sampling were conducted: quadrat-based density measurements and destructive plant sampling for biomass and plant trait analysis. For density measurements, three fixed quadrats were established in each plot after rice seedling recovery or uniform wheat emergence, with each quadrat covering 0.63 m2 for rice and 0.60 m2 for wheat. These quadrats were used to determine the initial plant density and the density of fertile panicles or spikes at maturity.
Destructive sampling was conducted separately at physiological maturity. For both rice and wheat, four representative hills or sowing holes were selected from each plot. For both crops, all plants and tillers within each selected hill or sowing hole were carefully uprooted from the field. The roots were then removed by cutting at the stem base, and only the aboveground parts were used for subsequent measurements. Root biomass was not included in the determination of aboveground biomass.
The sampled plants were separated into grain and vegetative organs. The samples were oven-dried at 75 °C for 48 h and weighed to determine aboveground dry matter. For rice, the threshed grains were further separated into filled and unfilled grains using the water selection method, and filled grains were counted. The harvest index (HI) was calculated as the ratio of grain dry weight to total aboveground dry matter.
Grain yield was determined independently from the destructive samples by harvesting the remaining plants in each plot. The harvested grain was threshed and weighed, and its moisture content was measured. Grain yield was expressed on a hectare basis after adjustment to the standard moisture content of 13.0% for wheat and 13.5% for rice. For the calculation of aboveground dry matter and N uptake, the moisture-adjusted grain yield was further converted to an oven-dry basis. Plot-level aboveground dry matter was not obtained by directly scaling the four destructively sampled hills or sowing holes. Instead, it was estimated by dividing the plot-level dry grain yield by the HI derived from the destructive samples. Plot-level vegetative dry matter was calculated as the difference between plot-level aboveground dry matter and plot-level dry grain yield. These plot-level dry matter values, together with the N concentrations measured in the destructively sampled grain and vegetative organs, were used to calculate crop N uptake.
In this study, “System” refers to the annual rice–wheat rotation within one experimental cycle. System grain yield was calculated as the simple arithmetic sum of rice grain yield and wheat grain yield obtained from the same plot within the same annual cycle. No conversion to rice-equivalent yield, wheat-equivalent yield, or economic weighting was applied. System aboveground biomass was calculated as the sum of rice and wheat aboveground dry matter. Similarly, system crop N uptake was calculated as the sum of total aboveground N uptake by rice and wheat within the same annual cycle.
In this study, the potential carry-over effect of rice-season N application was evaluated primarily based on the yield and N uptake responses of the subsequent wheat crop, as well as post-harvest soil NO3-N concentrations. Soil N transformation processes, microbial N cycling, N mineralization, immobilization, and the isotopic fate of fertilizer-derived N were not directly quantified. Therefore, the term “yield carry-over effect” is used to describe the observed response of subsequent wheat yield to preceding rice-season N input.

2.3. Soil Sampling and Analysis

Soil samples were collected at 0–60 cm depth in 20 cm increments after crop harvest. A soil auger (5 cm diameter) was used to collect soil samples from three locations along a diagonal in each plot. The samples collected from the same soil depth at the three locations were composited and analyzed to determine the residual soil NO3-N concentration. The soil samples were first extracted with 0.01 M CaCl2 and then analyzed via ultraviolet spectrophotometry to determine NO3-N concentrations [22].

2.4. Nitrogen Use Efficiency

After the grain and vegetative organs of the destructively sampled plants were oven-dried and weighed, subsamples were ground and passed through a 1 mm sieve to determine the N concentration using the micro-Kjeldahl method [23]. The N concentrations of grain and vegetative organs obtained from destructive samples were used together with crop dry matter to calculate crop N uptake. Grain N uptake was calculated as the dry grain yield multiplied by the grain N concentration, and vegetative N uptake was calculated as the vegetative dry matter multiplied by the vegetative N concentration. Total aboveground N uptake was the sum of grain N uptake and vegetative N uptake. The NUE parameters were calculated with the following equations [24,25]. For these calculations, grain yield was converted to kg ha−1, N uptake was expressed as kg N ha−1, and fertilizer N rate was expressed as kg N ha−1. Accordingly, PFPN and AEN are reported as kg grain kg−1 N applied, whereas REN is reported as kg N uptake kg−1 N applied:
(1)
N uptake (Nupt, kg ha−1) = Grain N uptake + Vegetative N uptake.
(2)
N fertilizer partial factor productivity (PFPN, kg grain kg−1 N applied) = Grain yield/N fertilizer rate [24].
(3)
N fertilizer agronomic efficiency (AEN, kg grain kg−1 N applied) = (Grain yield of N applied treatment − Grain yield of 0 N applied treatment)/N fertilizer rate [24].
(4)
Apparent N fertilizer recovery (REN, kg N uptake kg−1 N applied) = (Nupt of N applied treatment − Nupt of 0 N treatment)/N fertilizer rate [24].
(5)
N harvest index (NHI) = Grain N/Nupt [25].
To evaluate nutrient management intensity, we calculated the apparent N balance, also referred to as apparent N surplus. This metric represents the disparity between total N fertilizer inputs and N exported via crop harvest, offering a straightforward approach to assessing the status of the soil N budget [26]. It was calculated as follows:
(6)
Apparent N balance = Nfert − Nharvest [26].
To better assess apparent N balance, N output was calculated under two scenarios: one including straw removal, and the other excluding straw removal. For rice and wheat, apparent N balance was calculated separately for each crop season. System apparent N balance was calculated as the sum of the rice-season and wheat-season apparent N balances, which is equivalent to annual system fertilizer N input minus annual system N output through harvest.

2.5. Data Analysis

All data were analyzed using SPSS 31.0 software. For each response variable, the individual plot was considered the experimental unit. For each rice–wheat cycle, the three replicate blocks within the corresponding field were used as experimental replicates. Because the two rice–wheat cycles were conducted in two adjacent fields, Year represents the specific experimental cycle and includes both inter-annual climatic variation and any minor field-to-field variation between the adjacent fields. Because only two experimental cycles were included, Year was treated as a fixed factor rather than as a random factor. The N regime was also treated as a fixed factor because the N treatments were predefined fertilization strategies. Replicate block was included as the blocking/replication term nested within Year.
Before conducting ANOVA, residual diagnostics were performed to assess model assumptions. The normality of residuals was assessed using Shapiro–Wilk tests and Q–Q plots, and homogeneity of variance was examined using Levene’s test. No severe deviations from normality or homogeneity of variance were detected; therefore, no data transformations were applied, and untransformed means are presented.
When the N-regime main effect or the simple N-regime effect within a year was significant, treatment means were compared using Duncan’s multiple range test at p < 0.05. Duncan’s test was selected to separate and rank the predefined agronomic N regimes under field conditions, and the same post hoc procedure was applied consistently across variables. Pearson correlation analysis was used to evaluate the relationship between the N application rate and residual soil NO3-N concentration. Before Pearson correlation analysis, scatterplots were inspected to confirm approximate linear relationships and the absence of influential outliers, and the normality assumption was checked.
For data presentation, different approaches were used according to the nature of the measured variables. Year-specific treatment means were shown for the primary response variables, including grain yield and aboveground biomass, to directly illustrate annual variation. The residual soil NO3-N concentration was also presented by year because it exhibited a strong year-dependent pattern. In contrast, for yield components and N use-efficiency parameters, the main objective was to summarize the overall effects of N regimes across the two experimental cycles. Therefore, the treatment main-effect means averaged across years were retained in the corresponding tables.

3. Results

3.1. Grain Yield of Rice and Wheat

The N fertilization regime exerted a dominant influence on grain yield and aboveground biomass for both rice and wheat, as well as system productivity (p < 0.01; Table 3). Significant inter-annual variability was observed only in the wheat season, where yields were generally lower in 2017/2018. The two experimental cycles were generally within the long-term climatic range of the Guanghan/Chengdu Plain, but rainfall distribution differed between years, which may have contributed to the observed inter-annual variation in wheat yield. Moreover, the lack of significant N × Year interactions indicates that treatment performance rankings remained consistent across the study period.
In rice, reducing N input from 225 to 180 kg ha−1 maintained statistically similar grain yields, whereas further reduction to 135 kg ha−1 incurred yield penalties in the 2016/2017 season. Wheat productivity exhibited a distinct threshold; inputs of 135 kg N ha−1 sustained yields equivalent to 180 kg N ha−1, while the 90 kg N ha−1 rate caused significant declines (p < 0.05). At the system level, annual productivity was robust across optimized regimes. Despite lower N inputs, the R180W135 and R135W180 strategies produced total annual yields statistically comparable to those of the highest-input checks (R225W135 and R180W180). Conversely, the limited N supply in the wheat season under the R180W90 regime significantly attenuated total system output. Under R0W0, the contrasting year-to-year patterns of rice and wheat yield likely reflected crop-specific responses to indigenous soil N supply and interannual differences in seasonal growing conditions. Moreover, no significant yield carry-over effect of rice-season N rate on subsequent wheat yield was detected. Wheat yield formation was predominantly governed by current-season N input rather than by the N rate applied during the preceding rice season.

3.2. Yield Components of Rice and Wheat

N availability primarily modulated rice productivity by adjusting sink capacity, specifically panicle density and filled grain number per panicle (p < 0.01; Table 4). The traditional high-N practice (R225W135) maximized panicle production (221.7 m−2). Notably, moderate N reduction strategies (180 kg ha−1) maintained panicle numbers statistically comparable to those of the high-input control. However, limiting N input to 135 kg ha−1 (R135W135) significantly depressed panicle formation (p < 0.05). Conversely, grain weight exhibited a compensatory response: excessive N fertilization (R225W135) significantly reduced 1000-grain weight compared to all reduced-N regimes, while the harvest index remained largely stable across fertilized treatments (0.51–0.52).
N management influenced wheat yield formation primarily by regulating spike density (p < 0.01; Table 5). Regimes with high wheat N inputs (180 kg ha−1, R180W180 and R135W180) maximized effective spike numbers (>464 m−2). Reducing wheat N to 135 kg ha−1 resulted in a moderate but significant decline in spike density, while the deficit supply of 90 kg N ha−1 (R180W90) caused a sharp reduction to 376.8 m−2 (p < 0.05). In contrast, grains per spike remained saturated across all fertilized treatments (37.8–39.8), showing insensitivity to N rate variations. However, a density-dependent trade-off was evident during grain filling; treatments with the highest spike densities exhibited significantly lower 1000-grain weight than the reduced N regimes.

3.3. N Uptake by Plants

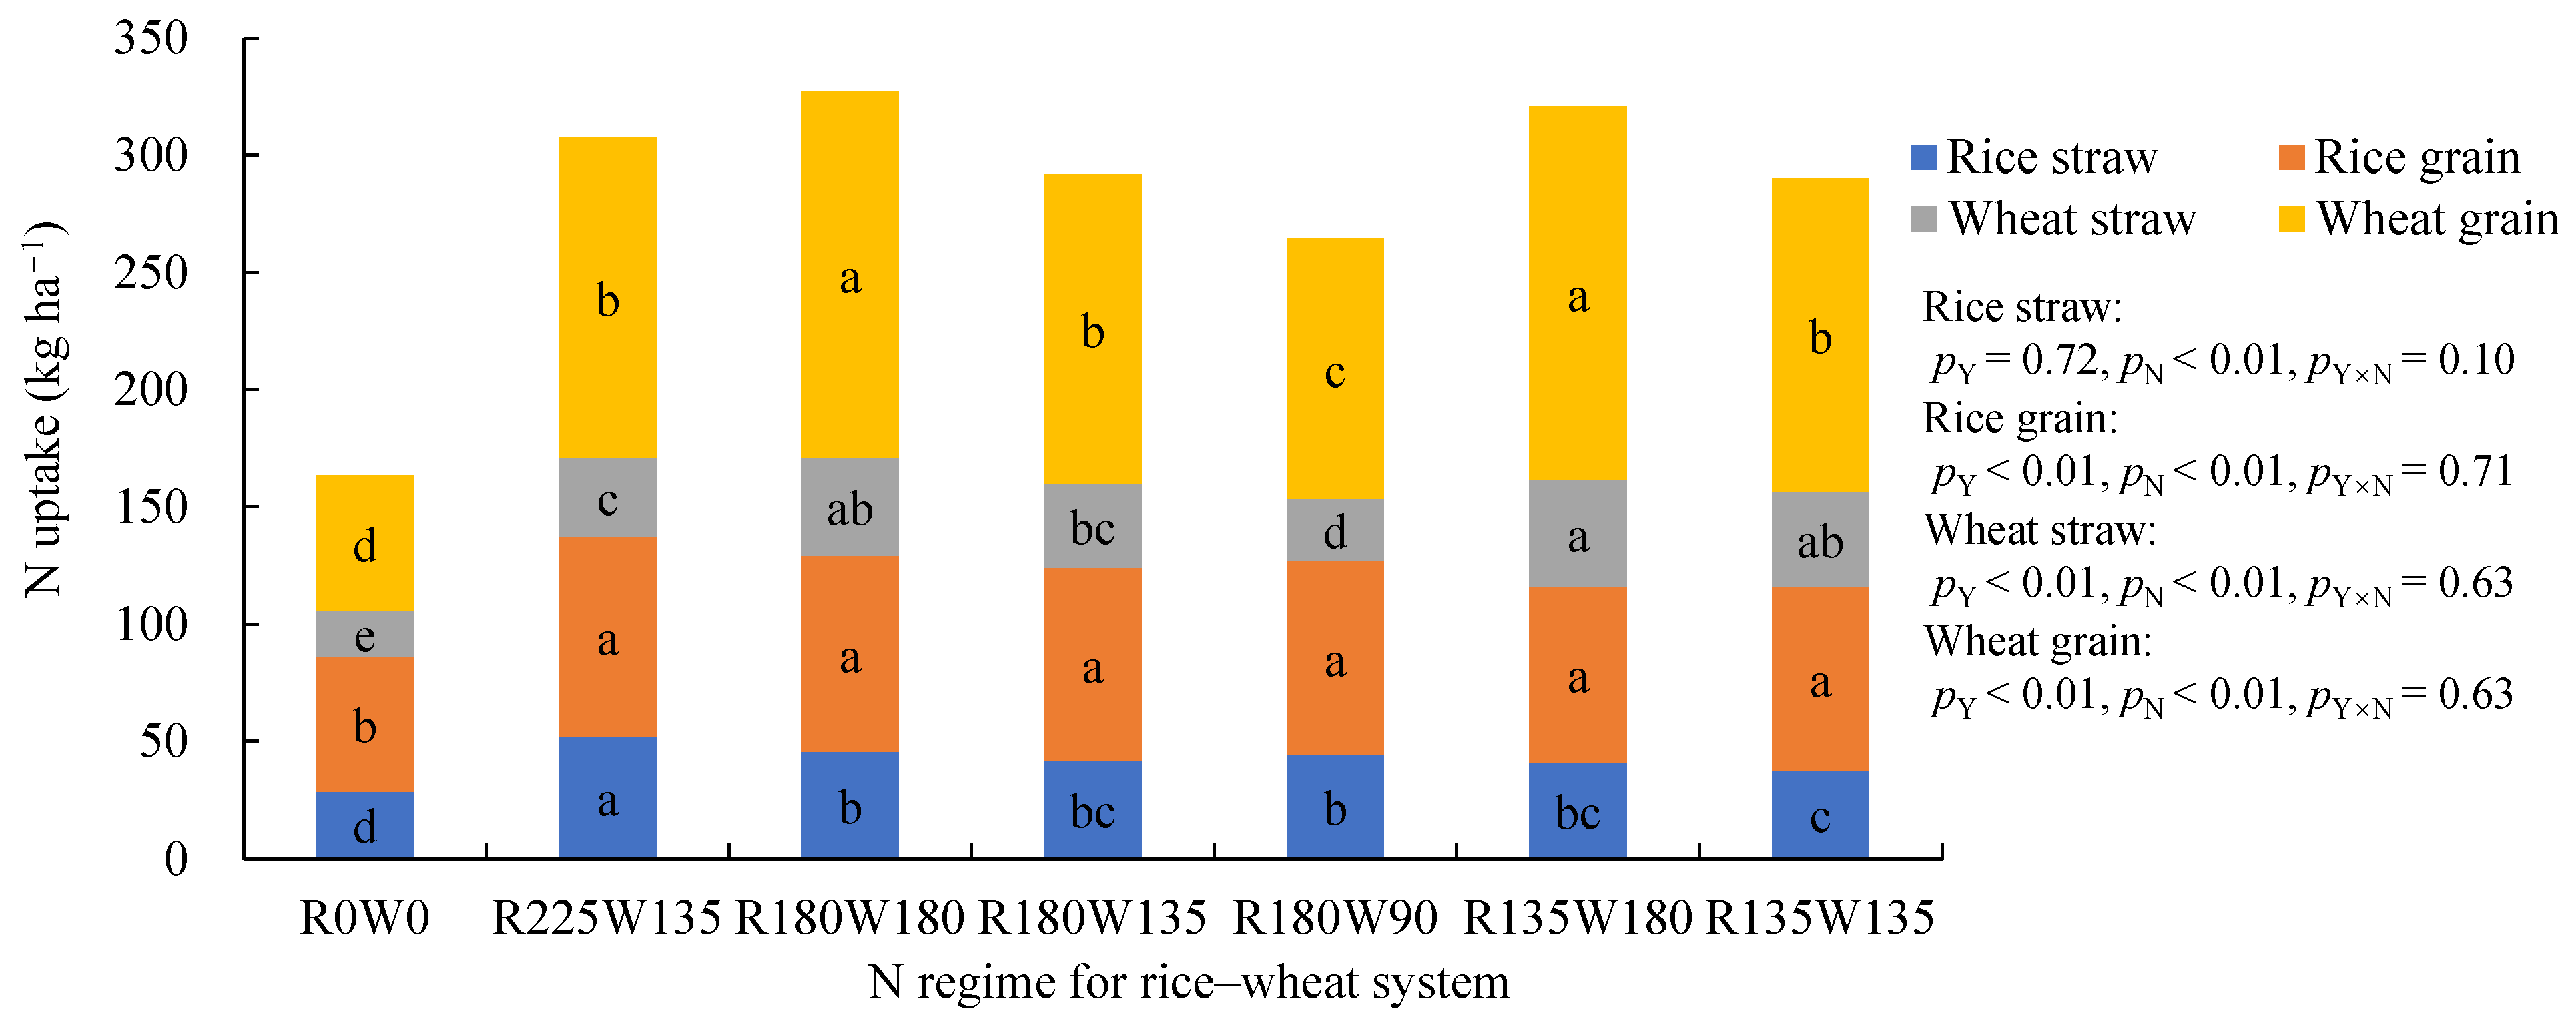
In general, the amount of N absorbed by both rice and wheat crops was closely related to the level of N application (Figure 2). With increasing N rate, plant N uptake was enhanced, especially during the wheat season. Over two tested years, N uptake by rice plants ranged from 86.3 to 137.2 kg ha−1, with the differences mainly observed in the vegetative organs rather than in the grain. For wheat crops, the N uptake ranged from 77.0 to 204.7 kg ha−1, and the differences occurred both in the vegetative organs and the grain. Furthermore, wheat N uptake was mainly associated with the current-season wheat N rate, and no clear carry-over response of wheat N uptake to the preceding rice-season N rate was observed. At the system level, the two traditional practices achieved the highest system N uptake, followed by the R135W180 treatment, and treatments with reduced N during the wheat season generally had lower system N absorption.

3.4. Residual NO3-N Concentrations in the Soil Profile

Residual soil nitrate-N at crop maturity was mainly concentrated in the topsoil and decreased significantly with depth across all treatments, while the 2017/2018 season showed greater NO3-N accumulation than 2016/2017, particularly in the subsoil after rice harvest (Table 6).
In the rice season, N application rates exerted negligible influence on surface soil NO3-N concentration (0–20 cm); however, significant treatment effects emerged in the deep soil (40–60 cm, p < 0.05). Specifically, regimes with higher basal N inputs (e.g., the R225W135 treatment) tended to increase nitrate accumulation in deep soil layers, contrasting with the lower accumulation observed in the R135 treatments.
Following the wheat harvest, in 2016/2017, the R180W90 regime resulted in a transient spike in soil surface NO3-N concentration. Conversely, during the 2017/2018 wheat season, soil NO3-N concentrations were similar across N regimes, indicating no significant response to fertilization gradients.
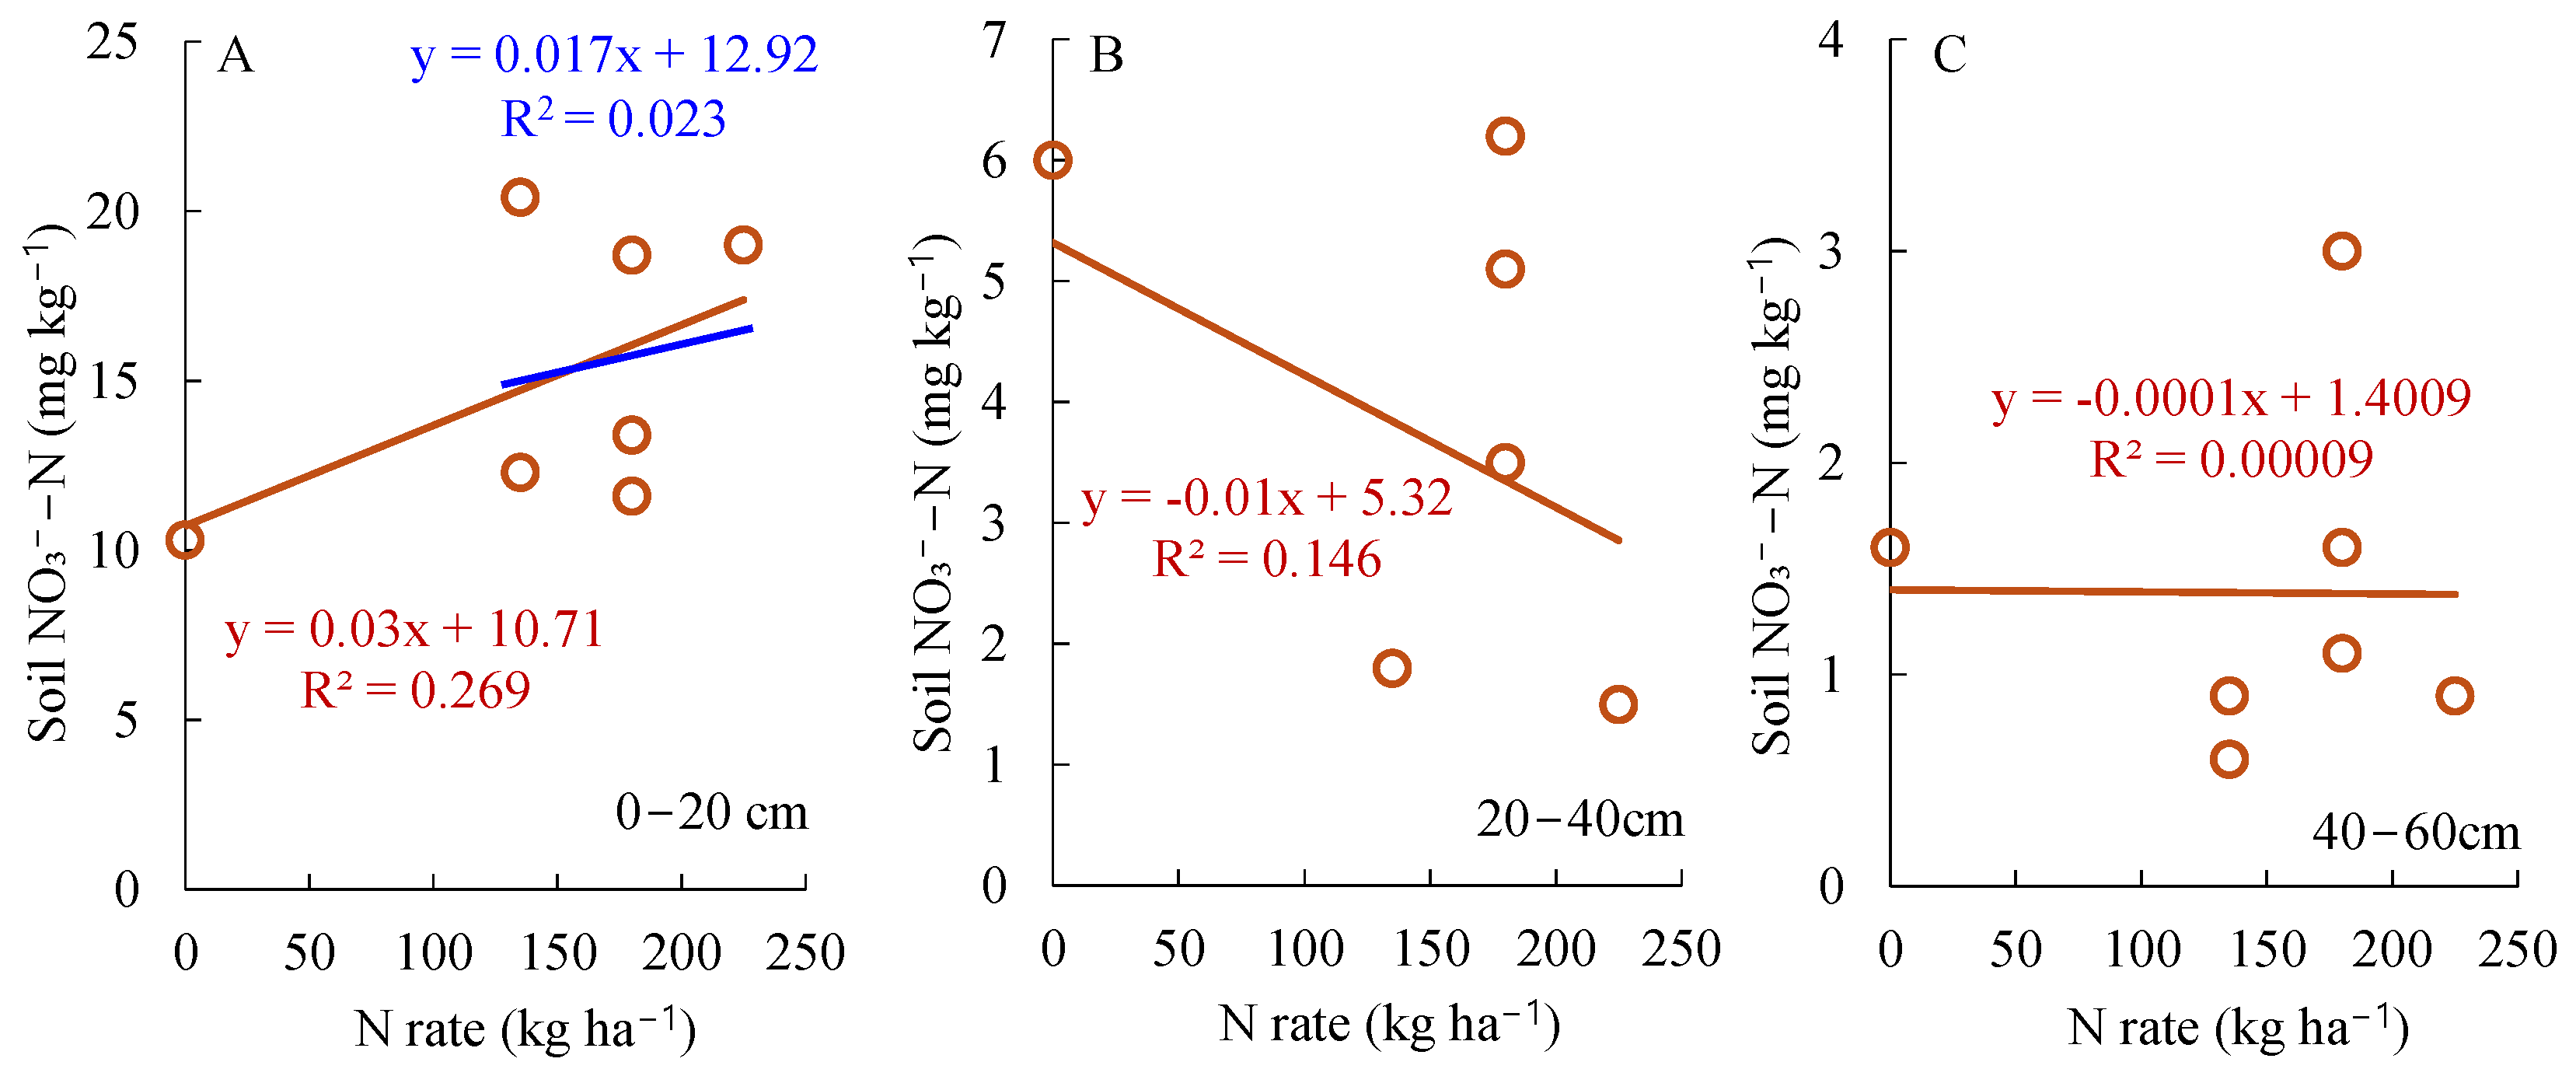
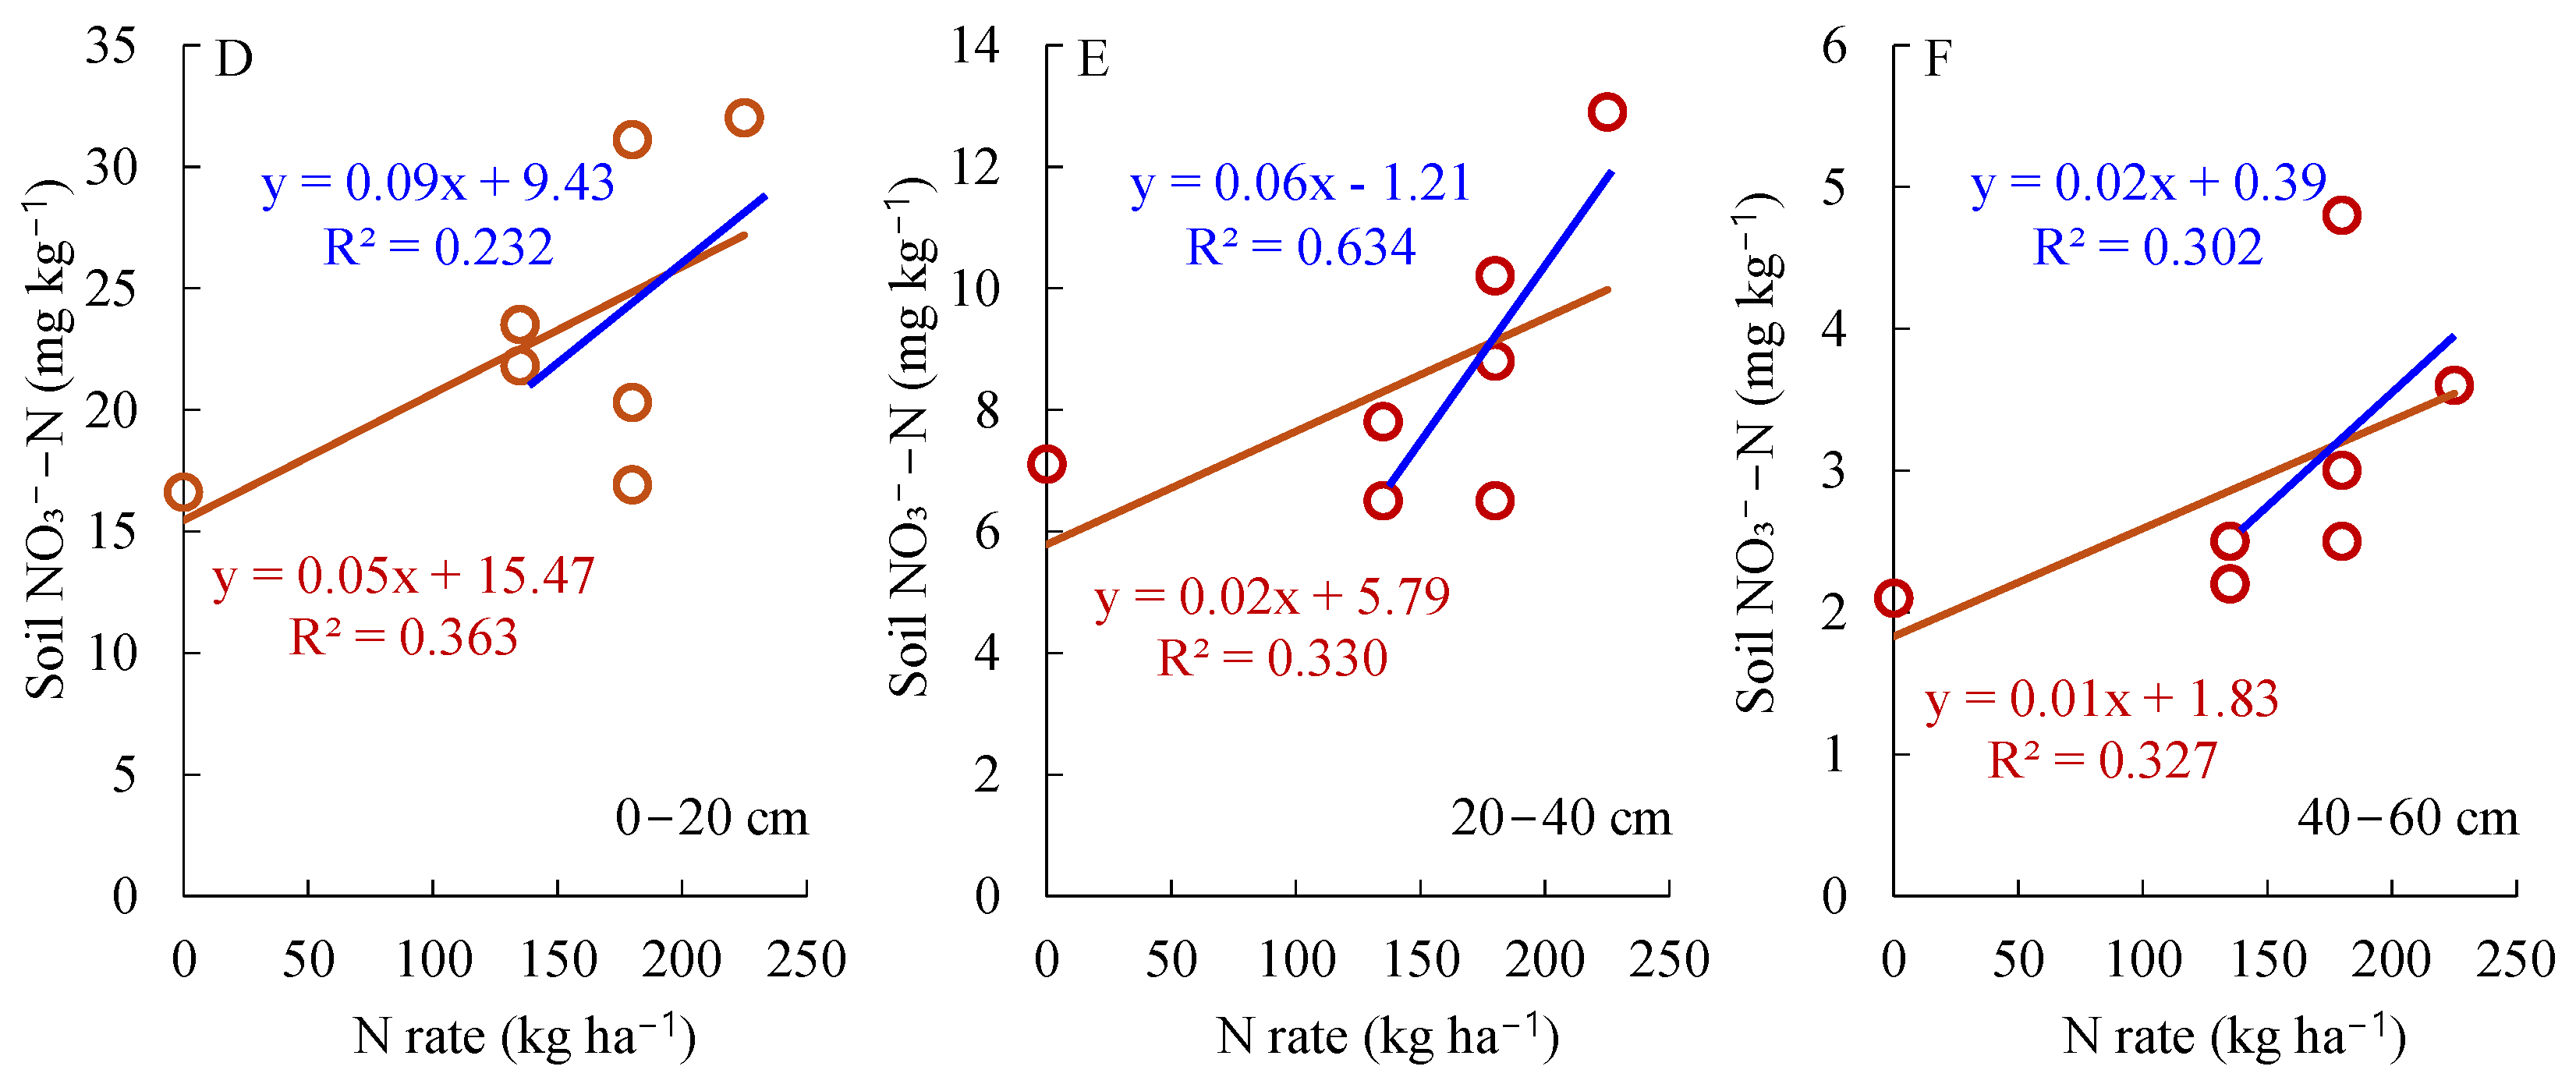
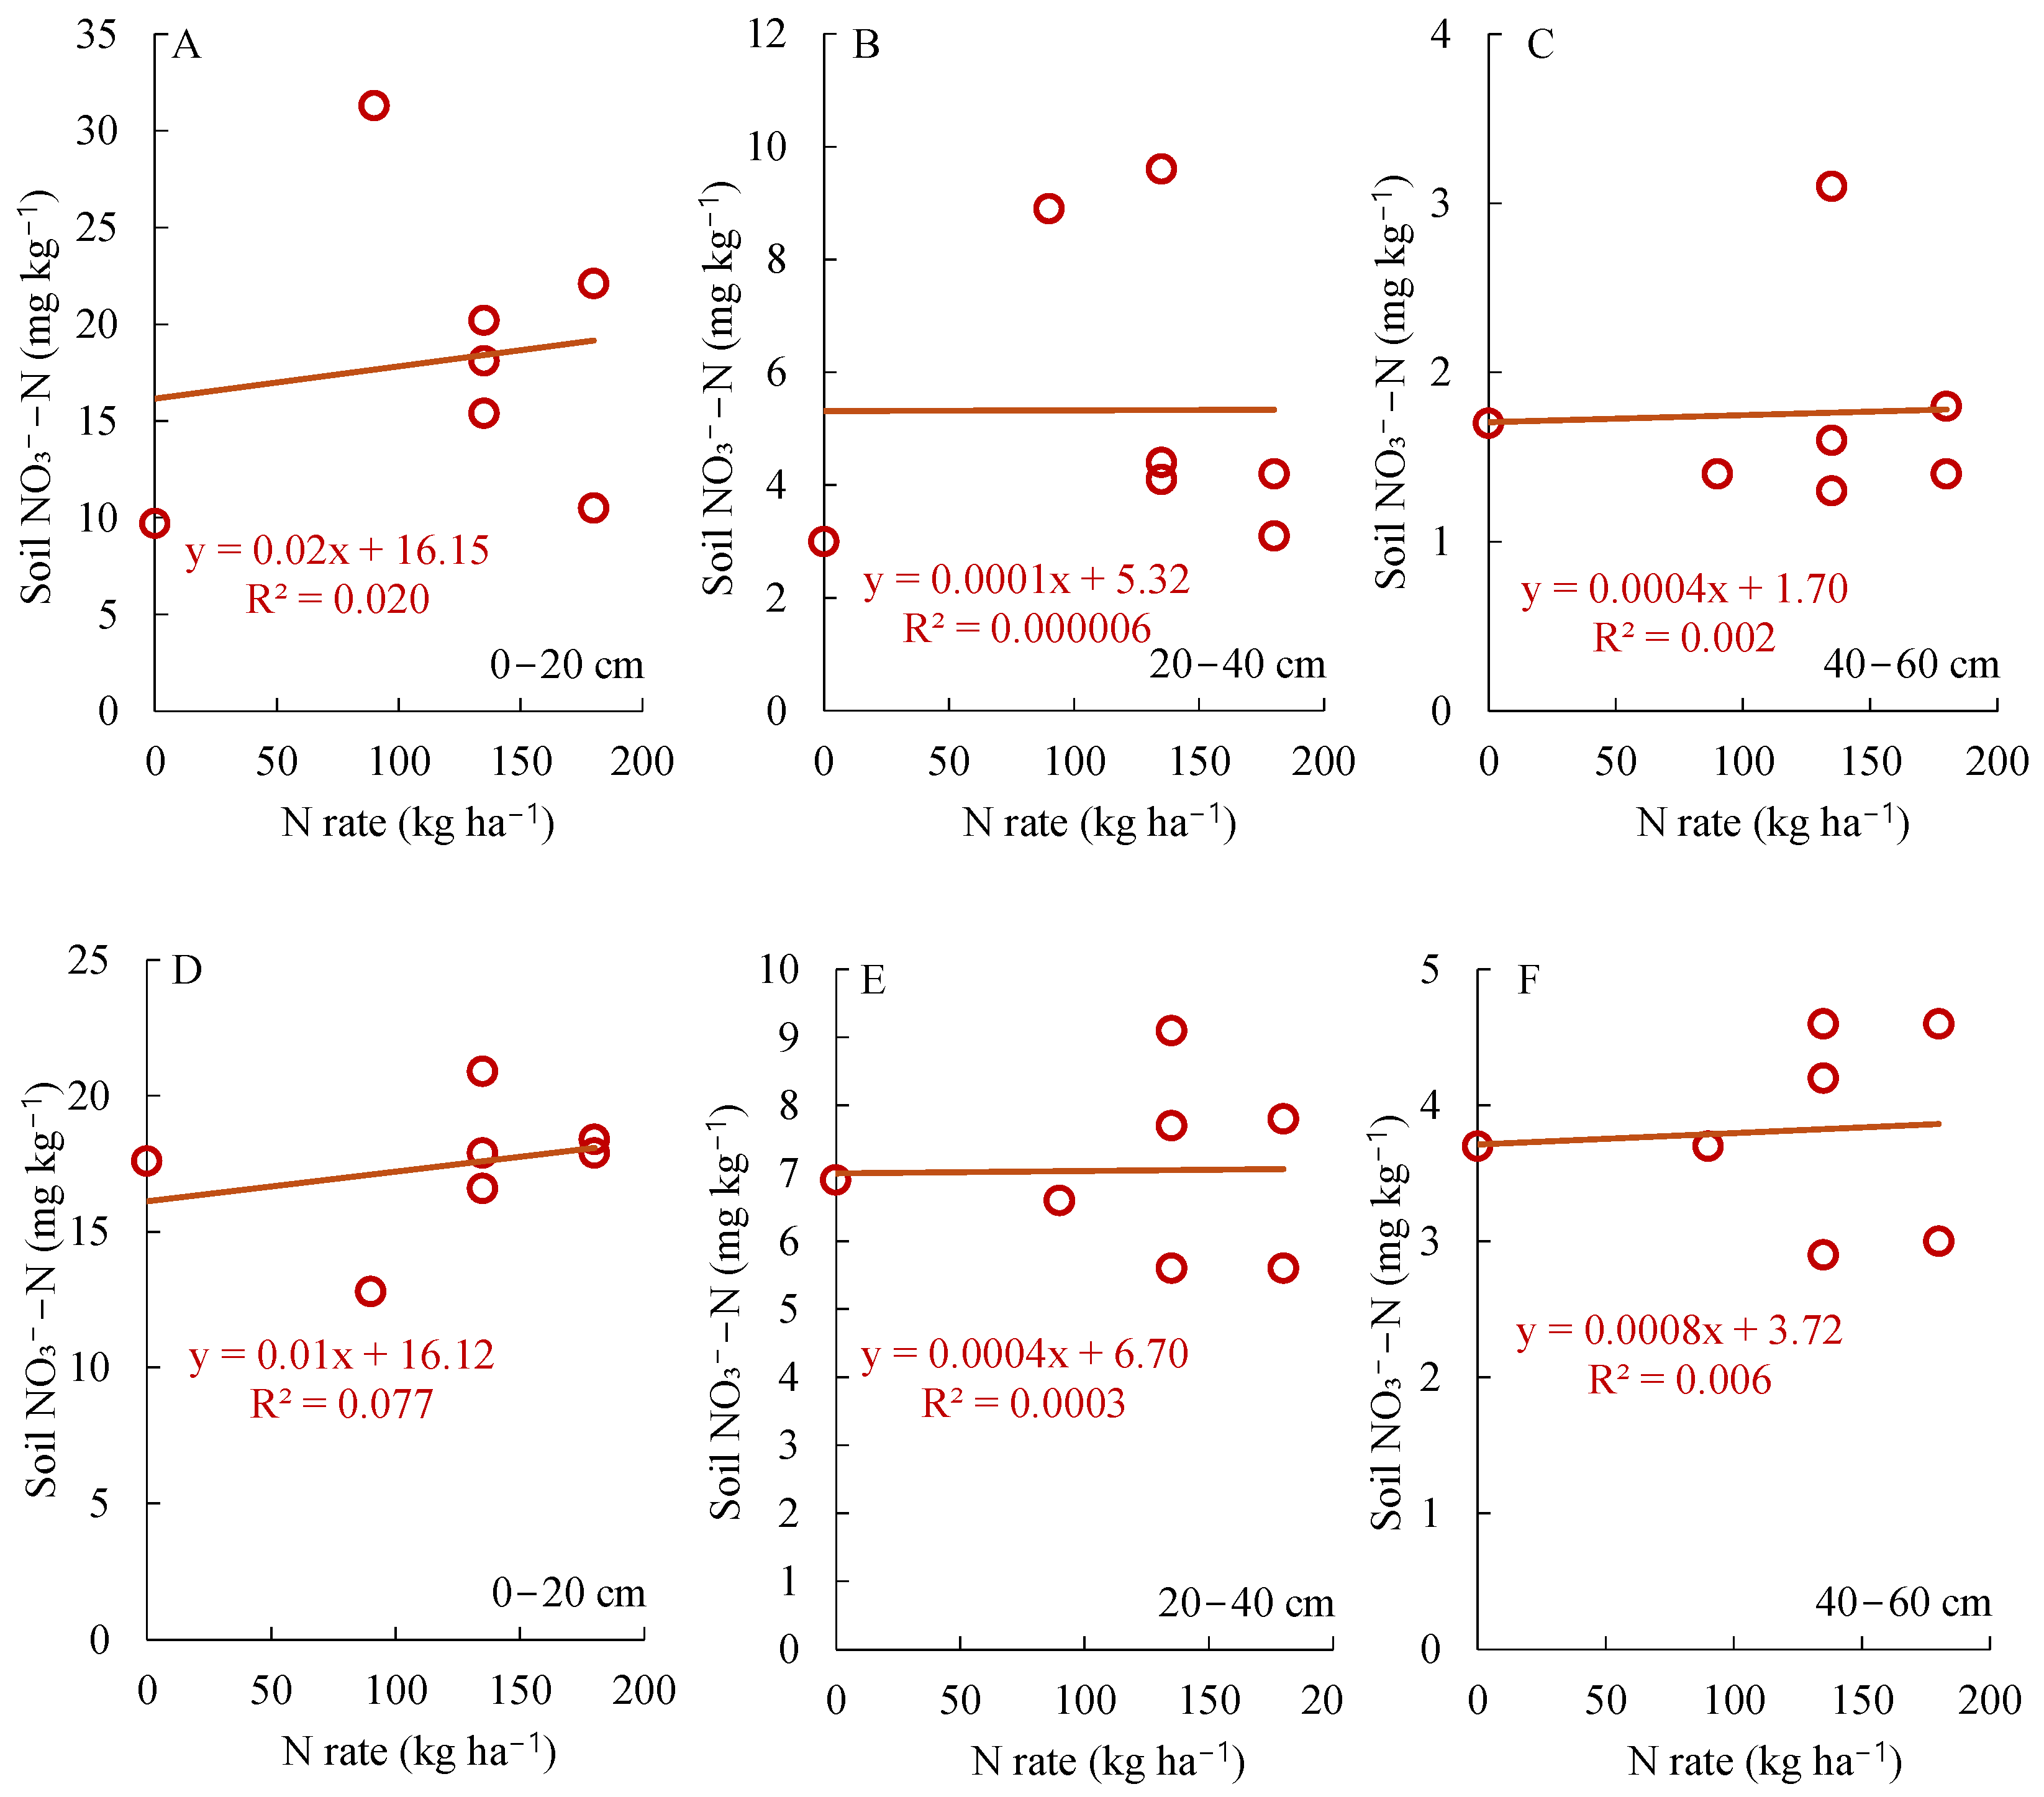
Pearson correlation analysis revealed that the relationship between N application rates and post-harvest residual NO3-N concentration in the root zone was not statistically significant for either rice or wheat. During the rice season, N omission resulted in a depletion of topsoil (0–20 cm) nitrate, and topsoil NO3-N concentration generally increased with rising N inputs. Notably, during the 2017/2018 season, this positive dependence on N rates extended to the 20–40 cm and 40–60 cm subsoil layers (Figure 3). In contrast, residual NO3-N concentration following the wheat harvest appeared uncoupled from the current-season N application rates across the soil profile. This lack of correlation was particularly evident in the 2017/2018 season, where residual nitrate levels in the unfertilized control plots remained intermediate, comparable to those in the fertilized treatments (Figure 4).

3.5. N Use Efficiency

The N application rate had significant or extremely significant effects on PFPN, AEN, and NHI in both rice and wheat. The N × Y interaction effect on most NUE parameters was not significant (Table 7). Reducing N input significantly increased PFPN in both crops. AEN was lower in rice than in wheat, and the response to N reduction was weaker in rice (p < 0.05) than in wheat (p < 0.01). REN of both wheat and rice was not significantly affected by the N rate. Moreover, REN was lower in rice than in wheat, likely because of lower N uptake in rice. NHI of wheat was higher than that of rice. Reducing N input helped to increase N in the grain. At the system level, compared with farmer’ practices, the N reduction treatment could significantly improve PFPN (by more than 10%), but had no significant impact on AEN and REN. N × Y interaction had a significant effect on system AEN, but has no significant effect on other parameters.

3.6. Apparent N Balance

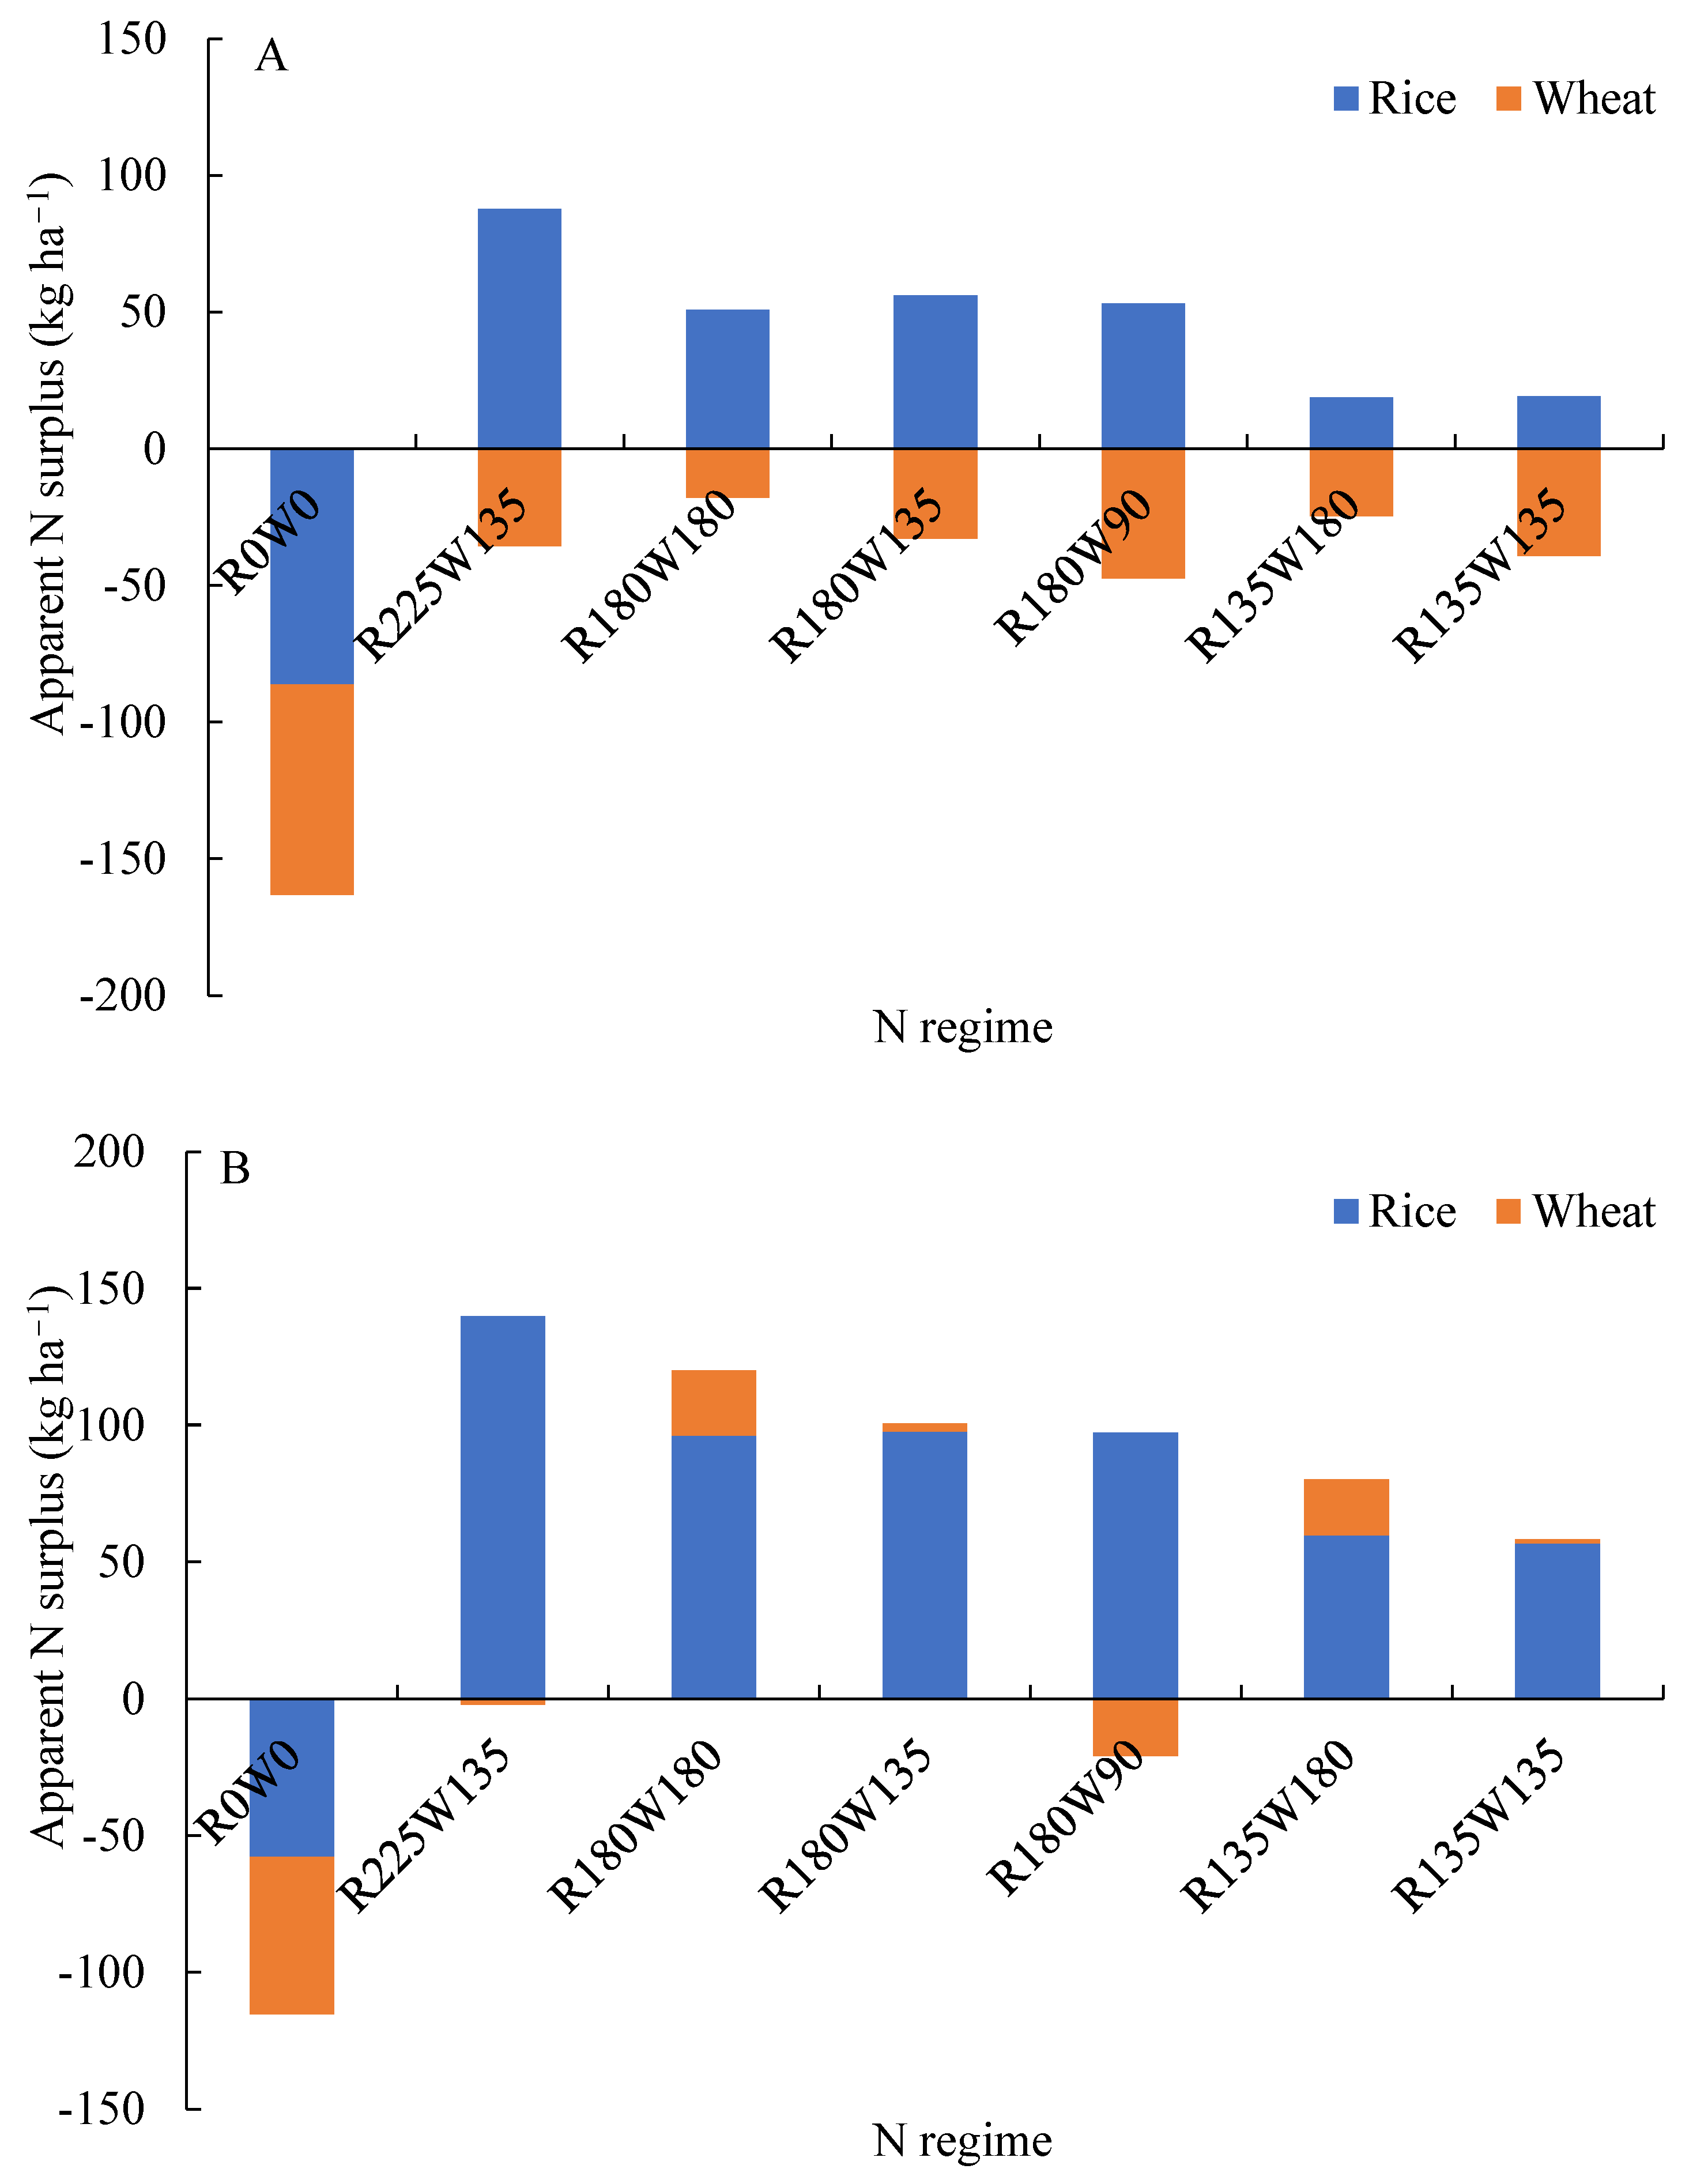
The apparent N balance, calculated based on total N removal (grain plus straw), revealed distinct seasonal asymmetries (Figure 5A). The rice season consistently showed an N surplus in fertilized treatments, peaking at 87.8 kg N ha−1 under the high-N regime (R225). Conversely, the wheat season showed an N deficit; all treatments exhibited negative balances ranging from −47.5 to −17.9 kg N ha−1, indicating that wheat uptake exceeded seasonal fertilizer input. Consequently, on an annual basis, only high-input rotations (e.g., R225W135) maintained a consistent positive system surplus, whereas reduced N regimes (R180W90, R135W180) often resulted in annual deficits.
However, the assessment shifts significantly when the N balance is calculated solely based on grain removal, excluding straw N export (Figure 5B). Under this scenario, the annual system consistently exhibited a substantial surplus across all fertilized treatments, ranging from 49.3 to 150.8 kg N ha−1. Notably, the deficits observed during the wheat season in the total-removal calculation were largely mitigated or reversed when straw N was excluded from the output calculation.

4. Discussion

4.1. Optimized N Allocation Maintains System Productivity While Reducing Total Inputs

The intensive rice–wheat (RW) rotation in the Yangtze River Basin has historically relied on high nitrogen (N) inputs to sustain productivity, thereby increasing the risk of N losses [1,2,3,4]. Our two-year study shows that comparable system productivity can be maintained with lower annual N input when N is strategically reallocated between the rice and wheat seasons. We identified that a moderate annual N input of 315 kg ha−1 (R180W135: 180 kg ha−1 for rice and 135 kg ha−1 for wheat or R135W180: 135 kg ha−1 for rice and 180 kg ha−1 for wheat) maintained a robust annual grain yield (18.2–19.3 Mg ha−1), which was statistically equivalent to the traditional high-input practices (360 kg N ha−1).
The maintenance of high yields under reduced N regimes is primarily attributed to the regulation of sink capacity, specifically panicle or spike densities, which are the fundamental drivers of productivity in both crops [27,28]. For rice, reducing the N rate from 225 to 180 kg ha−1 did not significantly compromise panicle formation (Table 4). This indicates that 180 kg N ha−1 approaches the agronomic N saturation point for rice in this region; inputs beyond this threshold fail to stimulate further tillering and instead risk lodging and increased disease susceptibility [29]. For wheat, the R180W135 regime supported optimal spike density, whereas a further reduction to 90 kg N ha−1 (R180W90) caused a significant yield penalty due to carbon-nitrogen metabolic limitations during the tillering and jointing stages, leading to tiller abortion [30,31].
Furthermore, our findings suggest a trade-off between sink formation and grain filling under relatively high N input. Higher N supply promoted panicle or spike formation, but this did not consistently increase grain yield and was sometimes accompanied by a reduction in 1000-grain weight. This response may reflect an imbalance between sink demand and source capacity during grain filling, especially when N-induced vegetative growth or high spike density increases competition for assimilates [32]. However, the strength of this trade-off is unlikely to be constant across environments. It may become more pronounced under unfavorable agroecological conditions, such as low solar radiation, high temperature during grain filling, excessive soil moisture, lodging, disease pressure, or soils with high indigenous N supply. Conversely, under favorable radiation, temperature, and soil conditions, the negative effect of high N input on grain filling may be less evident [33,34]. Therefore, optimized N management should avoid excessive stimulation of sink formation while maintaining sufficient N supply for grain filling.

4.2. Wheat Productivity Responds More Sensitively to Current-Season N Supply, with No Significant Yield Carry-Over Effect Detected

A critical uncertainty in continuous RW rotations is whether N applied during the rice season produces a measurable carry-over effect on the subsequent wheat crop. In some continuous dryland crop sequences, residual nitrate may remain within the soil profile and can sometimes be recovered by the following crop [35,36]. However, residual fertilizer N in paddy–upland rotations is not a stable or consistently available N pool. Its retention and utilization are strongly affected by the transition from flooded anaerobic conditions during rice growth to drained aerobic conditions during wheat growth. Under flooded conditions, applied N may be lost through ammonia volatilization, denitrification, runoff, and leaching; after drainage, soil reoxidation can promote nitrification and increase NO3-N formation, which is highly mobile and vulnerable to leaching. Therefore, the amount, chemical form, spatial distribution, and timing of residual N availability to wheat are highly uncertain. In the present study, the rice-season N rate did not significantly affect subsequent wheat yield, indicating that no significant yield carry-over effect was detected under the conditions of this two-year experiment. However, this result should not be interpreted as evidence of the absence of broader N legacy effects in the soil–crop system, because residual fertilizer N transformation, mineralization, immobilization, microbial N cycling, and the isotopic fate of fertilizer-derived N were not directly quantified. Furthermore, residual NO3-N concentrations in the topsoil (0–20 cm) after the wheat harvest showed little correlation with the N applied in the current wheat season (Figure 4).
The soil profile analysis revealed that regimes with high N inputs for rice, such as R225, tended to increase NO3-N accumulation in deeper soil layers, particularly at 40–60 cm after rice harvest in the 2017/2018 season (Table 6). Although this residual nitrate was measurable in the soil profile, it did not translate into a detectable increase in subsequent wheat yield. Its downward distribution may reduce the likelihood of timely wheat uptake during early establishment and increase the risk of further leaching during rainfall or irrigation events. Thus, residual NO3-N accumulation after rice harvest should not be directly interpreted as an effective N source for the subsequent wheat crop, at least from the perspective of yield response. Consequently, the traditional strategy of “over-fertilizing rice to feed the wheat” is not supported by the observed wheat yield response in this study and may increase environmental risks.
The apparent N balance further underscores the need to revise N recommendations. When calculated based on total biomass removal, including straw, the wheat season appeared to be N-deficient. However, under the current regional practice of full straw return, the system operates in a N surplus across all fertilized treatments (Figure 5). The long-term return of crop residues can enhance soil organic carbon, improve soil aggregation, stimulate microbial activity, and steadily increase the supply of indigenous N through mineralization [37]. In addition, zero- or reduced-tillage wheat following rice harvest may reduce soil disturbance and improve soil moisture and nutrient retention, thereby supporting wheat establishment and N acquisition [16]. These improvements help explain why moderate N reduction did not significantly reduce annual system productivity and further support the need to update fertilizer recommendations under current management conditions. Nevertheless, the present study evaluated carry-over effects mainly through subsequent wheat yield, wheat N uptake, and residual soil NO3-N concentration; further studies using isotope tracing and direct measurements of soil N transformation are needed to quantify the broader legacy effects of fertilizer N.
The contrasting NUE responses between rice and wheat indicate that N management in rice–wheat rotation systems should be crop-season-specific rather than based only on a uniform annual N input. Rice and wheat are grown under markedly different hydrological conditions, which influence soil N transformation, crop N uptake, and potential N losses. In the rice season, flooded conditions may enhance N losses through ammonia volatilization, denitrification, and runoff if N supply is not synchronized with crop demand. Therefore, rice N management should focus on appropriate split application, improved synchronization with tillering and panicle initiation, and coordinated water management. In contrast, wheat is grown under upland conditions, where residual soil mineral N after rice, soil moisture, and N availability during tillering and stem elongation are more critical for determining crop N uptake and yield formation. Thus, wheat N management should avoid excessive early-season N input that may increase lodging risk or reduce N recovery efficiency.

4.3. Optimized N Allocation Enhances System-Level NUE and Reduces Potential N-Loss Risks

Optimizing N allocation not only stabilized yields but also significantly enhanced system-level NUE. The partial factor productivity of N (PFPN) was markedly improved under reduced-N regimes compared with traditional practices (Table 7). Notably, we observed distinct asymmetrical NUE patterns between the two crops: the agronomic efficiency (AEN) and apparent recovery efficiency (REN) of wheat were consistently higher than those of rice.
The inherently lower REN in flooded rice systems is well-documented, primarily driven by rapid ammonia volatilization, denitrification, leaching, and surface runoff under flooded conditions [38]. From an environmental perspective, reducing rice-season N input is particularly important because high N application during the flooded rice season may enhance N losses and promote NO3-N accumulation in deeper soil layers after drainage [39,40]. Therefore, the optimized regime improved the balance between productivity and N management by sustaining grain yield, improving N use efficiency, and limiting deep-soil nitrate accumulation, thereby reducing the potential risk of nitrate leaching.
Therefore, rice-season N management should prioritize avoiding excessive basal or early-season N input, improving the synchronization between N supply and tiller or panicle formation, and reducing N losses through appropriate fertilizer splitting and water management [28]. In contrast, wheat cultivated under zero-tillage with straw mulching in the Upper Yangtze River Basin benefits from improved soil moisture retention and reduced soil disturbance, thereby enhancing N interception [16]. Because wheat yield and N uptake responded more strongly to current-season N supply, adequate N availability during establishment and stem elongation should be maintained, particularly under zero-tillage and straw-mulching conditions. To maximize system-level efficiency, rather than heavily biasing N allocation toward rice, a crop-specific and season-specific allocation strategy that respects the physiological thresholds and N loss pathways of both crops is required.

4.4. Agronomic Implications and Future Perspectives

For decades, N management in the Upper Yangtze River Basin has been largely empirical, lagging behind significant changes in cropping practices, particularly in the adoption of conservation tillage and straw incorporation.
Our findings provide a region-specific agronomic basis for a moderate reduction in N fertilizer use, suggesting that reducing the annual N application rate from the current level of 360 kg ha−1 to approximately 315 kg ha−1 is feasible to maintain system productivity under the tested conditions. The two experimental cycles were broadly representative of the long-term climatic conditions of the Chengdu Plain and were not characterized by extreme drought or excessive rainfall. However, because only two rice–wheat cycles were included, further multi-year and multi-site studies are needed to test the robustness of the optimized N allocation strategy under more contrasting climatic conditions, especially unusually wet or dry years.
It should be noted, however, that the feasibility of moderate N reduction was evaluated mainly from the perspectives of grain yield, biomass production, N uptake, NUE, residual soil NO3-N, and apparent N balance. Grain quality traits, including wheat grain protein concentration, rice milling quality, chalkiness, and cooking or eating quality, were not measured in the present study. Therefore, the effects of long-term moderate N reduction on grain quality cannot be directly assessed from our dataset. This limitation is important because N management can influence crop quality by affecting grain N accumulation and grain filling. In wheat, grain protein concentration is closely associated with N supply, especially during the late vegetative and grain-filling stages. A reduction in N input that maintains yield may still alter grain protein concentration if post-anthesis N uptake or N remobilization is affected. In rice, N supply may influence grain filling, chalkiness, milling recovery, and eating quality. Thus, although the optimized N regimes maintained system productivity and improved PFPN in this study, their long-term effects on grain quality require further evaluation. In addition, legacy N and long-term straw return may influence soil microbial communities and broader soil health through changes in substrate availability, redox conditions, nitrification–denitrification processes, enzyme activities, and soil organic matter turnover. However, microbial community composition, microbial biomass N, enzyme activities, and integrated soil health indicators were not measured in this study. Therefore, the potential effects of moderate N reduction and residual N on soil microbial processes and soil health could not be directly evaluated. Future long-term studies should integrate microbial and soil health indicators to better understand the legacy effects of N management in rice–wheat rotations.
While this study offers clear actionable insights for seasonal N reallocation, we acknowledge that the selected N regimes were designed to represent common local farmer practices and feasible reduction strategies, rather than to cover all possible N rates, season allocation ratios, or in-season splitting strategies. Future studies should include more refined N-rate gradients, additional seasonal allocation combinations, and dynamic in-season N management across multiple sites and years to better define the optimal N input range for intensive RW rotation systems. This will support the transition from regionalized N thresholds to more dynamic, site-specific nutrient management frameworks, thereby improving the agronomic performance and N use outcomes of intensive RW rotation systems.

5. Conclusions

This study shows that optimized seasonal N allocation can maintain high productivity in intensive rice–wheat rotations in the Upper Yangtze River Basin while reducing total fertilizer N input. Our findings indicate that an optimized annual N regime of 315 kg ha−1, allocated as either 180 kg ha−1 for rice plus 135 kg ha−1 for wheat or 135 kg ha−1 for rice plus 180 kg ha−1 for wheat, maintained robust system grain yields of 18.2–19.3 Mg ha−1, statistically comparable to traditional higher-input farmer practices with 360 kg N ha−1.
A key finding of this research is that no significant yield carry-over effect of rice-season N input on subsequent wheat yield was detected. Excessive N applied to the flooded rice crop did not provide a measurable yield benefit for the following winter wheat under the conditions of this two-year experiment. Wheat productivity was mainly determined by current-season N management rather than by the N rate applied during the preceding rice season. This conclusion should be interpreted in light of the wheat yield response, because broader residual soil N processes were not directly quantified. By avoiding excessive seasonal N surpluses, the optimized allocation strategy significantly improved system-level N use efficiency, particularly PFPN, and may reduce potential N-related environmental risks by limiting nitrate accumulation in deeper soil layers. Ultimately, under current regional practices of full straw retention, implementing a moderate, crop-specific N-reduction strategy offers a practical framework to maintain high annual grain yield while improving N use efficiency and reducing potential N-related risks in intensive rice–wheat rotations.

Supplementary Materials

The following supporting information can be downloaded at: https://www.mdpi.com/article/10.3390/agriculture16111176/s1, Table S1: Experimental layout with Randomized complete block design, 7 N regimes × 3 replicates.

Author Contributions

Conceptualization, C.L., M.L. (Ming Li) and M.L. (Miao Liu); methodology, C.L. and M.L. (Miao Liu); software, C.L. and M.L. (Miao Liu); validation, C.L., M.L. (Miao Liu), X.W. and T.X.; formal analysis, C.L. and M.L. (Miao Liu); investigation, C.L., M.L. (Miao Liu), X.W., T.X., Y.T. and M.L. (Ming Li); resources, M.L. (Ming Li) and Y.T.; data curation, C.L. and M.L. (Miao Liu); writing—original draft preparation, C.L. and M.L. (Miao Liu); writing—review and editing, C.L., M.L. (Miao Liu), M.L. (Ming Li) and Y.T.; visualization, C.L. and M.L. (Miao Liu); supervision, M.L. (Ming Li); project administration, M.L. (Ming Li) and Y.T.; funding acquisition, M.L. (Ming Li) and Y.T. All authors have read and agreed to the published version of the manuscript.

Funding

This research was funded by the Scientific Research Project of Environment-Friendly and Efficient Water-Saving Technology and Equipment for Hilly Agriculture Key Laboratory of Sichuan Province (2025JDPT0109), the Scientific and Technological Research Project of Sichuan Academy of Agricultural Sciences (1+9KJGG010, 2025(1+3)ZYGG-04) and the Sichuan Science and Technology Program of China (2026NSFSC0104).

Institutional Review Board Statement

Not applicable.

Informed Consent Statement

Not applicable.

Data Availability Statement

The data have been presented in the article. For further inquiries, please contact the corresponding author.

Acknowledgments

The authors acknowledge the use of Gemini-3.1-Pro for language editing and proofreading. The authors have reviewed and edited the output and take full responsibility for the content of this publication.

Conflicts of Interest

The authors declare no conflicts of interest.

Abbreviations

The following abbreviations are used in this manuscript:
RWRice–wheat
NNitrogen
NUENitrogen use efficiency
HIThe harvest index
DMDry matter
NuptN uptake
PFPNN fertilizer partial factor productivity
AENN fertilizer agronomic efficiency
RENApparent N fertilizer recovery
NHIN harvest index

References

  1. Yang, Y.; Liu, X.; Chen, Y.; Xu, Q.; Dai, Q.; Wei, H.; Xu, K.; Zhang, H. Environmental impact assessment of rice–wheat rotation considering annual nitrogen application rate. Agronomy 2024, 14, 151. [Google Scholar] [CrossRef]
  2. Yang, Y.; Liu, X.; Gao, P.; Chen, Y.; Wei, H.; Zhang, H.; Dai, Q. Response of crop yield to nitrogen application and optimal nitrogen application rate in a rice–wheat rotation system. Agronomy 2025, 15, 2506. [Google Scholar] [CrossRef]
  3. Liu, Y.; Yu, J.; Zhang, L.; Wang, X.; Yin, G.; Zuo, W.; Bai, Y.; Huo, Z. Effects of fertilization on yield and nitrogen use efficiency of wheat and rice with straw return. Commun. Soil Sci. Plant Anal. 2021, 52, 1161–1170. [Google Scholar] [CrossRef]
  4. Zhang, X.; Davidson, E.A.; Mauzerall, D.L.; Searchinger, T.D.; Dumas, P.; Shen, Y. Managing nitrogen for sustainable development. Nature 2015, 528, 51–59. [Google Scholar] [CrossRef]
  5. Ju, X.; Xing, G.; Chen, X.; Zhang, S.; Zhang, L.; Liu, X.; Cui, Z.; Yin, B.; Christie, P.; Zhu, Z.; et al. Reducing environmental risk by improving N management in intensive Chinese agricultural systems. Proc. Natl. Acad. Sci. USA 2009, 106, 3041–3046. [Google Scholar] [CrossRef]
  6. Peng, S.; Buresh, R.J.; Huang, J.; Yang, J.; Zou, Y.; Zhong, X.; Wang, G.; Zhang, F. Strategies for overcoming low agronomic nitrogen use efficiency in irrigated rice systems in China. Field Crops Res. 2006, 96, 37–47. [Google Scholar]
  7. Zhang, X.; Sun, H.; Wang, C.; Zhang, J.; Zhou, S. Optimizing fertilizer management mitigated net greenhouse gas emissions in a paddy rice-upland wheat rotation system: A ten-year in situ observation of the Yangtze River Delta, China. Agric. Ecosyst. Environ. 2023, 356, 108640. [Google Scholar]
  8. Cui, Z.; Zhang, H.; Chen, X.; Zhang, C.; Ma, W.; Huang, C.; Zhang, W.; Mi, G.; Miao, Y.; Li, X.; et al. Pursuing sustainable productivity with millions of smallholder farmers. Nature 2018, 555, 363–366. [Google Scholar] [CrossRef] [PubMed]
  9. Sapkota, T.B.; Jat, M.L.; Rana, D.S.; Khatri-Chhetri, A.; Jat, H.S.; Bijarniya, D.; Sutaliya, J.M.; Kumar, M.; Singh, L.K.; Jat, R.K.; et al. Crop Nutrient Management Using Nutrient expert improves yield, increases farmers’ income and reduces greenhouse gas emissions. Sci. Rep. 2021, 11, 1564. [Google Scholar] [CrossRef]
  10. Zhang, J.; He, P.; Xu, X.; Ding, W.; Ullah, S.; Wang, Y.; Jia, L.; Cui, R.; Wang, H.; Zhou, W. Nutrient expert improves nitrogen efficiency and environmental benefits for winter wheat in China. Agron. J. 2018, 110, 696–706. [Google Scholar] [CrossRef]
  11. Qiao, J.; Wang, J.; Zhao, D.; Zhou, W.; Schwenke, G.; Yan, T.; Liu, D. Optimizing N fertilizer rates sustained rice yields, improved N use efficiency, and decreased N losses via runoff from rice-wheat cropping systems. Agric. Ecosyst. Environ. 2022, 324, 107724. [Google Scholar] [CrossRef]
  12. Jing, W.; Wang, C.; Fa, X.; Gu, H.; Wang, W.; Zhu, K.; Zhang, W.; Gu, J.; Liu, L.; Zhang, J.; et al. Reducing nitrogen and regulating density enable sustainable production of rice–wheat rotation system in the lower reaches of Yangtze River of China: A two-year rotation study. J. Sci. Food Agric. 2026, 106, 1600–1614. [Google Scholar] [CrossRef]
  13. Ma, P.; Lan, Y.; Lv, X.; Fan, P.; Yang, Z.; Sun, Y.; Zhang, R.; Ma, J. Reasonable nitrogen fertilizer management improves rice yield and quality under a rapeseed/wheat–rice rotation system. Agriculture 2021, 11, 490. [Google Scholar] [CrossRef]
  14. Hofmeier, M.; Roelcke, M.; Han, Y.; Lan, T.; Bergmann, H.; Bohm, D.; Cai, Z.; Nieder, R. Nitrogen management in a rice–wheat system in the Taihu Region: Recommendations based on field experiments and surveys. Agric. Ecosyst. Environ. 2015, 209, 60–73. [Google Scholar] [CrossRef]
  15. Jing, Q.; van Keulen, H.; Hengsdijk, H. Modeling biomass, nitrogen and water dynamics in rice–wheat rotations. Agric. Syst. 2010, 103, 433–443. [Google Scholar] [CrossRef]
  16. Liu, M.; Wu, X.; Li, M.; Xiong, T.; Li, C.; Tang, Y. Innovative no-till seeding technology improves yield and nitrogen use efficiency while reducing environmental pressure in wheat after rice harvesting. Soil Till. Res. 2024, 235, 105908. [Google Scholar] [CrossRef]
  17. Liu, B.; Xia, H.; Jiang, C.; Jiang, C.; Riaz, M.; Yang, L.; Chen, Y.; Fan, X.; Zhang, Z.; Duan, X.; et al. Straw addition enhances crop yield, soil aggregation, and soil microorganisms in a 14-year wheat–rice rotation system in central China. Plants 2024, 13, 985. [Google Scholar] [CrossRef]
  18. Li, H.; Li, J.; Jiao, X.; Jiang, H.; Liu, Y.; Wang, X.; Ma, C. The fate and challenges of the main nutrients in returned straw: A basic review. Agronomy 2024, 14, 698. [Google Scholar] [CrossRef]
  19. Smith, C.J.; Chalk, P.M. The residual value of fertilizer N in crop sequences: An appraisal of 60 years of research using 15N tracer. Field Crops Res. 2018, 217, 66–74. [Google Scholar] [CrossRef]
  20. Wang, S.; Luo, S.; Yue, S.; Shen, Y.; Li, S. Residual effects of fertilizer N response to split N applications in semiarid farmland. Nutr. Cycl. Agroecosyst. 2019, 114, 99–110. [Google Scholar]
  21. Alam, M.S.; Khanam, M.; Rahman, M.M. Environment-friendly nitrogen management practices in wetland paddy cultivation. Front. Sustain. Food Syst. 2023, 7, 1020570. [Google Scholar] [CrossRef]
  22. Norman, R.J.; Stucki, J.W. The determination of nitrate and nitrite in soil extracts by ultraviolet spectrophotometry. Soil Sci. Soc. Am. J. 1981, 45, 347–353. [Google Scholar] [CrossRef]
  23. Nelson, D.; Sommers, L. Determination of total nitrogen in plant material. Agron. J. 1973, 65, 109–112. [Google Scholar] [CrossRef]
  24. Liu, X.; Xu, S.; Zhang, J.; Ding, Y.; Li, G.; Wang, S.; Liu, Z.; Tang, S.; Ding, C.; Chen, L. Effect of continuous reduction of nitrogen application to a rice-wheat rotation system in the middle-lower Yangtze River region (2013–2015). Field Crops Res. 2016, 196, 348–356. [Google Scholar] [CrossRef]
  25. Yin, L.; Dai, X.; He, M. Delayed sowing improves nitrogen utilization efficiency in winter wheat without impacting yield. Field Crops Res. 2018, 221, 90–97. [Google Scholar] [CrossRef]
  26. Ding, W.; Xu, X.; Zhang, J.; Hui, S.; He, P.; Zhou, W. Nitrogen balance acts an indicator for estimating thresholds of nitrogen input in rice paddies of China. Environ. Pollut. 2021, 290, 118091. [Google Scholar] [CrossRef]
  27. Zhang, H.; Xue, Y.; Wang, Z.; Yang, J.; Zhang, J. Morphological and physiological traits of roots and their relationships with shoot growth in “super” rice. Field Crops Res. 2009, 113, 31–40. [Google Scholar] [CrossRef]
  28. Liu, L.; Chen, T.; Wang, Z.; Zhang, H.; Yang, J.; Zhang, J. Combination of site-specific nitrogen management and alternate wetting and drying irrigation increases grain yield and nitrogen and water use efficiency in super rice. Field Crops Res. 2013, 154, 226–235. [Google Scholar]
  29. Lu, Y.; Cui, J.; Bao, S.; Liu, W.; Geng, Y.; Liang, X.; Li, S.; Guo, L.; Shao, X. Effects of nitrogen fertilizer application rate on lodging resistance for rice (Oryza sativa L.) stem. Sci. Rep. 2025, 15, 2149. [Google Scholar] [CrossRef]
  30. Fortunato, S.; Nigro, D.; Paradiso, A.; Cucci, G.; Lacolla, G.; Trani, R.; Agrimi, G.; Blanco, A.; de Pinto, M.C.; Gadaleta, A. Nitrogen metabolism at tillering stage differently affects the grain yield and grain protein content in two durum wheat cultivars. Diversity 2019, 11, 186. [Google Scholar] [CrossRef]
  31. Li, J.; Wang, Z.; Song, Y.; Li, J.; Zhang, Y. Effects of reducing nitrogen application rate under different irrigation methods on grain yield, water and nitrogen utilization in winter wheat. Agronomy 2022, 12, 1835. [Google Scholar] [CrossRef]
  32. Yang, J.; Zhang, J.; Huang, Z.; Zhu, Q.; Wang, L. Remobilization of carbon reserves is improved by controlled soil-drying during grain filling of wheat. Crop Sci. 2000, 40, 1645–1655. [Google Scholar] [CrossRef]
  33. Dou, Z.; Zhou, Y.; Zhang, Y.; Guo, W.; Xu, Q.; Gao, H. Influence of Nitrogen Applications during Grain-Filling Stage on Rice (Oryza sativa L.) Yield and Grain Quality under High Temperature. Agronomy 2024, 14, 216. [Google Scholar] [CrossRef]
  34. Fang, L.; Struik, P.C.; Girousse, C.; Yin, C.; Martre, P. Source–sink relationships during grain filling in wheat in response to various temperature, water deficit, and nitrogen deficit regimes. J. Exp. Bot. 2024, 75, 6563–6578. [Google Scholar] [CrossRef]
  35. Shi, Z.; Liu, D.; Liu, M.; Hafeez, M.B.; Wen, P.; Wang, X.; Wang, R.; Zhang, X.; Li, J. Optimized fertilizer recommendation method for nitrate residue control in a wheat–maize double cropping system in dryland farming. Field Crops Res. 2021, 271, 108258. [Google Scholar] [CrossRef]
  36. Cui, Z.; Zhang, F.; Chen, X.; Dou, Z.; Li, J. In-season nitrogen management strategy for winter wheat: Maximizing yields, minimizing environmental impact in an over-fertilization context. Field Crops Res. 2010, 116, 140–146. [Google Scholar] [CrossRef]
  37. Chen, A.; Zhang, W.; Sheng, R.; Liu, Y.; Hou, H.; Liu, F.; Ma, G.; Wei, W.; Qin, H. Long-term partial replacement of mineral fertilizer with in situ crop residues ensures continued rice yields and soil fertility: A case study of a 27-year field experiment in subtropical China. Sci. Total Environ. 2021, 787, 147523. [Google Scholar] [CrossRef]
  38. Hao, S.; Wang, X.; Ding, T.; Zhu, W. Study on nitrogen loss rules of paddy fields under different irrigation and drainage modes in Southern China. Water 2022, 14, 3071. [Google Scholar] [CrossRef]
  39. Rehman, A.; Nawaz, A.; Islam, M.; Haider, F.U.; Farooq, M. Nitrogen pollution and management in rice–wheat cropping system. Plant Soil 2025, 517, 1149–1186. [Google Scholar] [CrossRef]
  40. Kishor, K.; Chaudhary, S.K.; Upadhaya, B.; Dharminder; Tiwari, R.K.; Giri, G.S. Influence of nitrogen management on rice equivalent yield and soil properties in rice-wheat cropping system in calcareous soil of Bihar. Commun. Soil Sci. Plant Anal. 2025, 56, 2747–2768. [Google Scholar] [CrossRef]
Figure 1. The cropping calendar and observed daily weather conditions during the two experimental rice–wheat rotation cycles in Guanghan, Sichuan Province, Southwest China. (A) The first rotation cycle, including the 2016 rice season and the subsequent 2016/2017 wheat season. (B) The second rotation cycle, including the 2017 rice season and the subsequent 2017/2018 wheat season. For each cycle, the upper bar indicates the rice and wheat growing periods, and the lower panel shows daily rainfall, maximum temperature (Tmax), and minimum temperature (Tmin). Dashed vertical lines indicate the end of the rice season and the start of the subsequent wheat season.
Agriculture 16 01176 g001
Figure 2. The effect of different fertilizer N regimes under rice–wheat rotation on the N uptake of rice and wheat averaged over two consecutive growing seasons from 2016 to 2018. Note: Within a given crop and organ, means followed by different lowercase letters differ significantly (p < 0.05).
Agriculture 16 01176 g002
Figure 3. The correlation between the fertilizer N rate and the soil residual NO3-N concentration in different soil layers after rice harvest. (AC), 2016/2017 season; (DF), 2017/2018 season. Note: The red line represents the trend line of all experimental treatments, and the blue line represents the trend change of the N application treatments.
Agriculture 16 01176 g003aAgriculture 16 01176 g003b
Figure 4. The correlation between the fertilizer N rate and the soil residual NO3-N concentration in different soil layers after wheat harvest. (AC), 2016/2017 season; (DF), 2017/2018 season.
Agriculture 16 01176 g004
Figure 5. The effect of different fertilizer N regimes under rice–wheat rotation on the apparent N balance for rice and wheat averaged over two consecutive growing seasons from 2016 to 2018. (A), the scenario where N output includes crop straw; (B), the scenario where N output excludes crop straw.
Agriculture 16 01176 g005
Table 1. The chemical properties of the soil (0–20 cm soil layer) before rice transplanting in 2016 and 2017.
20162017
Soil organic carbon (g kg−1)29.9724.36
Total nitrogen (g kg−1)2.812.47
Total phosphorus (g kg−1)1.291.24
Total potassium (g kg−1)18.0514.73
Alkali-hydrolyzable nitrogen (mg kg−1)156.93154.24
Available phosphorus (mg kg−1)22.7111.41
Available potassium (mg kg−1)247.79154.78
pH6.987.75
Table 2. The fertilizer N regime under the rice–wheat rotation system.
N RegimeN Rate for Rice (kg ha−1)N Rate for Wheat (kg ha−1)System N Application (kg ha−1)Note
R0W0000Zero N input
R225W135225135360Local farmer’s practice 1
R180W180180180360Local farmer’s practice 2
R180W135180135315N reduction for wheat
R180W9018090270Further N reduction for wheat
R135W180135180315N reduction for rice
R135W135135135270N reduction for both crops
Note: System N application is the sum of the rice-season and wheat-season fertilizer N rates. Each N regime was randomly assigned to one plot within each of three replicate blocks in each field/cycle, and the same plot was used continuously for rice and the subsequent wheat crop within one annual rice–wheat cycle.
Table 3. The effect of different fertilizer N regimes under rice–wheat rotation on grain yield and aboveground biomass of rice, wheat, and the annual system in two consecutive growing seasons from 2016 to 2018.
YearN RegimeGrain Yield (Mg ha−1)Biomass (Mg ha−1)
Rice Wheat SystemRice Wheat System
2016/2017R0W06.83 c 5.36 d12.2 b10.6 c10.6 d21.2 b
R225W1359.99 a9.13 b19.1 a16.3 a16.2 bc32.5 a
R180W1809.71 ab9.73 a19.4 a15.3 ab17.5 a32.8 a
R180W1359.82 ab9.50 ab19.3 a16.0 ab17.3 ab33.4 a
R180W909.78 ab8.57 c18.4 a15.8 ab15.8 c31.6 a
R135W1808.94 b9.58 ab18.5 a14.4 b17.5 a31.9 a
R135W1359.34 ab9.50 ab18.8 a15.1 ab17.4 a32.5 a
2017/2018R0W07.37 b4.36 d11.7 b12.4 b8.1 c20.5 b
R225W1359.60 a8.68 ab18.3 a17.0 a15.9 ab32.9 a
R180W1809.63 a9.05 ab18.7 a16.6 a16.7 a33.3 a
R180W1359.88 a8.30 bc18.2 a17.0 a15.3 ab32.3 a
R180W909.86 a7.75 c17.6 a17.3 a14.5 b31.8 a
R135W1809.45 a9.20 a18.6 a17.0 a16.6 a33.6 a
R135W1359.54 a8.30 bc17.8 a16.5 a15.1 b31.5 a
F value
Year (Y)0.89 ns46.38 **10.87 **28.02 **35.84 **0.01 ns
N regime (N)28.82 **100.28 **82.86 **24.05 **71.62 **54.96 **
N × Y0.81 ns1.11 ns0.58 ns0.73 ns1.78 ns0.70 ns
Note: Values followed by different letters in each column in the same year indicate significant differences between treatments, as determined with Duncan’s test (p < 0.05). ** indicates significance at p < 0.01; ns indicates not significant.
Table 4. The effects of different fertilizer N regimes under a rice–wheat rotation on rice yield components, averaged over two consecutive growing seasons from 2016 to 2018.
N RegimePanicles m−2Filled Grains Panicle−11000-Grain Weight (g)Harvest Index
R0W0150.9 c 126.2 b 31.3 a0.53 a
R225W135221.7 a 140.1 a 30.4 b0.51 b
R180W180215.3 a 132.2 ab 31.2 a0.52 ab
R180W135210.0 ab 135.7 a 31.3 a0.51 b
R180W90217.0 a 141.0 a 31.2 a0.51 b
R135W180209.0 ab 139.6 a 31.4 a0.51 b
R135W135200.3 b 126.5 b 31.6 a0.52 b
F value
Year (Y)6.48 *0.52 ns69.29 **112.17 **
N regime (N)33.29 **4.35 **2.49 *3.17 **
N × Y1.25 ns2.58 *2.72 *0.72 ns
Note: Values followed by different letters in each column indicate significant differences between treatments, as determined with Duncan’s test (p < 0.05). ** and * indicate significance at p < 0.01 and p < 0.05, respectively; ns indicates not significant. Although significant Year × N interactions were detected for some variables, averaged values are shown to summarize the overall treatment effects across the two experimental cycles.
Table 5. The effects of different fertilizer N regimes under a rice–wheat rotation on wheat yield components, averaged over two consecutive growing seasons from 2016 to 2018.
N RegimeSpikes m−2Grains Spike−11000-Grain Weight (g)Harvest Index
R0W0248.6 d30.1 b55.1 a0.46 c
R225W135438.9 b39.0 a53.4 ab0.49 a
R180W180464.4 a39.8 a50.7 c0.48 ab
R180W135425.1 b38.0 a52.6 bc0.48 ab
R180W90376.8 c37.8 a54.4 ab0.47 b
R135W180467.4 a38.6 a50.7 c0.48 ab
R135W135440.1 b39.1 a52.5 bc0.48 ab
F value
Year (Y)138.34 **5.27 *139.25 **0.01 ns
N regime (N)85.16 **13.44 **5.44 **9.27 **
N × Y3.63 **1.31 ns1.37 ns5.76 **
Note: Values followed by different letters in each column indicate significant differences between treatments, as determined with Duncan’s test (p < 0.05). ** and * indicate significance at p < 0.01 and p < 0.05, respectively; ns indicates not significant. Although significant Year × N interactions were detected for some variables, averaged values are shown to summarize the overall treatment effects across the two experimental cycles.
Table 6. The effect of different fertilizer N regimes under rice–wheat rotation on soil residual NO3-N concentration in two consecutive growing seasons from 2016 to 2018.
N RegimeRice Wheat
0–20 cm20–40 cm40–60 cm0–20 cm20–40 cm40–60 cm
2016–2017R0W010.3 a6.0 a1.6 ab9.7 b3.0 b1.7 a
R225W13519.0 a1.5 c0.9 b15.4 b4.1 b1.3 a
R180W18018.7 a6.2 a3.0 a10.5 b3.1 b1.4 a
R180W13511.6 a3.5 bc1.6 ab18.1 ab9.6 a3.1 a
R180W9013.4 a5.1 ab1.1 b31.3 a8.9 a1.4 a
R135W18012.3 a1.8 bc0.6 b22.1 ab4.2 b1.8 a
R135W13520.4 a1.8 bc0.9 b20.2 ab4.4 b1.6 a
2017–2018R0W016.6 a7.1 b2.1 b17.6 a6.9 a3.7 a
R225W13532.0 a12.9 a3.6 ab16.6 a7.7 a4.6 a
R180W18016.9 a8.8 ab3.0 b17.9 a5.6 a3.0 a
R180W13531.1 a10.2 ab4.8 a17.9 a5.6 a2.9 a
R180W9020.3 a6.5 b2.5 b12.8 a6.6 a3.7 a
R135W18023.5 a6.5 b2.5 b18.4 a7.8 a4.6 a
R135W13521.8 a7.8 ab2.2 b20.9 a9.1 a4.2 a
F value
Year8.09 **39.66 **32.71 **1.51 ns4.39 *30.61 **
N regime1.03 ns1.53 ns3.60 *0.15 ns1.39 ns0.42 ns
N × Y0.93 ns31.6 **2.41 ns2.79 *2.50 *1.30 ns
Note: Values followed by different letters in each column in the same year indicate significant differences between treatments, as determined with Duncan’s test (p < 0.05). ** and * indicate significance at p < 0.01 and p < 0.05, respectively; ns indicates not significant.
Table 7. The effect of different fertilizer N regimes under rice–wheat rotation on N-use-efficiency parameters for rice, wheat, and the annual system, averaged over two consecutive growing seasons from 2016 to 2018.
N RegimeRice Wheat System
PFPN
(kg Grain kg−1 N Applied)
AEN
(kg Grain kg−1 N Applied)
REN
(kg N Uptake kg−1 N Applied)
NHIPFPN
(kg Grain kg−1 N Applied)
AEN
(kg Grain kg−1 N Applied)
REN
(kg N Uptake kg−1 N Applied)
NHIPFPN
(kg Grain kg−1 N Applied)
AEN
(kg Grain kg−1 N Applied)
REN
(kg N Uptake kg−1 N Applied)
R0W00.67 a0.75 c
R225W13543.5 c12.0 b0.23 a0.62 b66.0 b29.9 b0.69 a0.80 a51.9 c18.7 a0.39 ab
R180W18053.7 b14.3 ab0.24 a0.65 ab52.2 c25.2 c0.67 a0.79 ab53.0 c19.7 a0.44 ab
R180W13554.7 b15.3 ab0.21 a0.66 a66.0 b29.9 b0.67 a0.79 ab59.5 b20.3 a0.39 ab
R180W9054.6 b15.1 ab0.23 a0.65 a90.7 a36.7 a0.67 a0.81 a66.6 a19.6 a0.36 b
R135W18068.1 a15.5 a0.22 a0.65 ab52.2 c25.2 c0.71 a0.78 ab59.5 b19.7 a0.48 a
R135W13569.9 a17.3 a0.22 a0.67 a65.9 b29.9 b0.72 a0.77 bc67.9 a20.8 a0.45 ab
F value
Year0.50 ns9.08 **10.46 **15.29 **42.86 **2.36 ns1.45 ns6.86 **12.75 **32.73 **0.23 ns
N regime83.68 **2.62 *0.12 ns3.58 *156.09 **14.12 **0.21 ns4.33 **67.52 **0.84 ns2.48 ns
N × Y0.74 ns0.37 ns0.86 ns1.87 ns2.11 ns1.14 ns0.32 ns0.98 ns0.86 ns4.07 **0.57 ns
Note: “–” denotes “not applicable”. Values followed by different letters in each column indicate significant differences between treatments, as determined with Duncan’s test (p < 0.05). ** and * indicate significance at p < 0.01 and p < 0.05, respectively; ns indicates not significant. Although significant Year × N interactions were detected for some variables, averaged values are shown to summarize the overall treatment effects across the two experimental cycles.
Disclaimer/Publisher’s Note: The statements, opinions and data contained in all publications are solely those of the individual author(s) and contributor(s) and not of MDPI and/or the editor(s). MDPI and/or the editor(s) disclaim responsibility for any injury to people or property resulting from any ideas, methods, instructions or products referred to in the content.