Article

Spatiotemporal Evolution and Driving Factors of the Coupling Coordination Among Digital Village Development, Agricultural Modernization, and Agricultural Carbon Emission Efficiency: An Empirical Study Based on a Triple-System Coupling and GTWR Model

College of Public Administration and Law, Hunan Agricultural University, No. 1, Nongda Road, Furong District, Changsha 410128, China
*
Author to whom correspondence should be addressed.
Agriculture 2026, 16(11), 1135; https://doi.org/10.3390/agriculture16111135
Submission received: 16 April 2026 / Revised: 14 May 2026 / Accepted: 19 May 2026 / Published: 22 May 2026
(This article belongs to the Topic Ecological Protection and Modern Agricultural Development)

Abstract

The coupling coordination among digital village development, agricultural modernization, and agricultural carbon emission efficiency is critical for achieving green and high-quality agricultural development. Using panel data of 30 Chinese provinces (excluding Hong Kong, Macao, Taiwan, and Tibet) from 2011 to 2024, this study measures agricultural carbon emission efficiency via the super-efficiency SBM model, evaluates the levels of digital village development and agricultural modernization using the entropy method, constructs a coupling coordination degree model to analyze the spatiotemporal evolution characteristics of the three systems, and employs the Geographically and Temporally Weighted Regression (GTWR) model to reveal the spatiotemporally heterogeneous effects of governmental, market, and social factors on the coupling coordination degree. The results show that: (1) The three systems exhibit unbalanced development. The digital village development index increased from 0.430 to 0.634; agricultural modernization grew slowly from 0.308 to 0.411; and agricultural carbon emission efficiency surged from 0.146 to 0.655. (2) The coupling coordination degree of the three systems rose continuously from 0.382 to 0.661, transitioning from near disorder to primary coordination. Spatially, the eastern and northeastern regions led while the western region lagged, though Xinjiang reached good coordination (0.786) in 2024. (3) The GTWR model reveals that the marketization index (ranging from −0.0362 to 0.0559), agricultural land transfer rate (ranging from −0.1630 to 1.7952), fiscal support for agriculture (ranging from −0.0003 to 0.0232), and agricultural socialized services (ranging from −0.0019 to 0.0012) have positive effects with significant spatial heterogeneity. Rural infrastructure exhibits a “positive in the south, negative in the north” pattern (ranging from 0.0540 to 1.0460), while the overall social consumption level (ranging from −0.9680 to 0.6548) exerts a negative inhibiting effect. These findings provide a theoretical basis for understanding the spatial heterogeneity of the coupling coordination among the three systems and emphasize that differentiated, regionally tailored strategies are key to promoting green and high-quality agricultural development.

1. Introduction

China’s agriculture is currently at a critical juncture where a new round of technological revolution, industrial transformation, and the “dual carbon” goals are deeply intertwined. The rapid penetration of digital technologies presents new opportunities for improving agricultural productivity and transforming operational models. However, traditional high-input, high-emission agricultural production methods remain the primary cause of persistently high agricultural carbon intensity, necessitating a green and low-carbon transition through technological empowerment and structural optimization. The 14th Five-Year Plan for National Agricultural Green Development (2021) explicitly calls for accelerating the comprehensive green transformation of agriculture. The Digital Village Development Action Plan (2022–2025) outlines key tasks for digital village construction. Moreover, the No. 1 Central Documents of 2023 and 2024 continue to emphasize “promoting digital village development” and “accelerating the pace of agricultural modernization.” It is evident that accelerating the iterative, modernized, and low-carbon transformation of agriculture is a vital pathway to resolving the practical dilemma of “increasing output without reducing emissions, or reducing emissions without increasing income.” Against this backdrop, how to achieve green and high-quality agricultural development through digital empowerment, agricultural efficiency gains, and environmental improvement is an urgent issue to be addressed [1]. To this end, this paper specifically answers the following two questions: What is the spatiotemporal evolution pattern of the coupling coordination degree among digital village development, agricultural modernization, and agricultural carbon emission efficiency from 2011 to 2024? How do factors from the governmental, market, and social dimensions influence this coordination degree?
Existing studies have explored the pairwise relationships from various perspectives. Regarding digital village development and agricultural modernization, most studies confirm the positive impact of digital technology on agricultural modernization [2,3,4], but they generally adopt a pairwise analysis framework, assuming the impact is linear and unidirectional. Few studies examine whether this positive effect holds across all regions and periods. Regarding digital village development and agricultural carbon emissions, these studies similarly focus on unidirectional emission reduction effects [5,6], with disagreements in mechanism explanations. A common shortcoming is that they report only national average effects without examining whether the effects vary across space or time. Regarding agricultural modernization and carbon emissions, two opposing views exist: one argues for a “first conflict, then coordination” phased pattern [7]; the other firmly believes that technological optimization can achieve complete decoupling [8]. However, most of these discussions rely on conventional panel regressions that cannot reveal the heterogeneity of effects across different regions and periods.
Despite the important progress made by existing studies, critical gaps remain. First, most studies focus on the unidirectional effect of digital village development on agricultural modernization or agricultural carbon emissions, lacking a unified analytical framework that incorporates all three systems and examines their synergistic evolution. There may be complex two-way interactions and even trade-offs among the three, but few studies have simultaneously considered their coupling coordination dynamics. Second, the existing literature rarely reveals the evolutionary characteristics and driving factors of the coupling coordination from a spatiotemporal heterogeneity perspective. Agricultural systems are comprehensively influenced by natural conditions, local policies, and market development levels, and the effects of various driving factors on coupling coordination often exhibit significant spatiotemporal heterogeneity.
To address these issues, this paper adopts the following methods: (1) Using the super-efficiency SBM model to measure agricultural carbon emission efficiency. (2) Constructing a coupling coordination degree model to evaluate the synergistic spatiotemporal evolution of the three systems. (3) Employing the Geographically and Temporally Weighted Regression (GTWR) model to analyze the effects of factors from the governmental, market, and social dimensions.
The remainder of this paper is organized as follows: Section 2 presents the mechanism analysis of coupling coordination; Section 3 describes the research design; Section 4 presents the spatiotemporal evolution of the coupling; Section 5 analyzes the driving factors; Section 6 offers conclusions and recommendations.

2. Analysis of the Mechanisms Underlying the Coupling and Coordination Among Digital Rural Development, Agricultural Modernization, and Agricultural Carbon Emissions

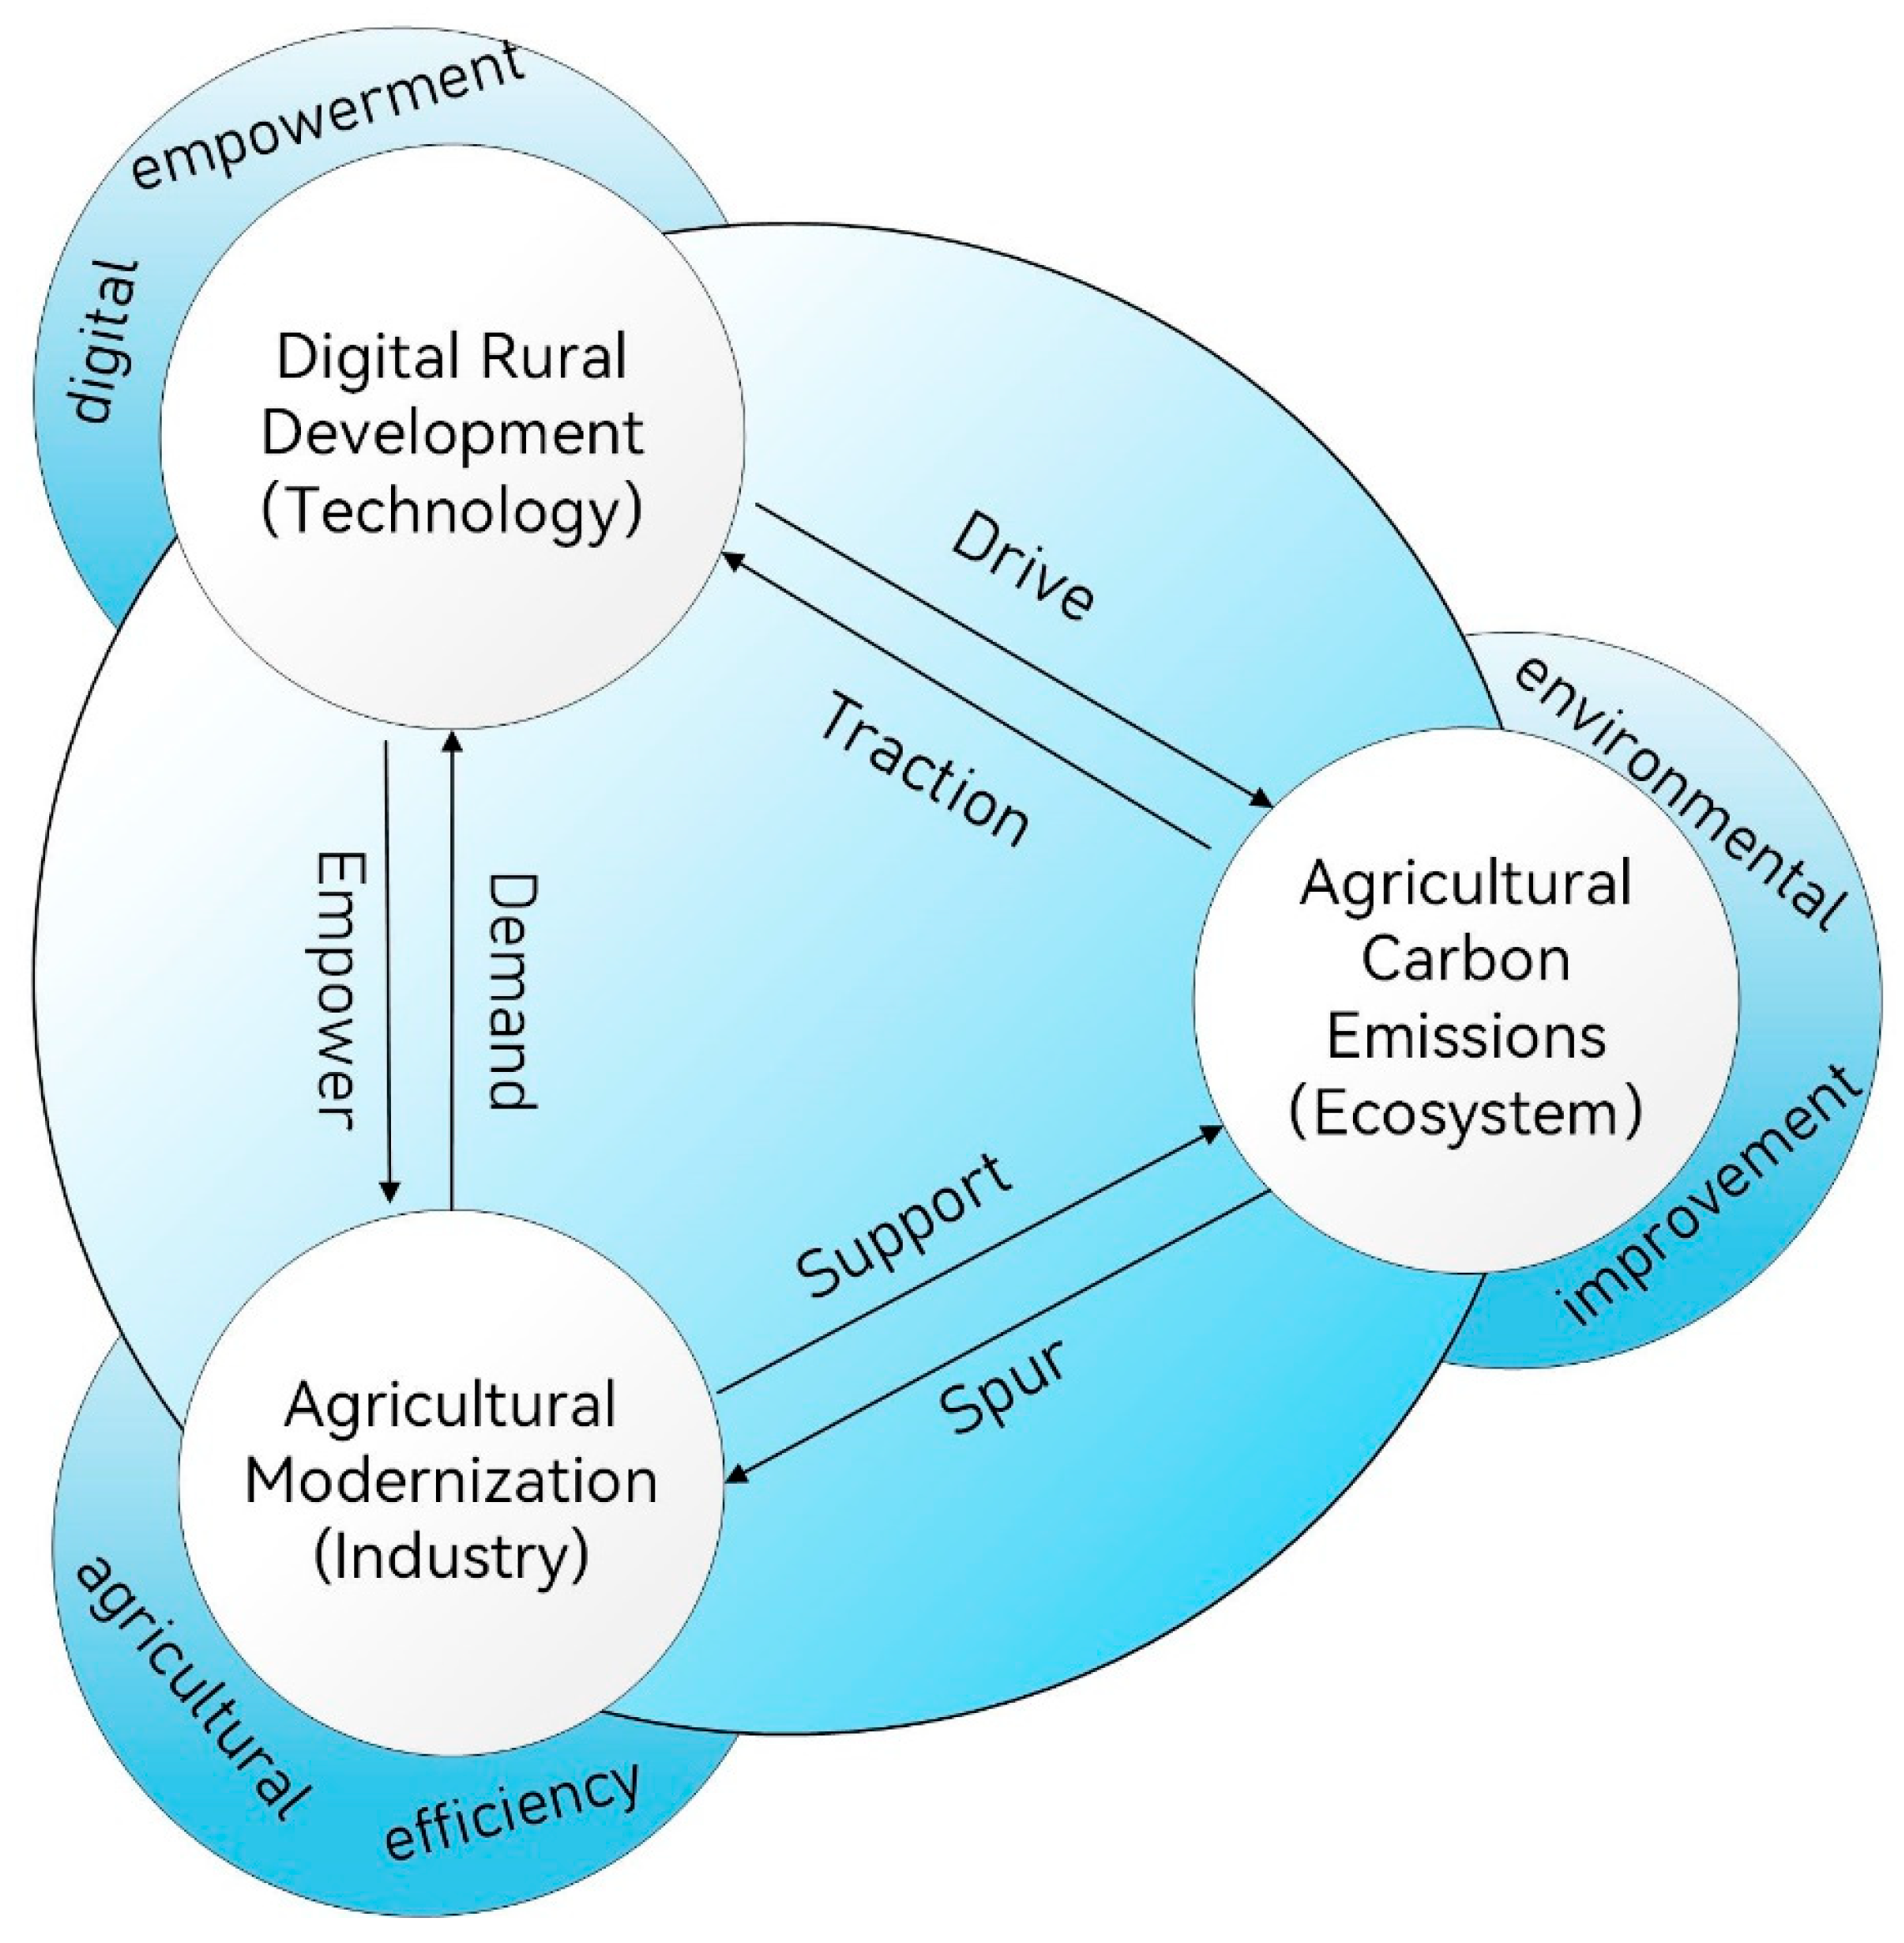
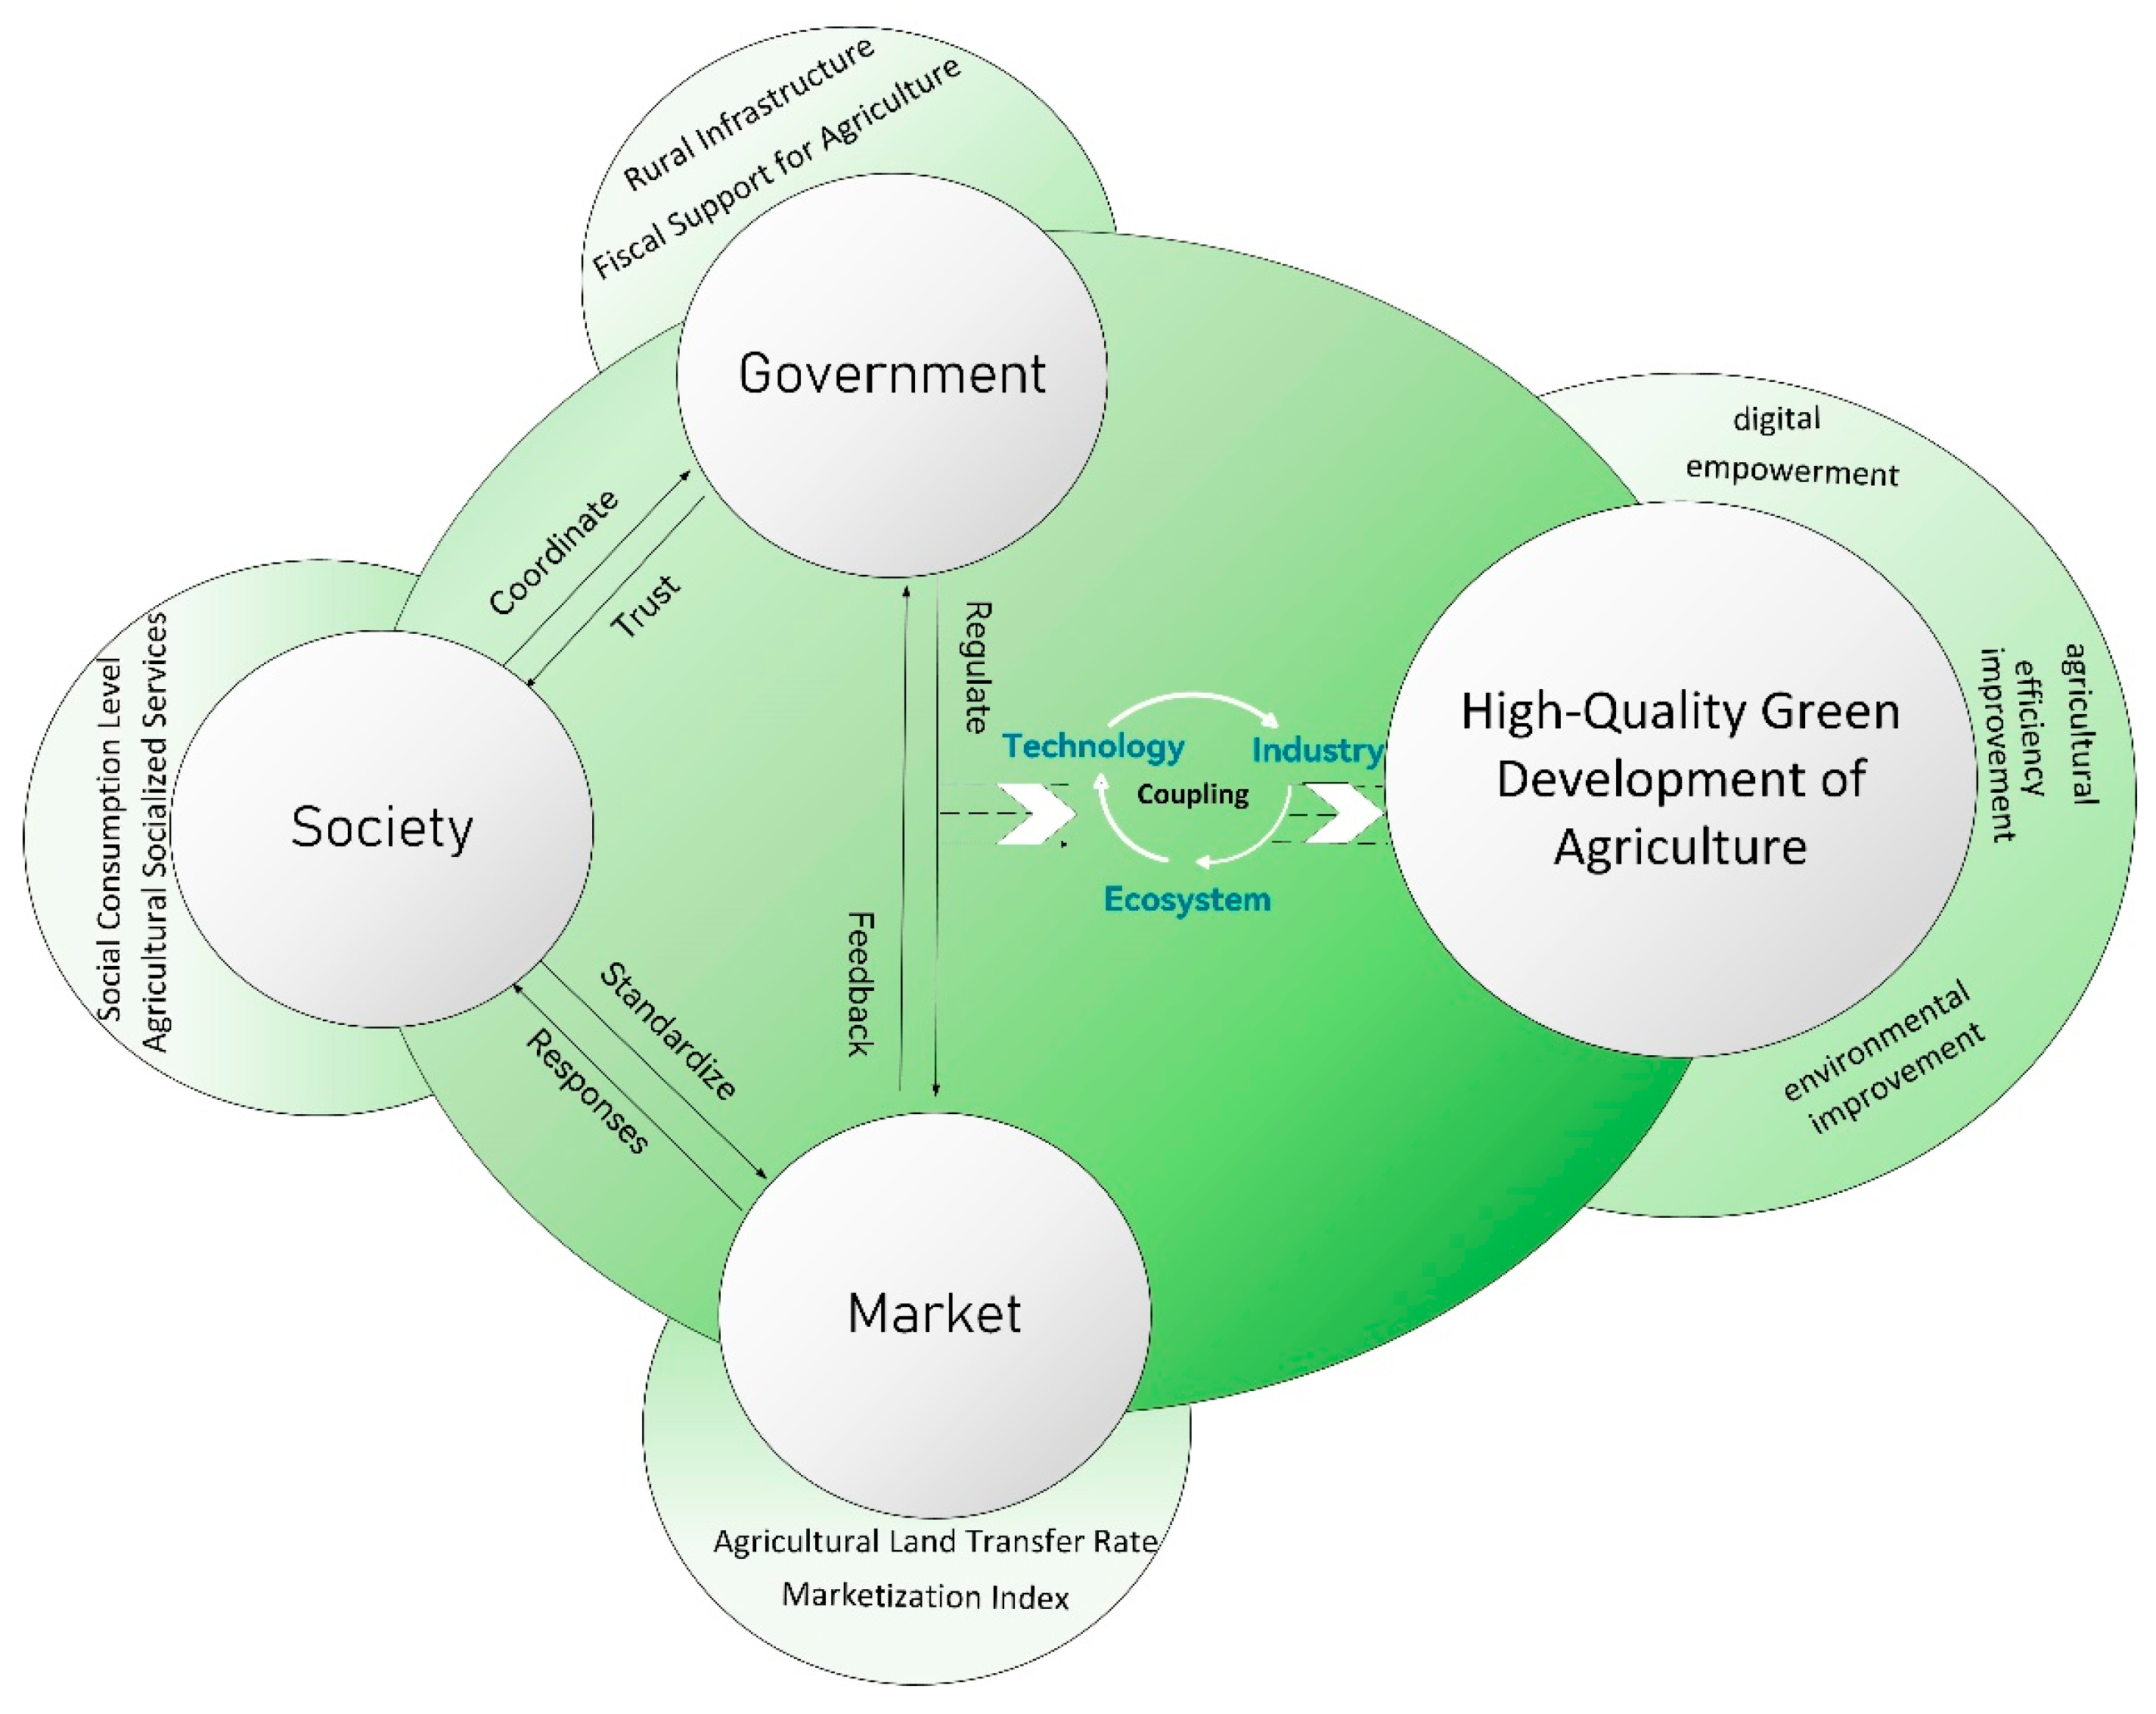
Theories of coupling and symbiosis provide a suitable perspective for analyzing such multi-system synergies [9]. Unlike general systems theory, which merely emphasizes “interactions among systems,” symbiosis theory further predicts the direction and evolutionary hierarchy of interactions, ranging from unilateral dependence to bilateral reciprocity, and from occasional interaction to integrated symbiosis. Applying this theory to the agricultural domain, the question is whether digital village development (technology), agricultural modernization (industry), and agricultural carbon emission efficiency (ecology) can move toward deep mutualistic symbiosis. This question requires a systematic analysis of both promoting and inhibiting mechanisms among the three systems. To fill the above gap and test the predictions of coupling and symbiosis theory, this paper constructs a theoretical analytical framework of the “technology–industry–ecology” triple system based on panel data of 30 Chinese provinces from 2011 to 2024 (Figure 1).

2.1. Bidirectional Empowerment and Demand Pull Between Digital Village Development and Agricultural Modernization

Digital village development systematically empowers agricultural modernization through four dimensions: rural digital infrastructure, digitalization of rural production, digitalization of rural operation, and digitalization of rural distribution [10]. At the level of rural digital infrastructure, with the increase in internet penetration, mobile phone coverage, and optical cable coverage, as well as the lowering of information acquisition costs, farmers can adjust their operational strategies based on real-time weather and market prices, thereby avoiding resource misallocation while achieving improvements in total factor productivity [11]. Fixed asset investment in computer services, transportation, and other areas constitutes a fundamental prerequisite, rather than the sole driver, for the penetration of digital technologies into agriculture. At the level of rural digital infrastructure, with the increase in internet penetration, mobile phone coverage, and optical cable coverage, as well as the lowering of information acquisition costs, farmers can adjust their operational strategies based on real-time weather and market prices, thereby avoiding resource misallocation while achieving improvements in total factor productivity. Fixed ass Confirmed correctet investment in computer services, transportation, and other areas constitutes a fundamental prerequisite, rather than the sole driver, for the penetration of digital technologies into agriculture. At the level of digitalization of rural production, the application of the Internet of Things (IoT) and intelligent agricultural machinery covers the stages of plowing, planting, management, and harvesting, enabling precise input of water, fertilizer, pesticides, and energy, along with waste reduction and cost decreases. The number of Taobao Villages reflects the vitality of digital transformation in production; agrometeorological observatories provide support for precision planting; and the improvement of digital electrified production indicates a trend toward intensive and efficient agriculture. At the level of digitalization of rural operations, the growth in the number of corporate websites, e-commerce activity, and rural online sales has given rise to new agents such as digital farmers and e-commerce farming households, accompanied by innovations in models such as cooperatives and contract farming. These developments alleviate the difficulty of connecting smallholders with large markets and promote the scaling and standardization of agricultural operations. At the digitalization of rural distribution level, the extension of rural delivery routes, the increase in the proportion of administrative villages covered by postal services, and the density of postal service outlets support the logistics network for agricultural products moving to urban areas and consumer goods moving to rural areas. Rural online procurement and the share of rural retail sales in total social retail sales reflect the vitality of rural digital consumption; a well-developed distribution system reduces transport losses and guarantees models such as farm-to-table direct supply and cold-chain logistics that are part of modernized agricultural operations.
Simultaneously, the deepening of agricultural modernization provides a reverse driving force for digital village development. Demand-induced innovation theory suggests that changes in the structure and scale of market demand are generally regarded as important reference factors for technological evolution [12]. The new trends arising from agricultural modernization, such as scaled operation, standardized production, and quality-safety management, correspond to the continuous expansion of application scenarios for digital technologies. By 2025, the number of agricultural drones in China had exceeded 200,000, with an annual operating area of over 400 million mu. Applications such as smart irrigation and drone-based plant protection have expanded from pilot demonstrations to large-scale production [13]. In this context, there exists a logical consistency between the technological demand derived from agricultural modernization and the improvement of digital infrastructure and service capabilities, forming a cyclical structure of “demand–technology–production” [14]. Subsequent research will employ the coupling coordination model to empirically test the spatial association characteristics between the dimensions of agricultural industrial modernization, agricultural operational modernization, and agricultural production modernization and the various indicators of digital village development.

2.2. Bidirectional Driving Between Digital Village Development and Agricultural Carbon Emissions

The effect of digital village development on agricultural carbon emission efficiency is primarily realized through three pathways: precision input, intelligent operation, and carbon sink monitoring. The core of precision input is substituting data for experience. The application of IoT sensors, smart irrigation systems, and soil-testing and formula fertilization technologies shifts fertilizer and pesticide application from “estimation based on experience” to “supply based on demand,” thus improving use efficiency and reducing carbon emission intensity per unit of output. According to information released by China’s Ministry of Agriculture and Rural Affairs in 2026, the fertilizer use efficiency of China’s three major food crops reached 43.3% in 2025, with soil-testing formula fertilization and integrated water-fertilizer technologies being widely promoted. This trend is consistent over the time series with the decline in fertilizer use for nine consecutive years and the stable increase in grain output. The path of intelligent operation, on the other hand, focuses more on the optimization of energy consumption. Driven by these technologies, fertilizer use has declined for nine consecutive years while grain output has continued to grow. The intelligent operation pathway focuses more on optimizing energy consumption. The use of agricultural drones, autonomous tractors, and other equipment enables finer control of operation paths and energy management, reducing unnecessary fuel consumption. A similar logic applies to the distribution stage: online transactions and e-commerce platforms shorten the supply chain for agricultural products, thereby reducing carbon emissions from transportation. As for carbon sink monitoring, the spread of broadband, mobile networks, and other infrastructure facilitates the establishment of dynamic agricultural carbon emission monitoring platforms, providing a reliable data basis for regional carbon accounting and evaluation of low-carbon technology effectiveness. With the overall improvement of agricultural digitalization, the flow of low-carbon technology inputs becomes smoother, the difficulty for farmers to adopt new technologies decreases, and emission reduction outcomes improve [15]. However, the expansion of digital infrastructure itself also brings additional energy consumption and electronic waste burdens. If the energy mix remains dominated by fossil fuels, the carbon emission reduction effect brought about by digitalization may be partially offset. Of course, the same technology may yield different outcomes in different regions. The northeastern region, with better digital infrastructure and higher economic development levels, shows more pronounced emission reduction effects; western provinces, with later digitalization starts, naturally exhibit weaker effects. It is precisely this spatial heterogeneity that justifies the use of the GTWR model in this paper.
The improvement of agricultural carbon emission efficiency is not merely a passive outcome of digital technology empowerment; it also drives the further development of digital villages in reverse. First, precision emission reduction. When agricultural producers realize that further improving carbon emission efficiency requires moving beyond experience-based management, the demand for precise carbon measurement pulls the deployment of digital devices such as IoT sensors [16]. To obtain real-time, accurate carbon data, rural areas must accelerate the upgrading of information infrastructure, thereby promoting the hardware development of digital villages [17]. Second, scale operation. Agricultural operators with high carbon emission efficiency typically exhibit scaled and standardized characteristics. However, the expansion of operational scale typically exposes the limitations of traditional manual record-keeping in carbon emission tracking and green certification, which in turn creates a demand for the introduction of digital management systems, indirectly raising the digitalization level of the rural economy [18]. Third, green finance. High-efficiency regions are more likely to access financial products such as green credit, which often rely heavily on online applications. To obtain green financing, agricultural entities and financial institutions actively promote the diffusion of mobile payment, digital credit reporting, and other services, thereby accelerating the digitalization of rural services [19,20]. In this reverse driving process, the absence of integrated planning for the full-lifecycle environmental impacts of digital infrastructure may exacerbate energy consumption and electronic pollution, thereby creating new pressures on regional ecological security.

2.3. Bidirectional Support and Forcing Between Agricultural Modernization and Agricultural Carbon Emission Efficiency

Agricultural modernization has a significant supporting effect on agricultural carbon emission efficiency, mainly manifested in the synergistic optimization of the industrial system, production system, and operation system. At the industrial system level, agricultural modernization promotes a shift from a single cropping structure to an integrated system of planting and breeding and a coordinated development of farming, forestry, animal husbandry, and fishery. It also extends the agricultural value chain by developing deep processing of agricultural products. Such structural adjustments not only improve resource use efficiency but also reduce carbon emission intensity per unit of output [21]. At the production system level, the promotion of high-standard farmland construction, water-saving irrigation technologies, soil-testing formula fertilization, and conservation tillage directly reduces the input intensity of fertilizers, pesticides, and energy, thereby lowering emissions of greenhouse gases such as nitrous oxide and methane [22]. The improvement of agricultural mechanization, accompanied by the precise operation of intelligent machinery, effectively increases fuel efficiency and reduces carbon emissions [23]. At the level of the operation system, the development scale of appropriately scaled operations and specialized socialized services exhibits a positive correlation with the breadth of low-carbon technology diffusion. Scaled family farms and specialized farmer cooperatives, with their large operational areas and standardized management, are more likely to adopt emission reduction measures such as precision fertilization and conservation tillage. Agriculturally socialized service organizations providing services such as contract farming and unified pest control lower the threshold for smallholder farmers to adopt new technologies, further promoting continuous improvement in agricultural carbon emission efficiency. The transition of production methods from traditional to intelligent machinery does generate certain carbon emissions during the process, but such emissions last for a relatively short period and are controllable in total. By contrast, the characteristics of scaled operation and specialized services brought by agricultural modernization, which largely overlap with the behaviors of standardizing fertilization and pesticide application, optimizing agricultural machinery scheduling, and promoting low-carbon technologies, generate carbon reduction effects that typically offset the emission increases caused by machinery operations [24].
From the reverse perspective, the improvement of agricultural carbon emission efficiency can force agricultural modernization to undergo a deep green and low-carbon transformation. As the “dual carbon” goals are further integrated into agricultural policy systems, the importance of carbon emission efficiency has gained increasing attention, gradually abandoning the traditional “pollute first, treat later” path and forming development principles of low carbon, green, and circularity. From an input perspective, improving carbon emission efficiency means achieving higher agricultural output at the same carbon emission level. This requires more advanced agricultural production technologies, more efficient management concepts, and more rational factor allocation, thereby objectively driving the upgrading of the agricultural industrial, production, and operation systems [25]. From an output perspective, improving carbon emission efficiency requires maximizing agricultural output while minimizing carbon emissions, which prompts continuous optimization of agricultural production structures and forces the development and application of low-carbon agricultural technologies, such as breeding low-carbon crop varieties and promoting conservation tillage—precisely the core elements of agricultural modernization. Against the backdrop of the “dual carbon” goals, the increase in the weight of carbon emission efficiency indicators occurs simultaneously with the shift of agricultural evaluation criteria from a single output and value orientation toward incorporating resource and environmental performance, jointly reflecting the evolutionary trajectory of agriculture from “high input, high output” to “low emission, high efficiency”.

3. Research Design

Given that the core of the subsequent analysis is to investigate the coupling coordination degree and driving factors of digital village development, agricultural modernization, and agricultural carbon emission efficiency, this section constructs measurement indicator systems for the three systems based on existing research. First, to measure agricultural carbon emission efficiency, which involves the undesirable output of agricultural carbon emissions, the super-efficiency SBM (Slacks-Based Measure) model that accommodates undesirable outputs is adopted. The entropy method is used to calculate the composite indices for digital village development and agricultural modernization. Second, to obtain the composite index of the three subsystems, a coupling coordination degree model is constructed to calculate the coupling coordination degree for each province and year, identifying the spatiotemporal evolution pattern. The SBM efficiency value directly participates in the coupling coordination calculation as the ecological subsystem. Finally, after obtaining the coupling coordination degree, this paper further explores its driving factors. Given that agricultural systems are comprehensively influenced by natural conditions, local policies, and market development levels, the effects of driving factors may vary across space and time. Therefore, this paper employs the GTWR model, taking the coupling coordination degree as the dependent variable and six factors from the governmental, market, and social dimensions as independent variables, to analyze the direction and intensity of each factor’s influence across different regions and periods, and further verify the joint impact of government, market, and society on the coupling coordination degree. The above methods are based on observational panel data and aim to identify the co-occurrence patterns, spatial synergy characteristics, and heterogeneous associations of driving factors among the three systems, rather than strictly causal inference.

3.1. Indicator System Construction

To systematically measure the development level of each subsystem within the “technology–industry–ecology” triple framework, this section constructs comprehensive evaluation indicator systems for digital village development (technology), agricultural modernization (industry), and agricultural carbon emission efficiency (ecology), and then calculates their coupling coordination index. Following the principles of scientific validity, systematic coverage, and data availability, we have constructed the comprehensive evaluation indicator systems as follows.

3.1.1. Indicator System for Digital Village Development

Most current measurements of digital village development indices adopt the entropy method. Drawing on existing studies [3,26], this paper selects four dimensions—rural digital infrastructure, digitalization of rural production, digitalization of rural operation, and digitalization of rural distribution—and 16 tertiary indicators to construct the digital village development indicator system (Table 1). First, rural digital infrastructure is the necessary prerequisite for achieving rural digitalization; information devices such as the internet, mobile phones, and optical cables are the necessary material carriers supporting rural digital development. Second, the core goal of rural digitalization focuses on the digital transformation of production, operation, and distribution. Among these, digitalization of production can be assessed by indicators such as the number of agrometeorological observatories and digital electrified production; the development of digitalization of operation can be measured by data such as the number of corporate websites and rural online sales and procurement; the degree of digitalization of distribution is mainly reflected by indicators such as the level of rural postal communication services and the coverage of rural delivery routes.

3.1.2. Indicator System for Agricultural Modernization

To measure the agricultural modernization level of Chinese provinces more comprehensively and objectively, and following the approaches of existing literature [28,29], this paper constructs an agricultural modernization evaluation indicator system from three dimensions: modernization of the agricultural industrial system, modernization of the production system, and modernization of the operation system, as shown in Table 2.

3.1.3. Indicator System for Agricultural Carbon Emission Efficiency

Agricultural carbon emission efficiency reflects the ratio of the minimum possible carbon emissions to actual carbon emissions in agricultural production activities, given fixed expected outputs and input factor conditions [30]. A higher agricultural carbon emission efficiency indicates better agricultural carbon emission reduction performance. The evaluation indicator system for agricultural carbon emission efficiency is constructed based on studies by Tian Yun et al. [31] and Hou Yu et al. [32], selecting agricultural output value (expected output) and agricultural carbon emissions (undesirable output), as detailed in Table 3.

3.1.4. Selection of Driving Factors

The coupling coordination of digital village development, agricultural modernization, and agricultural carbon emission efficiency is a complex systemic project, influenced by multiple factors including market mechanisms, government regulation, and social participation. To reveal the formation mechanism of the coupling coordination pattern, and following the principle that evaluation indicators are not reintroduced as driving factors, this paper draws on relevant research results [33,34,35] and selects six indicators from the three dimensions of market, government, and society to analyze the driving factors of spatial differentiation in the coupling coordination degree (Table 4). Government can guide the diffusion of digital technologies and the green transformation of agriculture through fiscal support, infrastructure construction, and institutional supply, mainly involving indicators such as the level of fiscal support for agriculture and the level of rural digital infrastructure [36]. Market can optimize resource allocation efficiency through price signals and competition mechanisms, promoting the transformation of agricultural production methods toward low-carbon and scaled operations, mainly covering factors such as the marketization index and the agricultural land transfer rate [37]. Society can force the upgrading of agricultural production structures and lower the threshold for adopting green technologies through changes in consumption demand and the supply of specialized services, mainly including the level of social consumption and the level of agricultural socialized services.

3.2. Research Methods

3.2.1. Super-Efficiency SBM Model

In actual production processes, when input overuse or output underproduction occurs, Data Envelopment Analysis (DEA) containing radial and piecewise linear forms often overestimates the efficiency values of decision-making units (DMUs). Strictly speaking, a DMU that is fully efficient has neither radial inefficiency nor input or output slack. To effectively address these issues, Tone [38] proposed the SBM-DEA (Slacks-Based Measure-DEA) model in 2001, which adds slack variables to the objective function. It was later improved to include undesirable outputs. Consequently, the measurement results are more accurate and the model is more widely applicable. When multiple DMUs simultaneously achieve an efficiency score of 1, the standard SBM model cannot distinguish among them. To solve this problem, this paper adopts the super-efficiency SBM model used by most scholars [39] based on Tone’s SBM-DEA model to evaluate agricultural carbon emission efficiency. The key feature of the super-efficiency SBM model is that it retains the advantages of the traditional SBM in handling undesirable outputs while overcoming the upper limit of 1, providing efficiency gradient information among efficient units. This feature is crucial for the subsequent analysis of the coupling coordination degree and GTWR, both of which rely on efficiency sequences with sufficient variability. The super-efficiency SBM provides exactly such variability, avoiding information loss. The specific model specification is as follows:
φ s = min 1 + 1 t e = 1 t u e x e l 1 1 t z = 1 u u z + y z l
s . t . j = 1 , j l n x e l × θ j u e x e l j = 1 , j l n y z l × θ j + u z y z l θ , u e , u z + 0
where φ * is the agricultural carbon emission efficiency value; x and y are agricultural inputs and outputs, respectively; t and u are the numbers of agricultural input and output types; θ is the linear combination of DMUs; j and l are the indices of the j -th DMU and the l -th existing DMU, respectively; u e and u z + are the slack variables corresponding to the e -th input and the z -th output.

3.2.2. Entropy Method

This study uses the entropy method to evaluate the indicator systems of digital village development, agricultural modernization, and agricultural carbon emission efficiency. According to the principle of the entropy weight method, entropy can determine the degree of dispersion of an indicator. The greater the dispersion, the greater the indicator’s impact on the comprehensive evaluation. Moreover, this method is not affected by sample size or the choice of reference sequence, making it highly suitable for the objectives of this study. The construction steps are as follows:
Normalize each indicator:
For positive indicators:
X i j = x i j m i n ( x j ) m a x ( x j ) m i n ( x j )
For negative indicators:
X i j = m a x ( x j ) x i j m a x ( x j ) m i n ( x j )
where x i j is the original value of the j -th indicator in the i -th year, and m a x   ( x j ) and m i n ( x j ) are the maximum and minimum values of the j -th indicator, respectively.
Calculate the proportion of the i -th year for the j -th indicator:
P i j = X i j i = 1 n X i j
Calculate the information entropy of the j -th indicator:
e j = k i = 1 n P i j l n ( P i j ) ,   k = 1 ln n
Calculate the redundancy of information entropy (coefficient of variation):
d j = 1 e j
Calculate the weight of the j -th indicator:
w j = d j j = 1 m d j
Calculate the composite score of each subsystem:
U i = j = 1 m w j X i j
To test the robustness of the entropy method, the digital village development and agricultural modernization indices were recalculated using equal weighting and compared with the original results. Agricultural carbon emission efficiency, which is the direct output value from the super-efficiency SBM model, was not included in the comparison. Under both schemes, the Pearson and Spearman correlation coefficients for each index and the coupling coordination degree were 0.999, confirming that the conclusions are insensitive to weight selection and highly robust.

3.2.3. Coupling Coordination Model

To assess the interrelationship and degree of influence among digital village development, agricultural modernization, and agricultural carbon emission efficiency, this study constructs a coupling degree model based on the comprehensive evaluation of the three systems. The coupling degree is calculated as follows:
C t = 3 u 1 t u 2 t u 3 t ( u 1 t + u 2 t + u 3 t ) 3 1 3
In the formula, C t represents the coupling degree of digital village development, agricultural modernization, and agricultural carbon emission efficiency in period t , with C t ranging between 0 and 1. U 1 t , U 2 t , and U 3 t denote the composite development indices of digital village development, agricultural modernization, and agricultural carbon emission efficiency in period t , respectively. A higher coupling degree, with C closer to 1, indicates a strong synergistic effect among the three; conversely, a lower C suggests weak coupling, reflecting imbalances and instability in the development levels of the three systems.
Because the coupling degree model only reflects the intensity of coupling relationships but not the degree of coordination, we further construct a coupling coordination degree model to analyze the quality of coupling among the systems:
T t = α U 1 t + β U 2 t + γ U 3 t
D t = C t × T t
Here, D t is the coupling coordination degree of the three systems in period t , ranging from 0 to 1. T t is the comprehensive harmony index of the three subsystems in period t , and α , β , γ are coefficients to be determined, satisfying α + β + γ = 1 . In this study, considering the equal importance of digital village development, agricultural modernization, and agricultural carbon emission efficiency, we set α = β = γ 0.33 . Although widely adopted in coupling coordination studies, this equal-weight assumption is not the only choice; its justification depends on the theoretical stance and empirical context of the research question. This study adopts the equal-weight assumption based on the following three considerations. First, from a theoretical perspective, agricultural modernization, digital village development, and agricultural carbon emission efficiency correspond respectively to the three policy objectives of “digital empowerment, agricultural efficiency gains, and environmental improvement.” Under the strategic framework of China’s new round of technological revolution, industrial transformation, and the “dual carbon” goals, these three objectives are given equal strategic importance; a lag in any one would constrain overall coordinated development. Second, as a methodological convention, equal weighting avoids researcher bias that might be introduced by subjective weighting and enhances the comparability and reproducibility of the results—most three-system coupling coordination studies adopt this setting. Third, considering the empirical context, the sample period (2011–2024) covers a strategic transition period of technological revolution. Although policy emphases varied across stages—with an early focus on basic inputs for agricultural modernization and a later increase in the weight of digital village development and agricultural carbon emission efficiency—from the perspective of full-period system synergy, equal weighting provides a relatively robust baseline reference, as shown in Table 5.
To further test the robustness of the equal-weight assumption, this study conducted a sensitivity analysis. Keeping the subsystem composite scores unchanged, we tried two alternative weighting schemes. Scheme 1: because China’s early policy focus was based on agriculture, giving slightly higher weight to agricultural modernization: α = 0.4 , β = 0.3 , γ = 0.3 . Scheme 2: Given the prominent position of the digital village strategy in the 14th Five-Year Plan for Economic and Social Development of the People’s Republic of China and the Long-Range Objectives Through the Year 2035, giving slightly higher weight to digital village development: α = 0.25 , β = 0.4 , γ = 0.35 . The results show that the correlation coefficients between the coupling coordination degree D under the two alternative schemes and that under the original equal-weight scheme both exceeded 0.95, and the relative ranking of provinces did not change significantly. This indicates that our coupling coordination degree estimates are highly robust to weight specification, and the equal-weight assumption is acceptable.
According to the value of the coupling coordination degree D among digital village development, agricultural modernization, and agricultural carbon emission efficiency, the degree of coupling coordination can be classified into ten basic types [40], as shown in Table 6.

3.2.4. GTWR

Currently, the Geographically Weighted Regression (GWR) and the Geographically and Temporally Weighted Regression (GTWR) are widely used to study spatial heterogeneity. Because the GTWR model accounts for both spatial and temporal non-stationarity [41], this paper uses ArcGIS software to construct a GTWR model to analyze the driving factors of digital village development, agricultural modernization, and agricultural carbon emission efficiency. The model is specified as:
D i = δ 0 ( u i , v i , z i ) + j = 1 m δ j ( u i , v i , z i ) X i j + ε i
where D i is the coupling coordination degree of the i -th region; X i j is the j -th explanatory variable of the i -th region, including government (Gov), market (Mar), and society (Soc) as shown in Table 4; μ i ν i are the longitude and latitude coordinates of the i -th study region; t i is the observation time; β 0 ( μ i , ν i , t i ) is the intercept term; β j ( μ i , ν i , t i ) is the regression coefficient of the j -th explanatory variable for the i -th region; and ε i is the random error term.

3.3. Data Source

Based on data availability, continuity, and applicability, this study selects 30 Chinese provinces (excluding Hong Kong, Macao, Taiwan, and the Tibet Autonomous Region) from 2011 to 2024 as the research objects. The primary reasons for these exclusions are that the statistical calibers of Hong Kong, Macao, and Taiwan are inconsistent with those of mainland China, and the Tibet Autonomous Region has extensive missing data on core indicators such as agricultural insurance depth. Therefore, Hong Kong, Macao, Taiwan, and Tibet are not included in this study. The data are mainly sourced from the China Statistical Yearbook, the China Rural Statistical Yearbook, the official website of the National Bureau of Statistics, provincial statistical yearbooks, and statistical bulletins. During data processing, we identified missing values for some indicators. Among the digital village indicators, the following data for 2024 are missing: the number of mobile phones per 100 rural households, the number of websites per 100 enterprises, the number of agrometeorological observatories, the proportion of administrative villages with postal service, and the length of rural postal delivery routes. Data on the number of Taobao Villages are missing for the years 2022–2024. For the agricultural modernization indicators, the following data for 2024 are missing: the level of rural human capital, agricultural insurance depth, the output value of the agricultural product processing industry, and the degree of agricultural production cooperation. For the indicators with missing values in 2024, the linear interpolation method is used to fill in the gaps, thereby preserving sample information and maintaining the balance of the panel data.

4. Spatiotemporal Evolution of the Coupling Among Digital Village Development, Agricultural Modernization, and Agricultural Carbon Emission Efficiency

4.1. Spatiotemporal Characteristics of Digital Village Development

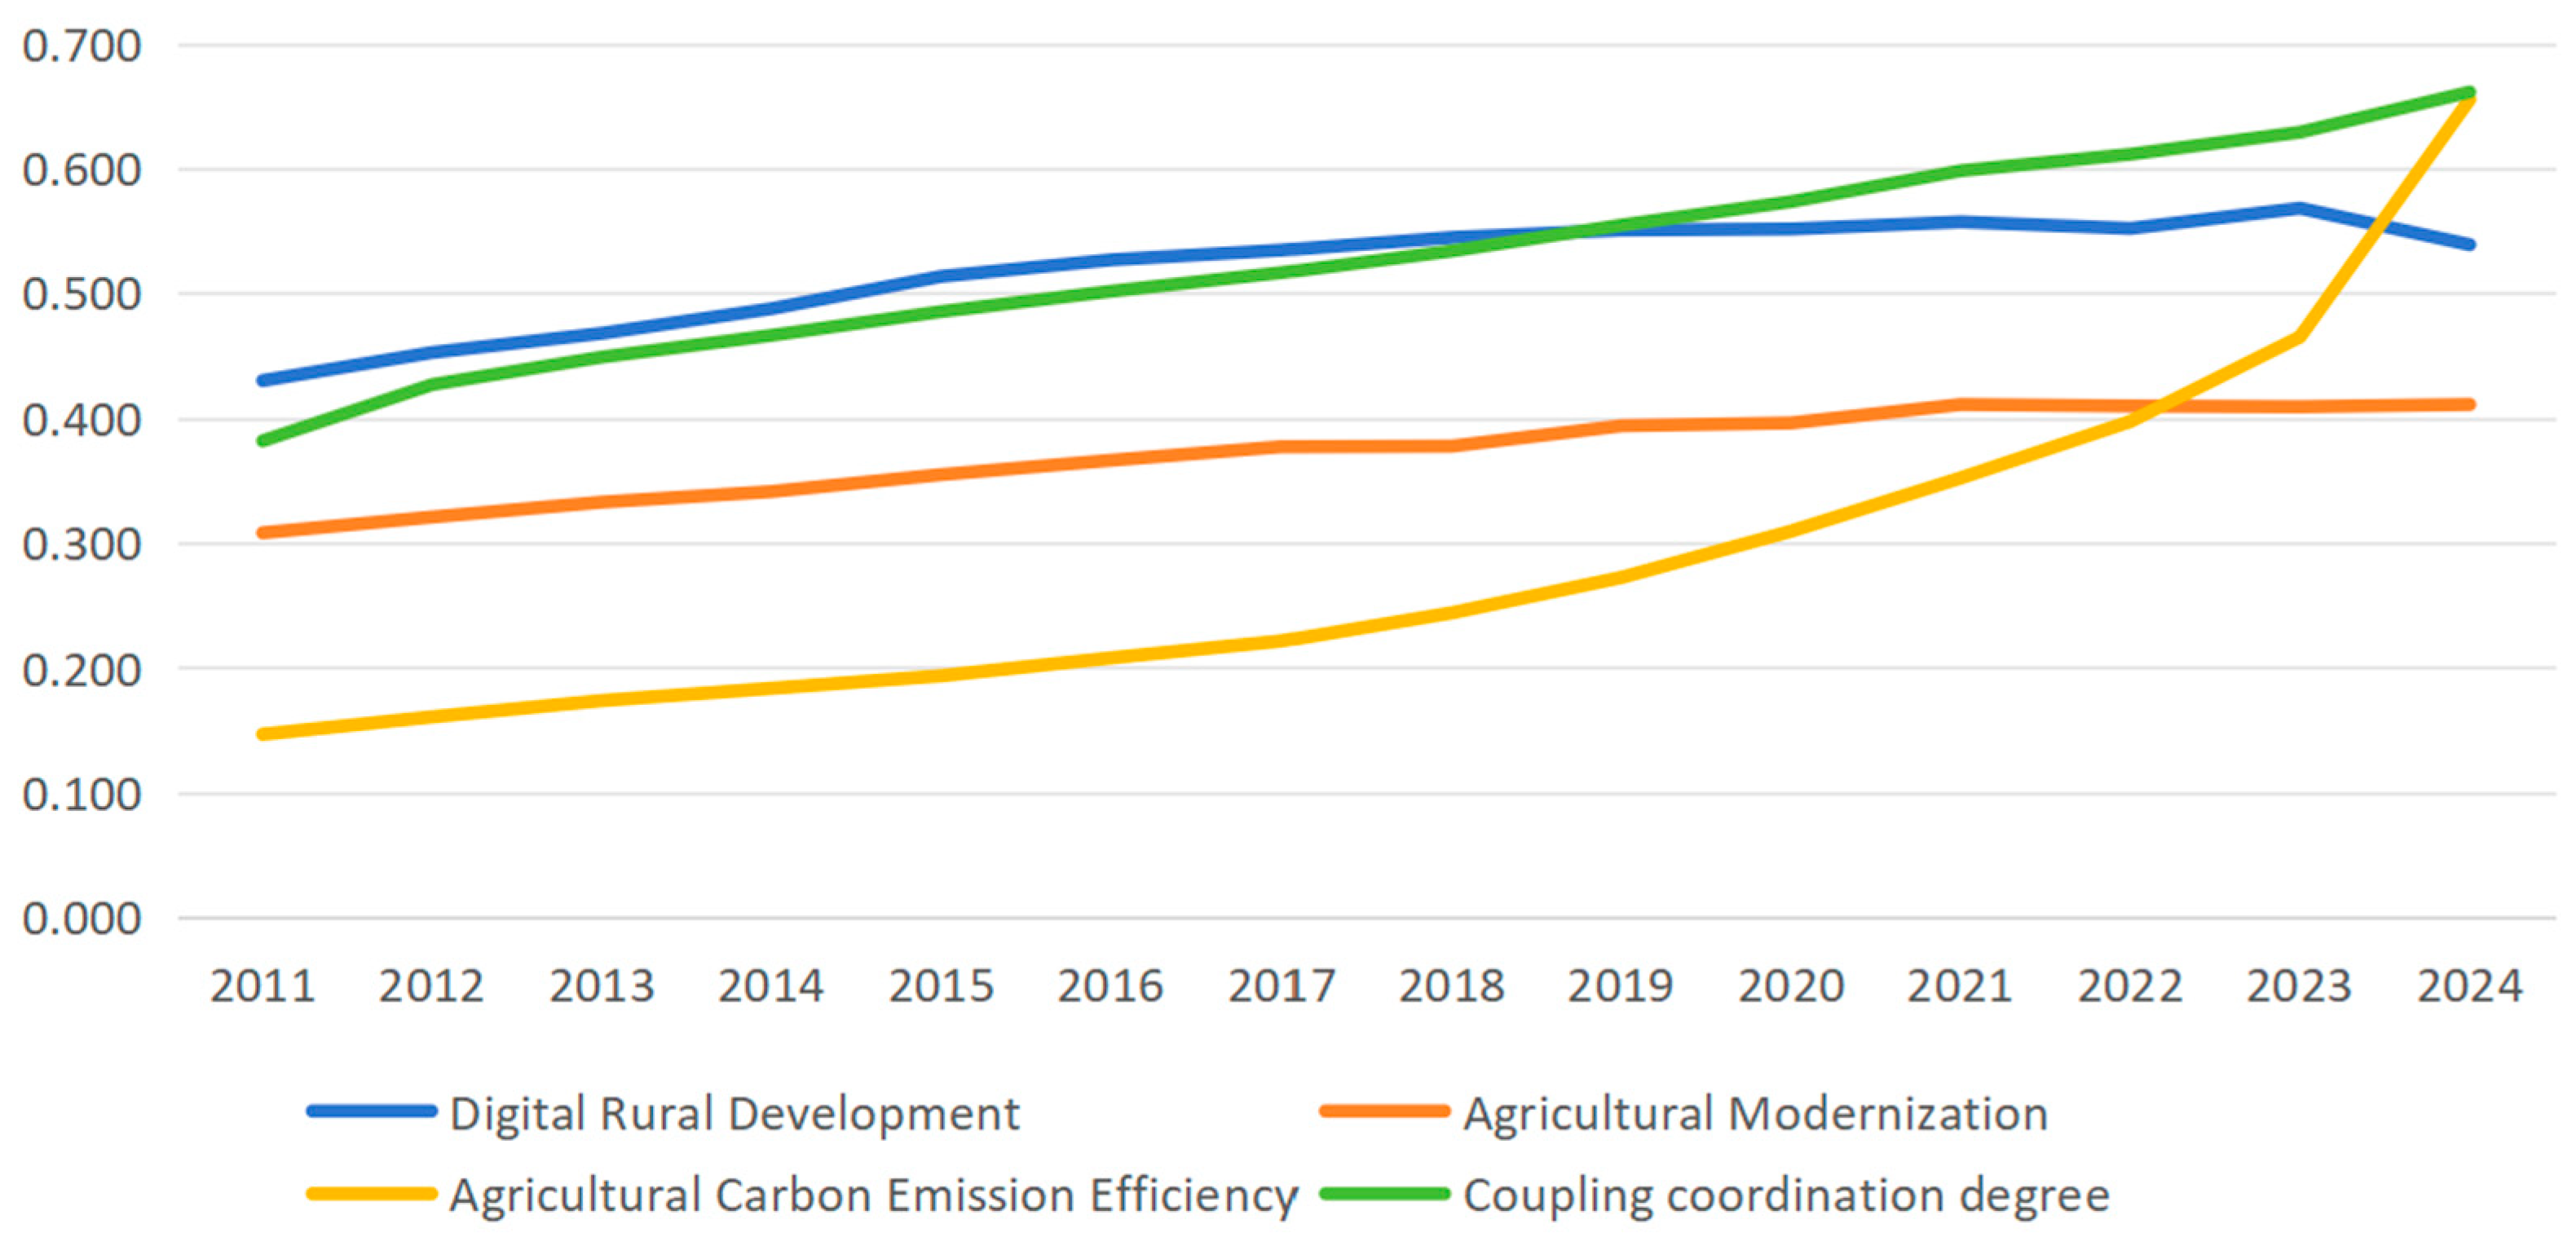
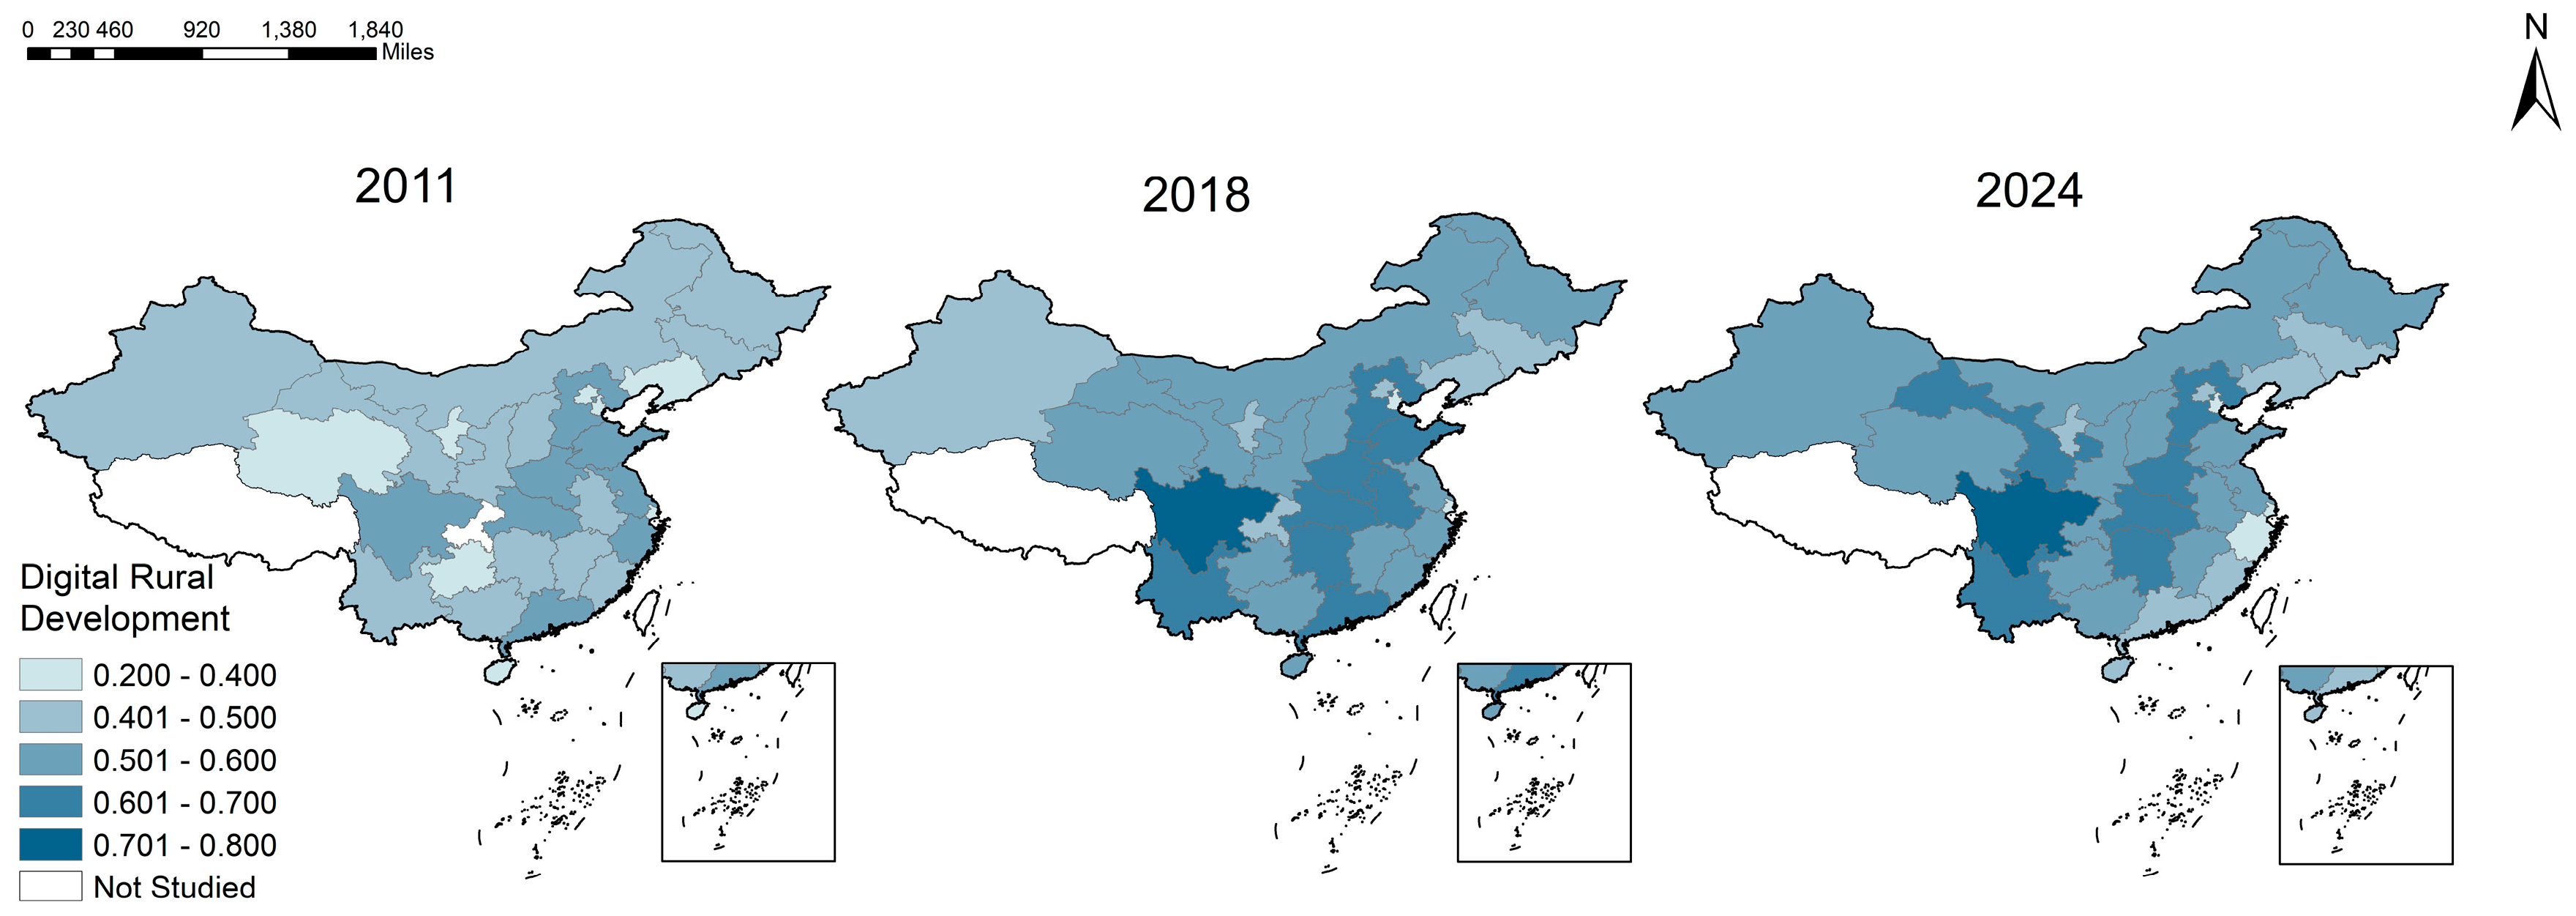
ArcGIS 10.8 is used to analyze the spatiotemporal evolution characteristics of digital village development. This paper selects the years 2011, 2018, and 2024 for spatial mapping. As shown in Figure 2, from an overall trend perspective, the level of digital village development in China exhibited a pattern of rising first and then stabilizing between 2011 and 2024.
In the temporal dimension, the mean value in 2011 was 0.430, rising to 0.544 in 2018, with an average annual growth rate of about 3.4%, mainly benefiting from the concentrated implementation of policies such as “Broadband China” and e-commerce entering rural areas. After 2018, the index continued to rise, reaching 0.568 in 2023, before declining slightly to 0.539 in 2024. The slowdown is mainly attributed to the diminishing marginal returns of infrastructure. After broadband and e-commerce service stations are built, further improvements rely on “soft inputs” such as industrial digitalization, which take longer to show effects. Moreover, after the COVID-19 pandemic, local government finances became strained, reducing the capacity for sustained investment in digital villages in some provinces. Overall, digital village construction has transitioned from a phase of rapid popularization to a phase of steady quality improvement.
In the spatial dimension, digital village development shows a pattern of “leading in major agricultural provinces, declining in coastal areas, and persistently low in western regions and municipalities” (Figure 3). In 2011, provincial differences were small. By 2018, divergence began to appear: major grain-producing areas such as Hebei (0.624), Henan (0.640), Shandong (0.627), Hubei (0.632), Hunan (0.600), and Anhui (0.623) rose above 0.6, with Sichuan reaching 0.724. Meanwhile, Beijing, Shanghai, and Tianjin remained fluctuating between 0.3 and 0.4, and most western provinces still lingered in the range of 0.5–0.6. By 2024, major agricultural provinces continued to increase to 0.6–0.7, but coastal provinces such as Zhejiang, Guangdong, and Fujian declined compared to 2018, and western provinces still had not exceeded 0.6. This can be attributed to the fact that major agricultural provinces have a large number of farming households, cooperatives, and agricultural enterprises, providing abundant application scenarios such as e-commerce sales and smart irrigation, resulting in a quick return on digital investment and thus higher indices. By contrast, municipalities directly under the central government have a very low agricultural share and lack application scenarios; even with high informatization levels, it is difficult to convert this into a high digital village index. Meanwhile, after 2018, coastal provinces such as Zhejiang, Guangdong, and Fujian shifted their digital focus toward urban economies and industrial internet, reducing attention and investment in the agricultural sector, leading to a decline in their indices. Furthermore, western provinces, constrained by fiscal capacity, logistics costs, and talent shortages, find it difficult to catch up with the level of major agricultural provinces in the short term despite policy support.

4.2. Spatiotemporal Characteristics of Agricultural Modernization

In the temporal dimension, from 2011 to 2024, the level of agricultural modernization in China showed a slow upward trend, rising from 0.308 to 0.411, with an average annual growth rate of only 2.4%. Among the three systems, agricultural modernization progressed relatively slowly (Figure 2). From 2011 to 2018, it increased from 0.308 to 0.377, with an average annual growth rate of about 3.0%. After 2018, the increase was very small, with the 2024 value only 0.034 higher than that in 2018. The slowdown after 2018 is mainly attributed to a strategic shift in policy priorities. As the national agricultural policy orientation gradually shifted from simply increasing output to green quality improvement and high-quality development, fiscal funds were increasingly directed toward resource conservation and pollution control, with relatively less support for the traditional path of simply expanding production scale. At the same time, green transformation involves higher technical thresholds and longer implementation cycles. Moreover, the aging of the rural population (reaching 26.5% in 2023) and rural hollowing have led to a structural decline in labor quality, limiting the efficiency of modern agricultural technology promotion. In addition, recent local fiscal pressure and grain price volatility have weakened the ability of operating entities to make long-term fixed asset investments. These combined factors have resulted in a marked lag in agricultural modernization in the later period compared to digital village development and agricultural carbon emission efficiency.
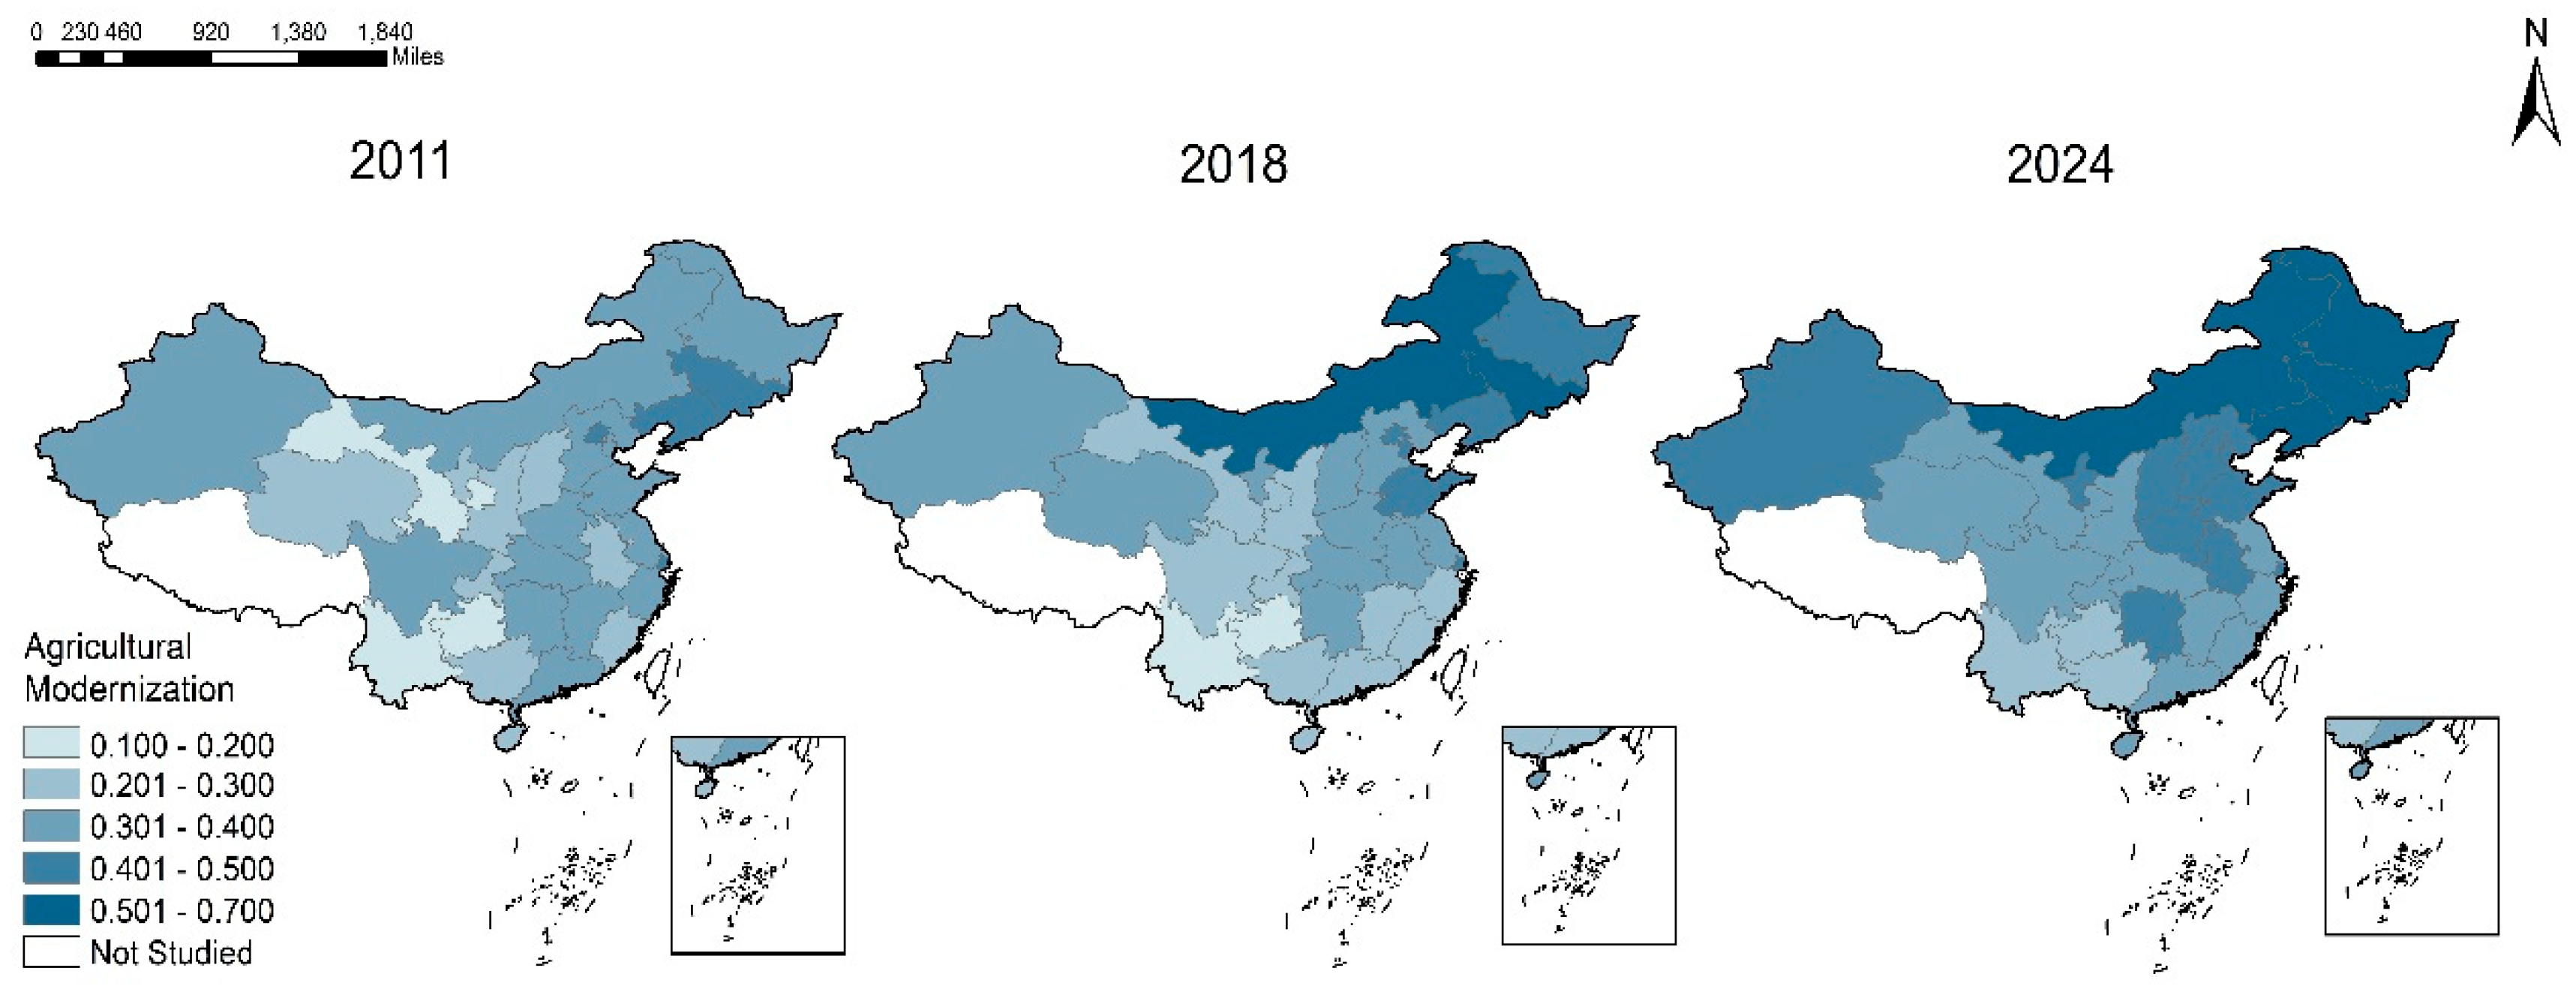
In the spatial dimension, agricultural modernization shows a pattern of “leading in the northeast, lagging in the southwest” (Figure 4). In 2011, the indices of Inner Mongolia, Jilin, and Heilongjiang were already at relatively high levels (0.33–0.46), while those of Guizhou, Yunnan, and Guangxi were only 0.14–0.26. By 2018, Inner Mongolia rose to 0.547, Jilin to 0.588, and Heilongjiang to 0.480, with the three provinces continuing to lead. Guizhou and Yunnan remained below 0.260, and Guangxi at 0.291. In 2024, Inner Mongolia reached 0.654, Jilin 0.699, and Heilongjiang 0.544, maintaining high levels; Guizhou (0.205), Yunnan (0.272), and Guangxi (0.291) remained the lowest; eastern coastal provinces such as Jiangsu, Zhejiang, Fujian, and Guangdong were consistently in the 0.3–0.4 range, even slightly below the national average. The main reasons for this pattern are: the northeastern region, with its sparse population and high degree of land-scale operation and mechanization, started agricultural modernization earlier and achieved rapid results; the southwestern region, constrained by hilly and mountainous terrain, fragmented farmland, and difficulty in scaling up, coupled with a weak economic foundation, has long lagged behind; and the eastern coastal region, although economically developed, has a relatively small agricultural share and tight land resources, limiting the potential for agricultural modernization improvement.

4.3. Spatiotemporal Characteristics of Agricultural Carbon Emission Efficiency

This paper uses the super-efficiency SBM model to measure agricultural carbon emission efficiency, constructing the frontier from a global perspective, so the efficiency values across different years are comparable. In the temporal dimension, from 2011 to 2024, agricultural carbon emission efficiency in China exhibited a pattern of “low base, rapid growth,” rising continuously from 0.146 to 0.655, making it the fastest-growing subsystem and the most rapidly accelerating in the later period (Figure 2). From 2011 to 2018, it increased from 0.146 to 0.244, with an average annual growth rate of about 7.6%. After 2018, it entered an acceleration phase, reaching 0.655 in 2024. This “slow then steep” trend is highly consistent with the implementation rhythm of the “dual carbon” strategy. The campaign to reduce fertilizer and pesticide use was launched in 2015. After 2018, agricultural green development policies were intensively implemented, and technologies such as conservation tillage and waste recycling were widely promoted, causing carbon emission efficiency to leap in the later period.
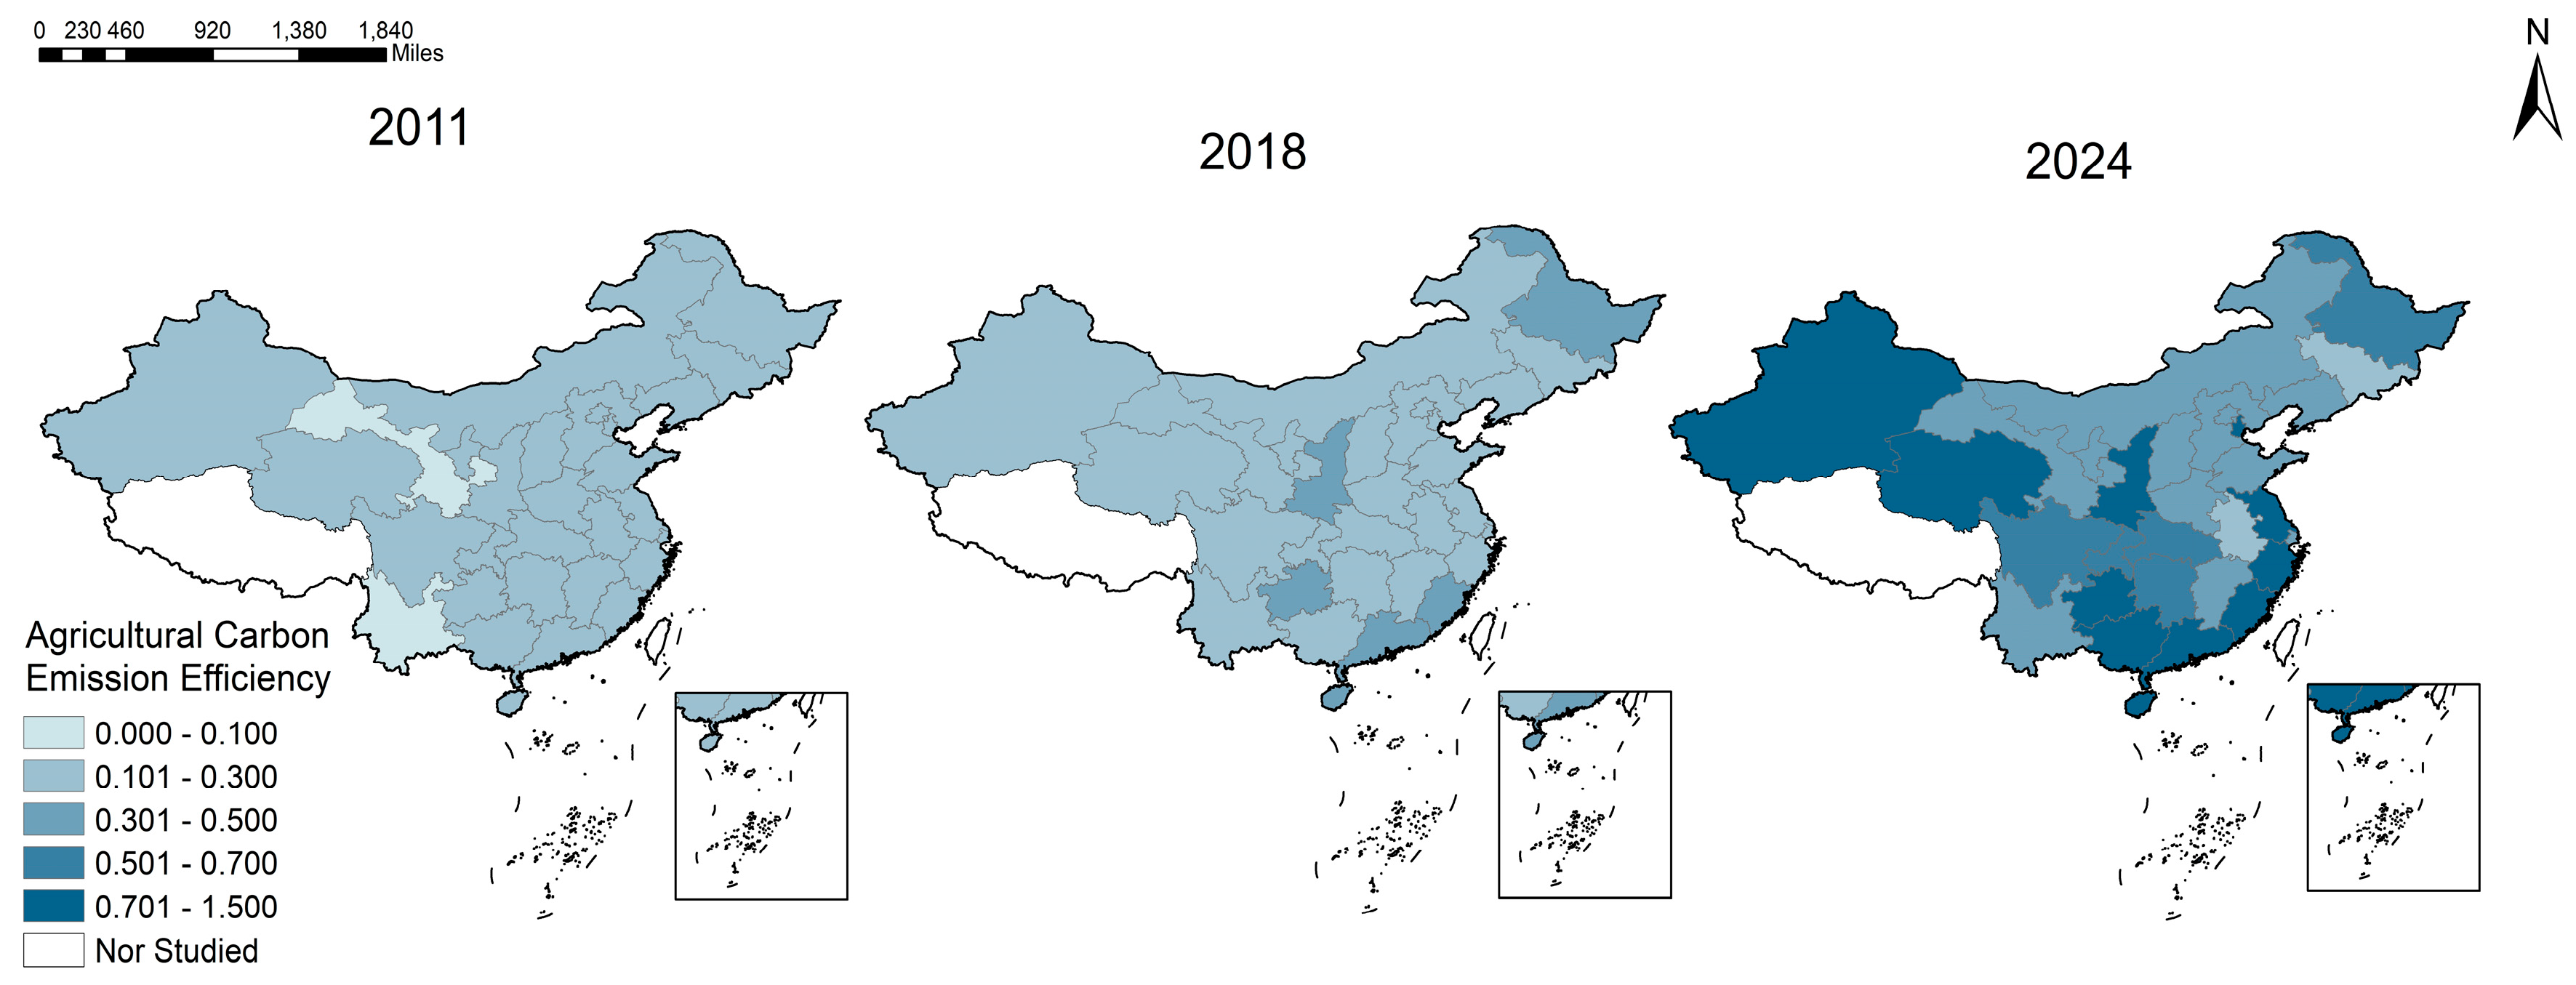
In the spatial dimension, agricultural carbon emission efficiency shows a pattern of “high in the south, low in the north; leading in coastal areas; lagging in the North China Plain.” (Figure 5) The national average in 2011 was 0.146, with high-efficiency provinces mainly concentrated in southern coastal areas such as Guangdong, Fujian, and Hainan. In 2018, the southern coastal advantage remained: Guangdong rose to 0.428, Fujian to 0.336, and Hainan to 0.339; Heilongjiang increased to 0.335; but Hebei, Shandong, and Henan remained significantly below the national average. By 2024, the divergence intensified. Southern coastal provinces such as Guangdong (1.127), Fujian (1.025), Guangxi (1.002), and Hainan (1.194) had efficiency values well above 1; Heilongjiang (0.554) also improved significantly; while Hebei, Shandong, and Henan remained around 0.4. The efficiency values exceeding 1 in southern coastal areas result from multiple factors. First, these provinces have favorable hydrothermal conditions, high multiple cropping indices, and a cropping structure dominated by cash crops such as vegetables, fruits, and tea, generating much higher output value per unit area than grain crops, thus achieving higher expected output with the same fertilizer, pesticide, and energy inputs. Second, southern coastal areas implemented fertilizer and pesticide reduction and efficiency-enhancing actions earlier, with green production technology penetration rates above the national average, leading to a continuous decline in agricultural carbon emission intensity. Third, in recent years, Guangxi and Hainan have vigorously developed large-scale cultivation of sugarcane and tropical fruits, with widespread application of precision agriculture technologies such as smart irrigation and integrated water-fertilizer management, further reducing carbon emissions per unit of output. Fourth, these four provinces did not experience extensive severe natural disasters in 2024, and agricultural production was relatively stable, avoiding artificially high efficiency values due to sharp output fluctuations. Therefore, the efficiency values exceeding 1 in these provinces are not model anomalies but a true reflection of the effectiveness of their agricultural green transformation, and they also provide a replicable low-carbon development path for other provinces.

4.4. Spatiotemporal Evolution Analysis of the Coupling Coordination Among Digital Village Development, Agricultural Modernization, and Agricultural Carbon Emission Efficiency

Based on the previously constructed “technology–industry–ecology” triple-system framework, digital village development is the technology subsystem, agricultural modernization is the industry subsystem, and agricultural carbon emission efficiency is the ecology subsystem. The continuous increase in the coupling coordination degree of the three systems implies that a positive feedback mechanism of technology empowering industry, industry supporting ecology, and ecology forcing technology is gradually emerging. In the temporal dimension, from 2011 to 2024, the national coupling coordination degree of the three systems rose continuously from 0.382 to 0.661, with an average annual growth rate of approximately 4.3%. The coordination level transitioned from “near disorder” (0.3–0.5) to “primary coordination” (0.6–0.7). Throughout the study period, the coupling coordination degree showed a continuous upward trend (Figure 2). The growth process can be roughly divided into two stages: from 2011 to 2018, a rapid improvement period, during which the national mean rose from 0.382 to 0.534, with an average annual growth rate of 2.6%; from 2018 to 2024, a steady optimization period, during which the mean rose from 0.534 to 0.661, with an average annual growth rate of 3.7%, slightly slower but still robust. The difference in growth drivers between the two stages is that the early stage relied mainly on the rapid popularization of digital villages and the steady advancement of agricultural modernization; the later stage benefited from a substantial leap in agricultural carbon emission efficiency, which effectively offset the impact of diminishing marginal returns from digital villages. By 2024, no province remained in the disorder category. Among them, eight provinces Xinjiang, Tianjin, Heilongjiang, Fujian, Hunan, Hubei, Jiangsu, and Inner Mongolia—entered intermediate coordination or above, with Xinjiang reaching good coordination (0.807). Among them, Xinjiang had the highest coupling coordination degree (0.786), mainly due to its ecological endowment, cash crop structure, highly scaled and mechanized production, effectiveness of green agricultural transformation, and sustained and strong fiscal policy support. First, Xinjiang has a sparse population, low traditional agricultural input intensity, and is dominated by cash crops such as cotton and melons, resulting in low carbon emissions per unit of output. In 2024, its agricultural carbon emission efficiency jumped from 0.401 to 1.061, raising the overall coordination degree. Second, in 2024, the comprehensive mechanization rate of plowing, sowing, and harvesting for major crops in Xinjiang reached 90.28%. Scaled operation reduces the intensity of fertilizer and pesticide application and facilitates the unified promotion of green technologies such as precision fertilization and smart irrigation. Third, Xinjiang has achieved significant results in fertilizer reduction, high-efficiency water conservation, and straw and film recycling, with the fertilizer utilization rate reaching 43.02% and the area under water-saving irrigation continuously expanding. Fourth, from 2021 to 2024, the region’s total “agriculture, rural areas, and farmers” expenditure reached 451.41 billion RMB. Large-scale fiscal investment has created a superimposed effect of technology promotion, scale operation, and green transformation.
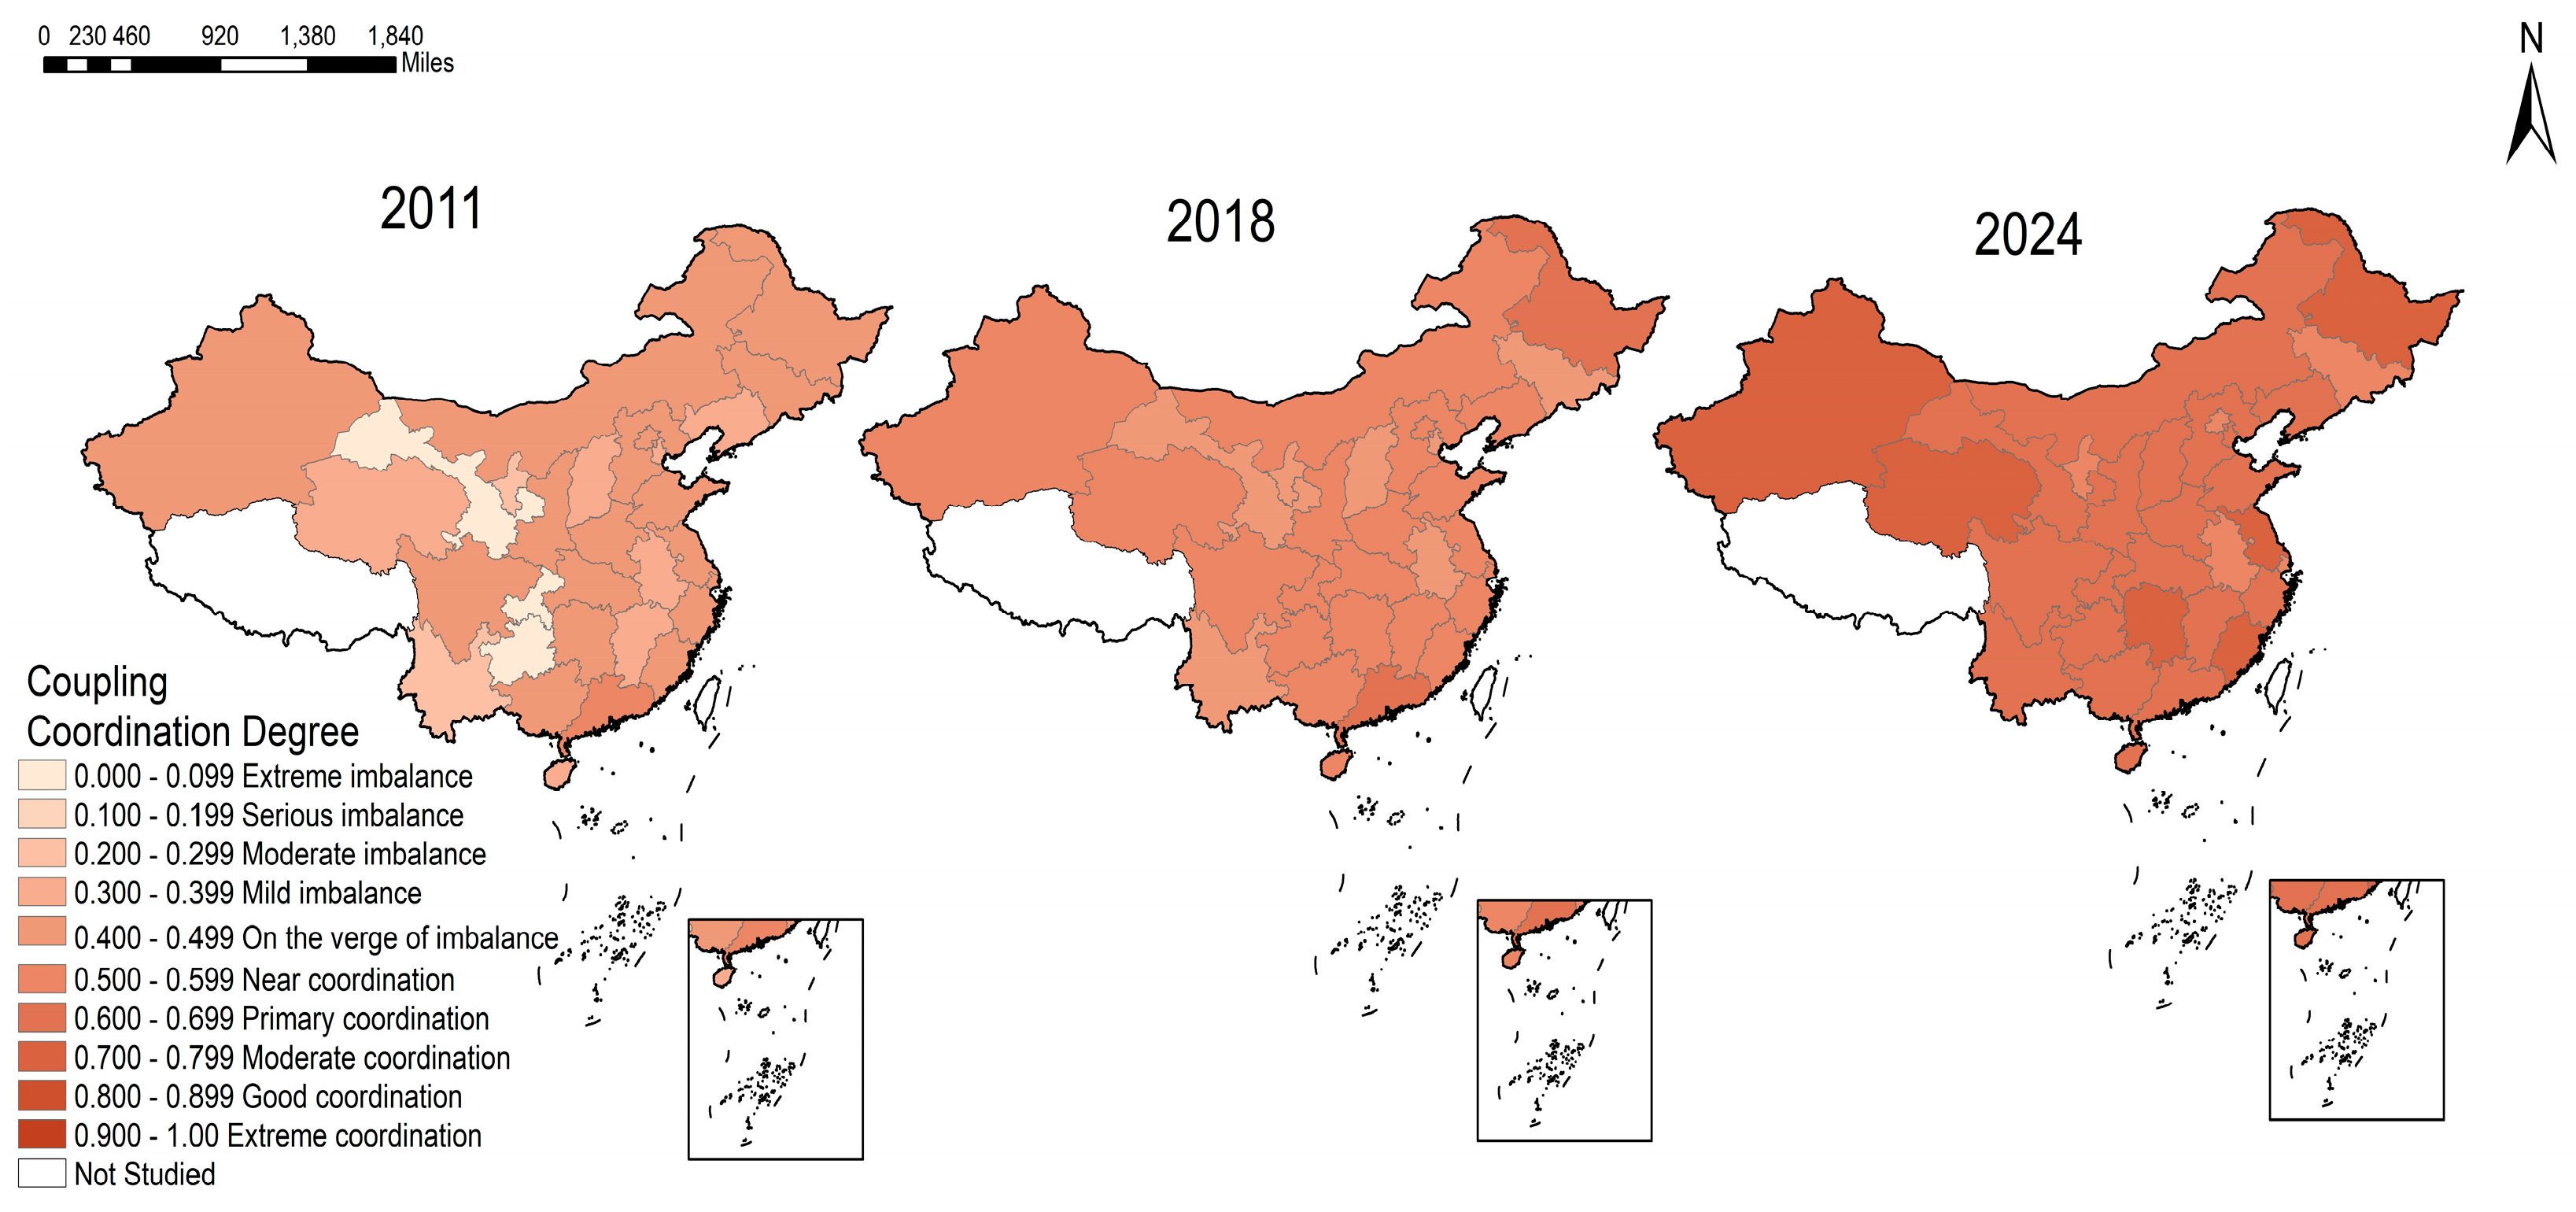
In the spatial dimension, the coupling coordination degree shows a pattern of “eastern and northeastern regions leading, western region lagging,” with high-value areas spreading from the coast inland. In 2011, the coupling coordination degree of the three systems ranged from 0.049 to 0.518. At this stage, the proportions of extreme disorder, mild disorder, near disorder, and barely coordination were 2:8:15:5, with an overall low coordination level. High-value areas were distributed only in eastern coastal provinces such as Beijing, Shanghai, Guangdong, and Jiangsu, which had good foundations in digital village development and agricultural modernization as well as high carbon emission efficiency, resulting in balanced development of the three systems. Low-value areas were concentrated in western provinces such as Gansu, Guizhou, and Yunnan, where agricultural modernization was constrained by natural conditions (hilly terrain, fragmented farmland, difficulty in scaling up) and carbon emission efficiency was extremely low, leading to a low coupling coordination degree. In 2018, the coupling coordination degree range rose to 0.448–0.631. The proportions of near disorder, barely coordination, and primary coordination shifted to 3:15:12, with no provinces in moderate disorder or below. Heilongjiang and Tianjin were the first to enter primary coordination. With the rapid advancement of digital villages in central and western regions and the widespread improvement of carbon emission efficiency, Guizhou, Yunnan, and other western provinces escaped extreme disorder and entered near disorder or barely coordination. In 2024, the coupling coordination degree range expanded to 0.578–0.786 with no province in the disorder category. The proportions of barely coordination, primary coordination, intermediate coordination, and good coordination were 5:12:12:1. High-value areas expanded significantly, with most provinces in the east, northeast, and north entering primary coordination or above. Xinjiang, Tianjin, Heilongjiang, and others entered intermediate or good coordination, indicating relatively balanced development of the three systems. However, western provinces such as Guizhou (0.637), Yunnan (0.609), and Gansu (0.617) remained in the barely coordination stage. The main reason is that natural geographical conditions constrain agricultural modernization: Guizhou has fragmented terrain and small basins, making large-scale mechanization difficult; Gansu suffers from water scarcity and poor soil quality; Yunnan has extensive mountainous areas and scattered farmland, resulting in persistently low levels of agricultural modernization. Coupled with slow improvement in carbon emission efficiency, the three systems are unbalanced. Overall, the low coupling coordination degree in the western region is mainly due to natural geographical conditions constraining agricultural modernization. Future efforts should focus on promoting mountainous agricultural mechanization, developing characteristic high-efficiency agriculture, and increasing fiscal transfers and technology assistance tailored to local conditions (Figure 6).
To verify the statistical significance of the above spatiotemporal differences, this paper conducted a series of tests. Paired t-tests indicated that the national coupling coordination degree significantly increased from 0.382 in 2011 to 0.661 in 2024. One–way ANOVA showed that the mean differences among the eastern, central, and western regions were significant in 2011 (p < 0.001), but not significant in 2024, reflecting a trend of regional convergence. The Kruskal–Wallis test confirmed that the distribution of the coupling coordination degree across different coordination levels was significantly different (p < 0.001), validating the classification of levels. These results jointly reveal three underlying mechanisms: first, early polarization and later convergence. The diffusion of digital and green technologies follows a “point–to–area” pattern. In the early stage, resource agglomeration led to the eastern region taking the lead, while in the later stage, policy inclusiveness and technology spillovers facilitated the catch-up of the western region. Second, overall systemic improvement. Technological empowerment and green transformation have formed a synergy, driving the continuous improvement of the three–system coordination level nationwide. Third, hierarchical gradation. The improvement of the coupling coordination degree is staged and bounded. Different levels correspond to different technology–industry–ecology combination states, and policy interventions should be precisely tailored according to the current level.

5. Driving Mechanisms of the Coupling Coordination Among Digital Village Development, Agricultural Modernization, and Agricultural Carbon Emission Efficiency

Having revealed the spatiotemporal evolution characteristics of the coupling coordination among the three systems, we further investigate the underlying driving mechanisms. The improvement in the coupling coordination degree is not the result of a single factor’s linear effect, but rather the interactive outcome of multiple forces from government, market, and society in specific spatiotemporal contexts. To clearly depict this complex process, this paper constructs a “government–market–society” three-dimensional driving analytical framework (Figure 7) to elucidate the impact pathways and internal logic of each factor on the coupling coordination among digital village development, agricultural modernization, and agricultural carbon emission efficiency.

5.1. Spatial Autocorrelation

The global Moran’s I is used to test the spatial agglomeration characteristics of digital village development, agricultural modernization, and agricultural carbon emissions. As shown in Table 7, the global Moran’s I for digital village development was negative and not significant from 2011 to 2015, indicating that no stable spatial agglomeration pattern had formed in the early stage. In 2016, Moran’s I turned positive and continued to rise, becoming significantly positive from 2019, then increasing and slightly declining after 2023. The overall pattern is “continuous increase followed by a slight decline,” suggesting that the spatial agglomeration of digital village development increased in 2016, but then, with the widespread provision of digital infrastructure and the comprehensive promotion of the “digital going-to-the-countryside” policy, late-developing regions accelerated their catch-up, regional disparities narrowed, and spatial agglomeration weakened. For agricultural modernization, the global Moran’s I was always positive and significant, indicating a stable and strong positive spatial correlation. This stable spatial pattern reflects that the process of agricultural modernization is deeply constrained by geographical factors such as natural endowments, topographical conditions, and the scale of land transfer. High-level and low-level regions remain locked in their original patterns, making cross-regional coordinated improvement difficult and resulting in overall slow progress. For agricultural carbon emission efficiency, the global Moran’s I shows a “periodically significant” pattern. It was significant in 2011 but not significant from 2012 to 2015 for four consecutive years, indicating a random spatial distribution during this period. In 2016, Moran’s I turned significantly positive and remained so until 2022, suggesting that under the policy drive of the national “dual carbon” strategy and agricultural green development plans, low-carbon agricultural technologies began to generate spatial spillover effects, and provinces with similar carbon emission efficiency tended to form contiguous clusters. In 2023, Moran’s I dropped sharply to 0.085 and was not significant, which is related to the frequent extreme weather events that year. According to public information from the China Meteorological Administration and the Ministry of Agriculture and Rural Affairs, in 2023, the Huang-Huai-Hai region and Northeast China experienced heavy rainstorms during the summer harvest, leading to widespread waterlogging in farmland, while Southwest China suffered persistent summer-autumn droughts. These disasters disrupted conventional agricultural input and carbon emission patterns, making inter-provincial differences in carbon emission efficiency more random and temporarily eliminating spatial dependence. The index recovered significance in 2024, demonstrating the self-repair capacity of the spatial pattern. Overall, the spatial agglomeration stability of agricultural carbon emission efficiency is significantly weaker than that of agricultural modernization, reflecting that carbon emission efficiency is more susceptible to exogenous shocks such as short-term policies, climate conditions, and the pace of technology diffusion.

5.2. GTWR Model Specification Test

The coupling coordination of digital village development, agricultural modernization, and agricultural carbon emission efficiency is comprehensively influenced by multiple dimensions such as government regulation, market mechanisms, and social participation. These factors can be summarized as “government, market, and society,” which are interrelated and work together to drive the formation and evolution of the coupling coordination pattern (Figure 7). Before conducting regression analysis, this paper tests for multicollinearity among the explanatory variables. The results show that the variance inflation factor (VIF) values of all driving factors are less than 10, indicating no multicollinearity among the driving factors and valid regression results. As shown in Table 8, at the 1% significance level, five driving factors have significant effects on the coupling coordination degree, with the level of social consumption showing a negative effect. The coefficient of the rural infrastructure level is negative and not significant. This does not mean that this variable has no effect on the coupling coordination degree. If the effect of this variable on the coupling coordination degree varies significantly across regions or periods (e.g., positive promotion in infrastructure-lagging areas and negative drag in saturated areas), the global average effect may approach zero, leading OLS to fail to identify its true effect. Therefore, it is necessary to further use the GTWR model to reveal its potential spatiotemporal heterogeneity, capturing the local heterogeneity obscured by the “averaging” of conventional panel models.
The GTWR plugin designed by Huang et al. [42] is used for analysis, with a fixed bandwidth kernel function selected. This choice was made because the study area covers 30 Chinese provinces with relatively uniform shapes and sizes of units, and a fixed bandwidth ensures consistency of spatial weights. The optimal bandwidth was determined by minimizing the AICc value, where a smaller AICc indicates a better balance between model fit and complexity. Through iterative search, the final optimal fixed bandwidth was 0.114, corresponding to a model AICc of −1355.95 (Table 9). On this basis, the spatiotemporal regression coefficients of each driving factor were further estimated. with OLS and GWR as benchmarks. The results are shown in Table 9. Compared with OLS and GWR models, the GTWR model has a higher adjusted R2 (0.807) and a lower AICc (−1355.95), indicating a good model fit. Therefore, the GTWR model is used to calculate the coefficients of the driving factors for each spatial unit, and natural breaks are employed to classify the coefficients, reflecting the spatial heterogeneity of the influence of driving factors on the coupling coordination degree of digital village development, agricultural modernization, and agricultural carbon emission efficiency.
To test whether spatial autocorrelation remained in the residuals of the GTWR model, this paper calculated the global Moran’s I of the residuals for 30 provinces in 2024 using a binary spatial weight matrix. The results show that Moran’s I = −0.161, p = 0.129 (one-sided test), which was not statistically significant, indicating no significant spatial autocorrelation in the residuals. Therefore, the GTWR model can effectively explain the spatiotemporal differentiation of the coupling coordination degree, and the model specification is valid.

5.3. Analysis of Spatiotemporal Evolution Characteristics of Driving Factors

5.3.1. Effective Market Allocation

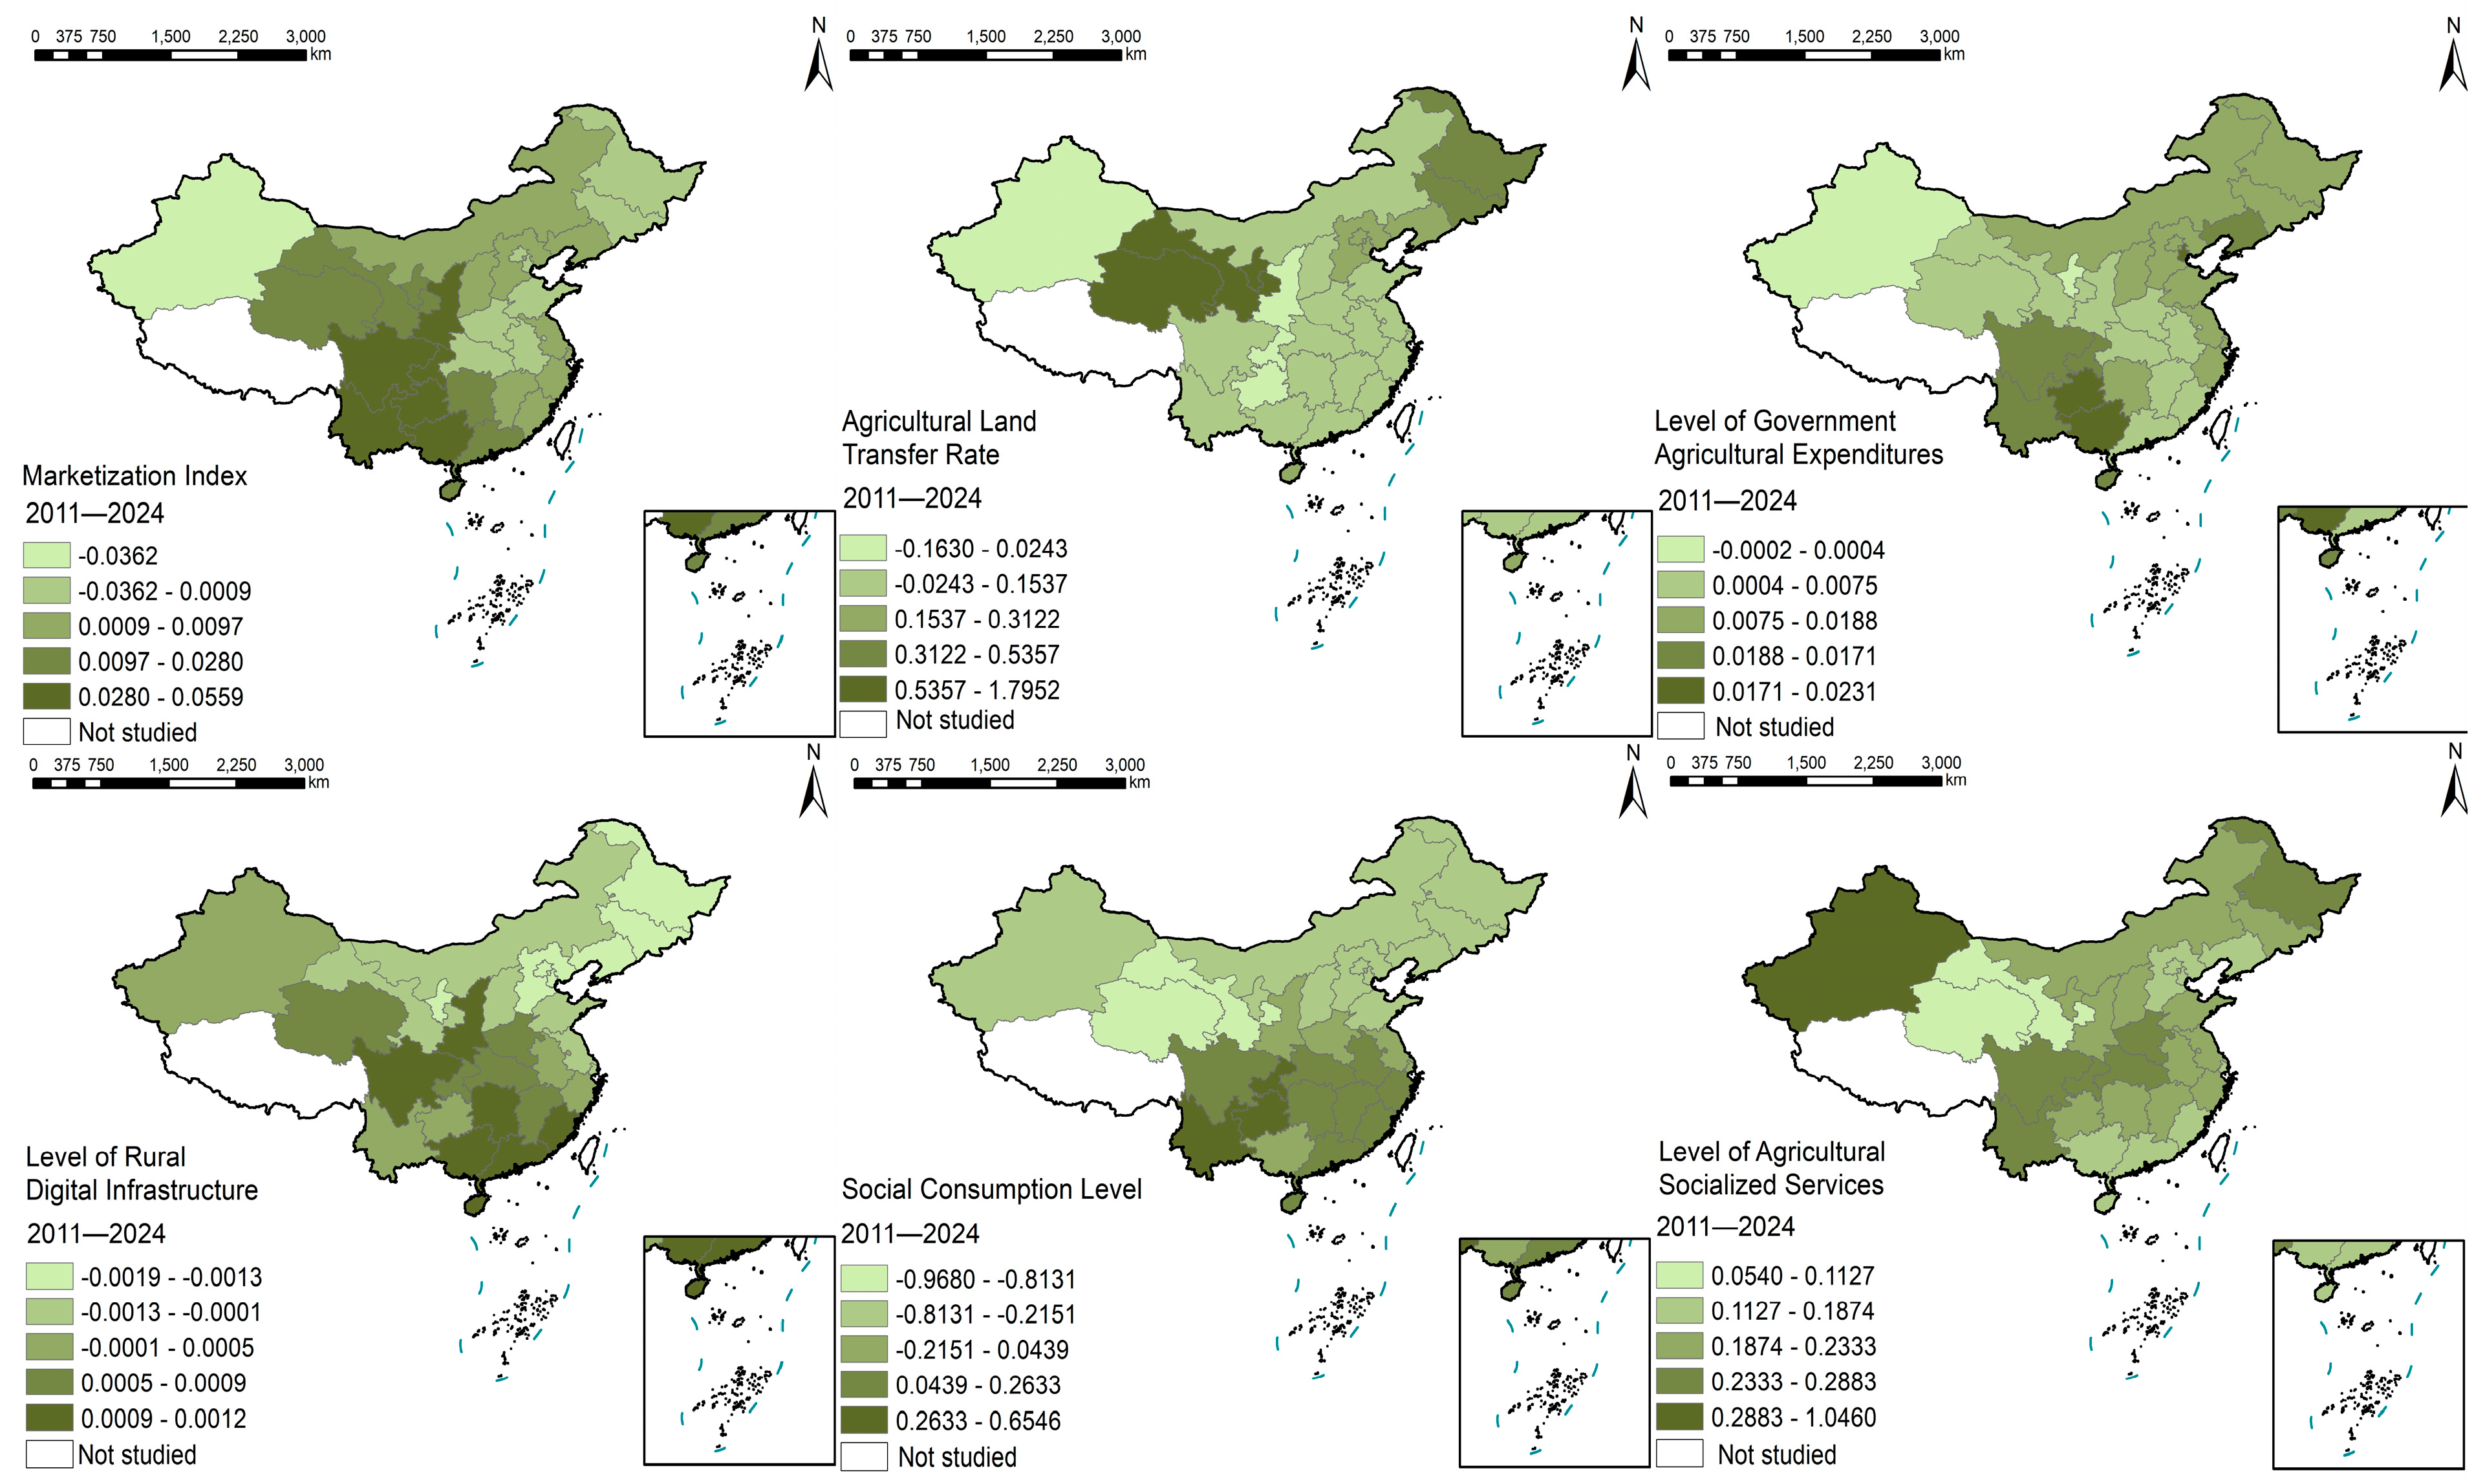
The marketization index has a predominantly positive effect on the coupling coordination degree, with some outliers showing a small negative inhibitory effect (Figure 8). From the perspective of significance distribution (Table 10), the proportion of significant samples for the marketization index is 33.33%. The effect is non-stationary, with clear spatial differentiation. As the market economy becomes increasingly active, a one-unit increase in the marketization index changes the coupling coordination degree in the range of (−0.0362, 0.0559). In terms of spatial distribution of regression coefficients, western regions exhibit high-positive agglomeration, with coefficients generally between 0.050 and 0.056, while eastern coastal provinces have low or even negative values. The marketization index is relatively lagging in western regions, where the marginal effect of market-oriented reforms is more pronounced. In contrast, the eastern region already has a high degree of marketization, and the marginal effect of further marketization has approached saturation. An increase in the marketization index promotes the free flow of production factors across regions, reduces transaction costs in the diffusion of digital technologies and the process of agricultural modernization, and accelerates the deep integration of data elements into agricultural production, operation, and management, thereby promoting high-quality green agricultural development [43].
The agricultural land transfer rate also has a predominantly positive effect on the coupling coordination degree, with some outliers showing a small negative inhibitory effect. From the perspective of significance distribution (Table 10), the proportion of significant samples for the agricultural land transfer rate is 73.33%, indicating that this factor has a statistically significant association in the vast majority of region-year combinations. An increase of 10,000 hm2 in the total area of transferred contracted farmland changes the coupling coordination degree in the range of (−0.1630, 1.7952). Spatially, western provinces such as Gansu, Qinghai, and Ningxia, as well as northeastern provinces such as Jilin and Heilongjiang, show high-positive agglomeration, with coefficients generally exceeding 0.4. Eastern coastal provinces are low-value areas, with coefficients mostly below 0.15. Land transfer promotes appropriately scaled farm operations, improves the efficiency of agricultural mechanization and factor allocation, and reduces energy consumption and carbon emission intensity per unit of output. At the same time, scaled operation makes it easier for farmers to adopt green technologies such as precision fertilization and conservation tillage, and stable land property rights expectations encourage long-term low-carbon investments, thereby accelerating the synergistic improvement of agricultural modernization and carbon emission efficiency [44].

5.3.2. Proactive Government Guidance

The effect of the Level of Government Agricultural Expenditures on the coupling coordination degree shifts from negative to positive, but overall shows a significant positive correlation (Figure 8). From the perspective of significance distribution (Table 10), the proportion of significant samples for the level of fiscal support for agriculture is 70.00%, indicating that this factor has a statistically significant association in most region-year combinations. A 1% increase in the level of fiscal support for agriculture changes the coupling coordination degree in the range of (−0.0003, 0.0232). The negative effect in some periods or regions is mainly related to the lag in the allocation of fiscal funds and the “threshold effect.” In the early stage, fiscal support for agriculture in some regions was mostly used to expand traditional agricultural production scale, lacking complementary investment in digital infrastructure and green technologies. This led to unilateral expansion of the industry while the technology and ecology sectors lagged, actually lowering the coordination level of the three systems. As the policy orientation gradually shifted toward green development and digitalization, the positive effect of fiscal support for agriculture began to emerge. Spatially, regional differences are significant. Southwestern provinces such as Guangxi, Hainan, Guizhou, Yunnan, and Chongqing form high-positive agglomeration areas; the coefficients generally range between 0.015 and 0.023. Northwestern provinces such as Gansu, Xinjiang, Ningxia, and Qinghai are mostly low-value or negative-value areas. In the southwestern region, constrained by mountainous terrain, fiscal funds tend to be simultaneously invested in digital infrastructure, specialty agriculture, and ecological compensation, facilitating the synergistic improvement of technology, industry, and ecology. In the northwestern region, natural endowment constraints are significant. Water scarcity, soil salinization, and desertification are prominent, and the ecological environment is fragile, limiting the marginal room for improvement in agricultural production under the same fiscal input. The emission reduction and synergistic enhancement effects of funds are diluted by natural conditions.
The Level of Rural Digital Infrastructure did not pass the significance test in the OLS estimation. Therefore, further examining the coefficient distribution from the GTWR model, its effect exhibits significant spatial heterogeneity, with a relatively weak overall statistical association. From the perspective of significance distribution (Table 10), the proportion of significant samples for the rural infrastructure level is only 10.24%, the lowest among the six factors, indicating that this factor failed to pass the significance test in more than 89% of region-year combinations. A 1% increase in the rural infrastructure level changes the coupling coordination degree in the range of (−0.0019, 0.0012). The effect is highly spatially heterogeneous and needs to be discussed by region. In terms of the spatial distribution of the regression coefficients, this effect exhibits significant regional differences. Southern provinces form high-positive agglomeration areas, with coefficients generally ranging between 0.0009 and 0.0013. Some northern provinces show negative values, with coefficients approximately between −0.0019 and 0.0001. In the southern region, characterized by complex terrain, hills, and mountains, improvements in broadband and other digital infrastructure have large marginal contributions to breaking information isolation, promoting agricultural product distribution to urban areas, and facilitating the diffusion of digital technologies, thereby exerting a positive pull on the synergy of the three systems. In northern plain areas, infrastructure is already relatively complete, further expansion of coverage has diminishing marginal benefits, and in some areas, redundant construction or mismatches with industrial structure lead to idle resources, resulting in localized negative effects.

5.3.3. Orderly Social Promotion

The Social Consumption Level generally shows a negative correlation with the coupling coordination degree, but turns positive in parts of the southwest (Figure 8). From the perspective of significance distribution (Table 10), the proportion of significant samples for the social consumption level is 56.67%, indicating that this factor has a statistically significant association in more than half of the region-year combinations. A 1% increase in the social consumption level changes the coupling coordination degree in the range of (−0.9680, 0.6548). In terms of the spatial distribution of the regression coefficients, some central, western, and northern provinces form high-negative agglomeration areas, with coefficients generally below −0.30. Conversely, parts of the southwest exhibit positive effects, with coefficients ranging between 0.23 and 0.65. Consumption structure is a key factor influencing the agricultural carbon emission pattern. Current household consumption is still dominated by traditional high-carbon products, and an increase in the level of food consumption to some extent intensifies the pressure of agricultural carbon emissions [45]. In the southwestern region, where specialty agriculture is developed and green agricultural products enjoy high market recognition, consumption upgrading instead promotes the diffusion of low-carbon production models, thus exhibiting a localized positive association.
The Level of Agricultural Socialized Services is significantly positively correlated with the coupling coordination degree. From the perspective of significance distribution (Table 10), the proportion of significant samples for the level of agricultural socialized services is 83.33%, the highest among the six factors, indicating that this factor has a statistically significant association in the vast majority of region-year combinations. For every 1000 hectares increase in the service area provided by agricultural socialized services, the coupling coordination degree increases in the range of (0.0540, 1.0460). Spatially, some western and northeastern provinces show high-positive agglomeration, with coefficients generally exceeding 0.4; eastern coastal provinces are low-value areas, with coefficients mostly between 0.15 and 0.22. Agricultural socialized services introduce green technology and environmental factors to optimize the input-output ratio of cultivated land, playing an important role in improving green use efficiency and promoting the green and low-carbon transformation of cultivated land [46]. The western region started socialized services later and has greater room for improvement, so the positive pulling effect is more prominent. In the eastern region, service supply is already mature, and the marginal effect is weaker.

6. Conclusions and Recommendations

6.1. Conclusions

Based on panel data of 30 Chinese provinces from 2011 to 2024, this paper constructs a “technology–industry–ecology” triple-system analytical framework and uses the super-efficiency SBM model, coupling coordination degree model, and GTWR model to systematically investigate the spatiotemporal evolution characteristics of digital village development, agricultural modernization, and agricultural carbon emission efficiency and the driving mechanisms of their coupling coordination. The main conclusions are as follows:
(1) The three systems show a pattern of “fast technology, slow industry, and ecological catch-up.” Digital village development exhibited a “rising then stabilizing” trend (mean from 0.438 to 0.546), benefiting in the early stage from the rapid implementation of policies such as Broadband China and e-commerce in rural areas, and later entering a phase of steady quality improvement due to diminishing marginal returns. Agricultural modernization grew slowly (mean from 0.308 to 0.411), with an average annual growth rate of only 2.4%, constrained by structural contradictions such as land fragmentation and the predominance of smallholder farming. Driven by the “dual carbon” policies, agricultural carbon emission efficiency achieved “low base, rapid growth” (mean from 0.146 to 0.655), with an average annual growth rate of 17.9% after 2018, becoming the main engine driving the increase in coupling coordination degree in the later period. This unbalanced pattern indicates that the dividends of digital economy and emission reduction policies have been released relatively quickly, while the structural constraints of agricultural modernization require deeper institutional innovation and factor reallocation to break through.
(2) The coupling coordination degree of the three systems continuously increased, and the spatial pattern evolved from “local leadership” to “overall improvement.” The national average coupling coordination degree rose from 0.418 to 0.686, transitioning from near disorder to primary coordination, showing a continuous upward trend. The internal driving force of this improvement is: digital technology empowers agricultural productivity improvement; agricultural modernization optimizes factor allocation and industrial structure; and improved carbon emission efficiency forces greener production methods. The three systems form a closed loop, jointly promoting green and high-quality agricultural development. Spatially, a pattern of “eastern and northeastern regions leading, western region lagging” formed, with high-value areas spreading from the coast inland. Eight provinces, including Xinjiang, Tianjin, and Heilongjiang, entered intermediate coordination or above, with Xinjiang reaching good coordination (0.807), mainly due to the superimposed effects of ecological endowment, cash crop structure, scaled mechanization, and sustained fiscal investment. The relatively low coordination in the western region is constrained by natural geographical conditions. These findings suggest that improving coupling coordination not only depends on digital technology empowerment and carbon efficiency improvement but also requires regionally differentiated synergistic strategies tailored to local conditions.
(3) The influence of government, market, and social factors on the coupling coordination degree exhibits significant spatial heterogeneity. The GTWR model results show that, on the market side, the marketization index has a positive effect on the coupling coordination degree, with the marginal effect decreasing from west to east; the agricultural land transfer rate has a significant positive effect, with high-value areas concentrated in the west and northeast, and weaker in the eastern coastal region. On the government side, the effect of fiscal support for agriculture shifts from negative to positive, showing a pattern of “high in the southwest, low in the northwest”; the rural infrastructure level shows a “positive in the south, negative in the north” pattern, with a large marginal contribution in southern mountainous areas and diminishing marginal benefits in northern plains. On the society side, agricultural socialized services show a significant positive driving effect, with stronger effects in the west and northeast than in the east; the social consumption level is generally negative, with positive effects only locally in the southwest. These spatial differentiations are mainly related to differences in topographical conditions, policy orientation, natural endowments, and regional development stages. The western region should focus on releasing the dividends of market-oriented reforms and the potential of agricultural socialized services; the northeastern region needs to strengthen the linkage between scale operation and socialized services; the northern plains need to optimize the structure of fiscal investment and improve infrastructure utilization efficiency.

6.2. Recommendations

(1) Implement regionally differentiated synergistic promotion strategies. For the eastern coastal region, leverage its good foundation to first explore deep integration pathways of technology, industry, and ecology, focusing on the use of digital technologies to transform traditional agriculture across the entire value chain, and creating pilot zones for smart agriculture and low-carbon agriculture. For the western region, constrained by hilly and mountainous terrain and lagging agricultural mechanization, it should not blindly copy the eastern model. Instead, it should strengthen central fiscal transfers and technology assistance, prioritize the promotion of micro-intelligent agricultural machinery suitable for mountainous areas, expand digital infrastructure coverage, and cultivate specialty green agriculture. Within the western region, Xinjiang has a relatively high coupling coordination degree, which should be used as a pivot to establish cross-regional pairing assistance mechanisms, fully leveraging the demonstration spillover effects of such high-value areas to promote mutual learning among regions.
(2) Optimize the structure of agricultural modernization and strengthen the supporting capacity of the industrial system. Provinces should accelerate the registration and certification of farmland property rights and the construction of land transfer markets, especially in provinces such as Jilin, Heilongjiang, and Gansu where land transfer has a strong driving effect. Appropriately scaled land operations can reduce the promotion cost of intelligent farm machinery and green technologies. At the same time, pilot trials of agricultural carbon emission trading should be explored, using market mechanisms to guide scaled operators to adopt emission reduction technologies. Furthermore, the structure of fiscal support for agriculture should be adjusted accordingly, shifting from the past emphasis on “production over ecology” and directing more funds toward water-saving irrigation, film recycling, and the promotion of low-carbon technologies, leveraging fiscal leverage to drive the green and low-carbon transformation of agricultural modernization.
(3) Optimize the targeting of policy tools based on the spatial heterogeneity of driving factors. On the market dimension, continue to release the dividends of market-oriented reforms in the western region, while guiding the deep integration of data elements with agricultural production in the eastern region. On the government dimension, fiscal support funds for agriculture should be tilted toward the southwest to support its “digital + green” integrated development, while in the northwest, ecological compensation mechanisms need to be provided to offset natural endowment constraints. Rural digital infrastructure construction should follow the principle of deepening application in the south and enhancing efficiency in the north, avoiding idle resources due to redundant construction in northern plains. On the social dimension, agricultural socialized services should be vigorously promoted, especially in the western and northeastern regions. Support service organizations to aggregate the demands of smallholder farmers and provide services such as unified pest control and precision fertilization, achieving the universal application of low-carbon technologies through scaled services.
(4) Actively guide the positive interaction between consumption and production to form a closed loop for green transformation. It is necessary to accelerate the establishment of green agricultural product certification and carbon labeling systems, use e-commerce platforms to set up green product zones, cultivate consumers’ willingness to pay for low-carbon agricultural products, and transform high consumption into a driving force for green production. At the same time, improve the green finance system, simplify the credit and insurance application processes for low-carbon agricultural operators, and enable consumption upgrading and green finance to work together to promote the synergistic development of digital village development, agricultural modernization, and agricultural carbon emission efficiency, thereby achieving green and high-quality agricultural development.

6.3. Limitations and Future Research

This study has several limitations and suggests directions for future research.
(1) Data limitations. Due to data availability, this study covers only 30 Chinese provinces (Tibet, Hong Kong, Macao, and Taiwan are excluded). In the measurement of the digital village development index, proxy variables such as the number of Taobao Villages and the length of rural postal delivery routes were used. Although these indicators can partially reflect the level of rural digitalization, they cannot fully capture the depth of digital technology integration into agricultural production, operation, and management. Future research should further refine data collection by integrating multi-source data, downscaling the analytical units, and iteratively improving the indicator system, thereby enhancing the accuracy and coverage of digital village development measurement and laying a more robust data foundation for comprehensive coupling coordination analysis.
(2) Scale limitations. The current analysis was conducted at the provincial level, which may mask intra-provincial rural–urban and inter-county disparities. Subsequent studies should extend the scale to prefecture-level cities, counties, and even villages, incorporating GIS and spatial analysis techniques to depict more detailed patterns.
(3) This study does not analyze the potential negative interaction mechanisms among the three systems. It primarily focuses on positive promoting pathways, with limited analysis of negative effects. Future research could construct a dual-track mechanism model incorporating both “promoting and inhibiting” pathways, and introduce mediation or threshold effect models to quantify the marginal inhibiting intensity, such as the energy consumption rebound effect of digital infrastructure or the marginal carbon emission pressure from high-input agricultural modernization. Furthermore, the net effect after the cancellation of positive and negative mechanisms could be estimated, thereby precisely identifying the true emission reduction contributions and synergy thresholds of digital village development and agricultural modernization.
(4) Limitations in causal identification. Constrained by panel data and model specifications, this study reveals primarily statistical associations and spatiotemporal heterogeneity without fully excluding endogeneity bias arising from reverse causality or omitted variables. Future research could leverage quasi-natural experiments, such as digital village pilot programs, to further identify causal effects.


Author Contributions

Conceptualization, C.X. and R.F.; methodology, R.F.; software, R.F.; validation, C.X., R.F. and D.J.; formal analysis, C.X.; investigation, D.J.; resources, C.X.; data curation, R.F.; writing—original draft preparation, C.X. and R.F.; writing—review and editing, C.X.; visualization, C.X.; supervision, C.X.; project administration, R.F.; funding acquisition, C.X. All authors have read and agreed to the published version of the manuscript.

Funding

This work was supported by Chunlin Xiong of the National Social Science Foundation’s Key Project “Research on the Mechanisms for Generating and Improving the Effectiveness of Digital Governance in Rural Areas” (24AZZ010).

Institutional Review Board Statement

Not applicable.

Data Availability Statement

The data presented in this study are available on request from the corresponding author.

Conflicts of Interest

The authors declare no conflicts of interest.

References

  1. Zhang, K.; Yu, F.; Li, F.D. Coupling coordinated development of rural informatization, agricultural industrialization, and rural ecologicalization in China. China Popul. Resour. Environ. 2023, 33, 182–195. [Google Scholar]
  2. Xu, L.; Song, N. New Quality Productivity, Digital Rural Development and Chinese Style Agricultural and Rural Modernization. J. Gansu Inst. Public Adm. 2024, 6, 27–37+125. [Google Scholar]
  3. Liao, R.; Chen, Z. Study on the Influence Mechanism and Spatial Effect of the Construction of Digital Countryside on the Rural Modernization of Chinese Style Agriculture. J. Harbin Univ. Commer. (Soc. Sci. Ed.) 2025, 5, 101–116. [Google Scholar]
  4. Zhao, Y.; Zhao, X.; Yang, J. Coupling, Coordination, and Influencing Factors Between Digital rural development and Agricultural and Rural Modernization: Evidence from China. Agriculture 2024, 14, 1901. [Google Scholar] [CrossRef]
  5. Wang, W.; Li, F.; Zhang, Y. I Impacts of digital village construction on agricultural carbon emissions and its spatial spillover effects. J. Agric. Resour. Environ. 2026, 1–20. [Google Scholar] [CrossRef]
  6. Zhu, H.; Zhou, B. Impacts of digital rural pilot projects on agricultural carbon emissions. J. Agric. Resour. Environ. 2025, 42, 1468–1479. [Google Scholar]
  7. Xia, M.; Zeng, D.; Huang, Q.; Chen, X. Coupling coordination and spatiotemporal dynamic evolution between agricultural carbon emissions and agricultural modernization in China 2010–2020. Agriculture 2022, 12, 1809. [Google Scholar] [CrossRef]
  8. Shi, Z.; Wang, R. Research on the coupling coordination relationship between agricultural between agricultural mod ernization and carbon emission efficiency in China. Resour. Environ. Arid. Areas 2024, 38, 1–12. [Google Scholar]
  9. Chen, Y.; Chen, S. Model construction on the planning mode of rutal complexes based on coupled symbiotic theory. Chin. J. Agric. Resour. Reg. Plan. 2018, 39, 7–12. [Google Scholar]
  10. Yao, X.; Duan, Z.; Che, S.; Deng, X. Spatiotemporal Evolution and Driving Factors of the Coupling Coordination Between Digital Rural Construction and Agricultural Carbon Emissions. Environ. Sci. 2026, 1–25. [Google Scholar] [CrossRef]
  11. Liu, Y. The Impact and Mechanism of Digital Countryside Construction on the Modernization of Agriculture and Rural Areas. J. Shanxi Univ. (Philos. Soc. Sci. Ed.) 2024, 47, 152–160. [Google Scholar]
  12. Foellmi, R.; Zweimüller, J. Income Distribution and Demand-Induced Innovations. Rev. Econ. Stud. 2006, 73, 941–960. [Google Scholar] [CrossRef]
  13. Tu, S.; Meng, F. The Mechanism and Implementation Path of Artificial Intelligence Driving Agricultural Transformation and Upgrading. J. Nanjing Agric. Univ. (Soc. Sci. Ed.) 2026, 26, 1–12. [Google Scholar]
  14. Lu, L.; Wei, Z. Mechanism and Path of Digital Rural Construction Boosting the Modernization of Chinese-style Agriculture. J. South China Agric. Univ. (Soc. Sci. Ed.) 2024, 23, 12–22. [Google Scholar]
  15. Han, H.; Gong, Y. Spatial spillover effects of digital rural construction on carbon emissions from agriculture. Trans. Chin. Soc. Agric. Eng. 2025, 41, 298–307. [Google Scholar]
  16. Terence, S.; Purushothaman, G. Systematic review of the Internet of Things in smart farming. Trans. Emerg. Telecommun. Technol. 2020, 31, e3958. [Google Scholar] [CrossRef]
  17. Yang, X.; Wang, Y.; Wang, J. Testing the Impact and Mechanisms of Digital Rural Development on Agricultural Carbon Emission Intensity. Stat. Decis. Mak. 2023, 39, 66–71. [Google Scholar]
  18. Chen, Y.; Wang, S.; Lu, S. The Impact of Agricultural Products Trade on Agricultural Carbon Emissions—The Threshold Effect of Digital Rural Development. J. Huazhong Agric. Univ. (Soc. Sci. Ed.) 2022, 6, 45–57. [Google Scholar]
  19. Lu, Z.; Xu, M.; Shi, L.; Lei, T. The criticality of environmental sustainability in agriculture: The decarbonization role of green finance in China. J. Environ. Manag. 2025, 394, 127470. [Google Scholar] [CrossRef] [PubMed]
  20. Pei, W.; Pei, W. Digital rural development, green agricultural transformation, and digital inclusive finance. Financ. Res. Lett. 2025, 86, 108879. [Google Scholar] [CrossRef]
  21. Li, S.; Zhou, C.; Wang, S. Does Modernization Affect Carbon Dioxide Emissions? A Panel Data Analysis. Sci. Total Environ. 2019, 663, 426–435. [Google Scholar] [CrossRef]
  22. Balsalobre-Lorente, D.; Driha, O.M.; Bekun, F.V.; Osundina, O.A. Do agricultural activities induce carbon emissions? The BRICS experience. Environ. Sci. Pollut. Res. 2019, 26, 25218–25234. [Google Scholar] [CrossRef]
  23. Martens, M.; Karlsson, N.P.; Ehde, P.M.; Mattsson, M.; Weisner, S.E. The greenhouse gas emission effects of rewetting drained peatlands and growing wetland plants for biogas fuel production. J. Environ. Manag. 2021, 277, 111391. [Google Scholar] [CrossRef]
  24. Xu, Q.; Zhang, G. Spatial spillover effect of agricultural mechanization on agricultural carbon emission intensity: An empirical analysis of panel data from 282 cities. China Popul. Resour. Environ. 2022, 32, 23–33. [Google Scholar]
  25. Chen, H.; Zhang, X.; Wu, R.; Cai, T. Revisiting the environmental Kuznets curve for city-level CO2 emissions: Based on corrected NPP-VIIRS nighttime light data in China. J. Clean. Prod. 2020, 268, 121575. [Google Scholar] [CrossRef]
  26. Liu, Y.; Xu, S. Spatial Effects and Influencing Mechanisms of Agricultural Carbon Emission Reduction Enabled by Digital Rural Development. Environ. Sci. 2025, 46, 6198–6208. [Google Scholar]
  27. Liu, M.; Lu, F. Can Platform-based E-commerce Inclusion Boost Rural Residents’ Consumption? Evidence from Taobao Villages in China. Manag. Rev. 2023, 35, 155–168+193. [Google Scholar]
  28. Xie, J.; Guo, L. Research on the Mechanism and Effect of Digital Economy Empowering Agricultural Modernization. Theory Pract. Financ. Econ. 2025, 46, 123–128. [Google Scholar]
  29. Wu, H.; Zhao, D. Study on the Impact and Mechanism of Agricultural Modernization Development on Urban-Rural Income Gap. Tax. Econ. 2025, 5, 4–15+2. [Google Scholar]
  30. Wu, H.; Huang, H.; He, Y.; Chen, W. Measurement, spatial spillover and influencing factors of agricultural carbon emissions efficiency in China. Chin. J. Ecol. Agric. 2021, 29, 1762–1773. [Google Scholar]
  31. Tian, Y.; Lu, Y. Coupling Coordination Between New-type Urbanization and Agricultural Carbon Emission Efficiency in China’s Provinces. J. Huazhong Agric. Univ. (Soc. Sci. Ed.) 2023, 4, 33–46. [Google Scholar]
  32. Hou, Y.; Wang, Y.; Shi, H.; Geng, F.; Wang, Y. Coupling and coordination analysis of low-carbon agriculture in major grain-producing areas: From the perspective of agricultural carbon emission efficiency. Chin. J. Ecol. Agric. 2024, 32, 2022–2033. [Google Scholar]
  33. Xue, C.; Bing, B.; Xu, L. Identification of county-level integration models of primary, secondary, and tertiary industries and selection of appropriate models: Based on an analytical framework of government, market, and organization. Rural Econ. 2026, 2, 143–153. [Google Scholar]
  34. Li, Z.; Wu, W.; Yao, H.; Zhu, Y.; Li, Y. Spatio-temporal evolution and driving mechanism of coupling coordination between new urbanization and agricultural modernization in the Yellow River Basin. Geogr. Arid. Areas 2025, 48, 1878–1891. [Google Scholar]
  35. Wang, L.; Liu, X.; Li, X.; Wang, Y. Analysis of Spatio-temporal Characteristics and Influencing Factors of Chinese-style Agricultural and Rural Modernisation. J. Manag. Stud. 2024, 37, 1–17. [Google Scholar]
  36. Qiao, J.; Jie, X. Spatial pattern and driving mechanism of the coordinated development of rural revitalization and new urbanization in the middle and lower reaches of the Yellow River. Adv. Geogr. 2024, 43, 417–433. [Google Scholar]
  37. Yang, C.; Zhang, Y. Study on the coupling of agricultural carbon emission efficiency and food security in major grain-producing areas. Chin. J. Agric. Resour. Reg. Plan. 2024, 45, 12–27. [Google Scholar]
  38. Tone, K. A slack-based measure of efficiency in data envelopment analysis. Eur. J. Oper. Res. 2001, 130, 498–509. [Google Scholar]
  39. Li, Q.; Li, G.; Yin, C. Regional differences and convergence of China’s agricultural green development level: Empirical analysis based on the panel data of prefecture-level cities. J. China Agric. Univ. 2022, 27, 230–242. [Google Scholar]
  40. Liu, M.; Lu, F. Can Platform‑based E‑commerce Inclusion Drive Consumption? Evidence from Taobao Villages in China. Manag. Rev. 2023, 35, 155–168, 193. [Google Scholar]
  41. Wu, D.; Du, N.; Wang, L.; Wu, Y.; Zhang, S.; Zhou, B.; Zhang, X. Estimation of PM2.5 Hourly Concentration in Sichuan Province Based on GTWR-XGBoost Model. Environ. Sci. 2023, 44, 3738–3748. [Google Scholar]
  42. Huang, B.; Wu, B.; Barry, M. Geographically and temporally weighted regression for modeling spatio-temporal variation in house prices. Int. J. Geogr. Inf. Sci. 2010, 24, 383–401. [Google Scholar] [CrossRef]
  43. Zhou, X.; Zhang, Y. Administration or marketization: Environmental regulation, marketization and agricultural green total factor productivity. J. Environ. Manag. 2024, 370, 122433. [Google Scholar] [CrossRef] [PubMed]
  44. Zhang, L.; Gao, S.; Yu, R. Scale Effect in the Willingness to Adopt Carbon Sink Technologies by Agricultural Land Operation Entities. Rural Econ. 2026, 2, 123–132. [Google Scholar]
  45. Ge, R.; Wang, G.; Niu, K. Drivers, decoupling effects, and implications of carbon emissions from China’s agri-food systems. J. Nat. Resour. 2026, 41, 288–307. [Google Scholar] [CrossRef]
  46. Geng, N.; Han, X.; Wang, S. Mechanisms and effects of agricultural socialized services driving green and low-carbon utilization of cultivated land. China Popul. Resour. Environ. 2025, 35, 139–149. [Google Scholar]
Figure 1. “Technology–Industry–Ecosystem” Coupling and Coordination Analysis Framework.
Agriculture 16 01135 g001
Figure 2. Trends in digital village development, agricultural modernization, and agricultural carbon emission efficiency.
Agriculture 16 01135 g002
Figure 3. Spatial distribution of digital village development in 2011, 2018 and 2024.
Agriculture 16 01135 g003
Figure 4. Spatial distribution of agricultural modernization in 2011, 2018 and 2024.
Agriculture 16 01135 g004
Figure 5. Spatial distribution of agricultural carbon emission efficiency in 2011, 2018 and 2024.
Agriculture 16 01135 g005
Figure 6. Spatial distribution of coupling coordination degree of digital village development, agricultural modernization, and agricultural carbon emission efficiency in 2011, 2018 and 2024.
Agriculture 16 01135 g006
Figure 7. Driving mechanism of the coupling coordination among digital village development, agricultural modernization, and agricultural carbon emission efficiency.
Agriculture 16 01135 g007
Figure 8. Spatial distribution of the influence of explanatory variables on the coupling coordination degree 2011–2024.
Agriculture 16 01135 g008
Table 1. Digital Village Development Indicator System.
Primary IndicatorsSecond-Level IndicatorsTertiary IndicatorsMeasurement MethodAttributes
Digital Village DevelopmentRural Digital InfrastructureInternet Penetration RateNumber of Internet Users in the Region/Total Population of the Region (%)+
Mobile Phone CoverageNumber of mobile phones per 100 rural households+
Fiber-optic line coverageLength of optical fiber lines per square kilometer (km)+
Fixed investment in digital servicesFixed-asset investment in the computer services and software industry (10,000 yuan)+
Fixed investment in the social services sectorFixed Asset Investment in Transportation, Warehousing, and Postal Services (10,000 yuan)+
Digitalization of Rural ProductionDigital HubsNumber of Taobao Villages (units)+
Agricultural Meteorological Observation StationsAgricultural Meteorological Observation Stations (units)+
Digital and Electrified ProductionValue Added in Agriculture, Forestry, Animal Husbandry, and Fisheries/Total Rural Electricity Consumption (%)+
Digitalization of Rural OperationsNumber of corporate websitesNumber of websites per 100 enterprises+
E-commerce Activity LevelPercentage of enterprises engaged in e-commerce activities+
rural online sales and purchasesTotal value of goods and services sold and procured via online orders (billion yuan)+
Digitalization of rural circulationLevel of Rural Consumer Goods SalesRural retail sales of consumer goods/Total retail sales of goods (%)+
Rural delivery routesRural Postal Delivery Routes (km)+
Percentage of Administrative Villages with Postal ServicePercentage of Administrative Villages with Postal Service (%)+
Level of Rural Telecommunications ServicesAverage number of people served per rural postal service outlet (people/outlet)+
Note: A Taobao Village is an administrative village identified by Alibaba Group that primarily uses Taobao.com as its main trading platform, with an annual e-commerce transaction volume exceeding RMB 10 million and more than 100 active online shops. It is a representative indicator of the deep integration of rural e-commerce and production–sales networks in China [27].
Table 2. Agricultural Modernization Indicator System.
First-Level IndicatorsSecond-Level IndicatorsTertiary IndicatorsMeasurement MethodAttribute
Agricultural ModernizationModernization of the Agricultural IndustryLevel of MechanizationTotal Agricultural Machinery Power/Rural Population+
Agricultural Industrial StructureLivestock Industry Output Value/Total Output Value of Agriculture, Forestry, Animal Husbandry, and Fisheries+
Level of Agricultural Product ProcessingTotal Output Value of Agricultural Product Processing/Agricultural Output Value+
Modernization of Agricultural OperationsAgricultural Insurance PenetrationAgricultural Insurance Premium Income/Number of Employees in the Primary Sector+
Level of Agricultural Credit ServicesOutstanding agricultural loans/Number of people employed in the primary sector+
Degree of Agricultural Production CooperationNumber of farmer cooperatives per 10,000 rural residents+
Level of agricultural modernizationLevel of grain productionGrain output/Total grain-sown area+
Level of Farmland IrrigationEffective Irrigated Area/Total Cropland Area+
Level of rural human capitalAverage years of schooling for the rural labor force+
Table 3. Agricultural Carbon Emission Efficiency Indicator System.
Level 1 IndicatorsSecondary IndicatorsUnitUnit
Input factorsLabor forceEmployees in the primary sector100,000
Chemical FertilizersChemical Fertilizer Application10,000 t
PesticidesPesticide application10,000 t
Agricultural filmAgricultural film usage10,000 t
Agricultural machineryTotal power of agricultural machinery10,000 kWh
LandCrop planting area10,000 ha
Expected OutputTotal agricultural outputTotal agricultural output100 million yuan
Non-targeted outputAgricultural carbon emissionsAgricultural carbon emissions10,000 t
Table 4. Indicators of Factors Influencing the Coupling and Coordination Degree Between Digital Rural Development, Agricultural Modernization, and Agricultural Carbon Emission Efficiency.
Primary IndicatorsSecond-Level IndicatorsIndicator DescriptionAttribute
MarketMarketization IndexMarketization Index Scores by Region+
Agricultural Land Transfer RateProportion of Total Transferred Farmland Under Household Contracts Relative to Total Farmland Under Household Contracts by Region+
GovernmentLevel of Government Agricultural ExpendituresAmount of agriculture-related expenditures/Local general public budget expenditures+
Level of Rural Digital InfrastructurePercentage of administrative villages with broadband internet access (%)+
SocialSocial Consumption LevelTotal retail sales of consumer goods/Gross regional product+
Level of Agricultural Socialized ServicesOutput value of agriculture, forestry, animal husbandry, and fisheries/Total cropland area+
Table 5. Robustness test of weights for digital village development, agricultural modernization, and agricultural carbon emission efficiency.
SchemeDigital Village DevelopmentAgricultural ModernizationAgricultural Carbon Emission EfficiencyCorrelation Coefficient
Original1/31/31/31.000
Scheme 10.30.40.30.994 ***
Scheme 20.40.250.350.992 ***
Note: * p < 0.05, ** p < 0.01, *** p < 0.001.
Table 6. Classification of Coupling Coordination Levels for Digital Rural Development, Agricultural Modernization, and Agricultural Carbon Emission Efficiency.
Coupling CoordinationLevelCoupling CoordinationLevel
0.000–0.099Extreme imbalance0.500–0.599Barely coordination
0.100–0.199Serious imbalance0.600–0.699Primary coordination
0.200–0.299Moderate imbalance0.700–0.799Intermediate coordination
0.300–0.399Mild imbalance0.800–0.899Good coordination
0.400–0.499Near disorder0.900–1.00Extreme coordination
Table 7. Moran’s I for digital village development, agricultural modernization, and agricultural carbon emission efficiency, 2011–2024.
YearDigital Village DevelopmentAgricultural ModernizationAgricultural Carbon Emission Efficiency
Moran’s IZ-ValueMoran’s IZ-ValueMoran’s IZ-Value
2011−0.0180.1440.282 ***0.2820.118 *1.375
2012−0.0160.1630.335 ***3.3310.1011.210
2013−0.0200.1330.394 ***3.8740.0740.973
2014−0.0190.1400.388 ***3.8010.0891.101
2015−0.0080.2380.386 ***3.7970.1001.194
20160.0190.4780.404 ***4.0050.157 **1.712
20170.0310.5910.423 ***4.1700.144 *1.591
20180.0740.9930.447 ***4.3800.170 **1.843
20190.105 *1.3120.430 ***4.2510.214 **2.256
20200.162 **1.8390.396 ***3.9480.195 **2.089
20210.221 ***2.3780.400 ***3.9820.224 ***2.350
20220.265 ***2.7400.409 ***4.0500.193 **0.193
20230.291 ***2.9510.439 ***4.3520.0851.087
20240.211 ***2.2170.471 ***4.6630.140 **1.559
Note: * p < 0.05, ** p < 0.01, *** p < 0.001.
Table 8. Ordinary Least Squares (OLS) model estimation results.
VariableCoefficient (t-Statistic)StdVIF1/VIF
Marketization Index0.021 *** (5.14)0.0044.410.226
Agricultural Land Transfer Rate0.148 *** (5.17)0.0291.900.525
Level of Government Agricultural Expenditures0.014 *** (8.25)0.0022.490.401
Level of Rural Digital Infrastructure−0.000 (−0.00)0.0001.090.916
Social Consumption Level−0.147 *** (−2.43)0.0601.340.745
Level of Agricultural Socialized Services1.548 *** (10.64)0.1451.230.812
Constant0.142 *** (3.42)0.042
Note: * p < 0.05, ** p < 0.01, *** p < 0.001.
Table 9. Comparison of model parameter results.
ParameterOlSGWRGTWR
R20.4290.7970.799
R2 Adjusted0.4200.7940.796
AICc−973.803−1359.27−1299.05
Bandwidth 0.1140.114
Residual Squares 0.8330.826
Sigma 0.0420.044
Table 10. Significance Statistics.
Driving FactorsNumber of Significant SamplesProportion of Significant Samples
Marketization Index14033.33%
Agricultural Land Transfer Rate30873.33&
Level of Government Agricultural Expenditures29470.00%
Level of Rural Digital Infrastructure4310.24%
Social Consumption Level23856.67%
Level of Agricultural Socialized Services36083.33%
Disclaimer/Publisher’s Note: The statements, opinions and data contained in all publications are solely those of the individual author(s) and contributor(s) and not of MDPI and/or the editor(s). MDPI and/or the editor(s) disclaim responsibility for any injury to people or property resulting from any ideas, methods, instructions or products referred to in the content.