Article

Sustainable Intensification of Feed Production Through Intercropping of Cereals and Legumes: The Role of Nitrogen Fertilization in Shaping the Circulation of Micronutrients


by
Rafał Górski
1,*,
Anna Płaza
2,
Alicja Niewiadomska
3,
Agnieszka Wolna-Maruwka
3,
Marcin Niemiec
4,
Monika Komorowska
4,
Abduaziz Abduvasikov
5,
Shakhista Ishniyazova
6 and
Mansur Tukhtamishev
5
1
Faculty of Engineering and Economics, Ignacy Mościcki University of Applied Sciences in Ciechanów, 06-400 Ciechanów, Poland
2
Institute of Agriculture and Horticulture, Faculty of Agricultural Sciences, University of Siedlce, 08-110 Siedlce, Poland
3
Department of Soil Science and Microbiology, Poznań University of Life Sciences, 60-637 Poznań, Poland
4
Department of Agricultural and Environmental Chemistry, University of Agriculture in Krakow, 30-120 Kraków, Poland
5
Faculty of Agroeconomics, Logistics and Services, Tashkent State Agrarian University, Universitet Ko’chasi 2, Tashkent 100142, Uzbekistan
6
Department of Processing Technology, Standardization and Certification of Agricultural Products, Faculty of Processing Technology and Product Standardization, Samarkand State University of Veterinary Medicine, Livestock and Biotechnology, Samarkand 140103, Uzbekistan
*
Author to whom correspondence should be addressed.
Agriculture 2026, 16(10), 1038; https://doi.org/10.3390/agriculture16101038
Submission received: 23 March 2026 / Revised: 7 May 2026 / Accepted: 8 May 2026 / Published: 11 May 2026

Abstract

In the context of sustainable agriculture and the need to reduce mineral nitrogen inputs, intercropping cereals with legumes is increasingly considered a promising strategy to enhance nutrient use efficiency and improve feed quality. However, the effects of such systems, combined with varying nitrogen fertilization levels, on the dynamics of micronutrients in soil and plant biomass remain insufficiently explored. Field research was conducted in central Poland, in Ciechanów, from 2021 to 2023, during the months of April through July each year. The aim of the study was to analyze the impact of intercropping spring barley and spring triticale with narrowleaf lupin and varying mineral nitrogen fertilization (0–60 kg N ha−1) on the concentration and uptake of Mn, Cu, Zn, and Fe in the soil and green matter intended for fodder. It was shown that both the sowing pattern and the level of N fertilization significantly differentiated the concentration of microelements in the soil and their concentration and uptake with the yield. As the proportion of lupine in the mixture increased, the post-harvest soil showed higher concentrations of Mn (2–8%), Cu (2–9%), Zn (9–33%), and Fe (4–10%), accompanied by a marked increase in their levels in green matter, ranging from 6% to 94% depending on the micronutrient. The highest uptake of micronutrients was obtained in intercropping systems with a predominance of legumes, especially with moderate fertilization (40–60 kg N ha−1), where the growth ranged from 16% to as much as 139%. Compared to single-species crops, the intercropping system was characterized by higher efficiency of soil resource use and better mineral quality of the feed. The results indicate that the integration of legumes with cereals can be an effective tool for improving feed security while reducing the intensity of mineral fertilization, in line with the principles of sustainable agriculture.

1. Introduction

Manganese (Mn), copper (Cu), zinc (Zn), and iron (Fe) are micronutrients required in low concentrations to support proper growth and development of both plants and livestock [1,2]. Their importance arises from their active participation in cellular metabolic pathways, where they act either as structural elements or activators of enzymes involved in a wide range of biochemical processes [3]. Thus, micronutrient deficiencies inhibit the proper development of plants, leading to reduced yields and quality, but an excessive presence of these elements can also have toxic effects [4]. In farm animals, micronutrients are distributed throughout all tissues and organs, playing an important role in their functioning. Enzymes, in turn, use micronutrients in metabolic reactions in cells. As in plants, both too low and too high micronutrient levels in animals can lead to developmental and performance disorders [5]. Micronutrient deficiencies in livestock, resulting mainly from their low concentration in feed, pose a significant problem in animal production [6]. These most commonly involve Cu and Zn, but Mn and Fe are also important [7]. Deficiencies in these minerals lead to numerous health disorders, including weakened immunity, metabolic diseases, and increased susceptibility to infections [8]. Additionally, negative effects on reproduction are observed, including reduced fertility, estrous cycle disorders, and problems with maintaining pregnancy [9]. In dairy cows, these deficiencies also lead to declines in milk yield and quality, particularly during early lactation, when mineral demand is highest [10]. Therefore, it is important to provide feed with an adequate mineral concentration.
The efficiency of nutrient absorption by plants is largely influenced by their concentration in the soil, along with soil water concentration and environmental conditions [11]. An important factor influencing the microelement concentration in crops is also the agricultural techniques used and the species of plants cultivated [12]. Among the determining factors that influence micronutrient accumulation in crops are agronomic practices and plant species [13]. Phosphate fertilizers generally contain micronutrients, so their use, like that of animal manure, can increase the concentration of these minerals in the soil [14,15]. In the case of potassium and nitrogen fertilizers, however, micronutrient concentrations are not specified, and little research attention has been paid to their impact on changes in micronutrient concentration in the soil [1]. The availability of micronutrients to plants is also significantly influenced by soil properties, including pH and organic matter concentration [16]. The use of mineral fertilizers in agriculture, especially nitrogen fertilizers, lowers soil pH, which can lead to increased mobility and thus increased availability of Mn, Cu, Zn, and Fe to plants [17]. However, it should be borne in mind that the intensive use of mineral fertilizers undoubtedly increases yields and farmers’ profits, but it also harms the environment and biodiversity [18,19]. Therefore, around the world, increasing attention is being paid to sustainable agriculture that does not compromise ecological resources and mitigates climate change [20]. As a result, traditional agricultural practices applied in recent decades are gradually being replaced by more sustainable approaches that support food and feed security while addressing environmental concerns [21]. In intercropping legumes and cereals, it is also important to limit excessive nitrogen fertilization, as high doses of mineral nitrogen can inhibit the symbiotic nitrogen fixation process in lupins and disrupt the interspecies balance within the crop stand [22,23]. Therefore, in the field experiment, the maximum nitrogen dose was limited to 60 kg N·ha−1, a level that supports cereal growth without significantly limiting the biological activity of lupin. The quality of feed is characterized by its chemical composition and its effectiveness in delivering key nutrients, including proteins, minerals, vitamins, and energy, necessary for the proper development of farm animals [24]. The mineral profile of feed is largely determined by factors such as plant species, harvest stage, environmental conditions, and the fertility status of the soil [25,26,27]. Legumes and cereals differ significantly in their mineral profiles, making it possible to achieve a more balanced and diversified feed supply when combined [28]. Therefore, in recent decades, intercropping has been gaining renewed interest around the world as a way to improve sustainable crop production [29]. Numerous field experiments have demonstrated the benefits of intercropping legumes and cereals, such as higher yields and yield stability [30], more efficient use of resources, including nutrients, light and water, and, as a result, reduced demand for mineral fertilizers [23], reduction in the occurrence of weeds [31] and pests [32], and improvement in soil biophysical quality and fertility [33]. According to the summary by Justes et al. [34], there are many interaction mechanisms between co-cultivated species, which they defined as the “4C approach”: competition, complementarity, cooperation, and compensation. Rossi et al. [22] additionally point out that this approach applies to both the above-ground and below-ground parts of intercropped plants. Research conducted by other authors has shown that both cereals and legumes produced a more developed root system in intercropping compared to single cropping [35,36]. To achieve the benefits of intercropping mentioned above, the appropriate selection of species is also crucial [27]. In addition to the previously mentioned benefits of intercropping legumes and cereals, a key criterion for species selection was the similar timing of plant development and maturation. Barley and triticale reach their harvestable stages at a similar time as lupin, which allows for simultaneous harvesting and reduces technological problems associated with intercropping [37,38]. At the same time, differences in growth rates—faster development of cereals and slower initial growth of lupin—promote complementarity, limiting interspecific competition and improving the utilization of environmental resources.
Considering the importance of intercropping systems and N fertilization in shaping nutrient dynamics in agroecosystems, it was assumed that both factors may significantly influence the availability and uptake of micronutrients. Therefore, the following research hypotheses were formulated: 1. The intercropping system of narrowleaf lupine with cereals (barley and spring triticale) significantly affects the concentration of micronutrients (Mn, Cu, Zn, Fe) in postharvest soil compared to sole cropping; 2. The proportion of components in the sowing mixture significantly influences the concentration and uptake of micronutrients in plant green biomass; 3. Nitrogen fertilization significantly affects the concentration and uptake of micronutrients in plants as well as their concentration in postharvest soil; 4. There is a significant interaction between the cropping system and nitrogen fertilization in shaping the concentration and uptake of micronutrients (Mn, Cu, Zn, Fe) in plants and their concentration in soil.

2. Materials and Methods

2.1. Research Methodology

The field study was conducted over three successive growing seasons (2021–2023) in central Poland, near Ciechanów, under temperate climatic conditions. According to soil-agricultural maps provided by the Head Office of Geodesy and Cartography [39], and their correlation with the Polish Soil Classification [40,41], the soils of the study area are classified as texturally contrasted clay-illuvial soils. According to the World Reference Base for Soil Resources [42], these soils can be classified as Haplic and Geoabruptic Luvisols (Epiarenic, Endoloamic). Clay-illuvial soils are the most widely distributed and agriculturally used soil type in the country [43]. The studied soils are characterized by a loamy sand texture in the surface horizons and a sandy clay loam texture in the lower parts of the soil profiles, according to soil texture information provided by soil-agricultural maps [39,44]. The baseline soil characteristics before the experiment are presented in Table 1. Before the experiment started, soil samples were collected from depths ranging from 0 to 30 cm to determine pH, organic carbon, and macro- and micronutrients. To determine the total N availability, soil samples were collected from depths of 0–30 cm and 30–60 cm.
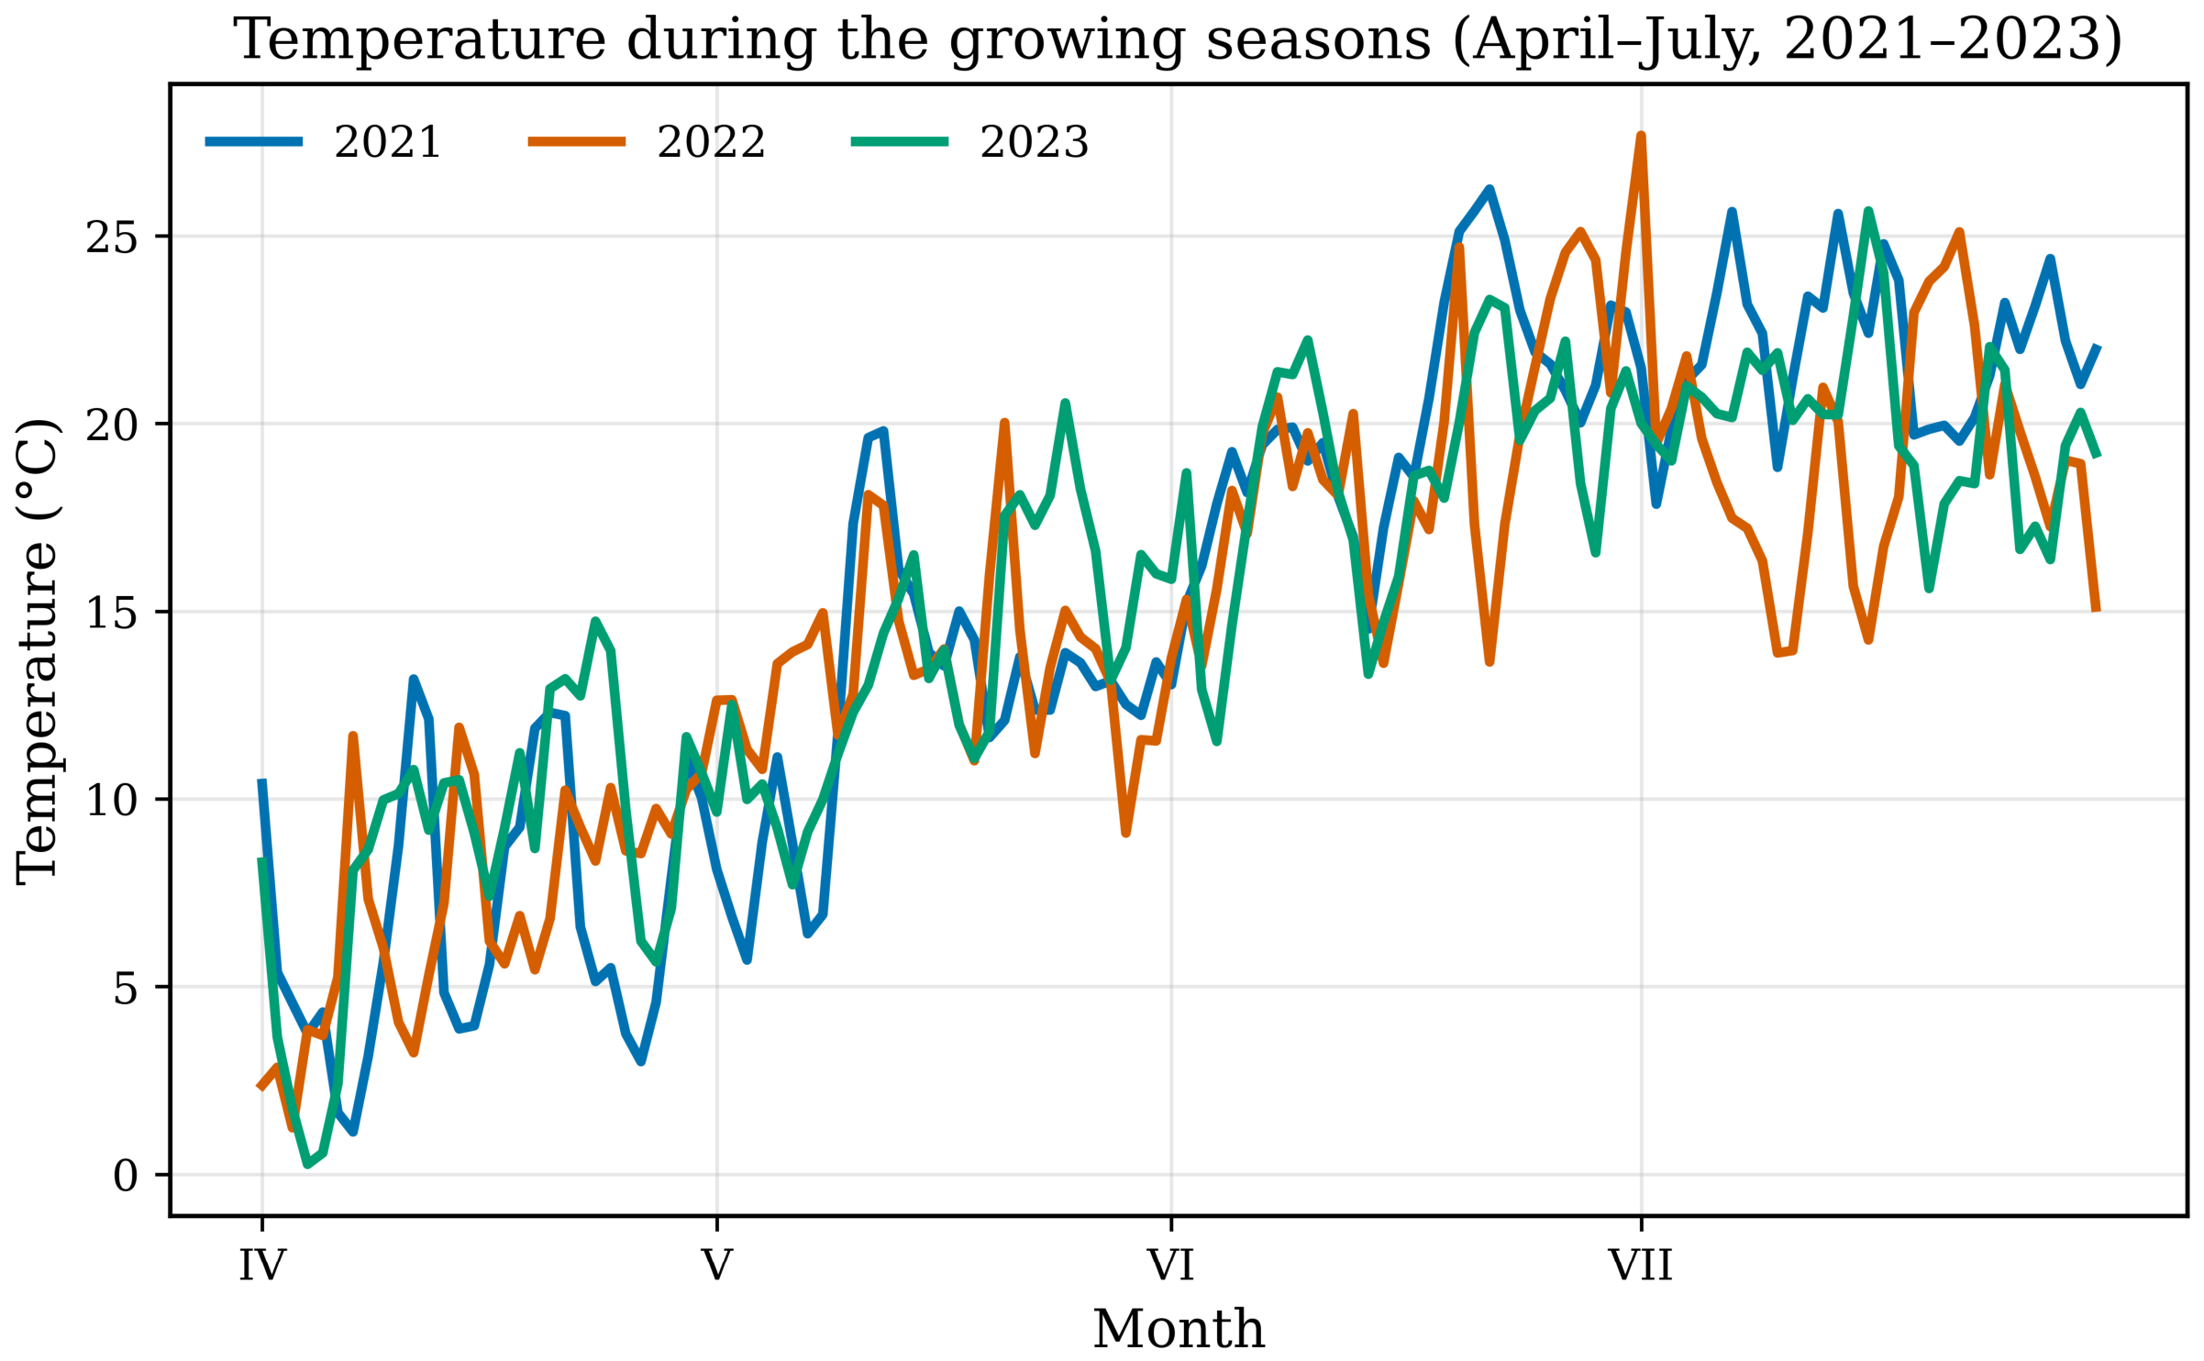
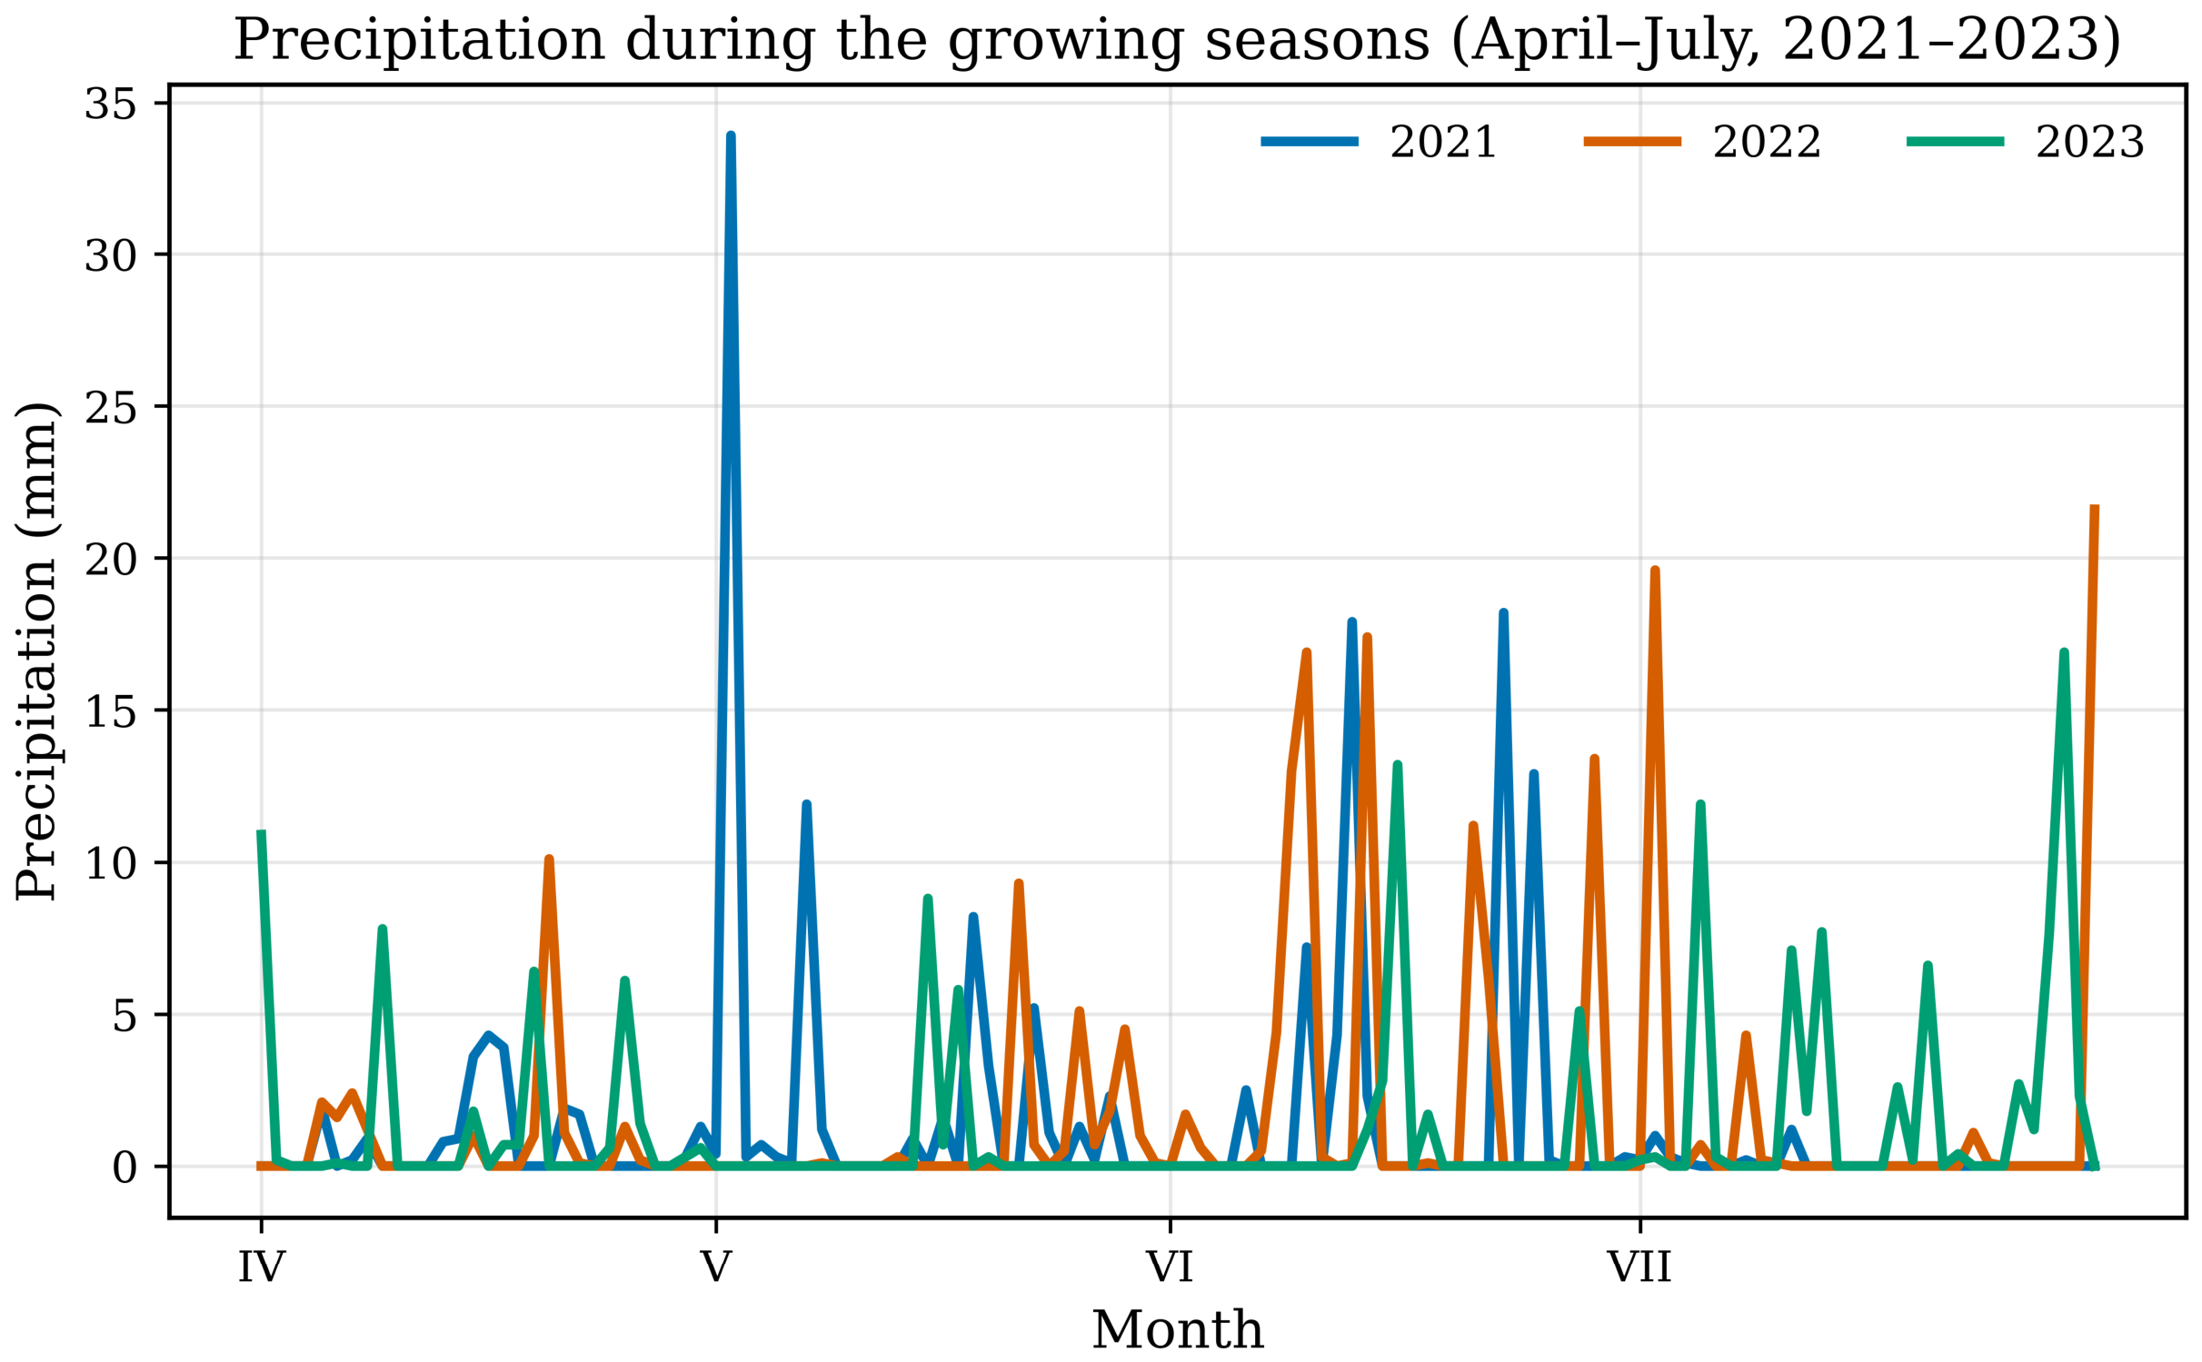
According to the Köppen–Geiger climate classification, the region is located in a snowy, humid zone with warm summers [45]. The average annual air temperature ranges from 7 to 8 °C, while the average annual precipitation ranges from 500 to 550 mm, making it one of the lowest mean annual values in Poland [46]. Meteorological data for each growing season were obtained from the weather station of the Ignacy Mościcki University of Applied Sciences in Ciechanów and are summarized in Figure 1.

2.2. Agrotechnological Practices

The study was carried out each year using a randomized layout with three replicates. Individual plots had an area of 20 m2 (4 m × 5 m). Two experimental factors were investigated: (1) the share of individual species in the sowing intercropping (Table 2), and (2) mineral nitrogen fertilization applied at four levels: 0, 20, 40, and 60 kg N ha−1.
In all years, oats served as the preceding crop. Before sowing, uniform basal fertilization was applied across all treatments at rates of 100 kg K ha−1 and 35 kg P ha−1. Before sowing, narrowleaf lupin seeds were treated with Bradyrhizobium lupini. The inoculum, containing 2 × 10⁹ CFU mL−1, was applied at a rate of 500 mL diluted in 1000 mL of water per 120 kg of seeds. Sowing was performed each April. In monoculture, seeding rates followed cultivar recommendations. In intercropping treatments, component proportions were established at 25:75%, 50:50%, and 75:25%. The crops were sown in two separate passes: narrowleaf lupine was sown first, followed by spring triticale or spring barley. Row spacing was maintained at 20 cm. After sowing, light harrowing was carried out to ensure proper seed coverage.

2.3. Data Collection

The crops were harvested at the flat green pod stage of narrowleaf lupin from an area of 1 m2 for each experimental treatment. The harvest date for the intercrop was determined based on previous field studies as the optimal harvesting stage in terms of biomass yield and chemical composition [26,47]. Immediately after harvesting, the narrowleaf lupin, spring barley, and spring triticale plants were separated. To determine dry matter yield, plant samples were dried at 65 °C to constant weight using an Ecocell 111 BMT (BMT Medical Technology, Brno, Czech Republic) drying oven. The dry matter was then ground and samples were prepared according to the proportion of individual plants in the yield for chemical analysis. The concentrations of Fe, Mn, Zn, and Cu in plant samples were measured using inductively coupled plasma atomic emission spectrometry (ICP-AES) following wet digestion in concentrated nitric acid in accordance with ISO 6869 [48]. The uptake of Fe, Mn, Zn, and Cu was determined as the product of the concentration and dry matter yield. Immediately after harvesting the crops from each experimental treatment, soil samples were taken from the topsoil layer (0–30 cm) in an amount of approximately 100 g. Soil samples were airdried, ground, and passed through a 2 mm sieve. The available forms of micronutrients (Cu, Zn, Mn, Fe) were extracted using a 1 mol·dm−3 HCl solution. Their concentrations were subsequently determined by ICP-AES in accordance with PN-R-04021:1994 [49]. All analyses were carried out in an accredited laboratory operating in accordance with PN-EN ISO/IEC 17025:2018-02.

2.4. Statistical Analysis

Data were analyzed by analysis of variance (ANOVA) to determine the effects of experimental factors and their interactions on micronutrient concentration and uptake, as well as soil micronutrient levels (Supplementary Materials, Table S1). The three years of the field experiment were treated as environmental replications, because the primary objective of the study was to evaluate the average response of micronutrient concentration and uptake to the intercropping system and nitrogen fertilization across variable field conditions. Year-to-year variability in meteorological conditions was considered part of the environmental background influencing the experimental results. The significance of effects was evaluated using the Fisher–Snedecor F-test (p ≤ 0.05), and mean comparisons were performed using Tukey’s HSD test (p ≤ 0.05). Pearson’s correlation coefficients were calculated to assess relationships among the studied variables. Statistical analyses were carried out using Statistica 13.3 (Hamburg, Germany).

3. Results

3.1. Microelement Concentration in Soil After Intercropping

The concentration of Mn, Cu, Zn, and Fe in the soil after intercropping was significantly differentiated by the level of mineral N fertilization and the intercropping pattern. A statistically significant interaction between intercropping and mineral nitrogen fertilization was found only for the iron concentration in the soil (Table 3, Table 4, Table 5 and Table 6).
Under the influence of the intercropping pattern, the highest Mn concentration in the soil was found after narrowleaf lupine cultivation, and the lowest after barley and spring triticale cultivation. Increasing the amount of narrowleaf lupine sown in intercropping resulted in a significant increase in Mn concentration in the soil. In the case of intercropping spring barley with narrowleaf lupine, an increase of 2 to 6% was recorded, while in the case of spring triticale, an increase of 4 to 8% was recorded compared to single cereal crops. Among the intercropping, the highest levels of Mn in the soil were found after crops I2, I3, I5, and I6. Concerning mineral N fertilization, increasing the level of fertilization resulted in an increase in Mn concentration in the soil after the end of cultivation. The lowest values were found in the absence of fertilization and at 20 kg N ha−1, while the highest values were found at 60 kg N ha−1. The difference between the highest fertilization and the control treatment without fertilization was 10%.
The sowing pattern also had a significant effect on the Cu concentration in the soil. The lowest concentrations were recorded in single cereal cultivation and in intercropping I1 and I4. In turn, the highest concentration was recorded in I6, but it did not differ statistically from I3 and single narrowleaf lupine cultivation. In the case of I6, the Cu concentration in the soil was 9% higher than in the case of single-crop ryegrass, while in the case of I3, it was 5% higher than in the case of barley cultivation. The highest value obtained with fertilization of 60 kg N ha−1 was 12% higher than in the treatments where N fertilization was not used.
As a result of diversified crop sowing, the Zn concentration in the soil after harvest also changed significantly. The lowest concentration was found after cereal cultivation, and the highest after narrowleaf lupine and intercropping I3. The addition of narrowleaf lupine significantly increased the Zn concentration in the soil from 9 to 30% in the case of intercropping of narrowleaf lupine and spring barley (I1–I3) and from 9 to 33% in the case of narrowleaf lupine intercropped with spring triticale (I4–I6). Mineral N fertilization also caused a significant increase in Zn concentration in the soil. Significantly, the lowest Zn concentration was recorded in experimental treatments where mineral N fertilization was not applied. A further increase in the level of mineral fertilization resulted in an increase in Zn concentration in the soil from 12 to 30% compared to the control plots.
Intercropping caused significant variation in Fe concentration in the soil. Significantly, the highest concentration was found after the cultivation of narrowleaf lupine, and among intercrops with a predominance of narrowleaf lupine sowing in I3 and I6. In I3, an increase of 9% was recorded in relation to the spring barley treatments, while in I6, an increase of 10% was recorded in comparison to the soil after sowing spring triticale. As a result of increasing mineral N fertilization, an increase of 2 to 7% was observed in comparison to the treatments where no fertilization was applied. The highest Fe concentration in the soil after the analyzed crops was found after the highest mineral N fertilization (60 kg N ha−1). The interaction between intercropping and mineral N fertilization in relation to the Fe concentration in the soil showed that with fertilization in the range of 0–40 kg N ha−1, the highest values were recorded after narrowleaf lupine cultivation, followed by statistically lower values for crops I3 and I6. However, at a fertilization rate of 60 kg N ha−1, both the soil after narrowleaf lupin cultivation and after intercropping with a predominance of legumes in the sowing (I3 and I6) showed the same statistical level. Significantly, the lowest Fe concentration was found at all analyzed fertilization levels after single cereal cultivation.

3.2. Microelement Concentration in the Green Matter of Intercropping

The concentration of the analyzed micronutrients (Mn, Cu, Zn, and Fe) in the green matter of the analyzed crops was significantly differentiated by crop sowing patterns and mineral N fertilization. A significant interaction between intercropping and mineral N fertilization was also demonstrated for all analyzed micronutrients (Table 7, Table 8, Table 9 and Table 10).
The highest concentration of all analyzed micronutrients was found in the green matter of narrowleaf lupine. The lowest value was found in the green matter of barley and spring triticale. The exception was the Zn concentration, which was statistically higher in the green matter of spring barley than in spring triticale. When analyzing the microelement concentration in the green matter of intercropped crops, the addition of narrowleaf lupine to cereal sowing and increasing its share resulted in an increase in microelement concentration.
The Mn concentration in the green matter of narrowleaf lupine in intercropping with spring barley increased from 25 to 92% with increasing lupine proportion in the sowing, while in the case of lupine in intercropping with spring triticale, it increased from 27 to 94% compared to the single crops of the analyzed cereals. An increase in the average Mn concentration in the green matter of crops was also observed as a result of increased mineral N fertilization. The lowest value was obtained for the treatment where mineral N fertilization was not used. A gradual increase in N fertilization resulted in an increase in Mn concentration from 15 to 58% obtained at the maximum analyzed N fertilization. The interaction between intercropping and mineral N fertilization showed the lowest Mn concentration in cereals for all fertilization levels and the highest in narrowleaf lupine. With regard to intercropping, crops I3 and I6 showed the same significantly highest Mn concentration in green matter, except for fertilization with 20 kg N ha−1, where the Mn concentration was significantly higher in I3 than in I6.
The Cu concentration in the green matter of intercropping showed a statistically significant increase with increasing sowing rates of narrowleaf lupine. In the case of intercropping with spring barley, the increase ranged from 8 to 17%, while in the case of intercropping with spring rye, it ranged from 9 to 22%. In addition, I6, which included spring triticale, showed a higher Cu concentration compared to I3, which included spring barley. Concerning the second main effect, the highest Cu concentration was recorded in crops with the highest level of fertilization, and the lowest in the absence of mineral N fertilization. The average difference between these treatments was 15%. The interaction revealed the highest Cu concentration in the green matter of narrowleaf lupine and the lowest in cereals, regardless of the fertilization level. When analyzing intercropping, the highest concentrations were found in crops with a predominance of narrowleaf lupine. When fertilized with 60 and 20 kg N ha−1, I3 and I6 showed the same Cu level, while when fertilized with 40 and 0 kg N ha−1, I6 showed higher values than I3.
The lowest statistical Zn concentration was found in the green matter of cereals. However, the concentration in barley green matter was higher than that in triticale. A gradual increase in the proportion of narrowleaf lupine in intercropping with cereals resulted in a significant increase in the Zn concentration in the green matter obtained. In the case of cultivation with barley, an increase of 6 to 31% was recorded, while with spring triticale, an increase of 8 to 39% was recorded. In addition, the individual sowing proportions, regardless of the type of cereal, showed the same statistical level between the treatments. With regard to the effect of mineral N fertilization, an increase in the N dose resulted in an increase in the average Zn concentration in the green matter. In the case of treatments without N fertilization, increasing fertilization resulted in an increase of 5, 14, and 19%, respectively. The revealed interaction showed the lowest Zn concentration in the green matter of spring triticale. Only fertilization with 60 kg N ha−1 equalized the Zn concentration between barley and triticale. Among the intercropping systems, regardless of the fertilization level, I3 and I6 had the highest concentrations.
With regard to the Fe concentration in the green matter of crops, the lowest values were recorded in the green matter of cereals. As with other micronutrients, the addition of narrowleaf lupine in the intercropping mixture increased the Fe concentration in the green matter. In intercropping with spring barley, the increase ranged from 21 to 84%, and with spring triticale, from 26 to 82%. The highest concentrations were determined in I3 and I6, but statistically the highest was in I3. A gradual increase in N fertilization resulted in a significant increase in the Fe concentration in the green matter of crops. The highest concentration was obtained with fertilization of 60 kg N ha−1, which was 42% higher than in treatments without mineral fertilization. The interaction between intercropping and mineral N fertilization showed the highest Fe concentration in the green matter of lupins and the lowest in cereals, regardless of the level of N fertilization. When analyzing the green matter of intercrops, I3 and I6 had the highest values. However, for fertilization of 0–40 kg N ha−1, the green matter from intercropping, where barley was the cereal component, contained significantly higher Fe concentration. Only the highest mineral N fertilization resulted in a statistical equalization of Fe concentration in green matter, both when the component was barley (I3) or triticale (I6).

3.3. Uptake of Micronutrients from the Green Matter of Intercropping

The uptake of the analyzed micronutrients by the green matter of the analyzed crops was significantly differentiated by sowing patterns, mineral N fertilization, and their interaction (Table 11, Table 12, Table 13 and Table 14).
As a result of the sowing pattern, the lowest Mn uptake was found in single cereal crops, both barley and triticale. The addition of narrowleaf lupine caused a significant increase in Mn uptake. In intercropping with spring barley (I1–I3), an increase of 36 to 139% was recorded, while in intercropping with triticale (I4–I6), an increase of 36 to 139% was recorded compared to single cereal crops. The highest value was found in I6, but the same statistical level was also found in narrowleaf lupine cultivation. With regard to the second main effect, the lowest Mn uptake was found in the absence of mineral N fertilization. A further increase in the level of N supplied from mineral fertilizers resulted in an increase in Mn uptake from 46 to 147% at 60 kg N ha−1. The interaction revealed the lowest Mn uptake at N doses from 0 to 40 kg/ha in single cereal cultivation and the highest in I6 cultivation. However, with fertilization of 60 kg N ha−1, no significant differences were found between I2 and I3 or between I5 and I6. However, intercropping with triticale showed significantly higher Mn uptake at this fertilization level.
When analyzing Cu uptake under the influence of sowing patterns, the lowest uptake was found in single spring barley cultivation, while the highest was found in I5 and I6. The increase in Cu uptake in intercropped crops compared to single crops ranged from 20 to 50% for intercropped crops with barley and from 16 to 53% for intercropped crops with triticale. In addition, intercropping I2, I3, I5, and I6 showed statistically higher uptake than single cropping of narrowleaf lupine. With increasing mineral nitrogen fertilization, Cu uptake by the analyzed crops increased from 34 to 80% compared to the average of N-unfertilized treatments. Significantly higher uptake was found with fertilization of 40 and 60 kg N ha−1. The interaction revealed the lowest Cu uptake in single barley cultivation. However, for 0 and 20 kg N ha−1, the same statistical level was found for spring triticale and I1. On the other hand, at the highest fertilization level, it was also found for the green matter of narrowleaf lupine. For each of the analyzed fertilization levels, the highest Cu uptake was found for I6.
The crop sowing pattern also significantly affected Zn uptake from green matter. The lowest levels were found in single cereal crops. In the case of intercropping, an increase in Zn uptake was observed with an increase in the proportion of narrowleaf lupine in the sowing pattern. For intercropping where barley was the cereal component, Zn uptake ranged from 16 to 70% compared to single cereal cultivation, and from 16 to 78% for spring triticale. In addition, only the I6 crop statistically exceeded the average Zn uptake obtained in the cultivation of narrowleaf lupine. When analyzing N fertilization levels, the lowest average Zn uptake was obtained in the absence of mineral N fertilization. Increasing the N dose resulted in an increase in Zn uptake from green matter by 32 to 87%. Statistically, the highest Zn uptake was obtained with fertilization of 40 and 60 kg N ha−1. The interaction revealed that, regardless of the fertilization level, the lowest Zn uptake values were obtained with single cereal cultivation and I1. In turn, the highest Zn uptake values in the absence of N fertilization were recorded in I6 and single lupin cultivation. With fertilization of 20 kg N ha−1, the highest uptake was observed for single lupine cultivation, while with fertilization of 40 and 60 kg N ha−1, it was observed for I6.
Uptake together with green matter Fe was significantly differentiated by the crop sowing pattern. The lowest uptake was found in single barley and triticale cultivation, while the highest was in I6. In the case of narrowleaf lupine intercropping with barley and triticale, increasing the proportion of legume sowing resulted in a significant increase in Fe uptake. In the case of intercropping with barley, an increase of 30 to 133% was recorded, and with triticale, an increase of 32 to 126% was recorded compared to the single cropping of the corresponding cereals. The Fe uptake level for single cropping of narrowleaf lupine represented the same statistical level as I2 and I5. With regard to mineral N fertilization, the lowest Fe uptake was found in the absence of mineral N fertilization. A subsequent increase in the level of mineral N fertilization resulted in a significant increase in Fe uptake from 42 to 122%. The highest uptake was observed with fertilization of 60 kg N ha−1. An interaction was observed, showing that regardless of the mineral N fertilization dose, the lowest Fe uptake was observed in single cereal crops. In the absence of mineral N fertilization, the highest uptake was observed in single crops of narrowleaf lupine, I3, I5, and I6. Among the treatment on which 20 kg N ha−1 was applied, the highest uptake was observed for narrowleaf lupine. However, when fertilized with 40 and 60 kg N ha−1, the highest Fe uptake was observed in crop I6.

3.4. Correlation

The correlation analysis showed a significant positive relationship between the uptake of all micronutrients and yield, as well as between uptake and micronutrient concentration in green matter (Table 15). In the case of Zn and Cu uptake, a highly positive correlation with the concentration of these micronutrients in the soil was also revealed. The concentration of micronutrients in the soil also correlated significantly positively with the concentration in green matter in relation to Mn, Zn, and Fe. In the case of Cu, this correlation was insignificant. For all the microelements analyzed, no significant correlation was found between the yield obtained and their concentration in green matter. However, a significant positive correlation was found between the Cu and Zn concentrations in the soil and the yield obtained.

4. Discussion

The movement of micronutrients from soil to plants is determined by the distinction between total concentration and bioavailable forms [4]. Generally, only a small proportion of micronutrients is present in forms readily taken up by plants [50]. This bioavailable fraction is controlled by soil characteristics, including pH, organic matter, and redox potential [51], as well as by agronomic factors such as fertilization practices and crop species [52]. A proper understanding of these determinants is fundamental for identifying and managing micronutrient deficiencies in agroecosystems [4].
The meteorological conditions varied considerably between the study years (Figure 1), particularly in terms of temperature and precipitation distribution during the growing seasons (April–July). As shown in Figure 1, noticeable interannual differences occurred both in the magnitude and temporal pattern of these factors. Such variability may have influenced the availability and uptake of micronutrients (Mn, Cu, Zn, Fe) by plants, as environmental conditions, especially soil moisture and temperature, are known to affect microbial activity, nutrient mobility, and root functioning. In particular, precipitation patterns may modify the solubility and transport of micronutrients in soil, while temperature affects metabolic processes and nutrient demand in plants. However, in the present study, meteorological conditions were not treated as an independent experimental factor but rather as environmental background variability. Therefore, the obtained results should be interpreted with consideration of these interannual differences, which may have contributed to variability in micronutrient concentration and uptake.

4.1. Microelement Concentration in Soil After Intercropping

In the field experiment, the cultivation of narrowleaf lupine and intercropping resulted in an increase in the concentration of Mn, Cu, Zn, and Fe in the soil after harvest. In contrast, mineral fertilization with N in the range of 20 to 60 kg N ha−1 increased soil concentrations of these elements. In the absence of mineral nitrogen fertilization, slight decreases in micronutrient concentrations were observed. According to Egle et al. [53] and Wiche et al. [54], as a result of the formation of proteoid roots that increase the size of the rhizosphere and lead to a high rate of secretion of organic anions such as citrate and malate and the release of protons in the rhizosphere, lupin cultivation leads to an increase in the availability of microelements such as Fe, Zn, and Mn. In contrast, cereals are ineffective in this strategy [55]. In addition to the overall increase in micronutrients in the soil, this mechanism would also explain the increase in micronutrient concentration in the soil after intercropping associated with an increase in the proportion of narrowleaf lupin in the sowing. Research conducted by Wiche et al. [54] also showed a significant increase in the concentration of Fe, Zn, and Mn in the soil where lupins were grown. However, the increases obtained by the authors were significantly higher compared to the research presented in the manuscript. This may be due to the significant difference in the pH of the soil in which the crops were grown. Wiche et al. [54] conducted cultivation on alkaline soil (pH 7.8), while the authors’ research was conducted on soil with a pH of 5.8. The mobility and solubility of micronutrients in soil decrease with increasing pH. According to Davranche et al. [56], micronutrients in soil solution can react with organic or inorganic ligands, such as carbonates, phosphates, and sulfates, forming complexes and precipitates that are no longer available for uptake by plants. According to Cao et al. [57] and Han et al. [58], lowering the soil pH and the presence of low-molecular-weight organic compounds, such as citric and malic acids, promote the desorption of micronutrients in the soil by forming soluble complexes. This may also explain the increase in the concentration of the analyzed microelements as a result of increased mineral N fertilization, which results in soil acidification. Soil acidification following the harvest of the intercropping was also confirmed in the experiment (Supplementary Materials, Table S2).
An additional interaction that may increase the availability of micronutrients in the field experiment is the improved plant development resulting from increased N availability from mineral fertilizers, and thus improved root vigor and the production of more organic compounds. However, this assumption should be confirmed in future research in this field. Similarly, in the case of Cu, its mobility in the soil is lower at elevated pH [59]. Additionally, it is important to note that increased Cu availability in the soil reduces the availability of both P and the micronutrients Zn, Mn, and Fe to plants [60]. This is due to the fact that Cu binds to free Fe and Mn oxides, as well as clay minerals and soil organic matter [61]. However, in the conditions of the field experiment, changes in Cu under the influence of both the sowing pattern and mineral N fertilization were minor. In contrast, in single-crop cultivation, stable levels of micronutrients in the soil were obtained before and after cultivation, or slight decreases. According to Brooker et al. [62] and Xue et al. [63], this may be explained by the ability of grass plants such as cereals to overcome Fe, Mn, and Zn deficiencies by secreting phytosiderophores (PS), thus increasing their availability in the soil. Thus, the uptake of micronutrients by plants could have led to a reduction in their availability and, consequently, to their temporary deficiency during the growing season and, therefore, to the biosynthesis and transport of PS. In addition, Aleksza et al. [64] indicate that barley secretes the largest amount of PS among the cereal species tested, as well as the greatest diversity. This is confirmed by the presented data, as the single cultivation of barley increased the Fe, Mn, and Zn concentration in the soil more intensively than triticale.

4.2. Microelement Concentration in the Green Matter of Intercropping

In the field experiment, significantly higher levels of the analyzed micronutrients were obtained in the green matter of narrowleaf lupine compared to barley and triticale. Thus, increasing the proportion of legumes in the sowing compared to cereals resulted in a significant increase in the concentration of Mn, Cu, Zn, and Fe in the green matter. However, research conducted by Dimande et al. [65] on the intercropping of maize and beans showed higher Fe concentration in maize biomass, higher Mn and Zn concentration in beans, and comparable Cu in both crops. Wiche et al. [54] found higher Fe and Mn concentrations in lupins and higher Zn concentrations in barley grown in intercropping. In turn, Šenk et al. [66], in studies on the intercropping of soybeans with millet, and Zaeem et al. [67], in the intercropping of soybeans with maize, similarly to the results presented in this study, reported higher concentrations of micronutrients in legumes. Additionally, consistent with the results obtained in the present study, the authors reported an increase in the concentrations of the analyzed micronutrients under intercropping compared with sole cereal crops. This is also confirmed by the results of the study by Nasar et al. [68]. Thus, the results obtained by other authors are divergent and the microelement concentration may vary between species of plants grown in intercropping.
Legumes, including lupins, generally contain a higher concentration of total microelements compared to cereals, which was also confirmed in this experiment [69]. Therefore, they are very often used as a component of intercropping to improve the mineral concentration of the feed obtained [70]. The higher mineral concentration in legumes is generally explained by their ability to mobilize nutrients in the rhizosphere [71]. In addition, much field research has shown that the amount of minerals mobilized by legumes exceeds their own requirements, so they can be made available to non-leguminous species grown in intercropping [72,73]. This may therefore provide additional justification for the increase in mineral concentration in the green matter of intercropped crops. Concerning the increase in mineral concentration in the green matter of intercropped crops, the complementarity of nutrient uptake should also be noted [74]. In the case of intercropping cereals and legumes, temporal complementarity, i.e., different periods of critical nutrient demand, spatial complementarity, manifested in balanced niches due to different root patterns, and chemical complementarity, i.e., the mutual mobilization of different forms of nutrients, can be taken into account [75].
Some authors also point to a possible increase in the concentration of micronutrients in intercropped crops due to the greater diversity of soil microorganisms observed in this type of cultivation compared to single crops [76,77]. Soil microorganisms can increase the availability of Fe, Mn, and Zn in the soil, thereby enabling more efficient uptake by crops [78,79]. Rakshit et al. [80] also reported enhanced uptake of Fe, Zn, and other micronutrients as a result of the secretion of phytosiderophores and phytohormones by microorganisms present in the soil rhizosphere. However, the microbial composition of the soil was not analyzed in the presented experiment, so further field research is needed to confirm this.
Under the conditions of the field experiment, an increase in the concentration of the analyzed micronutrients was also demonstrated with increasing mineral fertilization. Research conducted by Singh et al. [81] also showed an increase in Fe and Zn concentration in wheat as a result of increased mineral N fertilization. Arciksoz et al. [82] even reported a threefold increase in Fe concentration in wheat shoots with increased mineral N supply. However, in the presented own research, this increase was not as high. On the other hand, Olama et al. [83] indicated an increased Zn, Fe, and Cu concentration in rapeseed shoots under the influence of higher N doses, while Mn concentration decreased. In turn, research conducted by Neugschwandtner and Kaul [84] on the intercropping of peas and oats showed an increase in Zn, Fe, and Cu in both the grains and other vegetative parts of the plants with increased mineral N fertilization, while in the case of Mn, there was an increase between doses of 0 and 6 g N m−2 and a decrease between doses of 6 and 12 g N m−2. Similar observations were also made in research on soybeans by Bobrecka-Jarmo et al. [85]. It can therefore be assumed that high doses of N may limit the absorption and distribution of Mn in plants, but in the conditions of the experiment conducted by the authors, this phenomenon did not occur in intercropping because the N doses were relatively low. However, a decrease in Mn concentration between the highest N doses was observed in single lupine cultivation. According to Persson et al. [86] and Cakmak and Kutman [87], Zn and Fe are significantly associated with protein fractions and can be bound by functional groups of amino acids such as cysteine, histidine, and aspartic acid. This relationship is explained by the fact that increased protein synthesis creates a greater number of binding sites for Zn and Fe ions. In addition, in legumes, symbiotic nitrogen fixation, i.e., the formation of nodules, causes an increased demand for micronutrients, so with low N fertilization, which intensifies the initial formation of nodules, there is an increased demand for micronutrients such as Zn, Fe, and Cu [88]. The importance of Fe as a component of nitrogenase and leghemoglobin, and Cu, Zn, and Mn as cofactors of superoxide dismutase in legumes is also emphasized by Yeremko et al. [89]. This may explain the higher concentration of the analyzed micronutrients in the green matter of crops with increasing mineral N fertilization.

4.3. Uptake of Micronutrients from the Green Matter of Intercropping

The uptake of minerals by the crop is a result of the size of the yield obtained and the mineral concentration of the crop. In general, however, the size of the yield is more important than its concentration [26]. In the field research presented, a higher correlation coefficient was also obtained between the uptake of the analyzed micronutrients and the yield than between the uptake and the concentration.
Yields from intercropping are generally higher than those from single crops [90]. The increase in yields in intercropping is attributed to more efficient use of resources such as water, light, and nutrients [91]. Thus, higher yields in the presented field experiment [92] resulted in higher micronutrient uptake values. Similarly to the authors’ own research, Dimande et al. [65] obtained higher uptake of the analyzed micronutrients in intercropping maize and beans compared to single crops. This is also confirmed by research conducted by other authors on various legume-cereal components of intercropping [93,94]. Ebbisa [95] also points out that the increased uptake of micronutrients by intercropping crops results from the simultaneous action of two strategies mentioned earlier: iron reductase activity and rhizosphere acidification characteristic of legumes, and the secretion of phytosiderophores characteristic of cereals. This may therefore also be a mechanism that improves the efficiency of micronutrient uptake by intercropping.
In a field experiment, increased mineral N fertilization also resulted in increased micronutrient uptake. N is an essential element in the physiological and metabolic activities of plants [96]. Thus, increasing mineral N fertilization increases yields in intercropping [97,98,99] and, as stated earlier, increases micronutrient uptake. It is also important to note that increased mineral N fertilization has a positive effect on the root structure of intercropped crops, as confirmed by numerous studies [100,101]. Thus, improved plant root structure can enhance the effects of the above-mentioned strategies for increasing the availability of nutrients in the soil and their uptake. This is confirmed by the significant correlation between the concentration of the analyzed micronutrients in the soil and their uptake.

5. Conclusions

Intercropping cereals with narrowleaf lupins increases the bioavailability and uptake of Mn, Cu, Zn, and Fe, improving the mineral quality of feed and the efficiency of soil resource use. Moderate doses of mineral nitrogen enhance this effect, but further increases in fertilization within the ranges analyzed in the field studies (up to 60 kg N ha−1) may not bring proportional environmental benefits. The intercropping system has an advantage over monoculture crops in terms of productivity and micronutrient cycling, making it a practical tool for implementing the principles of sustainable agriculture. From an agricultural practice perspective, it is recommended to increase the proportion of legumes in feed intercropping to approximately 50–75% and to apply moderate nitrogen doses adapted to soil conditions. However, the optimal proportion should be adjusted to local environmental conditions and agronomic practices. Future research should focus on the long-term impact of intercropping on soil micronutrient balance, microbial activity, and nitrogen use efficiency under different climatic conditions. It is also important to determine the optimal proportions of species components that maximize feed quality while minimizing environmental pressure.

Supplementary Materials

The following supporting information can be downloaded at: https://www.mdpi.com/article/10.3390/agriculture16101038/s1, Table S1. Analysis of variance; Table S2. pH in soil after intercropping narrowleaf lupine with cereals as influenced by seed proportion in sowing and mineral nitrogen fertilization (mean values for 2021–2023).

Author Contributions

Conceptualization, R.G. and A.P.; methodology, R.G.; software, R.G., M.N. and M.T.; validation, A.N. and A.W.-M.; formal analysis, R.G., A.P. and A.N.; investigation, M.K., A.A. and S.I. resources, A.N. and A.W.-M.; data curation, R.G., M.N. and M.K.; writing—original draft preparation, R.G., A.P. and A.N.; writing—review and editing, M.N., M.K. and A.W.-M.; visualization, A.A., S.I. and M.T.; supervision, R.G. and A.W.-M.; project administration, R.G. and A.P.; funding acquisition, R.G. All authors have read and agreed to the published version of the manuscript.

Funding

The research was funded by a subvention for the development of lecturer Ignacy Mościcki University of Applied Sciences in Ciechanów PNW.611.5;1.

Data Availability Statement

The raw data supporting the conclusions of this article will be made available by the authors on request.

Conflicts of Interest

The authors declare no conflicts of interest.

References

  1. Shahid, M.; Shukla, A.K.; Bhattacharyya, P.; Tripathi, R.; Mohanty, S.; Kumar, A.; Lal, B.; Gautam, P.; Raja, R.; Panda, B.B.; et al. Micronutrients (Fe, Mn, Zn and Cu) balance under long-term application of fertilizer and manure in a tropical rice-rice system. J. Soils Sediments 2016, 16, 737–747. [Google Scholar] [CrossRef]
  2. Olifir, Y.; Habryiel, A.; Partyka, T.; Havryshko, O.; Konyk, H.; Panakhyd, H.; Kozak, N.; Ivaniuk, V. The dynamics of mobile iron compounds and redox potential of Albic Pantostagnic Luvisol depending on long-term various fertilisation. Soil Sci. Annu. 2024, 75, 195939. [Google Scholar] [CrossRef]
  3. Rahman, R.; Sofi, J.A.; Javeed, I.; Malik, T.H.; Nisar, S. Role of micronutrients in crop production. Int. J. Curr. Microbiol. Appl. Sci. 2020, 8, 2265–2287. [Google Scholar]
  4. Galić, L.; Vukadinović, V.; Nikolin, I.; Lončarić, Z. Soil properties and microelement availability in crops for human health: An Overview. Crops 2025, 5, 40. [Google Scholar] [CrossRef]
  5. Saha, S.K.; Pathak, N.N. Mineral nutrition. In Fundamentals of Animal Nutrition; Saha, S.K., Pathak, N.N., Eds.; Springer: Singapore, 2021; pp. 113–131. [Google Scholar] [CrossRef]
  6. Fernández-Villa, C.; Rigueira, L.; López-Alonso, M.; Larrán, B.; Orjales, I.; Herrero-Latorre, C.; Pereira, V.; Miranda, M. Identification of patterns of trace mineral deficiencies in dairy and beef cattle herds in Spain. Animals 2025, 15, 2480. [Google Scholar] [CrossRef]
  7. Broom, L.J.; Monteiro, A.; Piñon, A. Recent advances in understanding the influence of zinc, copper, and manganese on the gastrointestinal environment of pigs and poultry. Animals 2021, 11, 1276. [Google Scholar] [CrossRef]
  8. Wang, H.; Lv, G.; Lian, S.; Wang, J.; Wu, R. Effect of copper, zinc, and selenium on the migration of bovine neutrophils. Vet. Sci. 2021, 8, 281. [Google Scholar] [CrossRef] [PubMed]
  9. Wang, B.; Li, X.; Zhou, Z.; Zhu, Y.; Zuo, Z.; Guo, H. The role of five key minerals (Cu, Se, Zn, Co, Fe) in reproductive function of female cattle: Current insights and future directions. Vet. Sci. 2026, 13, 208. [Google Scholar] [CrossRef]
  10. Sobczuk-Szul, M.; Pogorzelska-Przybyłek, P.; Momot, M.; Nogalski, Z. Content of selected macroelements and zinc in relation to stage of lactation of montbéliarde and polish holstein-friesian cows. Appl. Sci. 2025, 15, 144. [Google Scholar] [CrossRef]
  11. Ram, D.; Ali, T.; Mehraj, S.; Wani, S.A.; Jan, R.; Jan, R.; Bhat, M.A.; Bhat, S.J.A. Strategy for optimization of higher productivity and quality in field crops through micronutrients: A review. Econ. Aff. 2017, 62, 139–147. [Google Scholar] [CrossRef]
  12. Sisodia, P.; Gryta, A.; Pathan, S.I.; Pietramellara, G.; Frąc, M. Roots to riches: Unearthing the synergy of intercropping, microbial interactions, and symbiotic systems for sustainable agriculture: A Review. Agronomy 2025, 15, 2243. [Google Scholar] [CrossRef]
  13. Li, B.-Y.; Huang, S.M.; Wei, M.-B.; Zhang, H.L.; Xu, J.-M.; Ruan, X.-L. Dynamics of soil and grain micronutrients as affected by long-term fertilization in an aquic inceptisol. Pedosphere 2010, 20, 725–735. [Google Scholar] [CrossRef]
  14. Nziguheba, G.; Smolders, E. Inputs of trace elements in agricultural soils via phosphate fertilizers in European countries. Sci. Total Environ. 2008, 390, 53–57. [Google Scholar] [CrossRef]
  15. Dach, J.; Starmans, D. Heavy metals balance in Polish and Dutch agronomy: Actual state and previsions for the future. Agric. Ecosyst. Environ. 2005, 107, 309–316. [Google Scholar] [CrossRef]
  16. Rutkowska, B.; Szulc, W.; Sosulski, T.; Stępień, W. Soil micronutrient availability to crops affected by long-term inorganic and organic fertilizer applications. Plant Soil Environ. 2014, 60, 198–203. [Google Scholar] [CrossRef]
  17. Uprety, D.; Hejcman, M.; Száková, J.; Kunzová, E.; Tlustoš, P. Concentration of trace elements in arable soil after long-term application of organic and inorganic fertilizers. Nutr. Cycl. Agroecosyst. 2009, 85, 241–252. [Google Scholar] [CrossRef]
  18. Bourke, P.M.; Evers, J.B.; Bijma, P.; van Apeldoorn, D.F.; Smulders, M.J.; Kuyper, T.W.; Bonnema, G. Breeding beyond monoculture: Putting the “intercrop” into crops. Front. Plant Sci. 2021, 12, 734167. [Google Scholar] [CrossRef] [PubMed]
  19. Papdi, E.; Kovács, F.; Fekete, I.; Juhos, K.; Kotroczó, Z. Possibilities of biological soil management in monoculture greenhouse cultivation: Cover crops, organic matter replenishment and Trichoderma sp. application to improve soil health. Soil Sci. Annu. 2024, 75, 193448. [Google Scholar] [CrossRef]
  20. Boix-Fayos, C.; de Vente, J. Challenges and potential pathways towards sustainable agriculture within the European Green Deal. Agric. Syst. 2023, 207, 103634. [Google Scholar] [CrossRef]
  21. Saikanth, D.R.K.; Supriya; Singh, B.V.; Rai, A.K.; Bana, S.R.; Sachan, D.S.; Singh, B. Advancing sustainable agriculture: A comprehensive review for optimizing food production and environmental conservation. Int. J. Plant Soil Sci. 2023, 35, 417–425. [Google Scholar] [CrossRef]
  22. Bedoussac, L.; Journet, E.P.; Hauggaard-Nielsen, H.; Naudin, C.; Corre-Hellou, G.; Jensen, E.S.; Prieur, L.; Justes, E. Ecological principles underlying the increase of productivity achieved by cereal–grain legume intercrops. Agron. Sustain. Dev. 2015, 35, 911–935. [Google Scholar] [CrossRef]
  23. Jensen, E.S.; Carlsson, G.; Hauggaard-Nielsen, H. Intercropping of grain legumes and cereals improves the use of soil N resources and reduces the requirement for synthetic fertilizer N: A global-scale analysis. Agron. Sustain. Dev. 2020, 40, 5. [Google Scholar] [CrossRef]
  24. Moore, K.J.; Lenssen, A.W.; Fales, S.L. Factors affecting forage quality. In Forages: The Science of Grassland Agriculture, 7th ed.; Moore, K.J., Collins, M., Nelson, C.J., Redfearn, D.D., Eds.; John Wiley & Sons, Ltd.: Headquarters, NJ, USA, 2020; Volume 2, pp. 701–717. [Google Scholar] [CrossRef]
  25. Bo, P.T.; Bai, Y.; Dong, Y.; Shi, H.; Soe Htet, M.N.; Samoon, H.A.; Zhang, R.; Tanveer, S.K.; Hai, J. Influence of different harvesting stages and cereals–legume mixture on forage biomass yield, nutritional compositions, and quality under Loess Plateau region. Plants 2022, 11, 2801. [Google Scholar] [CrossRef]
  26. Górski, R.; Płaza, A. Content and uptake of macroelements in green fodder of mixtures of narrowleaf lupin with spring triticale. J. Agric. Sci. 2023, 161, 563–571. [Google Scholar] [CrossRef]
  27. Księżak, J.; Staniak, M.; Stalenga, J. Restoring the importance of cereal-grain legume mixtures in low-input farming systems. Agriculture 2023, 13, 341. [Google Scholar] [CrossRef]
  28. Masters, D.G.; Norman, H.C.; Thomas, D.T. Minerals in pastures—Are we meeting the needs of livestock? Crop Pasture Sci. 2019, 70, 1184–1195. [Google Scholar] [CrossRef]
  29. Rossi, R.; Cavalli, D.; Notario, T.; Pecetti, L. Early belowground interactions in lupin–wheat intercropping assessed by a simple root phenotyping approach. Plant Soil 2025, 1–18. [Google Scholar] [CrossRef]
  30. Yang, H.; Zhang, W.; Li, L. Intercropping: Feed more people and build more sustainable agroecosystems. Front. Agric. Sci. Eng. 2021, 8, 373–386. [Google Scholar] [CrossRef]
  31. Gu, C.; Bastiaans, L.; Anten, N.P.; Makowski, D.; van Der Werf, W. Annual intercropping suppresses weeds: A meta-analysis. Agric. Ecosyst. Environ. 2021, 322, 107658. [Google Scholar] [CrossRef]
  32. Lopes, T.; Hatt, S.; Xu, Q.; Chen, J.; Liu, Y.; Francis, F. Wheat (Triticum aestivum L.)-based intercropping systems for biological pest control. Pest Manag. Sci. 2016, 72, 2193–2202. [Google Scholar] [CrossRef]
  33. Lu, M.; Zhao, J.; Lu, Z.; Li, M.; Yang, J.; Fullen, M.; Li, Y.; Fan, M. Maize–soybean intercropping increases soil nutrient availability and aggregate stability. Plant Soil 2023, 506, 441–456. [Google Scholar] [CrossRef]
  34. Justes, E.; Bedoussac, L.; Dordas, C.; Frak, E.; Louarn, G.; Boudsocq, S.; Journet, E.P.; Lithourgidis, A.; Pankou, C.; Zhang, C.; et al. The 4C approach as a way to understand species interactions determining intercropping productivity. Front. Agric. Sci. Eng. 2021, 8, 3–15. [Google Scholar] [CrossRef]
  35. Bargaz, A.; Isaac, M.E.; Jensen, E.S.; Carlsson, G. Nodulation and root growth increase in lower soil layers of water-limited faba bean intercropped with wheat. J. Plant Nutr. Soil Sci. 2016, 179, 537–546. [Google Scholar] [CrossRef]
  36. Zhang, C.; Postma, J.A.; York, L.M.; Lynch, J.P. Root foraging elicits niche complementarity-dependent yield advantage in the ancient ‘three sisters’ (maize/bean/squash) polyculture. Ann. Bot. 2014, 114, 1719–1733. [Google Scholar] [CrossRef]
  37. Bacchi, M.; Monti, M.; Calvi, A.; Lo Presti, E.; Pellicanò, A.; Preiti, G. Forage potential of cereal/legume intercrops: Agronomic performances, yield, quality forage and LER in two harvesting times in a mediterranean environment. Agronomy 2021, 11, 121. [Google Scholar] [CrossRef]
  38. Carton, N.; Naudin, C.; Piva, G.; Corre-Hellou, G. Intercropping winter lupin and triticale increases weed suppression and total yield. Agriculture 2020, 10, 316. [Google Scholar] [CrossRef]
  39. Head Office of Geodesy and Cartography. A Service for Viewing the Content of a Soil-Agricultural Map at a Scale of 1:5000. 2024. Available online: https://www.geoportal.gov.pl/ (accessed on 23 April 2026).
  40. Kabala, C.; Charzyński, P.; Chodorowski, J.; Drewnik, M.; Glina, B.; Greinert, A.; Hulisz, P.; Jankowski, M.; Jonczak, J.; Łabaz, B.; et al. Polish Soil Classification, 6th edition—Principles, classification scheme and correlations. Soil Sci. Annu. 2019, 70, 71–97. [Google Scholar] [CrossRef]
  41. Świtoniak, M.; Kabała, C.; Podlasiński, M.; Smreczak, B. Proposal of the correlation between cartographic units on the agricultural soil map and types and subtypes of Polish Soil Classification. Soil Sci. Annu. 2019, 70, 98–114. [Google Scholar] [CrossRef]
  42. IUSS Working Group WRB. World Reference Base for Soil Resources. In International Soil Classification System for Naming Soil and Creating Legends for Soils and Creating Legends for Soil Maps, 4th ed.; International Union of Soil Sciences (IUSS): Vienna, Austria, 2022. [Google Scholar]
  43. Kabala, C. Luvisols and related clay-illuvial soils–soils of the year 2023. Current view of their origin, classification and services in Poland. Soil Sci. Annu. 2023, 74, 177034. [Google Scholar] [CrossRef]
  44. Stępień, M.K.; Gozdowski, D.; Samborski, S.M. Possibilities of attribution of the content of soil separates according to PTG 2008/USDA to selected granulometric groups of PTG 1956 and distinguished on agricultural soil maps. Soil Sci. Annu. 2024, 75, 193375. [Google Scholar] [CrossRef]
  45. Kottek, M.; Grieser, J.; Beck, C.; Rudolf, B.; Rubel, F. World Map of the Köppen-Geiger climate classification updated. Meteorol. Z. 2006, 15, 259–263. [Google Scholar] [CrossRef] [PubMed]
  46. Lechnio, J.; Malinowska, E. Wysoczyzna Ciechanowska (318.64). In Regionalna Geografia Fizyczna Polski; Richling, A., Solon, J., Macias, A., Balon, J., Borzyszkowski, J., Kistowski, M., Eds.; Bogucki Wydawnictwo Naukowe: Poznań, Poland, 2021; pp. 191–198. (In Polish) [Google Scholar]
  47. Płaza, A.; Rudziński, R.; Górski, R. Plon i zawartość białka ogółem w mieszankach łubinu wąskolistnego z pszenżytem jarym uprawianych na zieloną masę w rolnictwie zrównoważonym. Agron. Sci. 2023, 78, 69–80. [Google Scholar] [CrossRef]
  48. ISO 6869:2000; Animal Feeding Stuffs—Determination of the Contents of Calcium, Copper, Iron, Magnesium, Manganese, Potassium, Sodium and Zinc—Method Using Atomic Absorption Spectrometry. International Organization for Standardization: Geneva, Switzerland, 2000.
  49. PN-R-04021:1994; Chemical Analysis of Plants—Determination of Micronutrients (Fe, Mn, Zn, Cu). Polish Committee for Standardization: Warsaw, Poland, 1994.
  50. Nieder, R.; Benbi, D.K.; Reichl, F.X. Microelements and their role in human health. Soil Compon. Hum. Health 2018, 7, 317–374. [Google Scholar] [CrossRef]
  51. de Valença, A.W.; Bake, A.; Brouwer, I.D.; Giller, K.E. Agronomic biofortification of crops to fight hidden hunger in sub–Saharan Africa. Glob. Food Secur. 2017, 12, 8–14. [Google Scholar] [CrossRef]
  52. Van Breemen, N.; Buurman, P. Soil Formation; Springer: Berlin/Heidelberg, Germany, 1998. [Google Scholar] [CrossRef]
  53. Egle, K.; Römer, W.; Keller, H. Exudation of low molecular weight organic acids by Lupinus albus L., Lupinus angustifolius L. and Lupinus luteus L. as affected by phosphorus supply. Agronomie 2003, 23, 511–518. [Google Scholar] [CrossRef]
  54. Wiche, O.; Kummer, N.A.; Heilmeier, H. Interspecific root interactions between white lupin and barley enhance the uptake of rare earth elements (REEs) and nutrients in shoots of barley. Plant Soil 2016, 402, 235–245. [Google Scholar] [CrossRef]
  55. Li, L.; Tang, C.; Rengel, Z.; Zhang, F.S. Calcium, magnesium and microelement uptake as affected by phosphorus sources and interspecific root interactions between wheat and chickpea. Plant Soil 2004, 261, 29–37. [Google Scholar] [CrossRef]
  56. Davranche, M.; Gruau, G.; Dia, A.; Marsac, R.; Pédrot, M.; Pourret, O. Biogeochemical factors affecting rare earth element distribution in shallow wetland groundwater. Aquat. Geochem. 2015, 21, 197–215. [Google Scholar] [CrossRef]
  57. Cao, X.; Chen, Y.; Wang, X.; Deng, X. Effects of redox potential and pH value on the release of rare earth elements from soil. Chemosphere 2001, 44, 655–661. [Google Scholar] [CrossRef]
  58. Han, F.; Shan, X.Q.; Zhang, J.; Xie, Y.N.; Pei, Z.G.; Zhang, S.Z.; Zhu, Y.G.; Wen, B. Organic acids promote the uptake of lanthanum by barley roots. New Phytol. 2005, 165, 481–492. [Google Scholar] [CrossRef]
  59. Burachevskaya, M.; Minkina, T.; Mandzhieva, S.; Bauer, T.; Chaplygin, V.; Zamulina, I.; Sushkova, S.; Fedorenko, A.; Ghazaryan, K.; Movsesyan, H.; et al. Study of copper, lead, and zinc speciation in the Haplic Chernozem surrounding coal-fired power plant. Appl. Geochem. 2019, 104, 102–108. [Google Scholar] [CrossRef]
  60. Rehman, M.; Lui, L.; Wang, Q.; Saleem, M.H.; Bashir, S.; Ullah, S.; Peng, D. Copper environmental toxicology, recent advances, and future outlook: A review. Environ. Sci. Pollut. Res. 2019, 26, 18003–18016. [Google Scholar] [CrossRef] [PubMed]
  61. Ponizovsky, A.A.; Studenikina, T.A.; Mironenko, E.V.; Kingery, W.L. Copper(II) retention by chernozem, gray forest, and dernovo–podzolic soils: Ph effect and cation balance. Soil Sci. 2001, 166, 239–248. [Google Scholar] [CrossRef]
  62. Brooker, R.W.; Bennett, A.E.; Cong, W.F.; Daniell, T.J.; George, T.S.; Hallett, P.D.; Hawes, C.; Iannetta, P.P.M.; Jones, H.G.; Karley, A.J.; et al. Improving intercropping: A synthesis of research in agronomy, plant physiology and ecology. New Phytol. 2015, 206, 107–117. [Google Scholar] [CrossRef]
  63. Xue, Y.; Xia, H.; Christie, P.; Zhang, Z.; Li, L.; Tang, C. Crop acquisition of phosphorus, iron and zinc from soil in cereal/legume intercropping systems: A critical review. Ann. Bot. 2016, 117, 363–377. [Google Scholar] [CrossRef] [PubMed]
  64. Aleksza, D.; Spiridon, A.; Tarkka, M.; Hauser, M.T.; Hann, S.; Causon, T.; Kratena, N.; Stanetty, C.; George, T.S.; Russell, J.; et al. Phytosiderophore pathway response in barley exposed to iron, zinc or copper starvation. Plant Sci. 2024, 339, 111919. [Google Scholar] [CrossRef] [PubMed]
  65. Dimande, P.; Arrobas, M.; Rodrigues, M.Â. Intercropped maize and cowpea increased the land equivalent ratio and enhanced crop access to more nitrogen and phosphorus compared to cultivation as sole crops. Sustainability 2024, 16, 1440. [Google Scholar] [CrossRef]
  66. Šenk, M.; Simić, M.; Milojković-Opsenica, D.; Brankov, M.; Tolimir, M.; Kodranov, I.; Dragičević, V. Common millet and soybean intercropping with bio-fertilizer as sustainable practice for managing grain yield and quality. Front. Nutr. 2023, 10, 1267928. [Google Scholar] [CrossRef]
  67. Zaeem, M.; Nadeem, M.; Pham, T.H.; Ashiq, W.; Ali, W.; Gillani, S.S.M.; Moise, E.; Elavarthi, S.; Kavanagh, V.; Cheema, M.; et al. Corn-soybean intercropping improved the nutritional quality of forage cultivated on Podzols in Boreal climate. Plants 2021, 10, 1015. [Google Scholar] [CrossRef]
  68. Nasar, J.; Ahmad, M.; Gitari, H.; Tang, L.; Chen, Y.; Zhou, X.B. Maize/soybean intercropping increases nutrient uptake, crop yield and modifies soil physio-chemical characteristics and enzymatic activities in the subtropical humid region based in Southwest China. BMC Plant Biol. 2024, 24, 434. [Google Scholar] [CrossRef]
  69. Paulson, J.; Jung, H.; Raeth-Knight, M.; Linn, J. Grass vs Legume Forages for Dairy Cattle; University of Minnesota: Saint Paul, MA, USA, 2008; pp. 119–133. [Google Scholar]
  70. Baghdadi, A.; Halim, R.A.; Ghasemzadeh, A.; Ebrahimi, M.; Othman, R.; Yusof, M.M. Effect of intercropping of corn and soybean on dry matter yield and nutritive value of forage corn. Legume Res. 2016, 39, 976–981. [Google Scholar] [CrossRef]
  71. Muler, A.L.; Oliveira, R.S.; Lambers, H.; Veneklaas, E.J. Does cluster-root activity benefit nutrient uptake and growth of co-existing species? Oecologia 2014, 174, 23–31. [Google Scholar] [CrossRef]
  72. Lambers, H.; Clements, J.C.; Nelson, M.N. How a phosphorus-acquisition strategy based on carboxylate exudation powers the success and agronomic potential of lupines (Lupinus, Fabaceae). Am. J. Bot. 2013, 100, 263–288. [Google Scholar] [CrossRef]
  73. Głowacka, A. Changes in the uptake of Cu, Zn, Fe and Mn by dent maize in blue lupin/spring barley strip cropping system. Zemdirb. Agric. 2014, 101, 41–50. [Google Scholar] [CrossRef]
  74. Dissanayaka, D.M.S.B.; Rankoth, L.M.; Gunathilaka, W.M.N.D.; Prasantha, B.D.R.; Marambe, B. Utilizing food legumes to achieve iron and zinc nutritional security under changing climate. J. Crop Improv. 2021, 35, 700–721. [Google Scholar] [CrossRef]
  75. Duchene, O.; Vian, J.; Celette, F. Intercropping with legume for agroecological cropping systems: Complementarity and facilitation processes and the importance of soil microorganisms. A review. Agric. Ecosyst. Environ. 2017, 240, 148–161. [Google Scholar] [CrossRef]
  76. Li, Q.; Chen, J.; Wu, L.; Luo, X.; Li, N.; Arafat, Y. Belowground interactions impact the soil bacterial community, soil fertility, and crop yield in maize/peanut intercropping systems. Int. J. Mol. Sci. 2018, 19, 622. [Google Scholar] [CrossRef]
  77. Chen, P.; He, W.; Shen, Y.; Zhu, L.; Yao, X.; Sun, R. Interspecific Neighbor Stimulates Peanut Growth Through Modulating Root Endophytic Microbial Community Construction. Front. Plant Sci. 2022, 13, 830666. [Google Scholar] [CrossRef] [PubMed]
  78. Karnwal, A. Zinc solubilizing Pseudomonas spp. from vermicompost bestowed with multifaceted plant growth promoting properties and having prospective modulation of zinc biofortification in Abelmoschus esculentus L properties and having prospective modulation of zinc. J. Plant Nutr. 2020, 44, 1023–1038. [Google Scholar] [CrossRef]
  79. Lurthy, T.; Pivato, B.; Lemanceau, P.; Mazurier, S. Importance of the rhizosphere microbiota in iron biofortification of plants. Front. Plant Sci. 2021, 12, 744445. [Google Scholar] [CrossRef] [PubMed]
  80. Rakshit, A.; Singh, H.B.; Sen, A. Strategies for enhancing zinc efficiency in crop plants. In Nutrient Use Efficiency: From Basics to Advances; Springer: New Delhi, India, 2015. [Google Scholar] [CrossRef]
  81. Singh, B.R.; Timsina, Y.N.; Lind, O.C.; Cagno, S.; Janssens, K. Zinc and iron concentration as affected by nitrogen fertilization and their localization in wheat grain. Front. Plant Sci. 2018, 9, 307. [Google Scholar] [CrossRef] [PubMed]
  82. Aciksoz, B.S.; Yazicici, A.; Ozturk, L.; Cakmak, I. Biofortification of wheat with iron through soil and foliar application of nitrogen and iron fertilizers. Plant Soil 2011, 349, 215–225. [Google Scholar] [CrossRef]
  83. Olama, V.; Ronaghi, A.; Karimian, N.; Yasrebi, J.; Hamidi, R.; Tavajjoh, M.; Kazemi, M.R. Seed quality and micronutrient contents and translocations in rapeseed (Brassica napus L.) as affected by nitrogen and zinc fertilizers. Arch. Agron. Soil Sci. 2014, 60, 423–435. [Google Scholar] [CrossRef]
  84. Neugschwandtner, R.W.; Kaul, H.P. Concentrations and uptake of micronutrients by oat and pea in intercrops in response to N fertilization and sowing ratio. Arch. Agron. Soil Sci. 2016, 62, 1236–1249. [Google Scholar] [CrossRef]
  85. Bobrecka-Jamro, D.; Jarecki, W.; Buczek, J. Response of soya bean to different nitrogen fertilization levels. J. Elem. 2018, 23, 559–568. [Google Scholar] [CrossRef]
  86. Persson, D.P.; Hansen, T.H.; Laursen, K.H.; Schjoerring, J.K.; Husted, S. Simultaneous biofortification of zinc and protein in wheat grain by combined application of zinc and nitrogen fertilisers. J. Agric. Food Chem. 2016, 64, 5963–5970. [Google Scholar]
  87. Cakmak, I.; Kutman, U.B. Agronomic biofortification of cereals with zinc: A review. Eur. J. Soil Sci. 2018, 69, 172–180. [Google Scholar] [CrossRef]
  88. Li, Y.; Liu, Q.; Zhang, D.X.; Zhang, Z.Y.; Xu, A.; Jiang, Y.L.; Chen, Z.C. Metal nutrition and transport in the process of symbiotic nitrogen fixation. Plant Commun. 2024, 5, 100829. [Google Scholar] [CrossRef]
  89. Yeremko, L.; Czopek, K.; Staniak, M.; Marenych, M.; Hanhur, V. Role of environmental factors in legume-rhizobium symbiosis: A review. Biomolecules 2025, 15, 118. [Google Scholar] [CrossRef]
  90. Šarūnaitė, L.; Toleikienė, M.; Arlauskienė, A.; Razbadauskienė, K.; Deveikytė, I.; Supronienė, S.; Semaškienė, R.; Kadžiulienė, Ž. Effects of pea (Pisum sativum L.) cultivars for mixed cropping with oats (Avena sativa L.) on yield and competition indices in an organic production system. Plants 2022, 11, 2936. [Google Scholar] [CrossRef]
  91. Gong, X.W.; Dang, K.; Lv, S.M.; Zhao, G.; Tian, L.X.; Luo, Y.; Feng, B.L. Interspecific root interactions and water-use efficiency of intercropped proso millet and mung bean. Eur. J. Agron. 2020, 115, 126034. [Google Scholar] [CrossRef]
  92. Górski, R.; Płaza, A. The Effects of intercropping narrowleaf lupine with cereals under variable mineral nitrogen fertilization. Agriculture 2024, 14, 989. [Google Scholar] [CrossRef]
  93. Sidikou, A.A.H.; Drissi, S.; Bouaziz, A.; Dhassi, K.; Amlal, F.; Darrhal, N.; Bamouh, A.; El Hajli, H.; Alouatir, Z.; Houssa, A.A. Productivity, quality, and nutrient uptake of intensive forage crop rotations based on corn in sandy soil (northern Morocco). Sains Tanah–J. Soil Sci. Agroclimatol. 2023, 20, 32–42. [Google Scholar] [CrossRef]
  94. Mir, N.H.; Alie, B.A.; Ahmad, S.; Bhat, S.S.; Atufa, R. Zinc fortification and legume incorporation in forage based cropping systems: Implications for yield and nutrient dynamics. J. Environ. Biol. 2024, 45, 780–787. [Google Scholar] [CrossRef]
  95. Ebbisa, A. Mechanisms underlying cereal/legume intercropping as nature-based biofortification: A review. Food Prod. Process. Nutr. 2022, 4, 19. [Google Scholar] [CrossRef]
  96. Lin, S.; Pi, Y.; Long, D.; Duan, J.; Zhu, X.; Wang, X.; He, J.; Zhu, Y. Impact of organic and chemical nitrogen fertilizers on the crop yield and fertilizer use efficiency of soybean–maize intercropping systems. Agriculture 2022, 12, 1428. [Google Scholar] [CrossRef]
  97. Yang, C.; Fan, Z.; Chai, Q. Agronomic and economic benefits of pea/maize intercropping systems in relation to N fertilizer and maize density. Agronomy 2018, 8, 52. [Google Scholar] [CrossRef]
  98. Pramanick, B.; Mahapatra, B.S.; Datta, D.; Dey, P.; Singh, S.P.; Kumar, A.; Paramanik, B.; Awasthi, N. An innovative approach to improve oil production and quality of mustard (Brassica juncea L.) with multi-nutrient-rich polyhalite. Heliyon 2023, 9, e13997. [Google Scholar] [CrossRef]
  99. Szpunar-Krok, E.; Wondołowska-Grabowska, A.; Bobrecka-Jamro, D.; Jańczak-Pieniążek, M.; Kotecki, A.; Kozak, M. Effect of nitrogen fertilisation and inoculation with Bradyrhizobium japonicum on the fatty acid profile of soybean (Glycine max (L.) Merrill) seeds. Agronomy 2021, 11, 941. [Google Scholar] [CrossRef]
  100. Fan, Z.; Liu, P.; Lin, Y.; Qiang, B.; Li, Z.; Cheng, M.; Guo, Q.; Liu, J.; Ren, X.; Zhao, X.; et al. Root plasticity improves the potential of maize/soybean intercropping to stabilize the yield. Soil Tillage Res. 2025, 251, 106553. [Google Scholar] [CrossRef]
  101. Ramirez-Garcia, J.; Martens, H.J.; Quemada, M.; Thorup-Kristensen, K. Intercropping effect on root growth and nitrogen uptake at different nitrogen levels. J. Plant Ecol. 2015, 8, 380–389. [Google Scholar] [CrossRef]
Figure 1. Meteorological conditions during the growing seasons, including temperature and precipitation, were recorded at the Meteorological Station of the Ignacy Mościcki University of Applied Sciences in Ciechanów.
Agriculture 16 01038 g001aAgriculture 16 01038 g001b
Table 1. The soil characteristics before the field experiment.
CharacteristicUnitValue
pH-5.8
Organic carbon%0.95
Pmg 100 g−1 soil10.23
Kmg 100 g−1 soil6.58
Mgmg 100 g−1 soil6.93
N totalmin 0–30 cmmg kg−1 soil7.61
N totalmin 30–60 cmmg kg−1 soil6.06
Mnmg kg−1 soil147.33
Cumg kg−1 soil4.8
Znmg kg−1 soil17.67
Femg kg−1 soil1457.33
Table 2. Seeding rate for the intercropping of narrowleaf lupin and cereals, expressed as seeding density and seeding rate.
TreatmentCrop CompositionSeeding Density (Seeds m−2)Seed Rate (kg ha−1)
NLnarrowleaf lupin120240
SBspring barley300160
STspring triticale450180
I1narrowleaf lupin + spring barley30 + 22560 + 120
I2narrowleaf lupin + spring barley60 + 150120 + 80
I3narrowleaf lupin + spring barley90 + 75180 + 40
I4narrowleaf lupin + spring triticale30 + 34060 + 135
I5narrowleaf lupin + spring triticale60 + 225120 + 90
I6narrowleaf lupin + spring triticale90 + 115180 + 45
Table 3. Soil Mn concentration after narrowleaf lupine and cereals intercropping (mean values for 2021–2023) [mg kg−1 soil].
IntercroppingMineral Nitrogen Fertilization [kg N ha−1]Means
6040200
NL 1164.0 ± 11.0168.0 ± 10.8156.0 ± 12.7152.0 ± 10.7160.0 ± 13.0 F 2
SB153.7 ± 12.3146.7 ± 11.0146.0 ± 12.3144.3 ± 12.1147.7 ± 12.5 AB
I1160.0 ± 11.2149.3 ± 11.1146.7 ± 12.3146.0 ± 11.0150.5 B ± 12.7 C
I2165.3 ± 12.4152.7 ± 12.3150.3 ± 11.9149.0 ± 12.6154.3 D ± 13.9 E
I3169.0 ± 12.0155.7 ± 10.7152.7 ± 12.3150.0 ± 12.3156.8 ± 13.9 E
ST151.7 ± 10.1147.7 ± 9.5146.7 ± 10.7138.3 ± 9.0146.1 ± 11.0 A
I4162.3 ± 11.3150.7 ± 13.6148.7 ± 12.7148.0 ± 13.0152.4 ± 13.9 CD
I5164.3 ± 11.9152.7 ± 11.1149.7 ± 11.7149.3 ± 11.1154.0 ± 13.0 DE
I6171.0 ± 8.6156.3 ± 11.3153.7 ± 11.3151.3 ± 11.1158.1 ± 13.1 EF
Means162.4 ± 12.8 C153.3 ± 12.8 B150.0 ± 12.4 A147.6 ± 12.2 A
p valuesintercropping: <0.001; mineral nitrogen fertilization: <0.001;
intercropping × mineral nitrogen fertilization: >0.05
1 as indicated in Table 2; 2 Means for the intercropping in a column followed by the same capital letter (A, B, C, D, E, F) do not differ significantly at p ≤ 0.05. Means for the mineral nitrogen fertilization in verse followed by the same capital letter (A, B, C) do not differ significantly at p ≤ 0.05; ± standard deviation.
Table 4. Soil Cu concentration after narrowleaf lupine and cereals intercropping (mean values for 2021–2023) [mg kg−1 soil].
IntercroppingMineral Nitrogen Fertilization [kg N ha−1]Means
6040200
NL 15.3 ± 0.95.3 ± 0.85.1 ± 0.84.8 ± 0.95.1 ± 0.9 DE 2
SB5.1 ± 0.84.9 ± 0.94.8 ± 0.94.4 ± 0.94.8 ± 0.9 A
I15.1 ± 0.94.8 ± 0.94.7 ± 0.94.6 ± 0.84.8 ± 0.9 A
I25.2 ± 0.94.9 ± 0.94.9 ± 0.94.7 ± 0.94.9 ± 0.9 ABC
I35.3 ± 0.85.1 ± 0.84.9 ± 1.04.9 ± 0.95.0 ± 0.9 CDE
ST5.1 ± 0.84.9 ± 0.94.7 ± 0.94.4 ± 0.94.8 ± 0.9 A
I45.1 ± 0.94.9 ± 0.84.8 ± 0.84.6 ± 0.84.9 ± 0.8 AB
I55.3 ± 1.05.1 ± 0.94.9 ± 0.94.8 ± 0.85.0 ± 0.9 BCD
I65.6 ± 1.15.3 ± 0.95.0 ± 0.94.9 ± 0.85.2 ± 1.0 E
Means5.2 ± 0.9 D5.0 ± 0.9 C4.9 ± 0.9 B4.7 ± 0.9 A
p valuesintercropping: <0.001; mineral nitrogen fertilization: <0.001;
intercropping × mineral nitrogen fertilization: >0.05
1 as indicated in Table 2; 2 Means for the intercropping in a column followed by the same capital letter (A, B, C, D, E) do not differ significantly at p ≤ 0.05. Means for the mineral nitrogen fertilization in verse followed by the same capital letter (A, B, C, D) do not differ significantly at p ≤ 0.05; ± standard deviation.
Table 5. Soil Zn concentration after narrowleaf lupine and cereals intercropping (mean values for 2021–2023) [mg kg−1 soil].
IntercroppingMineral Nitrogen Fertilization [kg N ha−1]Means
6040200
NL 126.1 ± 2.426.5 ± 3.124.8 ± 3.421.9 ± 3.224.8 ± 3.5 F 2
SB20.8 ± 3.618.4 ± 2.717.2 ± 2.516.0 ± 2.818.1 ± 3.4 AB
I122.3 ± 3.320.9 ± 2.818.7 ± 2.817.2 ± 2.619.8 ± 3.5 C
I223.8 ± 2.722.7 ± 1.920.3 ± 2.018.5 ± 3.521.3 ± 3.3 D
I326.0 ± 2.724.8 ± 1.422.9 ± 2.220.3 ± 4.223.5 ± 3.5 EF
ST20.3 ± 3.618.0 ± 2.016.7 ± 2.415.3 ± 2.917.6 ± 3.3 A
I422.4 ± 2.320.3 ± 2.518.3 ± 2.015.9 ± 4.719.2 ± 3.9 BC
I524.5 ± 2.922.4 ± 2.220.9 ± 2.118.9 ± 3.621.7 ± 3.4 D
I626.8 ± 2.224.6 ± 3.222.8 ± 1.519.4 ± 3.123.4 ± 3.7 E
Means23.7 ± 3.7 D22.1 ± 3.7 C20.3 ± 3.6 B18.2 ± 4.0 A
p valuesintercropping: <0.001; mineral nitrogen fertilization: <0.001;
intercropping × mineral nitrogen fertilization: >0.05
1 as indicated in Table 2; 2 Means for the intercropping in a column followed by the same capital letter (A, B, C, D, E, F) do not differ significantly at p ≤ 0.05. Means for the mineral nitrogen fertilization in verse followed by the same capital letter (A, B, C, D) do not differ significantly at p ≤ 0.05; ± standard deviation.
Table 6. Soil Fe concentration after narrowleaf lupine and cereals intercropping (mean values for 2021–2023) [mg kg−1 soil].
IntercroppingMineral Nitrogen Fertilization [kg N ha−1]Means
6040200
NL 11664 ± 199 d 21710 ± 216 f1623 ± 212 e1594 ± 211 f1648 ± 214 F
SB1517 ± 230 a1476 ± 242 a1444 ± 262 a1423 ± 247 ab1465 ± 248 A
I11576 ± 231 b1524 ± 239 bc1502 ± 242 b1466 ± 236 c1517 ± 240 C
I21596 ± 224 bc1549 ± 219 cd1531 ± 229 c1513 ± 219 d1547 ± 225 D
I31663 ± 199 d1627 ± 211 e1584 ± 210 d1521 ± 217 de1599 ± 216 E
ST1509 ± 232 a1473 ± 235 a1443 ± 231 a1416 ± 234 a1460 ± 236 A
I41562 ± 224 b1511 ± 240 b1475 ± 250 b1436 ± 249 b1496 ± 245 B
I51617 ± 209 c1584 ± 211 d1535 ± 193 c1499 ± 223 d1559 ± 214 D
I61659 ± 206 d1629 ± 213 e1597 ± 215 d1549 ± 210 e1608 ± 215 E
Means1596 ± 225 D1565 ± 238 C1526 ± 236 B1491 ± 235 A
p valuesintercropping: <0.001; mineral nitrogen fertilization: <0.001;
intercropping × mineral nitrogen fertilization: <0.001
1 as indicated in Table 2; 2 Values in columns for the interaction intercropping × mineral nitrogen fertilization followed by the same small letter (a, b, c, d, e, f) do not differ significantly at p ≤ 0.05. Means for the intercropping in a column followed by the same capital letter (A, B, C, D, E, F) do not differ significantly at p ≤ 0.05. Means for the mineral nitrogen fertilization in verse followed by the same capital letter (A, B, C, D) do not differ significantly at p ≤ 0.05; ± standard deviation.
Table 7. Mn concentration in narrowleaf lupine and cereals intercropping (mean values for 2021–2023) [mg kg−1 DM].
IntercroppingMineral Nitrogen Fertilization [kg N ha−1]Means
6040200
NL 1214 ± 7 e 2226 ± 17 e199 ± 5 f183 ± 2 e205 ± 19 E
SB100 ± 6 a78 ± 5 a58 ± 5 a51 ± 6 a72 ± 20 A
I1120 ± 11 b100 ± 2 b76 ± 5 b64 ± 5 b90 ± 23 B
I2144 ± 11c124 ± 10 c95 ± 12 c80 ± 8 c111 ± 27 C
I3163 ± 11 d149 ± 11 d129 ± 9 e110 ± 13 d138 ± 23 D
ST95 ± 3 a75 ± 5 a58 ± 6 a49 ± 6 a69 ± 18 A
I4114 ± 11 b99 ± 3 b74 ± 6 b64 ± 6 b88 ± 21 B
I5141 ± 14 c125 ± 7 c101 ± 4 c83 ± 5 c113 ± 24 C
I6160 ± 17 d146 ± 10 d122 ± 12 d108 ± 11 d134 ± 24 D
Means139 ± 37 D125 ± 41 C101 ± 36 B88 ± 40 A
p valuesintercropping: <0.001; mineral nitrogen fertilization: <0.001;
intercropping × mineral nitrogen fertilization: <0.001
1 as indicated in Table 2; 2 Values in columns for the interaction intercropping × mineral nitrogen fertilization followed by the same small letter (a, b, c, d, e, f) do not differ significantly at p ≤ 0.05. Means for the intercropping in a column followed by the same capital letter (A, B, C, D, E) do not differ significantly at p ≤ 0.05. Means for the mineral nitrogen fertilization in verse followed by the same capital letter (A, B, C, D) do not differ significantly at p ≤ 0.05; ± standard deviation.
Table 8. Cu concentration in narrowleaf lupine and cereals intercropping (mean values for 2021–2023) [mg kg−1 DM].
IntercroppingMineral Nitrogen Fertilization [kg N ha−1]Means
6040200
NL 15.97 ± 0.17 e 25.97 ± 0.09 e5.67 ± 0.05 e5.13 ± 0.12 g5.68 ± 0.36 F
SB4.43 ± 0.21 a4.27 ± 0.09 a4.10 ± 0.03 a3.90 ± 0.08 b4.18 ± 0.23 A
I14.87 ± 0.09 bc4.73 ± 0.12 b4.47 ± 0.05 bc4.03 ± 0.12 b4.53 ± 0.33 B
I24.90 ± 0.22 bc4.70 ± 0.16 b4.60 ± 0.08 c4.23 ± 0.12 c4.61 ± 0.29B C
I35.17 ± 0.17 d4.97 ± 0.17 c4.83 ± 0.05 d4.60 ± 0.08 e4.89 ± 0.24 D
ST4.40 ± 0.22 a4.33 ± 0.21 a4.07 ± 0.05 a3.73 ± 0.09 a4.13 ± 0.31 A
I44.77 ± 0.25 b4.63 ± 0.26 b4.40 ± 0.08 b4.20 ± 0.08 c4.50 ± 0.29 B
I54.93 ± 0.26 c4.77 ± 0.31 b4.57 ± 0.17 c4.40 ± 0.16 d4.67 ± 0.31 C
I65.27 ± 0.25 d5.17 ± 0.17 d4.97 ± 0.05 d4.80 ± 0.09 f5.05 ± 0.24 E
Means4.97 ± 0.49 D4.84 ± 0.51 C4.63 ± 0.47 B4.34 ± 0.43 A
p valuesintercropping: <0.001; mineral nitrogen fertilization: <0.001;
intercropping × mineral nitrogen fertilization: <0.001
1 as indicated in Table 2; 2 Values in columns for the interaction intercropping × mineral nitrogen fertilization followed by the same small letter (a, b, c, d, e, f, g) do not differ significantly at p ≤ 0.05. Means for the intercropping in a column followed by the same capital letter (A, B, C, D, E, F) do not differ significantly at p ≤ 0.05. Means for the mineral nitrogen fertilization in verse followed by the same capital letter (A, B, C, D) do not differ significantly at p ≤ 0.05; ± standard deviation.
Table 9. Zn concentration in narrowleaf lupine and cereals intercropping (mean values for 2021–2023) [mg kg−1 DM].
IntercroppingMineral Nitrogen Fertilization [kg N ha−1]Means
6040200
NL 158.1 ± 1.5 f 257.6 ± 0.3 g55.2 ± 1.2 e52.5 ± 2.9 g55.9 ± 2.8 F
SB33.1 ± 2.7 a32.1 ± 1.9 b30.1 ± 0.8 b29.0 ± 0.9 b31.1 ± 2.4 B
I135.3 ± 2.5 b34.0 ± 2.2 c31.4 ± 0.9 b30.5 ± 0.5 bc32.8 ± 2.6 C
I240.7 ± 0.5 d36.8 ± 1.5 d33.6 ± 1.8 c32.3 ± 1.8 d35.9 ± 3.6 D
I346.8 ± 1.5 e41.9 ± 1.3 e37.1 ± 2.6 d37.6 ± 2.5 f40.8 ± 4.4 E
ST31.4 ± 0.9 a30.3 ± 0.4 a28.1 ± 1.2 a26.9 ± 0.9 a29.2 ± 2.0 A
I434.1 ± 2.0 b32.5 ± 1.7 bc30.4 ± 0.7 b29.0 ± 0.8 b31.5 ± 2.4 BC
I538.0 ± 1.3 c36.0 ± 0.8 d33.7 ± 0.6 c31.2 ± 1.1 cd34.7 ± 2.7 D
I645.5 ± 0.2 e43.8 ± 0.8 f38.7 ± 0.4 d34.8 ± 1.0 e40.7 ± 4.3 E
Means40.3 ± 8.2 D38.3 ± 8.1 C35.4 ± 7.8 B33.8 ± 7.5 A
p valuesintercropping: <0.001; mineral nitrogen fertilization: <0.001;
intercropping × mineral nitrogen fertilization: <0.001
1 as indicated in Table 2; 2 Values in columns for the interaction intercropping × mineral nitrogen fertilization followed by the same small letter (a, b, c, d, e, f, g) do not differ significantly at p ≤ 0.05. Means for the intercropping in a column followed by the same capital letter (A, B, C, D, E, F) do not differ significantly at p ≤ 0.05. Means for the mineral nitrogen fertilization in verse followed by the same capital letter (A, B, C, D) do not differ significantly at p ≤ 0.05; ± standard deviation.
Table 10. Fe concentration in narrowleaf lupine and cereals intercropping (mean values for 2021–2023) [mg kg−1 DM].
IntercroppingMineral Nitrogen Fertilization [kg N ha−1]Means
6040200
NL 1184.9 ± 10.3 f 2190.3 ± 10.5 g171.9 ± 9.2 g160.0 ± 11.2 f176.8 ± 15.7 G
SB97.6 ± 9.0 a83.8 ± 5.6 a72.3 ± 3.9 b62.0 ± 3.0 a78.9 ± 14.5 A
I1114.8 ± 12.9 b100.6 ± 13.9 b89.7 ± 8.3 c77.0 ± 6.9 b95.6 ± 17.7 B
I2144.9 ± 5.6 d131.6 ± 8.9 d111.9 ± 8.0 d98.0 ± 0.9 c121.6 ± 19.2 D
I3170.2 ± 10.4 e153.4 ± 6.3 f138.2 ± 9.6 f118.3 ± 2.3 e145.0 ± 20.7 F
ST93.3 ± 3.6 a85.4 ± 5.1 a65.2 ± 2.9 a57.7 ± 3.5 a75.4 ± 15.0 A
I4110.0 ± 14.3 b102.4 ± 9.9 b90.3 ± 6.7 c77.7 ± 5.2 b95.1 ± 15.6 B
I5130.7 ± 10.6 c119.7 ± 9.3 c106.3 ± 4.0 d95.0 ± 2.7 c112.9 ± 15.4 C
I6170.2 ± 14.9 e146.6 ± 20.0 e123.9 ± 6.1 e109.2 ± 1.5 d137.5 ± 26.4 E
Means135.2 ± 33.8 D123.8 ± 35.0 C107.7 ± 32.4 B95.0 ± 30.4 A
p valuesintercropping: <0.001; mineral nitrogen fertilization: <0.001;
intercropping × mineral nitrogen fertilization: <0.001
1 as indicated in Table 2; 2 Values in columns for the interaction intercropping × mineral nitrogen fertilization followed by the same small letter (a, b, c, d, e, f, g) do not differ significantly at p ≤ 0.05. Means for the intercropping in a column followed by the same capital letter (A, B, C, D, E, F, G) do not differ significantly at p ≤ 0.05. Means for the mineral nitrogen fertilization in verse followed by the same capital letter (A, B, C, D) do not differ significantly at p ≤ 0.05; ± standard deviation.
Table 11. Mn uptake in narrowleaf lupine and cereals intercropping (mean values for 2021–2023) [kg ha−1].
IntercroppingMineral Nitrogen Fertilization [kg N ha−1]Means
6040200
NL 10.914 ± 0.340 c 21.091 ± 0.230 cd1.137 ± 0.281 g0.720 ± 0.156 f0.966 ± 0.308 EF
SB0.621 ± 0.144 a0.434 ± 0.076 a0.267 ± 0.041 a0.173 ± 0.031 a0.374 ± 0.191 A
I10.785 ± 0.193 b0.590 ± 0.149 a0.386 ± 0.089 ab0.276 ± 0.035 ab0.510 B ± 0.235 C
I21.149 ± 0.275 d0.957 ± 0.293 c0.563 ± 0.112 cd0.360 ± 0.034 bc0.757 ± 0.376 D
I31.149 ± 0.367 d1.132 ± 0.301 de0.768 ± 0.151 ef0.521 ± 0.038 de0.893 ± 0.363 E
ST0.718 ± 0.107 ab0.506 ± 0.050 a0.319 ± 0.031 ab0.224 ± 0.028 a0.442 ± 0.199 AB
I40.931 ± 0.103 c0.743 ± 0.100 b0.427 ± 0.026 bc0.302 ± 0.030 ab0.601 ± 0.261 C
I51.314 ± 0.126 e1.265 ± 0.149 e0.636 ± 0.045 de0.446 ± 0.029 cd0.915 ± 0.394 E
I61.378 ± 0.083 e1.431 ± 0.152 f0.809 ± 0.003 f0.607 ± 0.005 ef1.056 ± 0.367 F
Means0.996 ± 0.333 D0.905 ± 0.383 C0.590 ± 0.290 B0.403 ± 0.183 A
p valuesintercropping: <0.001; mineral nitrogen fertilization: <0.001;
intercropping × mineral nitrogen fertilization: <0.001
1 as indicated in Table 2; 2 Values in columns for the interaction intercropping × mineral nitrogen fertilization followed by the same small letter (a, b, c, d, e, f, g) do not differ significantly at p ≤ 0.05. Means for the intercropping in a column followed by the same capital letter (A, B, C, D, E, F) do not differ significantly at p ≤ 0.05. Means for the mineral nitrogen fertilization in verse followed by the same capital letter (A, B, C, D) do not differ significantly at p ≤ 0.05; ± standard deviation.
Table 12. Cu uptake in narrowleaf lupine and cereals intercropping (mean values for 2021–2023) [kg ha−1].
IntercroppingMineral Nitrogen Fertilization [kg N ha−1]Means
6040200
NL 10.025 ± 0.009 a 20.029 ± 0.007 b0.032 ± 0.008 de0.020 ± 0.004 bc0.027 ± 0.009 BC
SB0.028 ± 0.007 a0.024 ± 0.005 a0.019 ± 0.004 a0.014 ± 0.004 a0.021 ± 0.007 A
I10.033 ± 0.010 bc0.028 ± 0.007 ab0.023 ± 0.006 ab0.018 ± 0.003 ab0.025 ± 0.009 B
I20.039 ± 0.010 d0.036 ± 0.011 c0.028 ± 0.008 cd0.019 ± 0.003 b0.031 ± 0.012 D
I30.037 ± 0.013 cd0.038 ± 0.012 c0.029 ± 0.007 cde0.022 ± 0.004 bc0.032 ± 0.011 D
ST0.033 ± 0.004 bc0.029 ± 0.003 b0.023 ± 0.004 ab0.018 ± 0.004 ab0.026 ± 0.007 B
I40.039 ± 0.006 d0.034 ± 0.004 c0.025 ± 0.003 bc0.020 ± 0.004 bc0.030 ± 0.009 CD
I50.046 ± 0.006 e0.048 ± 0.005 d0.029 ± 0.002 cde0.024 ± 0.002 cd0.037 ± 0.012 E
I60.046 ± 0.005 e0.051 ± 0.007 d0.033 ± 0.003 e0.027 ± 0.002 d0.039 ± 0.011 E
Means0.036 ± 0.011 C0.035 ± 0.011 C0.027 ± 0.007 B0.020 ± 0.005 A
p valuesintercropping: <0.001; mineral nitrogen fertilization: <0.001;
intercropping × mineral nitrogen fertilization: <0.001
1 as indicated in Table 2; 2 Values in columns for the interaction intercropping × mineral nitrogen fertilization followed by the same small letter (a, b, c, d, e) do not differ significantly at p ≤ 0.05. Means for the intercropping in a column followed by the same capital letter (A, B, C, D, E) do not differ significantly at p ≤ 0.05. Means for the mineral nitrogen fertilization in verse followed by the same capital letter (A, B, C) do not differ significantly at p ≤ 0.05; ± standard deviation.
Table 13. Zn uptake in narrowleaf lupine and cereals intercropping (mean values for 2021–2023) [kg ha−1].
IntercroppingMineral Nitrogen Fertilization [kg N ha−1]Means
6040200
NL 10.249 ± 0.093 bc 20.283 ± 0.074 c0.318 ± 0.083 e0.209 ± 0.056 e0.265 ± 0.088 CD
SB0.205 ± 0.044 a0.179 ± 0.032 a0.139 ± 0.024 a0.100 ± 0.026 a0.156 ± 0.051 A
I10.233 ± 0.060 ab0.198 ± 0.043 a0.162 ± 0.041 a0.133 ± 0.024 abc0.181 ± 0.058 AB
I20.329 ± 0.088 d0.286 ± 0.090 c0.204 ± 0.050 bc0.146 ± 0.021 bc0.241 ± 0.099 C
I30.331 ± 0.109 d0.324 ± 0.102 d0.221 ± 0.043 c0.181 ± 0.034 de0.265 ± 0.103 CD
ST0.239 ± 0.035 ab0.204 ± 0.026 a0.156 ± 0.023 a0.126 ± 0.024 ab0.181 ± 0.051 AB
I40.281 ± 0.040 c0.242 ± 0.028 b0.176 ± 0.016 ab0.139 ± 0.021 bc0.209 ± 0.062 B
I50.357 ± 0.050 d0.367 ± 0.056 d0.212 ± 0.019 c0.168 ± 0.013 cd0.276 ± 0.096 D
I60.398 ± 0.056 e0.437 ± 0.079 e0.258 ± 0.024 d0.198 ± 0.023 de0.323 ± 0.111 E
Means0.291 ± 0.092 C0.280 ± 0.103 C0.205 ± 0.067 B0.156 ± 0.045 A
p valuesintercropping: <0.001; mineral nitrogen fertilization: <0.001;
intercropping × mineral nitrogen fertilization: <0.001
1 as indicated in Table 2; 2 Values in columns for the interaction intercropping × mineral nitrogen fertilization followed by the same small letter (a, b, c, d, e) do not differ significantly at p ≤ 0.05. Means for the intercropping in a column followed by the same capital letter (A, B, C, D, E) do not differ significantly at p ≤ 0.05. Means for the mineral nitrogen fertilization in verse followed by the same capital letter (A, B, C) do not differ significantly at p ≤ 0.05; ± standard deviation.
Table 14. Fe uptake in narrowleaf lupine and cereals intercropping (mean values for 2021–2023) [kg ha−1].
IntercroppingMineral Nitrogen Fertilization [kg N ha−1]Means
6040200
NL 10.782 ± 0.278 b 20.921 ± 0.196 c0.975 ± 0.207 e0.621 ± 0.107 d0.825 ± 0.247 D
SB0.601 ± 0.125 a0.467 ± 0.078 a0.333 ± 0.051 a0.215 ± 0.059 a0.404 ± 0.167 A
I10.749 ± 0.168 b0.573 ± 0.093 a0.454 ± 0.091 ab0.331 ± 0.038 ab0.527 ± 0.188 B
I21.166 ± 0.300 d1.019 ± 0.326 cd0.675 ± 0.152 c0.448 ± 0.080 bc0.827 ± 0.369 D
I31.194 ± 0.361 d1.180 ± 0.350 de0.826 ± 0.166 d0.573 ± 0.107 cd0.943 ± 0.375 E
ST0.707 ± 0.098 ab0.573 ± 0.049 a0.361 ± 0.054 a0.276 ± 0.074 a0.479 ± 0.185 AB
I40.892 ± 0.074 c0.757 ± 0.059 b0.519 ± 0.026 b0.369 ± 0.044 ab0.634 ± 0.210 C
I51.220 ± 0.128 d1.206 ± 0.123 e0.668 ± 0.062 c0.513 ± 0.051 cd0.902 ± 0.331 DE
I61.470 ± 0.097 e1.425 ± 0.089 f0.825 ± 0.043 d0.618 ± 0.050 d1.084 ± 0.378 F
Means0.976 ± 0.346 D0.902 ± 0.364 C0.626 ± 0.239 B0.440 ± 0.159 A
p valuesintercropping: <0.001; mineral nitrogen fertilization: <0.001;
intercropping × mineral nitrogen fertilization: <0.001
1 as indicated in Table 2; 2 Values in columns for the interaction intercropping × mineral nitrogen fertilization followed by the same small letter (a, b, c, d, e) do not differ significantly at p ≤ 0.05. Means for the intercropping in a column followed by the same capital letter (A, B, C, D, E, F) do not differ significantly at p ≤ 0.05. Means for the mineral nitrogen fertilization in verse followed by the same capital letter (A, B, C, D) do not differ significantly at p ≤ 0.05; ± standard deviation.
Table 15. Correlation coefficients between microelement concentration in soil and green matter, uptake, and yield.
YieldMn Concentration in Green MatterMn Concentration in Soil YieldZn Concentration in Green MatterZn Concentration in Soil
Mn uptake0.7749 ***0.6648 ***0.3041 **Zn uptake0.8737 ***0.4454 ***0.6673 ***
Mn concentration in soil−0.0599 ns0.5277 *** Zn concentration in soil0.4521 ***0.6020 ***
Mn concentration in green matter0.0857 ns Zn concentration in green matter−0.0163 ns
yieldCu concentration in green matterCu concentration in soil yieldFe concentration in green matterFe concentration in soil
Cu uptake0.9643 ***0.2949 **0.4804 ***Fe uptake0.8201 ***0.6118 ***0.2202 *
Cu concentration in soil0.4862 ***0.1077 ns Fe concentration in soil0.0349 ns0.3583 ***
Cu concentration in green matter0.0473 ns Fe concentration in green matter0.0926 ns
Statistically significant at * for p ≤ 0.05, ** for p ≤ 0.01, and *** for p ≤ 0.001; ns—not significant (p > 0.05).
Disclaimer/Publisher’s Note: The statements, opinions and data contained in all publications are solely those of the individual author(s) and contributor(s) and not of MDPI and/or the editor(s). MDPI and/or the editor(s) disclaim responsibility for any injury to people or property resulting from any ideas, methods, instructions or products referred to in the content.