Article

DGS-Net: A Lightweight Deformable and Occlusion-Aware Network for Paddy Weed Detection on Edge Devices

1
College of Agricultural Equipment and Energy Engineering, Northeast Agricultural University, Harbin 150030, China
2
School of Hydraulic Science and Engineering, Northeast Agricultural University, Harbin 150030, China
3
School of Intelligent Science and Engineering, Northeast Agricultural University, Harbin 150030, China
*
Author to whom correspondence should be addressed.
Agriculture 2026, 16(10), 1039; https://doi.org/10.3390/agriculture16101039
Submission received: 1 April 2026 / Revised: 13 April 2026 / Accepted: 8 May 2026 / Published: 11 May 2026
(This article belongs to the Section Artificial Intelligence and Digital Agriculture)

Abstract

To address the dual challenges of discriminating weeds from rice seedlings for precision weed management operations, such as targeted spraying and robotic weeding, in complex paddy-field scenes and deploying high-precision models on resource-limited edge devices, we propose DGS-Net, a deformable attention, GSConv-based feature fusion, and SEAM-enhanced lightweight network based on YOLOv11n. The backbone incorporates a convolutional block with parallel split attention and deformable attention transformer (C2PSA_DAT) module to improve the extraction of irregular and fine-grained weed features, the neck integrates a VoV-GSCSP module to enable lightweight multi-scale feature fusion for small and densely distributed targets, and a separated and enhancement attention module (SEAM) is placed before the detection head to enhance robustness under leaf occlusion and complex paddy-field background interference. In comparative experiments conducted on the paddy-field dataset under unified training and evaluation settings, DGS-Net achieved 91.7% precision, 86.8% recall, and 92.4% mean average precision (mAP), with a model size of 5.8 MB and a computational cost of 6.2 giga floating-point operations (GFLOPs). Compared with representative lightweight baseline detectors, DGS-Net showed a more favorable balance between detection accuracy and deployment efficiency. In additional edge-device deployment tests using the test set, the model sustained real-time inference at 32.5 FPS and achieved mAP@0.5, precision, and recall of approximately 0.928, 0.919, and 0.867, respectively. Overall, DGS-Net improves irregular feature extraction, enables lightweight multi-scale feature fusion, and increases robustness to occlusion while retaining strong deployability. The method therefore provides practical visual-perception support for precise, real-time crop–weed discrimination and precision weed management in complex paddy-field environments.

1. Introduction

Rice is one of the most important staple crops worldwide, and stable rice production is closely linked to food security [1]. In paddy-field cultivation, weed control during the early growth stage is especially important because this period determines whether rice seedlings can establish a favorable population structure under field competition [2]. Representative annotated target classes in this study included barnyard grass, Sagittaria trifolia, Alisma spp., rice seedlings, and reed, which frequently co-occur during the early growth stage of paddy fields, and accurate discrimination among them is directly related to subsequent selective weed control. These targets, especially the weed species, compete strongly for nutrients, water, light, and growing space, thereby affecting rice growth and final yield [3,4]. Weed infestation also lowers rice market grade, raises harvesting and drying costs, and can reduce quality and sale price. Traditional weeding relies on manual identification or blanket pesticide spraying, which is inefficient and causes serious ecological pollution and pesticide residues from overapplication. Thus, a real-time and reliable crop–weed discrimination method for complex paddy-field environments is crucial for supporting timely weed control, reducing unnecessary herbicide application, improving field-management efficiency, and advancing the green development of smart agriculture [5,6,7].
Weed recognition technology has evolved from traditional image processing methods reliant on manual features, such as color and texture, to automatic feature extraction driven by deep learning [8,9]. Over the past five years, one-stage object detection algorithms, particularly the YOLO series, have made significant advancements in this domain [10,11]. Wu et al. improved the residual structure of YOLOv4 to strengthen shallow feature propagation and local detail retention, thereby enhancing the representation and detection of small weed targets in agricultural scenes [12]. Further developments, such as HAD-YOLO, improved detection accuracy in complex agricultural backgrounds by optimizing the feature pyramid, which enhanced multi-scale feature aggregation and strengthened the representation of small targets under cluttered field conditions [13]. Similar difficulties have also been reported in other agricultural vision tasks, where small targets, occlusion, and structural interference likewise affect detection performance. For instance, Yang et al. proposed YOLO-SGD based on YOLOv7-l by introducing involution in the early backbone to enhance the spatial specificity of shallow features. In addition, the explicit visual center (EVC) and spatial context pyramid (SCP) modules were integrated at the backbone output to suppress instance interference caused by root winding and to improve contextual and multi-scale feature representation, especially for small and partially occluded targets [14]. This study suggests that robust weed recognition under complex field conditions can be improved not merely by replacing the detector, but by introducing targeted architectural designs for shallow feature preservation, interference suppression, and multi-scale feature fusion under dense distribution and leaf-overlap occlusion.
In recent years, research has transitioned from a primary focus on accuracy to a coordinated emphasis on accuracy, speed, and computational constraints. AGRI-YOLO employed the lightweight YOLOv11n as the detection backbone to improve inference efficiency in cornfield weed detection, demonstrating the practical value of lightweight one-stage detectors for real-time agricultural applications [15,16]; GE-YOLO improved multi-scale feature fusion through the Gold-YOLO feature aggregation network, which strengthened information interaction across feature levels and enhanced the representation of targets with scale variation in field environments [17]. The latest models, YOLO-CESn [18] and GTDR-YOLOv12 [14], sought to address real-time detection challenges in complex field environments by balancing lightweight design with enhanced feature representation, thereby reducing parameter burden while preserving detection performance. Furthermore, for the real-time detection of multi-trait and small-scale targets in the field, Yu et al. introduced SLW-YOLO, which incorporated the LSKNet attention mechanism to enhance attention to informative regions, a dedicated small-target detection layer (SNet) to improve sensitivity to tiny objects, and the WIoU v3 loss function to optimize localization quality, thereby achieving a better balance between accuracy and speed in complex backgrounds [19]. In the context of high-speed detection requirements on production lines, Li et al. developed Cotton-YOLO, which integrated ConvNext and Swin-Transformer into the backbone and detection head of YOLOv7 to combine stronger local feature extraction with improved contextual modeling, thereby enabling high-speed inference without sacrificing accuracy [20]. Concurrently, Pawłowski et al. conducted seed size detection and measurement utilizing the instance segmentation capabilities of YOLOv8, which enabled more precise object boundary delineation and quantitative measurement, thereby achieving both high accuracy and low error rates [21]. Additionally, the incorporation of the Transformer mechanism and deformable attention, as seen in YOLO-SW [22], improves the modeling of long-range dependencies and spatially adaptive feature sampling, which is beneficial for capturing target deformation and irregular morphology. Window self-attention modules such as Swin-Transformer have been used in agricultural target detection to improve contextual representation in complex backgrounds while controlling computational cost through localized attention computation, thus making them more suitable for real-time applications [23]. These studies indicate that recent performance gains in agricultural detection mainly rely on improved multi-scale fusion, enhanced contextual modeling, stronger attention to small or irregular targets, and lightweight architectural design for real-time deployment.
Despite these advances, the previous studies collectively suggest that recent performance improvements in agricultural detection mainly rely on enhanced shallow feature preservation, stronger multi-scale feature fusion, better contextual or attention-based modeling, and lightweight architectural optimization. However, the current literature still lacks a method that can simultaneously address the specific requirements of early-stage paddy-field crop–weed discrimination [24,25,26]. In this scenario, rice seedlings and weeds such as barnyard grass often exhibit highly similar morphology, while water-surface reflection, muddy background textures, and severe leaf overlap further increase the risk of false and missed detections [27,28]. At the same time, agricultural edge platforms impose strict constraints on model size, computational cost, and real-time inference capability. Therefore, the unresolved gap is not simply the need for higher detection accuracy, but the lack of a lightweight and robust method that can jointly handle fine-grained crop–weed confusion, complex paddy-field interference, and edge-side deployment requirements [29,30].
To address the above challenges, this study proposes DGS-Net, a lightweight weed detection model based on YOLOv11n for paddy-field environments. Unlike existing lightweight YOLO-based detectors that mainly improve deployment efficiency by reducing network scale or simplifying convolutional operations, DGS-Net is designed as a task-oriented architecture for the specific visual difficulties of paddy-field weed detection. In practical field scenes, weeds often exhibit irregular leaf shapes, small and dense distributions, high visual similarity to rice seedlings, partial occlusion, and interference from muddy backgrounds and water–surface reflections. To cope with these problems, a C2PSA_DAT module is introduced into the backbone to strengthen deformable feature extraction for weeds with irregular contours and elongated structures [31]; a VoV-GSCSP module is embedded in the neck to improve lightweight multi-scale feature fusion while controlling computational cost [32,33].
In addition, a separated and enhancement attention module (SEAM) is incorporated before the detection head to enhance the representation of partially occluded weed targets and suppress background interference. Through this coordinated design, DGS-Net aims to achieve a better balance between detection accuracy, model complexity, and edge-side deployment suitability, providing a practical solution for real-time weed recognition in paddy-field robotic and precision spraying applications.

2. Materials and Methods

2.1. Dataset Establishment

For consistency with the original annotation protocol, the field labels “barnyard”, “seedling”, and “reed” are retained throughout the manuscript. These terms refer to barnyard grass, rice seedlings, and reed, respectively, and are used as annotation categories rather than as strict taxonomic terms.
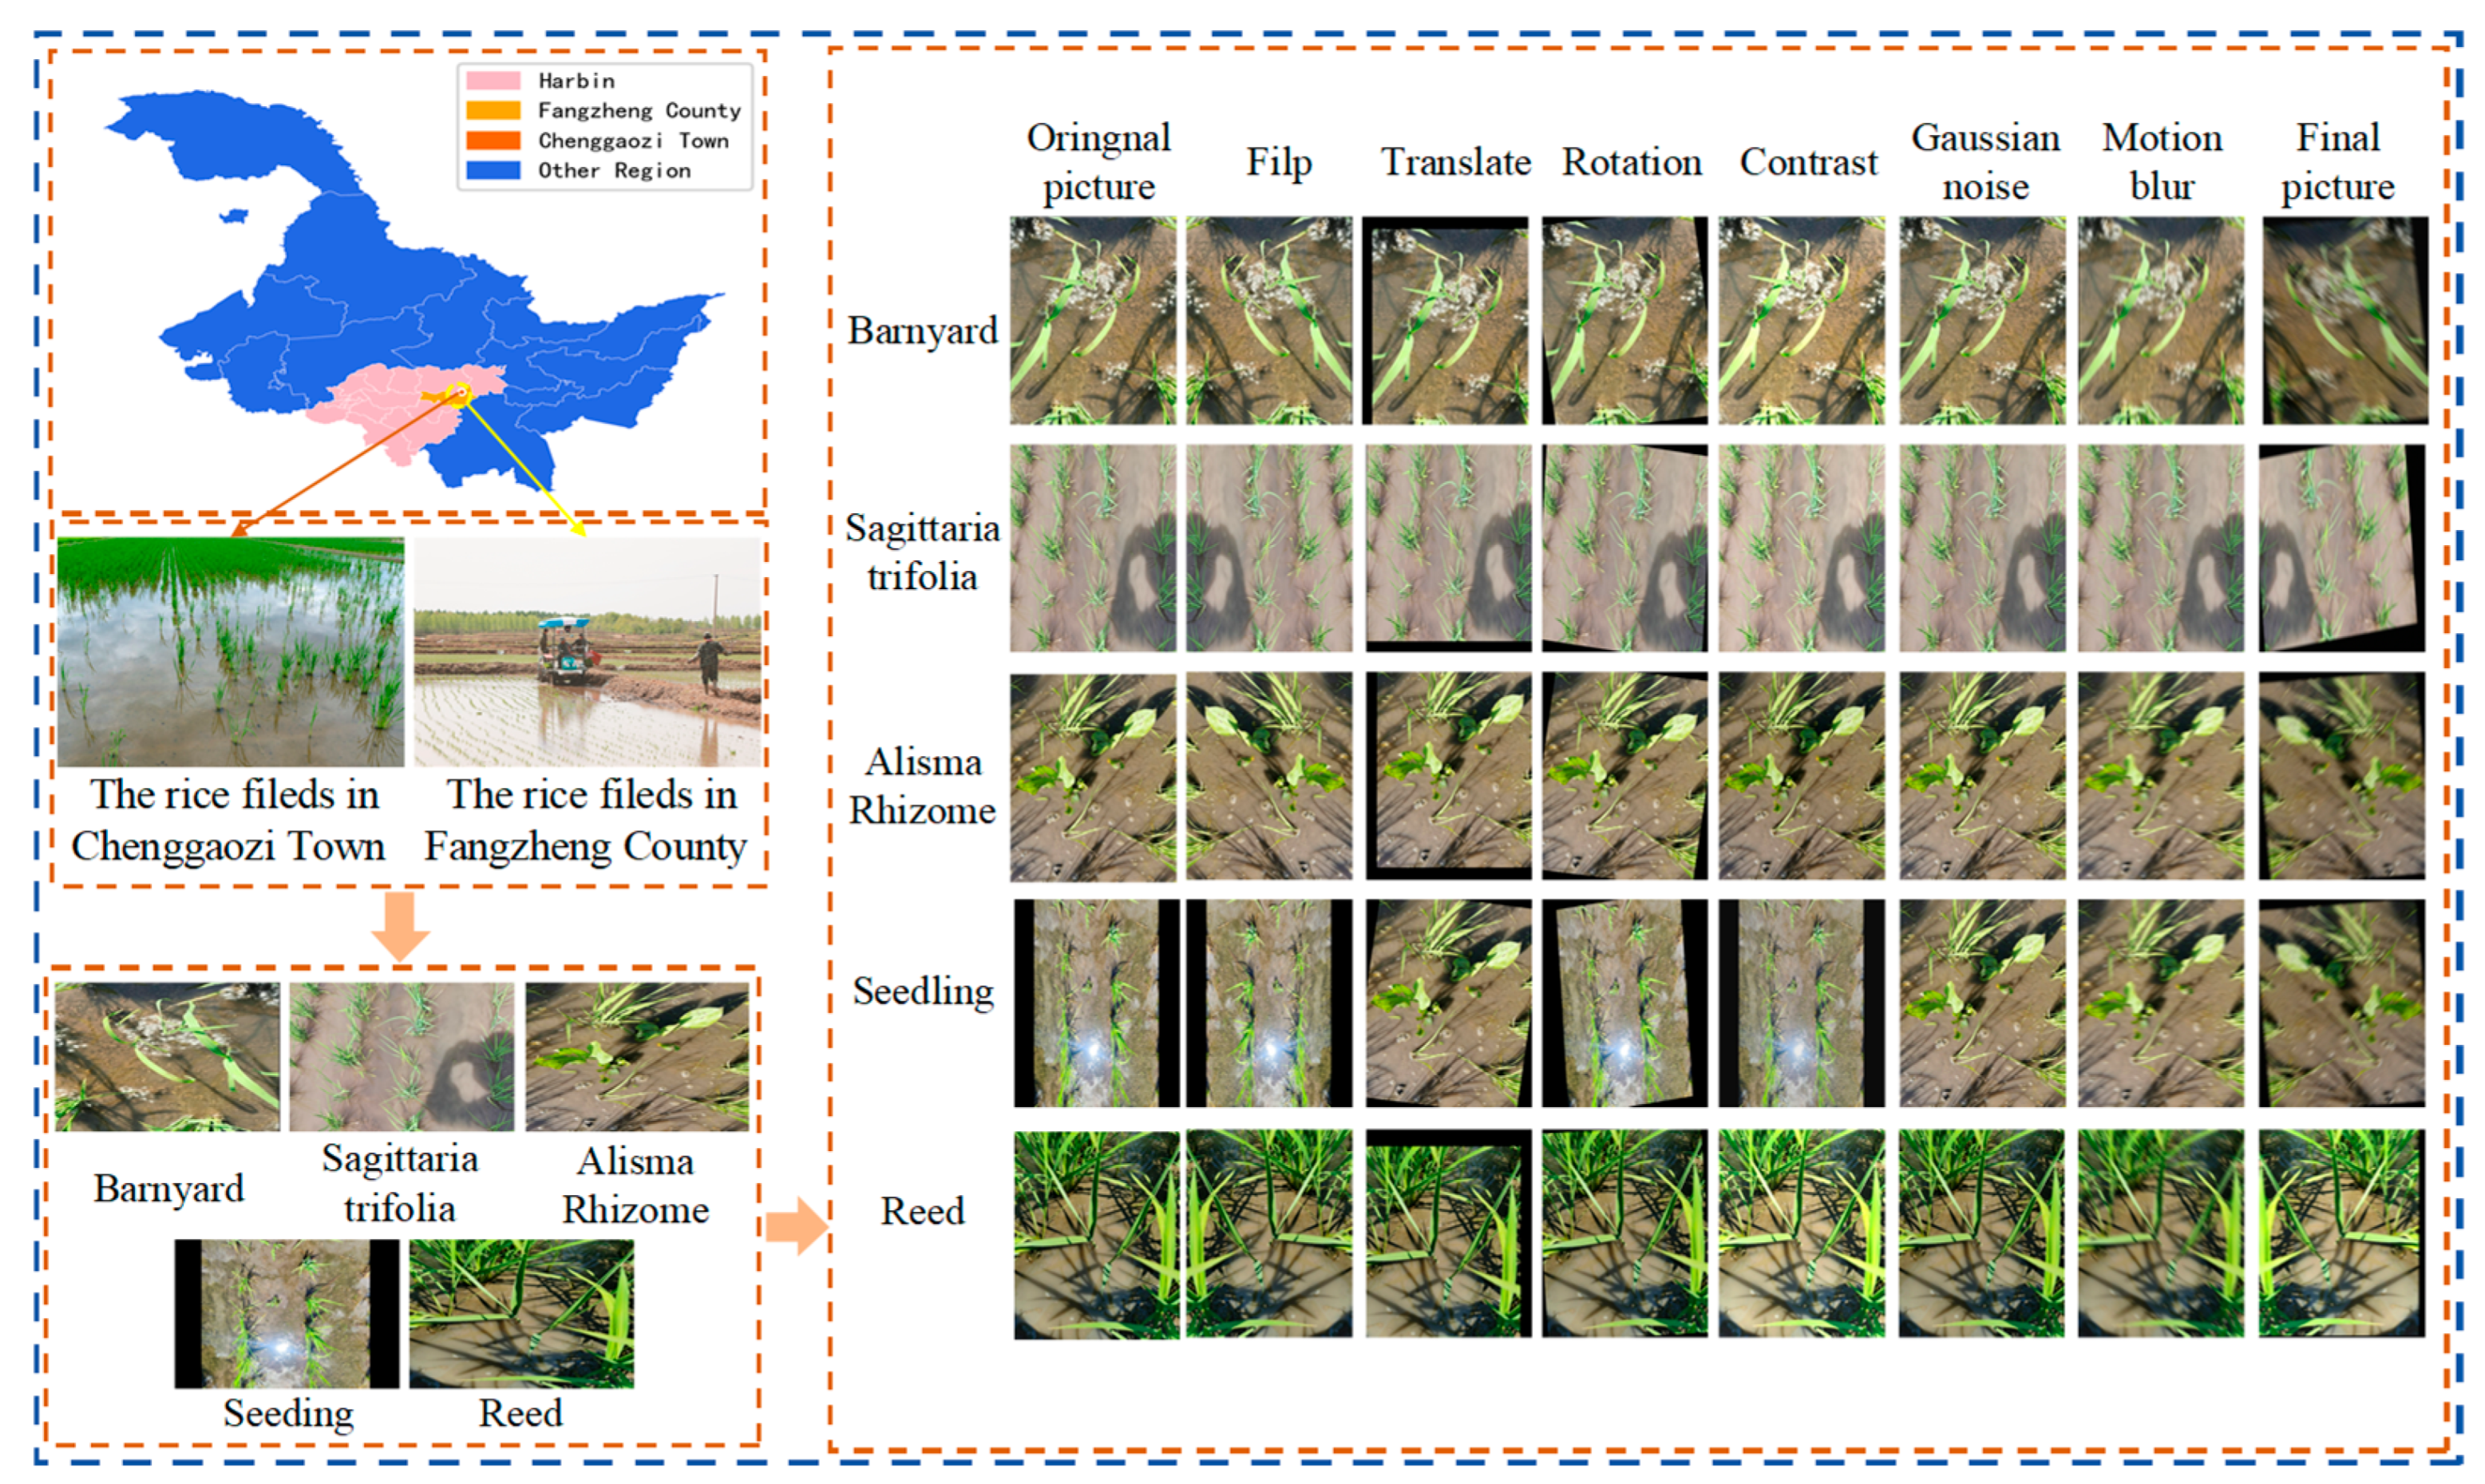
Field images were acquired at two paddy-field sites in Harbin, Heilongjiang Province, China, during June–July 2023 and June–July 2024. Image capture occurred between 08:00–11:30 and 14:00–16:30 at 10–30 days after rice transplanting, which corresponds to a critical period for early weed control and crop establishment in paddy fields. The camera was mounted ~0.6 m above ground, with the optical axis tilted 45°–90° to sample varied field perspectives. In total, 1979 images were collected under diverse backgrounds, illumination levels, and occlusion conditions. Following the dataset labeling protocol, five classes were annotated: barnyard, Sagittaria trifolia, Alisma spp., seedling, and reed, because these targets are commonly encountered during early-stage paddy-field management and are important for crop–weed discrimination. All images were manually annotated with LabelImg and saved in YOLO format. The dataset was randomly split into training, validation, and test sets in a 7:2:1 ratio. The detailed preprocessing pipeline is shown in Figure 1.

2.2. Construction of Detection Methods

2.2.1. YOLOv11n Model

In this study, YOLOv11n was selected as the baseline model because it provides a favorable trade-off between detection accuracy and inference efficiency, making it suitable for deployment scenarios with limited computational resources. The YOLOv11n architecture mainly consists of an input layer, a backbone network, a neck network, and a detection head. The input layer performs preprocessing operations such as image-size normalization; the backbone extracts features at different semantic levels; the neck fuses multi-scale features to improve target representation in complex backgrounds; and the detection head outputs category and localization information. Based on this baseline, DGS-Net was further developed in this study [34].
The YOLOv11n architecture comprises four primary components: the input layer, backbone, neck, and detection head. The input layer performs preprocessing operations such as image-size normalization. The backbone extracts feature information at different levels, and its representation capability is enhanced by the C3k2 and C2PSA modules. The neck fuses multi-scale features to improve target recognition in complex backgrounds. Finally, the detection head predicts target categories and locations.

2.2.2. DGS-Net

To improve the detection of small, densely distributed, and partially occluded targets in paddy fields while maintaining deployment efficiency, this study developed DGS-Net based on YOLOv11n. The improvements focus on three parts of the network: the backbone, neck, and detection head.
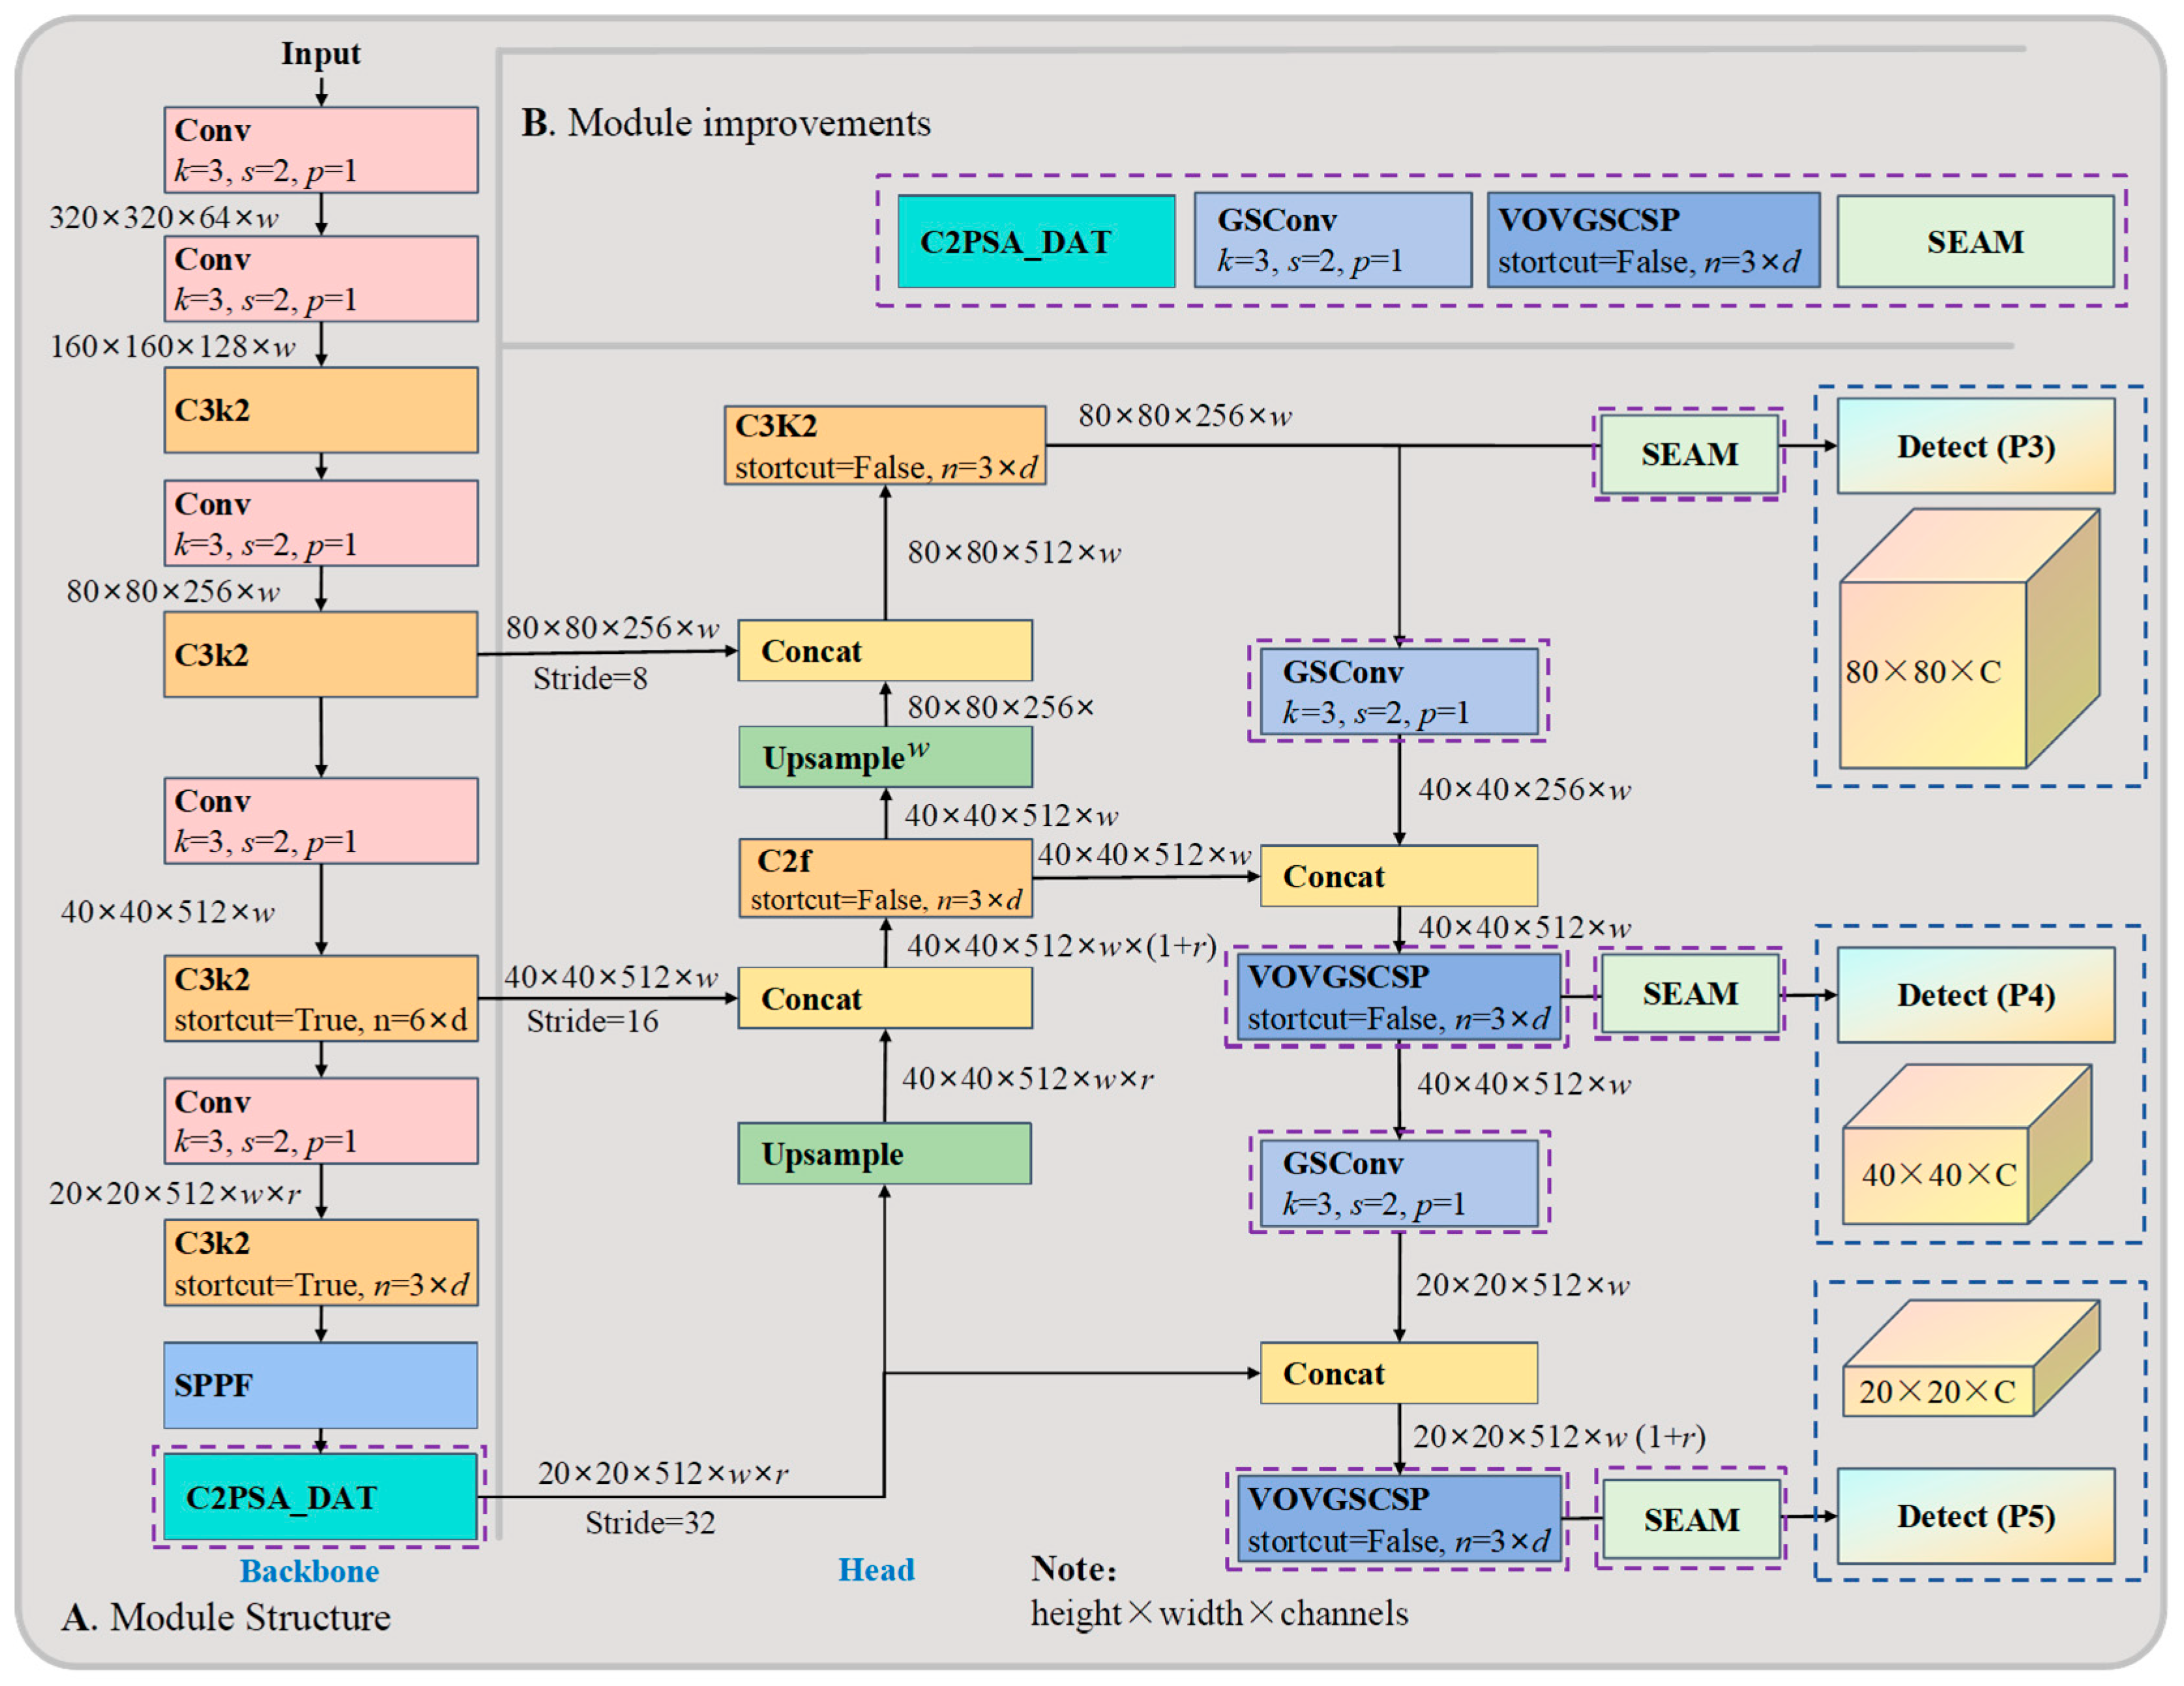
In the backbone, the original C2PSA module is replaced with C2PSA_DAT. Unlike the original C2PSA, this module retains the outer C2-based split–transform–fusion framework but replaces the internal PSA attention unit with DAT-based deformable attention. In this way, one branch preserves local feature information, while the other branch performs spatially adaptive attention modeling on informative regions, thereby improving the representation of irregular and fine-grained weed features. In the neck, conventional convolution and feature-fusion modules are replaced with GSConv and VoV-GSCSP to improve multi-scale feature representation while reducing computational cost. Before the detection head, the SEAM module is introduced to enhance robustness under occlusion and uneven illumination. The overall structure of the improved model is shown in Figure 2.
(1)
C2PSA_DAT module
This module adaptively modeled local salient features by learning the spatial offsets of feature points, allowing attention calculations to be performed solely on a limited number of key positions. Consequently, this approach significantly decreased the computational burden while enhancing the relevance and discriminability of feature representations [31]. Compared with the original C2PSA, the proposed C2PSA_DAT retains the outer split–transform–fusion framework while replacing the internal attention unit in the attention branch with DAT-based deformable attention.
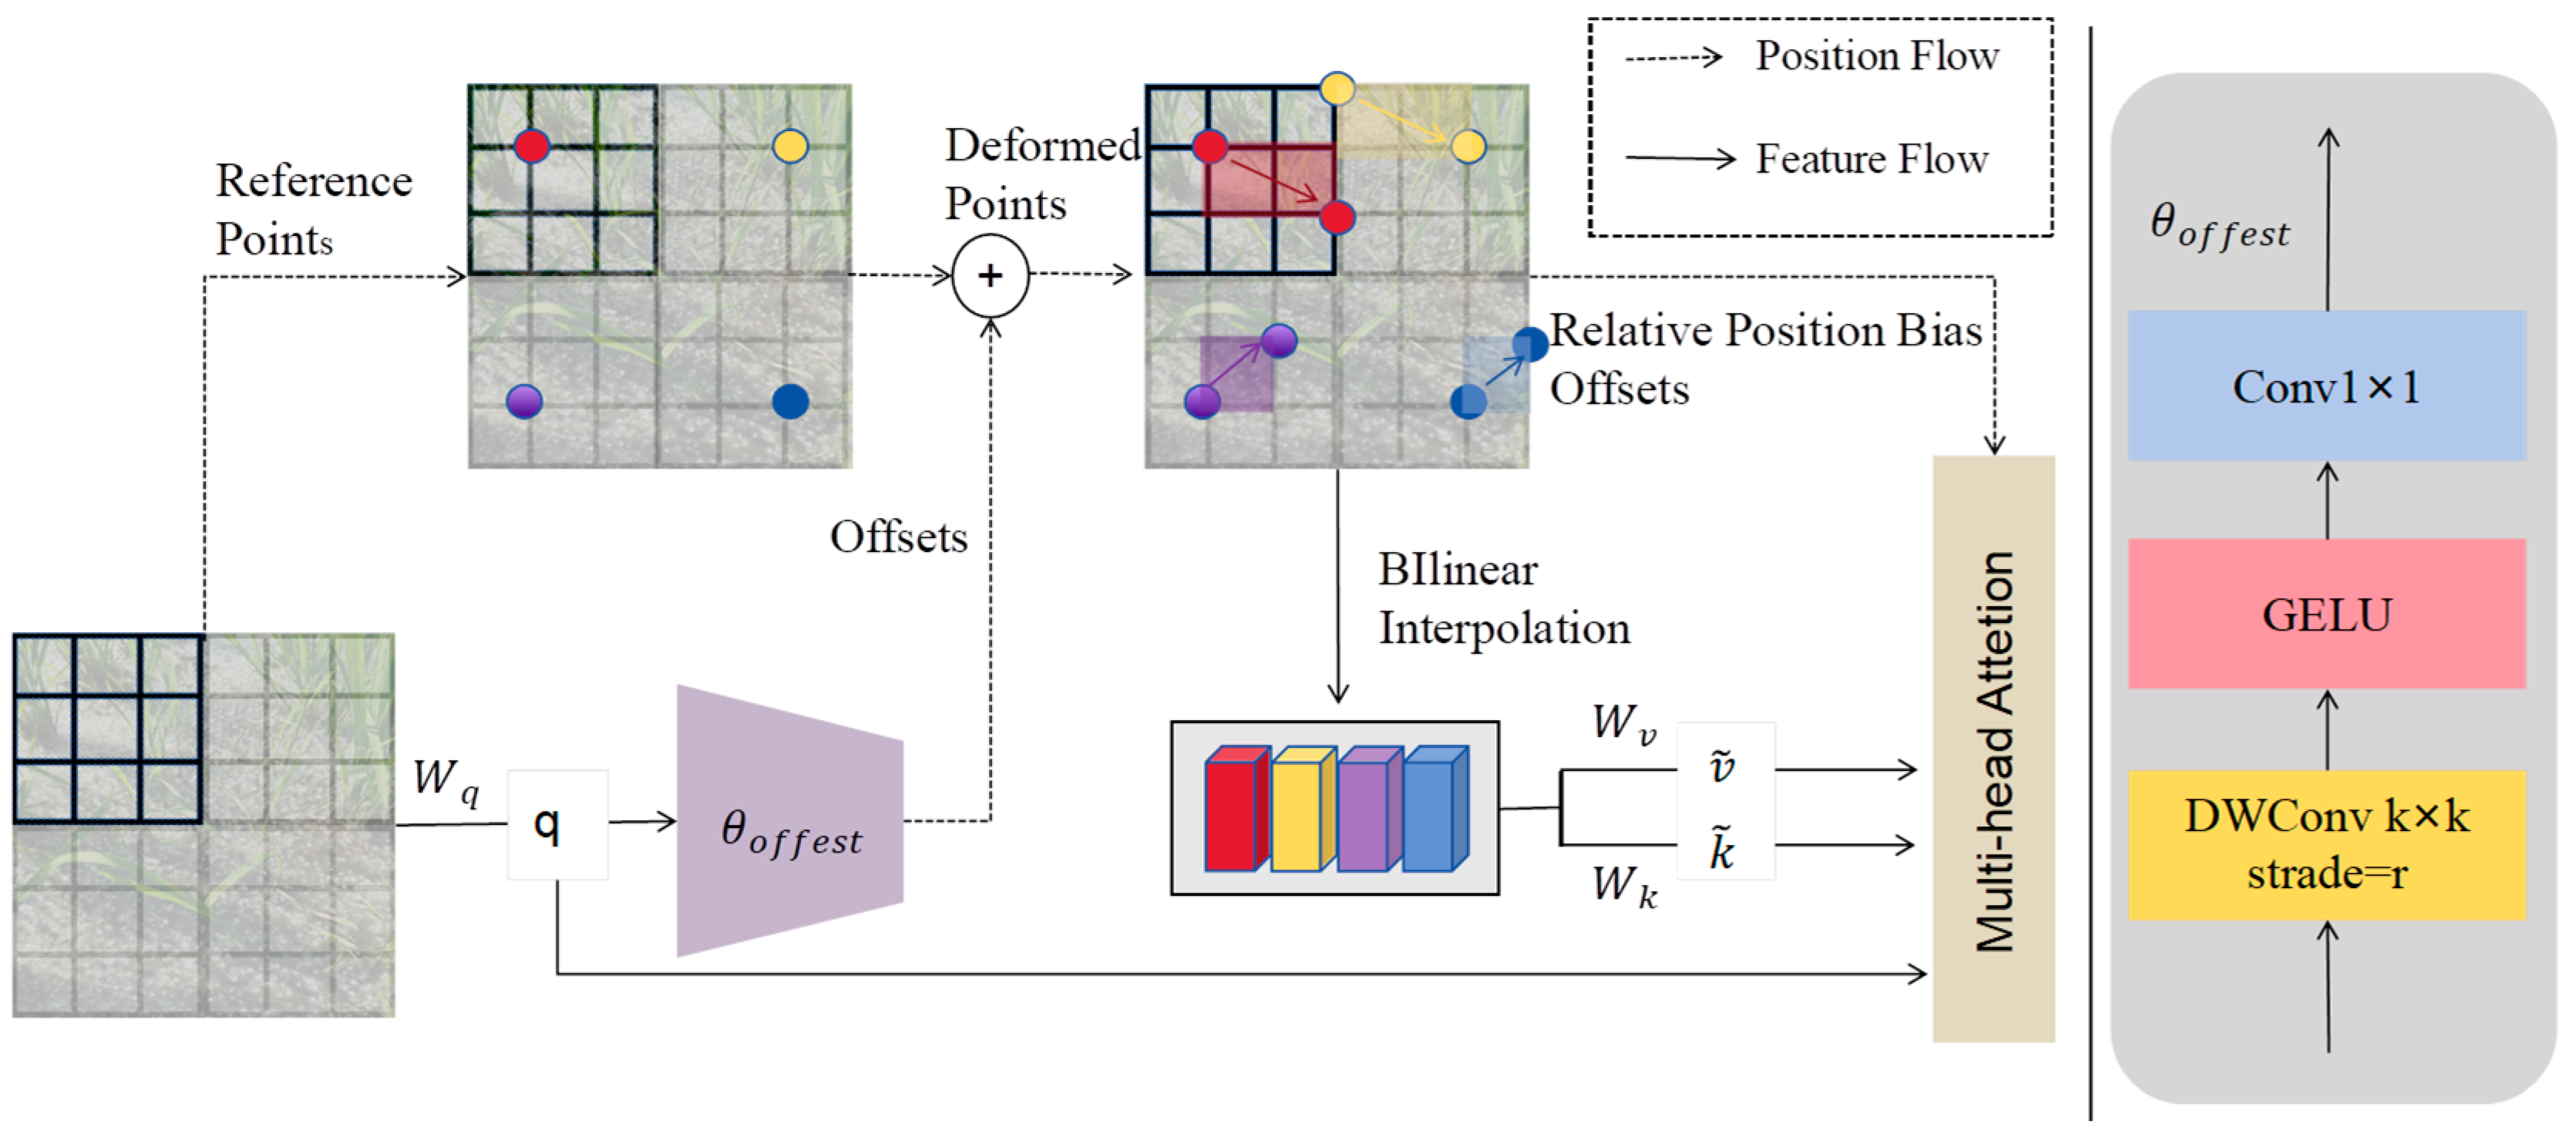
The core of the DAT module resided in its deformable attention mechanism, which contrasted with the dense modeling approach applied to global pixels in the standard Transformer. In C2PSA_DAT, this deformable attention is embedded into the PSABlock-based attention path rather than replacing the whole outer module structure. For the input feature map, DAT initially established a uniform set of reference points within the spatial dimension. By using the query features as input, it predicted the corresponding two-dimensional offsets for each reference point through a lightweight offset-generation branch. Utilizing this offset information, the module dynamically sampled key and value features from the corresponding positions on the feature map, thereby constructing deformed key and value sets and focusing the attention calculation on the local regions most pertinent to the current query.
During the attention calculation, DAT performed multi-head attention between the dynamically sampled features and query vectors while incorporating relative position bias derived from the deformed sampling locations to enhance the model’s ability to model spatial structural relationships. This approach allowed DAT to preserve Transformers’ global modeling capability while significantly reducing redundant computation, making the attention mechanism better aligned with the actual spatial distribution of targets. It was worth noting that the offset-generation branch employed a lightweight convolutional structure, which helped preserve computational efficiency while enabling adaptive spatial sampling.
In the feature extraction and fusion stage, this module directed the network to attend to regions that exhibited pronounced morphological changes and concentrated structural information, thereby reducing interference from redundant background features. Within the C2PSA_DAT structure, this deformable attention branch worked together with the preserved feature branch to improve irregular-feature modeling without discarding the lightweight design of the original C2PSA. This focused attention improved the model’s efficiency and accuracy in visual tasks such as object detection. The schematic diagram of the network structure and information flow of the DAT module is shown in Figure 3.
(2)
GSConv and VoV-GSCSPmodule
To reduce the neck network’s computational cost and parameter count while largely preserving feature representation, we introduced GSConv, a lightweight convolution structure, into the feature-fusion stage and subsequently built the VoV-GSCSP module to replace conventional convolutions and the standard CSP structure. This design effectively addressed the limitation of reduced feature representation in depthwise separable convolutions while maintaining real-time performance [32].
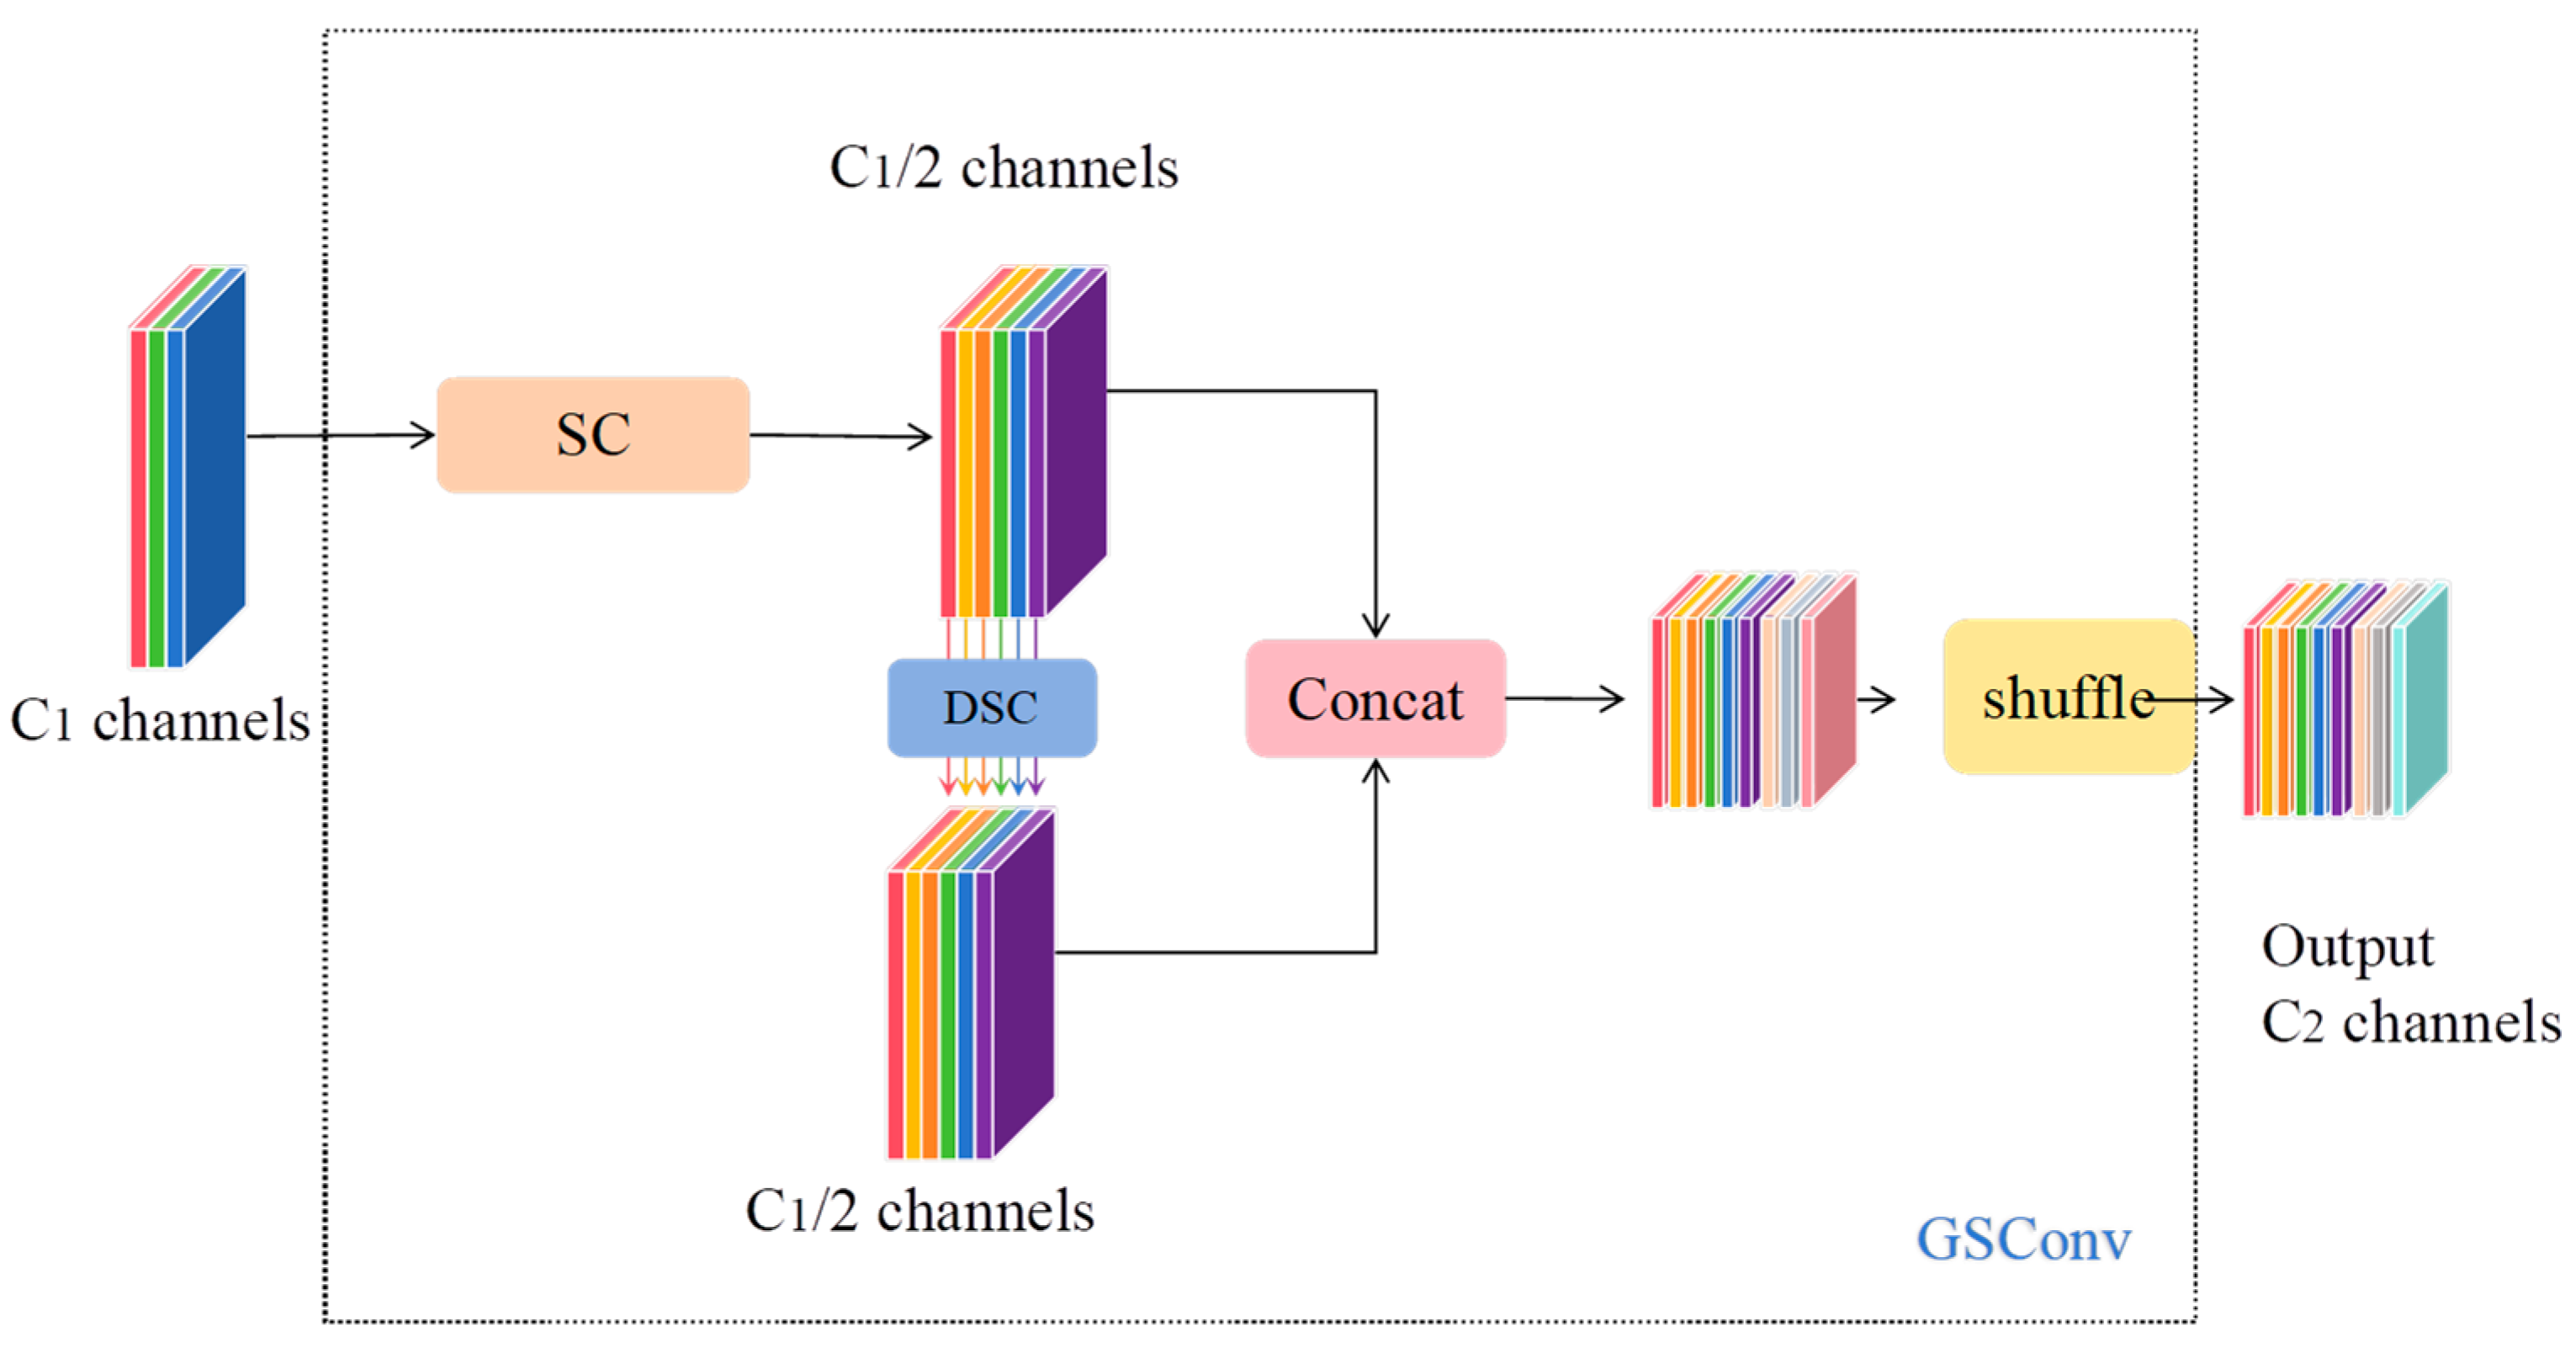
GSConv (grouped shuffle convolution) represents a lightweight convolutional architecture that integrates the advantages of standard convolution and depthwise separable convolution. Instead of solely depending on depthwise separable convolution, GSConv adopts a mixed feature-generation approach: it utilizes standard convolution for generating some features to maintain robust inter-channel correlations while employing depthwise separable convolution for generating the rest to decrease computational load. Subsequently, the module merges these two sets of features along the channel dimension, followed by applying a channel shuffle operation to enhance information flow. This fusion enables the high-quality features from standard convolution to permeate into the lightweight branch, resulting in performance comparable to standard convolution but with reduced computational requirements.
In its structural implementation, GSConv first applies a standard convolution to generate features for half of the output channels. It then feeds these features into a large-kernel depthwise separable convolution to further extract spatial information. The two feature sets are concatenated and rearranged afterward. This design substantially reduces the parameter count and FLOPs while preserving the network’s nonlinear modeling capacity, making it well-suited for real-time detection tasks constrained by computational resources. The overall GSConv architecture is shown in Figure 4.
Building on GSConv, we incorporated the one-shot aggregation concept of VoVNet and designed the VoV-GSCSP module to enhance feature fusion. The module adopts a CSP-based topology to split the input into two branches. One branch preserves shallow semantic information, whereas the other branch performs progressive feature extraction through GSConv-based bottlenecks. The two branches are then concatenated and fused by a 1 × 1 convolution to generate the final output. Compared with conventional CSP or VoV-style modules, VoV-GSCSP reduces computational cost and parameter count while maintaining strong feature representation, making it suitable for real-time object detection on resource-constrained platforms.
(3)
SEAM module
To improve the network’s ability to perceive locally missing targets in complex scenes, particularly when targets were occluded and local information was incomplete, we introduced the separated and enhancement attention module to adaptively amplify key-region features. SEAM explicitly modeled channel dependencies and spatial response intensities to compensate for features in occluded regions and to strengthen the discriminative power of visible regions. This combined effect reduced the likelihood of missed and false detections [33].
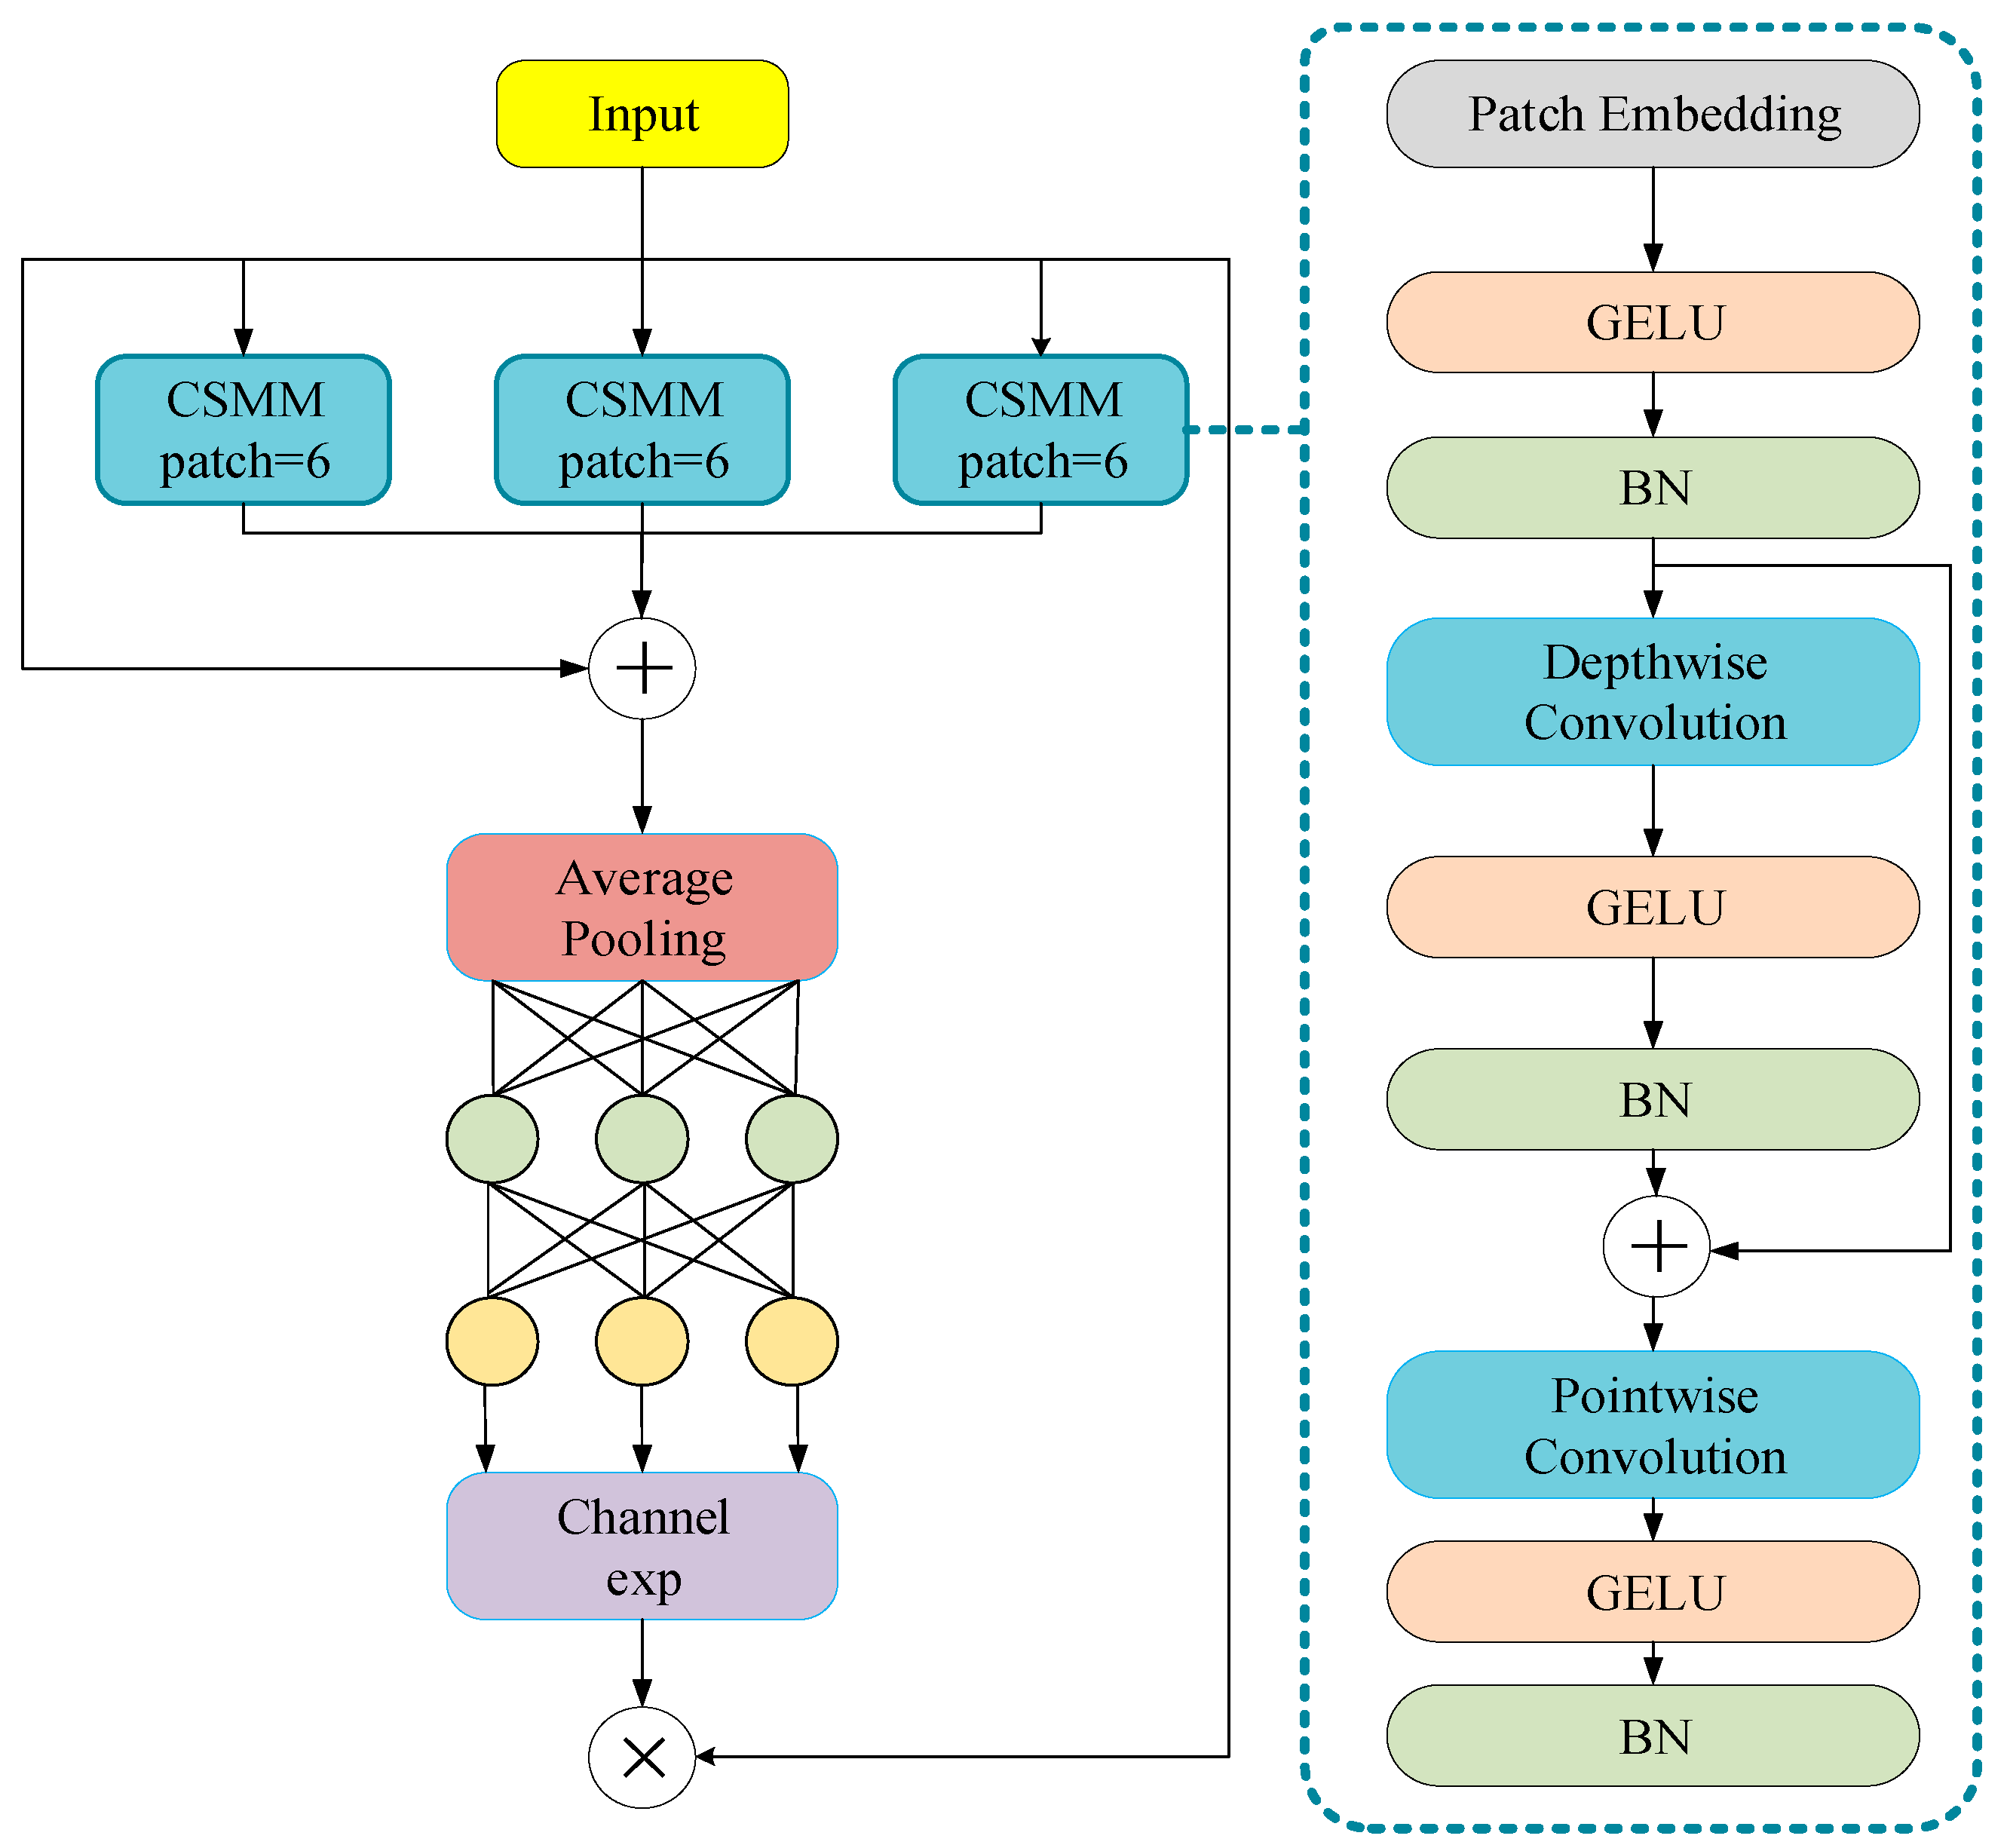
The SEAM module was designed to be lightweight. Its central concept was to model features separately and apply enhanced recalibration while keeping computational cost low. The module first processed input features with depthwise separable convolution to separate spatial feature extraction from channel modeling. The depthwise convolution captured local spatial patterns efficiently and reduced parameter redundancy. A 1 × 1 pointwise convolution then fused information across channels, preserving semantic relationships between them. Finally, a residual connection preserved the original feature information and prevented degradation from excessive suppression.
In the attention-weight generation stage, SEAM used a channel-fusion module formed by a two-layer fully connected network to compress and reconstruct global features and thus explicitly model inter-channel dependencies. This design linked occluded regions with their contextual surroundings and improved the network’s sensitivity to key structural cues. To increase robustness to feature offsets and positional errors, the module applied an exponential normalization to the fully connected output to map it into the interval [1, e] and multiplied the result channel-wise with the original features, producing an adaptively enhanced attention representation.
Overall, the SEAM module enhanced locally visible regions and indirectly compensated for areas with missing information without adding significant computational cost, allowing the network to maintain stable detection performance under complex occlusion. The structural diagram of the SEAM module is shown in Figure 5.

2.3. Construction of Evaluation Indicators

To comprehensively assess DGS-Net’s performance on paddy-field weed detection, we used average precision (AP), mean average precision (mAP), model weight size (Weights), giga floating point operations (GFLOPs), and number of parameters as primary evaluation metrics. AP depended on the model’s precision (P) and recall (R) [30]. Precision denoted the fraction of predicted positives that were true positives, and recall denoted the fraction of actual positives that the model correctly identified. The metrics were computed as follows:
P = T P T P + F P × 100 %
R = T P T P + F N × 100 %
A P = 0 1 P ( R ) d R
m A P = i = 1 n A P ( i ) n
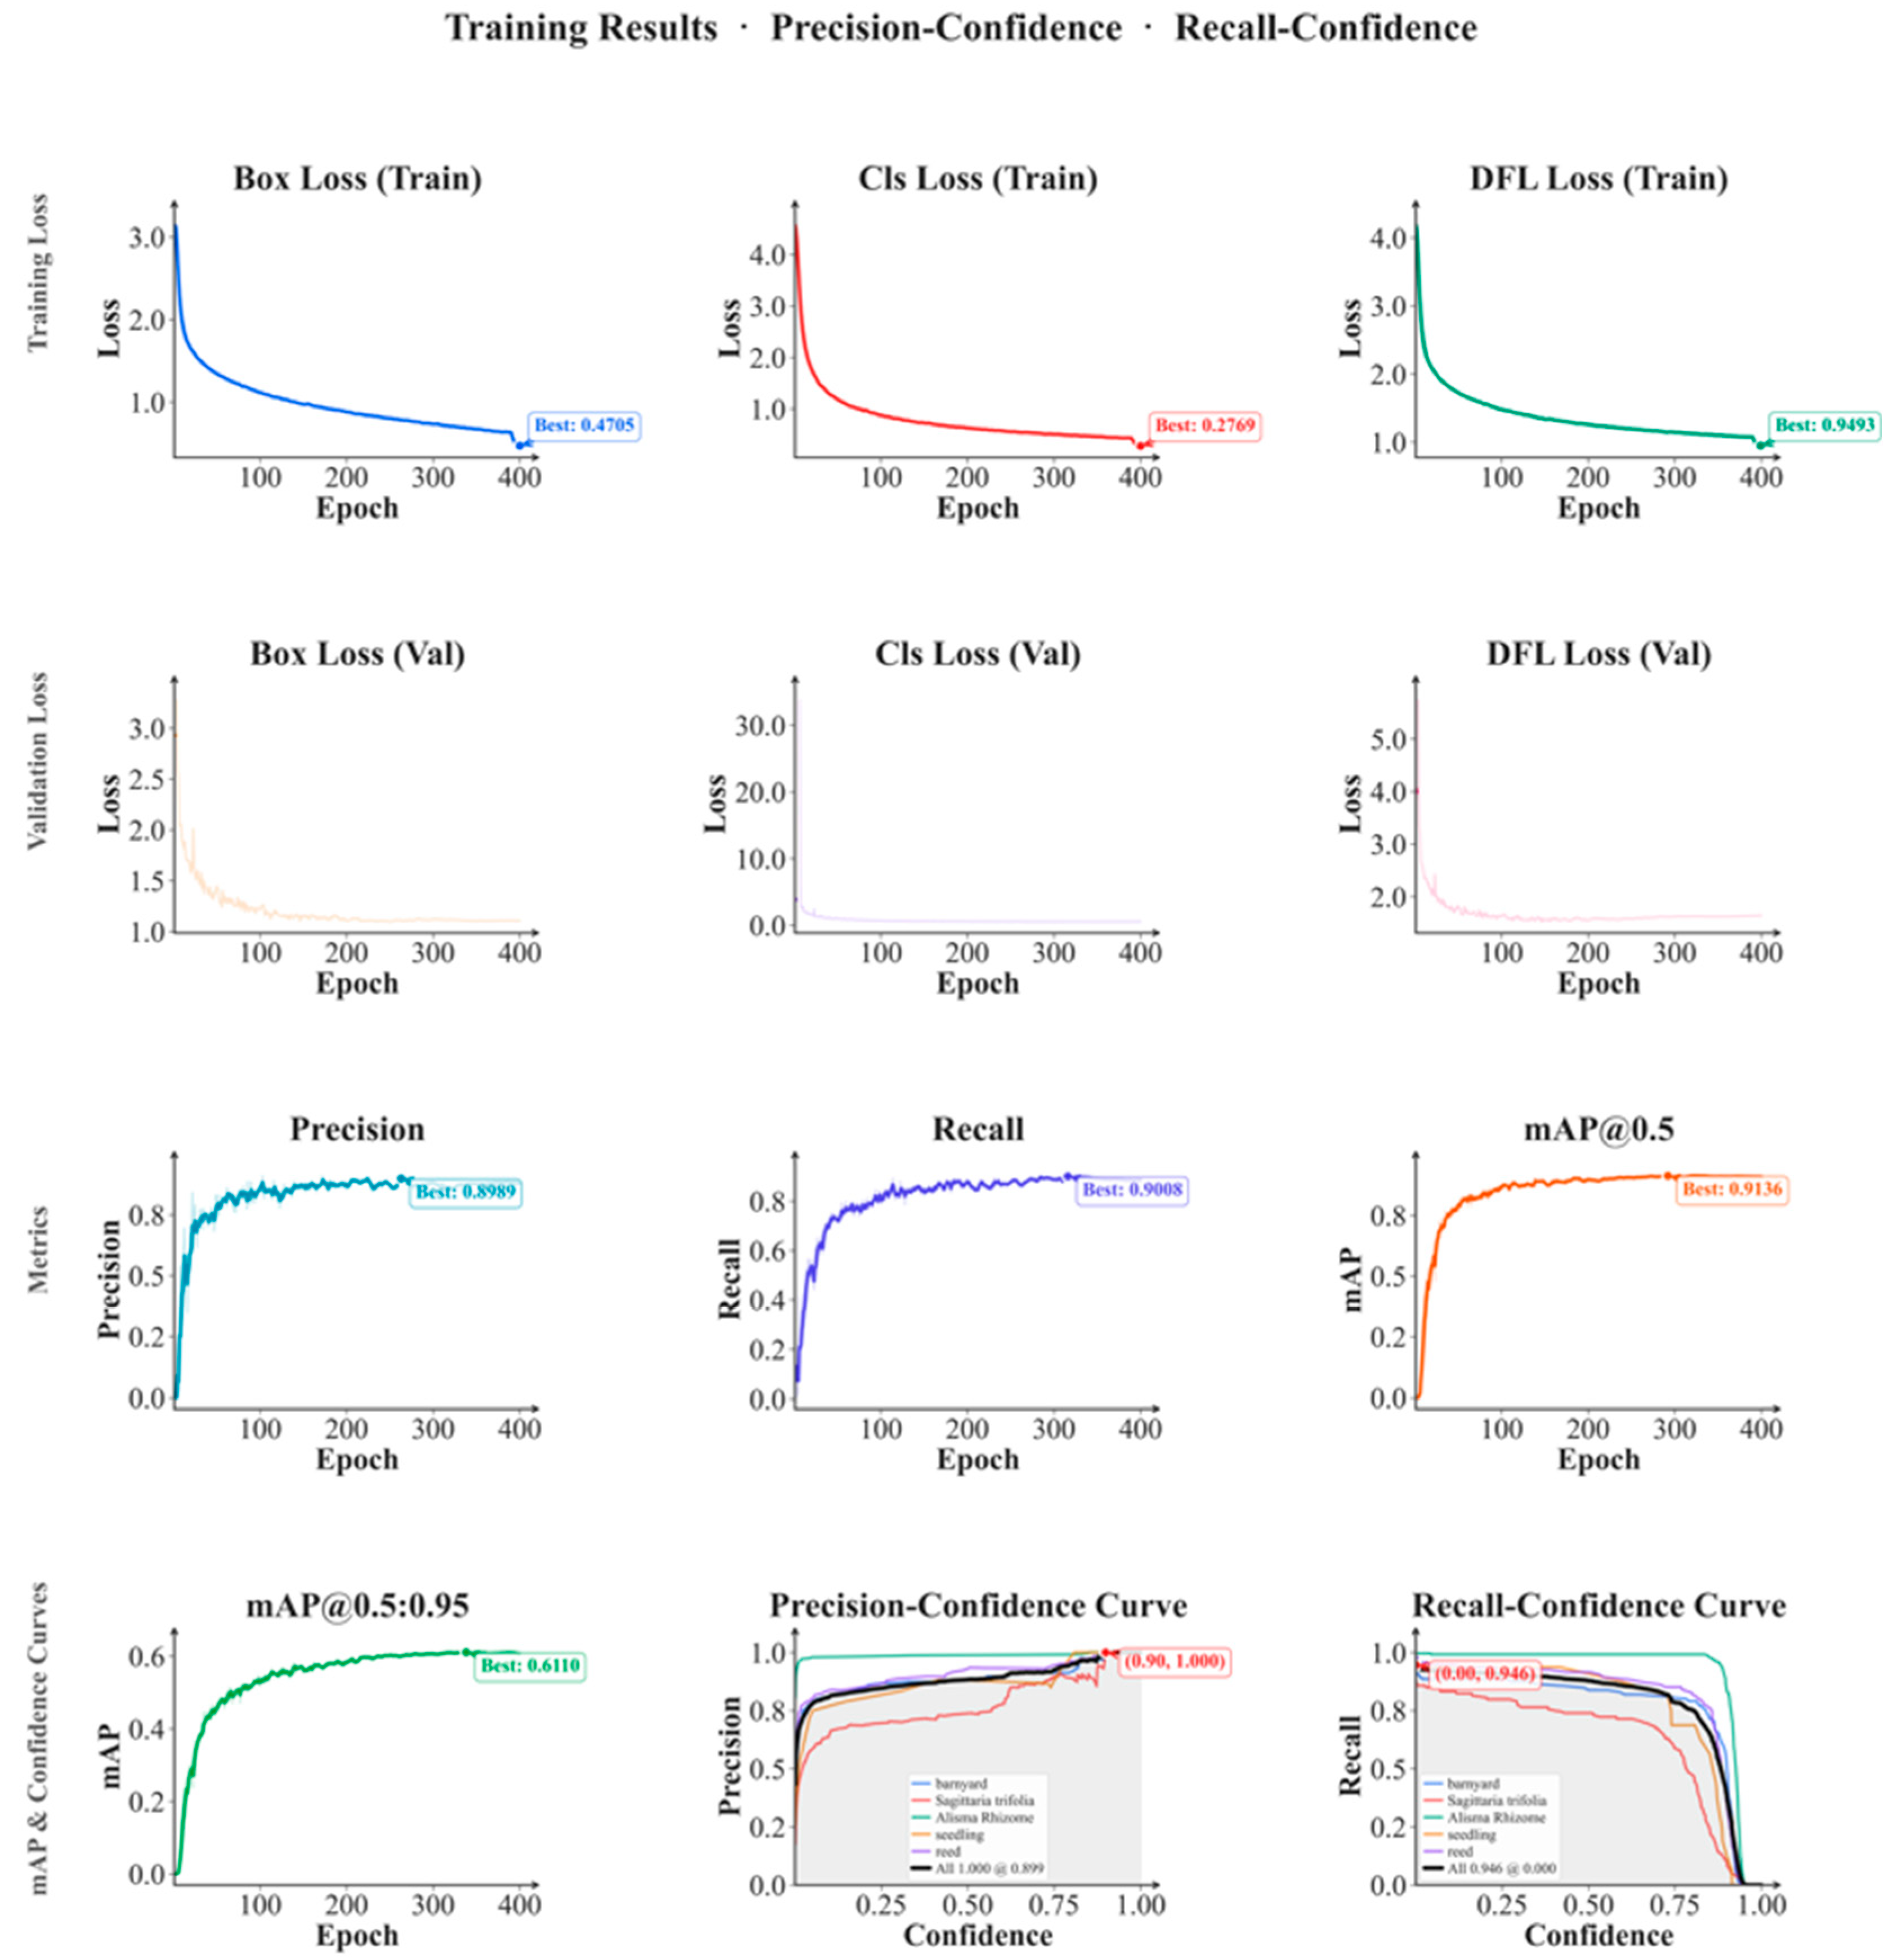
In the above formulas, true positive (TP) denotes the number of positive samples correctly identified by the model, false positive (FP) denotes the number of negative samples incorrectly predicted as positive, and false negative (FN) denotes the number of positive samples incorrectly predicted as negative. In this study, the detection targets comprised five classes: barnyard, Sagittaria trifolia, Alisma spp., seedling, and reed. Therefore, the mean average precision (mAP) was adopted as the primary metric for evaluating multi-class detection performance, where n = 5 in Equation (4). In addition, considering the storage and computational limitations of embedded devices used in paddy-field robots, model size (weights, MB) and computational cost (GFLOPs) were also included as important indicators of deployability. By optimizing lightweight modules such as VoV-GSCSP, DGS-Net aimed to substantially reduce model size while maintaining high accuracy, thereby meeting the storage constraints of agricultural machinery. The relevant performance curves are shown in Figure 6, including precision–confidence, recall–confidence, and detection performance curves, which illustrate how model performance varies under different confidence thresholds.

2.4. Experimental Environment and Hyperparameter Settings

Experiments were conducted on Ubuntu 20.04 (64-bit, Canonical Group Limited, London, UK) using a server equipped with an 18-vCPU AMD EPYC 9754 processor(Advanced Micro Devices, Inc., Santa Clara, CA, USA) and an NVIDIA RTX 4090D GPU (24 GB, Santa Clara, CA, USA). The software environment consisted of PyTorch 2.3.0, Python 3.10, and CUDA 12.1. The training hyperparameters are listed in Table S2 of the Supplementary Materials.

3. Results and Analysis

3.1. Ablation Experiments

Based on the YOLOv11n baseline, ablation experiments were conducted to evaluate the individual and combined contributions of the C2PSA_DAT, VoV-GSCSP, and SEAM modules to paddy-field weed detection. The results are presented in Table 1.
In Experiment 1, the baseline model without the C2PSA_DAT, VoV-GSCSP, and SEAM modules achieved a precision of 88.3%, recall of 88.4%, and mean average precision of 91%. These reference values indicate the model’s baseline detection performance prior to any optimization.
In Experiment 2, incorporating the VoV-GSCSPmodule raised both the precision and recall to 89.7%, and increased the mAP to 92.3%. These results indicate that VoV-GSCSP substantially improves feature fusion and effectively enhances the network’s multi-scale feature representation.
In Experiment 3, after introducing the C2PSA_DAT module, the model achieved an 89.8% precision, 87.1% recall, and 91.5% average precision. The C2PSA_DAT module enhances the network’s adaptive modeling of key regions via a deformable attention mechanism. In particular, for rice weed recognition, it markedly improved the capture of edge information.
In Experiment 4, introducing the SEAM module raised the precision and mean average precision to 90.5% and 91.6%, respectively. Although the recall declined slightly to 86%, the module markedly improved the model’s robustness for detecting targets in complex backgrounds, particularly when rice leaves were occluded.
Following the integration of the VoV-GSCSP and SEAM modules in Experiment 5, the model attained a precision of 90.5%, a recall of 84.7%, and an average precision of 90.6%. In comparison to the baseline model, this configuration enhanced precision while slightly decreasing the computational cost from 6.4 to 6.2 GFLOPs; however, both recall and mean average precision (mAP) experienced a decline. These findings suggest that the combination of VoV-GSCSP and SEAM did not result in a consistent overall enhancement in detection performance, although it may have bolstered confidence in certain positive predictions.
Upon integrating the C2PSA_DAT and SEAM modules in Experiment 6, precision achieved 86.5%, recall 89.9%, and average precision 90.9%. This configuration exhibited improved recall compared to the baseline model, albeit with a decrease in precision and a slightly lower mAP. Moreover, the parameter count and computational cost rose to 2,719,215 and 6.6 GFLOPs, respectively. Consequently, this setup does not alleviate the computational burden; instead, it indicates that the amalgamation of C2PSA_DAT and SEAM bolstered recall while introducing additional complexity and reduced precision.
After adding the C2PSA_DAT and VoV-GSCSP modules in Experiment 7, the model achieved a precision of 89.5%, a recall of 91.2%, and an average precision of 92.5%. This module combination substantially improved both precision and recall while keeping computational complexity low. Among the eight configurations, Experiment 7 achieved the highest mean average precision (mAP) of 92.5% and a recall rate of 91.2% while also exhibiting the lowest model weight at 5.3 MB and a computational cost of 6.0 GFLOPs. This performance indicates the most favorable trade-off within the ablation study. In contrast, Experiment 8 primarily improved the precision to 91.7%, but it did not exceed Experiment 7 in terms of mAP, recall, model size, or computational cost. Consequently, the ablation results imply that the combination of C2PSA_DAT and VoVGSCSP offers the most substantial overall contribution. Furthermore, the precision improvement noted in Experiment 8 is practically significant, as enhanced precision can mitigate false alarms and reduce the risk of incorrectly treating rice seedlings in paddy-field weed management.

3.2. Comparison of Baseline Models

For overall performance evaluation, representative lightweight CNN-based and Transformer-based detectors were selected as baseline models under unified experimental settings. Specifically, the compared models used the same input resolution, training epochs, optimizer, learning-rate schedule, and data augmentation strategy, so that the comparison can be understood as a controlled benchmark under a unified implementation pipeline. Precision, recall, mAP, model size, number of parameters, and GFLOPs were compared to analyze the trade-off between detection accuracy reliability and deployment efficiency for edge-side paddy-field applications.
Among the CNN-based baseline models, lightweight variants such as YOLOv5n, YOLOv8n, YOLOv10n, YOLOv11n, and YOLOv12n maintained relatively small model sizes and low computational cost, making them suitable for real-time deployment on resource-constrained devices. However, under the present paddy-field dataset, their limitations are more clearly reflected in complex scenarios involving dense small targets, strong visual similarity between rice seedlings and weeds, and severe background interference. Although these models provide competitive baseline performance, their overall detection reliability still declines under such conditions. In comparison, DGS-Net achieved a 91.7% precision, 86.8% recall, and 92.4% mAP with only a 5.8 MB model size and 6.2 GFLOPs, indicating that the proposed design improved not only the aggregated metrics in Table 2, but also the practical robustness required for crop–weed discrimination in complex paddy-field scenes. This balance between accuracy and computational cost is important for paddy-field robots, where lower GFLOPs can reduce inference burden and help maintain longer continuous operation under limited onboard power.
Transformer-based detectors, including variants of RT-DETR (RT-DETR-L, RT-DETR-Resnet50, RT-DETR-Resnet101, RT-DETR-X) [31], demonstrate robust global modeling capabilities through attention-based feature interactions. However, within the current unified training and evaluation framework, they do not exhibit an accuracy–efficiency trade-off that is comparable to that of DGS-Net on this dataset. While lightweight Transformer variants such as LW-DETR-Tiny and LW-DETR-Small [32] do reduce the computational costs, their overall detection performance remained inferior to that of the more robust lightweight YOLO baselines and DGS-Net in the present paddy-field task. This finding should be viewed as a relative comparison within the specific experimental context, rather than as an inherent limitation of Transformer-based detectors. For the current dataset, the primary challenge lies not only in global context modeling, but also in the reliable representation of dense, small, and visually similar crop–weed targets amid complex field interferences. Although Transformer-based detectors can model global dependencies, their higher computational cost may limit real-time deployment on compact agricultural platforms. In contrast, DGS-Net maintains competitive accuracy with lower complexity, making it more suitable for edge-side weed recognition in field operations.
The DGS-Net proposed in this study demonstrated superior detection performance compared to lightweight models while maintaining low resource consumption. With 2,707,279 parameters, 6.2 GFLOPs, and a model weight of 5.8 MB, DGS-Net’s deployment cost is similar to models like YOLOv11n and YOLOv12n. In standardized experiments, DGS-Net achieved a precision of 91.7%, a recall of 86.8%, and an mAP of 92.4%, surpassing most lightweight YOLO variants. The concept of a favorable balance in this research involves achieving robust detection accuracy in challenging paddy-field conditions without significantly increasing deployment costs. By incorporating C2PSA_DAT, VoV-GSCSP, and SEAM modules into the YOLOv11n architecture, DGS-Net enhances feature representation for small targets in complex backgrounds without excessive parameter complexity. This enhancement is particularly beneficial in scenarios with visual similarities between rice and weeds, dense small targets, partial occlusions, and backgrounds affected by reflections, where improved precision and mAP are crucial for minimizing false positives and missed weed detections. Consequently, DGS-Net is well-suited for accurate crop–weed differentiation and precise weed management on resource-limited platforms such as paddy-field drones and ground robots.
While the quantitative comparison illustrates the overall superiority of DGS-Net, it does not adequately elucidate how the introduced modules alter the network’s emphasis on target regions. Consequently, a gradient-weighted class activation mapping (Grad-CAM) analysis was conducted to offer supplementary visual evidence. These results suggest that the performance gain of DGS-Net is not obtained by simply increasing model scale, but by improving feature extraction and fusion in a manner consistent with the visual characteristics of paddy-field weed targets.

3.3. Heatmap Analysis

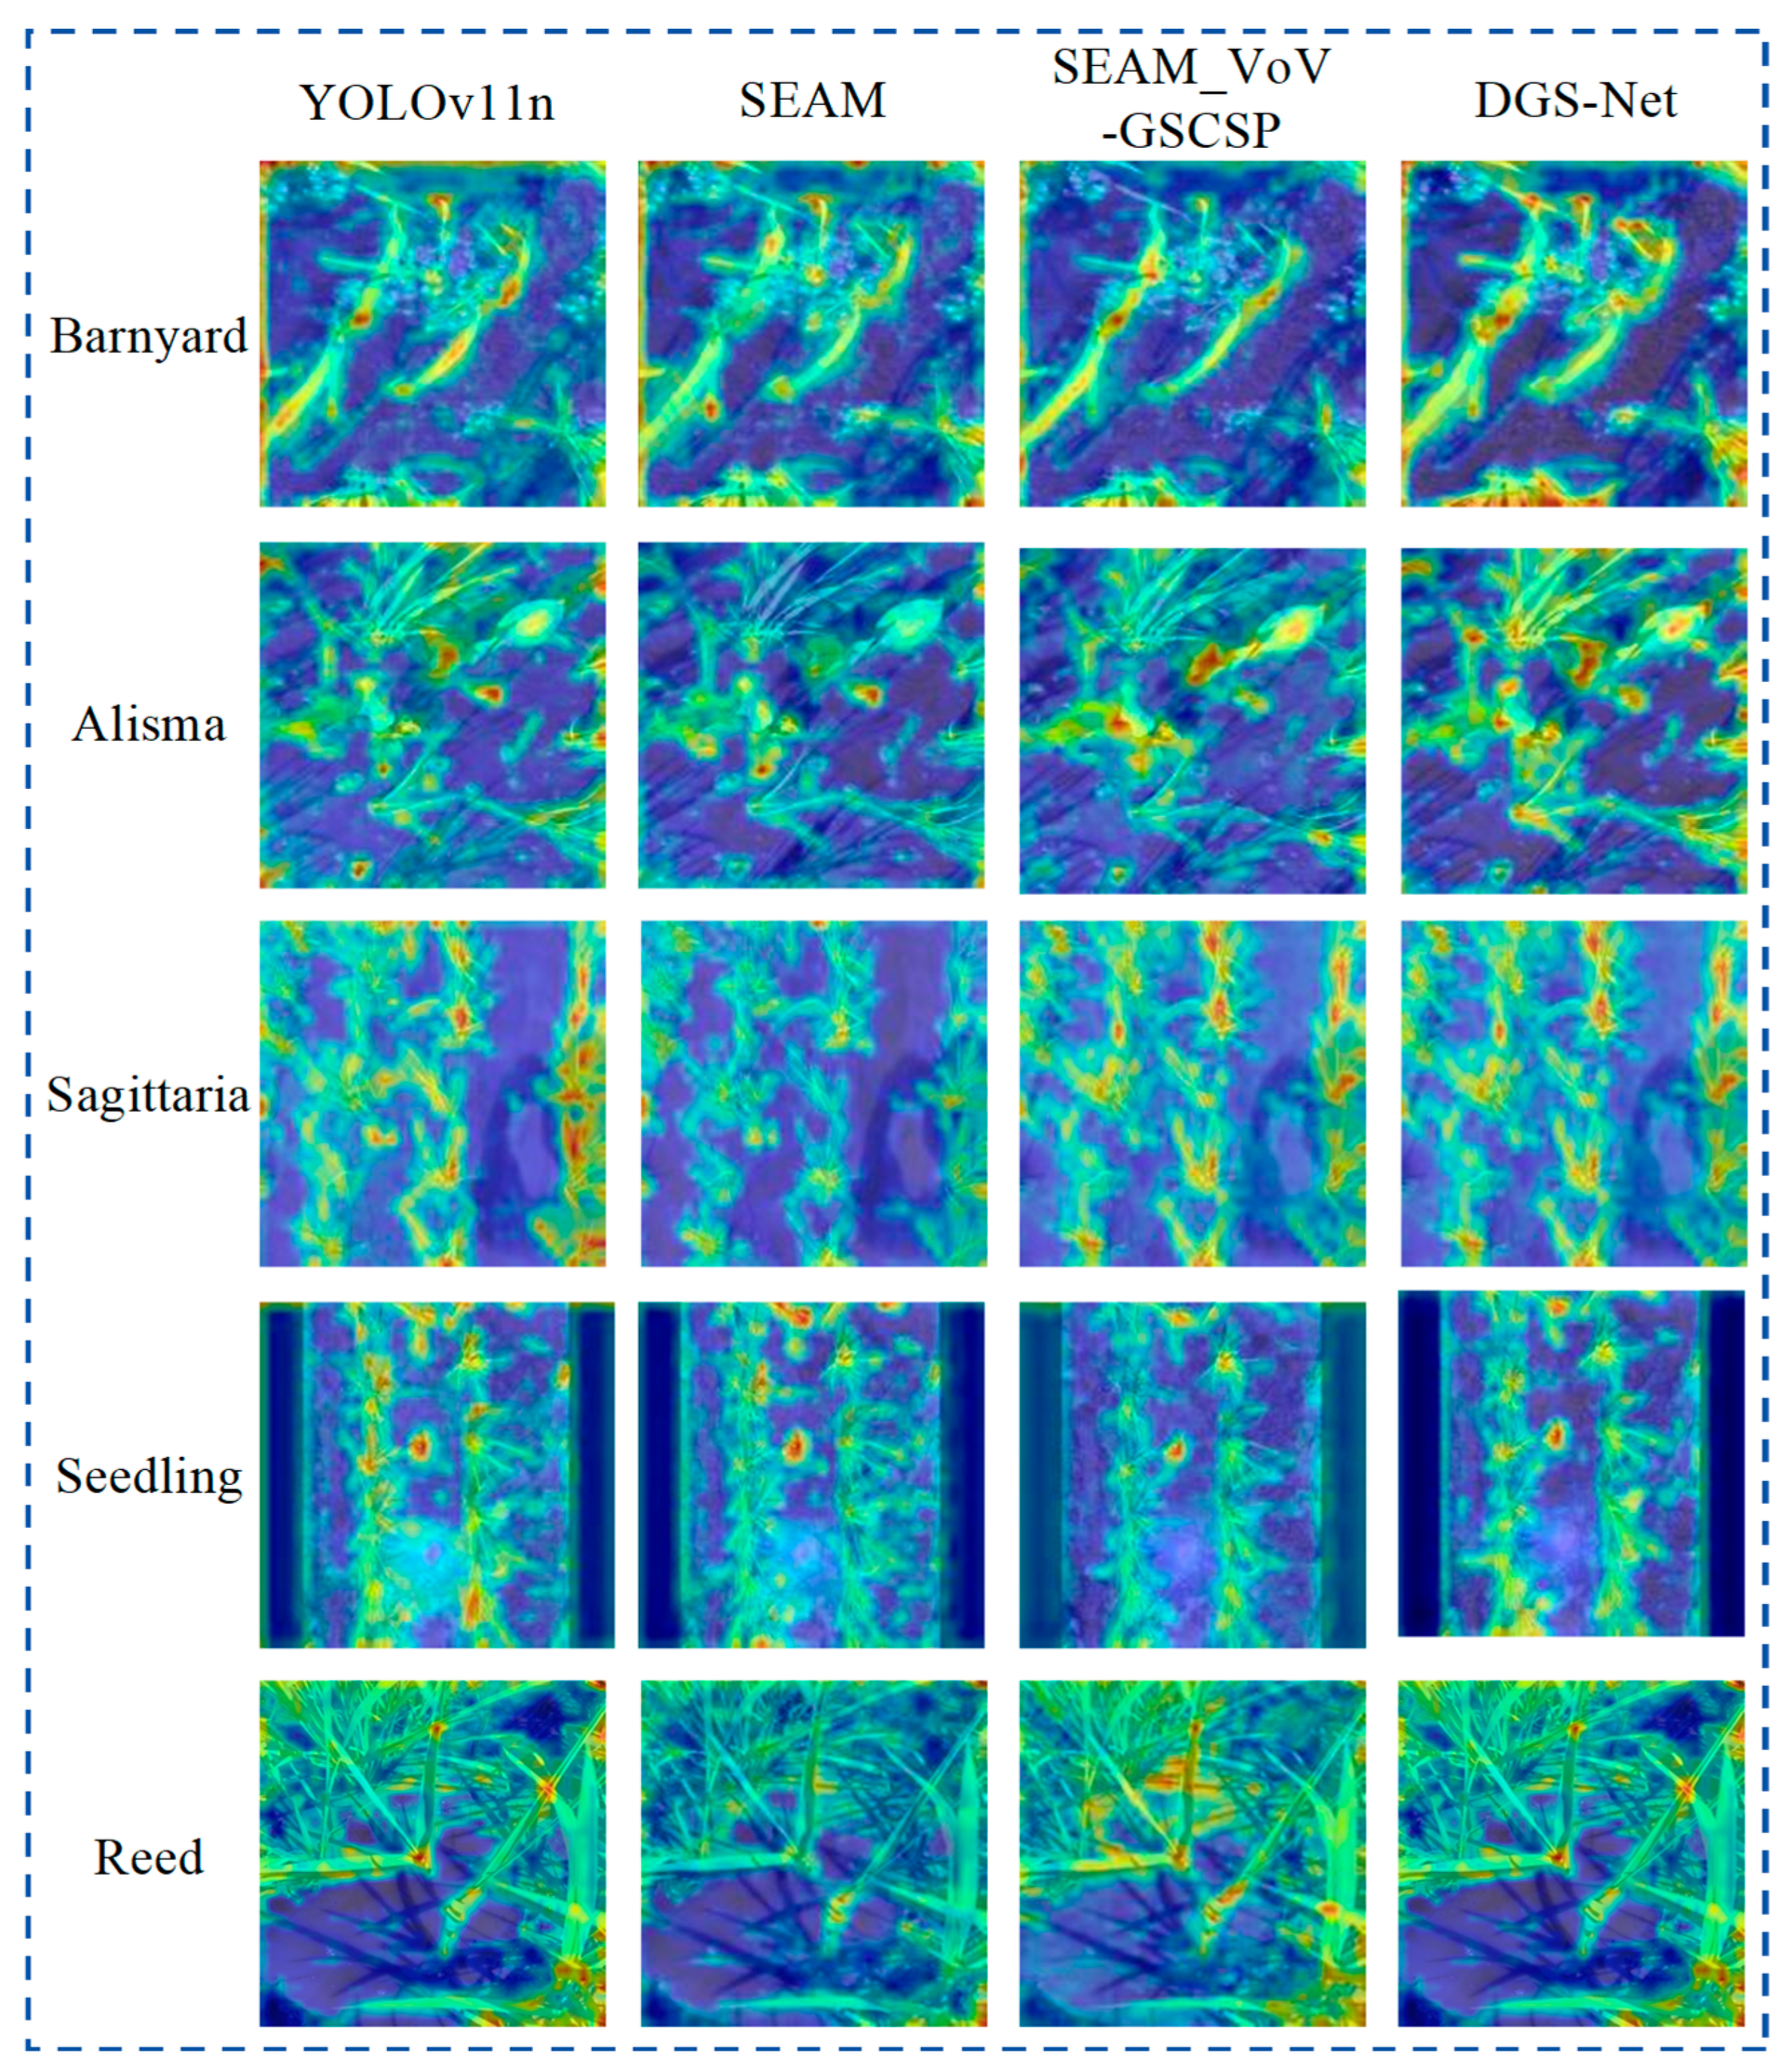
To further investigate the impact of the proposed modules on feature attention, Grad-CAM was employed on representative test images from five categories: barnyard, Sagittaria trifolia, Alisma spp., seedling, and reed. It is important to note that Grad-CAM provides qualitative rather than quantitative evidence. Consequently, the heatmaps serve as supportive visual evidence for model behavior, and their interpretation was considered alongside the ablation results and detection comparisons. In this study, the heatmaps were analyzed primarily from three qualitative perspectives: the concentration of activation on visible weed structures, the reduction in scattered responses in background regions, and the alignment of visual patterns with the detection differences outlined in Section 3.4. The examples presented in Figure 7 were selected from the test set to represent typical paddy-field conditions encountered in this study, such as occlusion, weak boundaries, and background interference. These examples are intended for illustrative comparison rather than statistical generalization. Figure 7 contrasts the activation maps of four model configurations: the baseline YOLOv11n, YOLOv11n + SEAM, YOLOv11n + SEAM + VoV-GSCSP, and the complete DGS-Net. This progressive comparison is significant, as it enables a step-by-step examination of the visual contributions of each added component, rather than limiting the analysis to a comparison between the baseline and the final model.
In comparison to the baseline YOLOv11n, the model incorporating SEAM exhibited enhanced activation in partially visible target regions while demonstrating diminished responses in surrounding cluttered areas. This modification is particularly significant in paddy-field scenes, where leaf overlap and incomplete target visibility frequently occur. This visual pattern aligns qualitatively with SEAM’s intended function of maintaining essential structural cues during occlusion and minimizing distractions from non-target regions amid complex background interference.
Following the introduction of VoV-GSCSP, the activation regions exhibited greater continuity on slender leaves and became more concentrated around the target body, while the scattered responses in muddy-water and reflection-affected background areas diminished. This visual pattern aligns qualitatively with a more stable multi-scale target representation under lightweight constraints. Thus, the observed changes in the heatmap can be interpreted as illustrative visual cues that broadly correspond with the gains reported in the ablation and model comparison experiments, rather than serving as independent evidence of enhanced feature fusion.
After adding C2PSA_DAT to the full DGS-Net, activation maps concentrated more on structurally informative regions such as narrow leaves, target centers, and irregular contours, while responses in non-target background areas were further suppressed. This improvement was most pronounced for categories with weak boundaries or complex surrounding textures, where the full model showed better alignment between the principal activation region and the actual weed structure. These qualitative differences support the interpretation that C2PSA_DAT enhances the modeling of irregular local morphology, and that the combined use of VoV-GSCSP and SEAM strengthens feature aggregation and robustness to occlusion. Overall, the Grad-CAM results align with the ablation and qualitative detection findings but should be treated as visual corroboration rather than definitive proof of improved target discrimination.
Heatmaps offer feature-level visual evidence, but detection quality on complex field images is better judged by the predicted bounding boxes. Therefore, we also present qualitative comparisons of the detection results.

3.4. Comparison of Detection Effects

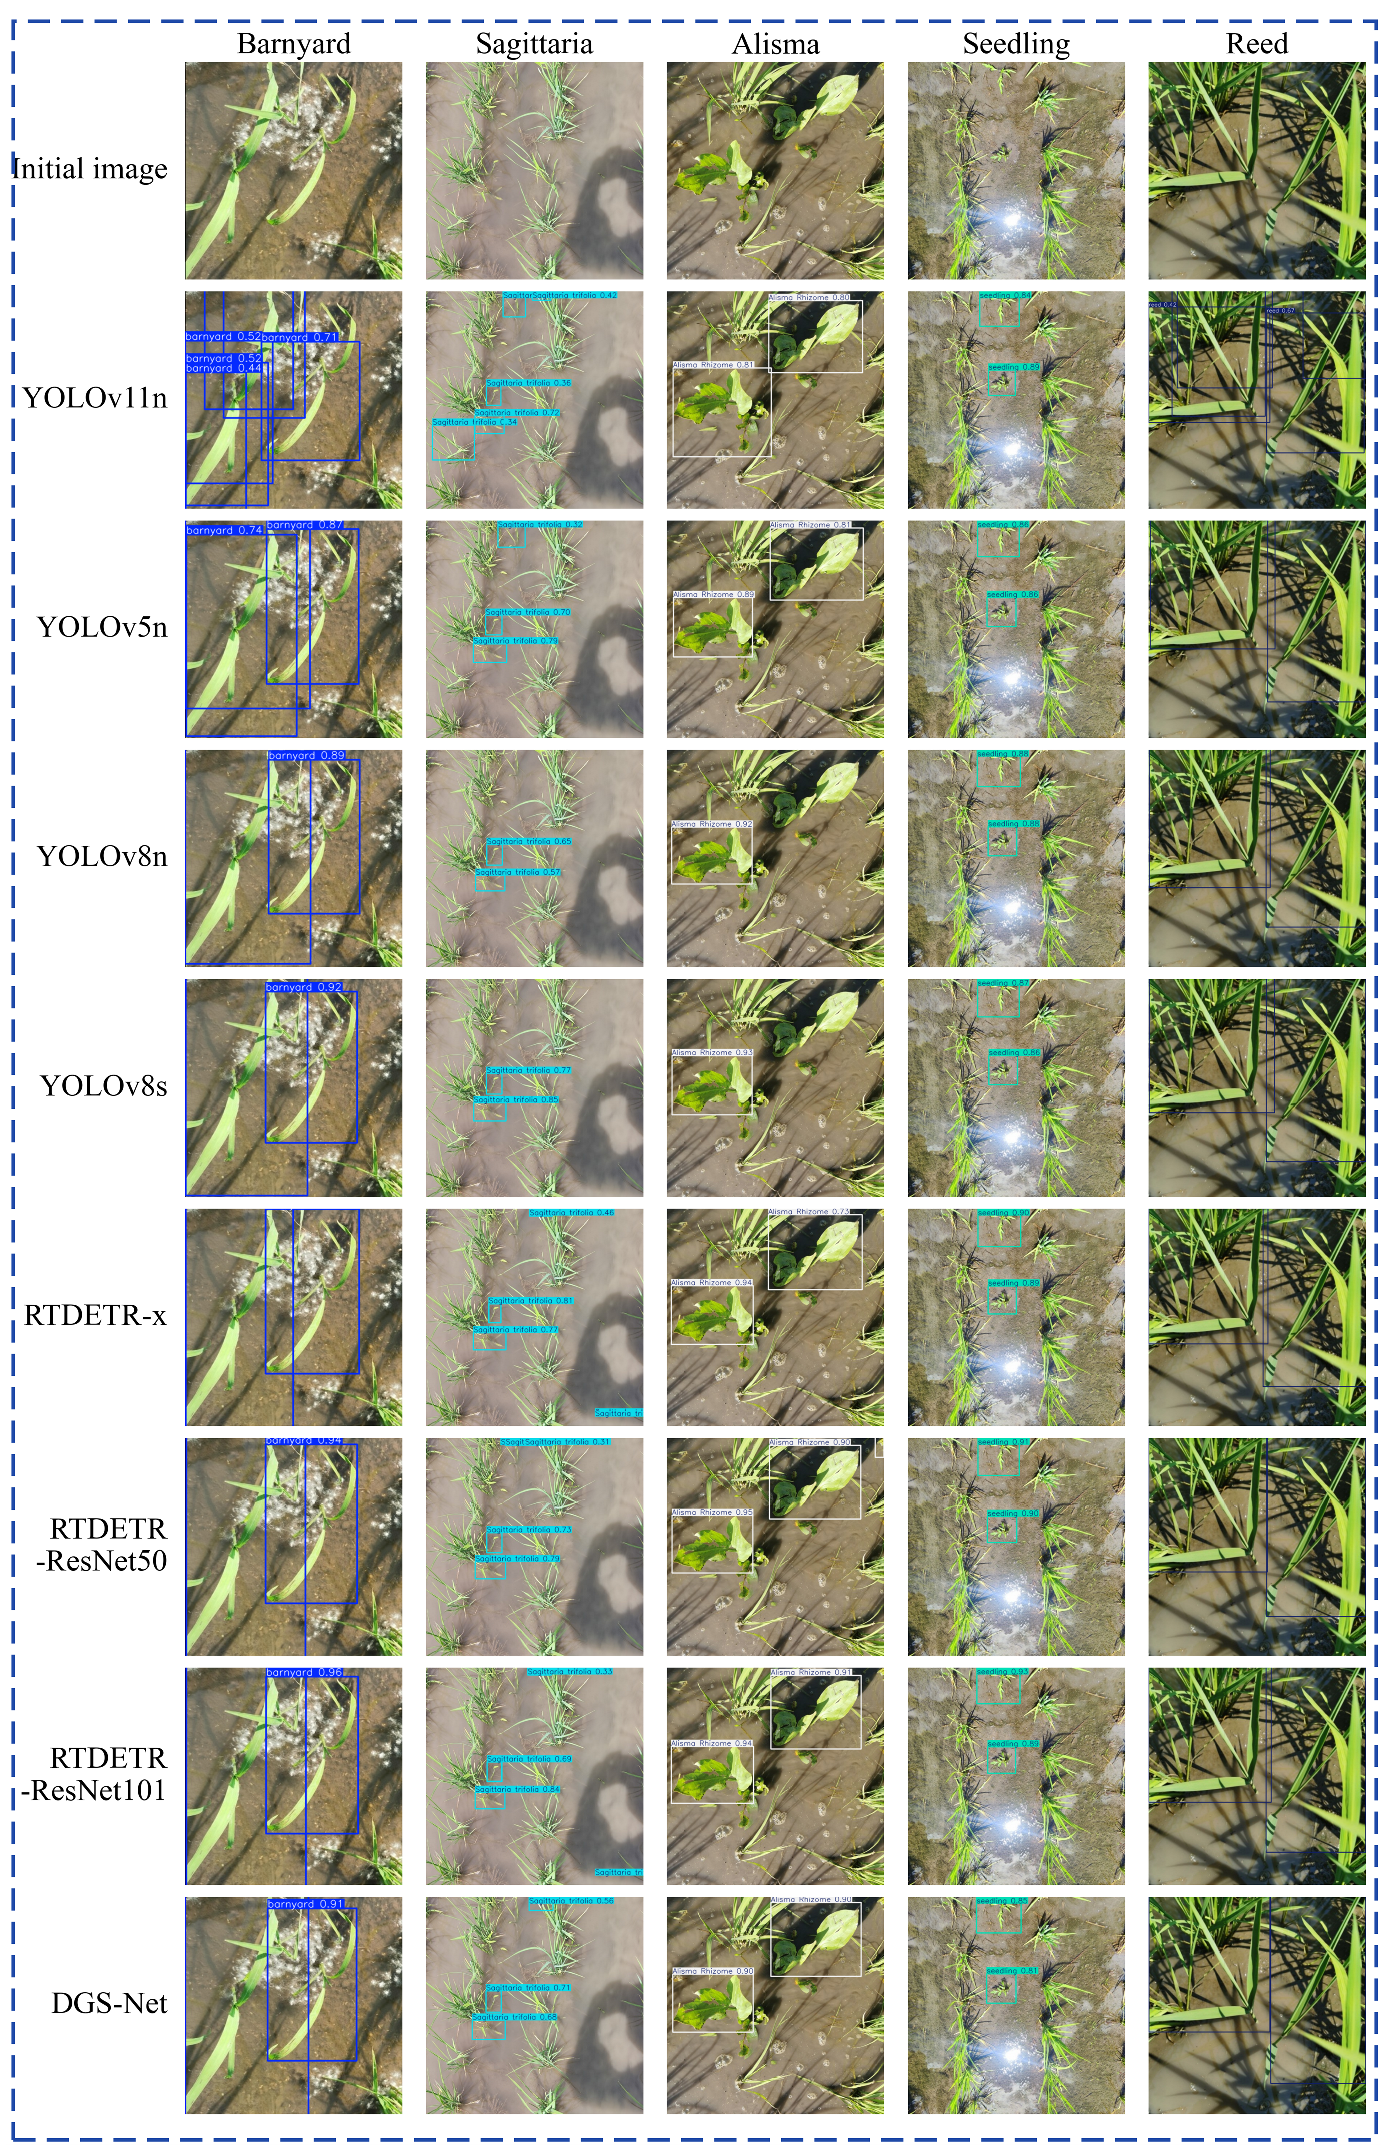
In the comparative analysis of YOLO-series algorithms, each version performed acceptably on weeds in simple backgrounds but exhibited clear limitations in complex paddy-field environments (Figure 8). Detection images revealed that lightweight models such as YOLOv5n and YOLOv6n suffered from substantial missed detections. Small targets such as barnyard and Sagittaria trifolia, which intermingle with rice seedlings, frequently lacked clearly identified boundaries and were sometimes completely overlooked. Even YOLOv8l, despite its larger parameter count and higher overall detection rate, produced inaccurate bounding boxes under conditions of strong light-induced water–surface reflection or plant overlap. The models often misclassified muddy-water textures as weeds or failed to detect weeds in densely infested areas, thereby falling short of the high-precision weed-removal requirements.
Transformer-based detectors (e.g., the RT-DETR family) exhibit strong global modeling capabilities in visual detection but remain inadequate for detecting very small targets. Comparison diagrams show that variants such as RTDETR-l and RTDETR-x produce relatively stable bounding boxes for larger weed targets. However, when weeds lie near image borders or are heavily occluded by rice leaves, these models often yield low confidence scores or misaligned boxes. The Transformer’s relatively coarse extraction of local fine-grained features impairs its ability to distinguish barnyard grass from rice, which have highly similar appearances, thus increasing false detections. Additionally, the predicted boxes are frequently oversized and fail to closely follow true weed contours. For precision-spraying tasks that demand accurate localization, this deficiency in positioning accuracy constitutes a critical limitation.
In contrast, the DGS-Net model presented in this paper achieved superior detection performance across diverse, complex paddy-field scenarios. Visualization results show that DGS-Net accurately identified various weed types. Even when weed targets were extremely small, closely blended with the background, or heavily occluded by rice seedlings, the model attained high-confidence detections. Thanks to the C2PSA_DAT module’s capacity to capture deformable features, the bounding boxes produced by DGS-Net tightly aligned with weed growth centers and edge contours, yielding markedly better localization accuracy than the YOLO and Transformer-series models. In areas with extreme weed density, DGS-Net reliably distinguished individual plants, substantially reducing both missed detections and false positives and thereby improving crop–weed discrimination for subsequent precise field interventions in complex paddy-field environments.

3.5. Deployment of the Model on Embedded Devices

This study aimed to achieve the high-precision, real-time detection of rice seedlings and representative weeds in paddy fields using a lightweight model. To evaluate deployment performance on edge devices and support subsequent real-time field recognition and intelligent agricultural machinery applications, we conducted a deployment experiment in Xinfutun, Shangzhi City, Harbin, Heilongjiang Province, China (coordinates to be verified: 44°79′12″ N–44°79′16″ N, 123°05′80″ E–123°05′90″ E). DGS-Net was deployed in an edge inference environment (Thunderobot MIX 8745H48 Mini PC, Qingdao Thunderobot Technology Co., Ltd., Qingdao, China) (AMD Ryzen 7 8745HS CPU, PyTorch 2.1.0 + cpu, Ultralytics 8.3.241). Test-set images were used to assess detection performance under edge conditions. At an input resolution of 640 × 640 pixels, the model’s average end-to-end processing time per image was 30.8 ms (preprocessing 0.5 ms, inference 30.1 ms, post-processing 0.2 ms), achieving a stable frame rate of approximately 32.5 FPS while maintaining high accuracy (mAP50 = 0.9278, mAP50–95 = 0.6358, P = 0.9194, R = 0.8671) (See Table 3). Figure S1 in the Supplementary Materials illustrates the deployment environment.

4. Discussion

4.1. Advantages of DGS-Net in Paddy-Field Weed Detection

The performance of DGS-Net is closely related to the agronomic and visual characteristics of early-stage paddy fields. At this stage, rice seedlings and co-occurring weeds compete for light, nutrients, water, and space, making reliable crop–weed discrimination within the rice cultivation system more critical than generic object detection. In practical paddy-field scenes, weeds often show irregular leaf morphology, slender structures, dense distribution, and high visual similarity to rice seedlings. Meanwhile, water–surface reflections, muddy-water textures, and plant overlap introduce substantial visual interference, which further complicates accurate field recognition.
The structural design of DGS-Net is intended to address these challenges in a targeted manner. C2PSA_DAT enhances the modeling of irregular local structures by introducing deformable attention into the backbone, which benefits the detection of weeds with narrow leaves, unstable contours, and weak edge information. VoV-GSCSP improves lightweight feature fusion in the neck, helping preserve useful shallow and mid-level cues for small and densely distributed weed targets while keeping the computational cost low. SEAM further strengthens the representation of partially visible weed regions before final prediction. Under overlap or occlusion, a weed may be recognized from only limited visible structures rather than its complete appearance; therefore, SEAM helps enhance relevant responses and suppress background interference, improving the stability of recognition in complex scenes.
The advantage of DGS-Net does not arise from simply increasing model complexity. Instead, it results from aligning module design with the specific visual characteristics of paddy-field weed detection. Compared with general lightweight YOLO-based models that mainly reduce parameters or simplify convolutional operations, DGS-Net combines deformable feature extraction, lightweight multi-scale fusion, and attention-enhanced representation to address irregular weed morphology, dense small targets, and occlusion-related interference simultaneously. This explains why the proposed model can improve detection accuracy while retaining low computational cost and real-time inference capability.
The Grad-CAM visualization results further support this interpretation. Compared with the baseline model, DGS-Net produces more concentrated activation responses on weed leaf structures, target centers, and irregular contours. At the same time, scattered responses in muddy backgrounds, water–surface reflections, and overlapping rice leaves are reduced. This visual evidence is consistent with the quantitative results of the comparison and ablation experiments, indicating that the proposed modules not only improve detection metrics but also guide the network to focus more effectively on agronomically relevant target regions. However, Grad-CAM should be regarded as qualitative evidence rather than direct quantitative proof; therefore, its results were interpreted together with the detection performance and ablation analysis.
For practical agricultural platforms, the lightweight design of DGS-Net is also important. Lower GFLOPs, fewer parameters, and a compact model size reduce the computational burden of real-time inference, which is beneficial for autonomous paddy-field robots and embedded field devices with limited computing resources, storage capacity, and battery power. In precision weed management, improved recall can reduce missed weed targets, while stable localization can support subsequent spraying or mechanical weeding operations. Therefore, DGS-Net improves not only benchmark detection performance, but also the practical applicability of crop–weed discrimination for field deployment and precision weed management [35].

4.2. Limitations

Although DGS-Net improves the overall detection performance, challenging cases remain unresolved. The principal errors occur in scenes with severe occlusion, strong reflections, and densely distributed targets. When weeds are heavily covered by rice leaves, positioned near image borders, or intermixed with seedlings that share very similar local appearance, the detector can still produce missed detections or inaccurate bounding boxes. These observations indicate that the current method enhances robustness but does not eliminate fine-grained confusion between weeds and rice seedlings in complex paddy-field environments [36].
The deployment results indicate that detection difficulty varies across classes. For example, Sagittaria trifolia exhibited a lower recall and reduced mAP@0.5:0.95 compared with other categories, indicating that the model is less stable when targets have more challenging visible structures or experience stronger interference from surrounding vegetation. Thus, the advantages of DGS-Net should be understood as an improvement under complex conditions rather than a complete solution for all difficult cases in paddy-field weed detection [37].
A further limitation is the constrained validation range. The dataset was collected from two paddy-field sites in Harbin during June–July of 2023 and 2024; despite variation in backgrounds, illumination, and occlusion, these images reflect a relatively specific scenario. Thus, the current results suffice to demonstrate DGS-Net’s effectiveness within the studied setting but do not establish that this advantage will persist across other ecological regions, seasons, water regimes, or weed-density levels. Additionally, the framework remains limited to two-dimensional object detection: it supports category recognition and bounding-box localization but cannot yet resolve weed morphology, density, or biomass at finer scales. This limitation restricts application in more precise field-management tasks.

4.3. Future Work and Practical Significance

Beyond benchmark performance, this study’s practical contribution is a lightweight, deployable perception module tailored to complex paddy-field environments. In real agricultural settings, weed detection serves not as an end but as the visual front end for downstream tasks such as targeted spraying, robotic weeding, field monitoring, and real-time decision-making. Thus, DGS-Net’s value extends beyond improved detection accuracy to include sustained deployability under strict computing, storage, and power constraints. This property renders the proposed method better suited to edge-side agricultural platforms than models that achieve accuracy gains primarily through large computational expansions.

5. Conclusions

Weed recognition in paddy fields faces several challenges: weeds exhibit irregular morphologies, backgrounds include confounding elements such as water–surface reflections and muddy textures, and lightweight detectors lack robust multi-scale feature extraction. To address these issues, we propose DGS-Net, an improved model built on the YOLOv11n object-detection architecture. DGS-Net incorporates a C2PSA_DAT module with deformable attention to better capture salient features, GSConv and VoV-GSCSP modules to trade off computational cost and semantic diversity, and a SEAM module to improve robustness under occlusion. These modifications yield substantial gains in detection performance. The main contributions are summarized as follows:
(1) Effective data augmentation and preprocessing were applied to address the complexity of the paddy field imaging environment: To represent the variability of scenes in paddy field images, we employed geometric transformations, including rotation and translation, alongside optical augmentations such as Gaussian noise addition and contrast adjustment to simulate realistic imaging changes. These augmentations increased training-data diversity, improved model generalization and robustness across lighting and turbidity conditions, and supplied higher-quality inputs for model training.
(2) The proposed DGS-Net improves detection accuracy and robustness in complex paddy-field environments. The C2PSA_DAT module enhances the capture of irregular edge information, VoV-GSCSP preserves effective feature representation within a lightweight framework, and SEAM improves robustness under partial occlusion. Heatmap-based visual analysis further shows that DGS-Net produces more concentrated activation in target regions and better suppresses background interference.
(3) We assessed the practical utility of the algorithm in real-world agricultural inspection scenarios. In comparative experiments, DGS-Net demonstrated a lightweight footprint of 5.8 MB while achieving a mean average precision (mAP) of 92.4%. Compared to mainstream models such as YOLOv8 and RT-DETR, it significantly reduced missed detections and minimized computational overhead in complex backgrounds. The model effectively identifies target categories across various scales and conditions, including barnyard, Sagittaria trifolia, Alisma spp., seedling, and reed. This capability provides robust algorithmic support for intelligent weed control and precision agriculture.
Despite the algorithmic advances reported here, certain limitations remain. The current detection framework focuses on two-dimensional bounding-box recognition and does not provide pixel-level morphological quantification of features such as weed density and biomass. Future work will extend the detector into a more integrated field-perception framework. The lightweight design of DGS-Net reduces model size and computational overhead, and it also improves deployability on resource-constrained agricultural platforms. Beyond combining object detection with semantic segmentation, future studies should explore multimodal sensing, enhanced cross-scene robustness, and tighter integration with downstream decision modules such as targeted spraying, robotic weeding, and real-time field monitoring. Such developments would transition the method from isolated weed detection to a deployable sensing-to-decision component for intelligent paddy-field management.


Supplementary Materials

The following supporting information can be downloaded at: https://www.mdpi.com/article/10.3390/agriculture16101039/s1, Table S1: Datasets Splits; Table S2: Experimental environment configuration; Figure S1: The deployment map of the DGS-Net on the AMD Ryzen Host.

Author Contributions

Conceptualization: Y.Z. and Y.W.; Methodology: Y.Z.; Data Collection: X.M.; Photomaking: Z.L., S.C., J.Z. and L.Z.; Model Training: Z.L.; Analysis: Z.L. and L.Z.; Formal analysis and investigation: Z.L.; Writing-review and editing: Y.Z.; Funding acquisition: Y.W.; Supervision: Y.Z. All authors have read and agreed to the published version of the manuscript.

Funding

The project was supported by the National Natural Science Foundation of China (No: 32472012).

Institutional Review Board Statement

Not applicable.

Data Availability Statement

The original contributions presented in this study are included in the article. Further inquiries can be directed to the corresponding author.

Conflicts of Interest

The authors declare that they have no conflicts of interest.

References

  1. Huang, J.; Ma, Z.; Wu, Y.; Bao, Y.; Wang, Y.; Su, Z.; Guo, L. YOLOv8-DDS: A lightweight model based on pruning and distillation for early detection of root mold in barley seedling. Inf. Process. Agric. 2025, 12, 581–594. [Google Scholar] [CrossRef]
  2. Liu, H.; Hou, Y.; Zhang, J.; Zheng, P.; Hou, S. Research on weed reverse detection methods based on improved you only look once (YOLO) v8: Preliminary results. Agronomy 2024, 14, 1667. [Google Scholar] [CrossRef]
  3. Ma, C.; Chi, G.; Ju, X.; Zhang, J.; Yan, C. YOLO-CWD: A novel model for crop and weed detection based on improved YOLOv8. Crop Prot. 2025, 192, 107169. [Google Scholar] [CrossRef]
  4. Guo, L.; Huang, J.; Wu, Y.; Wang, S.; Wang, Y.; Bao, Y.; Su, Z.; Liu, H. Detecting rice diseases using improved lightweight YOLOv8n. Trans. Chin. Soc. Agric. Eng. 2025, 41, 156–164. [Google Scholar]
  5. Upadhyay, A.; Sunil, G.; Das, S.; Mettler, J.; Howatt, K.; Sun, X. Multiclass weed and crop detection using optimized YOLO models on edge devices. J. Agric. Food Res. 2025, 22, 102144. [Google Scholar] [CrossRef]
  6. Sunil, G.; Upadhyay, A.; Zhang, Y.; Howatt, K.; Peters, T.; Ostlie, M.; Aderholdt, W.; Sun, X. Field-based multispecies weed and crop detection using ground robots and advanced YOLO models: A data and model-centric approach. Smart Agric. Technol. 2024, 9, 100538. [Google Scholar]
  7. Wu, Y.; Huang, J.; Wang, S.; Bao, Y.; Wang, Y.; Song, J.; Liu, W. Lightweight pepper disease detection based on improved YOLOv8n. AgriEngineering 2025, 7, 153. [Google Scholar] [CrossRef]
  8. Gautam, D.; Mawardi, Z.; Elliott, L.; Loewensteiner, D.; Whiteside, T.; Brooks, S. Detection of invasive species (Siam Weed) using drone-based imaging and YOLO deep learning model. Remote Sens. 2025, 17, 120. [Google Scholar] [CrossRef]
  9. Xu, J.; Lu, Y.; Deng, B. Openweedgui: An open-source graphical tool for weed imaging and yolo-based weed detection. Electronics 2024, 13, 1699. [Google Scholar] [CrossRef]
  10. Wu, X.; Zhu, T.; Xue, S.; Wu, J.; Guo, H.; Ni, C. CFSS-YOLO: A Detection Method for Cotton Top Bud in Real Farmland. Agriculture 2026, 16, 672. [Google Scholar] [CrossRef]
  11. Buczyński, K.; Kapłan, M.; Jarosz, Z. Detection of Red, Yellow, and Purple Raspberry Fruits Using YOLO Models. Agriculture 2025, 15, 2530. [Google Scholar] [CrossRef]
  12. Wu, H.; Wang, Y.; Zhao, P.; Qian, M. Small-target weed-detection model based on YOLO-V4 with improved backbone and neck structures. Precis. Agric. 2023, 24, 2149–2170. [Google Scholar] [CrossRef]
  13. Deng, L.; Miao, Z.; Zhao, X.; Yang, S.; Gao, Y.; Zhai, C.; Zhao, C. HAD-YOLO: An accurate and effective weed detection model based on improved YOLOV5 network. Agronomy 2024, 15, 57. [Google Scholar] [CrossRef]
  14. Yang, Z.; Khan, Z.; Shen, Y.; Liu, H. GTDR-YOLOv12: Optimizing YOLO for efficient and accurate weed detection in agriculture. Agronomy 2025, 15, 1824. [Google Scholar] [CrossRef]
  15. Peng, G.; Wang, K.; Ma, J.; Cui, B.; Wang, D. AGRI-YOLO: A lightweight model for corn weed detection with enhanced YOLO v11n. Agriculture 2025, 15, 1971. [Google Scholar] [CrossRef]
  16. Chinnasami, R.K.; Rajappan, S.; Murugasamy, V. UAV-based intelligent weed detection using YOLO11 and PSPNet for precision agriculture. Not. Bot. Horti Agrobot. Cluj-Napoca 2025, 53, 14822. [Google Scholar] [CrossRef]
  17. Chen, Z.; Chen, B.; Huang, Y.; Zhou, Z. GE-YOLO for weed detection in rice paddy fields. Appl. Sci. 2025, 15, 2823. [Google Scholar] [CrossRef]
  18. Chen, B.; Tang, T.; Wang, R. YOLO-CESn: An efficient field weed detection model based on an improved YOLO11. Meas. Sci. Technol. 2025, 36, 106115. [Google Scholar] [CrossRef]
  19. Yu, C.; Li, J.; Shi, W.; Qi, L.; Guan, Z.; Zhang, W.; Zhang, C. SLW-YOLO: A hybrid soybean parent phenotypic consistency detection model based on deep learning. Agriculture 2025, 15, 2001. [Google Scholar] [CrossRef]
  20. Li, Q.; Ma, W.; Li, H.; Zhang, X.; Zhang, R.; Zhou, W. Cotton-YOLO: Improved YOLOV7 for rapid detection of foreign fibers in seed cotton. Comput. Electron. Agric. 2024, 219, 108752. [Google Scholar] [CrossRef]
  21. Pawłowski, J.; Kołodziej, M.; Majkowski, A. Implementing YOLO convolutional neural network for seed size detection. Appl. Sci. 2024, 14, 6294. [Google Scholar] [CrossRef]
  22. Shuai, Y.; Shi, J.; Li, Y.; Zhou, S.; Zhang, L.; Mu, J. YOLO-SW: A Real-Time Weed Detection Model for Soybean Fields Using Swin Transformer and RT-DETR. Agronomy 2025, 15, 1712. [Google Scholar] [CrossRef]
  23. Matsuhashi, S.; Sugiura, R.; Asai, M.; Asami, H.; Kowata, Y.; Akamatsu, Y.; Sasaki, K.; Yoshino, N.; Ihara, N.; Koarai, A. Field evaluation of an agricultural weed detector using YOLO image recognition: Background conditions affect detection performance. Pest Manag. Sci. 2025, 81, 6560–6566. [Google Scholar] [CrossRef]
  24. Li, S.; Chen, Z.; Xie, J.; Zhang, H.; Guo, J. PD-YOLO: A novel weed detection method based on multi-scale feature fusion. Front. Plant Sci. 2025, 16, 1506524. [Google Scholar] [CrossRef] [PubMed]
  25. Hao, C.; Dong, W.; Li, H.; Zan, J.; Zhang, X. YOLO-AMAS: Maturity Detection of ‘Jiang’ Pomegranate in Complex Orchard Environments. Agriculture 2025, 15, 2514. [Google Scholar] [CrossRef]
  26. Sportelli, M.; Apolo-Apolo, O.E.; Fontanelli, M.; Frasconi, C.; Raffaelli, M.; Peruzzi, A.; Perez-Ruiz, M. Evaluation of YOLO object detectors for weed detection in different turfgrass scenarios. Appl. Sci. 2023, 13, 8502. [Google Scholar] [CrossRef]
  27. Sonawane, S.; Patil, N.N. Comparative performance analysis of YOLO object detection algorithms for weed detection in agriculture. Intell. Decis. Technol. 2025, 19, 507–519. [Google Scholar] [CrossRef]
  28. Zhang, Y.; Xu, Y.; Hou, J.; Song, Y. LMS-YOLO11n: A Lightweight Multi-Scale Weed Detection Model. Int. J. Adv. Comput. Sci. Appl. 2025, 16, 1291–1300. [Google Scholar] [CrossRef]
  29. Gurjar, B.; Torres, U.; Coleman, G.; Straw, C.; Bagavathiannan, M. Effect of Mowing, Imaging Technique, and Annotation Method on Weed Detection in Turfgrass Using Yolo. Precis. Agric. 2025, 27, 46. [Google Scholar] [CrossRef]
  30. Wu, Y.; Huang, J.; Wang, Y.; Bao, Y.; Liu, Z.; Cao, X.; Cong, Z.; Wang, H.; Zhang, W. YOLO-DCS: A Brain Tumor Detection Algorithm Based on Dynamic Self-Attention Mechanism and Adaptive Fusion. In 2025 IEEE International Conference on Bioinformatics and Biomedicine (BIBM); IEEE: Piscataway, NJ, USA, 2025; pp. 6503–6510. [Google Scholar]
  31. Xia, Z.; Pan, X.; Song, S.; Li, L.E.; Huang, G. Vision transformer with deformable attention. In Proceedings of the IEEE/CVF Conference on Computer Vision and Pattern Recognition, New Orleans, LA, USA, 18–24 June 2022; pp. 4794–4803. [Google Scholar]
  32. Li, H.; Li, J.; Wei, H.; Liu, Z.; Zhan, Z.; Ren, Q. Slim-neck by GSConv: A lightweight-design for real-time detector architectures. J. Real-Time Image Process. 2024, 21, 62. [Google Scholar] [CrossRef]
  33. Yu, Z.; Huang, H.; Chen, W.; Su, Y.; Liu, Y.; Wang, X. Yolo-facev2: A scale and occlusion aware face detector. Pattern Recognit. 2024, 155, 110714. [Google Scholar] [CrossRef]
  34. Redmon, J.; Divvala, S.; Girshick, R.; Farhadi, A. You only look once: Unified, real-time object detection. In Proceedings of the IEEE Conference on Computer Vision and Pattern Recognition, Las Vegas, NV, USA, 27–30 June 2016; pp. 779–788. [Google Scholar]
  35. Wang, R.-F.; Su, W.-H. The application of deep learning in the whole potato production Chain: A Comprehensive review. Agriculture 2024, 14, 1225. [Google Scholar] [CrossRef]
  36. Sun, H.; Xi, X.; Wu, A.-Q.; Wang, R.-F. ToRLNet: A Lightweight Deep Learning Model for Tomato Detection and Quality Assessment Across Ripeness Stages. Horticulturae 2025, 11, 1334. [Google Scholar] [CrossRef]
  37. Wang, R.-F.; Qu, H.-R.; Su, W.-H. From sensors to insights: Technological trends in image-based high-throughput plant phenotyping. Smart Agric. Technol. 2025, 12, 101257. [Google Scholar] [CrossRef]
Figure 1. Data collection and data preprocessing methods. Note: The figure presents the geographic locations of the two field sampling sites, representative images of the five annotated categories, and the main preprocessing operations applied to the dataset. These steps were used to increase scene diversity and improve model robustness under varying illumination, background interference, and occlusion conditions.
Agriculture 16 01039 g001
Figure 2. Overall architecture of DGS-Net. Note: (A) Overall network architecture, including the backbone, neck, and three-scale detection heads. The backbone extracts multi-level features from the input image, while the neck performs feature fusion through upsampling and concatenation operations. (B) Improved modules introduced in DGS-Net, including C2PSA_DAT, GSConv, VOV-GSCSP, and SEAM. Different colors are used to distinguish different types of network components. The purple dashed boxes indicate the improved modules, and the blue dashed boxes denote the multi-scale detection branches at P3, P4, and P5.The network was built on YOLOv11n and incorporates three key improvements: C2PSA_DAT in the backbone for irregular feature modeling, VoV-GSCSP in the neck for lightweight multi-scale feature fusion, and SEAM before the detection head for enhanced robustness under occlusion and background interference.
Agriculture 16 01039 g002
Figure 3. The architecture of DAT.Note: The module predicts offsets from query features and shifts uniformly distributed reference points to deformed sampling positions. Key and value features are then sampled by bilinear interpolation and used for multi-head attention with relative position bias. The colored points indicate corresponding reference and deformed sampling positions, with the same color representing the same point before and after offset prediction. Dashed arrows denote position flow, solid arrows denote feature flow, and colored feature blocks are used to distinguish different sampled feature groups or attention heads.
Agriculture 16 01039 g003
Figure 4. The architecture of GSConv. Note: GSConv combines standard convolution (SC) and depthwise separable convolution (DSC) to generate two feature groups, which are then concatenated and rearranged through channel shuffle to improve information exchange across channels. The different colors in the feature maps are used only to distinguish feature channels and illustrate the channel shuffle process; they do not indicate object categories or numerical values.
Agriculture 16 01039 g004
Figure 5. The architecture of SEAM. Note: The left panel shows the attention-weight generation process, while the right panel presents the internal structure of the CSMM block. Different colors are used only to distinguish functional components such as convolution, activation, normalization, pooling, and channel transformation, and do not indicate quantitative values or category labels.
Agriculture 16 01039 g005
Figure 6. Training and performance curves of YOLOv11n. Note: The curves include the training loss, validation loss, precision–confidence curve, recall–confidence curve, F1–confidence curve, and precision–recall curve. These curves were used to evaluate the convergence behavior of the baseline YOLOv11n model and to analyze how detection performance changes under different confidence thresholds. Different colors are used to distinguish different metrics in the training and validation curves and different target categories in the confidence-based curves, as indicated by the legends.
Agriculture 16 01039 g006
Figure 7. Grad-CAM visualization of different model configurations on representative paddy-field weed targets. Note: From left to right are YOLOv11n (baseline), YOLOv11n + SEAM, YOLOv11n + SEAM + VoV-GSCSP, and the full DGS-Net. The heatmap colors indicate model response intensity: red and yellow denote stronger attention regions, while blue and green denote weaker attention regions. The selected examples are used for qualitative visual comparison under typical paddy-field conditions.
Agriculture 16 01039 g007
Figure 8. Comparison of detection performance across different models.
Agriculture 16 01039 g008
Table 1. Results of the ablation experiments.
No.DATVoV-GSCSPSEAMP/%R/%mAP/%Weights/MBParametersGFLOPs
1×××88.388.4915.52,588,7196.4
2××89.789.792.35.32,576,7836
3××89.887.191.55.62,615,7276.4
4××90.58691.65.72,692,2076.6
5×90.584.790.65.72,680,2716.2
6×86.589.990.95.82,719,2156.6
7×89.591.292.55.32,603,7916
891.786.892.45.82,707,2796.2
Table 2. Results of baseline model comparison.
ModelsP/%R/%mAP/%Weights/MBParametersGFLOPs
CNN-based
YOLOv5n85.183.488.85.32,507,7917.1
YOLOv6n89.178.8838.74,234,62311.7
YOLOv8n88.683.288.76.33,010,3678.4
YOLOv8s86.18287.322.511,135,00728.6
YOLOv8m85.483.188.752.125,855,80779
YOLOv8l90.484.188.7104.243,629,535165.3
YOLOv9s87.685.990.615.37,179,13526.9
YOLOv10n89.783.788.25.82,272,7036.6
YOLOv11n88.388.4915.52,588,7196.4
YOLOv12n9084.991.35.62,566,9276.4
Transformer-based
RT-DETR-L87.983.286.266.332,005,727103.8
RT-DETR-Resnet5089.581.483.386.141,973,56786.1
RT-DETR-Resnet10188.181.283.5124.360,965,695187.4
RT-DETR-X89.578.883.8135.565,498,431223
LW-DETR-Tiny79.7560.6579.145.912,052,0026.4
LW-DETR-Small84.967.283.3138.736,350,62631.8
D-FINE-N83.480.390.257.923,724,8497.1
DGS-Net91.786.892.45.82,707,2796.2
Table 3. Detection results of deployed device test set.
Class Images Instances P R mAP@0.5 mAP@0.5:0.95
All3945750.9190.8670.9280.636
Barnyard701050.8800.8380.8850.626
Sagittaria trifolia351190.8360.7140.8260.456
Alisma Rhizome2162410.9880.9880.9930.888
Seedling14160.9290.9380.9810.586
Reed68940.9640.8580.9550.623
Speed: 0.5 ms preprocess, 30.1 ms inference, 0.0 ms loss, 0.2 ms postprocess per image
Disclaimer/Publisher’s Note: The statements, opinions and data contained in all publications are solely those of the individual author(s) and contributor(s) and not of MDPI and/or the editor(s). MDPI and/or the editor(s) disclaim responsibility for any injury to people or property resulting from any ideas, methods, instructions or products referred to in the content.