Article

Evaluation and Coupling Coordination Analysis of China’s Sustainable Agricultural Development Level


College of Economics and Management, Northeast Forestry University, Harbin 150040, China
*
Author to whom correspondence should be addressed.
Agriculture 2026, 16(1), 53; https://doi.org/10.3390/agriculture16010053
Submission received: 8 November 2025 / Revised: 22 December 2025 / Accepted: 23 December 2025 / Published: 25 December 2025
(This article belongs to the Section Agricultural Economics, Policies and Rural Management)

Abstract

Agriculture serves as a vital foundation for national development, and its sustainable development holds significant importance for ensuring national food security. This study analyzes the level of agricultural sustainable development and the coupling coordination degree of its subsystems across China’s 31 provincial regions from 2000 to 2022, employing the entropy value method, coupling coordination degree model, and coefficient of variation method. Results show the following: First, the comprehensive index of provincial agricultural sustainable development shows a steady upward trend, though regional variations reveal instability. Second, spatially, sustainable development exhibits a pattern of “high in northeast, low in central and west”, reflecting uneven provincial development. Finally, the coupling coordination degree among agricultural subsystem sustainability capabilities has significantly improved, shifting from a relatively uncoordinated stage to a relatively coordinated stage. Spatially, it generally follows an “high in east, low in west” distribution pattern, revealing variations in provincial agricultural subsystem coordination. Based on these findings, targeted recommendations are proposed to provide theoretical foundations and practical references for China’s sustainable agricultural development.

1. Introduction

Agriculture is the cornerstone of national development [1], and its sustainable development is essential for ensuring food security and supporting the national economy. Between 2000 and 2022, China used only 9% of the world’s arable land and 6% of its freshwater resources to feed nearly 20% of the global population [2]. Grain production increased from 460 million tons to 690 million tons, while the per capita disposable income of rural residents grew nearly ninefold [3]. However, alongside these remarkable achievements, issues such as overexploitation of resources and environmental pollution have become increasingly prominent [4]. The challenge of achieving synergy among social progress, economic growth, and ecological conservation has emerged as a core bottleneck constraining sustainable agricultural development. Therefore, scientifically measuring and clarifying the interactive relationships among the social, economic, and ecological subsystems within agricultural systems holds urgent practical significance.
The Chinese government has attached great importance to this issue. Since the early 21st century, successive Central Document No. 1s have repeatedly emphasized advancing sustainable agricultural capacity building. For instance, the 2015 document explicitly listed “enhancing sustainable agricultural development capabilities” as a major challenge in addressing resource and environmental constraints [5]. The focus of these documents has shifted from ensuring single-dimensional output—such as the 2007 Central Document No. 1’s systematic proposal for “modern agriculture” development [6]—toward coordinating multidimensional, comprehensive development. Particularly since the comprehensive implementation of the “Rural Revitalization Strategy” in 2018, the policy framework has explicitly required the coordinated advancement of thriving industries, ecological livability, and prosperous livelihoods [7], marking a high level of institutionalized attention to the coordination of agriculture’s “socio-economic-ecological” system. This series of policy orientations collectively points to a core question: How can we quantitatively assess and promote the synergistic achievement of social, economic, and ecological objectives within the agricultural system? This constitutes the policy starting point of this study.
The academic community has conducted extensive research on the evaluation and measurement of sustainable agricultural development. Velten et al. [8] systematically elaborated on sustainable agriculture based on social responsibility, economic viability, and ecological integrity; Fu Linlin et al. [9] constructed an evaluation indicator system encompassing six dimensions, which are agricultural resource endowment, agricultural production level, agricultural technology level, ecology, economic benefits, and social benefits, aiming to assess the sustainable development of agriculture in Zhejiang Province from 2013 to 2019; Zhang Liguo et al. [10] developed an evaluation framework encompassing population, society, economy, resources, and environment to analyze China’s agricultural sustainability from 2004 to 2015. Wang Weishuai et al. [11] selected indicators from agricultural society, agricultural economy, and agricultural resources and environment to assess Chengdu’s agricultural sustainability from 2000 to 2016. Moridi et al. [12] constructed an evaluation indicator system encompassing agricultural resources, agricultural development, environment and ecosystems, rural society, and science and education management to assess the sustainable agricultural development level in Golestan; Aleksandra et al. [13] developed a comprehensive green economy index comprising 19 variables across environmental, economic, and social dimensions to evaluate the green economy in rural Poland. Jie Yin et al. [14] incorporated eco-socio-economic objectives into fishery management plans to promote sustainable fisheries development. Research has also focused on constructing integrated indicator systems and employing objective weighting methods such as entropy weighting [15] and principal component analysis [16] for level measurement. While such approaches effectively assess overall development levels, they struggle to reveal interactions among subsystems like society, economy, and ecology. To overcome this limitation, this study introduces the coupling coordination degree model. By integrating coupling degree with coordination degree, this model more precisely characterizes the complex interactive mechanisms and synergy quality among multiple subsystems in agricultural sustainable development, achieving a methodological shift from “level evaluation” to “relationship diagnosis”.
Based on this, this paper utilizes panel data from China’s 31 provinces spanning 2000–2022. First, an evaluation framework is constructed across three dimensions—society, economy, and ecology—using the entropy weight method. Subsequently, the coupling coordination degree model is applied to conduct dynamic assessments and spatiotemporal comparisons of the coupling coordination relationships within the subsystems of agricultural sustainable development across provinces. The marginal contributions of this study are as follows: First, methodologically, it clarifies the advantages of the coupling coordination degree model in analyzing complex relationships within agricultural systems. Second, empirically, it provides the most recent, nationwide-scale spatiotemporal evolution map of coupling coordination. Its policy implications are as follows: the findings enable precise identification of coordination levels across different regions, thereby offering quantitative decision-making support for central and local governments to formulate differentiated, targeted synergistic advancement policies. This contributes to establishing a new agricultural development paradigm characterized by efficient resource utilization, stable ecosystems, and coordinated socioeconomic progress.

2. Theoretical Basis

2.1. Basic Concepts

Sustainable agricultural development is the cornerstone for ensuring food security and social stability. The concept of sustainable development was first defined by the World Commission on Environment and Development as “development that meets the needs of the present without compromising the ability of future generations to meet their own needs” [17], and has since been widely applied across various sectors [18,19,20,21]. For a country like China, characterized by a large population and small-scale farming, sustainable agricultural development holds particular strategic significance. Its core objective is to establish a resource-efficient and environmentally friendly agricultural production system to drive high-quality agricultural development [22]. Achieving this goal requires a systematic understanding of its internal components. Agricultural sustainable development is not a single-dimensional concept [23,24,25,26,27], but rather a complex system composed of three interacting and interdependent subsystems: social, economic, and ecological.
The social subsystem serves as the foundational prerequisite, encompassing the supply and allocation of production factors such as labor, technology, and infrastructure, as well as social welfare indicators like urban-rural equity [28]. The economic subsystem constitutes the pivotal component, reflecting agricultural input-output efficiency [29], farmer income, and industrial growth—it is the driving force behind the system’s operation. The ecological subsystem serves as a vital safeguard, addressing resource consumption, environmental protection, and ecological restoration—the foundational conditions for the system’s long-term viability [30]. These three subsystems interact dynamically, collectively determining the overall state of agricultural sustainability. Therefore, assessing sustainability hinges on scientifically measuring the interplay and coordination levels among these subsystems.

2.2. Theoretical Tools

To quantitatively analyze the complex relationships among the aforementioned multi-systems, this study introduces the “coupling coordination index” model. Originating from physics, this model has been widely applied in the social sciences to evaluate the level of interaction and synergistic development between two or more systems [21]. The model comprises two core dimensions: First, coupling strength: This measures the intensity of interaction and mutual influence between systems. Higher coupling strength indicates stronger interconnectivity and energy transfer between systems. Second, coordination degree: Building upon coupling effects, this dimension measures the extent to which systems mutually reinforce and harmonize with one another. It assesses whether systems are evolving toward positive synergy.

3. Materials and Methods

3.1. Construction of the Indicator System

Considering the United Nations Sustainable Development Goals (SDGs) and the triple bottom line principle of “social-economic-environmental”, and integrating the specific context of China’s agricultural development, based on the goal of achieving “significant economic, social, and ecological benefits” as outlined in the National Plan for Sustainable Agricultural Development (2015–2030) [31], “social sustainability”, “economic sustainability”, and “ecological sustainability” are established as the three core evaluation dimensions. An evaluation indicator system for agricultural sustainable development is constructed, with specific indicators selected as shown in Table 1. The detailed rationale for selecting each indicator is outlined below.
In the social subsystem, the natural population growth rate reflects the long-term supply potential of rural human resources and the endogenous development vitality of society [32], serving as a foundational demographic element for sustainable development. Rural per capita electricity consumption measures the level of modernization in rural residents’ livelihoods. Per capita arable land area is a core indicator representing the endowment of agricultural labor resources. The level of agricultural mechanization reflects the degree of modernization in agriculture as a specific social industry, constituting a core marker of progress in social productive forces [33]. The Engel coefficient for rural households reflects the quality of life for rural residents. Comparing urban and rural income levels directly assesses economic disparities and social equity. In the economic subsystem, per capita regional GDP embodies the level of regional economic development [34]. Per capita disposable income of rural households directly measures the achievements of agricultural and rural development. Agricultural labor productivity reflects the economic output efficiency per unit of agricultural labor, serving as a key metric for assessing industrial competitiveness and shifts in growth patterns. Land productivity measures the economic output value per unit of land area in monetary terms, reflecting the economic efficiency of land use [35]. Land productivity measures the physical output capacity per unit of land area in physical quantities, reflecting the fundamental natural productivity and technological level of the land [36]. In the ecological subsystem, the following five indicators were selected based on the pressure-state-response model [37]: fertilizer application intensity, pesticide application intensity, and plastic mulch application intensity are pressure-type indicators, measuring the safety risks of agricultural production to ecosystems and directly affecting the long-term sustainable use of land. The effective irrigation coverage ratio is a state-type indicator, characterizing the level of infrastructure safeguarding agricultural resilience against drought and stable high yields, as well as the degree of efficient water resource utilization. The area of soil erosion control reflects the level of environmental governance in rural development.
The calculation of certain indicators is as follows: Rural per capita electricity consumption = Rural electricity consumption/Rural population, Per capita arable land area = Arable land area/Rural population, Level of agricultural mechanization = Total power of agricultural machinery/Arable land area, Agricultural labor productivity = Total agricultural output value/Rural population, Land output efficiency = Total agricultural output value/Arable land area, Land productivity = Total grain output/Arable land area, Fertilizer application intensity = Fertilizer application volume/Arable land area, Pesticide application intensity = Pesticide application volume/Arable land area, Plastic mulch application intensity = Agricultural plastic film application volume/Arable land area, Proportion of effectively irrigated area = Effectively irrigated area/Arable land area.

3.2. Data Source

Based on the principles of systematicity, representativeness, data availability, and consistency, the above 16 indicators were selected. Farmland area data is sourced from the “Basic Rural Conditions and Agricultural Production Conditions” chapter of the China Rural Statistical Yearbook and the National Bureau of Statistics official database (https://www.stats.gov.cn/sj/) (accessed on 21 October 2025). The Engel’s coefficient (%) for rural households was sourced from the Income and Consumption chapter of the China Rural Statistical Yearbook and provincial/municipal statistical bulletins. Other data were sourced from the following sections of the China Rural Statistical Yearbook: Population; Basic Rural Conditions and Agricultural Production Conditions; Comprehensive and Summary; National Economic Accounts; Total Output Value and Value Added of Agriculture, Forestry, Animal Husbandry, and Fisheries; Planting Area and Yield of Major Agricultural Products; and Agricultural Ecology and Environment. Missing values for specific years were imputed using linear interpolation.

3.3. Methods

3.3.1. Entropy Weight Method

This study employs the entropy weight method to measure the weighting of evaluation indicators and the comprehensive score level for assessing the sustainability of agricultural development [38], utilizing Stata (18.0) software. As an objective multi-indicator evaluation method, the entropy method has been widely applied in fields such as social sciences [39]. The entropy method is an objective weighting approach based on information entropy, primarily determining indicator weights according to the information content reflected by the degree of variation in indicator data. It posits that indicators with greater information content exhibit lower uncertainty and smaller entropy values, warranting higher weights [40]. The comprehensive development index of the system can be calculated by combining the weights of each indicator. The main computational steps are as follows:
Step 1:
Data Standardization Processing. Due to differences in the units of measurement and positive/negative orientation of various indicators, the raw data requires standardization processing. The standardized calculation formulas for positive and negative indicators are as follows:
X i j = X i j min X j max X j min X j ,
X i j = max X j X i j max X j min X j .
In the above equation, X i j is the raw value of indicator j for province i; max X j   is the maximum value of the indicator across all years; min X j   is the minimum value of the indicator across all years; X i j is the standardized value of indicator j for province i after range standardization.
Step 2:
Calculate the weight of the jth indicator value in the ith year.
Y i j = X i j i = 1 m X i j .
In Equation (3), Y i j denotes the characteristic weight of province i under indicator j.
Step 3:
Calculate the information entropy of each indicator.
e j = 1 ln m i = 1 m Y i j × ln Y i j .
In Equation (4), e j denotes the entropy value of the jth indicator.
Step 4:
Calculate the information entropy redundancy.
d j = 1 e j .
In Equation (5), d j denotes the information entropy redundancy of the jth indicator.
Step 5:
Determine indicator weights.
w j = d j j = 1 n d j .
In Equation (6), w j denotes the entropy weight of the jth indicator.
Step 6:
Calculate the score.
S i = j = 1 n w j × X i j .
In Equation (7), S i denotes the score for the ith year.

3.3.2. Coupling Coordination Degree Model

Applying the coupling coordination degree model to analyze the interaction levels among social, economic, and ecological systems can reveal the coordination levels and developmental stages of these three subsystems. This approach enables the study of mutual influences within the subsystems of agricultural sustainable development, thereby providing a more comprehensive and scientific understanding of its overall sustainability level. The specific calculation formula is as follows:
C = 3 U 1 + U 2 + U 3 3 U 1 + U 2 + U 3 ,
T = α × f x + β × g x + γ × h x ,
D = C × T .
Among these equations, U 1 , U 2 , and U 3 represent data from the social system, economic system, and ecological system, respectively. C represents the coupling degree, with values ranging from [0, 1]. A higher value of C indicates a stronger coupling among the three subsystems. T denotes the comprehensive coordination index. D signifies the coupling coordination index, also ranging from [0, 1]. f(x), g(x), and h(x) represent the comprehensive sustainability scores for the social, economic, and ecological systems, respectively. Higher values indicate greater development within the corresponding system. α, β, and γ denote the weights assigned to each subsystem, reflecting their respective influence coefficients. Calculated using the entropy method, these coefficients, respectively, are 0.47, 0.38, and 0.15.

3.3.3. Coefficient of Variation Method

The coefficient of variation is a commonly used indicator for examining the relative variation in a specific attribute value within a sample over multiple years. The magnitude of its value represents the degree of relative variation in the attribute, with a larger value indicating greater relative variation. This paper employs the coefficient of variation to measure the relative variation in the comprehensive index of agricultural sustainable development, aiming to clarify the overall variation trends in China’s agricultural sustainable development [41]. The specific calculation formula is as follows:
V k = S t Y t ¯ .
Among these equations, S t represents the standard deviation; Y t ¯   is the composite index of China’s agricultural sustainable development level for year t; n represents the number of provinces (municipalities, autonomous regions); V t is the coefficient of variation.

4. Results

4.1. Spatio-Temporal Characteristics of Sustainable Agricultural Development Level

4.1.1. Temporal Variation Characteristics of Sustainable Agricultural Development Level

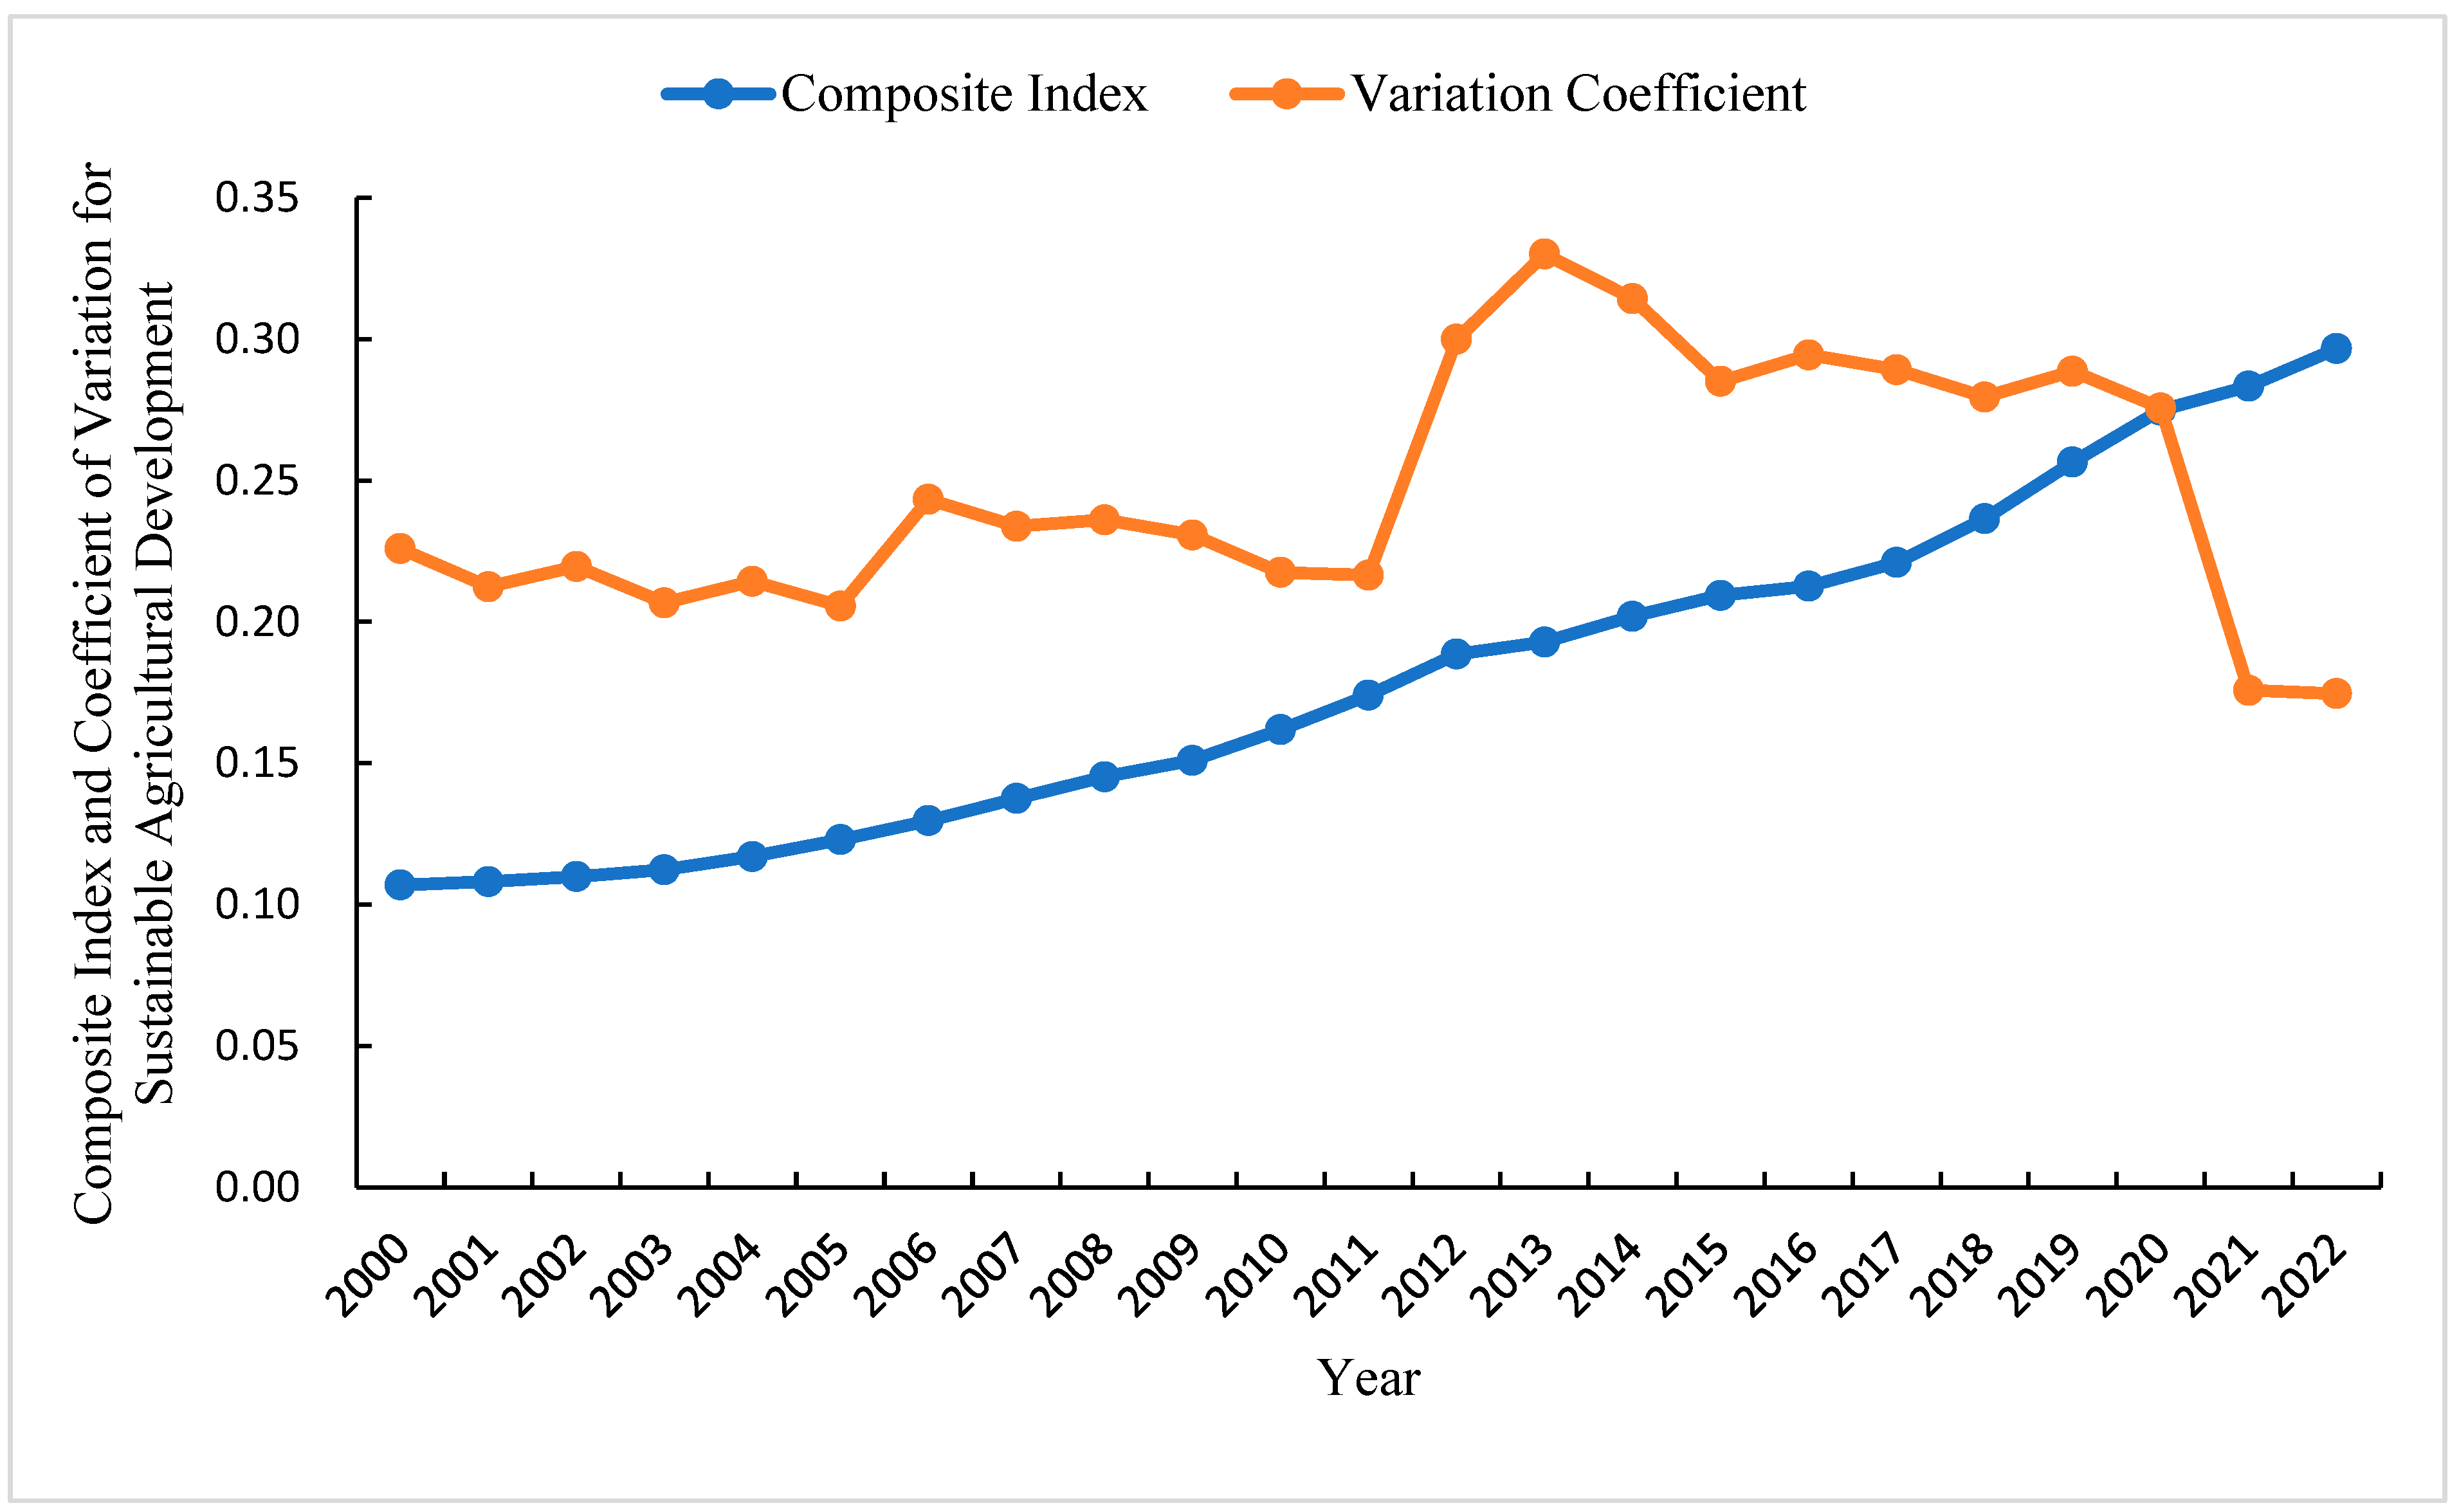
With the evaluation index system established earlier, we measured the sustainable agricultural development levels across China’s 31 provincial regions (excluding Hong Kong, Macao, and Taiwan). Due to space limitations, only the results of 2000, 2008, 2015, and 2022, along with the interannual average values, are presented for each province. The comprehensive index results for each provincial region are detailed in Table 2, while the annual comprehensive index results are illustrated in Figure 1.
As shown in Figure 1, the comprehensive index for agricultural sustainable development across China’s provincial regions exhibited a steady upward trend from 2000 to 2022, with an annual average value of 0.1805. The lowest composite index was recorded in 2000 at 0.1070, while the highest was achieved in 2022 at 0.2967, representing a growth rate of 177.3%. This indicates that although the pace of agricultural sustainable development accelerated during this period, the overall level remains relatively low.
The coefficient of variation for the comprehensive index of provincial agricultural sustainability shows frequent fluctuations between 2000 and 2022. A phased peak occurred from 2011 to 2013, indicating widening development disparities among provinces during this period. This phenomenon is highly correlated with key policy contexts during the same timeframe. In 2011, the Central Document No. 1 focused on water conservancy reform and development for the first time, leading to a significant increase in water conservancy investment nationwide. Additionally, environmental regulations were strengthened at the beginning of the 12th Five-Year Plan period. These factors impacted provincial infrastructure and agricultural production methods with varying intensity and speed. However, ecological indicators reflecting environmental pressures failed to improve synchronously due to inertia, while economic indicators followed divergent growth trajectories influenced by factors such as international grain price fluctuations during the same period [41]. The combined effect of these factors caused short-term imbalances in the development of subsystems within some provinces, thereby widening overall interprovincial disparities.

4.1.2. Spatial Variation Characteristics of Sustainable Agricultural Development Level

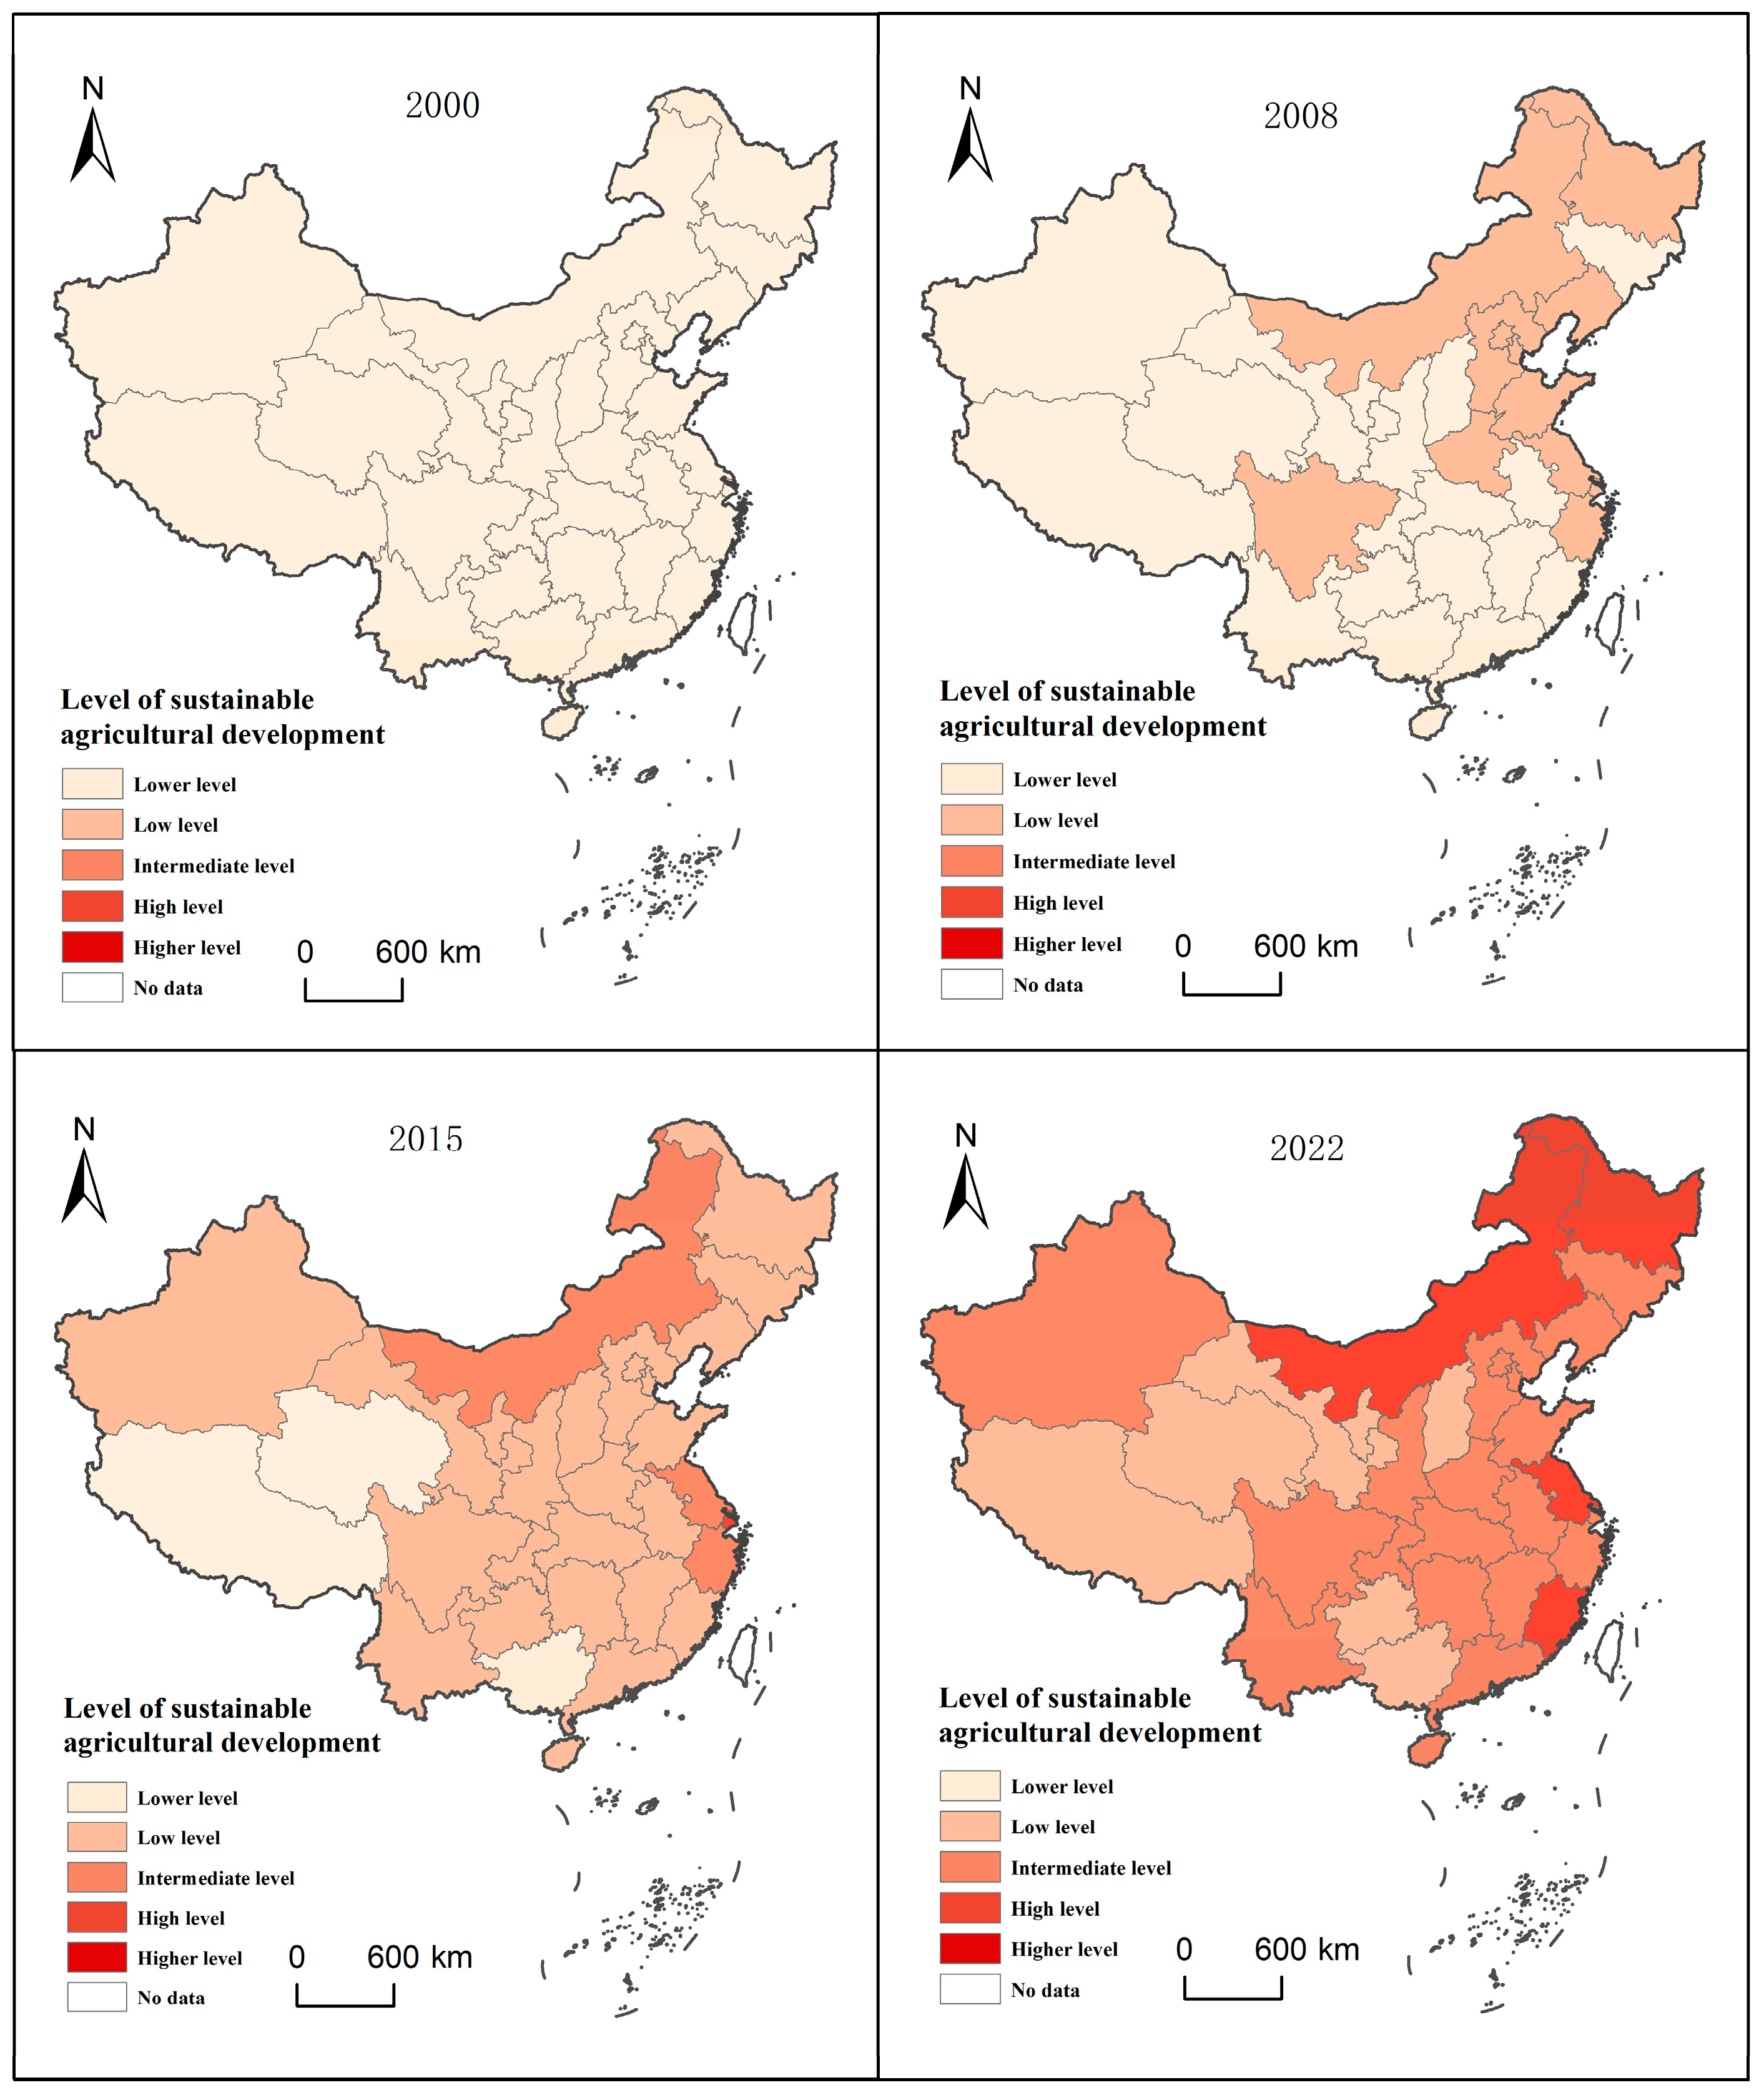
To clarify the spatial evolution of agricultural sustainable development levels across Chinese provinces, the comprehensive scores for agricultural sustainable development were divided into equal intervals. The levels were categorized as follows: lower level [0.0550, 0.1570), low level [0.1570, 0.2591), intermediate level [0.2591, 0.3613), high level [0.3613, 0.4634), and higher level [0.4634, 0.5655]. Comprehensive indices for provincial agricultural sustainable development from 2000, 2008, 2015, and 2022 were selected to construct spatial evolution maps for analysis.
As shown in Figure 2, the comprehensive index of sustainable agricultural development across Chinese provinces remained at a lower level in 2000, indicating overall modest agricultural development nationwide. By 2008, the comprehensive index for agricultural sustainable development had improved in some provinces, though it remained at a low level. This included 12 provinces (municipalities and autonomous regions): Beijing, Tianjin, Hebei, Inner Mongolia, Liaoning, Heilongjiang, Shanghai, Jiangsu, Zhejiang, Shandong, Henan, and Sichuan. The comprehensive index for agricultural sustainable development in the remaining provinces (municipalities and autonomous regions) remained at a lower level. By 2015, agricultural sustainable development levels had further improved. Shanghai achieved the highest level of agricultural sustainable development, with its composite index reaching a higher level. Inner Mongolia, Jiangsu, and Zhejiang saw relatively rapid progress in agricultural sustainable development, with composite indices at a medium level. Among the remaining provinces, regions, and municipalities, all except Guangxi, Qinghai, and Tibet maintained composite indices at a lower level, while the rest remained at a low level. Overall, agricultural sustainable development was better compared to previous years. In 2022, seven provinces (municipalities and autonomous regions)—Shanxi, Guangxi, Guizhou, Tibet, Gansu, Qinghai, and Ningxia—maintained low comprehensive indices for agricultural sustainable development. Four provinces (municipalities and autonomous regions)—Inner Mongolia, Heilongjiang, Jiangsu, and Fujian—achieved high levels. The remaining regions registered moderate levels, with no provinces (municipalities and autonomous regions) falling into lower or higher categories, indicating overall progress in development.
Overall, the level of sustainable agricultural development across provinces exhibits a distinct spatial pattern characterized by high levels in the northeast and low levels in the central and western regions. This pattern can be attributed to two primary factors: First, differences in natural conditions and resource endowments. Regions with higher agricultural development levels (such as Inner Mongolia and Heilongjiang) typically possess uniquely favorable conditions for agricultural production. Inner Mongolia boasts abundant arable land resources and high per capita land availability, facilitating large-scale, mechanized operations and providing ample resource space for agricultural development. As China’s largest commercial grain base, Heilongjiang’s fertile black soil and suitable climate form the ecological foundation for high and stable yields. Conversely, regions with lower agricultural development (such as Qinghai and Tibet) are constrained by harsh natural conditions like extreme cold and aridity. Their fragile ecological base and low ecosystem carrying capacity significantly limit socioeconomic development space, making it difficult for agriculture to achieve high-level development. Second, the focusing effect of industrial structure and policy orientation. The functional positioning and policy priorities of agriculture in different regions profoundly influence their sustainable development. In developed cities like Shanghai, the ecological services and recreational-cultural functions of agriculture are highly emphasized, potentially enabling sustainable agricultural development through the realization of agriculture’s ecological value. In major grain-producing regions like Inner Mongolia, under the strategic orientation of ensuring national food security, large-scale high-standard farmland construction and water-saving irrigation projects have simultaneously enhanced production efficiency and resource utilization efficiency, achieving high-level agricultural development. Some traditional agricultural regions, however, may have long prioritized yield growth at the expense of environmental pressures, thereby constraining sustainable agricultural development.

4.2. Spatio-Temporal Characteristics of Coupling and Coordination Among Subsystems in Sustainable Agricultural Development

4.2.1. Temporal Characteristics of Coupling and Coordination Among Subsystems in Sustainable Agricultural Development

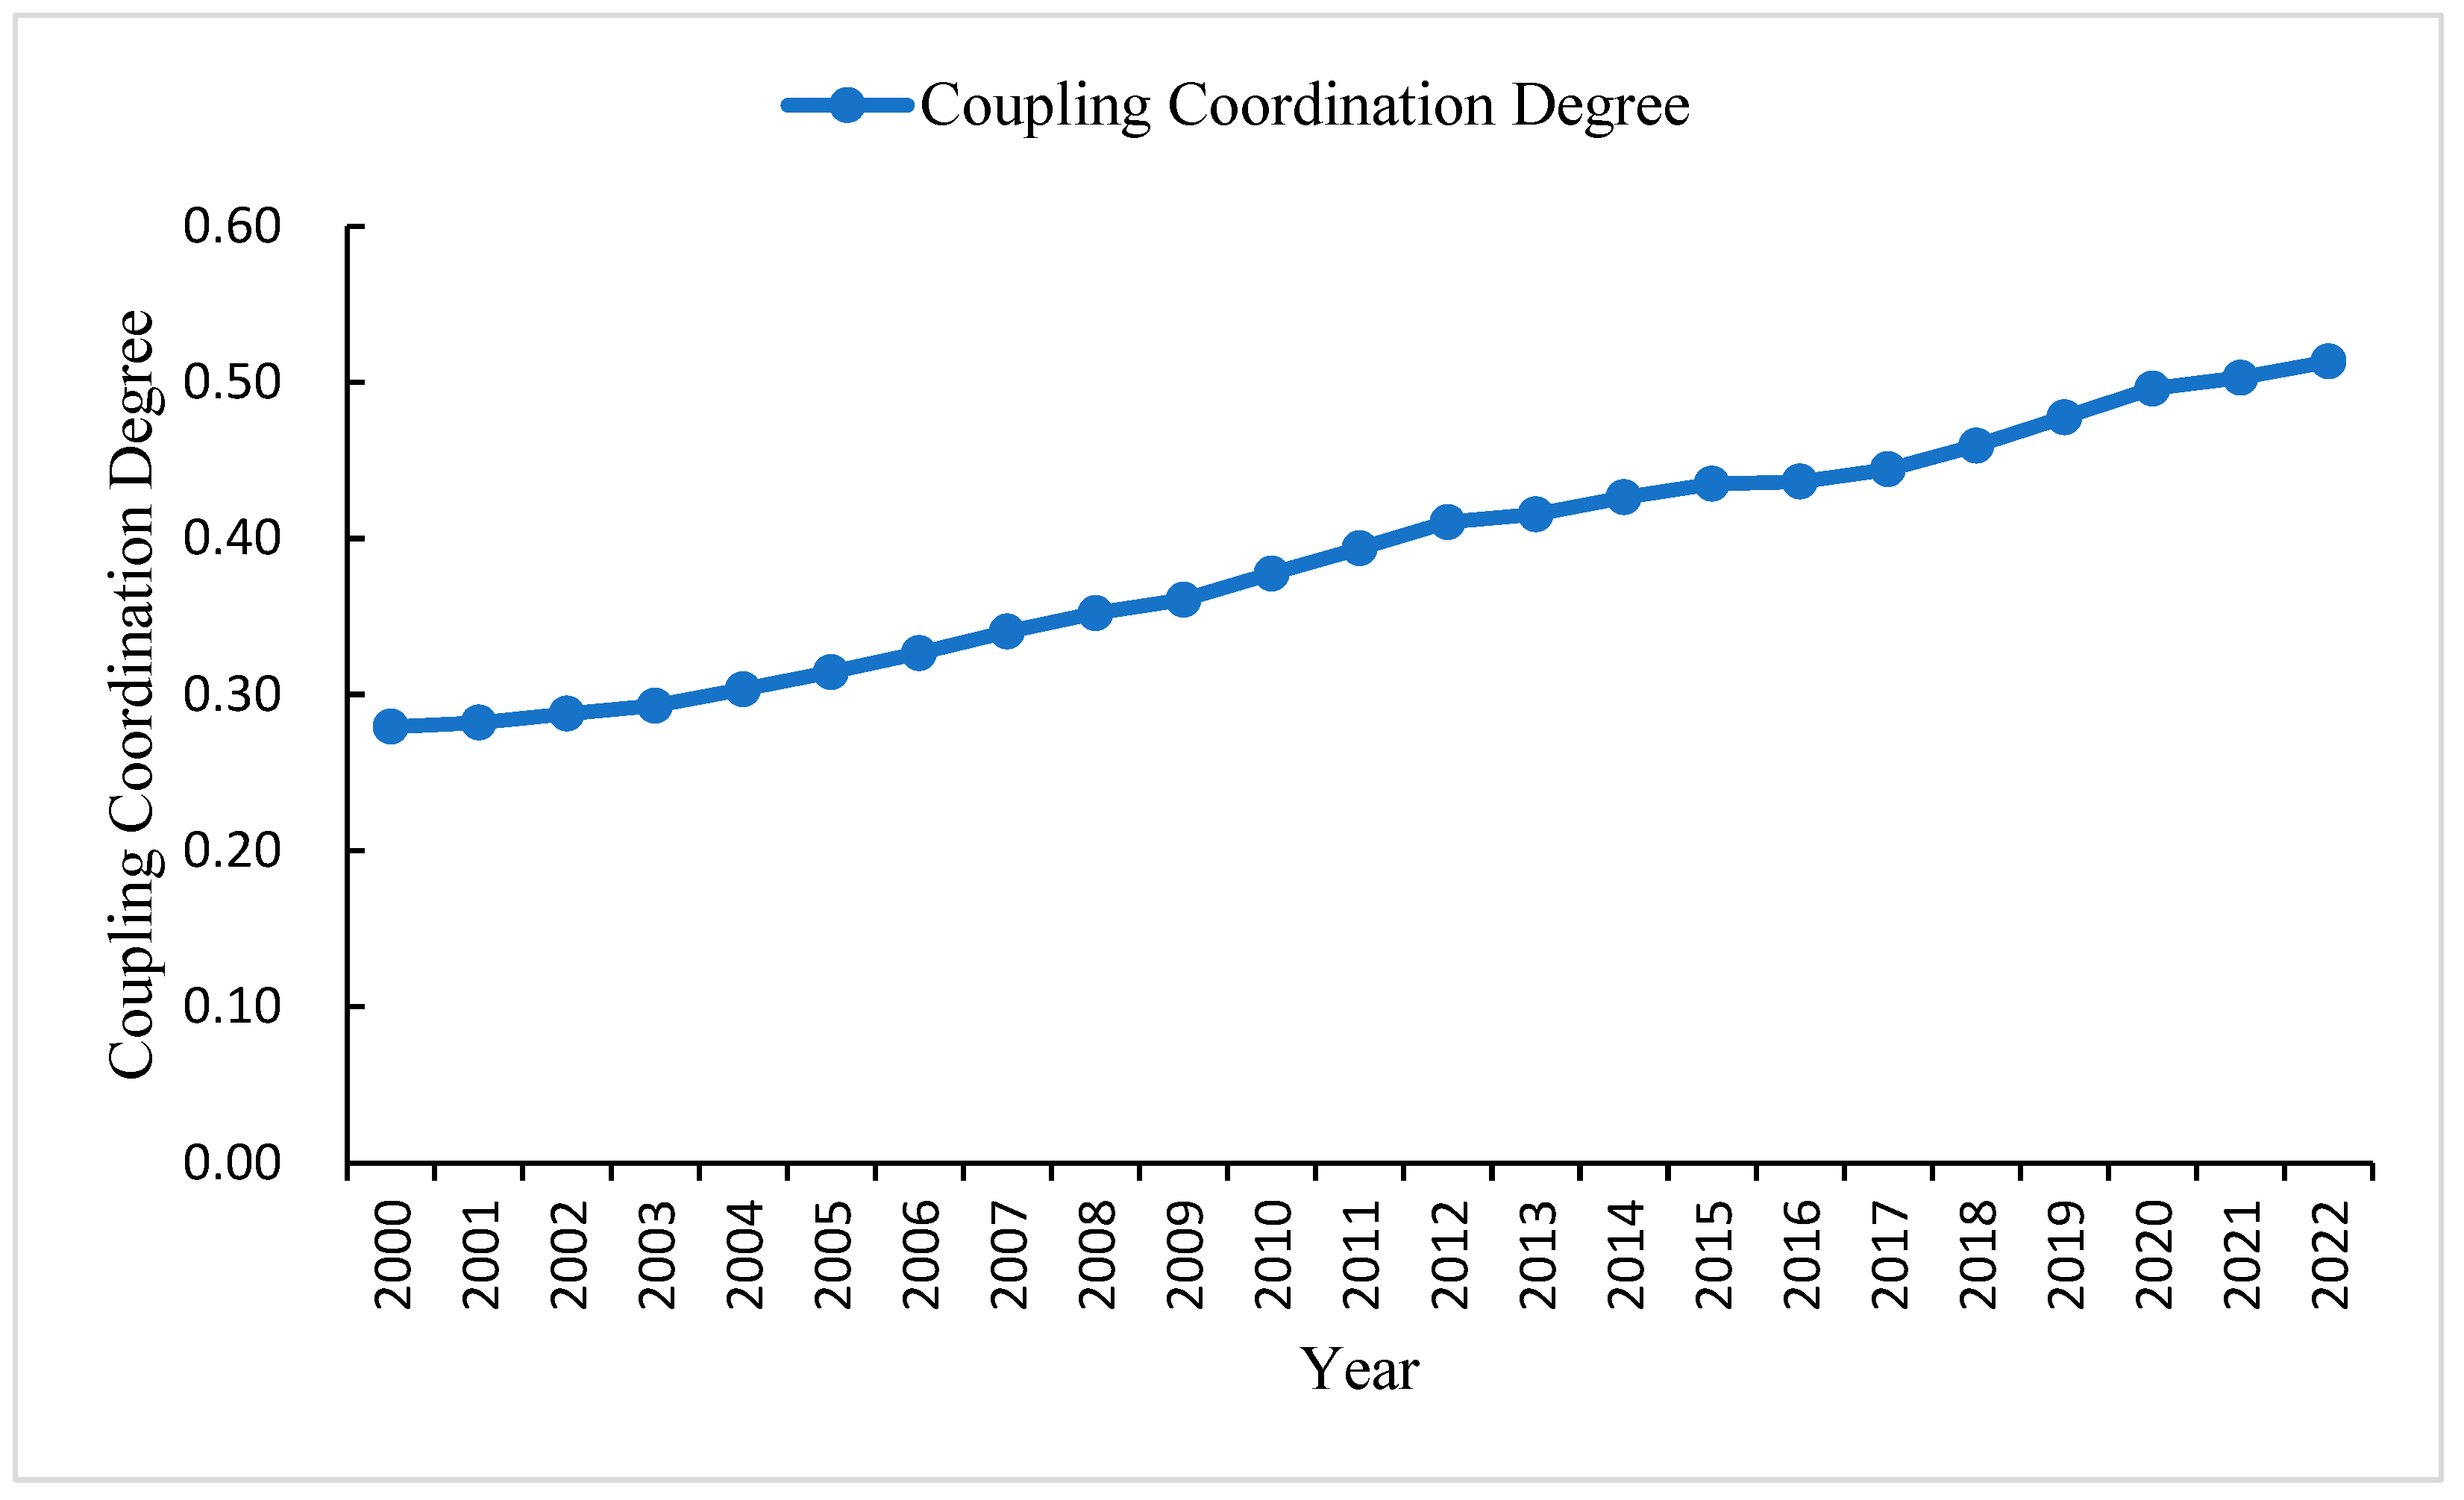
The sustainable development of agriculture at the provincial level in China requires the coordinated advancement of sustainability across all subsystems. To further explore the coupled coordination among the sustainability levels of various subsystems at the provincial level in China, a coupling coordination degree model was applied to measure the coupling coordination degree of the sustainable development levels of China’s provincial-level social, economic, and ecological subsystems from 2000 to 2022. The interannual variations are illustrated in Figure 3.
Figure 3 shows that the evolution of national agricultural coupling coordination from 2000 to 2022 exhibits distinct phases. Specifically, around 2007–2008, coordination emerged from a prolonged slump and entered a steady upward trajectory, closely aligning with the central government’s first explicit policy orientation toward developing modern agriculture and initiating systemic transformation. Around 2014–2015, the rate of increase in coordination significantly accelerated. This surge was closely tied to the concurrent implementation of stringent environmental regulations, such as the Action Plan for Zero Growth in Fertilizer and Pesticide Use, alongside deepening supply-side structural reforms in agriculture. This marked a shift in China’s agricultural development drivers from a singular focus on economic growth toward a dual-drive model emphasizing both economic expansion and ecological constraints. This systemic approach facilitated the rebalancing of subsystems and enhanced overall coordination. Following 2017–2018, the growth rate of coordination accelerated further. This acceleration may be attributed to the comprehensive implementation of the Rural Revitalization Strategy in 2018. This strategy emphasizes the coordinated advancement of thriving industries (economic), ecological livability (ecological), and civilized rural customs (social), providing fundamental impetus for the synergistic pursuit of economic, ecological, and social objectives. This has driven provincial development paths toward greater equilibrium at a higher level. By 2022, provinces had generally achieved a leap in coordination levels, reflecting the concentrated manifestation of long-term systemic policy effects.

4.2.2. Spatial Characteristics of Coupling and Coordination Among Subsystems in Sustainable Agricultural Development

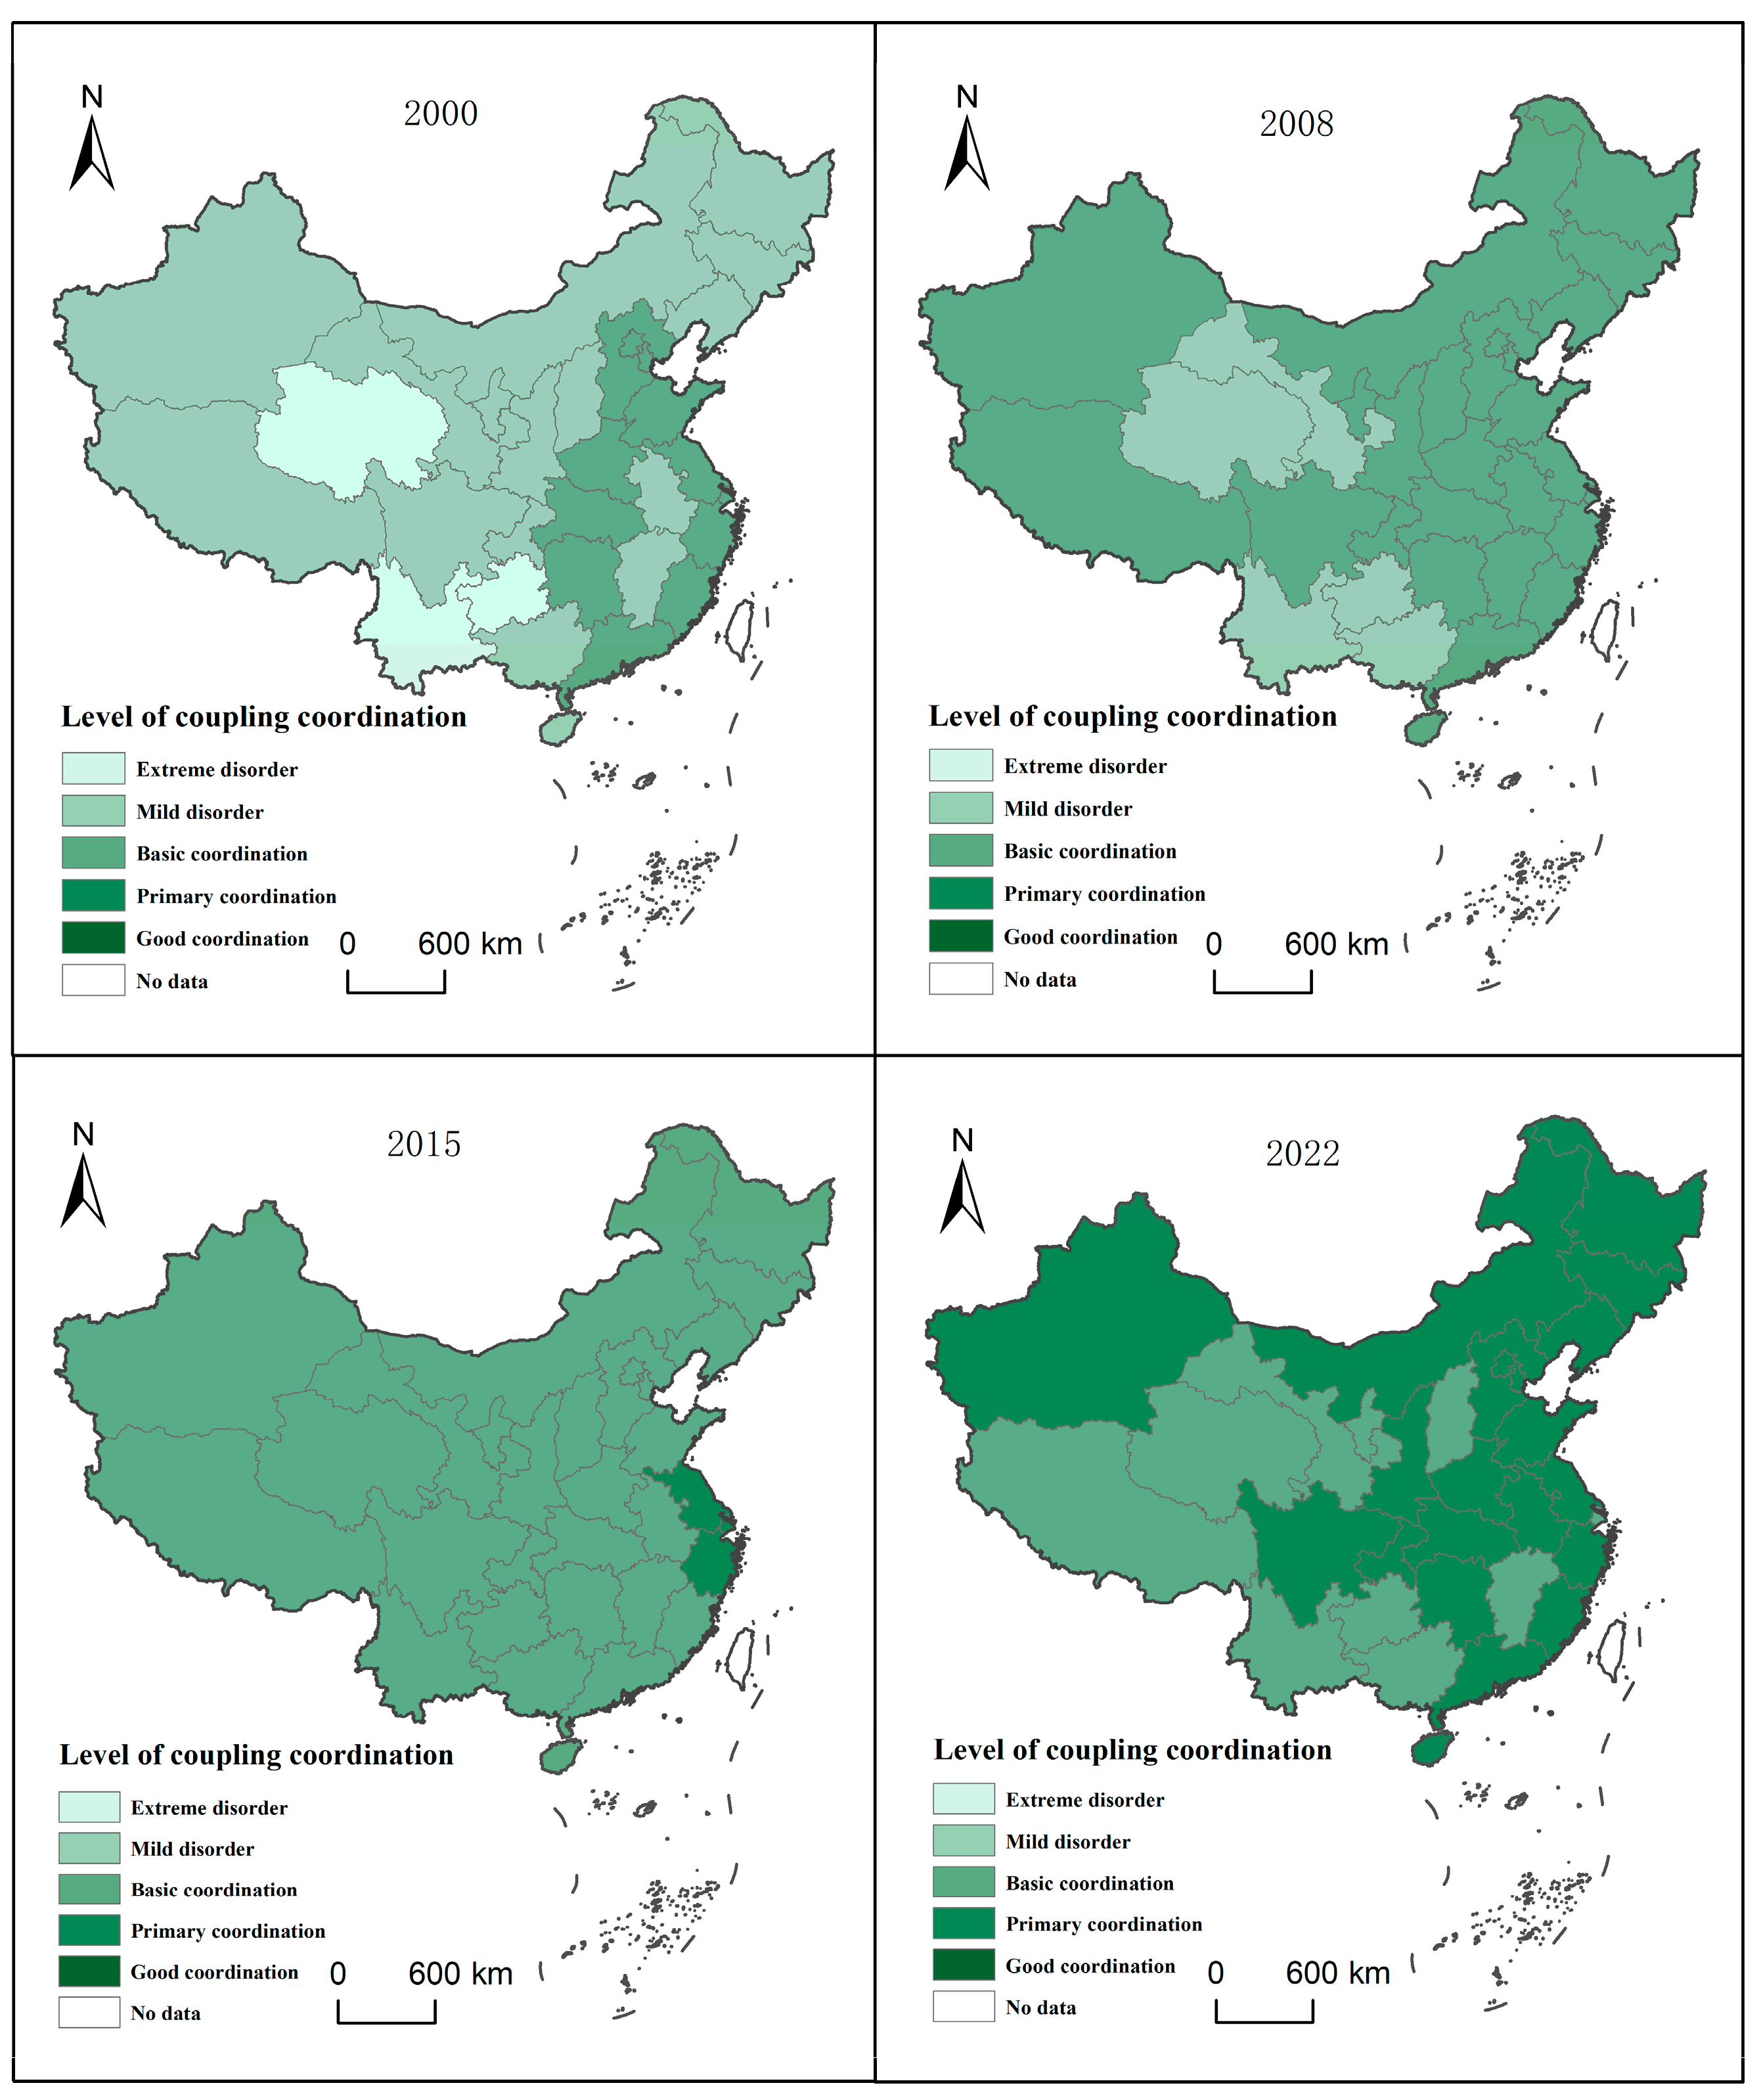
Referencing relevant research [42], the coupling coordination degree is categorized into five levels: extreme disorder [0, 0.2), mild disorder [0.2, 0.3), basic coordination [0.3, 0.5), primary coordination [0.5, 0.8), and good coordination [0.8, 1]. Data from 2000, 2008, 2015, and 2022 were selected to construct spatial evolution maps for analysis.
As can be seen from Figure 4, in 2000, Qinghai, Yunnan, and Guizhou provinces were in a state of extreme disorder in subsystem coupling coordination. Twelve provinces and municipalities, including Beijing, Tianjin, Hebei, Shanghai, Jiangsu, Zhejiang, Fujian, Shandong, Henan, Hubei, Hunan, and Guangdong, were in a state of basic coordination. The remaining provinces, municipalities, and autonomous regions were in a state of mild disorder. Overall, regions in central and eastern China exhibited stronger coupling coordination among social, economic, and ecological subsystems, while western regions showed weaker coordination. By 2008, except for Guangxi, Guizhou, Yunnan, Gansu, and Qinghai, which remained in the stage of mild disorder, all other provinces reached the basic coordinated level, indicating generally improved subsystem coupling coordination. By 2015, Shanghai, Jiangsu, and Zhejiang had achieved primary coordinated development, while all other provinces reached the basic coordination stage. By 2022, progress had advanced further, with all 31 provinces (municipalities and autonomous regions) operating at the coordination stage. Except for 10 provinces (municipalities and autonomous regions)—Shanxi, Shanghai, Jiangxi, Guangxi, Guizhou, Yunnan, Tibet, Gansu, Qinghai, and Ningxia—which remained at the basic coordination level, all other provincial regions achieved the primary coordinated level.
Overall, the spatial distribution pattern of the coupling coordination degree within provincial agricultural subsystems from 2000 to 2022 generally exhibits a “high in east, low in west” configuration. This spatial differentiation reveals distinctly different regional development models. Shanghai exemplifies a “policy-driven high-level equilibrium” model. Its early high coordination levels stemmed from forward-thinking planning for the ecological and social functions of urban agriculture. However, coordination growth has slowed in recent years, potentially reaching the upper limit of achieving multiple objectives within the constrained spatial scope of urban agriculture. In contrast, Inner Mongolia demonstrates a “resource-endowment-driven” coordination pathway. Its abundant arable land resources and advantages in large-scale operations enable simultaneous enhancement of economic and ecological benefits through measures like large-scale water-saving irrigation projects, achieving sustained rapid improvement in coordination levels. The low coordination levels in some western provinces highlight the challenge of subsystems becoming trapped at low levels under dual constraints of ecological limitations and capital shortages. Breaking this impasse requires targeted interventions such as external ecological compensation and the cultivation of distinctive industries.

5. Discussion

5.1. Comparison with Existing Research

Compared with existing research, the relative academic contributions of this study are primarily reflected in the following three aspects: First, in terms of research perspective, unlike studies focusing on in-depth analyses of single regional cases [9,11] or examining cross-sectoral resource linkages [43], this research centers on the internal structure of agricultural systems. It aims to deconstruct and quantify the coupling and coordination relationships among its three core subsystems: social, economic, and ecological. Second, in methodological application, unlike studies emphasizing horizontal evaluation or spatial pattern description [10], this research integrates entropy analysis with the coupling coordination index model. This approach simultaneously reveals the intensity of interactions and the level of synergistic development among subsystems, providing a more refined diagnostic tool for relationship analysis. Third, in terms of empirical scale, based on long-term panel data from 2000 to 2022 covering all 31 provinces in China, this study presents the most comprehensive and up-to-date national panorama. It systematically reveals the spatiotemporal evolution patterns and regional differentiation models, providing robust empirical evidence for understanding the complexity of agricultural transformation in a large country and formulating differentiated policies.

5.2. Limitations

Despite rigorous efforts, this study has the following limitations: First, the indicator system is limited. To ensure the availability and consistency of provincial panel data, core but limited proxy indicators were selected for measuring the social, economic, and ecological subsystems. For instance, the portrayal of “social equity” in the social subsystem remains incomplete, while the ecological subsystem fails to incorporate cutting-edge indicators such as biodiversity and agricultural carbon emissions. This may introduce certain biases in assessing subsystem development levels. Second, policy mechanisms rely on indirect inference. While the analysis correlates major policy milestones with trend shifts, macro-level data constraints prevent the use of econometric models to rigorously identify and quantify the direct impact pathways and magnitude of specific policy instruments on coupling coordination. The findings are thus largely based on logical inferences drawn from spatio-temporal correlations.

5.3. Future Research Directions

Based on the findings and limitations of this study, future research may explore the following avenues: First, expanding indicators and deepening data analysis. Future studies could incorporate richer micro-survey data or remote sensing data to construct a more comprehensive indicator system encompassing agricultural cultural heritage, rural governance effectiveness, and carbon footprint. Concurrently, exploring the use of combined subjective-objective weighting methods that holistically consider indicator importance is warranted. Second, dynamic simulation and policy modeling. System dynamics modeling can be introduced to simulate complex dynamic feedback processes among social, economic, and ecological subsystems under different policy scenarios. This approach enables prediction and simulation of long-term evolution in coupling coordination, providing more precise decision support for developing forward-looking, differentiated regional coordination policies.

6. Conclusions and Implications

6.1. Conclusions

Taking China’s 31 provinces (municipalities and autonomous regions) (excluding Hong Kong, Macao, and Taiwan) as the research subjects, an evaluation index system for agricultural sustainable development was constructed by selecting 16 indicators from social, economic, and ecological dimensions. Using the entropy method, coupling coordination index model, and coefficient of variation method, we analyzed the sustainable agricultural development levels and subsystem coupling coordination indices across Chinese provinces from 2000 to 2022. The following conclusions were drawn: Firstly, from a temporal perspective, the comprehensive index of agricultural sustainable development across China’s 31 provincial regions (excluding Hong Kong, Macao, and Taiwan) showed a steady upward trend from 2000 to 2022, indicating an overall improvement in China’s agricultural sustainability during this period. Regarding the coefficient of variation, the index exhibited frequent fluctuations, suggesting significant relative disparities in agricultural sustainability levels among different provinces and regions, reflecting developmental instability. Secondly, from a spatial perspective, the comprehensive index of agricultural sustainable development across China’s 31 provincial-level regions (excluding Hong Kong, Macao, and Taiwan) achieved a leap from lower level to intermediate level or high level between 2000 and 2022. Spatially, it generally exhibited a distribution pattern of “high in the northeast, low in the central and western regions”, indicating regional disparities in China’s agricultural sustainable development during this period and an imbalance in regional agricultural sustainability. Thirdly, regarding the coupling coordination degree of sustainability among agricultural subsystems, the coupling coordination degree between subsystem sustainability showed a steady upward trend from 2000 to 2022. It increased from 0.2796 in 2000 to 0.5136 in 2022, representing a growth rate of 83.69%. This transition signifies a shift from mild disorder level to primary coordination level. Spatially, this distribution pattern generally follows an “high in east, low in west” configuration, indicating regional variations in the coordination of agricultural subsystems.

6.2. Implications

The above analysis indicates that the overall level of sustainable agricultural development in China’s provincial regions remains relatively low and unstable. Furthermore, the coupling and coordination among the sustainability capacities of various subsystems are inadequate, with significant regional disparities. Therefore, based on the above conclusions, efforts to enhance the sustainable development of agriculture at the provincial level in China can be focused on the following three key aspects:

6.2.1. Enhance the Sustainable Agricultural Development Capacity of China’s Provinces

Improve agricultural infrastructure, integrate social resources, and participate in protecting farmland and the ecological environment. Emphasize the leading role of talent, strengthen talent cultivation systems, and build a workforce capable of supporting high-quality agricultural development to provide human resources for sustainable agriculture. Prioritize the application of data elements in agriculture, adhere to the strategy of revitalizing agriculture through science and technology, increase investment in agricultural R&D, and elevate the level of green agricultural production.

6.2.2. Enhance Coordination Among the Sustainable Capacities of Agricultural Subsystems

Adjust the agricultural industrial structure to promote the integrated development of primary, secondary, and tertiary industries, and strengthen the coordinated development of social, economic, and ecological dimensions. This includes accelerating the flow of factors between urban and rural areas, attracting factors to the agricultural sector, developing eco-tourism, and expanding agricultural technology extension cooperation to foster coordinated development among the sustainable capacities of various subsystems.

6.2.3. Developed Based on Local Conditions to Narrow Regional Disparities

Considering the differences in resource endowments among provinces, development plans tailored to their respective foundations can be formulated to foster localized growth. For instance, eastern regions should leverage their advantages in capital and technology to strengthen agricultural technological innovation and play a leading role; central regions should introduce advanced technologies while integrating them with their agricultural development foundations and balancing ecological conservation to enhance agricultural production and management efficiency; Western regions should enhance infrastructure development, leverage the ecological advantages of natural resources to develop eco-tourism, break geographical constraints, and promote the flow of factors. Simultaneously, strengthen resource sharing among regions to foster coordinated development of social, economic, and ecological systems, narrow regional development disparities, and elevate the level of sustainable agricultural development.

Author Contributions

Conceptualization, X.Z. and G.T.; methodology, X.Z.; software, G.T.; validation, X.Z. and G.T.; formal analysis, X.Z.; investigation, G.T.; resources, X.Z.; data curation, G.T.; writing—original draft preparation, X.Z.; writing—review and editing, X.Z. and G.T.; visualization, X.Z.; supervision, G.T.; project administration, G.T.; funding acquisition, G.T. All authors have read and agreed to the published version of the manuscript.

Funding

This research was funded by the National Social Science Foundation of China “Research on the Intergenerational Differences of the New Generation of Migrant Workers and Their Social Support Policies for Citizenship”, grant number 23BSH025.

Institutional Review Board Statement

Not applicable.

Data Availability Statement

The original contributions presented in this study are included in the article. Further inquiries can be directed to the corresponding author.

Conflicts of Interest

The authors declare no conflicts of interest. The funders had no role in the design of the study; in the collection, analyses, or interpretation of data; in the writing of the manuscript; or in the decision to publish the results.

References

  1. Gong, B. Agricultural productivity convergence in China. China Econ. Rev. 2020, 60, 101423. [Google Scholar] [CrossRef]
  2. Song, H.; Jiang, F. Connotative Characteristics, Key Tasks and Key Initiatives of an Agricultural Power. Issues Agric. Econ. 2023, 44, 18–29. [Google Scholar]
  3. National Bureau of Statistics of China. Statistical bulletin of national economic and social development of the People’s republic of China in 2022. China Stat. 2022, 3, 9–26. [Google Scholar]
  4. Bernard, B.; Lux, A. How to feed the world sustainably: An overview of the discourse on agroecology and sustainable intensification. Reg. Environ. Change 2017, 17, 1279–1290. [Google Scholar] [CrossRef]
  5. Ministry of Agriculture and Rural Affairs of the People’s Republic of China. The No. 1 Document of the Central Government in 2015. Available online: https://www.moa.gov.cn/ztzl/yhwj2015/zywj/ (accessed on 16 December 2025).
  6. Ministry of Agriculture and Rural Affairs of the People’s Republic of China. The No. 1 Document of the Central Government in 2007. Available online: https://www.moa.gov.cn/ztzl/yhwj/wjhg/201202/t20120215_2481382.htm (accessed on 16 December 2025).
  7. Ministry of Agriculture and Rural Affairs of the People’s Republic of China. The No. 1 Document of the Central Government in 2022. Available online: https://www.moa.gov.cn/ztzl/jj2022zyyhwj/2022nzyyhwj/202202/t20220222_6389276.htm (accessed on 16 December 2025).
  8. Velten, S.; Leventon, J.; Jager, N.; Newig, J. What is sustainable agriculture? A systematic review. Sustainability 2015, 7, 7833–7865. [Google Scholar] [CrossRef]
  9. Fu, L.; Mao, X.; Mao, X.; Wang, J. Evaluation of agricultural sustainable development based on resource use efficiency: Empirical evidence from Zhejiang Province, China. Front. Environ. Sci. 2022, 10, 860481. [Google Scholar] [CrossRef]
  10. Zhang, L.; Bao, B.; Yang, S. Spatial exploratory analysis of agricultural sustainable development in China. Econ. Geogr. 2019, 39, 159–164. [Google Scholar]
  11. Wang, W.; Gao, Y.; Liu, H.; Xing, L.; Yang, S. Evaluation on the Agricultural Sustainable Development of Chengdu Based on Euclidean Distance Theory. Chin. J. Agric. Resour. Reg. Plan. 2019, 40, 209–215. [Google Scholar]
  12. Shah Moridi, R.; Kazemi, H.; Kamkar, B. Evaluation of sustainable agricultural development in Golestan province. J. Agric. Sci. Sustain. Prod. 2017, 27, 197–215. [Google Scholar]
  13. Jezierska-Thöle, A.; Gwiaździńska-Goraj, M.; Dudzińska, M. Environmental, social, and economic aspects of the green economy in polish rural areas—A spatial analysis. Energies 2022, 15, 3332. [Google Scholar] [CrossRef]
  14. Yin, J.; Wo, J.; Li, Y.; Sun, M.; Eurich, J.G.; Kleisner, K.M.; Chen, Y. Evaluating ecological and socio-economic system dimensions to improve fisheries management in the Bohai Sea, China. Rev. Fish Biol. Fish. 2026, 36, 11. [Google Scholar] [CrossRef]
  15. Li, S.; Gong, Q.; Yang, S. A sustainable, regional agricultural development measurement system based on dissipative structure theory and the entropy weight method: A case study in Chengdu, China. Sustainability 2019, 11, 5313. [Google Scholar] [CrossRef]
  16. Tiwari, D.N.; Loof, R.; Paudyal, G.N. Environmental–economic decision-making in lowland irrigated agriculture using multi-criteria analysis techniques. Agric. Syst. 1999, 60, 99–112. [Google Scholar] [CrossRef]
  17. Ellili, N.O.D. Bibliometric analysis of sustainability papers: Evidence from Environment, Development and sustainability. Environ. Dev. Sustain. 2024, 26, 8183–8209. [Google Scholar] [CrossRef]
  18. Marull, J.; Farre, M.; Galletto, V.; Trullén, J. Analysing sustainable-progress typologies in European metropolitan regions. Cities 2023, 137, 104347. [Google Scholar] [CrossRef]
  19. Qiu, R.; Hou, S.; Chen, X.; Meng, Z. Green aviation industry sustainable development towards an integrated support system. Bus. Strategy Environ. 2021, 30, 2441–2452. [Google Scholar] [CrossRef]
  20. Kyaw, K.; Pindado, J.; de-la-Torre, C. Disentangling the bidirectional relationships across the corporate sustainable development indicators. Soc. Indic. Res. 2022, 163, 297–320. [Google Scholar] [CrossRef]
  21. Cai, J.; Li, X.; Liu, L.; Chen, Y.; Wang, X.; Lu, S. Coupling and coordinated development of new urbanization and agro-ecological environment in China. Sci. Total Environ. 2021, 776, 145837. [Google Scholar] [CrossRef]
  22. Yu, X.; Sheng, G.; Sun, D.; He, R. Effect of digital multimedia on the adoption of agricultural green production technology among farmers in Liaoning Province, China. Sci. Rep. 2024, 14, 13092. [Google Scholar] [CrossRef]
  23. Desa, G.; Jia, X. Sustainability transitions in the context of pandemic: An introduction to the focused issue on social innovation and systemic impact. In Social Innovation and Sustainability Transition; Springer Nature: Cham, Switzerland, 2022; pp. 273–281. [Google Scholar]
  24. Sun, J.; Hua, E.; Sun, S.; Yin, Y.; Wang, Y.; Zhao, J.; Wu, P. Sustainability assessment of agricultural development in China: Water-carbon footprint perspective. Agric. Water Manag. 2025, 320, 109835. [Google Scholar] [CrossRef]
  25. Pan, M.; Tang, Z.; Zhao, G. Organic farming enhances the synergy of the water-energy-food-ecology nexus. Agric. Syst. 2025, 224, 104247. [Google Scholar] [CrossRef]
  26. Huo, C.; Chen, L. The impact of land transfer policy on sustainable agricultural development in China. Sci. Rep. 2024, 14, 7064. [Google Scholar] [CrossRef] [PubMed]
  27. Tang, J.F.; Liu, J.L. Evaluation of provincial agricultural sustainable development level and its coupling and coordination analysis-Take 11 provinces and cities in the Yangtze River economic belt as an example. Econ. Geogr. 2022, 42, 179–185. [Google Scholar]
  28. Geng, Y.; Yang, X.; Zhang, N.; Li, J.; Yan, Y. Sustainable rural development: Differentiated paths to achieve rural revitalization with case of Western China. Sci. Rep. 2024, 14, 31507. [Google Scholar] [CrossRef]
  29. Liu, F.; Wang, C.; Luo, M.; Zhou, S.; Liu, C. An investigation of the coupling coordination of a regional agricultural economics-ecology-society composite based on a data-driven approach. Ecol. Indic. 2022, 143, 109363. [Google Scholar] [CrossRef]
  30. Luo, D.; Liang, L.; Wang, Z.; Chen, L.; Zhang, F. Exploration of coupling effects in the Economy–Society–Environment system in urban areas: Case study of the Yangtze River Delta Urban Agglomeration. Ecol. Indic. 2021, 128, 107858. [Google Scholar]
  31. Ministry of Agriculture of the People’s Republic of China Bulletin 2015. Available online: https://www.moa.gov.cn/nybgb/2015/liu/201712/P020220422349831283376.pdf (accessed on 16 December 2025).
  32. Xing, G.; Wang, D.; Cai, W. Study on multidimensional shrinkage spatial-temporal patterns and driving forces of cities in the Yellow River Basin. Sci. Rep. 2025, 15, 22934. [Google Scholar] [CrossRef]
  33. Wei, X.; Chen, B. Spatial association network structure of agricultural carbon emission efficiency in Chinese cities and its driving factors. Sci. Rep. 2024, 14, 31810. [Google Scholar] [CrossRef] [PubMed]
  34. Anh, H.H.; Phuong, D.N.D.; Da Hanh, T.M.; Ha, P.T.; Loi, N.K. Assessing the feasibility of achieving agricultural development targets in alignment with the development blueprint of Kon Tum Province, Vietnam. Agric. Syst. 2025, 230, 104485. [Google Scholar] [CrossRef]
  35. Batista e Silva, F.; Koomen, E.; Diogo, V.; Lavalle, C. Estimating demand for industrial and commercial land use given economic forecasts. PLoS ONE 2014, 9, e91991. [Google Scholar] [CrossRef] [PubMed]
  36. Doss, C.R. Women and agricultural productivity: Reframing the Issues. Dev. Policy Rev. 2018, 36, 35–50. [Google Scholar] [CrossRef]
  37. Liu, X.; Guo, P.; Yue, X.; Zhong, S.; Cao, X. Urban transition in China: Examining the coordination between urbanization and the eco-environment using a multi-model evaluation method. Ecol. Indic. 2021, 130, 108056. [Google Scholar] [CrossRef]
  38. Tariq, M.; Xu, Y.; Ullah, K.; Dong, B. Toward low-carbon emissions and green growth for sustainable development in emerging economies: Do green trade openness, eco-innovation, and carbon price matter? Sustain. Dev. 2024, 32, 959–978. [Google Scholar] [CrossRef]
  39. Gao, Y.; Tian, L.; Huang, A.; Zhang, H.; Yu, J.; Pan, Y.; Wang, Y.; Gou, B. Research on the Sustainable Development of Natural-Social-Economic Systems Based on the Emergy Accounting Method—A Case Study of Liyang in China. Land 2023, 12, 1362. [Google Scholar] [CrossRef]
  40. Xu, M.; Hu, W.Q. A research on coordination between economy, society and environment in China: A case study of Jiangsu. J. Clean. Prod. 2020, 258, 120641. [Google Scholar] [CrossRef]
  41. Xu, W.; Liu, C. The spatial pattern and driving force of innovation of industrial cluster and county urbanization coupled coordination in Zhejiang province. Sci. Geogr. Sin. 2015, 35, 1347–1356. [Google Scholar]
  42. Guo, S.; Diao, Y.; Du, J. Coupling coordination measurement and evaluation of urban digitalization and green development in China. Int. J. Environ. Res. Public Health 2022, 19, 15379. [Google Scholar] [CrossRef] [PubMed]
  43. Qi, Y.; Farnoosh, A.; Lin, L.; Liu, H. Coupling coordination analysis of China’s provincial water-energy-food nexus. Environ. Sci. Pollut. Res. 2022, 29, 23303–23313. [Google Scholar] [CrossRef]
Figure 1. Trends in China’s Comprehensive Index of Sustainable Agricultural Development (2000–2022).
Agriculture 16 00053 g001
Figure 2. Spatial Evolution Map of China’s Sustainable Agricultural Development Level.
Agriculture 16 00053 g002
Figure 3. Development of Coupling Coordination Degree Among Subsystems in China’s Sustainable Agricultural Development (2000–2022).
Agriculture 16 00053 g003
Figure 4. Spatial Evolution Map of Coupling Coordination Degree in China’s Agricultural Subsystem.
Agriculture 16 00053 g004
Table 1. System of indicators for evaluation sustainable agricultural development.
Primary IndicatorWeightSecondary IndicatorsUnitAttributeWeight
Social system0.47Natural population growth rateNegative0.0220
Per capita electricity consumption in rural areaskWh per personPositive0.2824
Per capita arable land areaha per personPositive0.1045
Agricultural mechanization levelkW per square kilometerPositive0.0436
Engel’s coefficient for rural households%Negative0.0058
Comparison of income levels between urban and rural residents/Negative0.0071
Economic system0.38Per capita regional gross domestic productRMB yuanPositive0.0816
Per capita disposable income of rural householdsRMB per personPositive0.0896
Agricultural labor productivityRMB per personPositive0.0906
land output rateTen thousand yuan per square kilometerPositive0.0844
Land productivitykg/km2Positive0.0397
Ecosystem0.15Fertilizer application intensitykg/km2Negative0.0161
Pesticide application intensitykg/km2Negative0.0034
Plastic mulch usage intensitykg/km2Negative0.0066
Effective irrigation coverage ratio/Positive0.0385
Area of land subject to soil erosion controlthousand km2Positive0.0844
Table 2. Comprehensive Index of Sustainable Agricultural Development in China (2000–2022).
Region2000200820152022Average
Beijing0.14390.19840.22030.31630.2086
Tianjin0.12880.16540.24120.31900.1986
Hebei0.13050.17530.22530.28690.1959
Shanxi0.09860.12090.17070.24020.1467
Inner Mongolia0.12770.18770.27100.41960.2341
Liaoning0.10720.16730.22950.28040.1905
Jilin0.10460.14850.19260.26930.1700
Heilongjiang0.11160.16360.24300.39020.2125
Shanghai0.14250.22710.44320.31230.3134
Jiangsu0.12120.18300.29870.37120.2371
Zhejiang0.15130.18280.26130.35250.2273
Anhui0.10450.12580.18320.26680.1670
Fujian0.11610.14230.24130.36180.2007
Jiangxi0.11200.14680.19290.28370.1779
Shandong0.13000.17590.23890.32820.2070
Henan0.12030.15930.21010.29450.1856
Hubei0.11600.15460.21270.31260.1900
Hunan0.11240.15200.21510.31300.1848
Guangdong0.12000.15120.22440.32430.1905
Guangxi0.08950.09680.15170.25300.1367
Hainan0.08320.11170.16150.31750.1482
Chongqing0.09640.11530.17580.28520.1581
Sichuan0.11570.15910.20000.31630.1886
Guizhou0.05490.08460.16090.25640.1261
Yunnan0.06900.10220.16590.26460.1392
Tibet0.07300.12240.12880.18690.1247
Shaanxi0.11280.14900.19190.29720.1784
Gansu0.09460.11940.16420.24440.1461
Qinghai0.05780.08870.12300.19070.1098
Ningxia0.07570.11220.16570.23840.1388
Xinjiang0.09600.11240.18510.30330.1621
Disclaimer/Publisher’s Note: The statements, opinions and data contained in all publications are solely those of the individual author(s) and contributor(s) and not of MDPI and/or the editor(s). MDPI and/or the editor(s) disclaim responsibility for any injury to people or property resulting from any ideas, methods, instructions or products referred to in the content.