1. Introduction
Global population growth is projected to surge from 7.4 billion (2016) to 9 billion by mid-century—coupled with escalating food demands, this places unprecedented strain on agricultural systems, where arthropod pests account for 18–26% of annual yield losses, critically undermining food security [
1]. While integrated pest management strategies are essential, scalability analyses reveal systemic limitations: biological control incurs higher unit costs with expanded implementation due to diminishing returns, while chemical interventions, despite short-term cost effectiveness, pose irreversible environmental risks, including non-target toxicity, groundwater contamination, and pesticide resistance [
2]. In contrast, physical control methods such as Pareto optimal solutions combine scalable cost-effectiveness with minimal ecological disruption.
However, how to effectively monitor the occurrence patterns of diseases remains a key factor that restricts the development of physical control strategies and their potential effectiveness, particularly for flying pests. To address these challenges, we focus on Cacopsylla chinensis as the target and describe a population monitoring method based on physical control strategies.
Cacopsylla chinensis, a major pest in Chinese pear orchards, feeds on buds, leaves, and tender shoots during both the adult and nymphal stages, causing the formation of necrotic brown spots on leaves [
3]. Severe infestations can lead to widespread leaf browning and premature defoliation [
4]. In addition, the honeydew excreted by
Cacopsylla chinensis promotes sooty mold development, contaminating fruit surfaces and foliage, thereby disrupting leaf development, floral bud differentiation, and fruit maturation. These effects ultimately result in a significant decline in fruit quality. Consequently,
Cacopsylla chinensis has become a critical pest requiring urgent management in China’s major pear-producing regions [
5].
The most commonly employed techniques for insect pest monitoring include light traps [
6], pheromone traps [
7], sticky traps [
8], and sticky bands [
9]. Ref. [
10] investigated the trapping efficiency of differently colored sticky boards for
Cacopsylla chinensis and found that both morphological types of
Cacopsylla chinensis exhibited strong attraction to yellow and purple sticky boards. Refs. [
11,
12] utilized the multisensory behaviors of moth species to develop a remote monitoring system for moth pests, where trap-collected data are transmitted and processed in real time via a 4G network. Additionally, automatic detection systems for
Sogatella furcifera and
Nilaparvata lugens have been established, enabling intelligent pest monitoring using light traps [
13].
Pheromone and light traps are widely utilized not only to track insect pest populations, but also to suppress larval populations by capturing adult moths. However, challenges persist in achieving real-time efficacy monitoring. A recent emerging solution integrates IoT-enabled sensors [
14,
15,
16] and machine learning algorithms [
17,
18]; studies [
4,
19,
20] have employed object detection algorithms such as Fast R-CNN and YOLOv-series to identify pests on sticky traps, achieving pest classification and detection. An improved YOLOv5 algorithm [
21] was utilized for pest detection on sticky traps in tomato fields. Most of these studies focus on pest identification from an algorithmic perspective. To better apply deep learning-based methods, ref. [
22] adopted a centralized service architecture, using network cameras for data acquisition and deploying a cascaded R-CNN model on a server for pest detection in vegetable gardens. However, this approach has notable drawbacks: network cameras require physical Ethernet cables or wireless adapters, as well as a continuous power supply, which leads to higher costs and increased complexity for large-scale deployment.
An improved YOLOv10 algorithm [
23] was deployed for pest detection on sticky traps in the field. Although these approaches have achieved certain results, nevertheless, IoT-based monitoring still faces challenges such as unstable wireless communication due to distributed nodes and difficulties in ensuring reliable power supply. Furthermore, AI-based approaches often require extensive deployment of front-end devices and place high demands on back-end server infrastructure, which significantly limits scalability and widespread adoption.
To address the aforementioned challenges, we conduct field investigations to better understand agricultural operation and management practices. Based on the actual working conditions of pear orchards [
24], and aiming to reduce monitoring costs and operational complexity, we initiated a study on a population monitoring method based on physical control strategies. Using sticky traps as the capture medium, we develop a portable, Artificial Intelligence (AI) based detection device specifically for
Cacopsylla chinensis and construct an integrated online monitoring and forecasting system. The main contributions of this study are as follows:
We adopt a Detection Transformer framework to construct the Cacopsylla chinensis detection model. A backbone network based on RepVit, and its variants are proposed to adapt to the small-size feature characteristics of Cacopsylla chinensis, thereby enhancing the model’s feature extraction capability.
To further improve the model’s small-object detection performance, we design a Dynamic Position Encoder (DPE) module based on Relative Position Bias to encode feature positions and propose a Context Guide Fusion Module (CGFM) that leverages context information guidance and adaptive feature adjustment to enhance recognition accuracy.
We develop an online monitoring system centered on Cacopsylla chinensis detection. We incorporate a hybrid neural network to model the nonlinear relationships among multiple environmental parameters and the pear psyllid population, enabling prediction of pest abundance based on weather forecasts and providing a robust data foundation for precision pest management.
2. Materials and Methods
2.1. Manual Population Monitoring
- (1)
Experimental Materials
Yellow sticky traps with a thickness of about 0.3 mm and dimensions of 24 cm × 20 cm are used. Both sides of the traps are coated with adhesive, and the spectral properties of the trap substrates complied with national standards.
- (2)
Experimental Methods
A five-point sampling method is employed in the surveyed pear orchards, with three replicates and an additional control group. At each sampling point, one tree is selected for investigation. From each tree, branches from five orientations—east, south, west, north, and center—at a height of 1.5 to 2.0 m above the ground are selected. On each branch, a segment 30 to 50 cm in length from the shoot tip downward is examined to record the number of Cacopsylla chinensis individuals of different morphotypes present on the leaves and shoots.
Using the proposed method, both routine surveys and additional surveys were conducted to monitor the population of Cacopsylla chinensis on sticky traps. Routine surveys were performed every 7 days, with the sticky traps replaced at each interval. To evaluate the effectiveness of the intelligent pest detection system—particularly under conditions of high insect density on the sticky traps—additional surveys were carried out at 14-day intervals, with trap replacement occurring accordingly.
- (3)
Data Recording
All data are recorded and organized using Microsoft Excel. The field deployment layout of all sticky traps is shown in
Figure 1d.
2.2. Intelligent Population Detection System
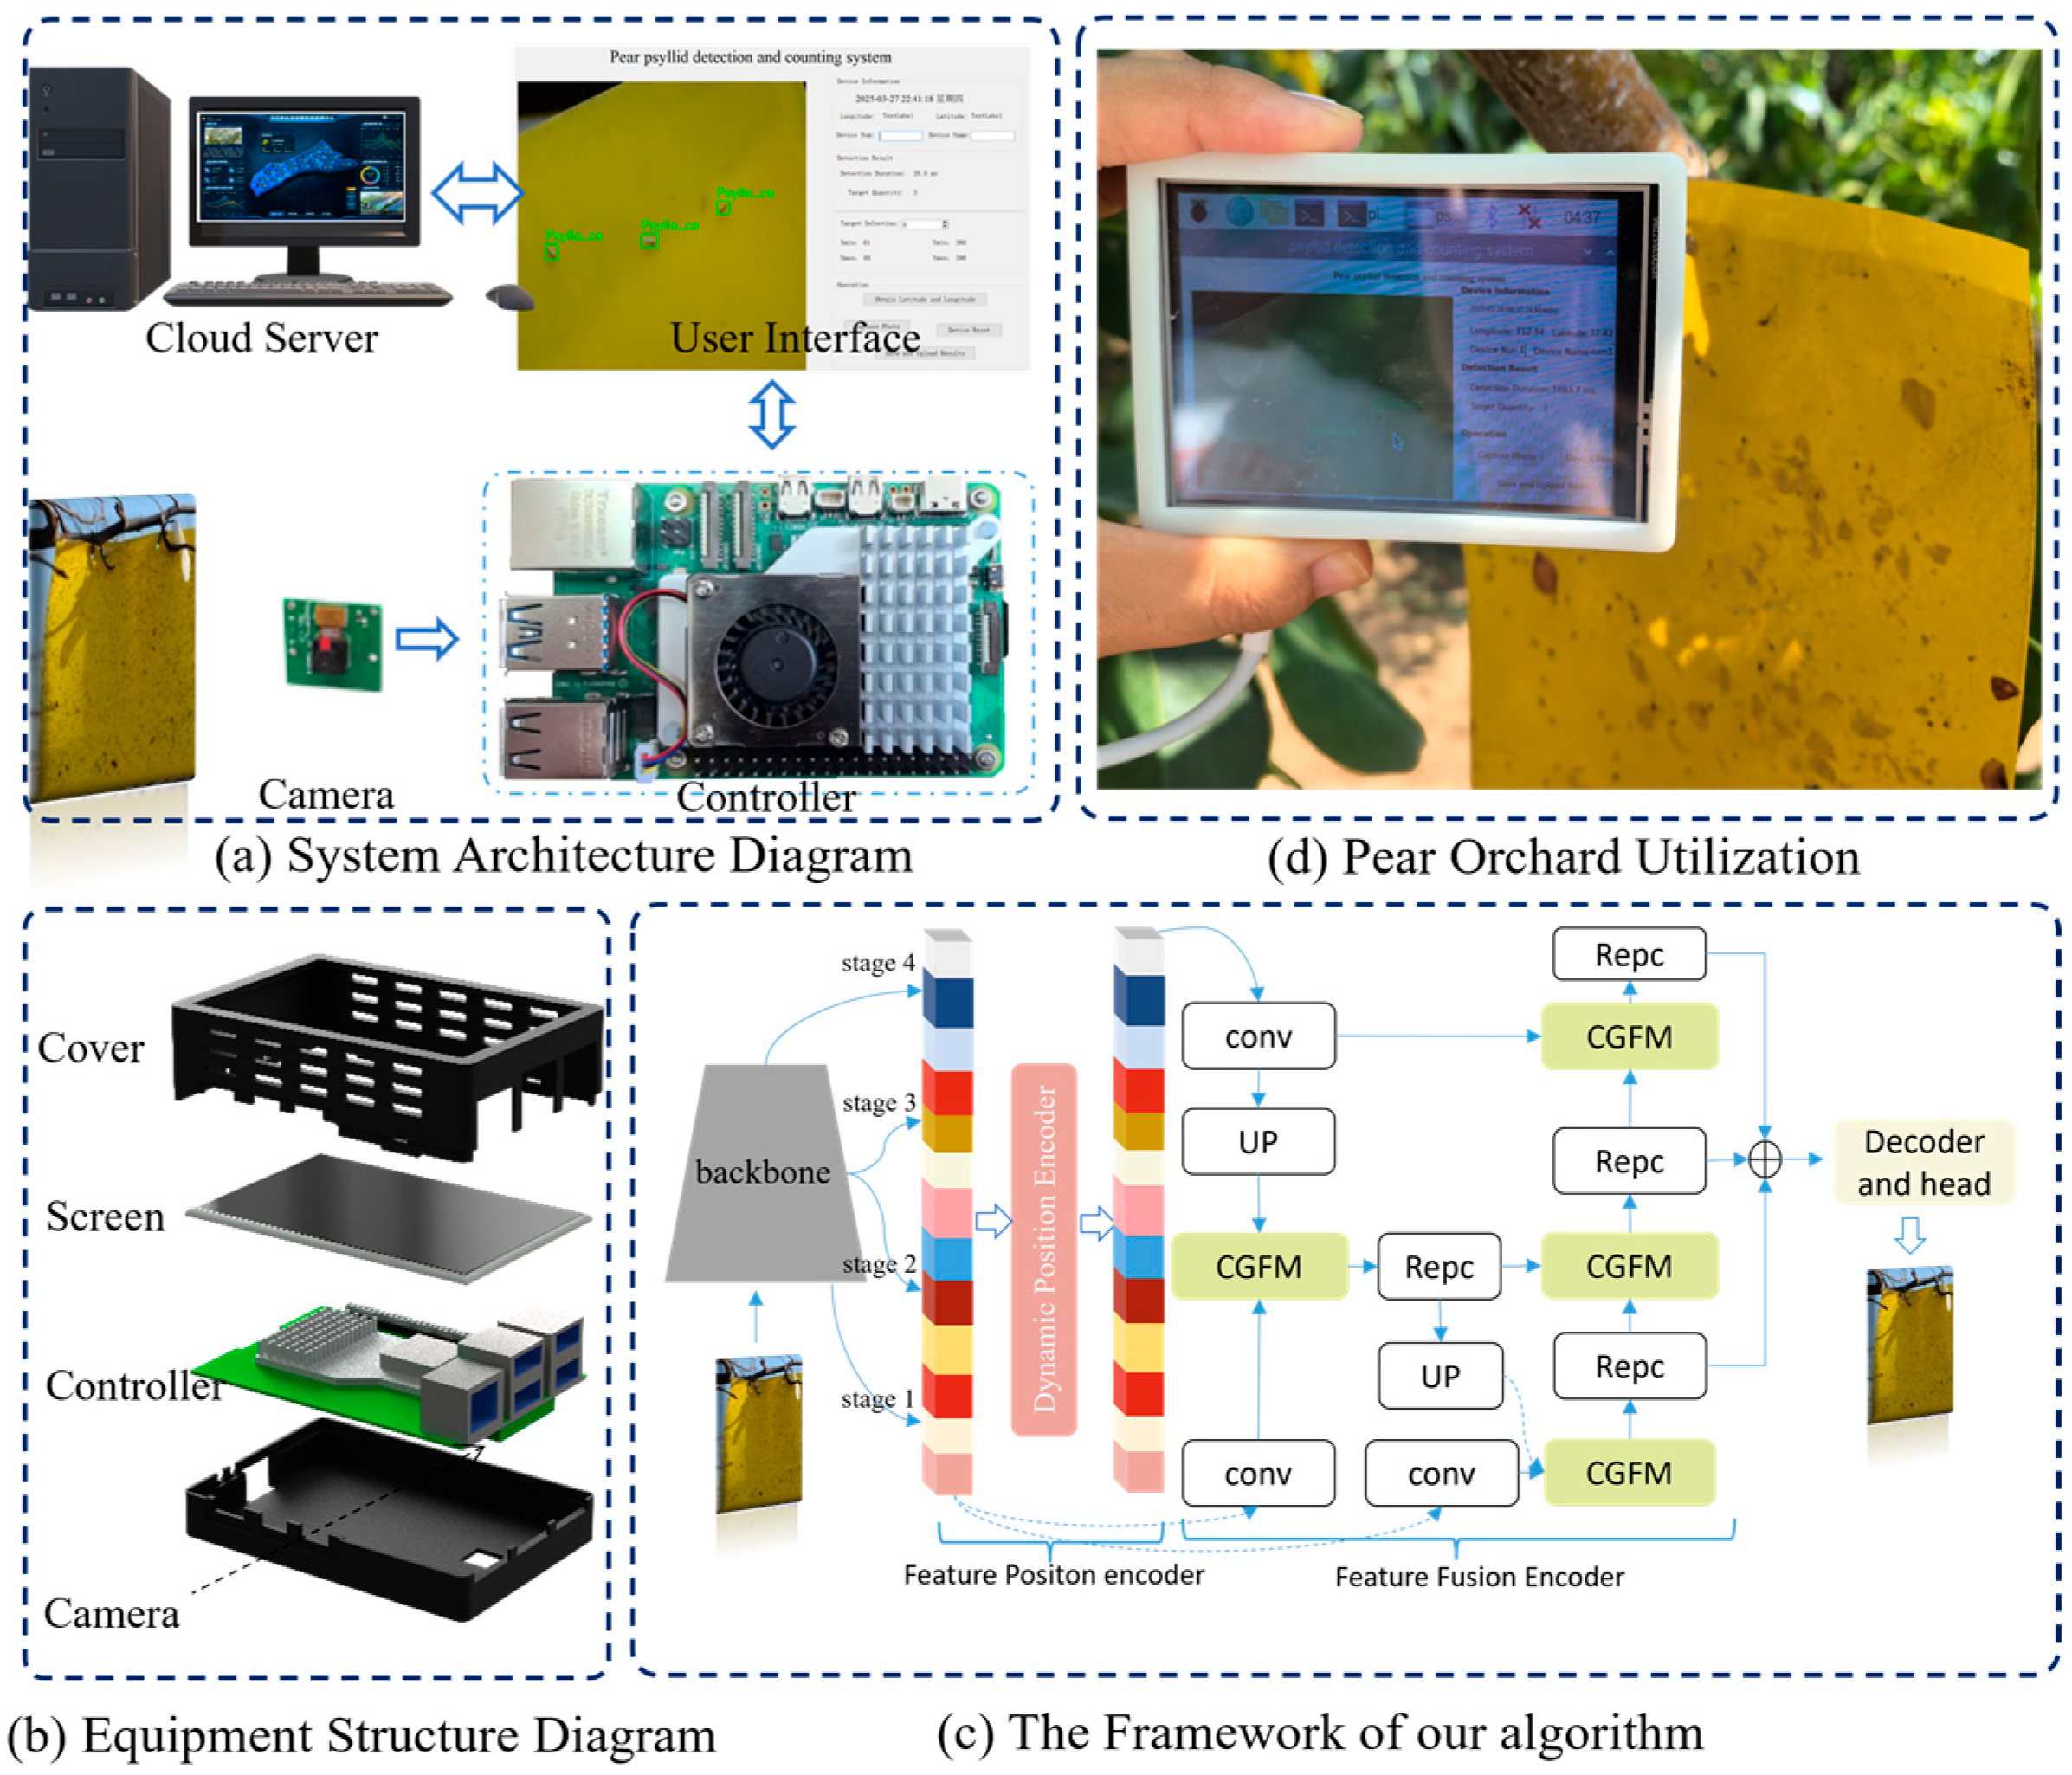
The experimental materials and methods used are consistent with those employed in manual population monitoring. For population counting, a portable identification device is utilized. The overall system architecture is illustrated in
Figure 1.
The portable device simultaneously collects information such as the coordinates and identification numbers of the sticky traps, as well as the number of Cacopsylla chinensis individuals. Through a user interface, the system enables human–machine interaction, allowing data to be either locally stored or uploaded to a central server.
The server performs two main functions: (i) real-time data visualization and statistical management, and (ii) population early-warning functionality.
The Cacopsylla chinensis population early-warning function is based on a nonlinear predictive model constructed from previously collected population and environmental data. By comparing predicted population levels derived from environmental factors with the actual collected data, the system determines whether the psyllid population exceeds conventional thresholds and issues an early warning when necessary.
The device utilizes a Raspberry Pi B5 as the core system controller. Its overall structure, shown in
Figure 1b, comprises the casing, controller, display unit, and camera module.
We propose the Pear Psyllid Detection Model to perform recognition and counting of
Cacopsylla chinensis individuals captured on sticky traps. The detection algorithm consists of a backbone network, a feature fusion encoder, and an auxiliary prediction decoder. The framework of the algorithm is illustrated in
Figure 1c.
2.3. Population Prediction System
- (1)
Experimental Data
The model training dataset consisted of manually collected population monitoring data from 2021 to 2024 at locations including Taigu and Zhengzhou. The validation dataset comprises environmental parameters and pest population data automatically captured by monitoring devices.
- (2)
Experimental Methodology
Population surveys in pear orchards are conducted following the methods described previously in
Section 2.1. Currently, portable devices are utilized for real-time insect identification and data recording during field surveys of
Cacopsylla chinensis populations.
A sequence data processing approach based on deep learning is employed to analyze the collected data, thereby training a nonlinear mapping model correlating Cacopsylla chinensis population dynamics with variables such as date, temperature, rainfall, and wind speed. For model validation, environmental conditions from 2022 are used as model inputs, and predicted populations are compared against manually surveyed population data to verify model accuracy and reliability.
- (3)
Data Analysis
Data management and preliminary processing are conducted using Microsoft Excel. Model implementation is performed in Python 3.8.0, utilizing the PyTorch 2.1.2 framework for constructing and training the nonlinear relationship model.
3. Design of the Pear Psyllid Identification and Prediction Model
3.1. Pear Psyllid Identification Model
The pear psyllid recognition and counting algorithm is deployed on a Raspberry Pi-based edge computing device. The small body size of pear psyllids and their morphological similarities to other flying insects impose higher demands on algorithmic performance. After comparative analysis of conventional object detection algorithms, we adopted a Detection Transformer framework to construct the pear psyllid identification model, with the architecture detailed in
Figure 1c.
To meet the requirements of portable terminal devices, we design the backbone network using optimized RepVit blocks and their variants, achieving model pruning while enhancing recognition accuracy. An adaptive feature position encoder is implemented through Dynamic Position Bias [
17]. Additionally, a Context-Guided Fusion Module (CGFM) is integrated to fully exploit contextual information for feature fusion.
3.1.1. RepVit-Based Backbone
The RepVit algorithm [
25] employs a widely used structural re-parameterization technique for the Depthwise (DW) layer to enhance model learning during training. This method eliminates the computational and memory costs associated with skipping connections during inference, which is particularly beneficial for mobile devices. To accurately extract the features of pear psyllas while reducing inference cost, we drew inspiration from the RepVit algorithm and designed the backbone network. The structural re-parameterization technique is used to optimize the inference process.
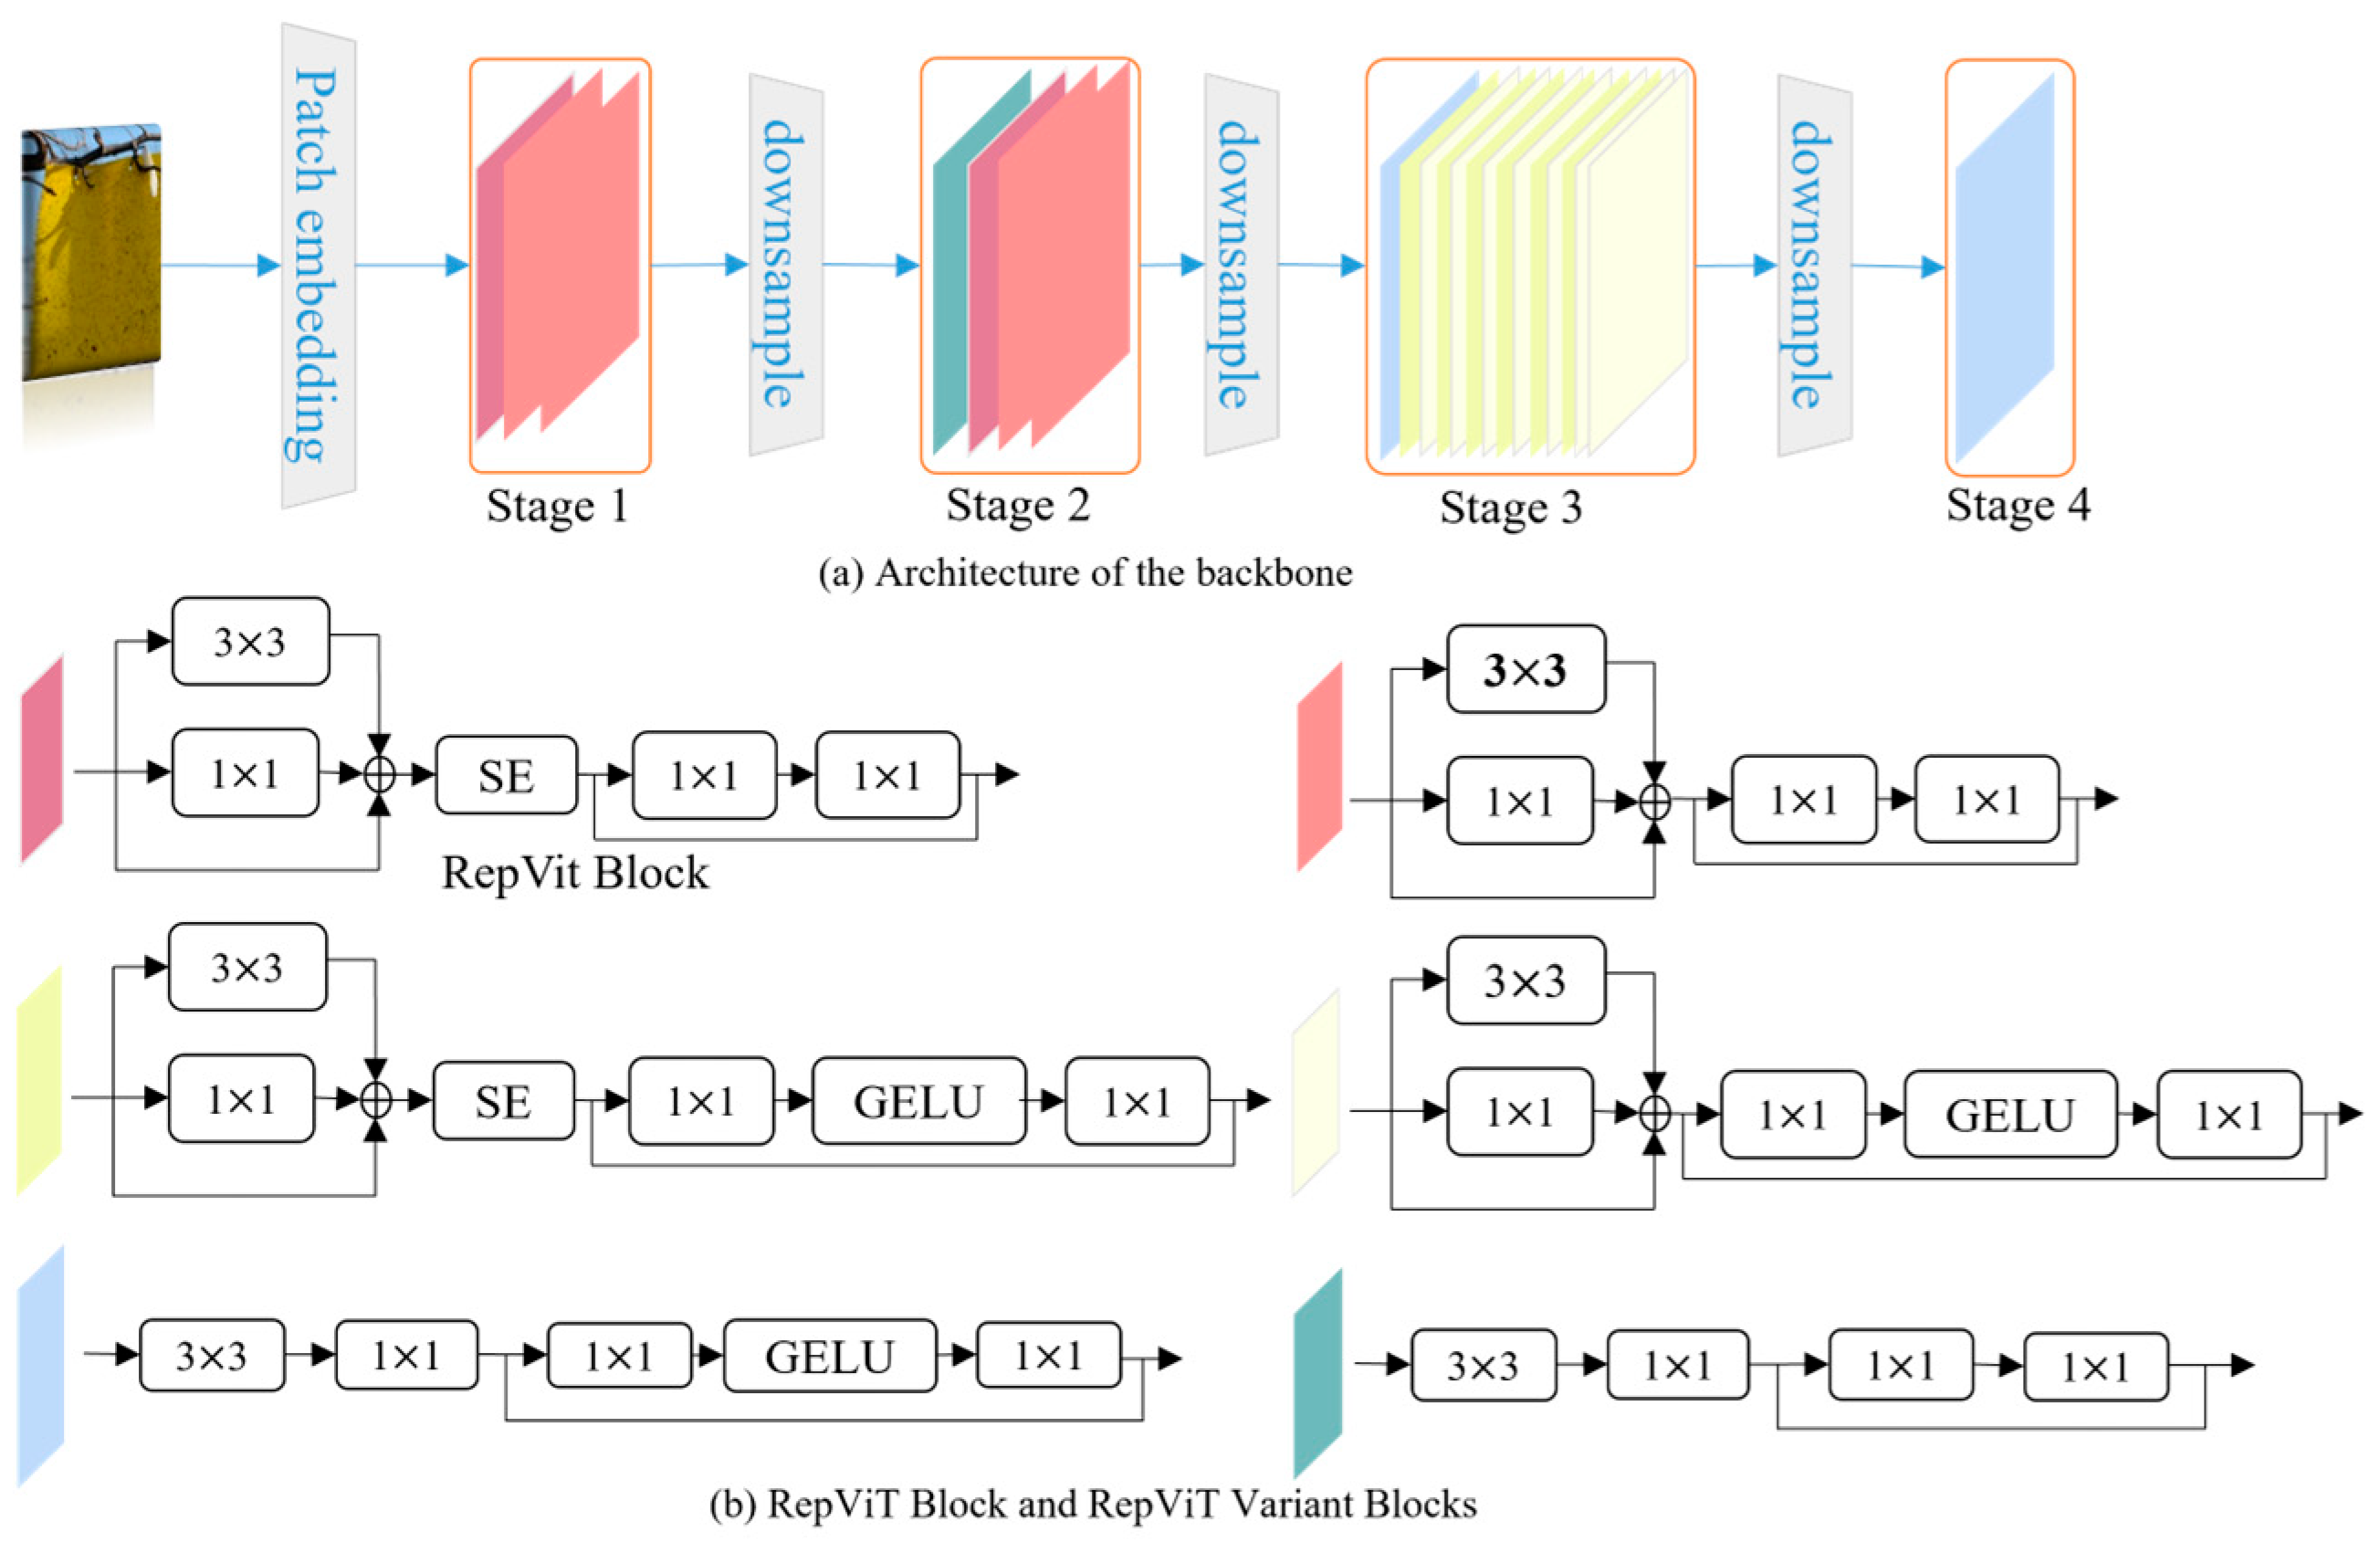
Drawing inspiration from RepViT, we develop a lightweight backbone architecture [
26,
27]. The network architecture is illustrated in
Figure 2a. The network comprises four stages, each dedicated to extracting hierarchical features at distinct levels. Features from different stages are projected linearly and concatenated to synthesize multi-scale representations. To mitigate information loss caused by resolution reduction, deeper or dedicated downsampling layers are strategically integrated, thereby increasing network depth while preserving spatial-semantic fidelity.
The four stages of the backbone network are composed of RepVit Blocks and their variants. In the RepVit Block, the design principle of separable convolutions is employed to separate the training and inference stages, thus reducing the model’s computational load and complexity during inference. Based on the RepVit Block, five different RepVit Block topologies are constructed by modifying the convolutional kernels and selecting Squeeze-and-Excitation (SE) and GELU layers, as shown in
Figure 2b.
In this topology, some versions retain SE layers, which help overcome the limitations of convolution in the absence of data-driven attributes, leading to improved performance. Additionally, the GELU activation layer is incorporated. Through its internal Gaussian component, it automatically adjusts the activation magnitude based on input attributes, optimizing network parameters.
3.1.2. Dynamic Position Encoder
Positional information encoded in embeddings also provides critical cues for model accuracy. Recent research indicates that Relative Position Bias [
28] significantly outperform alternative positional encoding approach. However, existing RPB implementations inherently assume inputs with fixed spatial dimensions, thereby limiting their applicability to images of varying sizes.
where
,
, and
denote the query, key, and value, respectively.
B is the RPB matrix.
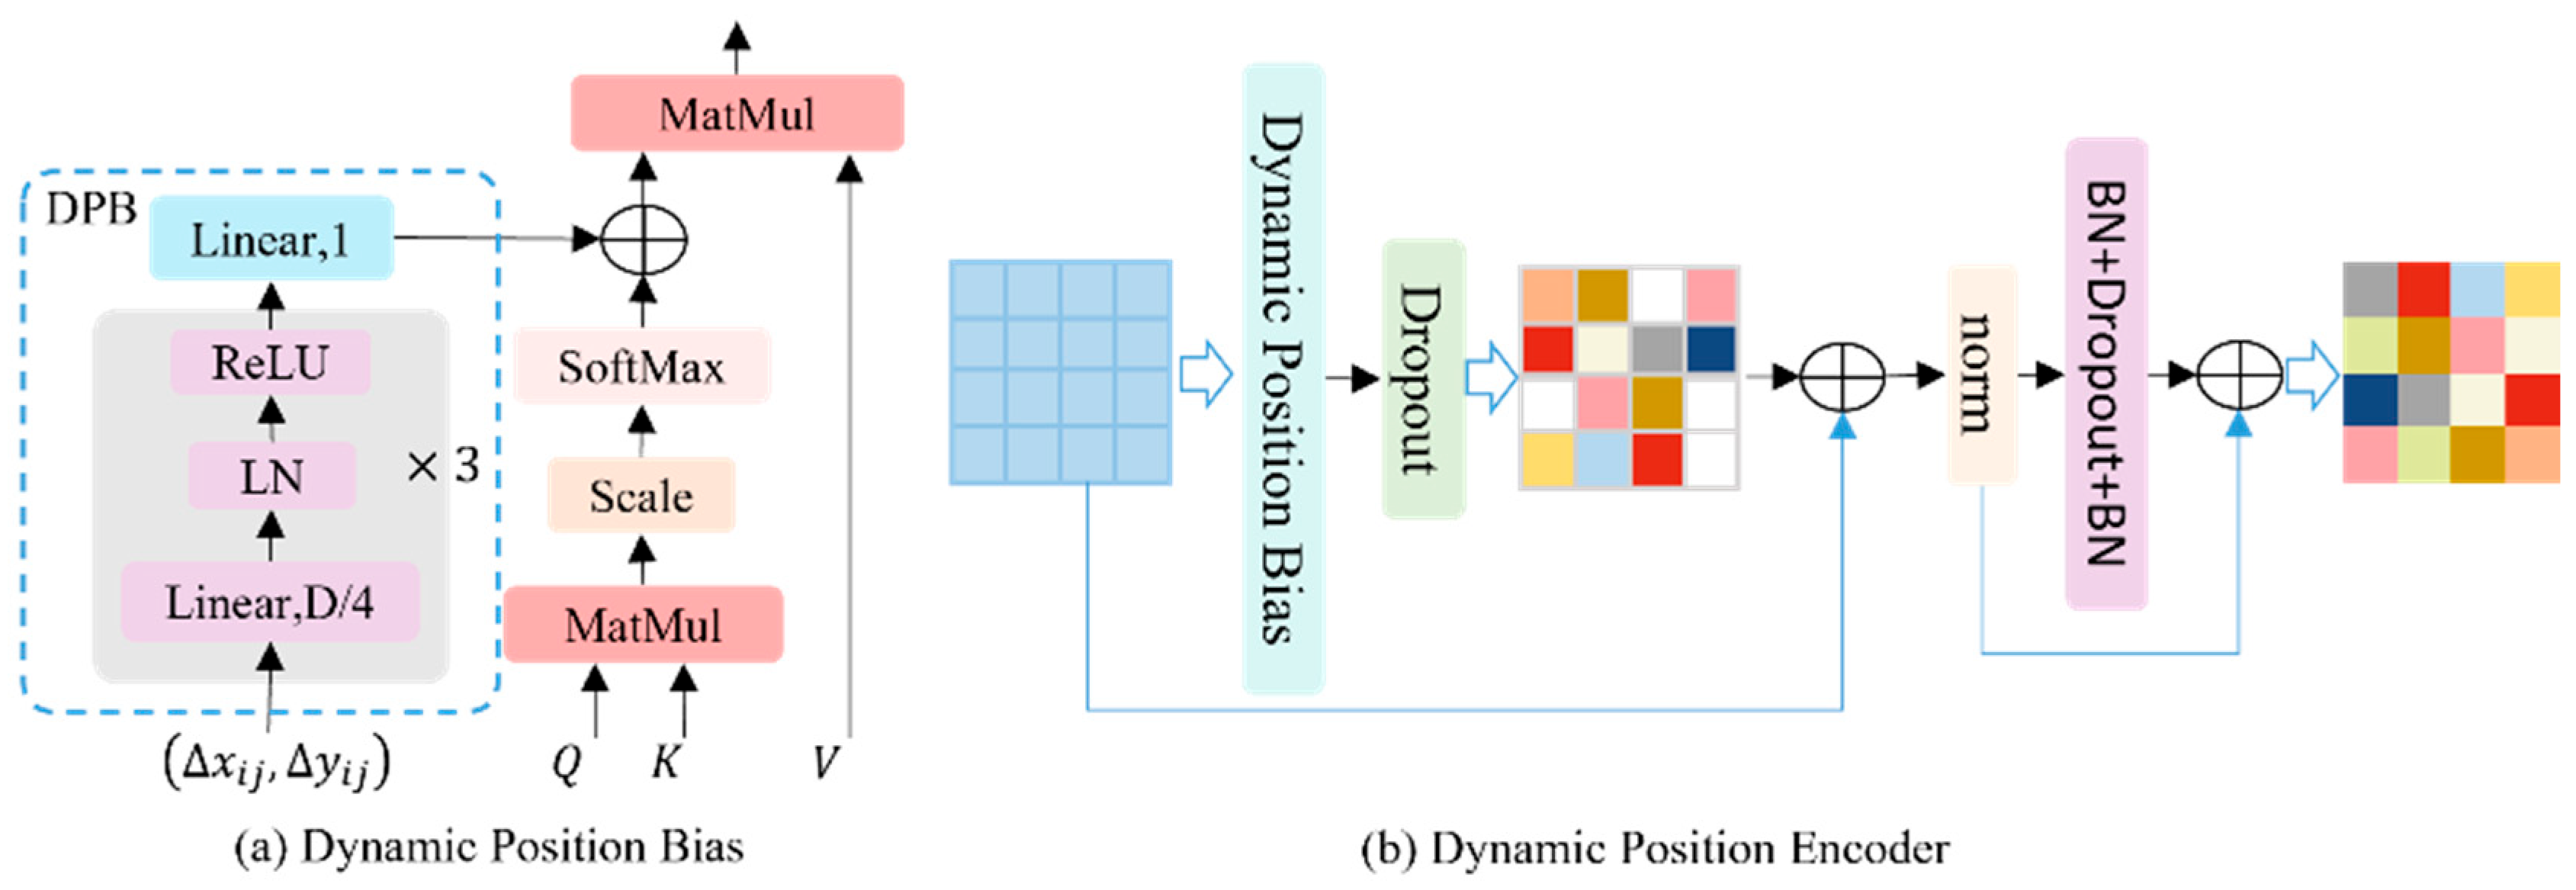
To address the aforementioned limitation, a Dynamic Position Bias (DPB) module is further proposed, enhancing the flexibility of relative position bias and accommodating variable image or group sizes. Specifically, DPB dynamically adapts the bias matrix
to varying image dimensions through an update mechanism illustrated in
Figure 3a. Additionally, we propose an efficient implementation of DPB that achieves computational complexity of
under variable image or group size conditions, compared to the
of relative position bias.
We introduce the Dynamic Position Bias (DPB) module, which dynamically adjusts position information weights during feature processing to effectively capture global dependencies among features. Unlike conventional static relative position encodings, DPB integrates feature consistency across different stages of
Cacopsylla chinensis imagery, enabling the model to adapt flexibly throughout the detection process. Furthermore, we propose the Dynamic Position Encoder module utilizing DPB as a position feature encoder, thus enabling cross-scale position encoding of multi-stage
Cacopsylla chinensis features. The overall framework of the DPE module is illustrated in
Figure 3b.
The self-attention mechanism is applied to high-level features enriched with semantic representations to effectively capture correlations among Cacopsylla chinensis instances within images. A feed-forward neural network structure, composed of convolutional layers followed by batch normalization (BN), ReLU activation, and dropout regularization, is employed to enhance the representational power of the learned features. Furthermore, we introduce multilayer residual connections and normalization techniques to improve feature extraction efficiency and strengthen the generalization capability of the proposed model.
3.1.3. Context Guide Fusion Module
The Context Guide Fusion Module (CGFM) is an innovative feature fusion module specifically designed to facilitate effective integration of multi-scale features by context-guided adaptive adjustment. The module employs channel attention mechanisms to dynamically recalibrate and weight feature maps, enabling the model to learn inter-channel dependencies and emphasize salient features during the fusion process (
Figure 4).
Given the feature maps
, the concatenated feature representation
is constructed. Subsequently, following the methodology of the Squeeze-and-Excitation [
29] attention mechanism, attention weights are computed through operations applied to
F.
The function denotes the Squeeze operation, where global average pooling is applied to the feature map to generate a vector. The function corresponds to the Excitation operation, which employs fully connected layers to produce the desired attention weights. Subsequently, an expand operation is conducted to project the weights into the space.
The generated weights of dimension are then split into two separate weight maps: and . This module enables the capture and exploitation of critical contextual information during feature fusion, thereby enhancing the effectiveness of feature representations and guiding the model to focus on informative regions relevant to the detection task, ultimately improving detection accuracy.
Through the weighted feature reorganization, the module strengthens important features while suppressing less relevant ones, thus improving the discriminative power of the feature maps. The architecture of the module remains relatively simple, with minimal computational overhead, making it particularly suitable for small object detection tasks, such as pear psyllid detection.
Using this module, a Feature Fusion Encoder, as illustrated in
Figure 1c, was constructed. This encoder processes the encoded feature information through a combination of convolution and upsampling operations. The positional-encoded features are further convolved and fed into the CFMG model. Within the Feature Fusion Encoder, the CFMG model is operated on through a sequence of Repc operations, convolution, and upsampling. The Repc operation is defined as follows:
3.2. Population Trend Prediction
Previous studies have primarily employed regression analysis to explore relationships between insect population dynamics and individual environmental variables [
30,
31,
32], such as temperature, humidity, and temporal factors. However, population dynamics in natural environments are influenced by multiple interdependent factors, including temperature, precipitation, and wind. Therefore, methods relying solely on single-factor analysis fail to comprehensively characterize actual population conditions. To overcome this limitation, we propose a hybrid neural network-based [
33] model for accurately predicting population trends for
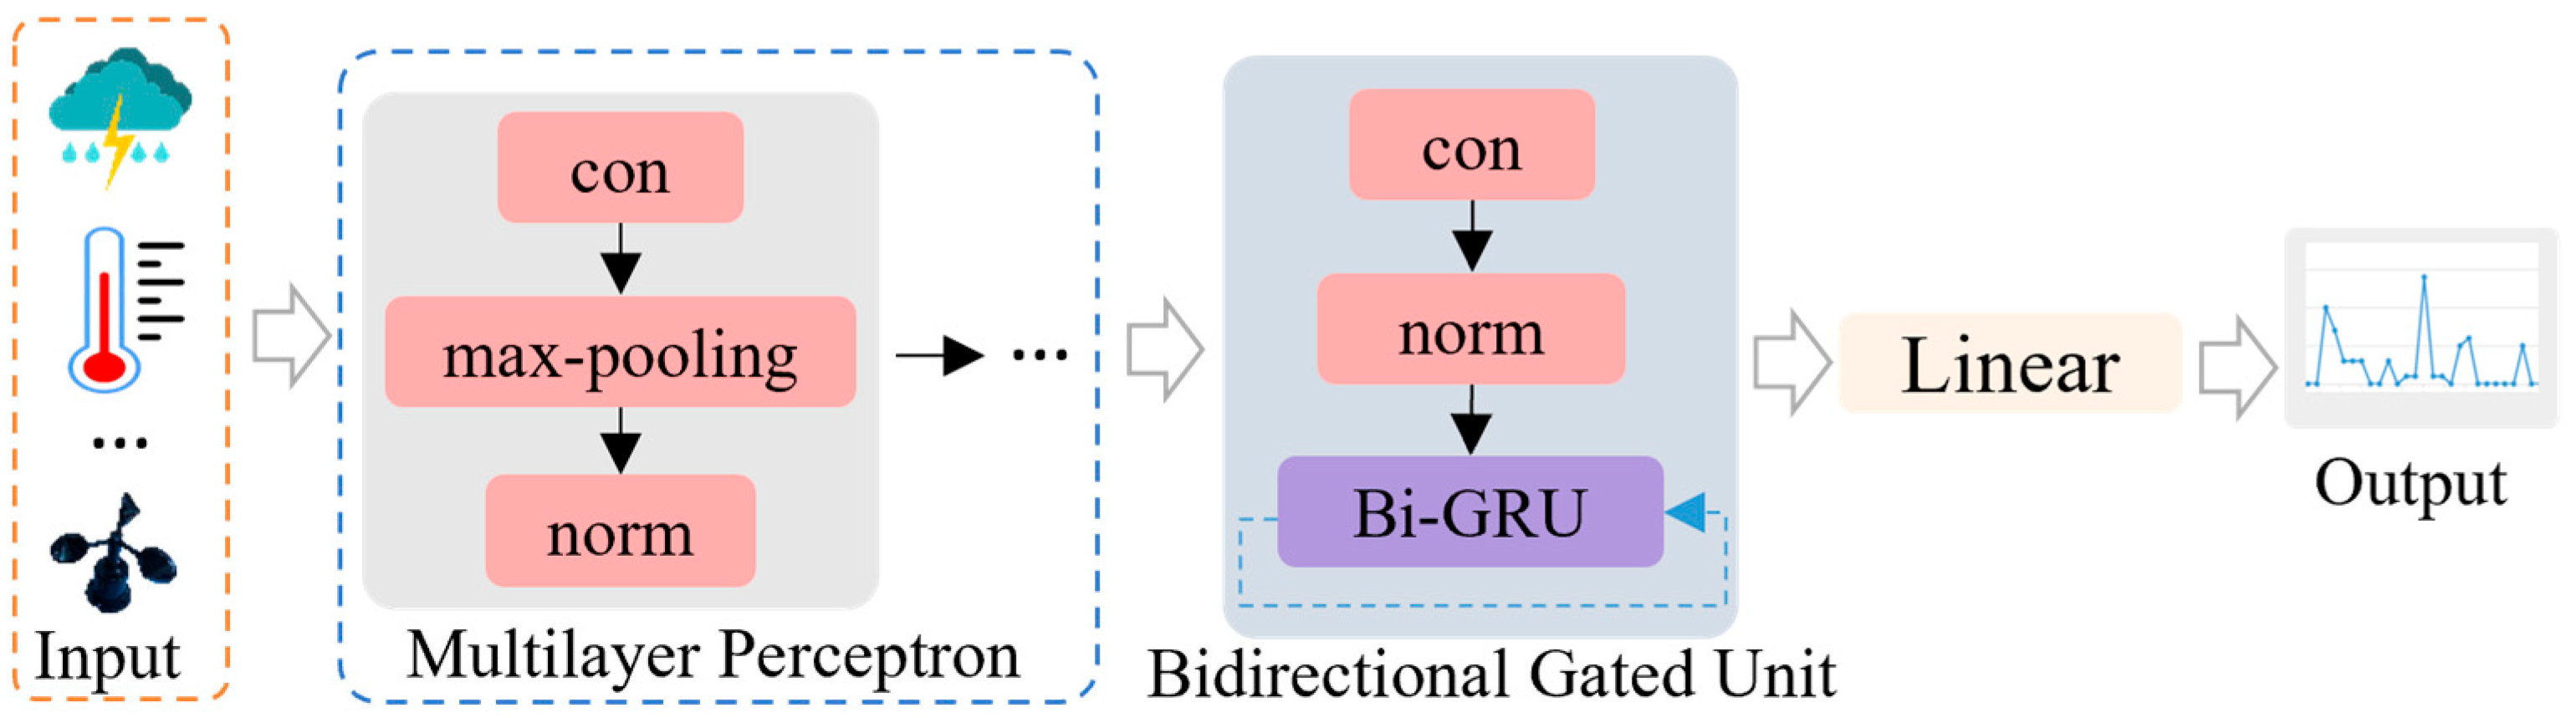
Cacopsylla chinensis. The architecture of the proposed model is illustrated in
Figure 5.
The model leverages the robust feature extraction capabilities of Convolutional Neural Networks (CNNs) and the sequential data modeling strengths of Recurrent Neural Networks (RNNs). Specifically, we integrate Gated Recurrent Units (GRUs) within the convolutional layers to enhance sequence modeling performance. Moreover, a bidirectional GRU (Bi-GRU) mechanism is adopted, effectively combining forward propagation and backward feedback to fuse past contextual information with predictive outputs.
The input data consist of the daily maximum and minimum temperatures, weather conditions, and wind speed over a 7-day period. Weather conditions are quantified based on their impact on the population size of Cacopsylla chinensis psyllas, with clear days assigned a value of 6, cloudy or overcast days 5, light rain 4, moderate rain 3, heavy rain 2, and torrential rain 1. This quantification is grounded in the observation that rainfall generally reduces the number of Cacopsylla chinensis psyllas captured. As a result, the input feature vector has a dimensionality of 28. The output is a single scalar representing the total number of Cacopsylla chinensis individuals collected over the same 7-day period.
The model architecture includes four convolutional blocks, each followed by a max-pooling layer. The number of filters in the convolutional layers is 128, 256, 512, and 512, respectively. A Bidirectional Gated Recurrent Unit (Bi-GRU) layer with 128 units follows the convolutional layers, employing a linear activation function. Linear transformation layer is subsequently incorporated into the forward neural network module, projecting the outputs from the Bi-GRU to a fully connected layer to produce final predictions of insect population counts.
The GRU (Gated Recurrent Unit) structure in the Bi-GRU helps to alleviate the gradient vanishing problem to some extent. The fully connected layers are directly linked to the output, which represents the population size of Cacopsylla chinensis. The developed model predicts population trends by incorporating historical data along with environmental variables.
4. Experiments and Results Analysis
Based on system design and practical requirements, we conduct algorithm feasibility validation experiments, comparative experiments evaluating recognition performance, and experiments validating population prediction capabilities. For feasibility validation, performance metrics including precision (P), recall (R), and mean Average Precision (mAP) are employed, following standard object detection evaluation protocols [
24]. Recognition experiments involved comparing the automated model results with manually counted pest populations.
The computational experiments are performed on a workstation configured with a 13th Gen Intel(R) Core (TM) i9-13900K CPU, 32 GB RAM, Ubuntu 20.04 (64-bit) operating system and an NVIDIA GeForce RTX 4090D GPU with 24 GB of memory. The model training settings are as follows: a total of 300 epochs, batch size of 16, eight parallel data-loading workers, and input image dimensions fixed at 1200 × 1200 pixels.
Field experiments are conducted at the National Fruitlets Germplasm Resources Institute of the Fruit Tree Research Institute, Shanxi Agricultural University, Shanxi Province, China. Field data are collected at 7-day intervals, employing a Canon D7300 camera and custom-developed equipment to capture insect distributions on sticky traps. A comprehensive dataset comprising 2400 images containing Cacopsylla chinensis is compiled, and uniform preprocessing is applied to standardize image dimensions to 1200 × 1200 pixels. Considering the significant differences between pear psylla populations in summer and winter, we constructed separate datasets with the labels Psylla_cc and Psylla_cs, respectively.
To further alleviate detection challenges and mitigate the negative impact of limited dataset variability on model performance and generalization capabilities, multiple data augmentation techniques are applied, including random scaling and rotation of sticky trap images. Consequently, the dataset is utilized for training consisted of 4328 augmented samples, while the test set comprised 568 samples.
4.1. Feasibility Detection Experiments of Models
To validate the feasibility and robustness of the proposed algorithm, we design ablation experiments, comparative evaluations with existing models, and performance assessments on edge computing devices.
4.1.1. Ablation Studies
In this subsection, ablation experiments are conducted to systematically evaluate the effectiveness of each module integrated within the proposed
Cacopsylla chinensis detection framework. These experiments are performed using the augmented dataset, and the detailed results are summarized in
Table 1.
Model A is employed as the baseline for these experiments and utilizes the Detection Transformer (DETR) framework [
34] with ResNet18 as its backbone. Furthermore, the efficient hybrid encoder structure from RTDETR [
35], characterized by decoupled intra-scale interaction and cross-scale feature fusion, is adopted to effectively handle features at multiple scales. Model A achieved a prediction accuracy (mAP@0.5) of 80.5%.
Model B is derived from Model A by replacing the original backbone network with a newly constructed lightweight architecture, resulting in improved computational efficiency. Specifically, the backbone network replacement increased the prediction accuracy (mAP@0.5) to 85.1%, representing an enhancement of 0.3% compared to baseline. Additionally, Model B achieved significantly reduced computational complexity, requiring only 36.3 GFLOPs, compared to 56.9 GFLOPs required by Model A.
Model C replaces the original AIFI network with the proposed Dynamic Position Encoder (DPE), enabling multi-level feature positional encoding across different feature scales. This modification significantly improves detection performance, achieving an mAP@0.5 of 89.9% and an mAP@0.5:0.95 of 42.2%, the highest among all evaluated models, reflecting a 1.6% improvement over previous configurations.
Model D represents the final optimized version of the proposed algorithm. It achieved a prediction accuracy of 87.4%, corresponding to a 6.9% improvement compared to the original baseline implementation. The Context Guide Fusion Module (CGFM), serving as the core of the feature fusion mechanism, demonstrated strong capability in effectively integrating salient target feature information.
4.1.2. Comparative Experiments Between Object Detections
We conduct comparative experiments against several commonly used real-time object detection algorithms, including YOLOv5, YOLOv7, YOLOv10, and YOLOv11. The comparison results are summarized in
Table 2.
As shown in the table, our proposed model demonstrates superior performance in terms of detection accuracy and model efficiency for identifying
Cacopsylla chinensis on young pear fruits, achieving an accuracy of 87%. Comparing the baseline (Model A) results from
Table 1 with the detection results of the standard algorithms in
Table 2, it can be observed that only YOLOv5 achieved a higher accuracy than DETR, while the performance of other YOLO variants is inferior to the baseline.
YOLO-series models are generally more sensitive to confidence threshold settings and less effective in handling dense object scenarios due to their reliance on confidence-based filtering and Non-Maximum Suppression (NMS) post-processing. Therefore, we selected the DETR framework as the baseline model for our work.
Our final model achieves a detection accuracy of 87.4%, which is significantly higher than that of conventional object detection algorithms, fully meeting the demands of agricultural application scenarios. Although the mAP@0.5 of our model (88.4%) is slightly lower than that of YOLOv5 (89.1%), this discrepancy is mainly attributed to sensitivity to confidence threshold settings in dense object detection tasks. A single metric such as mAP@0.5 may not fully reflect the overall model performance.
Considering both the recall (85.7%) and precision (87.4%) of our proposed model, the true positive (TP) rate is significantly improved, indicating a better ability to correctly identify true targets. This enhancement is particularly important for agricultural environments, where the presence of camouflage and background noise is common, thereby improving the model’s overall reliability and robustness.
We further compare the detection results produced by YOLOv5, YOLOv10, and YOLOv11, as illustrated in
Figure 6. It is evident that the YOLO series models exhibit a phenomenon of multiple overlapping detections for a single target, as observed in the detection results from the second row (YOLOv5) and the fourth row (YOLOv10 and YOLOv11). This issue can lead to inflated target counts due to multiple detections of the same object, which undermines the accuracy of quantitative analyses. This critical limitation is a major reason why we adopt the DETR framework as the foundation for our model, as it inherently mitigates redundant detection and counting errors through its end-to-end object detection mechanism.
Although the proposed algorithm exhibits greater model complexity and slightly lower real-time performance compared to YOLO-based models, it demonstrates superior robustness in scenarios characterized by limited target features and significant background noise. For instance, as shown in the first and second columns of
Figure 6, the YOLO models missed detecting small
Cacopsylla chinensis targets, while in the third column, they exhibited false positive detections under strong background interference. In contrast, our proposed method achieved robust and reliable detection performance under such challenging conditions.
4.1.3. Comparative Experiments on Edge Devices
To validate the practical deployment capability of our Cacopsylla chinensis detection algorithm, we conduct comparative experiments on edge computing devices. The experimental data utilizes for edge device testing are consistent with those employed in server-side evaluations, thereby ensuring fair comparison and validating the feasibility of model migration across different hardware platforms. This verification provides essential data support for subsequent large-scale deployment and practical applications.
The edge device used in this study is a Raspberry Pi 5B running the Raspberry Pi OS Full, which is based on Linux architecture. All operations were performed in a Linux environment. The development was conducted using Python 3.11. A virtual environment named env1 was created using the command
python -m venv env1, and required packages were installed via the pip install package. The graphical user interface was developed using the PyQt5 library. An OV5647 camera module was employed for image acquisition, with hardware access provided through the rpicam and Picamera2 libraries. The results of the edge device experiments are summarized in
Table 3.
By comparing the model A and model D results between
Table 3 and the ablation experiments in
Table 1, it can be observed that the performance on the edge device is highly consistent with that obtained on the server. This consistency indicates that the model is robust to hardware changes and can be reliably deployed in real-world agricultural production environments.
Furthermore, we evaluate the inference time required to process a single image on the edge device. Model A required 1.63 s per image, while the proposed algorithm achieved a faster processing time of 1.34 s. Although the detection speed does not fully meet strict real-time requirements, it is sufficient to satisfy practical user interaction needs in agricultural monitoring applications.
4.2. Model Feasibility Validation
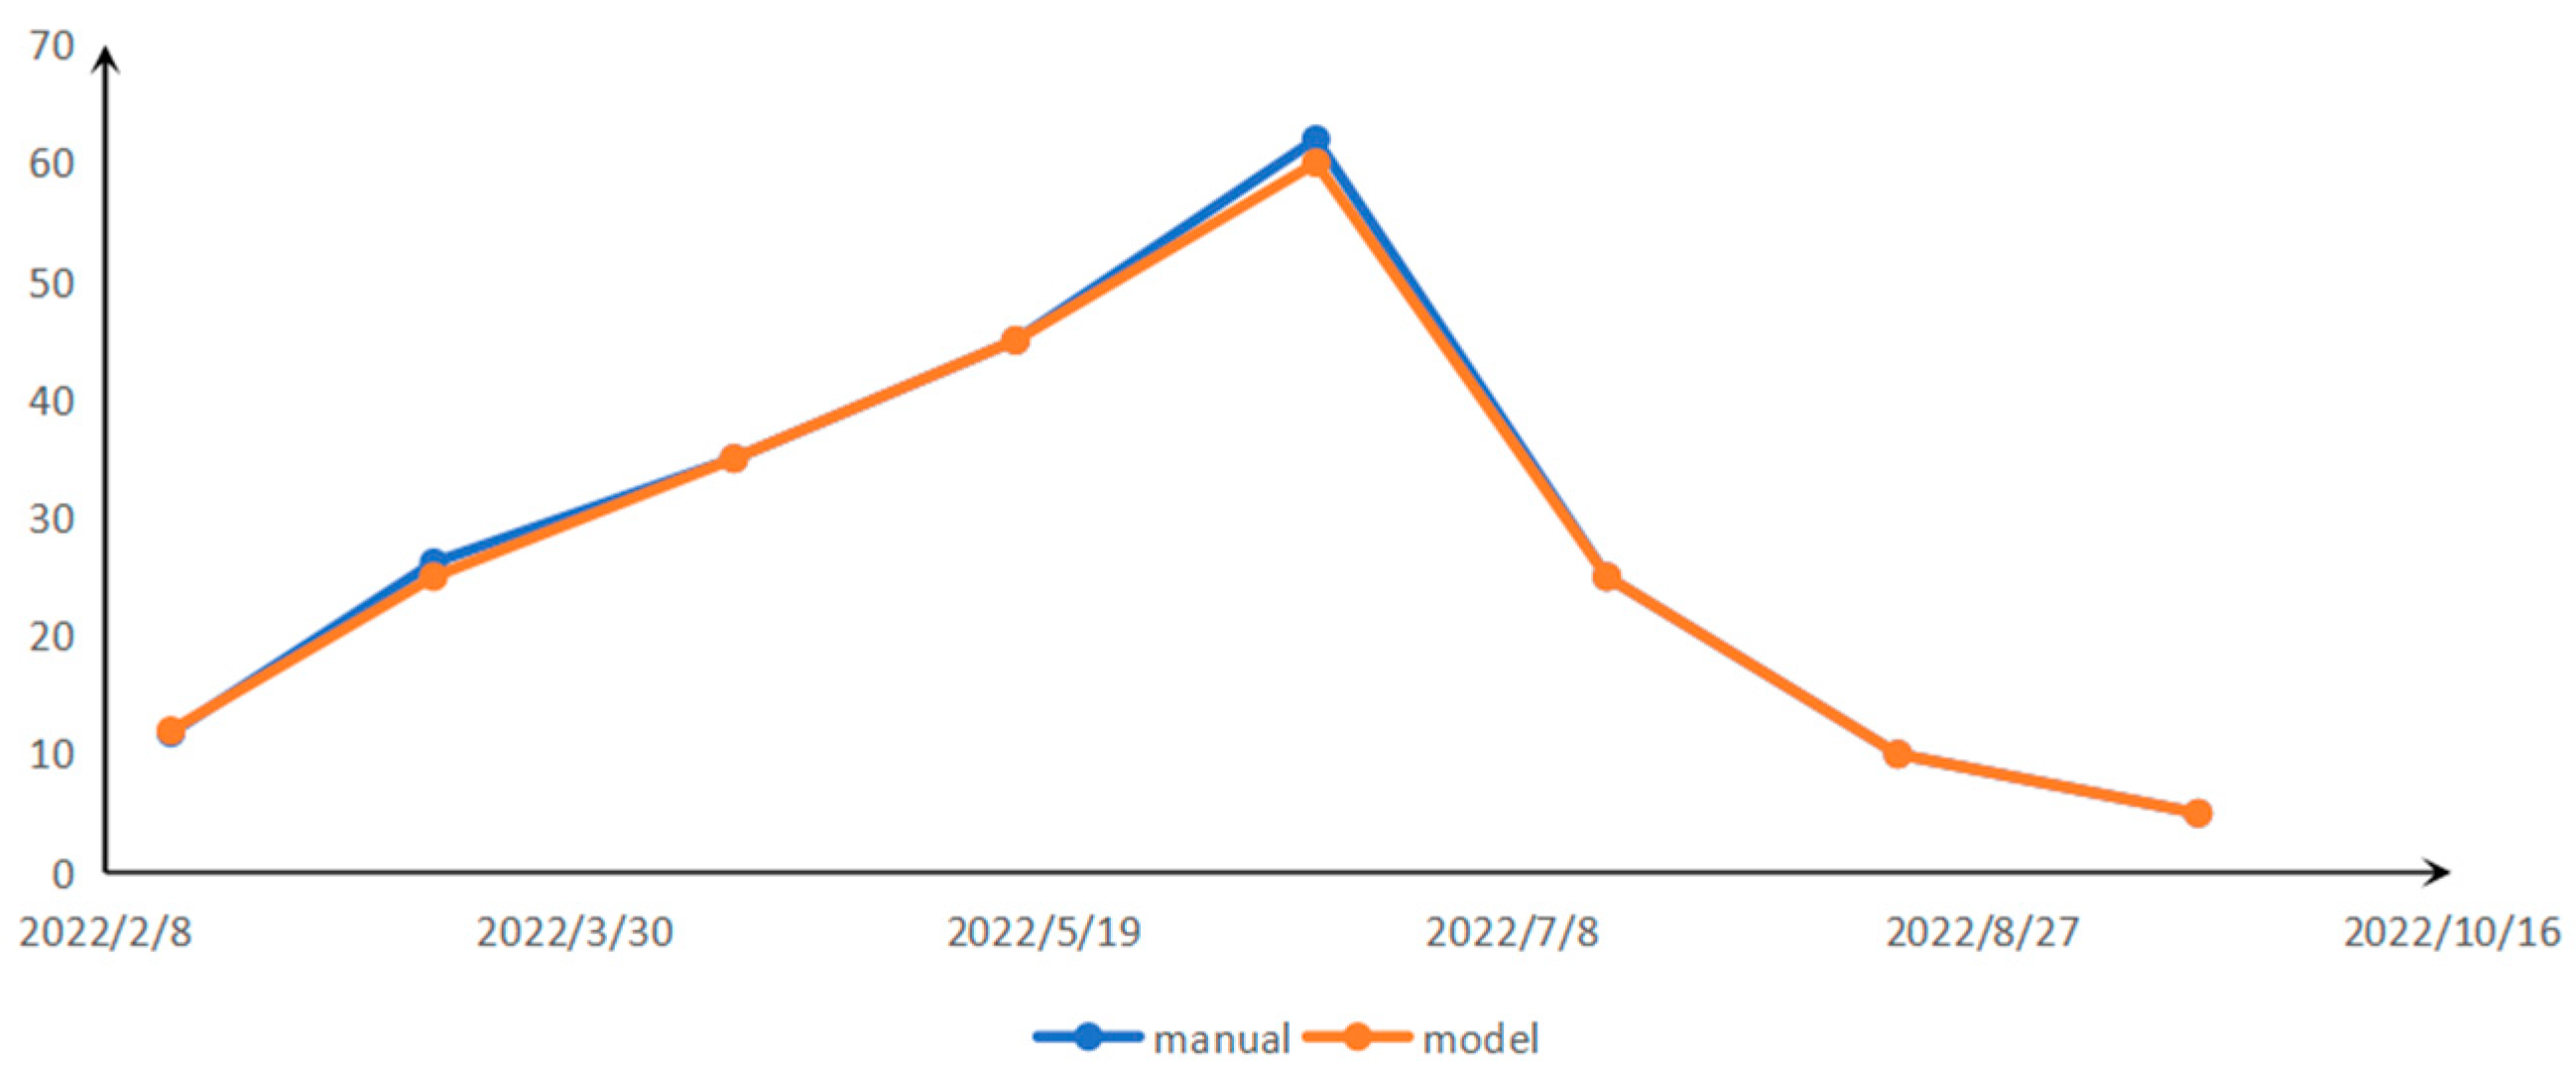
To validate the feasibility of the Cacopsylla chinensis recognition and counting system, we conducted a comparative analysis between manual counting and model-based recognition. The experiments are performed using sticky trap data collected during the 2022.
By comparing the manual counting results with the model’s predicted counts, it is found that the proposed model demonstrated strong performance in accurately estimating the Cacopsylla chinensis population. Statistical analysis revealed a numerical difference of only 2 between the manual and model counts, with a relative error of less than 4.5%.
The sources of recognition error can be attributed to several factors: (i) the small physical size of
Cacopsylla chinensis specimens, with individuals averaging only 3–5 mm in length, increases the difficulty of accurate detection; (ii) insects may fall into blind spots within the sticky trap, overlap with one another, or be influenced by environmental factors such as humidity, temperature, and wind conditions; and (iii) the presence of foreign debris adhering to the insects may obstruct accurate recognition, thereby introducing errors into the counting results (As shown in
Figure 7).
To further validate the feasibility and reliability of the device, field experiments were conducted from April to October 2024 at the pear orchard experimental site of the Fruit Tree Research Institute, Shanxi Agricultural University.
Cacopsylla chinensis specimens captured on sticky traps were recorded and photographed at 15-day intervals. Simultaneously, automated recognition and counting of the captured specimens were performed. The experimental results are summarized in
Table 4.
The “Date” column indicates the dates on which manual insect counts were conducted. The “Manual” column represents the number of insects identified through manual inspection, while the “Model” column shows the number of insects detected by the proposed model. The Cacopsylla chinensis populations captured at 15-day intervals are relatively large, with the number reaching 148 individuals on June 3. This provides a robust basis for evaluating the device’s applicability under high-density infestation conditions. The maximum observed counting error during the experiment is two individuals, which occurred on June 3 due to overlapping of two Cacopsylla chinensis specimens on the sticky trap. Overall, the experimental results demonstrate that the device effectively meets the practical requirements for population monitoring under field conditions.
4.3. Cacopsylla chinensis Population Trend Monitoring
Monitoring population dynamics is of critical importance for guiding agricultural activities. To this end, we develop a Cacopsylla chinensis population prediction algorithm based on hybrid neural network architecture. The model takes as input daily maximum and minimum temperatures, month information, wind speed, rainfall frequency, and other relevant environmental parameters, and outputs predicted population counts of Cacopsylla chinensis.
Following the experimental methodology described in
Section 2.1, field surveys were conducted every 7 days to record
Cacopsylla chinensis populations in the orchards. The dataset includes monitoring data collected between 2021 and 2024 from the pear orchards of the Fruit Tree Research Institute at Shanxi Agricultural University (Taigu), as well as 2023 data from orchards in Zhengzhou and Hebei Province. For model evaluation, the 2022 dataset is designated as the validation set, while the remaining data are used for model training.
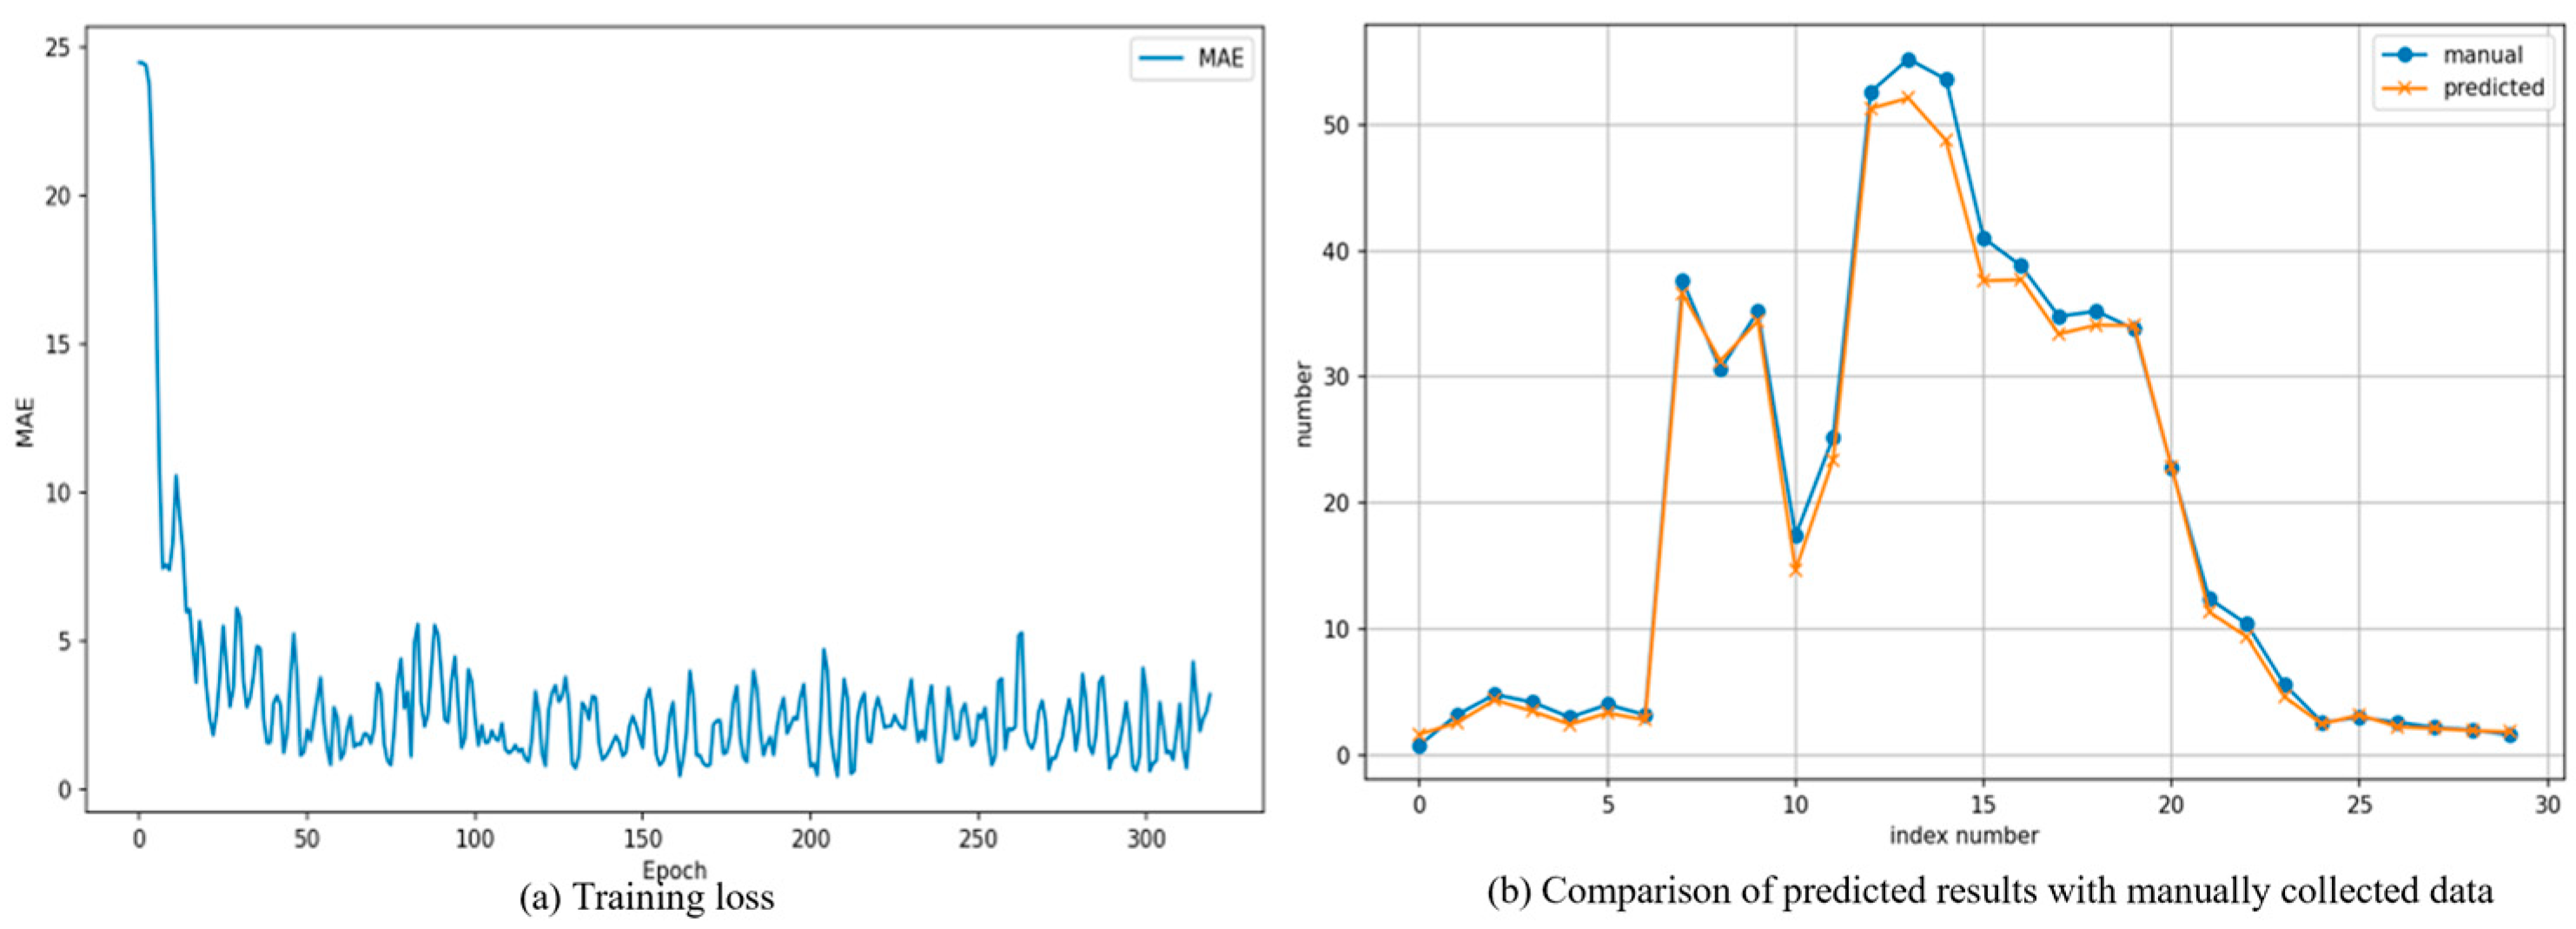
The model is implemented using the PyTorch 2.1.2 deep learning framework, with Python 3.8.0 as the programming language. The specific training parameters are set as follows: the initial learning rate is 0.001, and the total number of training epochs is 350. The loss trend during the training process is illustrated in
Figure 8a. The model reaches a stable state after approximately 40 epochs, with the Mean Absolute Error (MAE) converging to within 5%. On the actual test dataset, the model achieved an MAE of 1.94%, which meets the acceptable error margin for
Cacopsylla chinensis population estimation.
The trained model is then applied to predict the manually monitored population counts for 2022. The prediction results are shown in
Figure 8b, where the blue curve represents manually collected data, and the yellow curve represents the model’s predictions. As observed, the predicted trend closely aligns with the manually recorded trend. The maximum deviation occurred on June 30, during the 15th sampling event, where the manual count averaged 55.3 individuals, while the predicted value is 52.8, yielding a difference of 2.5 individuals. Compared to other periods, this sampling point exhibited the largest discrepancy, likely attributable to unusually high temperatures, clear weather conditions, and the developmental stage of the pears (young fruit stage), which collectively enhanced the activity level of adult
Cacopsylla chinensis.
The feasibility of the system’s counting capability and population trend prediction functionality is verified through both qualitative and quantitative analyses. The developed system successfully met the orchard’s requirements for monitoring Cacopsylla chinensis infestations and provided critical data support for disease management and pest control decision-making.
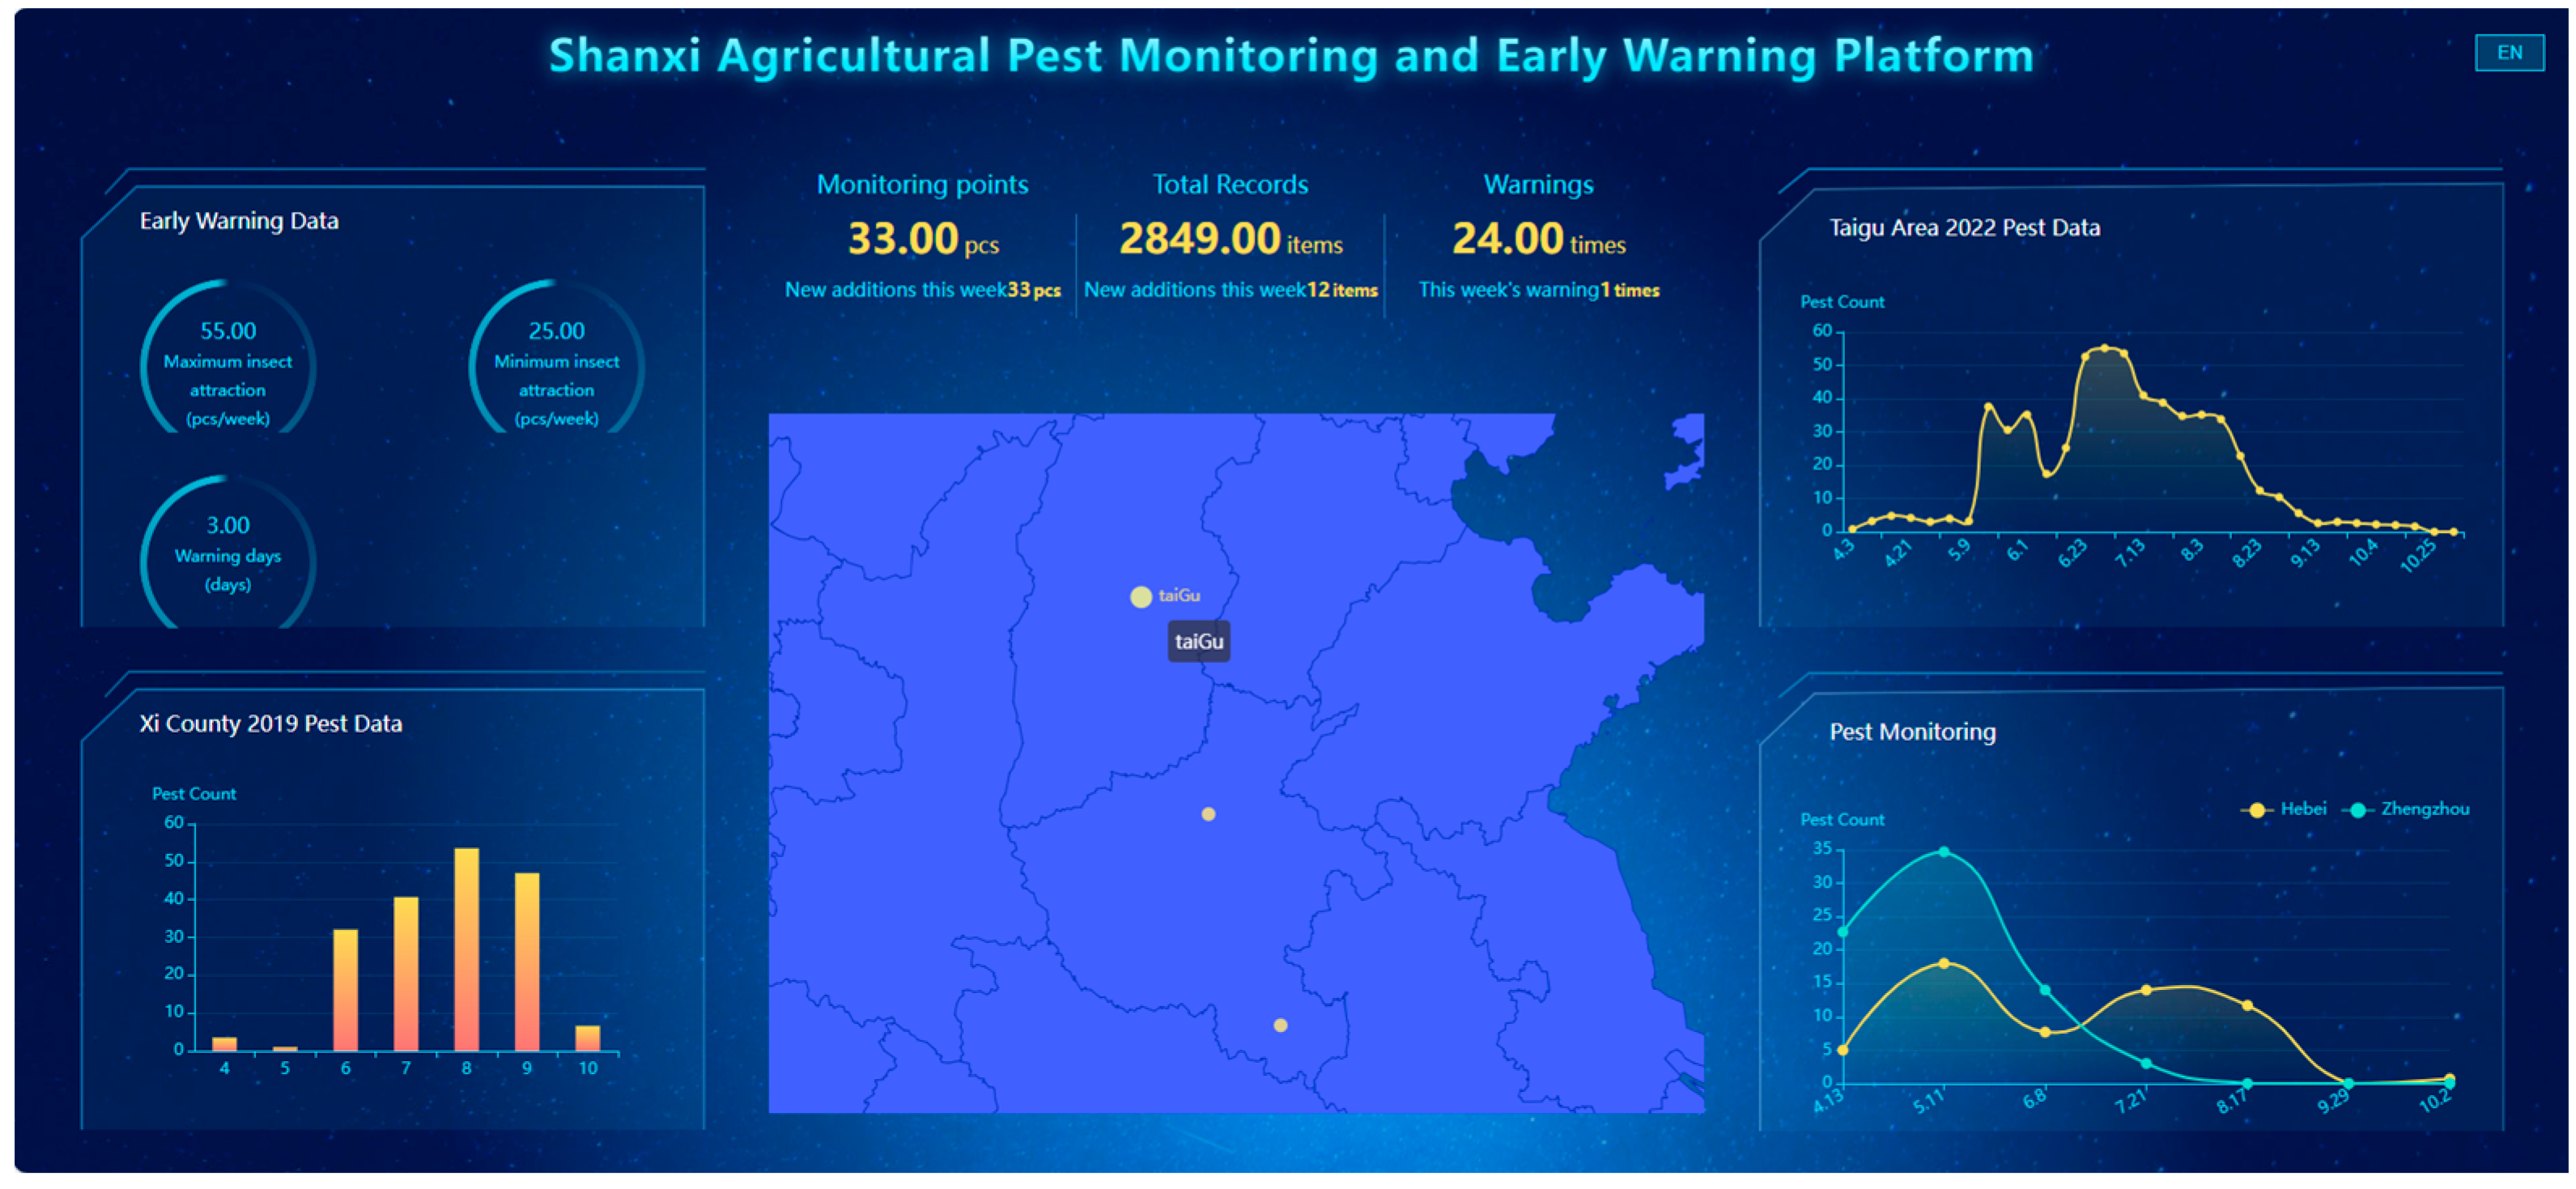
In the population trend monitoring experiments, data collected by the intelligent recognition module are transmitted to the monitoring platform for further processing and analysis. The monitoring platform is developed based on a SpringBoot and Vue3 architecture, as illustrated in
Figure 9. The database is implemented using MySQL version 8.0.30. It integrates functionalities including basic data management, visualization of detection area statistics, and regional population trend prediction.
The system consists of several functional modules, including historical population trend visualization, basic early warning data, real-time data reception, and display. When a central monitoring point is selected, the real-time data display module shows the most recently received data, while the basic early warning module displays the predicted upper and lower bounds generated by the model. By selecting the trend curves on either side, users can switch between predicted population trends for different monitoring points. Currently, data display has been implemented for three monitoring points: Taigu, Zhengzhou, and Xixian. Clicking on each point updates the display with data corresponding to different years.
5. Discussion
Sticky traps are one of the most effective physical control methods for pest management, with their efficacy heavily dependent on accurate pest population detection and trend prediction. Recently, employing artificial intelligence for pest monitoring has emerged as a prominent trend. However, pest detection systems that rely on server-based [
22] platforms incur high costs, necessitate manual sample collection, and involve complex computing. Conversely, edge device-based pest detection systems [
23,
24] exhibit enhanced flexibility and adaptability; by leveraging software, these systems effectively accommodate insect detection and recording processes associated with sticky traps. Consequently, we developed a portable terminal-based detection and population prediction system specifically targeting
Cacopsylla chinensis.
The YOLO family of algorithms has gained considerable attention in real-time object detection. Many researchers [
4,
19,
20] have optimized and deployed YOLO models on edge devices. However, a known challenge of these algorithms [
21] is the generation of redundant bounding boxes for the same target. Non-Maximum Suppression (NMS) and its improved variant have been introduced to mitigate this issue. In our comparative experiments between NMS and soft-NMS, we found that soft-NMS significantly reduced duplicate detections. Given that the
Cacopsylla chinensis population trend primarily depends on changes in insect abundance, our primary focus has been on accurately detecting the object while minimizing false positives, missed detections, and redundant detections. To address this, we constructed a pear psylla detection model based on the Detection Transformer framework [
34,
35], which utilizes Hungarian matching for global set prediction to inherently prevent duplicate bounding boxes. Nonetheless, the Detection Transformer suffers from limitations such as slow convergence and substantial computational costs. To assess whether the developed algorithm meets practical requirements, we conduct experiments on a Raspberry Pi 5B. The results indicate a detection time of less than two seconds per image, which is acceptable for practical applications. Future studies will further optimize the algorithm’s performance.
Additionally, we develop a forecasting and early warning system for
Cacopsylla chinensis, utilizing manually surveyed data as benchmarks. Our algorithm integrates multidimensional environmental [
8,
10] parameters to predict population trends. Although relationships between environmental factors and pest populations were successfully established, additional comparative experiments are not incorporated. The current system successfully achieves core functionalities, including data acquisition, data management, and population trend forecasting; however, further enhancements and refinements based on practical needs and application scenarios are necessary.
6. Conclusions
In this study, we design and develop an intelligent, portable Cacopsylla chinensis detection system based on artificial intelligence, targeting challenges in real-time pest monitoring and population trend prediction in agricultural environments. The system effectively addresses the limitations of traditional pest detection methods, such as low efficiency and inaccuracies under dense or small-target conditions.
The YOLO object detection algorithm adopts Non-Maximum Suppression to eliminate redundant bounding boxes in target detection. As shown in
Figure 6, this issue has been completely resolved. To overcome this limitation, we adopt the Detection Transformer framework for building the
Cacopsylla chinensis detection model.
To enhance the detection of small-sized targets, we design a lightweight backbone network based on RepViT blocks and their variants. Furthermore, a Dynamic Position Encoder module is developed using Relative Position Bias to encode positional information across feature maps. To further boost model performance, we propose the Context Guide Fusion Module, which facilitates context-aware feature fusion with adaptive adjustment mechanisms.
The final
Cacopsylla chinensis detection model achieved a recognition accuracy of 87.4%. As illustrated by the results in
Figure 6, the proposed method demonstrated strong robustness in the detection of
Cacopsylla chinensis under various challenging conditions.
To enable comprehensive pest monitoring, we further develop an online monitoring system centered around the proposed detection model. A hybrid neural network is employed to establish the relationship between multiple environmental parameters and Cacopsylla chinensis population dynamics, enabling population trend prediction. We conducted feasibility validation experiments by comparing model predictions with manual survey data. The experimental results showed that the Mean Absolute Error on the test set is 1.94%, fully meeting the practical requirements of agricultural production environments.
Overall, the proposed system offers a promising solution for intelligent pest monitoring and provides reliable data support for precise pest control and management activities in modern agriculture.


 ,
, 


