Twenty-Year Variability in Water Use Efficiency over the Farming–Pastoral Ecotone of Northern China: Driving Force and Resilience to Drought

 , ,
, ,
Abstract
1. Introduction
2. Material and Methods
2.1. Study Area
2.2. Data Sources
2.3. Methods
2.3.1. Estimation of WUE in the FPENC
2.3.2. Exploration of the Biophysical Controls on WUE
2.3.3. Calculation the Ecosystem Resilience in the FPENC
3. Results
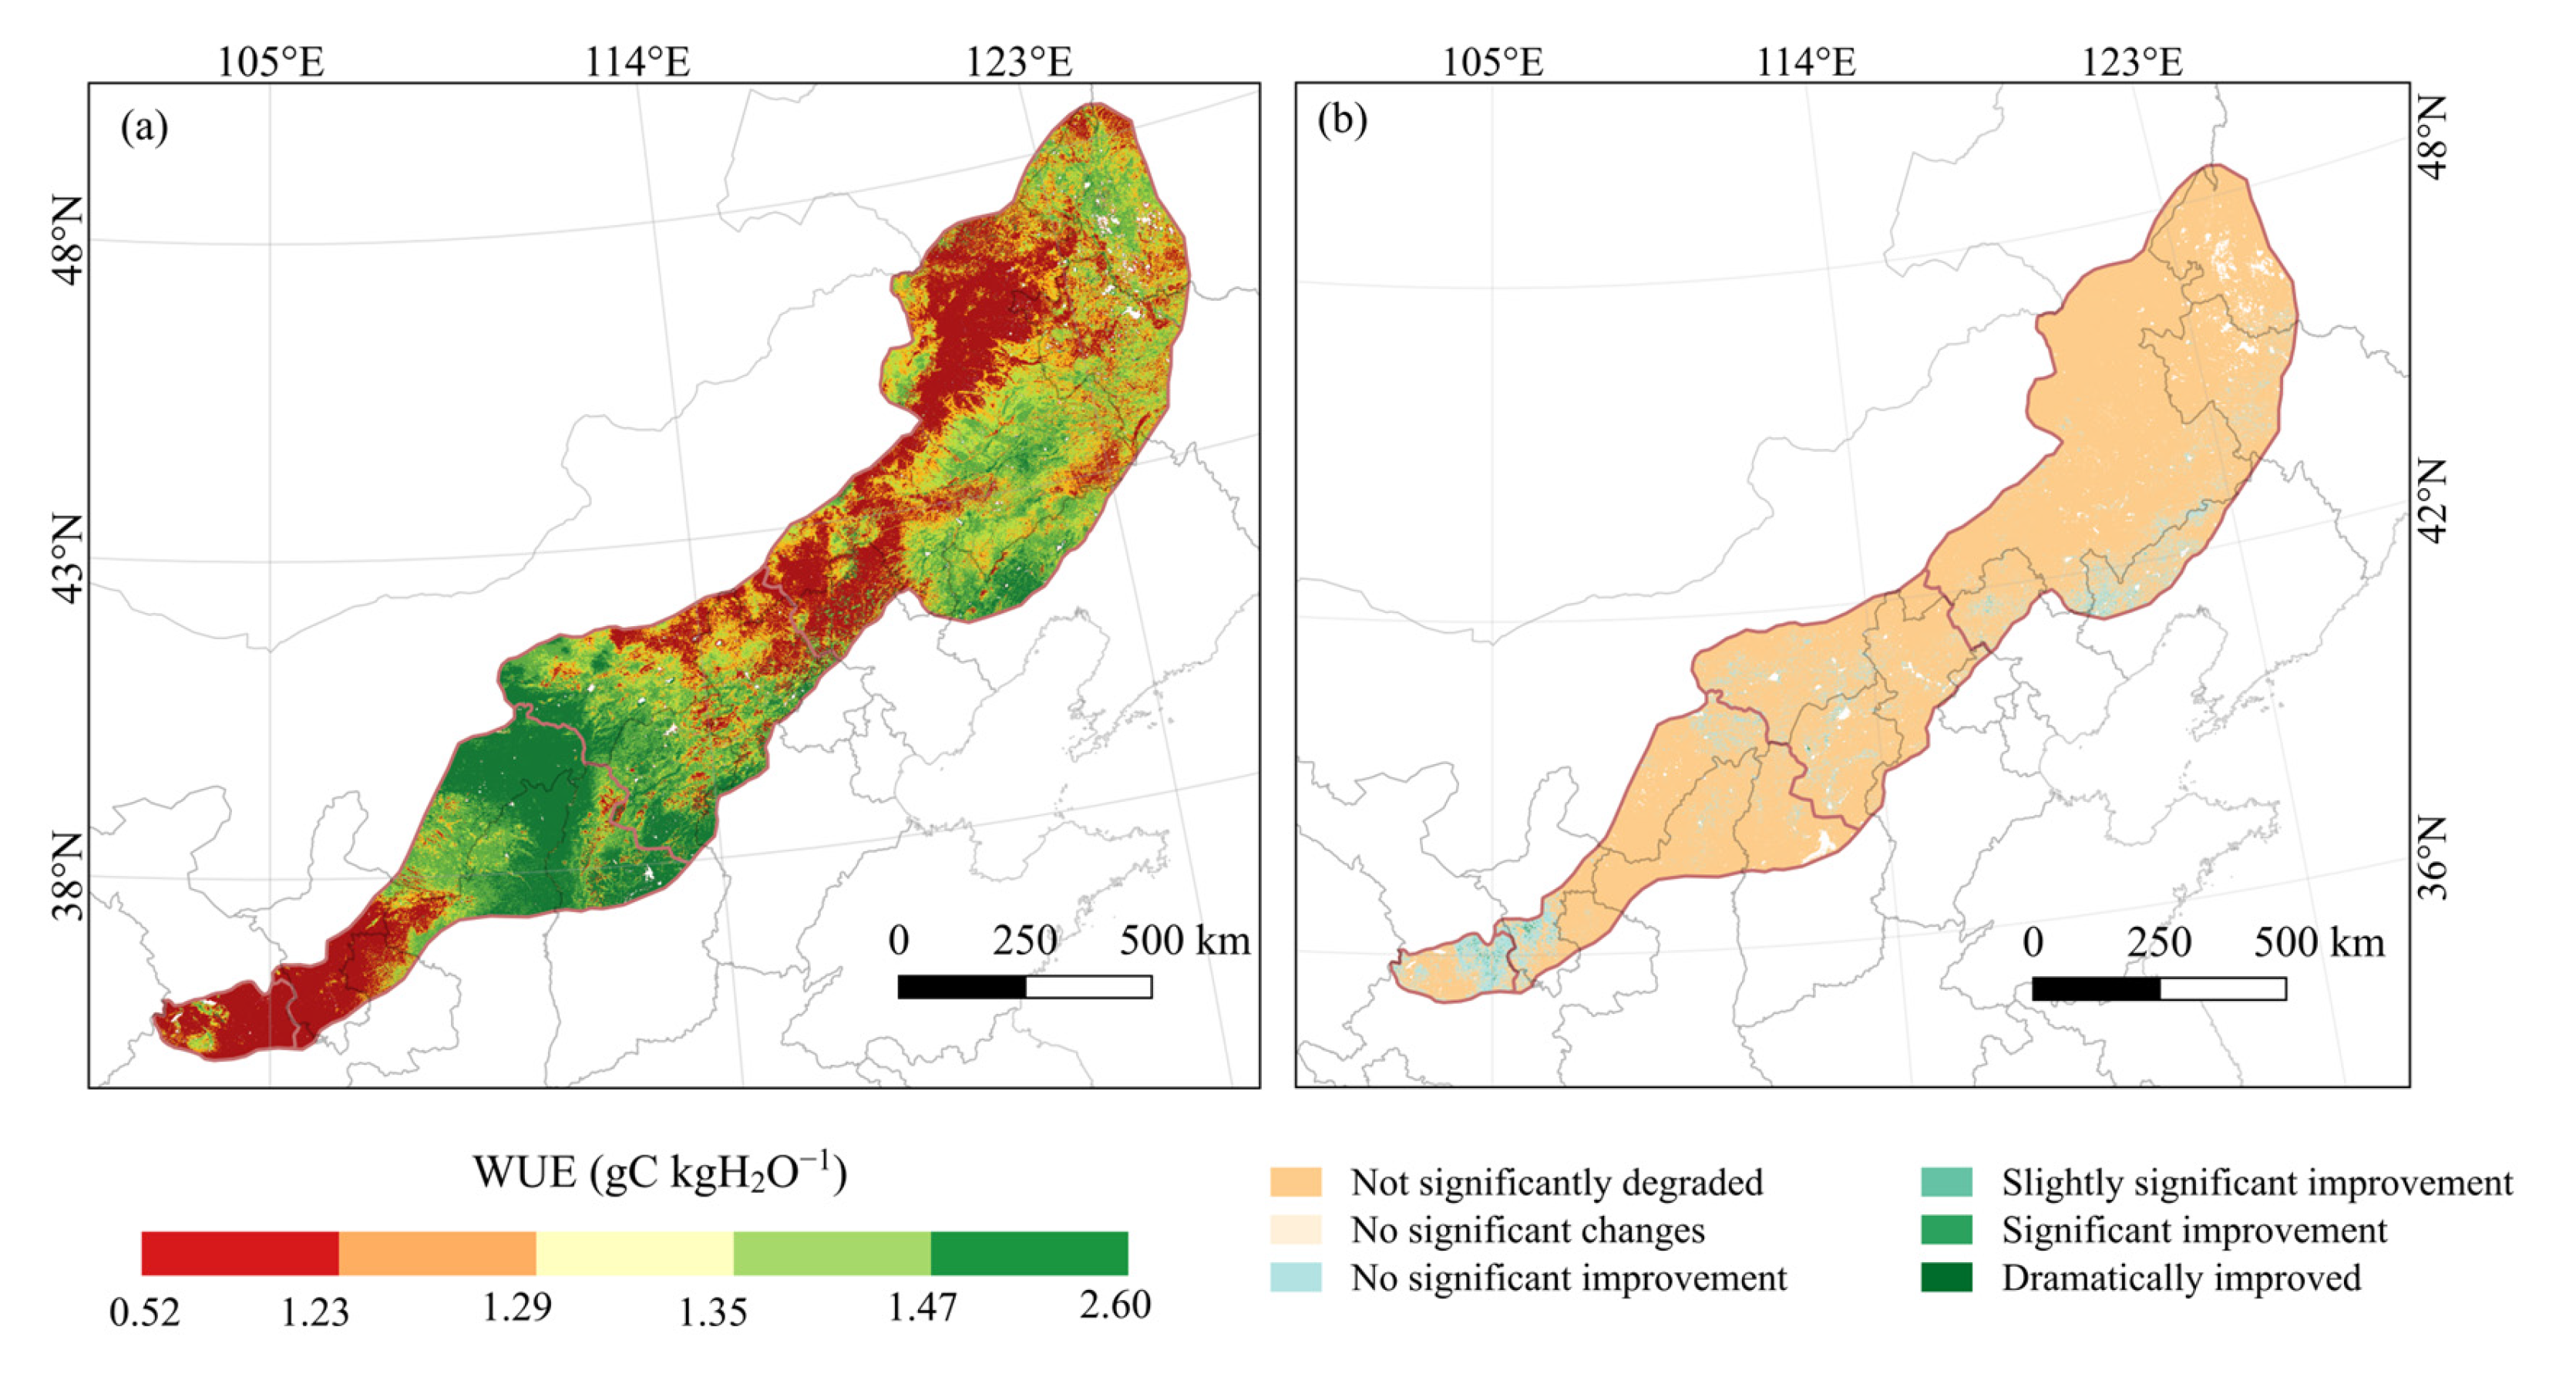
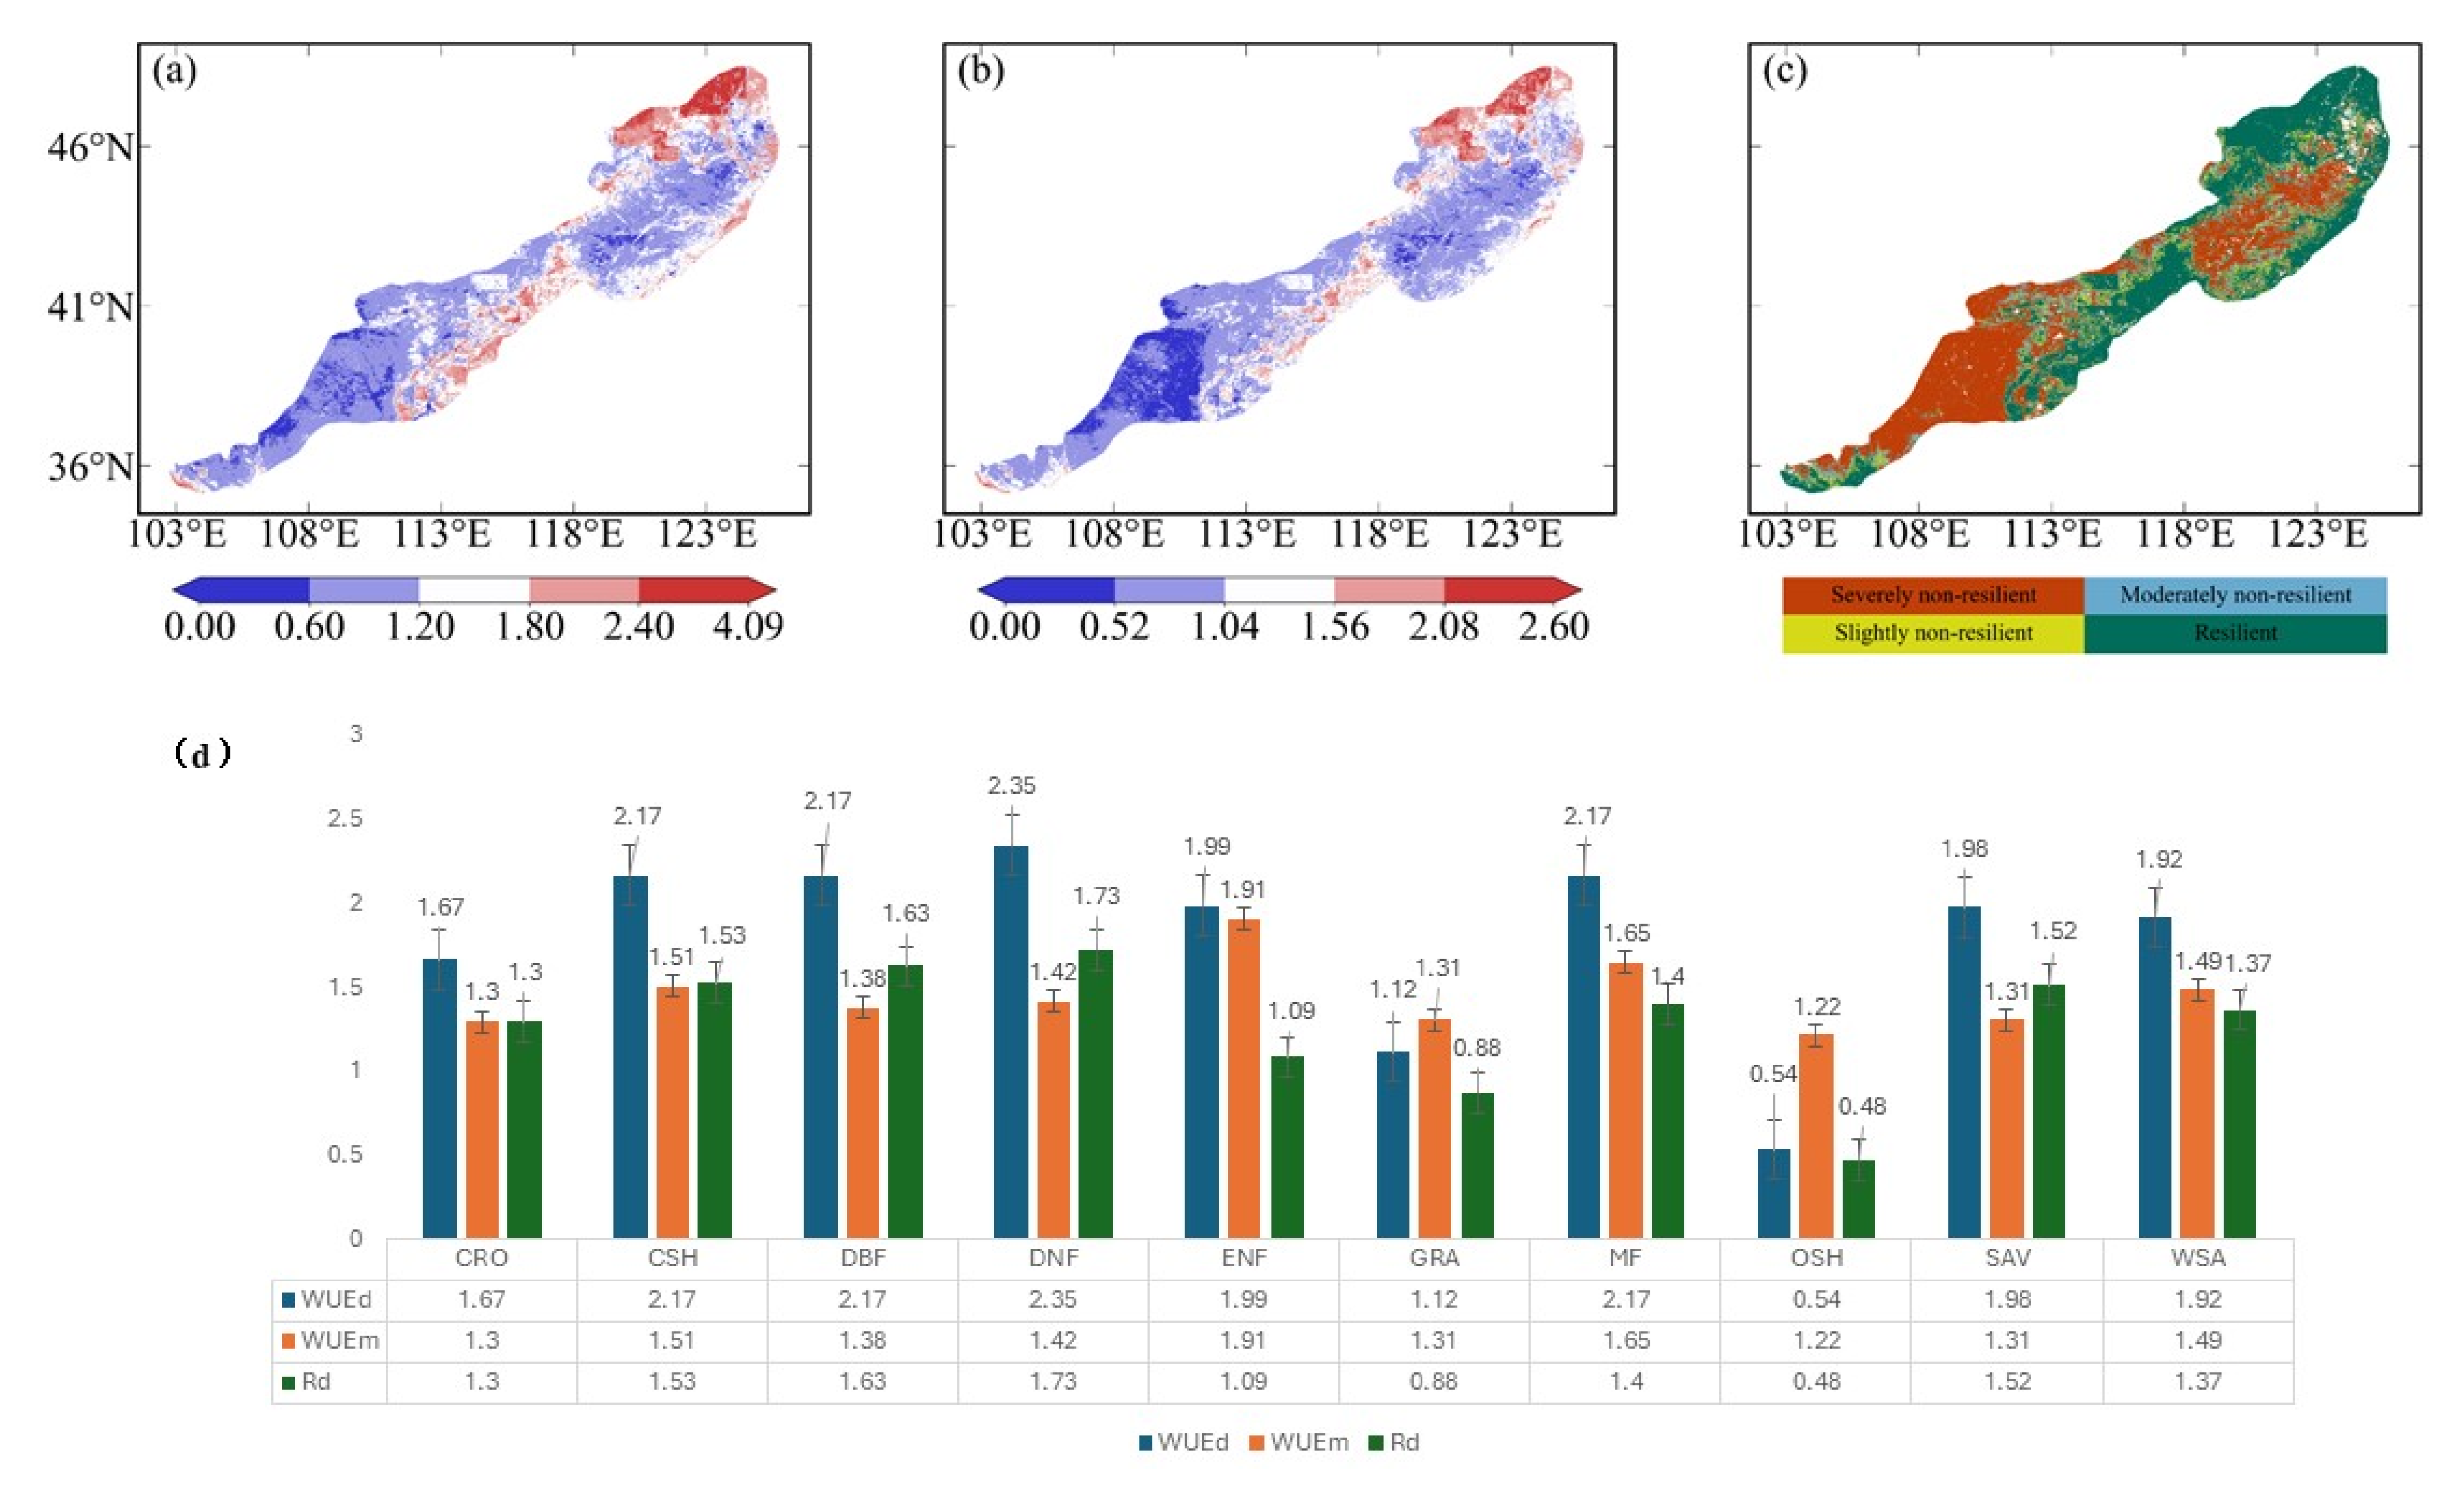
3.1. Trends in WUE
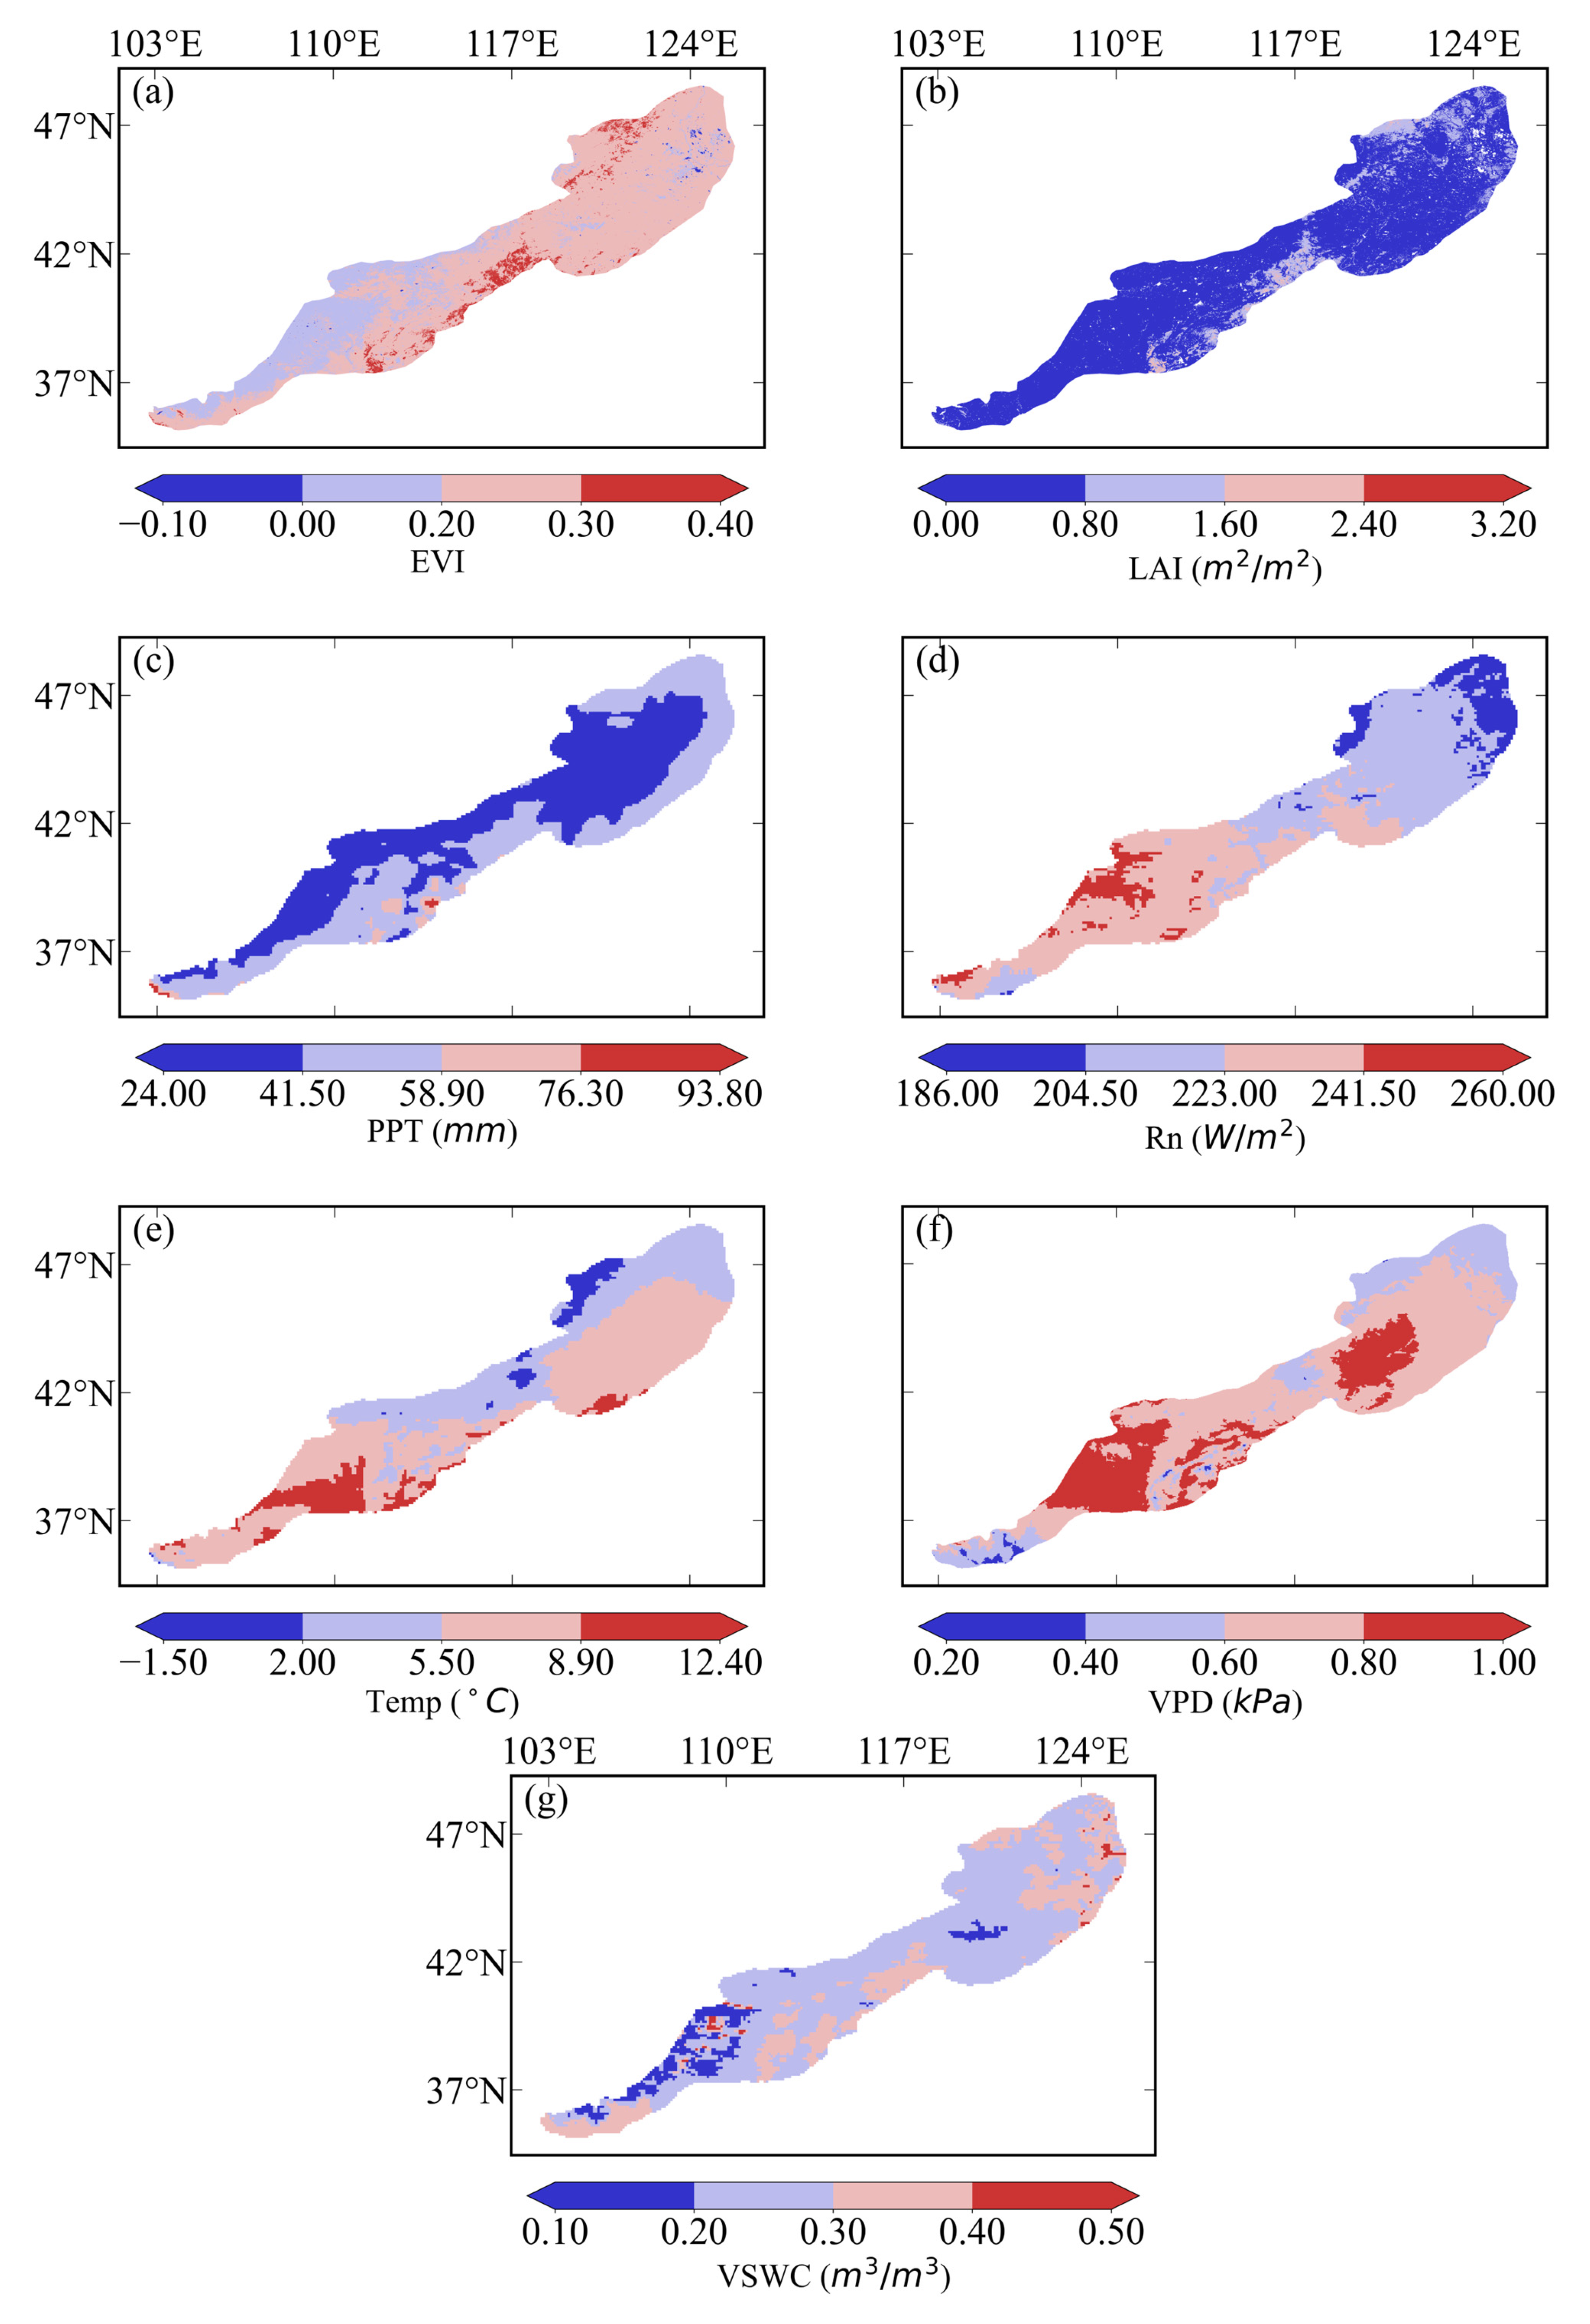
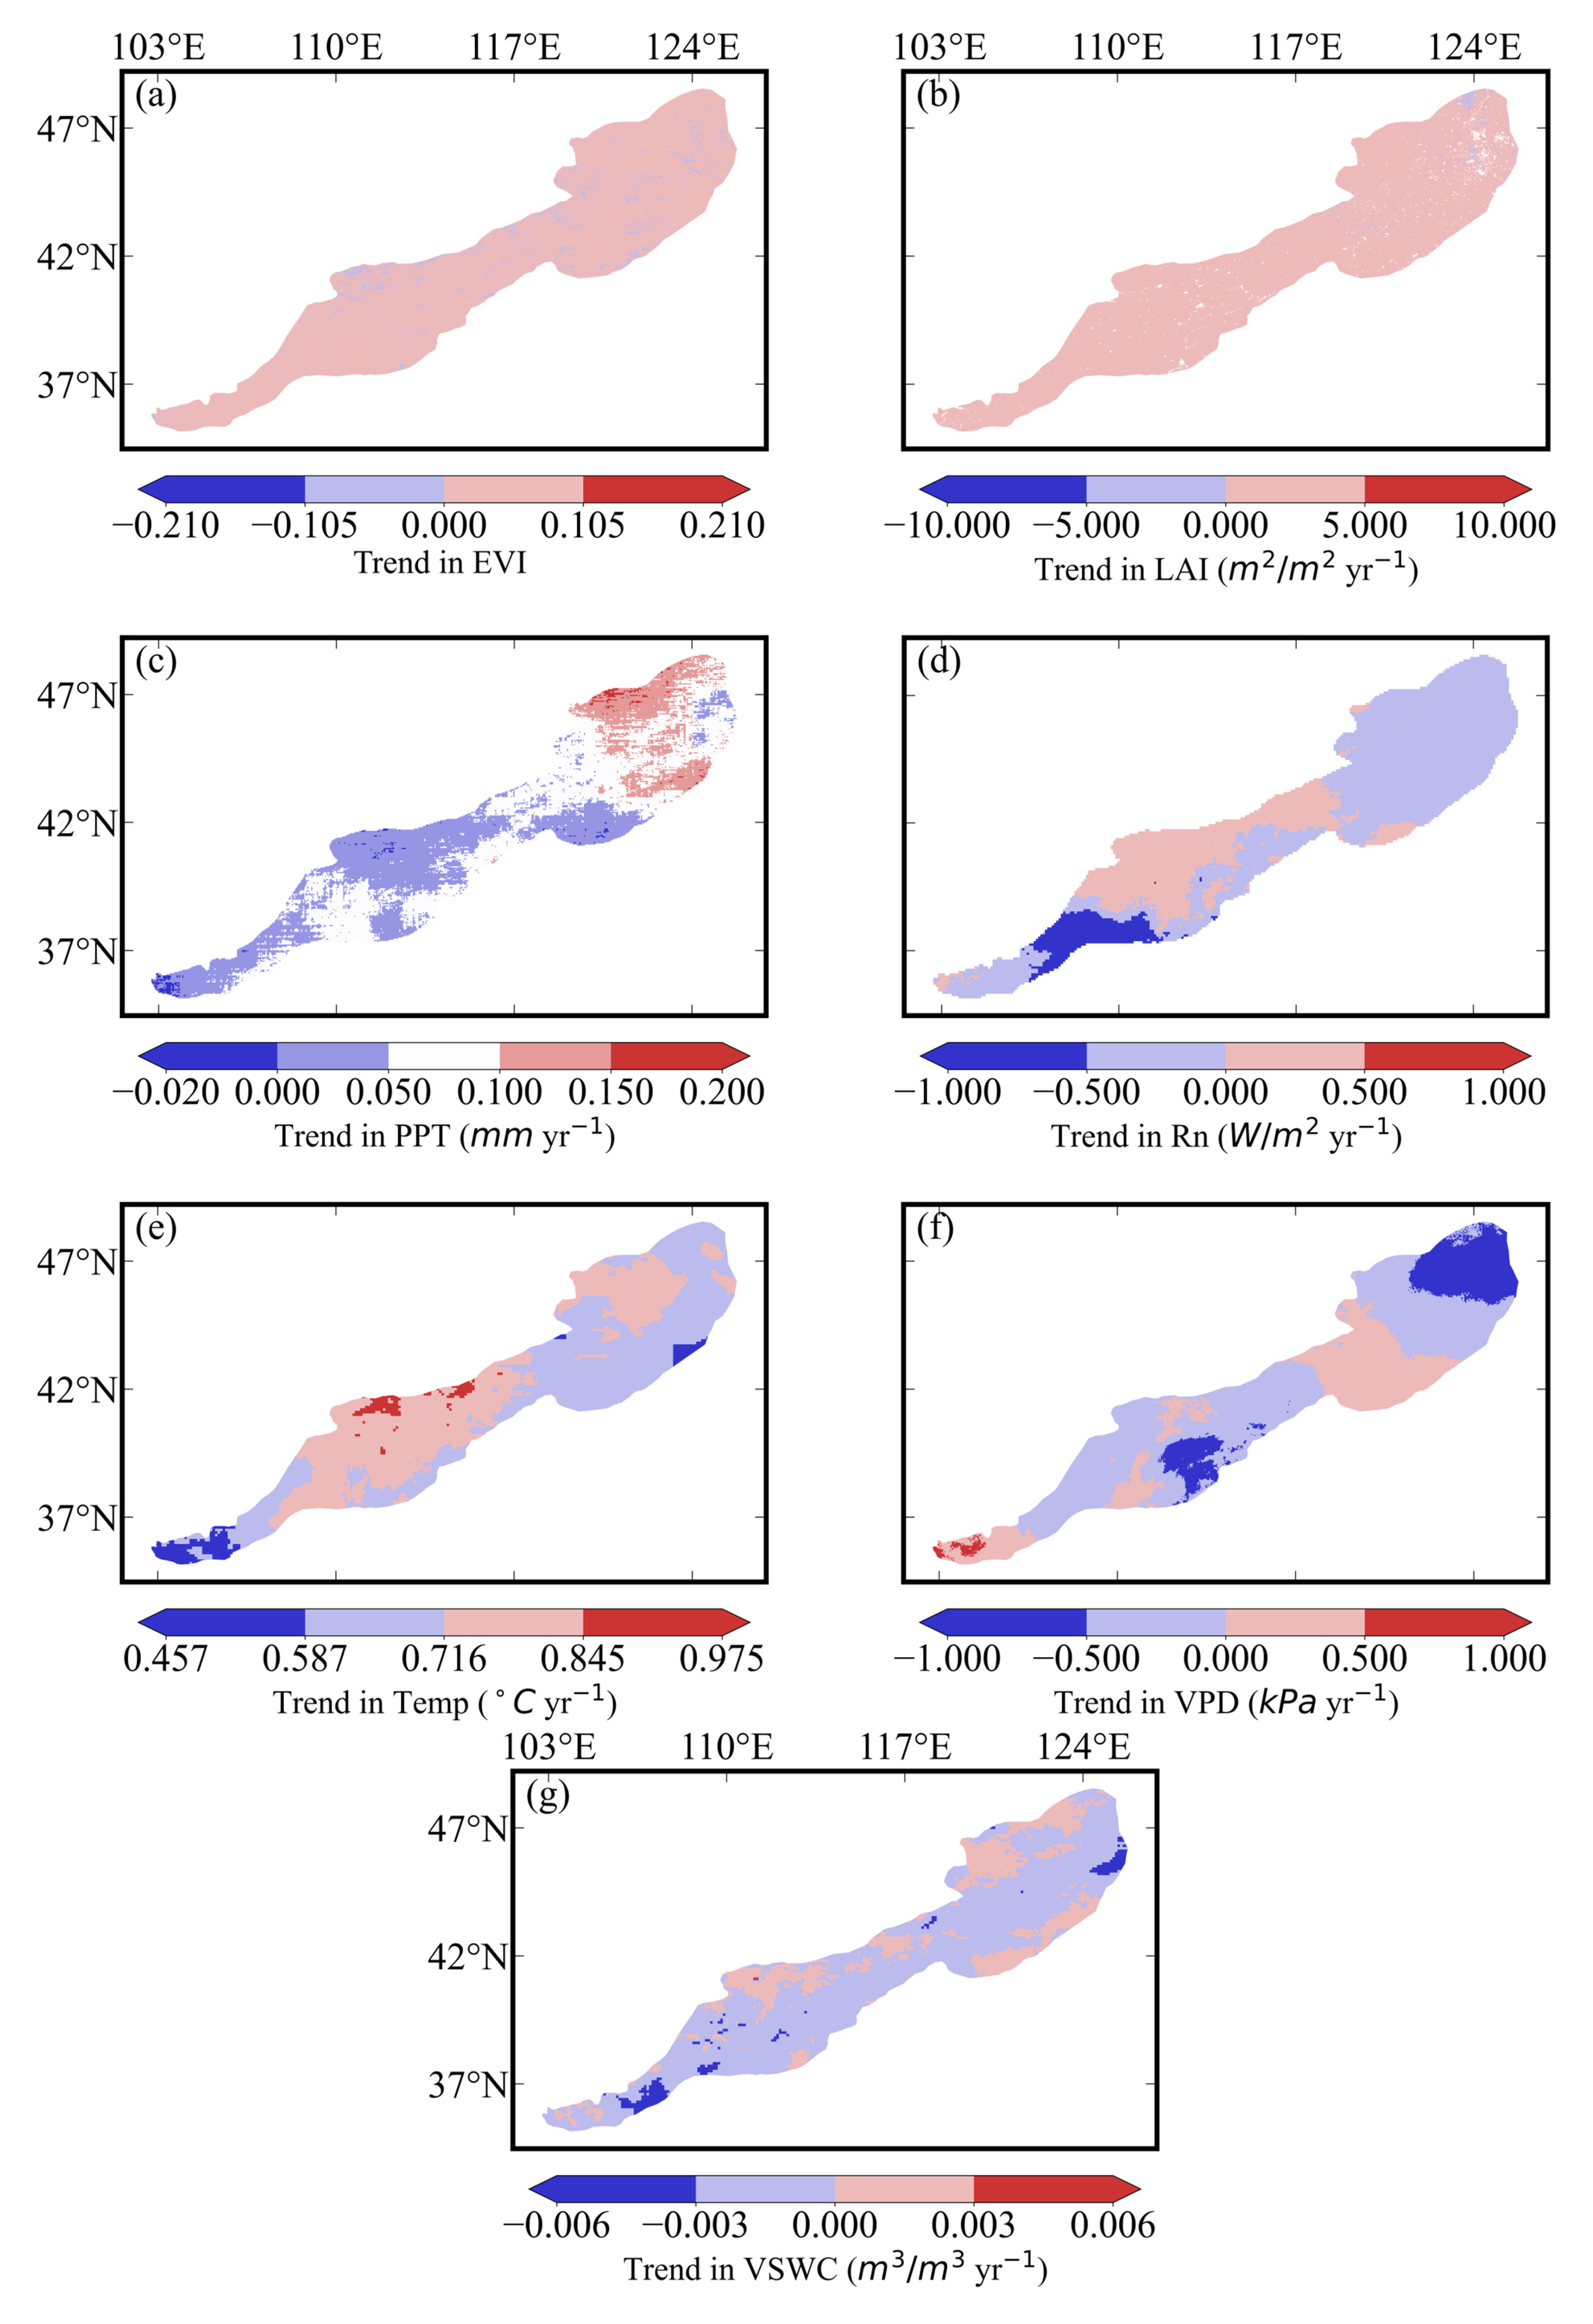
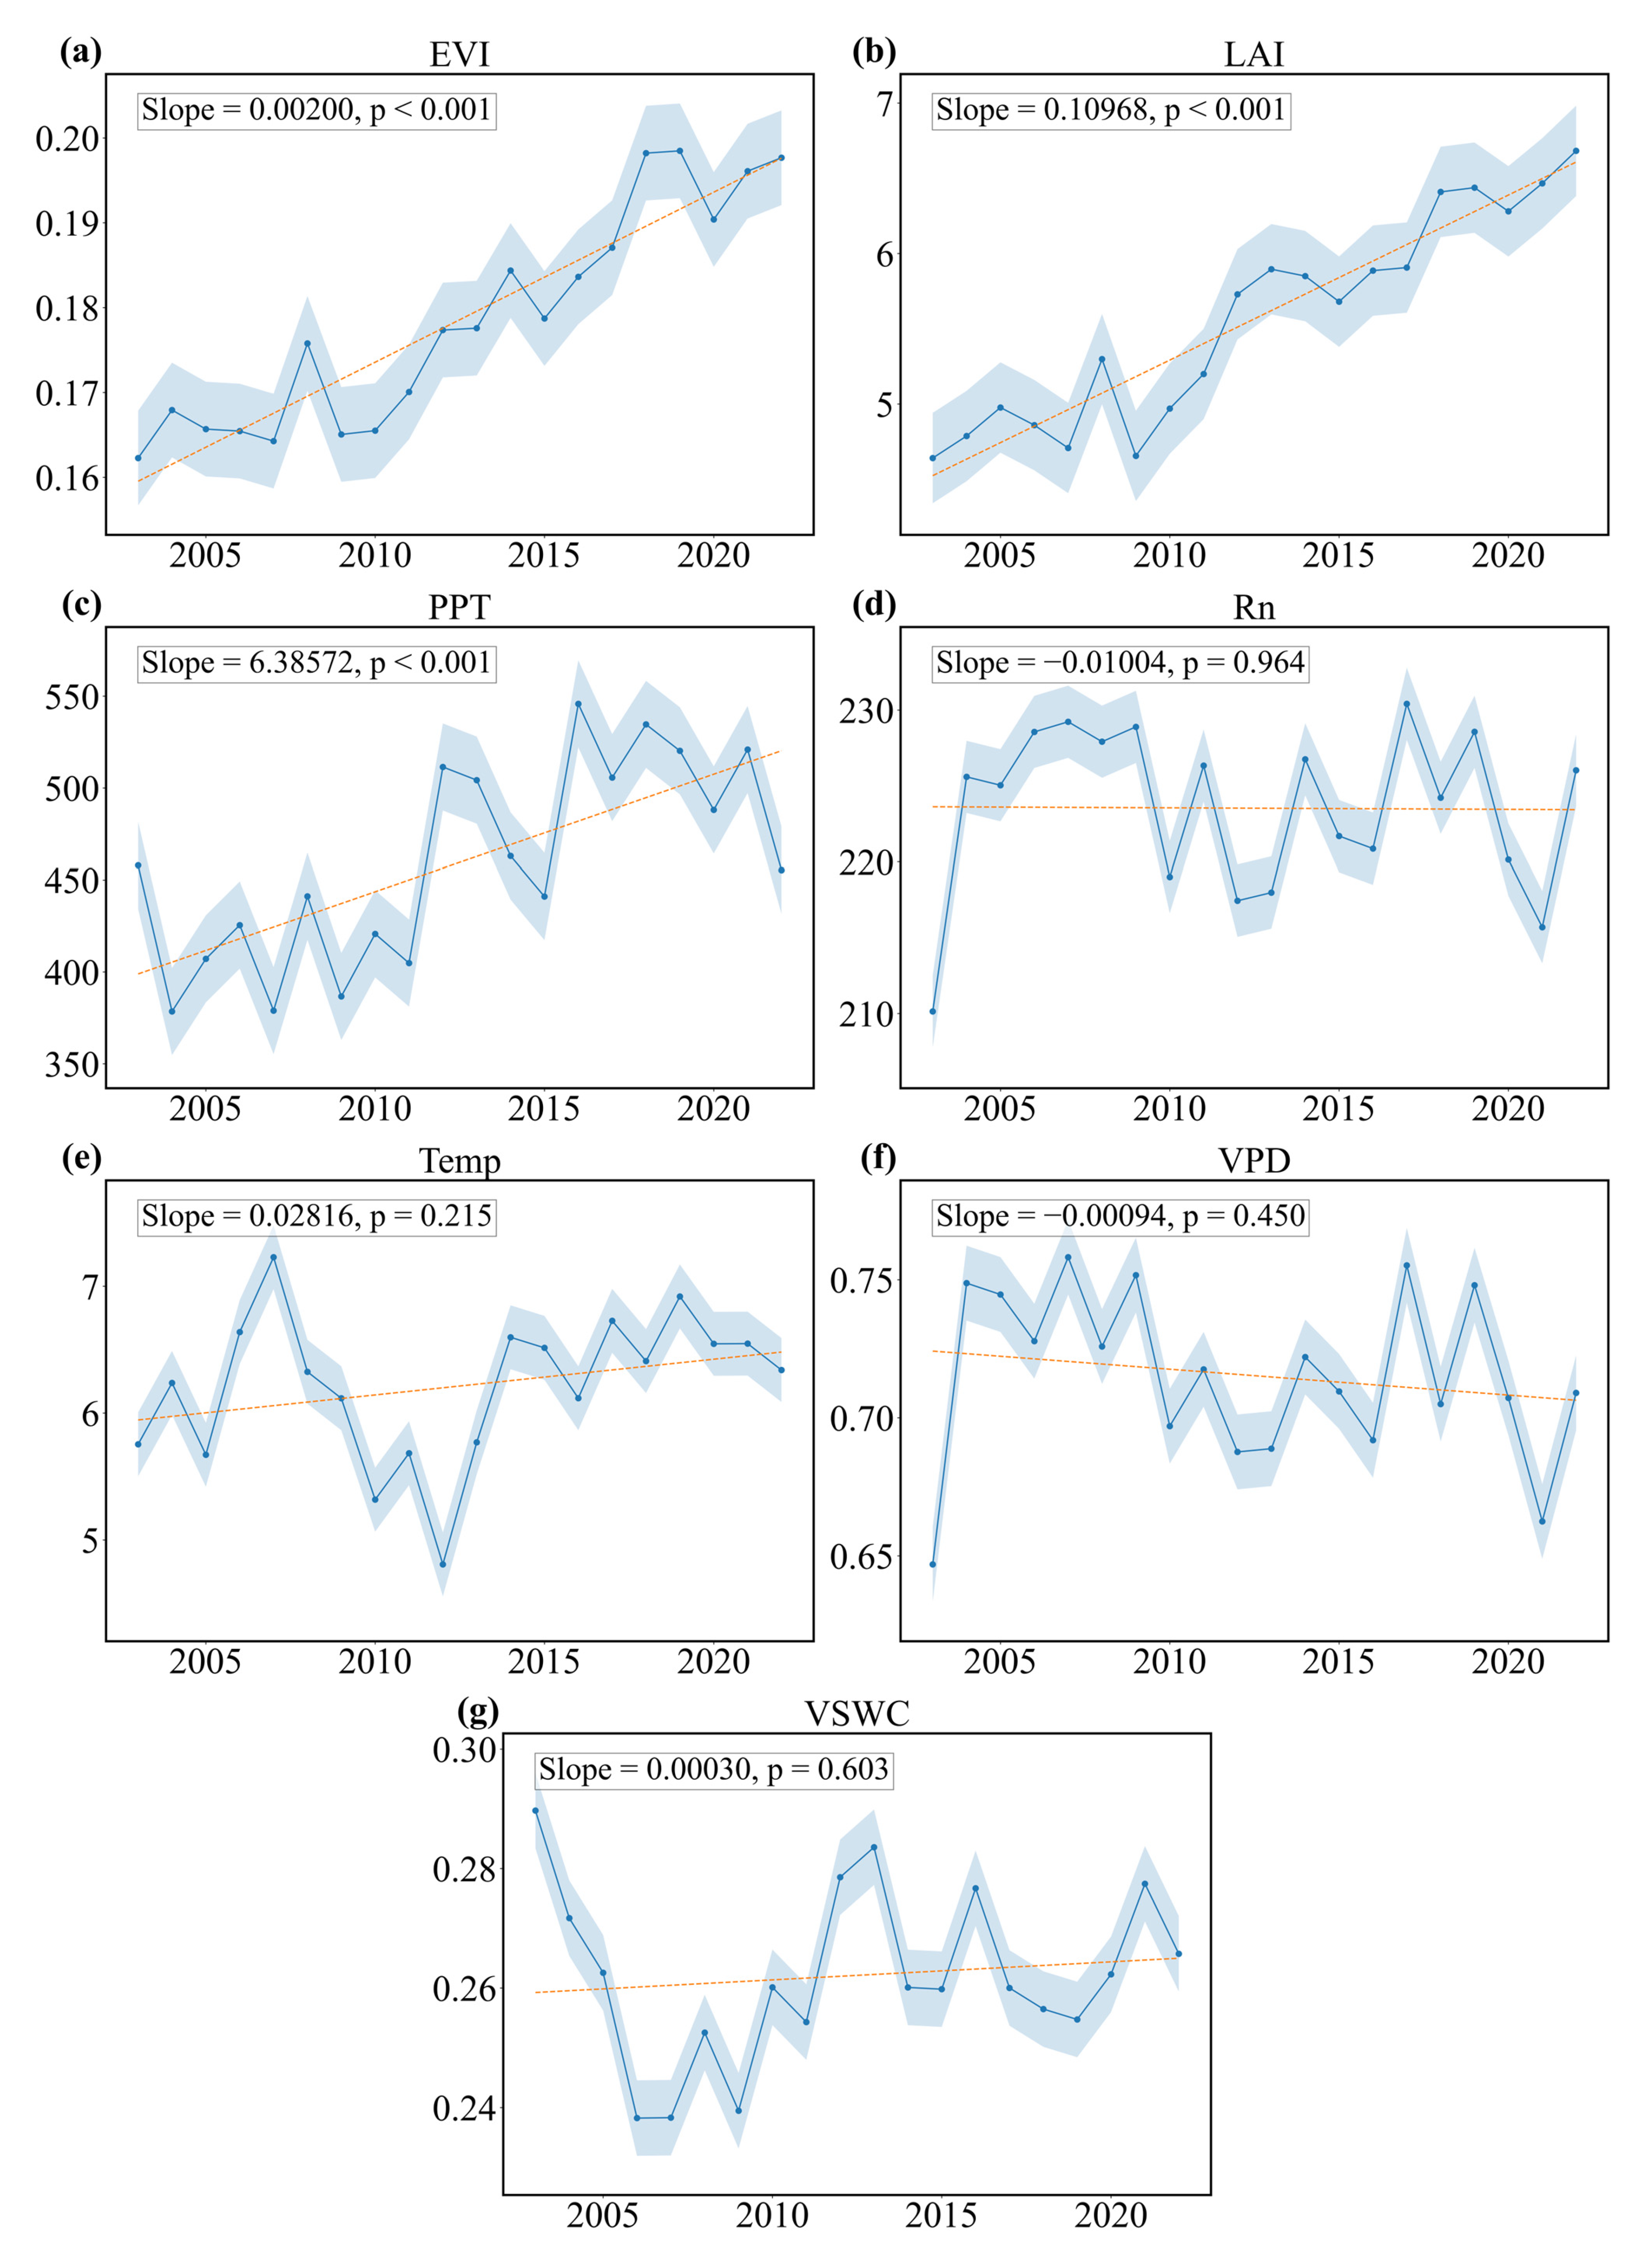
3.2. Trends in Biophysical Variables
3.3. Regulations of the Biophysical Variables on WUE
3.3.1. The Correlation Between the WUE and Biophysical Variables
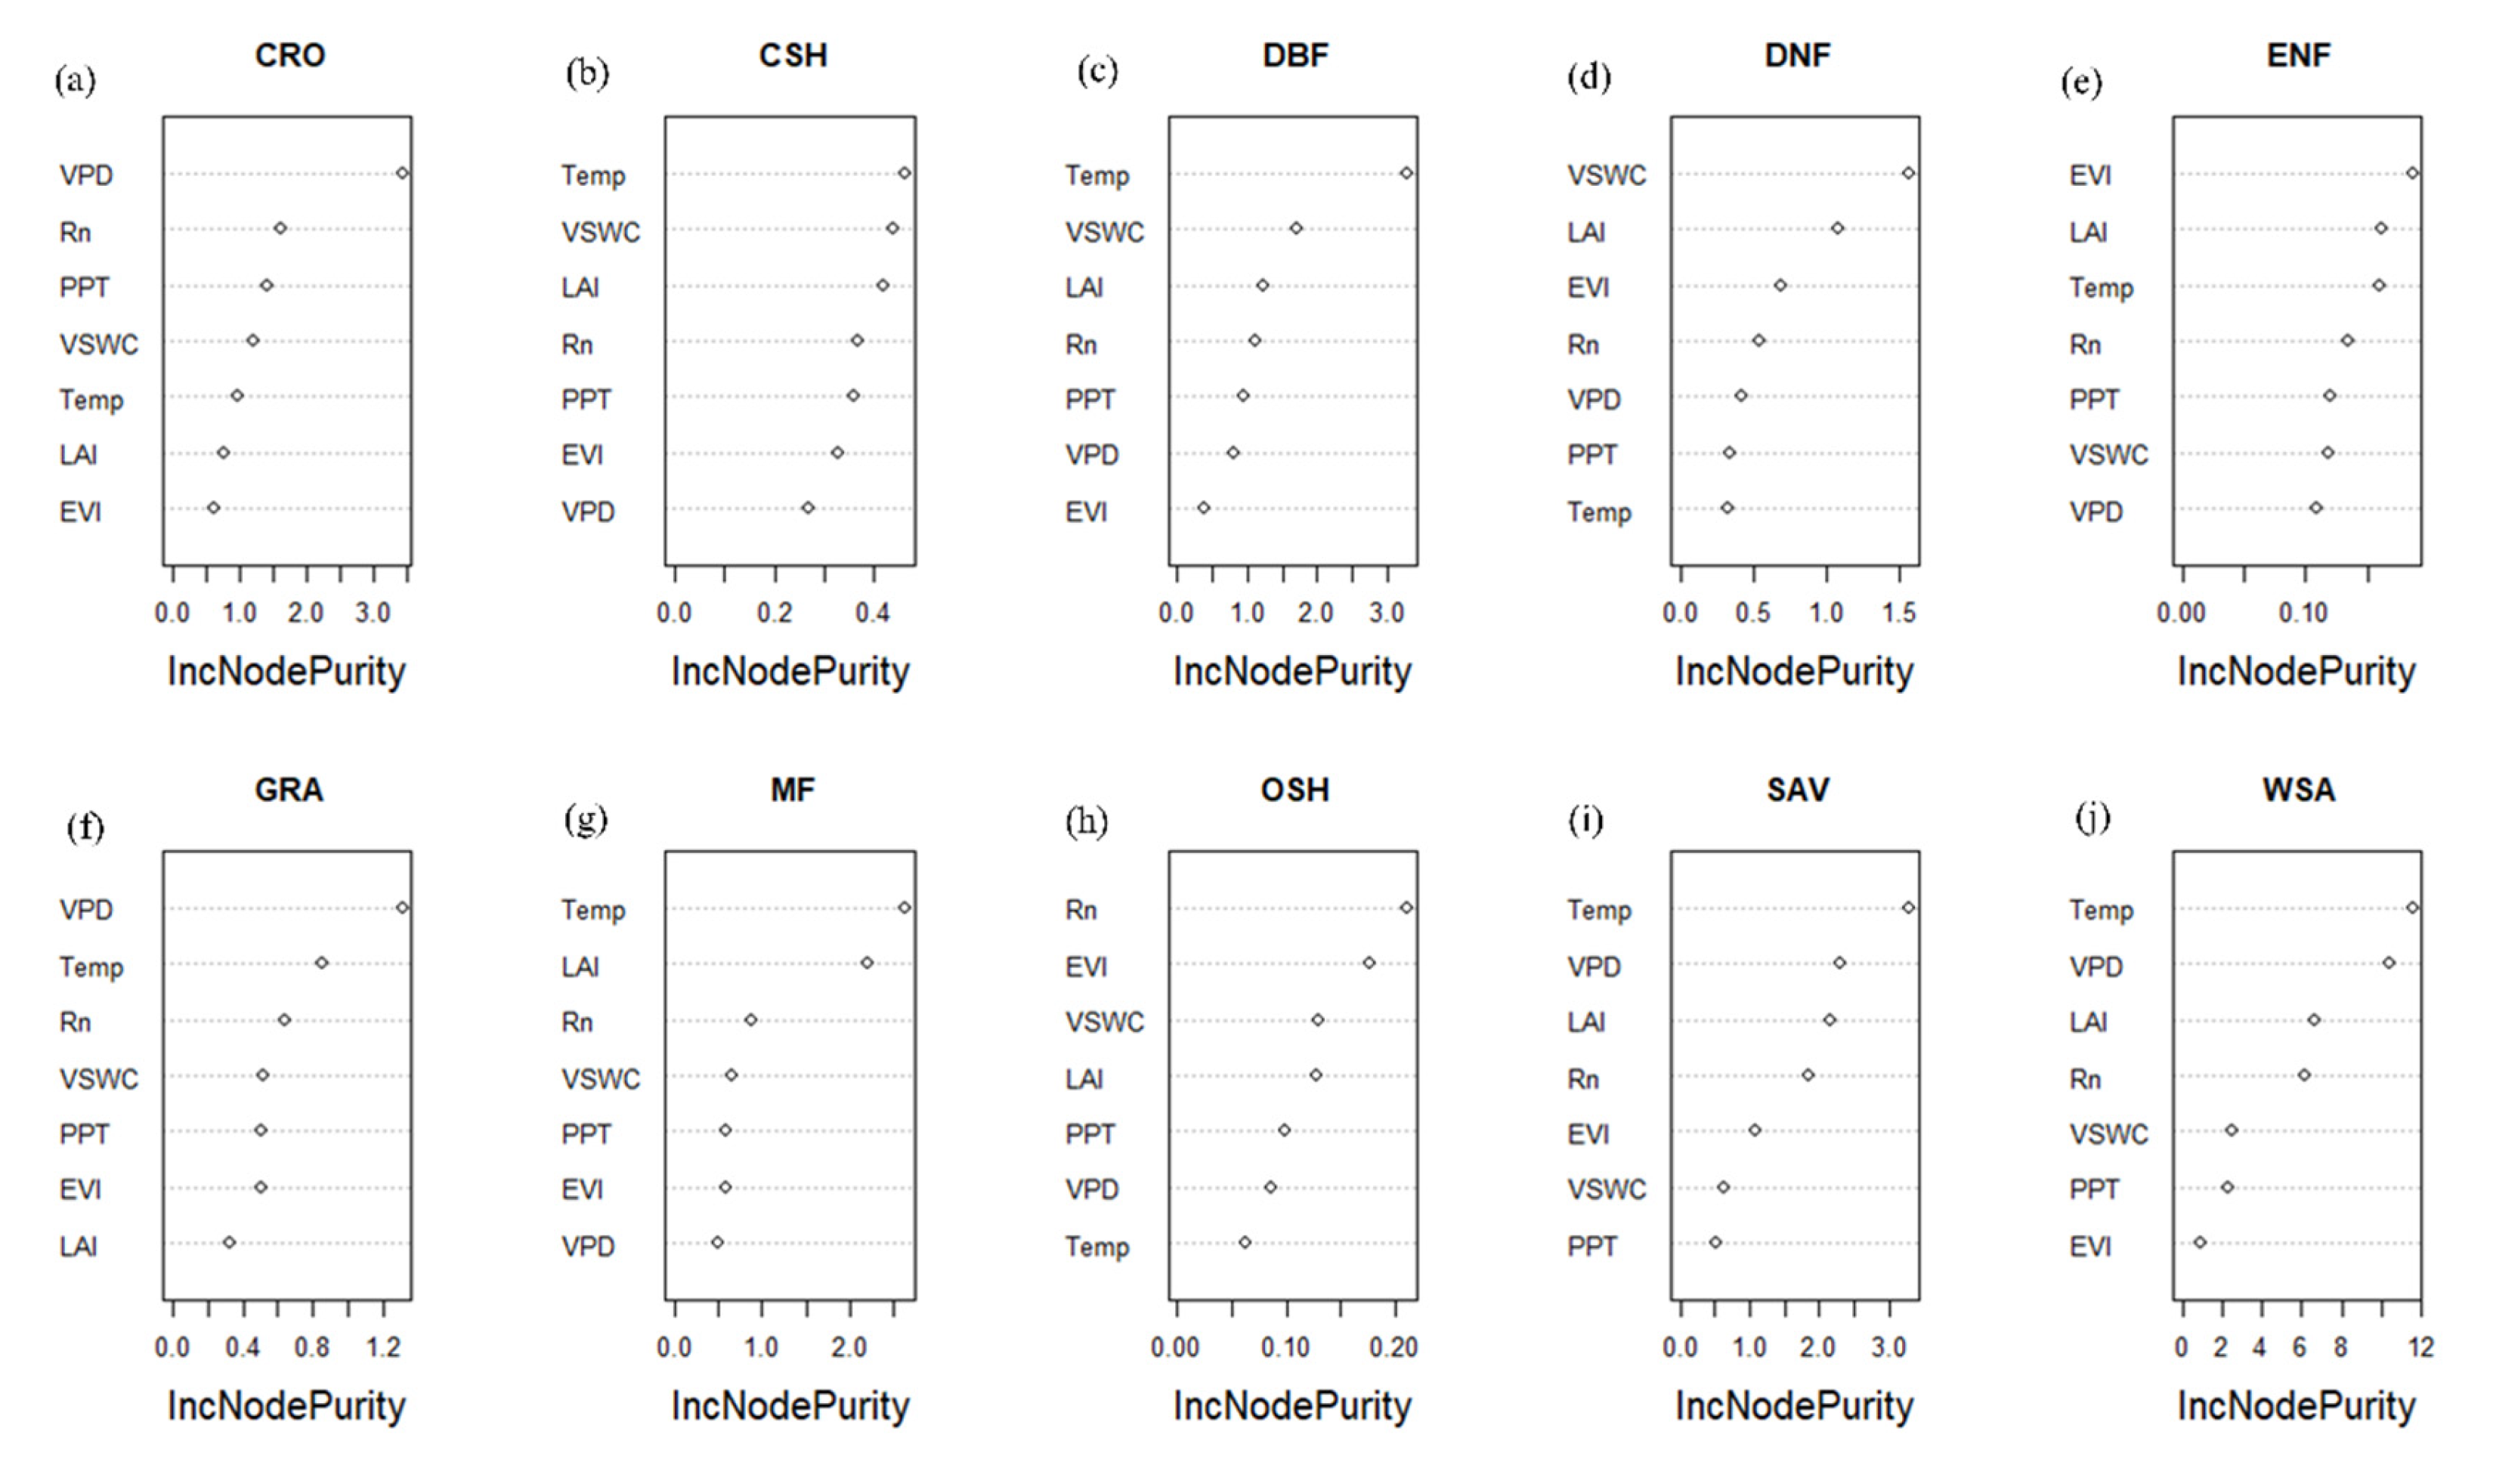
3.3.2. Biophysical Regulations on WUE of Each Vegetation Type
3.3.3. Climatic Controls on WUE at Regional Scale
3.4. Ecosystem Resilience
4. Discussion
4.1. Assessment of Data Precision
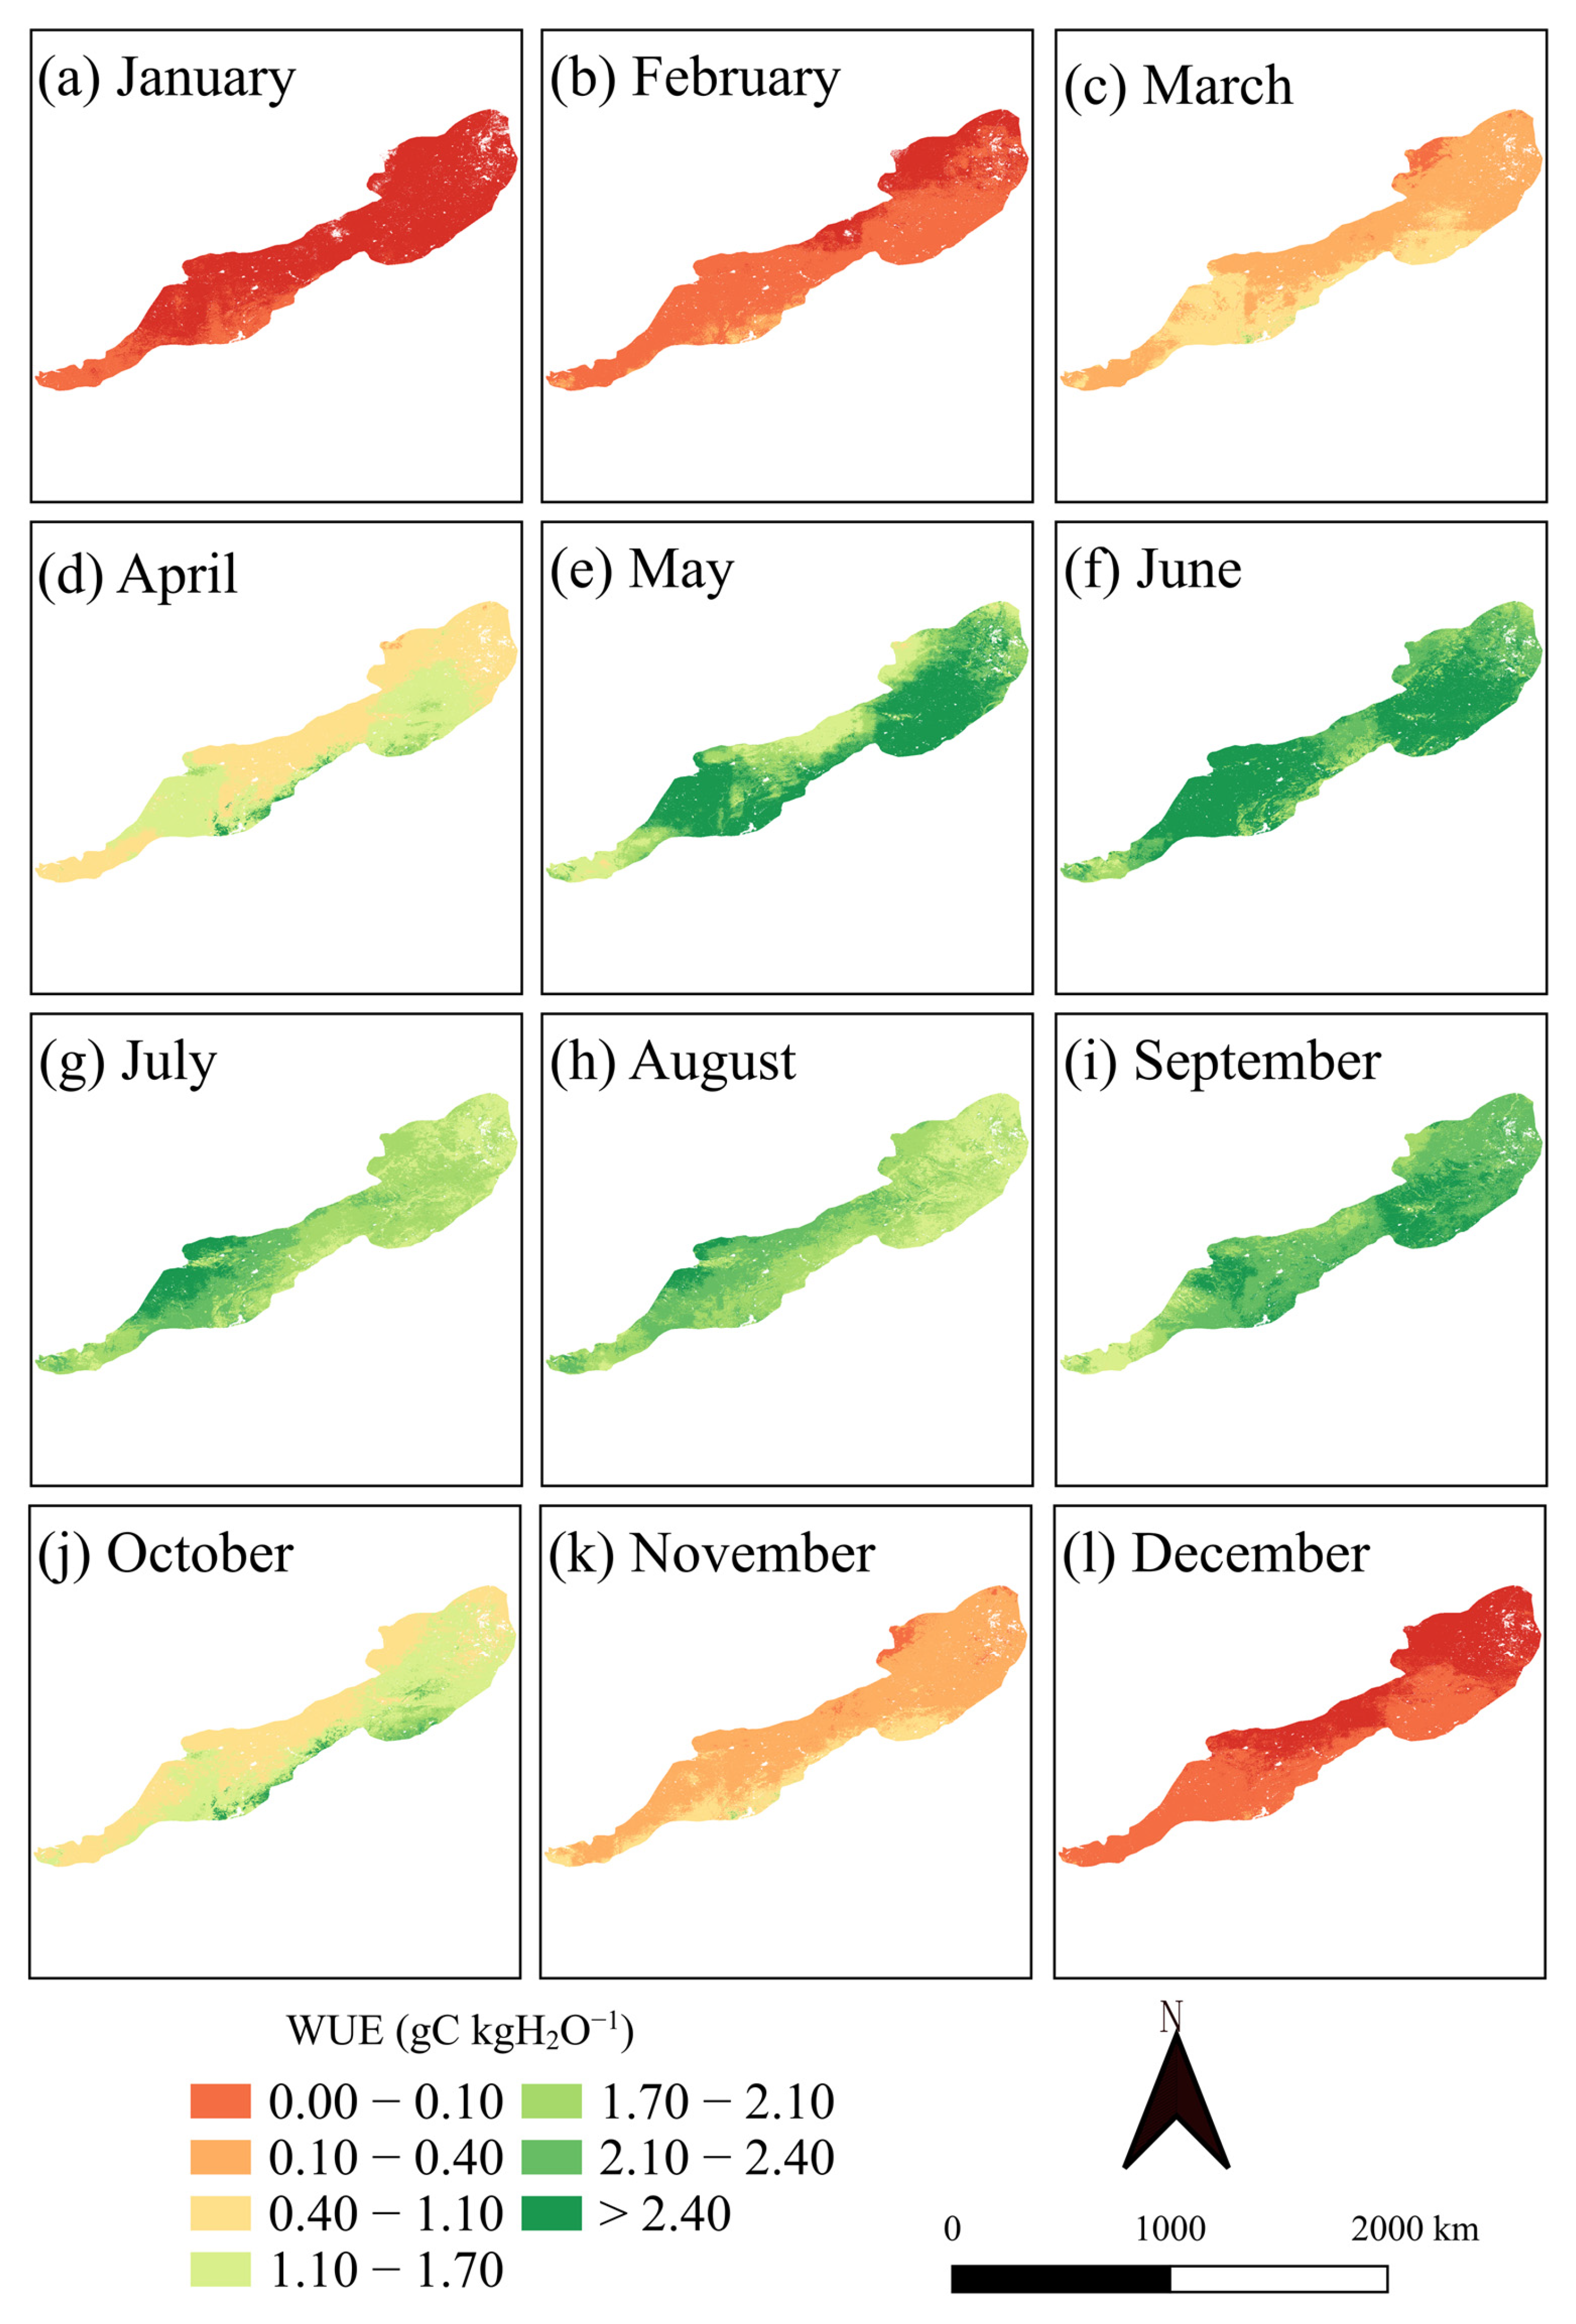
4.2. The WUE Characteristics
4.3. The Biophysical Controls of WUE
4.4. Ecosystem Resilience
4.5. Limitations
5. Conclusions
Supplementary Materials
Author Contributions
Funding
Institutional Review Board Statement
Data Availability Statement
Conflicts of Interest
References
- Bernacchi, C.J.; Vanloocke, A. Terrestrial Ecosystems in a Changing Environment: A Dominant Role for Water. Annu. Rev. Plant Biol. 2015, 66, 599. [Google Scholar] [CrossRef] [PubMed]
- Dai, A. Increasing drought under global warming in observations and models. Nat. Clim. Change 2013, 3, 52–58. [Google Scholar] [CrossRef]
- He, L.; Wang, J.; Ciais, P.; Ballantyne, A.; Yu, K.; Zhang, W.; Xiao, J.; Ritter, F.; Liu, Z.; Wang, X.; et al. Non-symmetric responses of leaf onset date to natural warming and cooling in northern ecosystems. PNAS Nexus 2023, 2, 308. [Google Scholar] [CrossRef]
- Valjarevic, A.; Morar, C.; Brasanac-Bosanac, L.; Cirkovic-Mitrovic, T.; Djekic, T.; Mihajlovic, M.; Milevski, I.; Culafic, G.; Lukovic, M.; Niemets, L.; et al. Sustainable land use in Moldova: GIS & remote sensing of forests and crops. Land Use Policy 2025, 152, 107515. [Google Scholar]
- Zhang, Y.Y.; Wang, Q.T.; Zhang, X.Y.; Guo, Z.C.; Guo, X.N.; Ma, C.H.; Wei, B.C.; He, L. Pre-Season Precipitation and Temperature Have a Larger Influence on Vegetation Productivity than That of the Growing Season in the Agro-Pastoral Ecotone in Northern China. Agriclture 2025, 15, 219. [Google Scholar] [CrossRef]
- Nandy, S.; Saranya, M.; Srinet, R. Spatio-temporal variability of water use efficiency and its drivers in major forest formations in India. Remote Sens. Environ. 2022, 269, 112791. [Google Scholar] [CrossRef]
- Huang, M.; Piao, S.; Sun, Y.; Ciais, P.; Cheng, L.; Mao, J.; Poulter, B.; Shi, X.; Zeng, Z.; Wang, Y. Change in terrestrial ecosystem water-use efficiency over the last three decades. Glob. Change Biol. 2015, 21, 2366–2378. [Google Scholar] [CrossRef]
- Ma, R.; Cui, X.; Wang, D.; Wang, S.; Wang, H.; Yao, X.; Li, S. Spatial and Temporal Characteristics of Water Use Efficiency in Typical Ecosystems on the Loess Plateau in the Last 20 Years, with Drivers and Implications for Ecological Restoration. Remote Sens. 2022, 14, 5632. [Google Scholar] [CrossRef]
- Guo, L.; Sun, F.; Liu, W.; Zhang, Y.; Wang, H.; Cui, H.; Wang, H.; Zhang, J.; Du, B. Response of Ecosystem Water Use Efficiency to Drought over China during 1982–2015: Spatiotemporal Variability and Resilience. Forests 2019, 10, 598. [Google Scholar] [CrossRef]
- Gu, C.; Tang, Q.; Zhu, G.; Ma, J.; Gu, C.; Zhang, K.; Sun, S.; Yu, Q.; Niu, S. Discrepant responses between evapotranspiration- and transpiration-based ecosystem water use efficiency to interannual precipitation fluctuations. Agric. For. Meteorol. 2021, 303, 108385. [Google Scholar] [CrossRef]
- Huang, L.; He, B.; Han, L.; Liu, J.; Wang, H.; Chen, Z. A global examination of the response of ecosystem water-use efficiency to drought based on MODIS data. Sci. Total Environ. 2017, 601, 1097–1107. [Google Scholar] [CrossRef] [PubMed]
- Jia, B.H.; Luo, X.; Wang, L.H.; Lai, X. Changes in Water Use Efficiency Caused by Climate Change, CO2 Fertilization, and Land Use Changes on the Tibetan Plateau. Adv. Atmos. Sci. 2023, 40, 144–154. [Google Scholar] [CrossRef]
- Kang, M.; Cho, S. Progress in water and energy flux studies in Asia: A review focused on eddy covariance measurements. J. Agric. Meteorol. 2021, 77, 2–23. [Google Scholar] [CrossRef]
- Dekker, S.C.; Groenendijk, M.; Booth, B.B.; Huntingford, C.; Cox, P.M. Spatial and temporal variations in plant water-use efficiency inferred from tree-ring, eddy covariance and atmospheric observations. Earth Syst. Dyn. 2016, 7, 525–533. [Google Scholar] [CrossRef]
- Gao, Y.; Zhu, X.; Yu, G.; He, N.; Wang, Q.; Tian, J. Water use efficiency threshold for terrestrial ecosystem carbon sequestration in China under afforestation. Agric. For. Meteorol. 2014, 195, 32–37. [Google Scholar] [CrossRef]
- Li, X.Y.; Zou, L.; Xia, J.; Wang, F.Y.; Li, H.W. Identifying the Responses of Vegetation Gross Primary Productivity and Water Use Efficiency to Climate Change under Different Aridity Gradients across China. Remote Sens. 2023, 15, 1563. [Google Scholar] [CrossRef]
- Ma, J.; Jia, X.; Zha, T.; Bourque, C.P.A.; Tian, Y.; Bai, Y.; Liu, P.; Yang, R.; Li, C.; Li, C.; et al. Ecosystem water use efficiency in a young plantation in Northern China and its relationship to drought. Agric. For. Meteorol. 2019, 275, 1–10. [Google Scholar] [CrossRef]
- Song, Q.-H.; Fei, X.-H.; Zhang, Y.-P.; Sha, L.-Q.; Liu, Y.-T.; Zhou, W.-J.; Wu, C.-S.; Lu, Z.-Y.; Luo, K.; Gao, J.-B. Water use efficiency in a primary subtropical evergreen forest in Southwest China. Sci. Rep. 2017, 7, 43031. [Google Scholar] [CrossRef]
- Wang, H.; Li, X.; Xiao, J.; Ma, M. Evapotranspiration components and water use efficiency from desert to alpine ecosystems in drylands. Agric. For. Meteorol. 2021, 298, 108283. [Google Scholar] [CrossRef]
- Zou, J.; Ding, J.; Welp, M.; Huang, S.; Liu, B.J.S. Assessing the response of ecosystem water use efficiency to drought during and after drought events across Central Asia. Sensors 2020, 20, 581. [Google Scholar] [CrossRef]
- Xiao, J.; Sun, G.; Chen, J.; Chen, H.; Chen, S.; Dong, G.; Gao, S.; Guo, H.; Guo, J.; Han, S.J.A.; et al. Carbon fluxes, evapotranspiration, and water use efficiency of terrestrial ecosystems in China. Agric. For. Meteorol. 2013, 182, 76–90. [Google Scholar] [CrossRef]
- Li, F.; Xiao, J.; Chen, J.; Ballantyne, A.; Jin, K.; Li, B.; Abraha, M.; John, R. Global water use efficiency saturation due to increased vapor pressure deficit. Science 2023, 381, 672–677. [Google Scholar] [CrossRef] [PubMed]
- Bai, Y.; Zha, T.; Bourque, C.P.A.; Jia, X.; Ma, J.; Liu, P.; Yang, R.; Li, C.; Du, T.; Wu, Y. Variation in ecosystem water use efficiency along a southwest-to-northeast aridity gradient in China. Ecol. Indic. 2020, 110, 105932. [Google Scholar] [CrossRef]
- Brümmer, C.; Black, T.A.; Jassal, R.S.; Grant, N.J.; Spittlehouse, D.L.; Chen, B.; Nesic, Z.; Amiro, B.D.; Arain, M.A.; Barr, A.G.; et al. How climate and vegetation type influence evapotranspiration and water use efficiency in Canadian forest, peatland and grassland ecosystems. Agric. For. Meteorol. 2012, 153, 14–30. [Google Scholar] [CrossRef]
- Xu, X.; Jiao, F.; Gong, H.; Xue, P.; Lin, N.; Liu, J.; Zhang, K.; Qiu, J.; Lin, D.; Yang, Y.; et al. Observed divergence in the trends of temperature controls on Chinese ecosystem water use efficiency. Ecol. Indic. 2023, 157, 111241. [Google Scholar] [CrossRef]
- Wang, F.; Zhang, F.; Gou, X.; Fonti, P.; Xia, J.; Cao, Z.; Liu, J.; Wang, Y.; Zhang, J. Seasonal variations in leaf-level photosynthesis and water use efficiency of three isohydric to anisohydric conifers on the Tibetan Plateau. Agric. For. Meteorol. 2021, 308–309, 108581. [Google Scholar] [CrossRef]
- Xie, J.; Chen, J.; Sun, G.; Zha, T.; Yang, B.; Chu, H.; Liu, J.; Wan, S.; Zhou, C.; Ma, H.; et al. Ten-year variability in ecosystem water use efficiency in an oak-dominated temperate forest under a warming climate. Agric. For. Meteorol. 2016, 218–219, 209–217. [Google Scholar] [CrossRef]
- Farquhar, G.D.; Ehleringer, J.R.; Hubick, K.T. CARBON ISOTOPE DISCRIMINATION AND PHOTOSYNTHESIS. Annu. Rev. Plant Physiol. Plant Mol. Biol. 1989, 40, 503–537. [Google Scholar] [CrossRef]
- Zhu, Q.; Jiang, H.; Peng, C.; Liu, J.; Wei, X.; Fang, X.; Liu, S.; Zhou, G.; Yu, S. Evaluating the effects of future climate change and elevated CO2 on the water use efficiency in terrestrial ecosystems of China. Ecol. Modell. 2011, 222, 2414–2429. [Google Scholar] [CrossRef]
- Zhuang, Y.; Zhao, W. Dew formation and its variation in Haloxylon ammodendron plantations at the edge of a desert oasis, northwestern China. Agric. For. Meteorol. 2017, 247, 541–550. [Google Scholar] [CrossRef]
- Kim, H.W.; Hwang, K.; Mu, Q.; Lee, S.O.; Choi, M. Validation of MODIS 16 global terrestrial evapotranspiration products in various climates and land cover types in Asia. KSCE J. Civ. Eng. 2012, 16, 229–238. [Google Scholar] [CrossRef]
- Liu, Y.; Zhou, Y.; Ju, W.; Chen, J.; Wang, S.; He, H.; Wang, H.; Guan, D.; Zhao, F.; Li, Y.; et al. Evapotranspiration and water yield over China’s landmass from 2000 to 2010. Hydrol. Earth Syst. Sci. 2013, 17, 4957–4980. [Google Scholar] [CrossRef]
- Mu, Q.; Zhao, M.; Running, S.W. MODIS global terrestrial evapotranspiration (ET) product (NASA MOD16A2/A3). Algorithm Theor. Basis Doc. Collect. 2013, 5, 381–394. [Google Scholar]
- Zhang, G.L.; Chen, X.; Zhou, Y.; Zhao, H.L.; Jin, Y.L.; Luo, Y.C.; Chen, S.Y.; Wu, X.Y.; Pan, Z.H.; An, P.L. Land use/cover changes and subsequent water budget imbalance exacerbate soil aridification in the farming-pastoral ecotone of northern China. J. Hydrol. 2023, 624, 129939. [Google Scholar] [CrossRef]
- Jiang, L.; Huang, X.; Wang, F.; Liu, Y.; An, P. Method for evaluating ecological vulnerability under climate change based on remote sensing: A case study. Ecol. Indic. 2018, 85, 479–486. [Google Scholar] [CrossRef]
- Zhou, W.C.; Liu, Z.J.; Wang, S.S. Spatiotemporal Dynamics of the Cropland Area and Its Response to Increasing Regional Extreme Weather Events in the Farming-Pastoral Ecotone of Northern China during 1992–2020. Sustainability 2023, 15, 13338. [Google Scholar] [CrossRef]
- He, L.; Li, Z.L.; Wang, X.M.; Xie, Y.W.; Ye, J.S. Lagged precipitation effect on plant productivity is influenced collectively by climate and edaphic factors in drylands. Sci. Total Environ. 2021, 755, 142506. [Google Scholar] [CrossRef]
- Sajikumar, N.; Remya, R. Impact of land cover and land use change on runoff characteristics. J. Environ. Manag. 2015, 161, 460–468. [Google Scholar] [CrossRef]
- Feng, X.R.; Zhang, T.; Feng, P.; Li, J.Z. Evaluation and tradeoff-synergy analysis of ecosystem services in Luanhe River Basin. Ecohydrology 2022, 15, e2473. [Google Scholar] [CrossRef]
- He, L.; Wang, J.; Penuelas, J.; Zohner, C.M.; Crowther, T.W.; Fu, Y.; Zhang, W.; Xiao, J.; Liu, Z.; Wang, X.; et al. Asymmetric temperature effect on leaf senescence and its control on ecosystem productivity. Proc. Natl. Acad. Sci. Nexus 2024, 3, pgae477. [Google Scholar] [CrossRef]
- Yang, B.Y.; Zhang, T.; Li, J.Z.; Feng, P.; Miao, Y.J.J. Optimal designs of LID based on LID experiments and SWMM for a small-scale community in Tianjin, north China. J. Environ. Manag. 2023, 334, 117442. [Google Scholar] [CrossRef]
- Hong, T.L.; Li, H.Y.; Chen, M.Q. Comprehensive Evaluations on the Error Characteristics of the State-of-the-Art Gridded Precipitation Products Over Jiangxi Province in 2019. Earth Space Sci. 2021, 8, e2021EA001787. [Google Scholar] [CrossRef]
- Jiang, Q.; Li, W.Y.; Fan, Z.D.; He, X.G.; Sun, W.W.; Chen, S.; Wen, J.H.; Gao, J.; Wang, J. Evaluation of the ERA5 reanalysis precipitation dataset over Chinese Mainland. J. Hydrol. 2021, 595, 125660. [Google Scholar] [CrossRef]
- Almeida, T.A.B.; Montenegro, A.A.d.A.; Mackay, R.; Montenegro, S.M.G.L.; Coelho, V.H.R.; de Carvalho, A.A.; da Silva, T.G.F. Hydrogeological trends in an alluvial valley in the Brazilian semiarid: Impacts of observed climate variables change and exploitation on groundwater availability and salinity. J. Hydrol. -Reg. Stud. 2024, 53, 101784. [Google Scholar] [CrossRef]
- Li, S.J.; Wang, G.J.; Sun, S.L.; Hagan, D.F.T.; Chen, T.X.; Dolman, H.; Liu, Y. Long-term changes in evapotranspiration over China and attribution to climatic drivers during 1980–2010. J. Hydrol. 2021, 595, 126037. [Google Scholar] [CrossRef]
- Kendall, M.G. Rank Correlation Methods; Charles Grifin: London, UK, 1975. [Google Scholar]
- Mann, H.B. Nonparametric tests against trend. Econometrica 1945, 13, 245–259. [Google Scholar] [CrossRef]
- Nandy, S.; Srinet, R.; Padalia, H. Mapping Forest Height and Aboveground Biomass by Integrating ICESat-2, Sentinel-1 and Sentinel-2 Data Using Random Forest Algorithm in Northwest Himalayan Foothills of India. Geophys. Res. Lett. 2021, 48, e2021GL093799. [Google Scholar] [CrossRef]
- Guo, X.; Xiao, J.; Zha, T.; Shang, G.; Liu, P.; Jin, C.; Zhang, Y. Dynamics and biophysical controls of nocturnal water loss in a winter wheat-summer maize rotation cropland: A multi-temporal scale analysis. Agric. For. Meteorol. 2023, 342, 109701. [Google Scholar] [CrossRef]
- Sharma, A.; Goyal, M.K. District-level assessment of the ecohydrological resilience to hydroclimatic disturbances and its controlling factors in India. J. Hydrol. 2018, 564, 1048–1057. [Google Scholar] [CrossRef]
- Sharma, A.; Goyal, M.K. Assessment of ecosystem resilience to hydroclimatic disturbances in India. Glob. Change Biol. 2018, 24, e432–e441. [Google Scholar] [CrossRef]
- Wang, X.; Ma, M.; Li, X.; Song, Y.; Tan, J.; Huang, G.; Zhang, Z.; Zhao, T.; Feng, J.; Ma, Z.; et al. Validation of MODIS-GPP product at 10 flux sites in northern China. Int. J. Remote Sens. 2013, 34, 587–599. [Google Scholar] [CrossRef]
- Liu, P.; Zha, T.S.; Jia, X.; Tian, Y.; Hao, S.R.; Li, X.H. Divergent responses of canopy and ecosystem water use efficiency to environmental conditions over a decade in a shrubland ecosystem dominated by Artemisia ordosica. Agric. For. Meteorol. 2025, 368, 110551. [Google Scholar] [CrossRef]
- Liu, P.; Zha, T.; Jia, X.; Black, T.A.; Jassal, R.S.; Ma, J.; Bai, Y.; Wu, Y. Different Effects of Spring and Summer Droughts on Ecosystem Carbon and Water Exchanges in a Semiarid Shrubland Ecosystem in Northwest China. Ecosystems 2019, 22, 1869–1885. [Google Scholar] [CrossRef]
- Dong, G.; Zhao, F.Y.; Chen, J.Q.; Qu, L.P.; Jiang, S.C.; Chen, J.Y.; Shao, C.L. Divergent forcing of water use efficiency from aridity in two meadows of the Mongolian Plateau. J. Hydrol. 2021, 593, 125799. [Google Scholar] [CrossRef]
- Ma, X.Q.; Leng, P.; Liao, Q.Y.; Geng, Y.J.; Zhang, X.; Shang, G.F.; Song, X.N.; Song, Q.; Li, Z.L. Prediction of vegetation phenology with atmospheric reanalysis over semiarid grasslands in Inner Mongolia. Sci. Total Environ. 2022, 812, 152462. [Google Scholar] [CrossRef]
- Xue, B.L.; Guo, Q.H.; Otto, A.; Xiao, J.F.; Tao, S.L.; Li, L. Global patterns, trends, and drivers of water use efficiency from 2000 to 2013. Ecosphere 2015, 6, 174. [Google Scholar] [CrossRef]
- Wang, Y.P.; Baldocchi, D.; Leuning, R.; Falge, E.; Vesala, T. Estimating parameters in a land-surface model by applying nonlinear inversion to eddy covariance flux measurements from eight FLUXNET sites. Glob. Change Biol. 2007, 13, 652–670. [Google Scholar] [CrossRef]
- Niu, S.; Xing, X.; Zhang, Z.; Xia, J.; Zhou, X.; Song, B.; Li, L.; Wan, S. Water-use efficiency in response to climate change: From leaf to ecosystem in a temperate steppe. Glob. Change Biol. 2011, 17, 1073–1082. [Google Scholar] [CrossRef]
- Cai, X.; Li, Z.; Liang, Y. Tempo-spatial changes of ecological vulnerability in the arid area based on ordered weighted average model. Ecol. Indic. 2021, 133, 108398. [Google Scholar] [CrossRef]
- Sun, S.; Song, Z.; Wu, X.; Wang, T.; Wu, Y.; Du, W.; Che, T.; Huang, C.; Zhang, X.; Ping, B.; et al. Spatio-temporal variations in water use efficiency and its drivers in China over the last three decades. Ecol. Indic. 2018, 94, 292–304. [Google Scholar] [CrossRef]
- Liu, Y.; Xiao, J.; Ju, W.; Zhou, Y.; Wang, S.; Wu, X. Water use efficiency of China’s terrestrial ecosystems and responses to drought. Sci. Rep. 2015, 5, 13799. [Google Scholar] [CrossRef]
- Peng, D.; Zhang, B.; Wu, C.; Huete, A.R.; Gonsamo, A.; Lei, L.; Ponce-Campos, G.E.; Liu, X.; Wu, Y. Country-level net primary production distribution and response to drought and land cover change. Sci. Total Environ. 2017, 574, 65–77. [Google Scholar] [CrossRef]
- Teuling, A.J.; Van Loon, A.F.; Seneviratne, S.I.; Lehner, I.; Aubinet, M.; Heinesch, B.; Bernhofer, C.; Grünwald, T.; Prasse, H.; Spank, U. Evapotranspiration amplifies European summer drought. Geophys. Res. Lett. 2013, 40, 2071–2075. [Google Scholar] [CrossRef]
- Zhao, M.; Running, S.W. Drought-Induced Reduction in Global Terrestrial Net Primary Production from 2000 Through 2009. Science 2010, 329, 940–943. [Google Scholar] [CrossRef]
- Xie, J.; Zha, T.; Zhou, C.; Jia, X.; Yu, H.; Yang, B.; Chen, J.; Zhang, F.; Wang, B.; Bourque, C.P.A.; et al. Seasonal variation in ecosystem water use efficiency in an urban-forest reserve affected by periodic drought. Agric. For. Meteorol. 2016, 221, 142–151. [Google Scholar] [CrossRef]
- Law, B.E.; Falge, E.; Gu, L.; Baldocchi, D.D.; Bakwin, P.; Berbigier, P.; Davis, K.; Dolman, A.J.; Falk, M.; Fuentes, J.D.; et al. Environmental controls over carbon dioxide and water vapor exchange of terrestrial vegetation. Agric. For. Meteorol. 2002, 113, 97–120. [Google Scholar] [CrossRef]
- Reichstein, M., Tenhunen; Valentini, R. Severe drought effects on ecosystem CO2 and H2O fluxes at three mediterranean evergreen sites: Revision of current hypotheses? Glob. Change Biol. 2002, 8, 999–1017. [Google Scholar] [CrossRef]


| No. | Data | Dataset/Product | Period | Resolution | Data Source | |
|---|---|---|---|---|---|---|
| Spatial | Temporal | |||||
| 1. | Gross primary productivity (GPP) | MODIS GPP(MOD17A2H) | 2003–2022 | 500 m | 8 days | Provider:NASA LP DAAC at the USGS EROS Center (https://lpdaac.usgs.gov/products/mod17a2hv061/ (accessed on 2 April 2025) Image collection ID:MODIS/006/MOD17/A2H) |
| 2. | Evapo-transpiration (ET) | MODIS ET (MOD16A2) | 2003–2022 | 500 m | 8 days | Provider:NASA LP DAAC at the USGS EROS Center (https://lpdaac.usgs.gov/products/mod16a2v061/ (accessed on 2 April 2025) Image collection ID:MODIS/006/MOD16/A2) |
| 3. | Leaf area index (LAI) | MODIS LAI (MOD15A2H) | 2003–2022 | 500 m | 8 days | Google Earth Engine Provider:NASA LP DAAC at the USGS EROS Center (https://lpdaac.usgs.gov/products/mod15a2hv061/ accessed on 2 April 2025) Image collection ID:MODIS/006/MOD15A2H |
| 4. | Enhanced vegetation index (EVI) | MODIS EVI (MOD13A1) | 2003–2022 | 500 m | 16 days | Provider:NASA LP DAAC at the USGS EROS Center (https://lpdaac.usgs.gov/products/mod13a1v061/) (accessed on 2 April 2025) Image collection ID:MODIS/006/MOD13A1) |
| 5. | Rainfall | Climate Hazards Group Infrared Precipitation with Station (CHIRPS) monthly averaged data | 2003–2022 | 0.05 degree | Provider: Climate Hazards Center-UC SANTA BARBARA (https://www.chc.ucsb.edu/data/chirps (accessed on 2 April 2025) Index of /products/CHIRPS-2.0/) Image collection ID: Image collection ID: UCSB-CHG/CHIRPS/MONTHLY) | |
| 6. | Temperature | ERA-5 Land monthly averaged data 2 m temperature | 2003–2022 | 0.1 degree | Monthly | Provider:Climate data store (https://cds.climate.copernicus.eu/datasets/reanalysis-era5-land-monthly-means?tab=overview (accessed on 2 April 2025) Image collection ID:ECMWF/ERA5 LAND MONTHLY) |
| 7. | Soil moisture | ERA-5 Land monthly averaged data-volumetric soil water content (VSWC) (0–7 cm depth) | 2003–2022 | |||
| 8. | Net radiation | ERA-5 Land monthly averaged data-resultant of the surface net solar and thermal radiation data | 2003–2022 | |||
| 9. | Vapor pressure deficit (VPD) | TerraClimate: Monthly Climate and Climatic Water balance for global terrestrial surfaces VPD | 2003–2022 | 2.5 arc minutes | Monthly | Provider:Terraclimate (https://climatedataguide.ucar.edu/climate-data/terraclimate-global-high-resolution-gridded-temperature-precipitation-and-other-water (accessed on 2 April 2025) mage collection ID:IDAHO EPSCOR TERRACLIMATE) |
| 10 | Land use classes | MODIS Land Cover Type MCD12Q1 | 2022 | 500 m | Annual | Provider:NASA LP DAAC at the USGS EROS Center (https://lpdaac.usgs.gov/products/mcd12q1v061/ (accessed on 2 April 2025)) |
| 11 | Stardardized precipitation evapotranspiration (SPEI) | 2003–2022 | 0.5° | Annual | Provider: Global SPEI database (http://spei.csic.es/database.html (accessed on 2 April 2025)) | |
| Vegetation Types | EVI | LAI | Temp | PPT | Rn | VSWC | VPD | WUE |
|---|---|---|---|---|---|---|---|---|
| m2 m−2 | °C | mm | W m−2 | m3 m−3 | kPa | gC H2O−1 | ||
| WSA | 0.24 | 12.41 | 5.55 | 527.54 | 228.41 | 0.31 | 0.63 | 1.39 ± 0.08 |
| SAV | 0.26 | 12.22 | 5.59 | 527.17 | 225.90 | 0.31 | 0.67 | 1.2 ± 0.07 |
| MF | 0.26 | 17.02 | 6.38 | 529.65 | 234.15 | 0.31 | 0.58 | 1.61 ± 0.10 |
| OSH | 0.14 | 2.57 | 8.06 | 407.37 | 212.14 | 0.12 | 0.84 | 1.08 ± 0.18 |
| GRA | 0.17 | 4.82 | 6.21 | 454.63 | 225.91 | 0.25 | 0.73 | 1.16 ± 0.11 |
| ENF | 0.24 | 12.60 | 7.25 | 487.98 | 236.59 | 0.27 | 0.69 | 1.87 ± 0.12 |
| DNF | 0.20 | 11.98 | 2.35 | 529.07 | 208.03 | 0.33 | 0.48 | 1.16 ± 0.14 |
| DBF | 0.27 | 16.49 | 5.17 | 523.24 | 225.54 | 0.15 | 0.64 | 1.28 ± 0.09 |
| CSH | 0.26 | 15.05 | 7.30 | 556.96 | 230.27 | 0.30 | 0.72 | 1.38 ± 0.11 |
| CRO | 0.20 | 6.84 | 6.27 | 483.98 | 215.11 | 0.28 | 0.67 | 1.30 ± 0.12 |
| FPENC | 0.23 | 11.20 | 6.01 | 502.76 | 224.21 | 0.26 | 0.67 | 1.32 ± 0.11 |
Disclaimer/Publisher’s Note: The statements, opinions and data contained in all publications are solely those of the individual author(s) and contributor(s) and not of MDPI and/or the editor(s). MDPI and/or the editor(s) disclaim responsibility for any injury to people or property resulting from any ideas, methods, instructions or products referred to in the content. |
© 2025 by the authors. Licensee MDPI, Basel, Switzerland. This article is an open access article distributed under the terms and conditions of the Creative Commons Attribution (CC BY) license (https://creativecommons.org/licenses/by/4.0/).
Share and Cite
Guo, X.; Wu, M.; Shen, Z.; Shang, G.; Ma, Q.; Li, H.; He, L.; Li, Z.-L. Twenty-Year Variability in Water Use Efficiency over the Farming–Pastoral Ecotone of Northern China: Driving Force and Resilience to Drought. Agriculture 2025, 15, 1164. https://doi.org/10.3390/agriculture15111164
Guo X, Wu M, Shen Z, Shang G, Ma Q, Li H, He L, Li Z-L. Twenty-Year Variability in Water Use Efficiency over the Farming–Pastoral Ecotone of Northern China: Driving Force and Resilience to Drought. Agriculture. 2025; 15(11):1164. https://doi.org/10.3390/agriculture15111164
Chicago/Turabian StyleGuo, Xiaonan, Meng Wu, Zhijun Shen, Guofei Shang, Qingtao Ma, Hongyu Li, Lei He, and Zhao-Liang Li. 2025. "Twenty-Year Variability in Water Use Efficiency over the Farming–Pastoral Ecotone of Northern China: Driving Force and Resilience to Drought" Agriculture 15, no. 11: 1164. https://doi.org/10.3390/agriculture15111164
APA StyleGuo, X., Wu, M., Shen, Z., Shang, G., Ma, Q., Li, H., He, L., & Li, Z.-L. (2025). Twenty-Year Variability in Water Use Efficiency over the Farming–Pastoral Ecotone of Northern China: Driving Force and Resilience to Drought. Agriculture, 15(11), 1164. https://doi.org/10.3390/agriculture15111164