Article

Impact of High Temperature on Germination, Seedling Growth and Enzymatic Activity of Wheat

1
Department of Seed Science and Technology, Chaudhary Charan Singh Haryana Agricultural University, Hisar 125004, Haryana, India
2
Department of Genetics and Plant Breeding, Chaudhary Charan Singh Haryana Agricultural University, Hisar 125004, Haryana, India
3
Agricultural Research Station (S.K.N. Agriculture University, Jobner), Sikar 332301, Rajasthan, India
4
Department of Biotechnology, Maharishi Markandeshwar University, Mullana, Ambala 133207, Haryana, India
5
Department of Agrometeorology, Chaudhary Charan Singh Haryana Agricultural University, Hisar 125004, Haryana, India
6
Department of Molecular Biology, Biotechnology and Bioinformatics, Chaudhary Charan Singh Haryana Agricultural University, Hisar 125004, Haryana, India
7
Krishi Vigyan Kendra (Chaudhary Charan Singh Haryana Agricultural University, Hisar), Fatehabad 125050, Haryana, India
*
Author to whom correspondence should be addressed.
Agriculture 2022, 12(9), 1500; https://doi.org/10.3390/agriculture12091500
Submission received: 29 June 2022 / Revised: 29 August 2022 / Accepted: 13 September 2022 / Published: 19 September 2022
(This article belongs to the Special Issue High Yield Cultivation, Growth and Development Mechanism of Wheat)

Abstract

:
Global warming has increased the temperature significantly over a large extent both spatially and temporally. The threat of heat stress during the germination and seedling establishment stages in the wheat crop is now more prevalent than ever before. The present experiment assessed the effect of elevated temperature on the germination and early seedling growth of wheat genotypes. The seeds were sown under four temperatures, viz., 20 °C, 25 °C, 30 °C and 35 °C; the germination, seedling vigor and enzyme activities in 8-day-old seedlings were assessed. The temperature significantly influenced germination and early seedling growth. The germination percentage at 20 and 25 °C was statistically on par with and higher than at 30 and 35 °C. The seedling vigor parameters were maximum at 25 °C and showed a reduction at higher temperatures. Genotypic differences were observed for early heat stress as the genotypes WH 730, WH 1123 and HD 2967 showed tolerance towards heat stress during germination, whereas the genotypes PBW 725 and WH 1105 were susceptible. Antioxidant enzyme activities in seedlings increased with the rise in temperature. Catalase, peroxidase and superoxide dismutase enzymes showed increased activities at higher temperature levels.

1. Introduction

Securing the availability of food to every person in the world is a big challenge, and the present-day situation of the climate means that this task is far more challenging. After 1950, a number of changes have been observed with respect to various weather and climate events, and the quantum of these fluctuations accelerated in recent times. Among these changes, the most prominent phenomenon is the constantly rising ambient temperature globally, which is generally termed ‘Global warming’. There has been a trend of a general increase in the prevalence of warmer days and nights with a reduced number of colder ones on a global scale [1]. The atmospheric heat resulting from global warming is posing a threat to crop growth and productivity.
Wheat, the cereal food for the majority of the world’s population, is a member of the family Poaceae [2]. Wheat alone provides more than 20% of the calories and protein for the world’s population [3]. As the global population is continuously increasing, it is more than sure that there will be a rise in the demand for wheat to fulfill the food requirements. The estimates show that the world’s population will reach 9.6 billion by 2050, and, therefore, wheat production and its availability to people will be the centerpiece of food security and the global economy in the near future [4]. Wheat as a temperate crop is facing the challenge of heat stress in the Indian peninsula more than any other type of abiotic stress. Year by year, the risk of the occurrence of high-temperature periods during the wheat growing season is increasing due to uncertainty in the climatic pattern. The ramifications of changing climate are recognized extensively all over the Indian subcontinent, but the region of the Gangetic plains is the most affected one. In these plains, the winter season became shorter, and the phenomenon of warming during the months of February and March will become the new normal [5], and now, the instances of higher temperature conditions during the early sowing season are also increasing due to uncertain climate events. The threat of increasing temperature on wheat production in India was first observed in the early 1930s [6]. The alarming conditions of high temperature (heat) stress and its significance in limiting the productivity of wheat in India were clearly visible in his statement, i.e., ‘Wheat growing in India is a gamble in temperature’. This statement becomes more compelling in present-day circumstances.
Terminal heat stress has been widely identified and studied in wheat, but the ramifications of heat stress are now prevailing on a larger spatial and temporal extent, and both are not mutually exclusive. Therefore, the problem of a hotter environment can affect crop plants at any stage of their life cycle. The adverse effects of heat stress on seed germination and stand establishment were studied in many crops, including wheat [7,8]. Rapid and uniform field emergence is essential to achieve better growth and higher yield. The optimal temperature favors a good aptitude to germinate, whereas low and high temperatures result in the delay of germination and a majority of genotypes are unable to bear temperature stress [9]. The germination percentage of wheat seeds is affected by non-optimal temperatures, i.e., too low and too high temperatures [10]. If the temperature of the seed zone increases beyond the optimum, it initially results in an increased seed germination rate but on a further increase in temperature, seed germination is reduced [11]. Keeping in view the fact that the stage of germination has critical importance in crop establishment and its successful production, the present study was designed to evaluate the effect of early heat stress on germination and subsequent seedling growth parameters in some of the most popular genotypes of wheat cultivated in India.

2. Materials and Methods

2.1. Seed Material

The seed material comprising twelve Indian bread wheat (Triticum aestivum) varieties/genotypes was obtained from the Wheat and Barley Section, Department of Genetics and Plant Breeding, Chaudhary Charan Singh Haryana Agricultural University, Hisar. These genotypes were selected on the basis of their diverse genetic backgrounds. Initially, these genotypes were chosen on the basis of their adaptability to terminal heat stress. Details of the genotypes used in the study are given in Table 1. The initial germination of all the genotypes was above 90%, and the initial seed moisture content (SMC) ranged from 8.90% to 9.40%. The seeds were stored under ambient conditions prior to the experiment.

2.2. Experimentation

The experiments were conducted in the Seed Testing Laboratory, Department of Seed Science and Technology, CCS Haryana Agricultural University, Hisar, Haryana, India. All the experiments were conducted for two successive years, and fresh seeds were used each year. Experiments were laid out in a completely randomized design with three replications.
For recording the standard germination and seedling-related traits, the between-paper method [12] was adopted. One hundred healthy, unbroken seeds of each genotype were taken and placed equidistantly in between two sufficiently moistenedtowel papers. These towel papers were then rolled and covered with a layer of wax paper to avoid moisture loss and kept on steel racks in growth chambers maintained at 20 °C, 25 °C, 30 °C and 35 °C with 12 h light and 12 h dark conditions for 8 days.
For the assessment of the speed of germination, the top-of-the-paper method [12] was adopted. Fifty seeds were placed on moistened filter paper in Petri plates and kept in the germinators under the same experimental conditions for 8 days. The relative humidity during the course of experiments was maintained at 90 ± 2%. The experiments were laid out in a completely randomized design in a factorial arrangement and replicated thrice during both years.

2.3. Observations Recorded

The final count of germination was taken on the eighth day, and the normal seedlings were considered for percent germination [12], and the values were expressed in percentages. The newly emerged radicals of germinated seeds were counted on a daily basis. The speed of germination was calculated based on the formula given by Maguire [13], as follows, and is expressed as numbers as it is a unitless index.
Speed   of   germination = X 1 Y 1 + X 2 X 1 Y 2 + + Xn Xn 1 Yn
where,
X1, X2 and Xn = number of seeds germinated on the first, second and nth day, respectively.
Y1, Y2 and Yn= number of days from sowing to first, second and nth count, respectively.
Thirty seedlings were randomly selected from the between-paper samples, and their shoot and root lengths were measured at 8 days after sowing (DAS). The average of the 30 seedlings was taken for the final calculation. The fresh weight of seedlings from each replicate was also recorded immediately. For the estimation of dry weight, the seedlings whose fresh weight was recorded were dried in a hot air oven for 24 h at 80 ± 1 °C. The dried seedlings of each replication were weighed, and the dry weight of single seedling was calculated by taking the average for each and expressed in milligrams. Percent dry weight was also calculated by taking average fresh and dry weights. The seedling vigor index-I and vigor index-II were calculated by the formula given by Abdul-Baki and Anderson [14] and expressed as a whole number.
Vigor Index-I = Standard germination (%) × Average seedling length (cm).
Vigor Index-II = Standard germination (%) × Average seedling dry weight (mg).
For the determination of the activities of different enzymes, 1 g of plant tissue was taken from 8-day-old seedlings of ‘between-paper’ samples. Biological samples (leaf tissue) were taken in three replicates for the preparation of enzyme extracts. These extracts were used for all the enzyme assays. All the steps of extraction were carried out at 0–4 °C. The supernatant was prepared using the standard procedure and carefully decanted and used as the crude enzyme preparation. Superoxide dismutase enzyme (SOD) was assayed by measuring its ability to inhibit the photochemical reduction of nitrobluetetrazoliumm (NBT) [15]. For the estimation of kinetic and regulatory properties, the enzyme activity was calculated and expressed in terms of unit g−1 fresh weight [16]. The activity of the catalase (CAT) enzyme was measured by a slightly modified method of Sinha [17]. The activity of the Peroxidase (POX) enzyme was assayed by determining the rate of guaiacol oxidation in the presence of H2O2 at 470 nm [18].

2.4. Statistical Analysis

The data from both years were subjected to pooled analyses and presented as the mean value with standard error (error bars) of three replicates in the graphical form. All the data were analyzed in Completely Randomized Design (CRD) using STAR 5.1: Statistical Tool for Agricultural Research of International Rice Research Institute (IRRI). Two-way ANOVA was used to detect the effect of temperature and genotype on different seed germination parameters. All the graphs were prepared using SigmaPlot 12.0. The least significant difference (LSD) test was used at the 0.05 probability level to check the difference between different treatments.

3. Results

3.1. Analysis of Variance

The analysis of variance (ANOVA) of different traits under the study showed significant effects of both the factors (temperature and genotype) and their interaction (Table 2).

3.2. Germination Characteristics

The initial germination percentage of all the genotypes was above the Indian Minimum Seed Certification Standards (IMSCS). Germination at different temperature levels showed distinct patterns, with a higher germination percentage at 20 °C and 25 °C and a minimum at 35 °C (Table 3). At higher temperatures, i.e., 30 °C and 35 °C, the genotypes differed significantly (Figure 1 and Table S1), and the range was also higher as compared to lower temperatures (Figure S1). Genotypes, viz., WH 730, WH 1123, EC 277134 and HD 2967 had more than 90% germination, even at 35 °C; for PBW 725, WH 1105 and DBW 88, it was reduced to less than 80% (Figure 1 and Table S1). Among the genotypes under study, the highest germination percentage (98.5%) was recorded in WH 1123 and WH 1021 at 20 °C and in the genotype WH 711 at 25 °C, whereas it was lowest for PBW 725 (72.0%) at 35 °C (Table S1).
The germination speed was significantly different at each level of temperature (Table 3). A temperature pattern of maximum at 25 °C, followed by 20 °C, 30 °C and a minimum at 35 °C was observed. The interaction between temperature and genotype was also significant for the speed of germination (Table 2). The interaction indicated that HD 2967 had the fastest germination speed at all the temperature levels, while the genotype EC 277134 showed minimum speed at 25 °C, 30 °C and 35 °C. At 20 °C, IC 443661 had a minimum speed of germination (Figure 1 and Table S1). On overall analysis, HD 2967 showed the maximum speed of germination followed by DBW 88 and PBW 725, while EC 277134 germinated with the slowest speed preceded by IC 443661 (Table 3).

3.3. Seedling Growth and Vigor

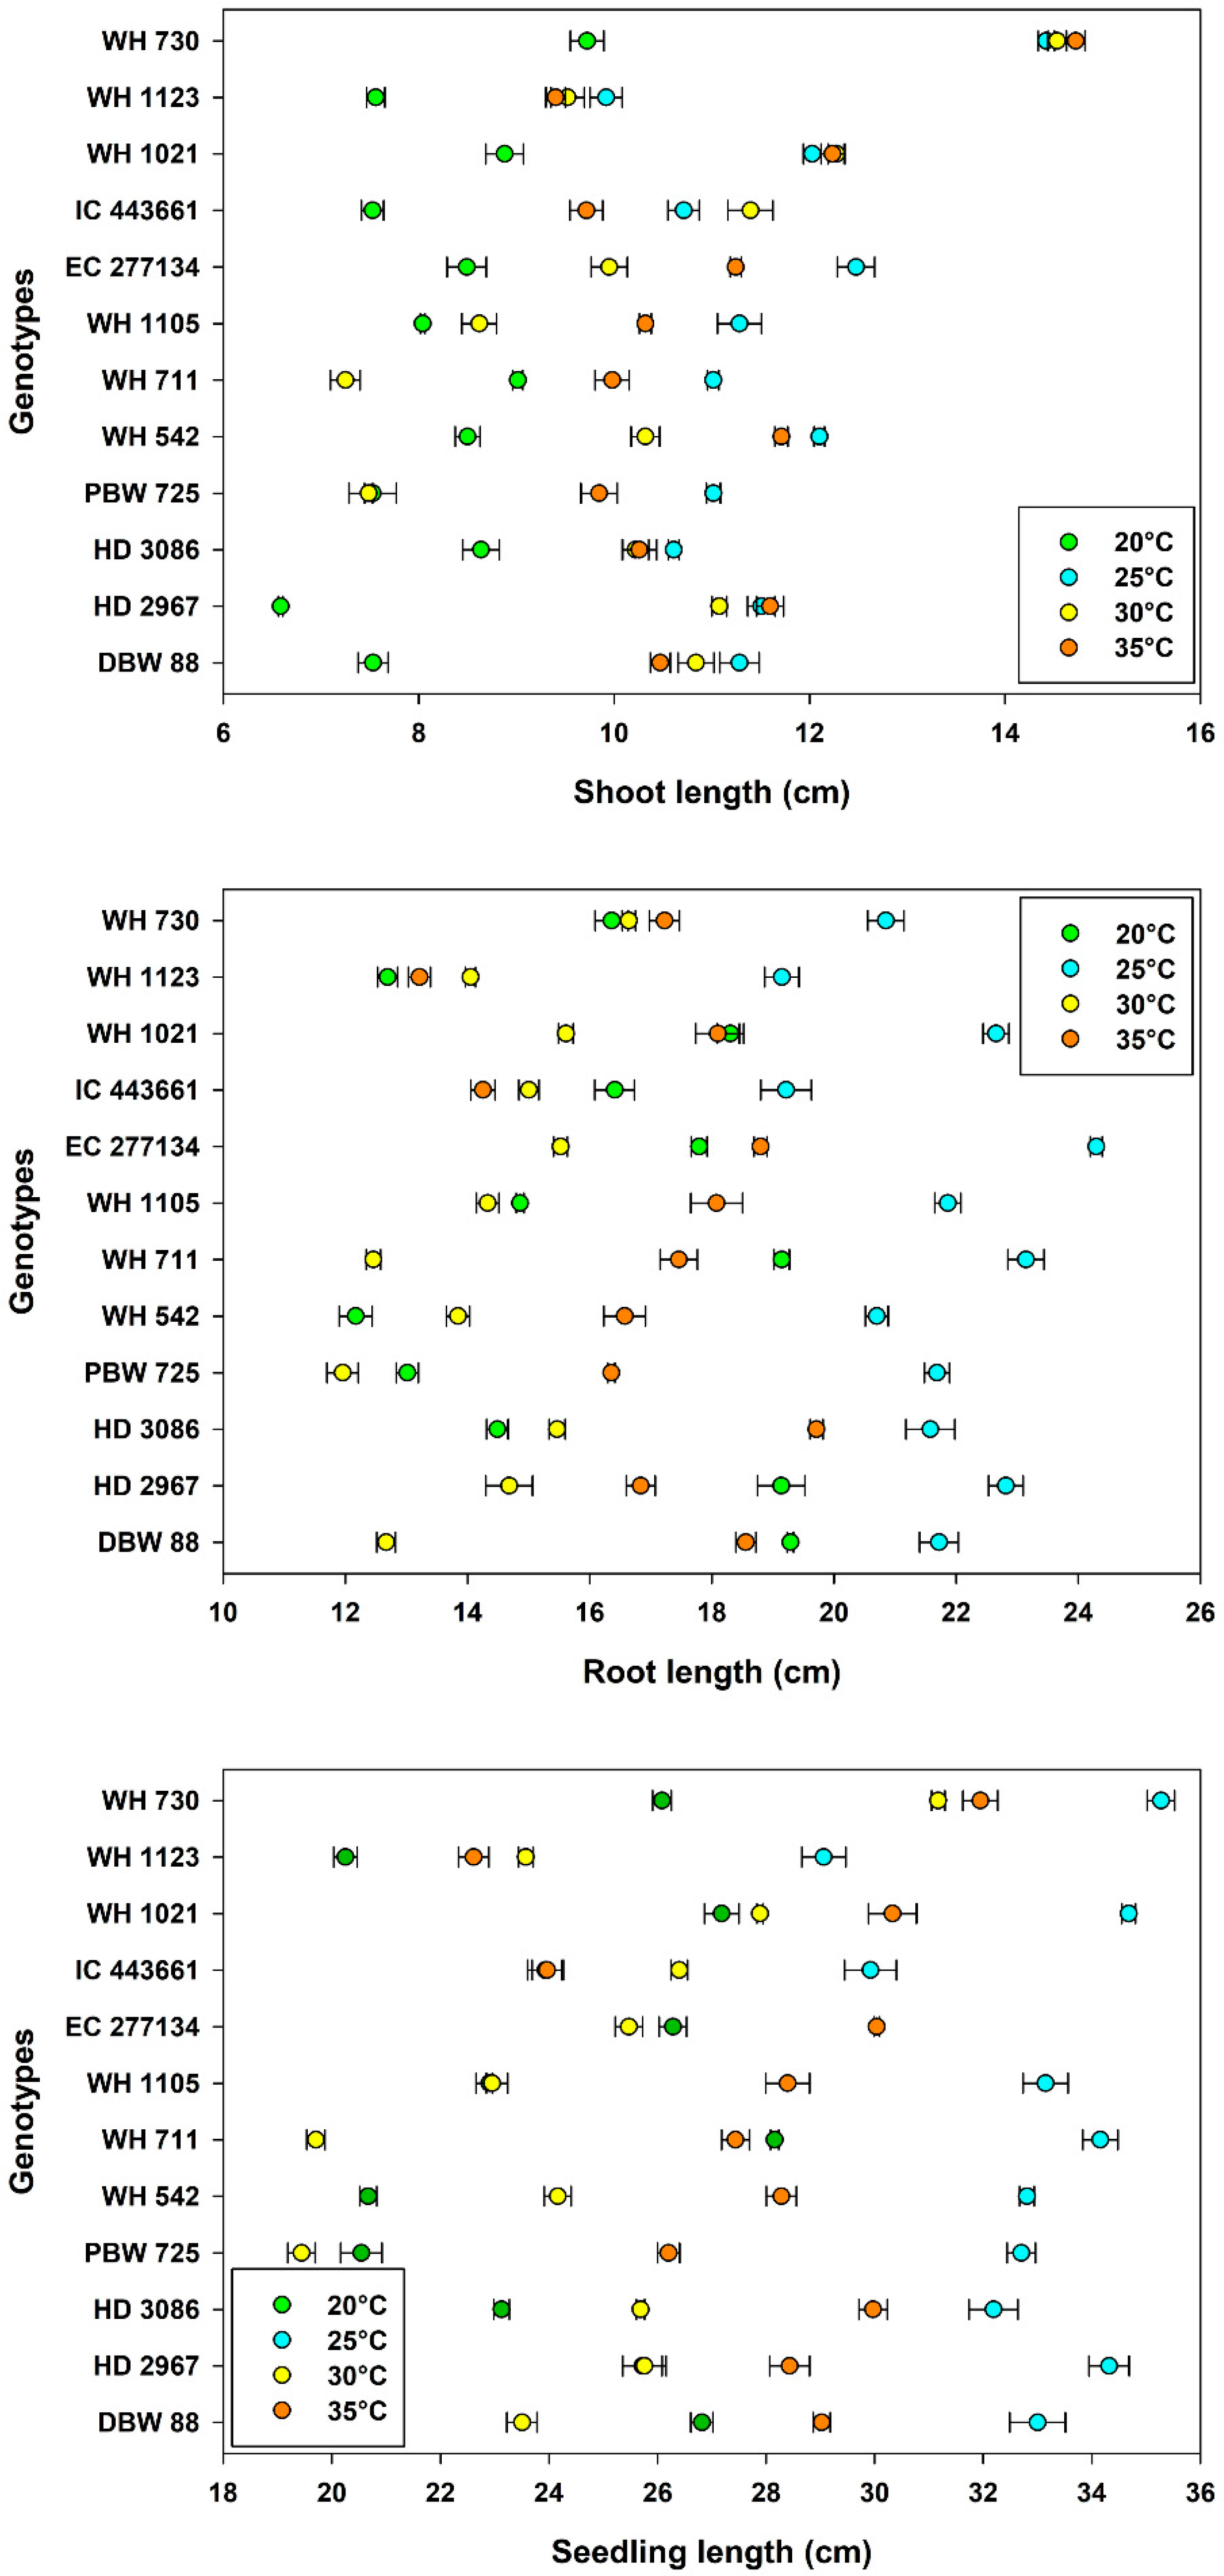
For shoot length, seedling length and seedling fresh weight, the sequence of temperature effect was 25 °C > 35 °C > 30 °C > 20 °C (Table 3 and Table 4); for root length, the sequence changed to 25 °C > 35 °C > 20 °C > 30 °C (Table 3). For the shoot and root length of seedlings, the genotypes followed a similar pattern except for the minimum lengths.
On comparing the seedlings, genotype WH 730 produced the longest shoots at all the temperature levels, while shoot length was minimum for the genotypes HD 2967 at 20 °C, WH 711 at 30 °C and WH 1123 at 25 °C and 35 °C. The significant interaction between temperature and genotypes (Table 2) indicated a differential response of genotypes under different temperature treatments for the shoot and root lengths (Figure 2 and Table S2). The genotypes DBW 88 (19.3 cm), EC 277134 (24.3 cm), WH 730 (16.6 cm) and HD 3086 (19.7 cm) had longer root lengths at temperatures from 20 °C to 35 °C, respectively (Figure 2 and Table S2). The genotype WH 1123 had smaller root lengths at 25 °C (19.2 cm) and 35 °C (13.2 cm).
In the effect of temperature on the seedling (shoot + root) length, the trend was similar to that of shoot length. Among the genotypes, WH 1123 had the shortest seedlings at 20 °C, 25 °C and 35 °C, whereas genotypes WH 711 and EC 277134 produced longer seedlings at 20 °C and 25 °C. The genotype WH 730 performed better than other genotypes in terms of seedling growth at higher temperatures and produced the longest seedlings at 30 °C (31.2 cm) and 35 °C (32.0 cm) (Figure 2 and Table S2).
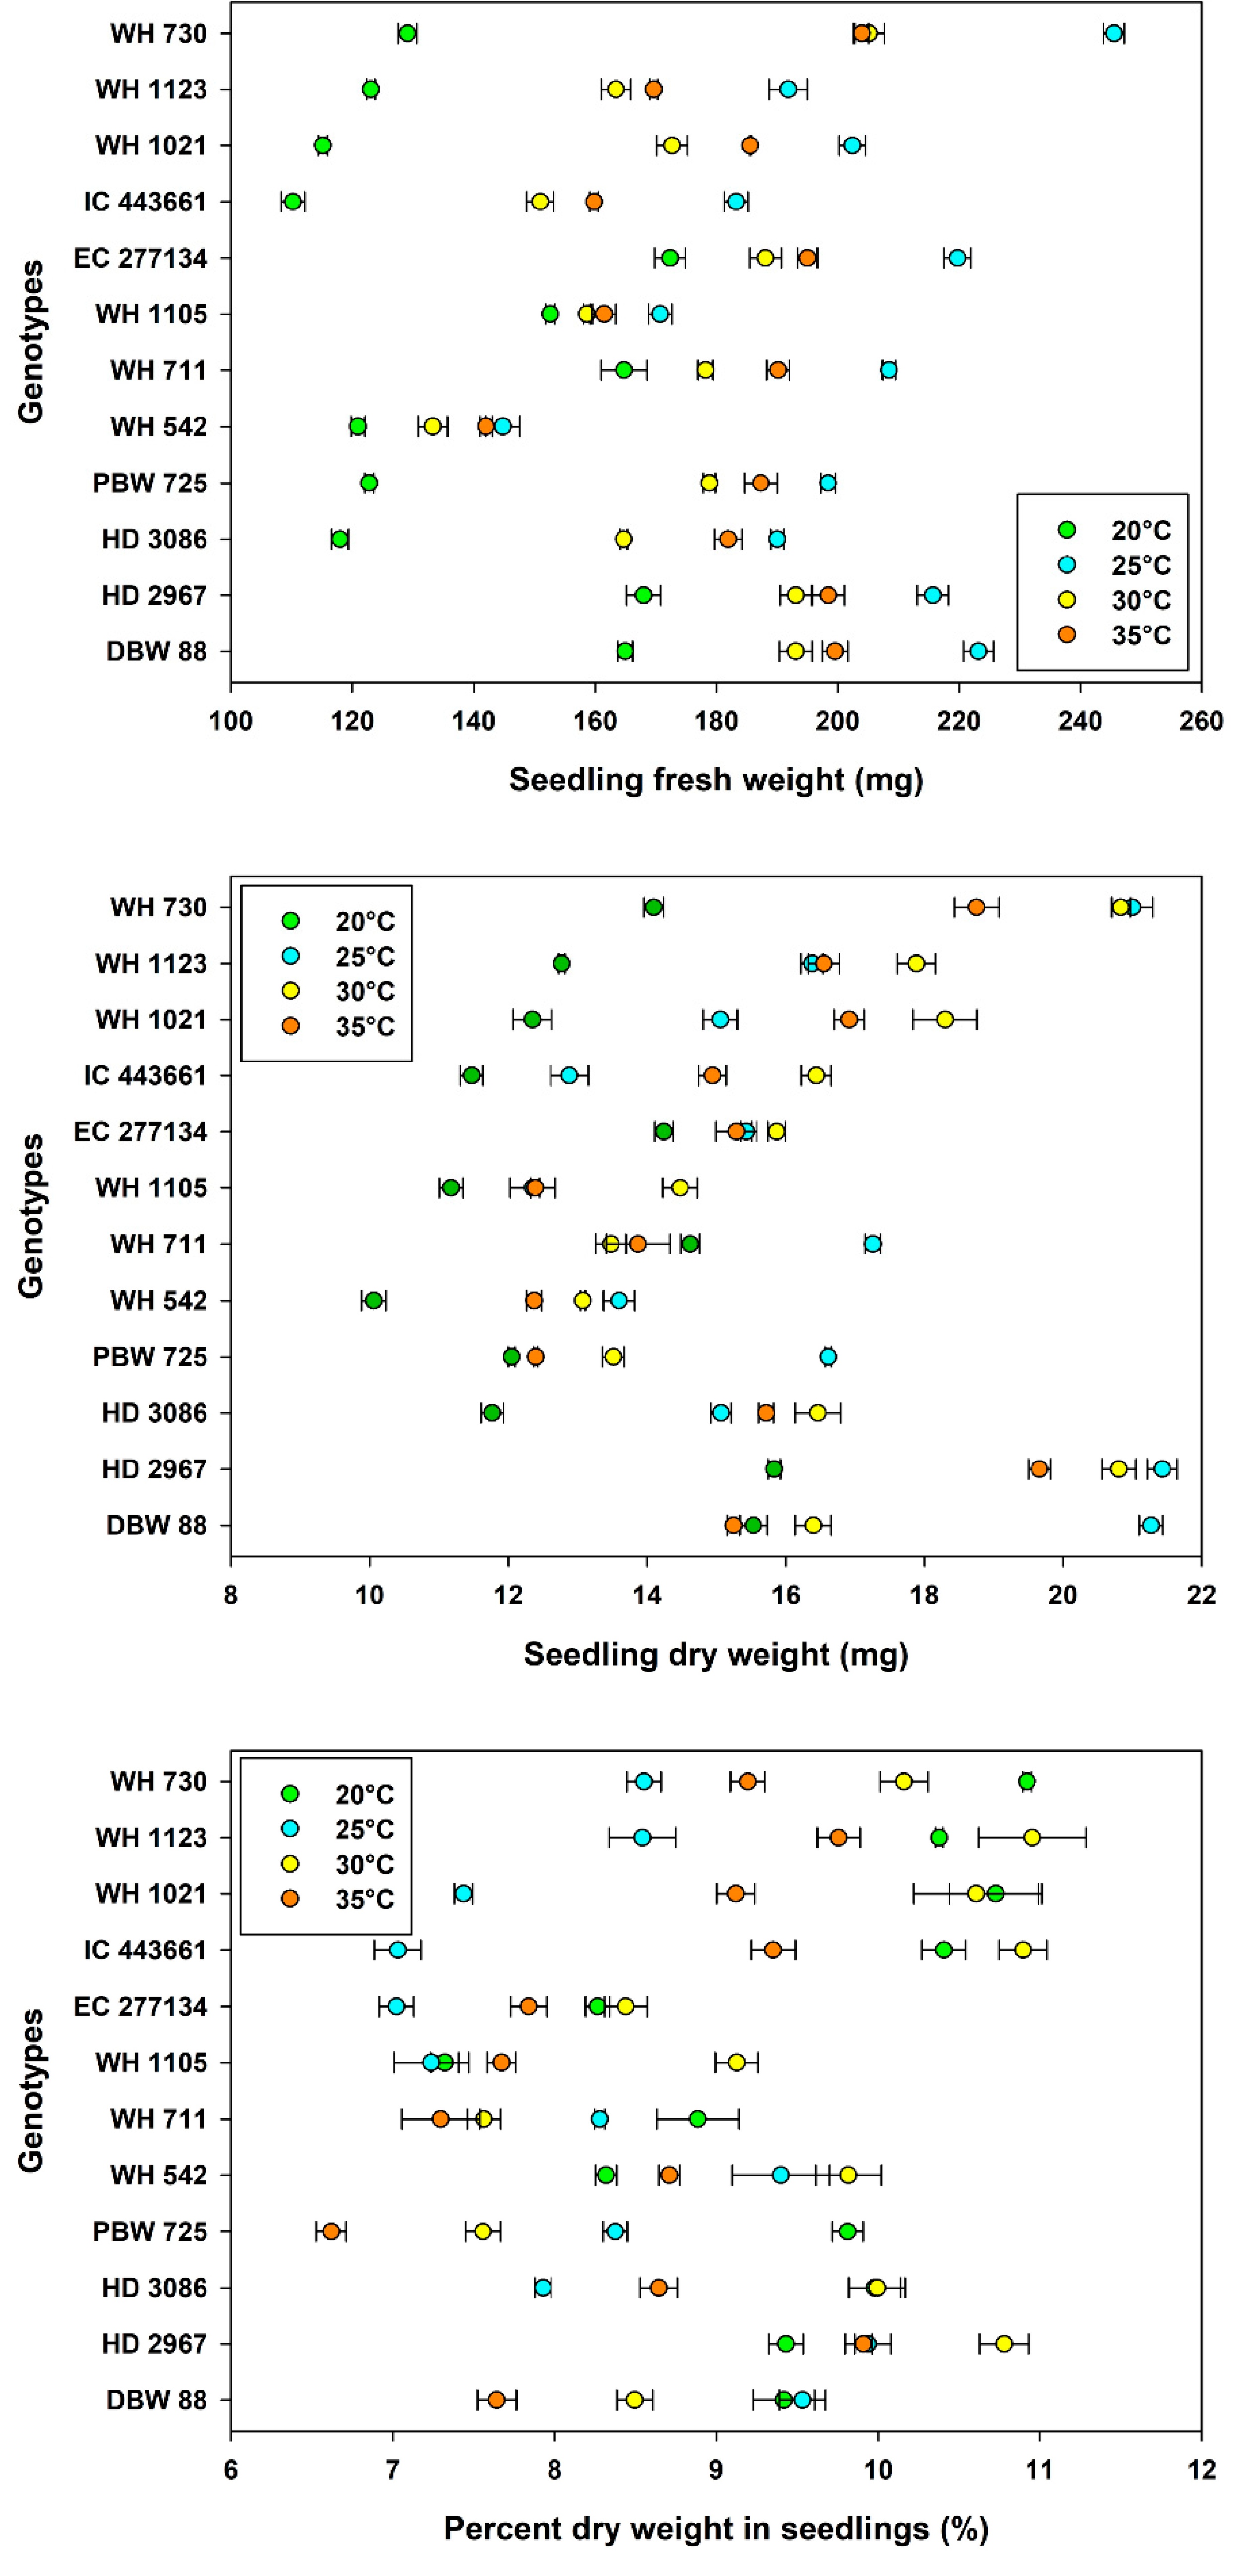
The range of values widened for seedling fresh weight accumulation among the genotypes. Genotypes EC 277134, HD 2967 and DBW 88 had the highest and statistically equal fresh weight values (Table 4). Among all the genotypes, WH 730 was better at temperatures higher than 20 °C and had maximum fresh weights at 25 °C (246 mg), 30 °C (205 mg) and 35 °C (204 mg), while WH 542 accumulated lower fresh weight at 25 °C, 30 °C and 35 °C in comparison to the 20 °C level (Figure 3 and Table S3). The trend for seedling dry weight in genotypes was 25 °C > 30 °C > 35 °C > 20 °C (Table 4). HD 2967 had maximum dry weight accumulation among all the genotypes at 20 °C, 25 °C and 35 °C. The seedlings of WH 542 had the lowest dry weight among all the genotypes at 20 °C, 30 °C and 35 °C (Figure 3 and Table S3). The percent dry weight in seedlings also showed significant differences among temperatures and genotypes (Table 2). Over the temperatures, genotypes HD 2967, WH 1123 and WH 730 had higher percent dry weights than other genotypes, and these three were statistically on par (Table 4). Most of the genotypes were recorded with lower percent dry weight at 25 °C and higher values at 30 °C (Figure 3 and Table S3).
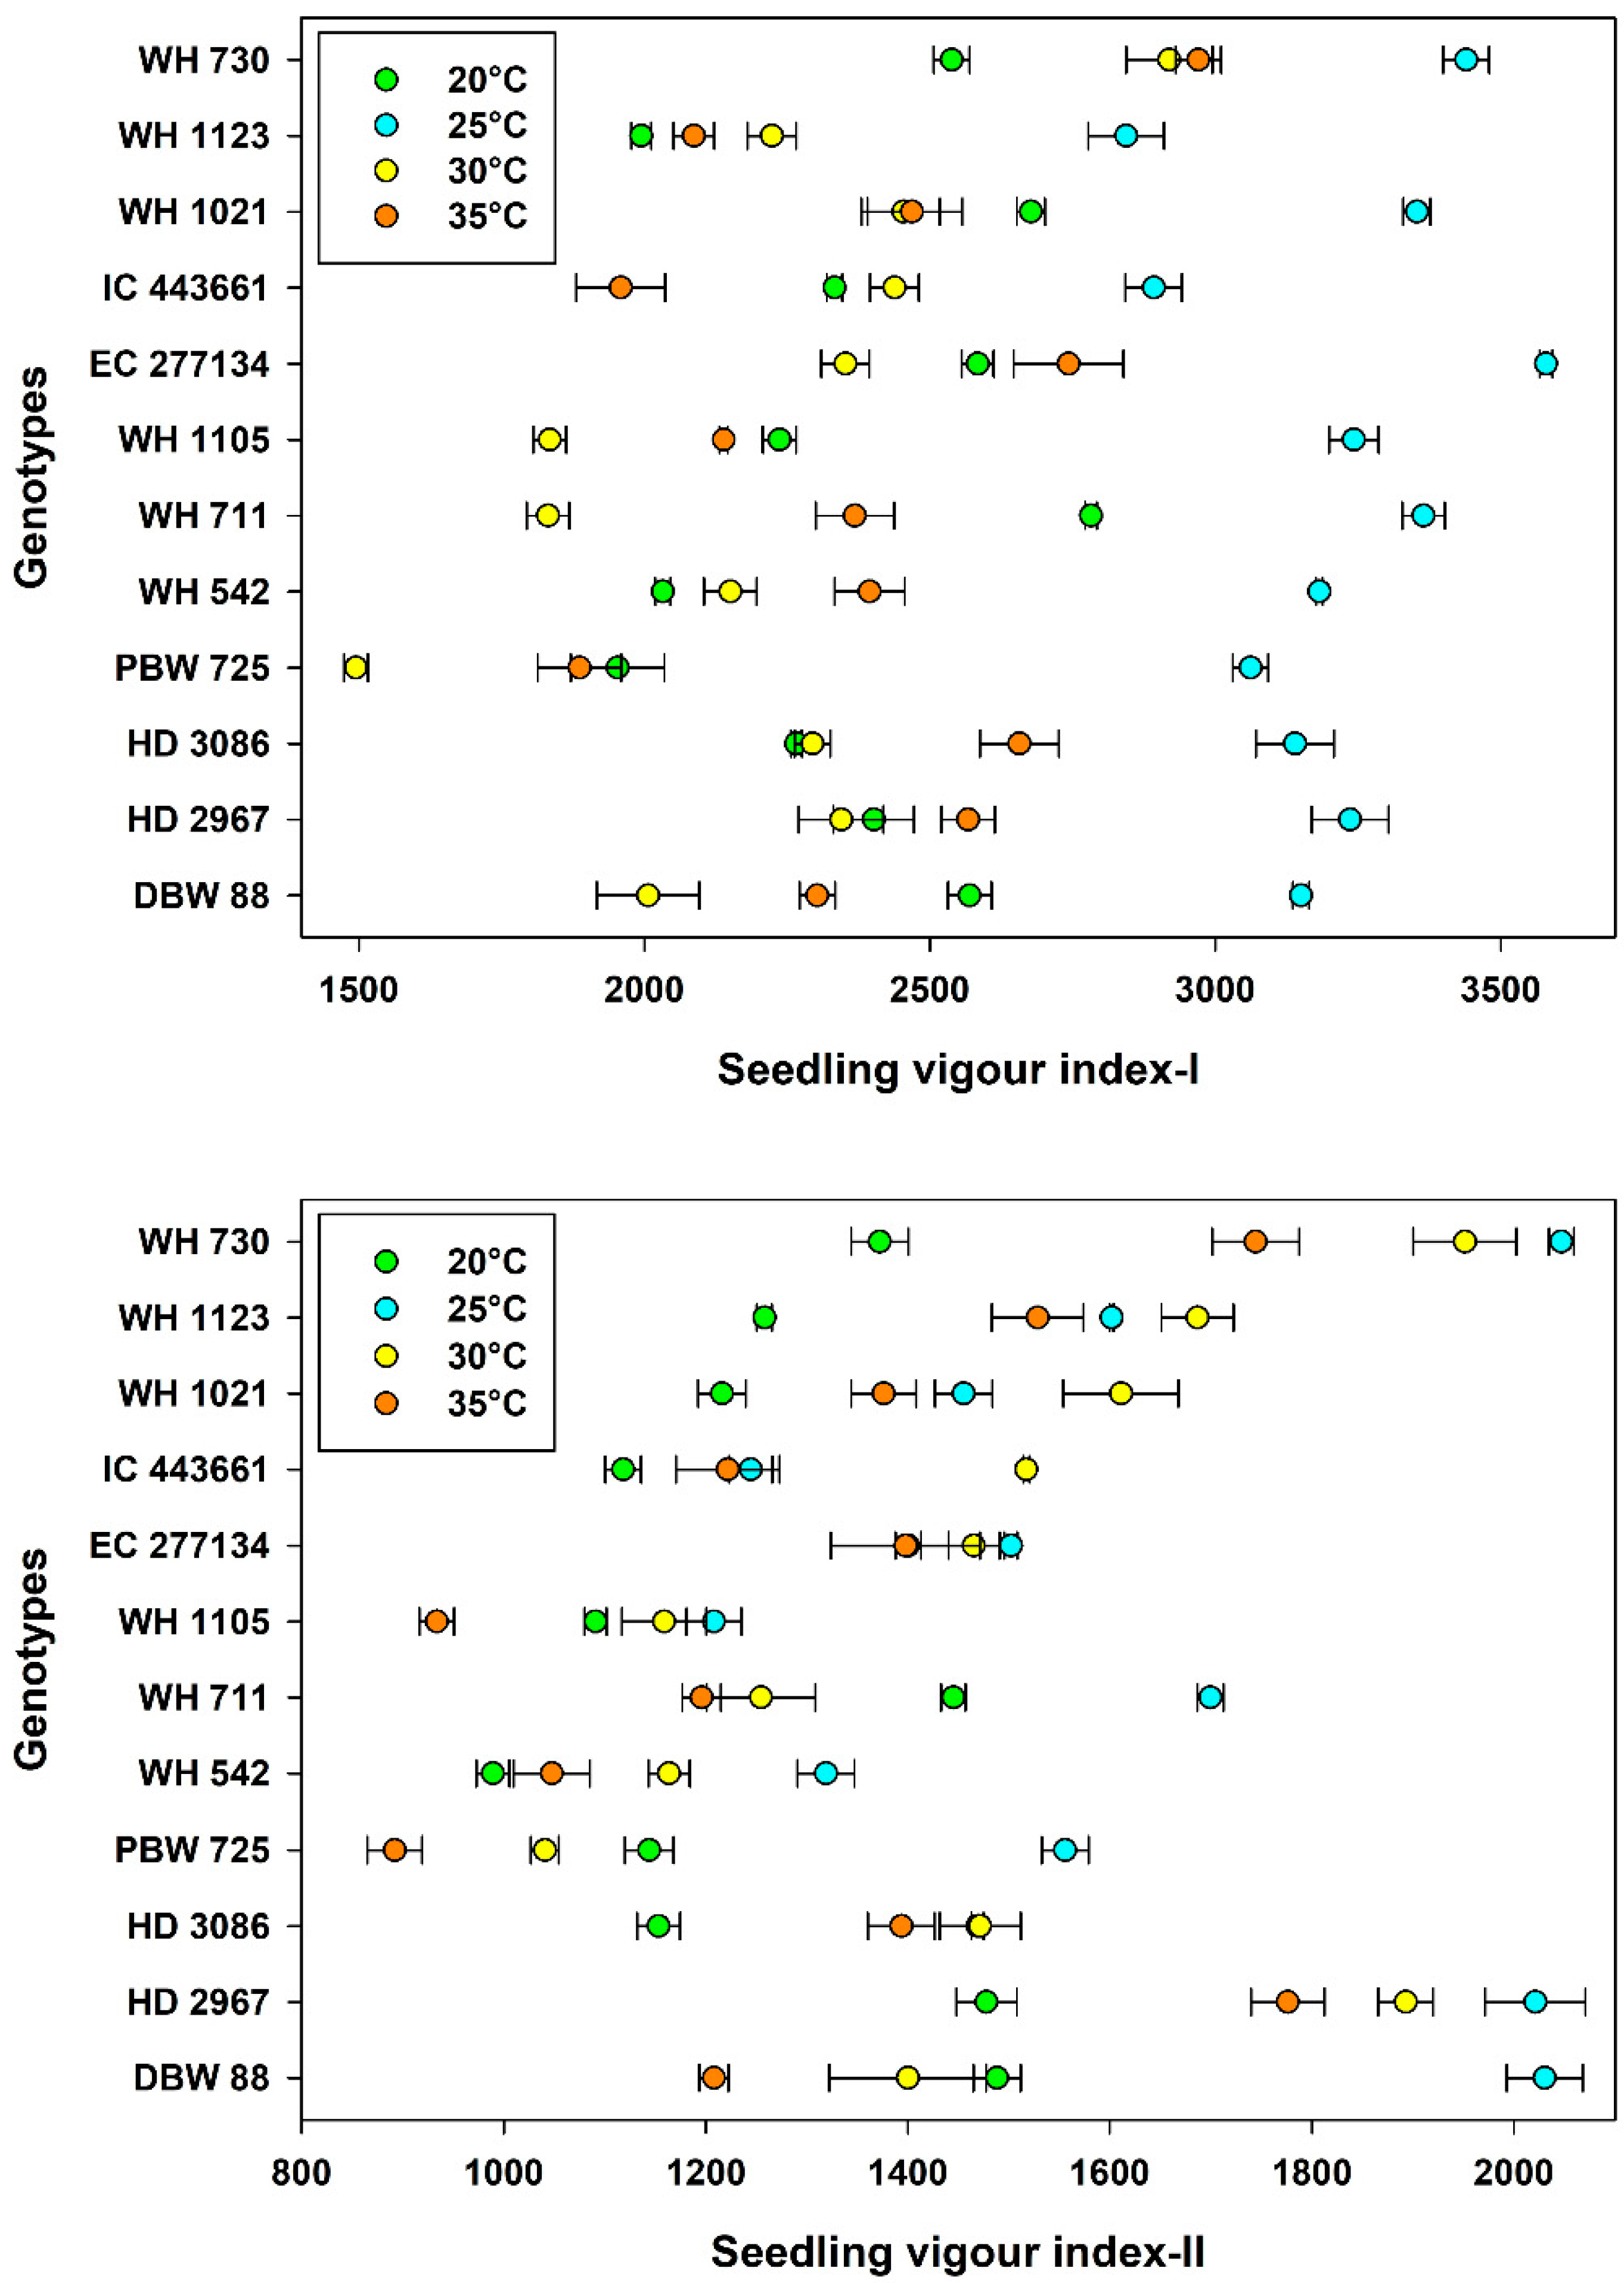
Data pertaining to vigor index-I and -II showed that most vigorous seedlings were obtained at 25 °C. The vigor index-I was minimized at 30 °C, while Vigor index-II had minimum values at 20 °C (Table 5). For both of the indices, the genotypes WH 730, DBW 88 and HD 2967 had the maximum values, and the indices were minimum for genotype WH 542 (Table 5). Interaction between temperature and genotype showed that at temperatures of 20 °C and 25 °C, genotypes WH 711 and EC 277134 performed better, respectively (Figure 4 and Table S4), while the genotype WH 730 performed better than all other genotypes at higher temperatures, i.e., 30 °C and 35 °C (Figure 4 and Table S4).

3.4. Antioxidant Enzymes

The significant influence of temperature and genotypes on enzymatic activity was observed in the wheat seedlings (Table 2). The activity of all the studied enzymes elevated with the rise in temperature. The activity of three enzymes (CAT, POX and SOD) was lowest at 20 °C. However, the highest activity of enzymes POX was at 25 °C, SOD at 30 °C and CAT at 35 °C (Table 5).
Higher CAT activity was observed in the genotypes EC 277134, PBW 725 and HD 2967, while it was low in WH 1021 and IC 443661 (Table 5). The activity of POX and SOD was higher in the genotypes HD 2967, IC 443661 and EC 277,134 and lower in WH 730, WH 711 and WH 542 (Table 5). The interaction between temperature and genotype was also significant for all three enzymes (Table 2). The interaction effect indicated that the genotype PBW 725 had higher CAT activity at all of the temperatures (Figure 5 and Table S5). For POX, the genotypes WH 1105 and PBW 725 had higher activity at lower temperatures but a drastic reduction at higher temperatures. The genotype WH 1123 had lower activity of POX and SOD at 20 °C, but at higher temperatures, the genotype had higher activity than most of the genotypes. The genotype HD 2967 had higher SOD activity across the temperature levels (Figure 5 and Table S5).

3.5. Principal Component Analysis (PCA)

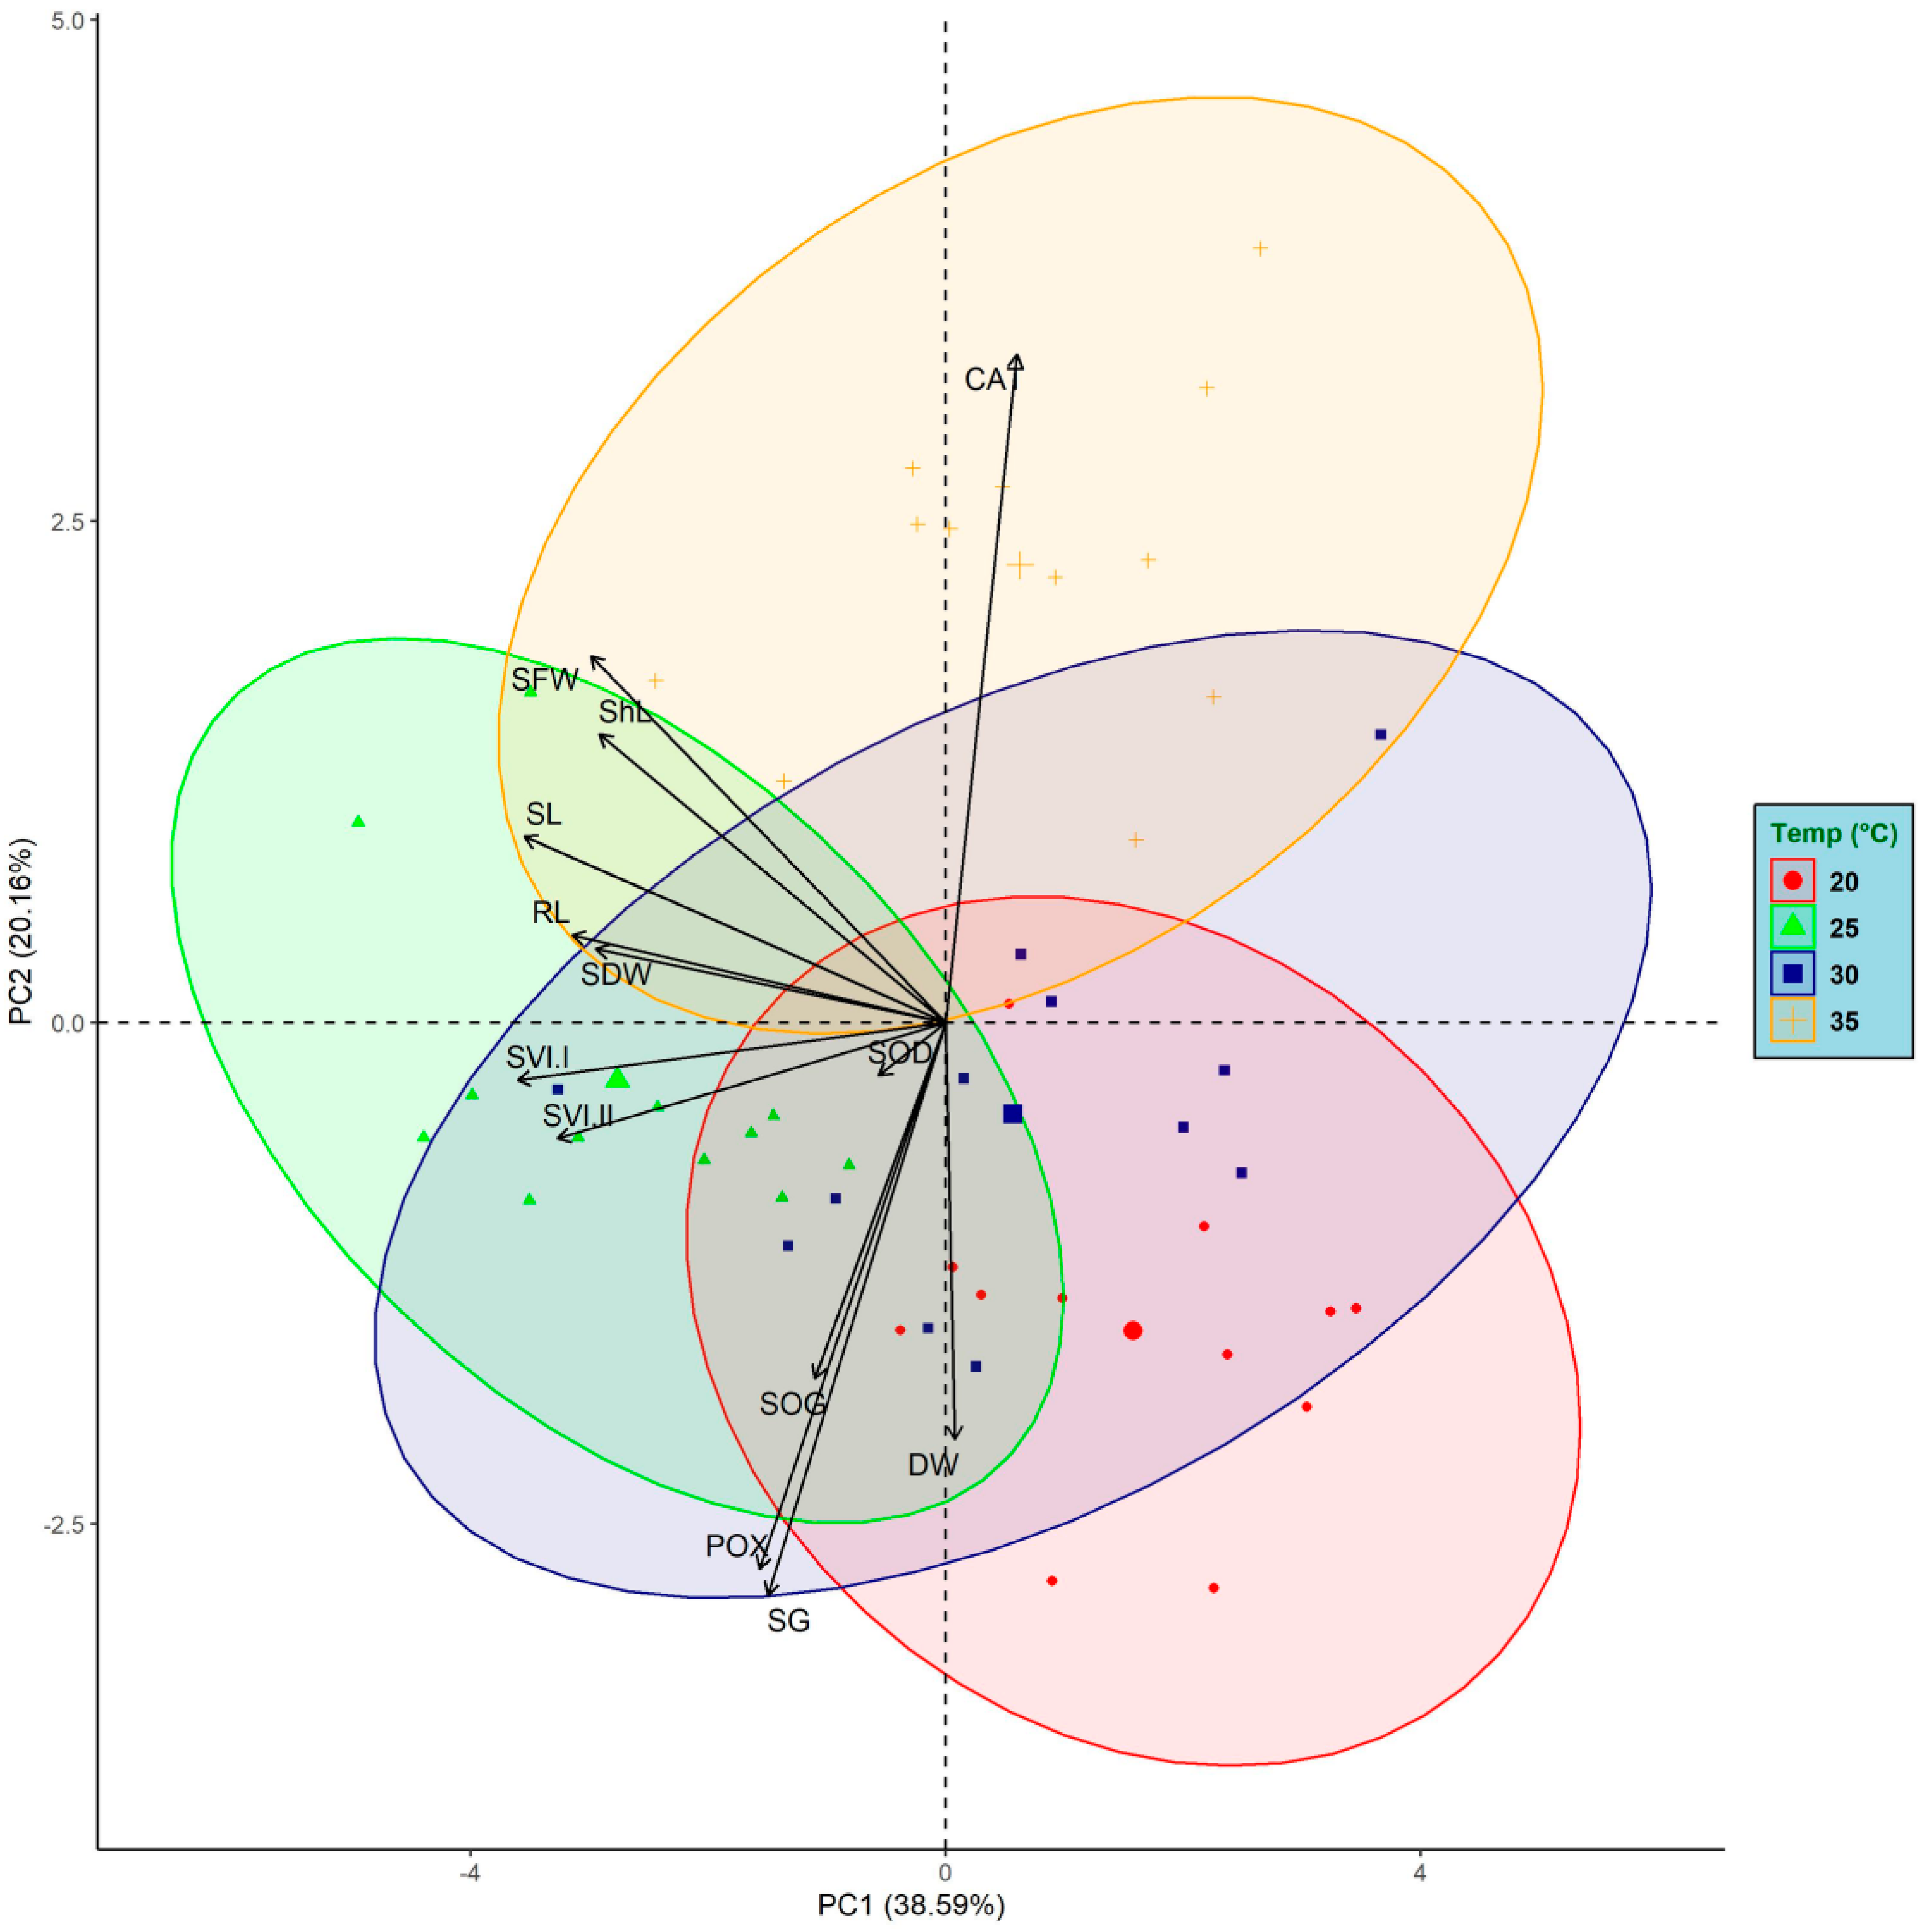
PCA analysis revealed four clusters parallel to the four genotype-by-temperature treatment groups examined in this study. PCA extracted three PCs on the basis of eigen values greater than one and these three PCs explained about 73 percent of the variation (Table S6). More than half of the variation (≈59%) among the treatments was explained by only two PCs, i.e., PC1 (38.6%) and PC2 (20.2%).
The magnitude of variation among the genotypes was lower at 35 °C, as reflected by their close proximity in the respective cluster. The data points representing the genotypes under 35 °C treatment were more tightly grouped than those of the other temperature treatments, showing that most of the genotypes behaved alike at 35 °C. In addition, the cluster representing 35 °C temperature treatment is placed separately from other clusters at the farthest positive extreme on PC1 (Figure 6) and showed the lowest germination percentage. In contrast, at 20 °C treatment, all the genotypes clustered into the lower right quadrant of Figure 6 (PC1, 0–4; PC2, 0 to −2) and recorded the highest germination. At 25 and 30 °C, the genotypes were more scattered, showing higher variability among them for germination traits at these temperatures. The genotypes under 30 °C treatments showed limited germination, but they were found to be scattered into all the quadrants (Figure 6). Genotypes clustered in the bottom left quadrant (PC1, 0 to −4; PC2 0 to −2) at <25 °C, showed the highest seedling growth and vigor with a comparable germination percentage to the 20 °C level.

4. Discussion

In northern India, the sowing of wheat is usually undertaken with the onset of winter, i.e., in the first fortnight of November. The recommended temperature range for sowing wheat is 20–22 °C [19]. However, the instances of heat stress during the wheat growing season are increasing in the present scenario of global warming. The growing uncertainties in temperature profiles during the specific period of wheat sowing season may lead to higher than optimum seed zone temperature. In the present study, the main effect of temperature alone (Table 3, Table 4 and Table 5) suggested the overall response of wheat germination to high-temperature stress over a variety of genotypes.
The germination percentage was highest at 20 °C in most of the wheat genotypes. At 25 °C, all the genotypes were statistically on par with the 20 °C temperature; however, numerically, a slight reduction was observed. As the temperature exceeded 25 °C, a significant reduction in germination percentage was recorded for most of the genotypes and reached a minimum level at 35 °C. There are reports that the most suitable temperature for wheat seed germination is 20–22 °C [19,20]. The germination was significantly reduced at 30 and 35 °C, showing the relevance of temperature in the process of germination. The significance of temperature in plant growth and development is higher than any other environmental factor when water is not limiting [21]. The inhibition of seed germination has been well documented in response to high temperature which often occurs through the induction of Abscisic acid (ABA) [22,23]. It was previously observed that a very high temperature (40–45 °C) during germination causes cell and embryo death and strictly prohibits the normal germination process or sometimes proved to be lethal in many plant species [24,25,26,27].
There were some notable genotypic differences in the germination percentage at different temperature levels. The genotypes WH 730 and HD 2967 were on par germination across the temperatures and WH 1123 maintained high germination up to 30 °C. The germination of WH 1105 and PBW 725 was adversely affected by high temperatures (30 and 35 °C). This genotypic variability might be due to the genetic potentiality of different genotypes to withstand temperature fluctuations. However, the response of different genotypes towards the early heat stress did not show any clear relationship with their characteristic breeding nature to cope with terminal heat stress. For example, genotypes, viz., WH 1021, IC 441661 and EC 277134, had heat-tolerance abilities when exposed to terminal heat stress, but they did not perform decently under early heat stress. However, HD 2967 performed better under heat given during germination, but it is considered as moderately susceptible to terminal heat stress.
The speed of germination followed a different pattern as compared to the germination percentage. The germination speed increased with the rise in temperature, and it was significantly higher at 25 °C than 20 °C, but it reduced at higher temperatures, i.e., 30 and 35 °C. On increases in temperature up to a certain level (25 °C), the time taken by seeds to germinate becomes reduced. This can be attributed to the higher rate of seed reserve mobilization which enhances the speed of germination, but a very high temperature (>30 °C) can delay this process, as reported in maize [24,28]. The optimum temperature for germination rate is typically higher than that required to achieve the maximum percentage of germination in partially dormant or partially deteriorated seed populations [29]. Once a seed loses its dormancy, it follows a pattern in germination showing a positive linear relationship between the base temperature (at and below which the rate is zero) and the optimum temperature (at which the rate is maximal) and a negative linear relationship between the optimal temperature and the ceiling temperature (at and above which, the rate is again zero). However, there are reports that even temperatures around 35–37 °C can enhance the rate of germination [30].
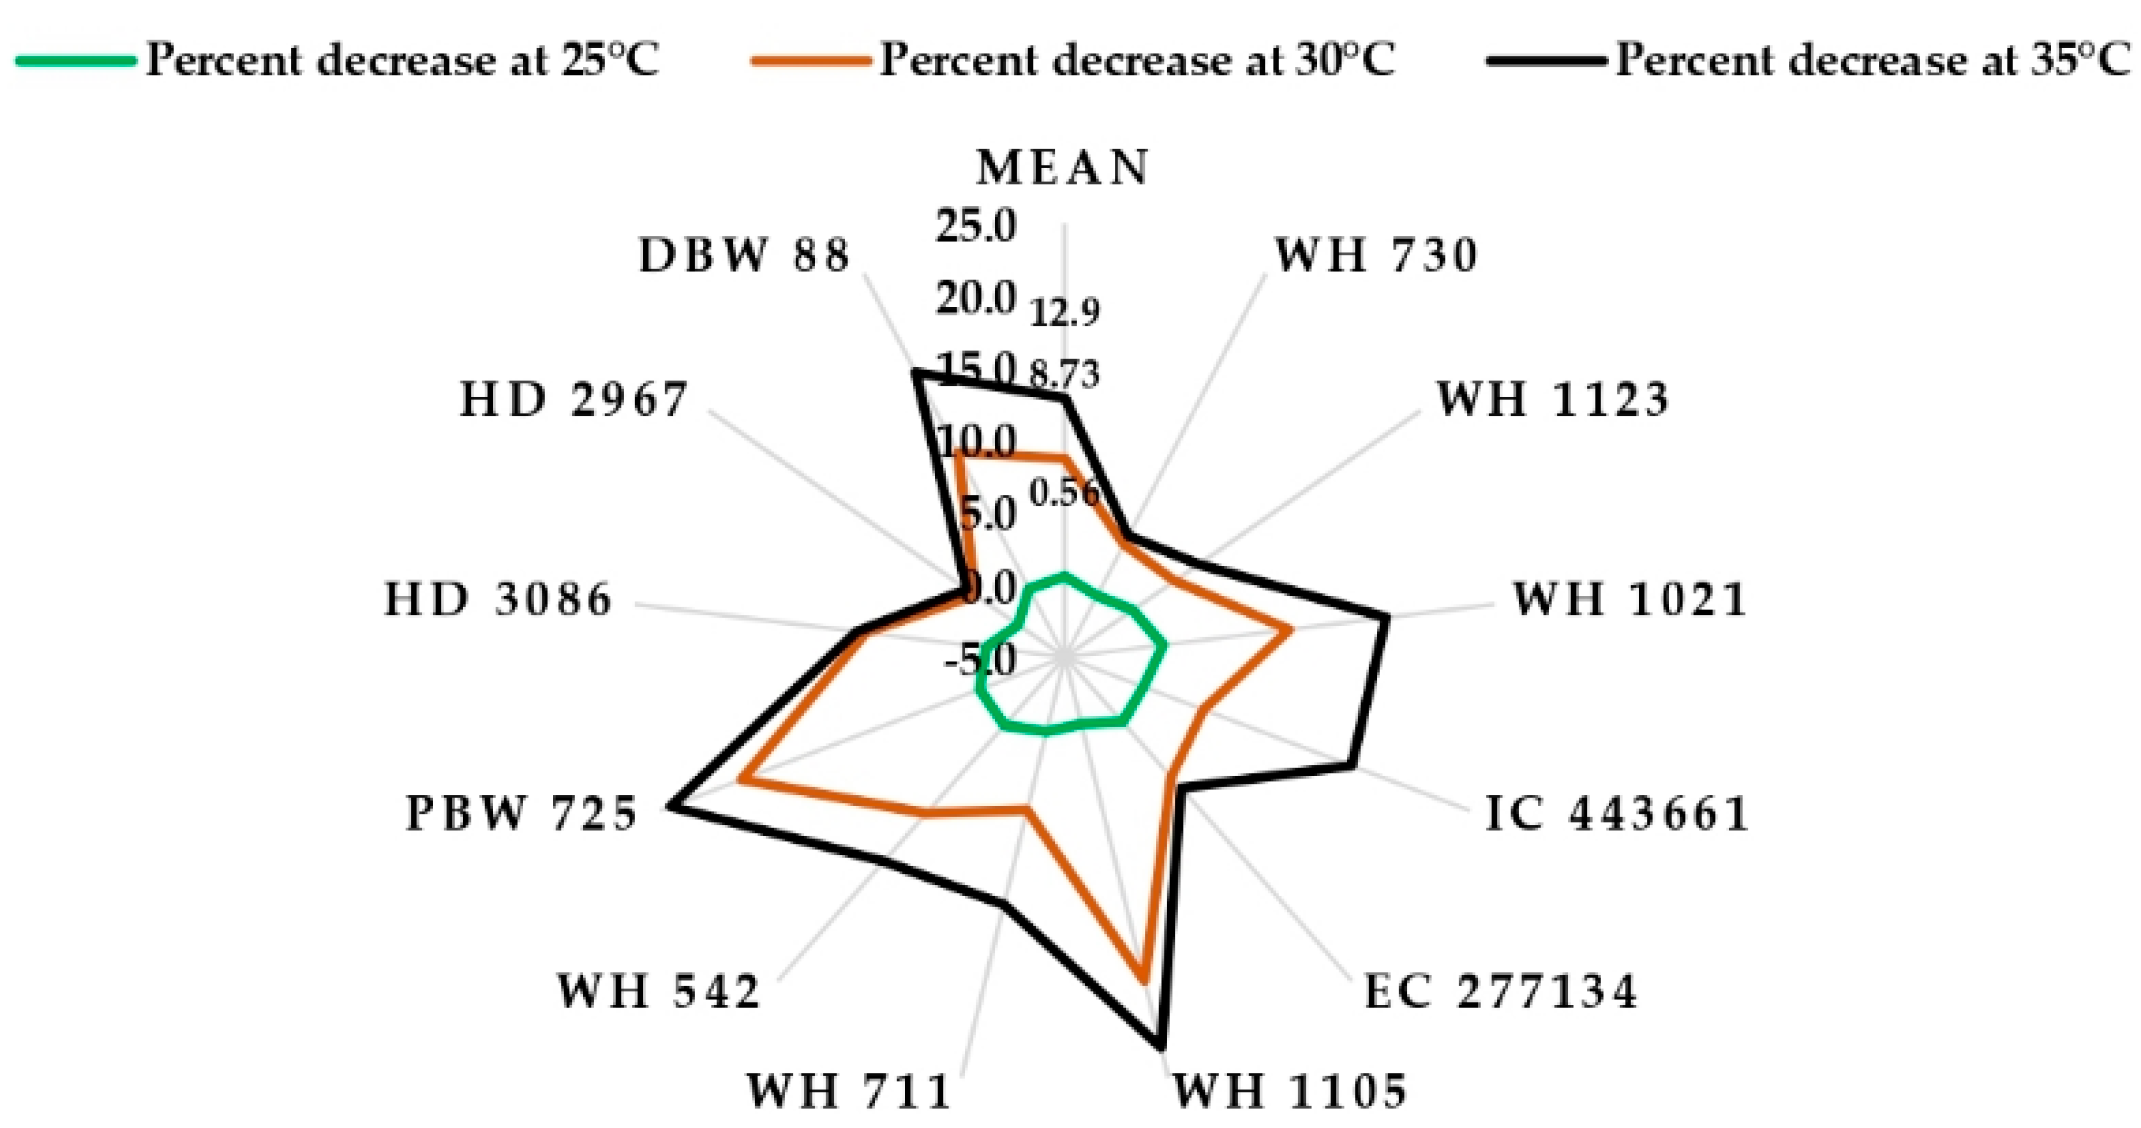
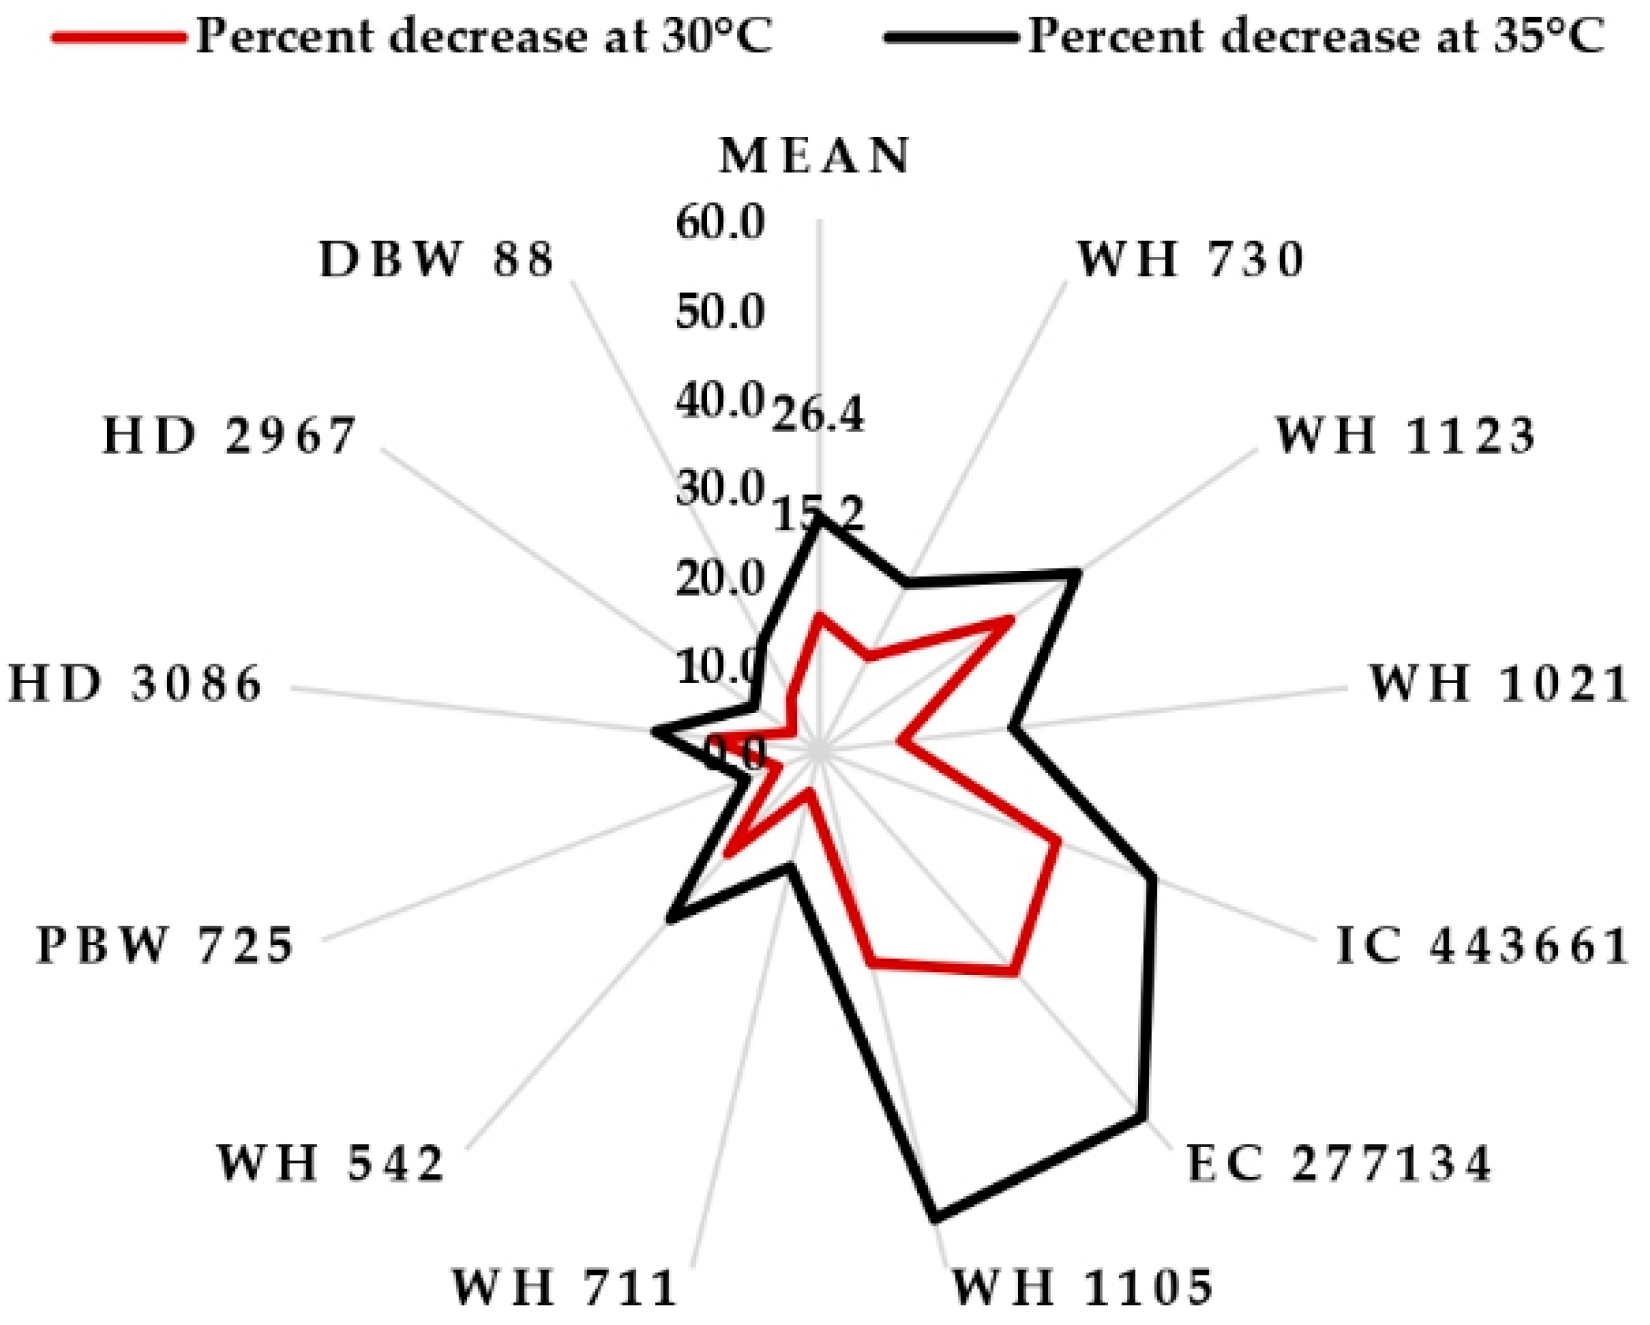
In the present study, the germination percentage and speed were reduced at higher temperature regimes, but the extent of the decrease was different for both of these traits. The germination percentage showed a lower mean reduction at 30 °C (8.73%) and 35 °C (12.92%), while the speed of germination showed 15.16% and 26.41% reductions, respectively, in comparison to the 20 °C level (Figure 7 and Figure 8). The rate or speed of germination is more susceptible to the adverse effects of abiotic stresses than the final germination percentage [31,32].
The synthesis of Reactive Oxygen Species (ROS) is the most usual reaction of plant systems in response to abiotic stresses. High temperature (heat stress) also accelerates the generation of various ROS molecules, viz., singlet oxygen(1O2), superoxide anion (O2–), hydrogen peroxide (H2O2) etc., resulting in oxidative stress [33,34]. As the oxidative stress increases in the plant, it responds by activating the enzymatic defense system which includes the enzymes POX, SOD, APX, GPX and CAT [35]. The status of these enzymes in the plant systems expresses the nature and quantum of plants’ response towards stress stimuli.
SOD plays a role in the dismutation of O2– to H2O2 and molecular oxygen. POX catalyzes the decomposition of H2O2 through oxidation and protects the cell from its destructive influence [36,37,38]. Similarly, CAT also catalyzes the decomposition of H2O2 into O2 and H2O [39].
Temperature is an integral factor in the process of germination, and the fluctuation in it from optimal ranges stimulates antioxidant enzymatic activity. The biochemistry of germinating seeds changes with the fluctuations in the surrounding environment. Significant variations in the activity of these enzymes were observed in the seedlings developed at different temperatures. All three enzymes under study showed their minimum activity in the seedlings germinated at 20 °C, and as the temperature increased, activity enhanced up to a specific level. The SOD activity enhanced up to 30 °C and then it drastically reduced at 35 °C, whereas the activity of CAT continuously increased with temperature and reached a maximum at 35 °C [40,41,42,43,44]. The higher activity of antioxidant enzymes beyond 20 °C indicated that for wheat, temperatures more than 20 °C create a condition of stress at the time of germination. By increasing the activity of antioxidant enzymes, the seedlings were attempting to tolerate the stress by maintaining homeostasis between the production and the scavenging of ROS by these enzymes. The genotypic differences in the activities of antioxidant enzymes did not show any clear relationship with their performance under temperature stress in terms of germination and seedling growth. As the higher activity of SOD, CAT and POX were found in the genotypes HD 2967, EC 277134 and IC443661, respectively, they also performed better under stress. However, the low-performing genotypes, viz., PBW 725 and WH 542, also showed higher activity of catalase, which showed that there was no stable correlation between this enzyme and genotypic performance. On the other hand, for POX and SOD, a good correlation was observed, as the tolerant genotypes showed higher activities of both these enzymes. The differential response for enzymatic activities under high temperatures might be due to the diversity in the genotypes under study. It is clear from the present study that some sort of correlation existed between enzymatic activities (especially POX and SOD) and genotypic performance under early heat stress. The genotypic differences for antioxidant enzymes under short-term heat stress are reported previously in wheat [43].
Apart from these antioxidative enzymes, the ascorbate-glutathione (AsA-GSH) cycle is a key component of the reactive oxygen compound scavenging system in photosynthetic plants. This pathway includes antioxidants such as AsA and GSH, as well as antioxidative enzymes such as ascorbate peroxidase (APX), monodehydroascorbate reductase (MDAR), dehydroascorbate reductase (DHAR) and glutathione reductase (GR) [45]. Guaiacol peroxidase (GPX) and ascorbic acid are other antioxidants that play critical roles in stress tolerance in plants. Under stressed conditions, GPX, APX and GR activity has been demonstrated to increase in wheat and other crop plants [43,45,46].
Seedling vigor parameters, viz., seedling length, seedling fresh weight as well as dry weight and vigor indices were maximized at 25 °C, reduced at 30 °C and slightly increased at 35 °C. This pattern might be due to the fact that at 35 °C, a lower number of seeds germinated but they produced slightly vigorous seedlings as compared to 30 °C. Therefore, the temperature around 25 °C is good with respect to germination percentage, speed and the overall growth of seedlings. However, the percent dry weight in seedlings showed a different pattern, and higher values were obtained at 30 °C, while lower values were obtained at 25 °C. This trend suggested that, at a temperature level of 25 °C, water uptake in seedlings was higher; therefore, the value of dry weight percentage to the total weight of seedlings was lesser; otherwise, these seedlings performed better in other terms. With respect to genotypic differences, the percent dry weight was maximum for HD 2967 with statistically on-par values observed in WH 1123 and WH 730. These three genotypes also performed better for other parameters, showing their heat-tolerant abilities physiologically, while the lower percent dry weight was recorded in the genotypes WH 1105, EC 277134 and WH 711, which was similar to their performance for other parameters. Therefore, the present study demonstrated that dry weight percent to the total weight of the seedlings is a very informative parameter physiologically and useful in the assessment of the stress tolerance potential of different genotypes/species.
Therefore, a better stand establishment and seedling growth can be achieved with the sowing of wheat when the average temperature remains around 25 °C. Germination-related traits under fluctuating environments greatly depend on the ability of different genotypes to tolerate the heat and moisture stress in the field. The insight from the present study suggested that the sowing time window for wheat in northern India needs a proper analysis with respect to temperature profiles experienced during sowing. An appropriate sowing date is crucial to allow wheat to flower during the period with minimum stresses, such as frost and heat [47]. Sandhu [19] also studied the effect of climatic shifts on sowing windows for wheat in the Punjab state of India and emphasized the rescheduling of sowing recommendations on the basis of weather conditions of different agroecological regions.
The interactive effects of different genotypes at different temperature levels are presented in Figure 1, Figure 2, Figure 3, Figure 4 and Figure 5. These interactions helped us to identify genotypes that perform better under both stressed and non-stressed conditions. The genotypic performances under early heat stress can be summarized into a grouping of genotypes, with group I having highly tolerant genotypes (WH 730 and HD 2967), group II with moderately tolerant genotypes (WH 1123, WH 1021, EC 277134 and HD 3086), group III with susceptible genotypes (IC 443661, DBW 88, WH 711 and WH 542) and group IV with highly susceptible genotypes (WH 1105 and PBW 725).

5. Conclusions

Wheat seeds can maintain a decent germination percentage and perform better in terms of seedling growth and vigor at 25 °C. Genotypic variability was observed in the response towards heat stress given during the germination stage and it was more prominent at higher temperature levels. Maximum germination speed and seedling growth in terms of length and dry matter accumulation were observed at 25 °C. Antioxidant enzymes showed enhanced activity at higher temperature levels but their correlation with germination and seedling growth parameters was low. The information can be used to optimize the sowing time in different agroclimatic regions according to weather conditions. The genotypes identified as tolerant to early heat stress, viz., WH 730 and HD 2967, can be recommended for early sowing and can also be used in breeding programs for the development of heat-tolerant genotypes.

Supplementary Materials

The following supporting information can be downloaded at: https://www.mdpi.com/article/10.3390/agriculture12091500/s1, Figure S1: Boxplot distribution of germination characteristics and biochemical parameters at four temperature regimes; Table S1: Effect of different temperature regimes on germination parameters of Indian wheat genotypes; Table S2: Effect of different temperature regimes on shoot length, root length and seedling length of Indian wheat genotypes; Table S3: Effect of different temperature regimes on seedling fresh weight and seedling dry weight of Indian wheat genotypes; Table S4: Effect of different temperature regimes on seedling vigor index-I and seedling vigor index-II of Indian wheat genotypes; Table S5: Effect of different temperature regimes on the activity of different antioxidant enzymes in seedlings of Indian wheat genotypes; Table S6: PC loadings for seed germination and biochemical parameters of wheat genotypes.

Author Contributions

Conceptualization, V.S., R.C.P. and S.S. (Sushma Sharma); methodology, V.S.; formal analysis, H.T. and M.K. (Mujahid Khan); investigation, S.S. (Sushma Sharma) and H.T.; resources, R.C.P., V.S.M. and A.B.; data curation, S.S. (Sushma Sharma), H.T. and C.S.D.; writing—original draft preparation, S.S. (Sushma Sharma), H.T. and S.S. (Sonali Sangwan); writing—review and editing, V.S., M.K. (Mukesh Kumar), M.S.D., S.Y. and J.S.; supervision, R.C.P., V.S., V.S.M. and A.B.; project administration, R.C.P. All authors have read and agreed to the published version of the manuscript.

Funding

This research received no external funding.

Institutional Review Board Statement

Not applicable.

Informed Consent Statement

Not applicable.

Data Availability Statement

Not applicable.

Acknowledgments

The authors are highly thankful to the CCSHAU, Hisar, Haryana for providing administrative and technical facilities during the course of the study.

Conflicts of Interest

The authors declare no conflict of interest.

References

  1. Seneviratne, S.I.; Nicholls, N.; Easterling, D.; Goodess, C.M.; Kanae, S. Changes in climate extremes and their impacts on the natural physical environment. In Managing the Risks of Extreme Events and Disasters to Advance Climate Change Adaptation; Field, C.B., Barros, V., Stocker, T.F., Qin, D., Dokken, D.J., Ebi, K.L., Mastrandrea, M.D., Mach, K.J., Plattner, G.-K., Allen, S.K., et al., Eds.; A Special Report of Working Groups I and II of the Intergovernmental Panel on Climate Change (IPCC); Cambridge University Press: Cambridge, UK; New York, NY, USA, 2012; pp. 109–230. [Google Scholar]
  2. Kerasa, S.; Baric, M.; Sarcevic, H.; Marchette, S.; Drasner, G. Callus Induction and Plant Regeneration from Immature and Mature Embryos of Winter Wheat (Triticum aestivum L.) genotypes. Plant Breeding Sustaining the Future. In Proceedings of the XVIth Eucarpia Congress, Edinburgh, UK, 10–14 September 2001; p. 41. [Google Scholar]
  3. Barun, H.J.; Atlin, G.; Payne, T. Multi-location testing as a tool to identify plant response to global climate change. In Climate Change and Crop Production; Reynolds, M.P., Ed.; CABI: Wallingford, UK, 2010; pp. 115–138. [Google Scholar]
  4. Acevedo, M.; Zurn, J.D.; Molero, G.; Singh, P.; He, X.; Aoun, M.; Juliana, P.; Bockleman, H.; Bonman, M.; El-Sohl, M.; et al. The role of wheat in global food security. In Agricultural Development and Sustainable Intensification; Nagothu, U.S., Ed.; Routledge: London, UK, 2018; pp. 81–110. [Google Scholar] [CrossRef]
  5. Joshi, A.K.; Mishra, B.; Chatrath, R.; Ferrara, G.O.; Singh, R.P. Wheat improvement in India: Present status, emerging challenges and future prospects. Euphytica 2007, 157, 431–446. [Google Scholar] [CrossRef]
  6. Howard, A. Crop production in India: A Critical Survey of Its Problems; Oxford University Press: Oxford, UK, 1924; p. 156. [Google Scholar]
  7. Johkan, M.; Oda, M.; Maruo, T.; Shinohara, Y. Crop production and global warming. In Global Warming Impacts-Case Studies on the Economy, Human Health, and on Urban and Natural Environments; Casalegno, S., Ed.; IntechOpen: Rijeka, Croatia; London, UK, 2011; pp. 139–152. [Google Scholar]
  8. Hossain, A.; Sarker, M.; Saifuzzaman, M.; da Silva, J.T.; Lozovskaya, M.; Akhter, M. Evaluation of growth, yield, relative performance and heat susceptibility of eight wheat (Triticum aestivum L.) genotypes grown under heat stress. Int. J. Plant Prod. 2013, 7, 615–636. [Google Scholar] [CrossRef]
  9. Buriro, M.; Oad, F.C.; Keerio, M.I.; Tunio, S.; Gandahi, A.W. Wheat Seed Germination under Influence of Temperature Regimes. Sarhad J. Agric. 2011, 27, 4. [Google Scholar]
  10. Hampson, C.R.; Simpson, G.M. Effect of temperature, salt and osmotic potential on early growth of wheat (Triticum aestivum) germination. Can. J. Bot. 1990, 68, 524–528. [Google Scholar] [CrossRef]
  11. Prasad, P.V.V.; Boote, K.J.; Allen, L.H., Jr. Adverse high temperature effects on pollen viability, seed-set, seed yield and harvest index of grain-sorghum [Sorghum bicolor (L.) Moench] are more severe at elevated carbon dioxide due to higher tissue tem-peratures. Agric. For. Meteorol. 2006, 39, 237–251. [Google Scholar] [CrossRef]
  12. ISTA. International Rules for Seed Testing; International Seed Testing Association: Bassersdorf, Switzerland, 2015. [Google Scholar]
  13. Maguire, J.D. Speed of germination-aid selection and evaluation for seedling emergence and vigor. Crop Sci. 1962, 2, 176–177. [Google Scholar] [CrossRef]
  14. Abdul-Baki, A.A.; Anderson, J.D. Vigour determination in soybean seed by multiple criteria. Crop Sci. 1973, 13, 630–633. [Google Scholar] [CrossRef]
  15. Beauchamp, C.; Fridovich, I. Superoxide dismutase: Improved assays and an assay applicable to acrylamide gels. Anal. Biochem. 1971, 44, 276–287. [Google Scholar] [CrossRef]
  16. Giannopolitis, C.N.; Ries, S.K. Superoxide Dismutases: Occurrence in Higher Plants. Plant Physiol. 1977, 59, 309–314. [Google Scholar] [CrossRef]
  17. Sinha, A.K. Calorimetric assay of catalase. Anal. Biochem. 1972, 47, 2. [Google Scholar] [CrossRef]
  18. Rao, M.B.; Tanksale, A.M.; Ghatge, M.S.; Deshpande, V.V. Molecular and Biotechnological Aspects of Microbial Proteases. Microbiol. Mol. Biol. Rev. 1998, 62, 597–635. [Google Scholar] [CrossRef]
  19. Sandhu, S.S.; Kaur, P.; Gill, K.K.; Vashisth, B.B. The effect of recent climate shifts on optimal sowing windows for wheat in Punjab, India. J. Water Clim. Chang. 2019, 11, 1177–1190. [Google Scholar] [CrossRef]
  20. Khodabandeh, N. Cereals, 7th ed.; Tehran University Press: Tehran, Iran, 2003; pp. 78–111. [Google Scholar]
  21. Thuzar, M.; Puteh, A.B.; Abdullah, N.A.P.; Lassim, M.B.M.; Jusoff, K. The Effects of Temperature Stress on the Quality and Yield of Soya Bean [(Glycine max L.) Merrill.]. J. Agric. Sci. 2010, 2, 172. [Google Scholar] [CrossRef]
  22. Toh, S.; Imamura, A.; Watanabe, A.; Nakabayashi, K.; Okamoto, M.; Jikumaru, Y.; Hanada, A.; Aso, Y.; Ishiyama, K.; Tamura, N.; et al. High Temperature-Induced Abscisic Acid Biosynthesis and Its Role in the Inhibition of Gibberellin Action in Arabidopsis Seeds. Plant Physiol. 2008, 146, 1368–1385. [Google Scholar] [CrossRef]
  23. Essemine, J.; Ammar, S.; Bouzid, S. Impact of Heat Stress on Germination and Growth in Higher Plants: Physiological, Biochemical and Molecular Repercussions and Mechanisms of Defence. J. Biol. Sci. 2010, 10, 565–572. [Google Scholar] [CrossRef]
  24. Blacklow, W.M. Influence of Temperature on Germination and Elongation of the Radicle and Shoot of Corn (Zea mays L.) 1. Crop Sci. 1972, 12, 647–650. [Google Scholar] [CrossRef]
  25. Kumar, S.; Kaur, R.; Kaur, N.; Bhandhari, K.; Kaushal, N.; Gupta, K.; Bains, T.S.; Nayyar, H. Heat-stress induced inhibition in growth and chlorosis in mungbean (Phaseolus aureus Roxb.) is partly mitigated by ascorbic acid application and is related to reduction in oxidative stress. Acta Physiol. Plant. 2011, 33, 2091–2101. [Google Scholar] [CrossRef]
  26. Piramila, B.H.M.; Prabha, A.L.; Nandagopalan, V.; Stanley, A.L. Effect of heat treatment on germination, seedling growth and some biochemical parameters of dry seeds of black gram. Int. J. Pharm. Phytopharm. Res. 2011, 1, 194–202. [Google Scholar]
  27. Iloh, A.C.; Omatta, G.; Ogbadu, G.H.; Onyenekwe, P.C. Effects of elevated temperature on seed germination and seedling growth on three cereal crops in Nigeria. Sci. Res. Essays 2014, 9, 806–813. [Google Scholar] [CrossRef]
  28. Sikder, S.; Hasan, M.; Hossain, M. Germination Characteristics and Mobilization of Seed Reserves in Maize Varieties as Influenced by Temperature Regimes. J. Agric. Rural Dev. 1970, 7, 51–58. [Google Scholar] [CrossRef]
  29. Roberts, E.H. Temperature and seed germination. Symp. Soc. Exp. Biol. 1988, 42, 32. [Google Scholar]
  30. Sikder, S.; Paul, N.K. Study of influence of temperature regimes on germination characteristics and seed reserves mobilization in wheat. Afr. J. Plant Sci. 2010, 4, 401–408. [Google Scholar]
  31. Jorenush, M.H.; Rajabi, M. Effect of Drought and Salinity Tensions on Germination and Seedling Growth of Artichoke (Cynara scolymus L.). Int. J. Adv. Biol. Biomed. Res. 2015, 3, 297–302. [Google Scholar]
  32. Özaktan, H.; Çiftçi, C.Y.; Kaya, M.D.; Uzun, S.; Akdogan, G. Chloride salts inhibit emergence and seedling growth of chickpea rather than germination. Legum. Res. Int. J. 2017, 40, 60–66. [Google Scholar] [CrossRef]
  33. Mittler, R. Oxidative stress, antioxidants and stress tolerance. Trends Plant Sci. 2002, 7, 405–410. [Google Scholar] [CrossRef]
  34. Yin, H.; Chen, Q.; Yi, M. Effects of short-term heat stress on oxidative damage and responses of antioxidant system in Lilium longiflorum. Plant Growth Regul. 2007, 54, 45–54. [Google Scholar] [CrossRef]
  35. Hernández, J.A.; Almansa, M. Short-term effects of salt stress on antioxidant systems and leaf water relations of pea leaves. Physiol. Plant. 2002, 115, 251–257. [Google Scholar] [CrossRef] [PubMed]
  36. Dionisio-Sese, M.L.; Tobita, S. Antioxidant responses of rice seedlings to salinity stress. Plant Sci. 1998, 135, 1–9. [Google Scholar] [CrossRef]
  37. Sudhakar, C.; Lakshmi, A.; Giridarakumar, S. Changes in the antioxidant enzyme efficacy in two high yielding genotypes of mulberry (Morus alba L.) under NaCl salinity. Plant Sci. 2001, 161, 613–619. [Google Scholar] [CrossRef]
  38. Lin, C.C.; Kao, C.H. Osmotic stress-induced changes in cell wall peroxidase activity and hydrogen peroxide level in roots of rice seedlings. Plant Growth Regul. 2002, 37, 177–184. [Google Scholar] [CrossRef]
  39. Foyer, C.; Noctor, G. Oxygen processing in photosynthesis: Regulation and signaling. New Phytol. 2000, 146, 359–388. [Google Scholar] [CrossRef]
  40. Badawi, G.H.; Tahir, I.S.A.; Nakata, N.; Tanaka, K. Induction of some antioxidant enzymes in selected wheat genotypes. In Proceedings of the Eighth African Crop Science Conference Proceedings, El-Minia, Egypt, 27–31 October 2007; pp. 841–848. [Google Scholar]
  41. Wang, Z.-Y.; Li, F.-M.; Xiong, Y.-C.; Xu, B.-C. Soil-Water Threshold Range of Chemical Signals and Drought Tolerance Was Mediated by ROS Homeostasis in Winter Wheat During Progressive Soil Drying. J. Plant Growth Regul. 2008, 27, 309–319. [Google Scholar] [CrossRef]
  42. Ibrahim, M.; Alsahli, A.; Al-Ghamdi, A. Cumulative abiotic stresses and their effect on the antioxidant defense system in two species of wheat, Triticum durum Desf and Triticum aestivum L. Arch. Biol. Sci. 2013, 65, 1423–1433. [Google Scholar] [CrossRef]
  43. Gupta, N.K.; Agarwal, S.; Agarwal, V.P.; Nathawat, N.S.; Gupta, S.; Singh, G. Effect of short-term heat stress on growth, physiology and antioxidative defence system in wheat seedlings. Acta Physiol. Plant. 2013, 35, 1837–1842. [Google Scholar] [CrossRef]
  44. Caverzan, A.; Casassola, A.; Brammer, S.P. Antioxidant responses of wheat plants under stress. Genet. Mol. Biol. 2016, 39, 1–6. [Google Scholar] [CrossRef]
  45. Pang, C.-H.; Wang, B.-S. Role of Ascorbate Peroxidase and Glutathione Reductase in Ascorbate–Glutathione Cycle and Stress Tolerance in Plants. In Ascorbate-Glutathione Pathway and Stress Tolerance in Plants; Anjum, N., Chan, M.T., Umar, S., Eds.; Springer: Dordrecht, The Netherlands, 2010. [Google Scholar] [CrossRef]
  46. Sarker, U.; Oba, S. Catalase, superoxide dismutase and ascorbate-glutathione cycle enzymes confer drought tolerance of Amaranthus tricolor. Sci. Rep. 2018, 8, 1–12. [Google Scholar] [CrossRef]
  47. Zheng, B.; Chenu, K.; Dreccer, M.F.; Chapman, S.C. Breeding for the future: What are the potential impacts of future frost and heat events on sowing and flowering time requirements for Australian bread wheat (Triticum aestivum) varieties? Glob. Change Biol. 2012, 18, 2899–2914. [Google Scholar] [CrossRef]
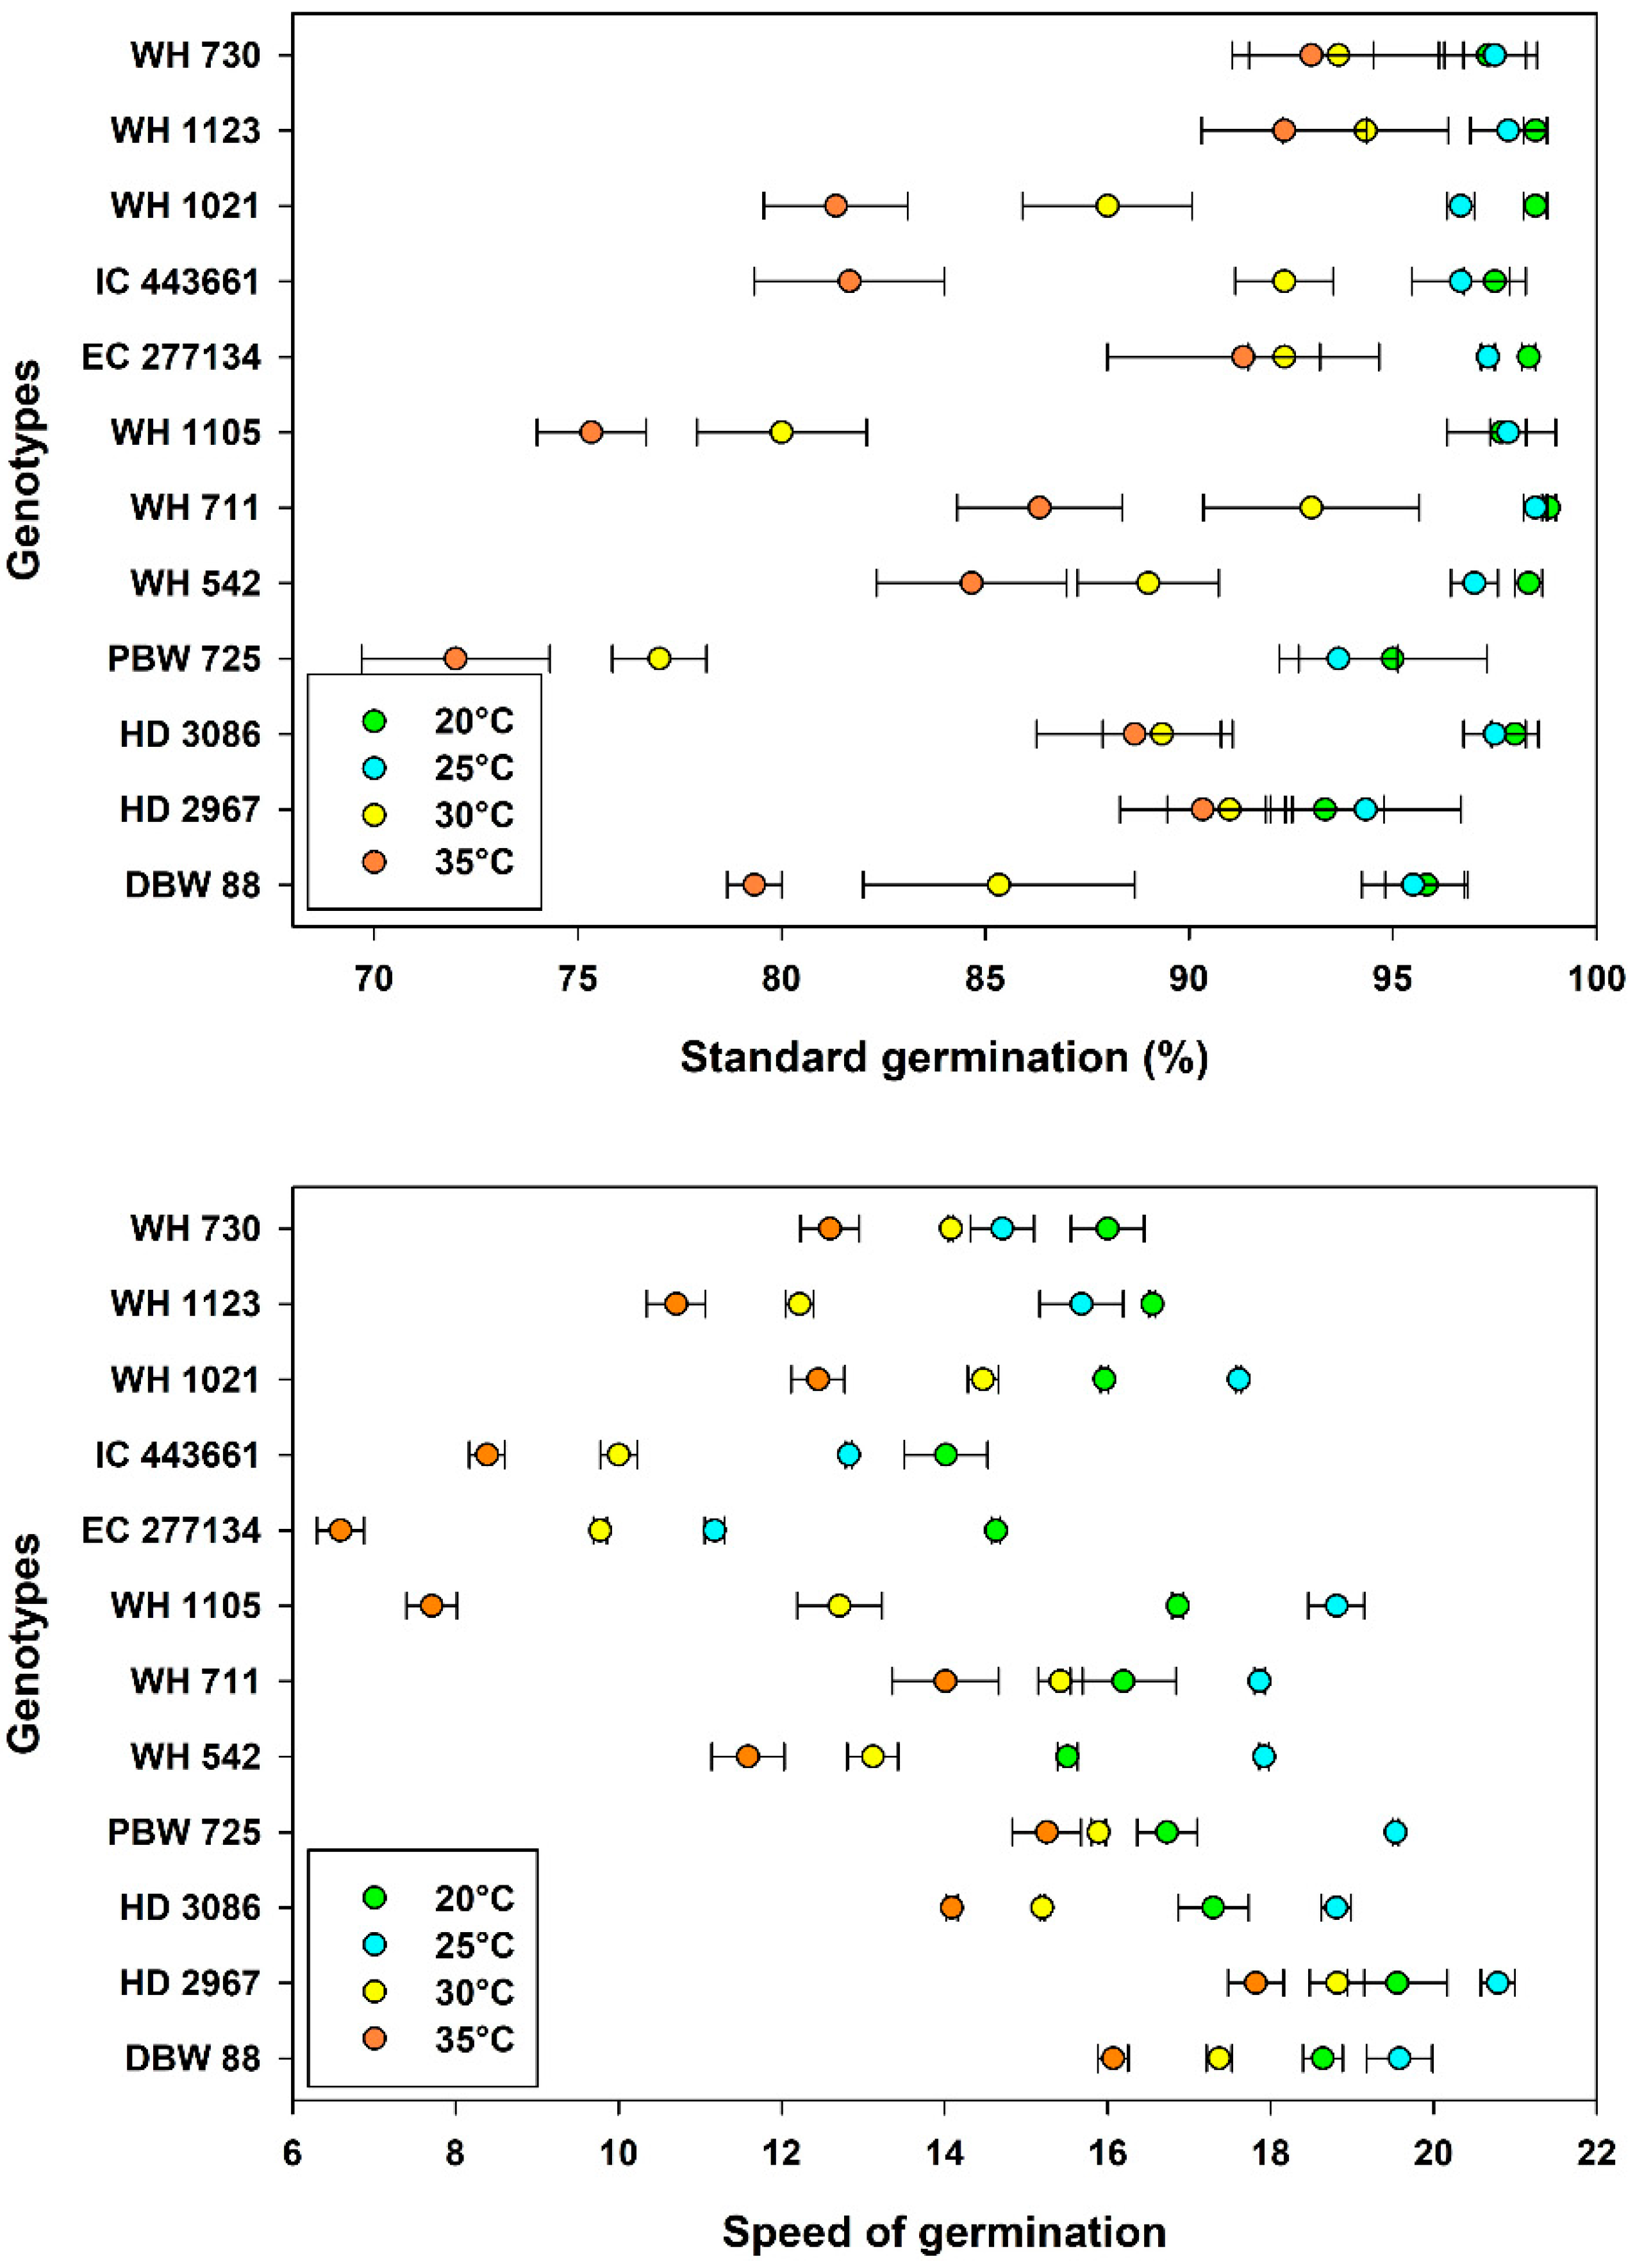
Figure 1. Effect of different temperature levels on germination characteristics of twelve wheat genotypes.
Agriculture 12 01500 g001
Figure 2. Effect of different temperature levels on seedling growth parameters in twelve wheat genotypes.
Agriculture 12 01500 g002
Figure 3. Effect of different temperature levels on fresh and dry weight accumulation in seedlings of twelve wheat genotypes.
Agriculture 12 01500 g003
Figure 4. Effect of different temperature levels on seedling vigor indices of twelve wheat genotypes.
Agriculture 12 01500 g004
Figure 5. Effect of different temperature levels on antioxidant activities in seedling of wheat genotypes.
Agriculture 12 01500 g005
Figure 6. Cumulative PCA biplot with variables. (SG: Standard germination; SOG: Speed of germination; ShL: Shoot length; RL: Root length; SL: Seedling length; SFW: Seedling fresh weight; SDW: Seedling dry weight; DW: Percent dry weight; SVI.I: Seedling vigor index-I; SVI.II: Seedling vigor index-II; POX: Peroxidase activity; CAT: Catalase activity; SOD: Superoxide dismutase activity).
Agriculture 12 01500 g006
Figure 7. Percent reduction in standard germination of wheat genotypes at elevated temperature levels as compared to 20 °C.
Agriculture 12 01500 g007
Figure 8. Percent reduction in speed of germination of wheat genotypes at elevated temperature levels as compared to 20 °C.
Agriculture 12 01500 g008
Table 1. Details of the genotypes used in the study.
Sr. No.Name of the
Genotype
ParentageDetails
1.WH 730CPAN 2092/Improved Lok-1Heat tolerance advance genotype from NBPGR (National Bureau of Plant Genetic Resources)
2.WH 1123NI5663/RAJ3765//K9330Advance genotype (heat tolerant)
3.WH 1021NYOT95/SONAKHigh-yielding variety released for late sown conditions
4.IC 443661NAIndigenous line selected from core germplasm for heat tolerance (NBPGR)
5.EC 277134NAExotic line selected from core germplasm for heat tolerance (NBPGR)
6.WH 1105MILAN/S87230//BABAXPopular varieties under cultivation in north-west plains (recommended for timely sown irrigated conditions)
7.WH 711ALD ‘S’ HUAC//HD 2285/3/HFW- 17
8.WH 542JUP/BJY”S”//URES
9.PBW 725PBW621//GLUPR O/3*PBW 568/3/PBW 621
10.HD 3086DBW14/HD2733//HUW468
11.HD 2967ALD/COC//URES/HD216 0M/HD2278
12.DBW 88KAUZ//ALTAR84/AOS/3/MILAN/KAUZ/4/HUITES
Table 2. Analysis of variance (F value) for effects of temperature and genotype on germination pattern, seedling growth and enzyme activities in wheat.
Germination ParametersSeedling Growth ParametersBiochemical Parameters
Source of Variationd.f.Standard GerminationSpeed of GerminationShoot Length Root Length Seedling Length Seedling Fresh Weight Seedling Dry Weight Percent Dry Weight in SeedlingsSeedling Vigor Index-ISeedling Vigor Index-IICAT Activity POX Activity SOD Activity
Temperature (T)3170 **610 **1296 **2066 **2550 **2022 **728 **211 **975 **255 **8470 **1928 **7912 **
Genotype (G)1117.1 **256 **286 **130 **228 **404 **437 **105 **89.9 **189 **416 **266 **560 **
Temperature × Genotype (T × G)334.58 **17.5 **43.7 **45.0 **50.3 **40.7 **49.7 **30.7 **17.7 **22.6 **221 **55.6 **395 **
** Significant at p = 0.01.
Table 3. Main effects of temperature and genotype on germination and seedling growth parameters of wheat.
Main EffectsLevelsStandard Germination (%)
(Mean ± SE)
Speed of Germination
(Mean ± SE)
Shoot Length (cm)
(Mean ± SE)
Root Length (cm)
(Mean ± SE)
Seedling Length (cm)
(Mean ± SE)
Temperature, Tm20 °C97.3 ± 0.37 a16.5 ± 0.32 b8.17 ± 0.14 d16.1 ± 0.43 c24.3 ± 0.46 c
25 °C96.7 ± 0.35 a17.1 ± 0.59 a11.5 ± 0.19 a21.6 ± 0.25 a33.2 ± 0.36 a
30 °C88.8 ± 1.01 b14.1 ± 0.54 c10.3 ± 0.33 c14.4 ± 0.24 d24.6 ± 0.53 c
35 °C84.7 ± 1.22 c12.3 ± 0.69 d11.0 ± 0.24 b17.1 ± 0.31 b28.1 ± 0.44 b
Genotype, GnWH 73095.4 ± 0.94 a14.3 ± 0.48 gh13.4 ± 0.63 a17.8 ± 0.55 c31.1 ± 1.00 a
WH 112395.8 ± 1.00 a13.8 ± 0.92 h9.10 ± 0.28 h14.8 ± 0.78 g23.9 ± 0.98 i
WH 102191.1 ± 2.16 bc15.1 ± 0.72 f11.4 ± 0.44 b18.7 ± 0.77 b30.0 ± 0.89 b
IC 44366192.0 ± 2.00 b11.3 ± 0.85 i9.84 ± 0.45 e16.2 ± 0.58 e26.1 ± 0.75 g
EC 27713494.8 ± 1.18 ab10.5 ± 1.09 j10.5 ± 0.45 c19.1 ± 0.97 a29.6 ± 1.35 b
WH 110587.7 ± 3.13 c14.0 ± 1.62 h9.56 ± 0.40 f17.3 ± 0.91 d26.9 ± 1.29 f
WH 71194.2 ± 1.69 ab15.9 ± 0.56 e9.31 ± 0.42 g18.1 ± 1.16 c27.4 ± 1.55 e
WH 54292.3 ± 1.82 b14.5 ± 0.91 g10.7 ± 0.43 c15.8 ± 0.98 f26.5 ± 1.37 f
PBW 72584.4 ± 3.14 d16.9 ± 0.63 c8.97 ± 0.46 h15.8 ± 1.15 f24.7 ± 1.59 h
HD 308693.4 ± 1.47 ab16.4 ± 0.70 d9.93 ± 0.24 e17.8 ± 0.89 c27.7 ± 1.08 de
HD 296792.3 ± 0.94 b19.3 ± 0.44 a10.2 ± 0.63 d18.4 ± 0.92 bc28.6 ± 1.07 c
DBW 8889.0 ± 2.26 c17.9 ± 0.51 b10.0 ± 0.45 de18.1 ± 1.01 c28.1 ± 1.05 d
LSDTm 1.490.7050.120.190.23
LSDGn 2.581.220.200.330.40
d.f. 143143143143143
Values with different letters in the same column for each main effect are statistically different at p = 0.05.
Table 4. Main effects of temperature and genotype on fresh and dry weight accumulations in wheat seedlings.
Main EffectsLevelsSeedling Fresh Weight (mg)
(Mean ± SE)
Seedling Dry Weight (mg)
(Mean ± SE)
Percent Dry Weight
in Seedlings (%)
(Mean ± SE)
Temperature, Tm20 °C138 ± 3.88 d13.0 ± 0.30 c9.49 ± 0.18 a
25 °C199 ± 4.30 a16.5 ± 0.52 a8.27 ± 0.16 c
30 °C177 ± 3.33 c16.5 ± 0.43 a9.53 ± 0.21 a
35 °C181 ± 3.11 b15.3 ± 0.39 b8.48 ± 0.17 b
Genotype, GnWH 730196 ± 12.7 a18.7 ± 0.85 b9.71 ± 0.28 ab
WH 1123162 ± 7.54 e15.9 ± 0.58 d9.91 ± 0.28 a
WH 1021169 ± 9.92 d15.7 ± 0.69 d9.47 ± 0.42 bc
IC 443661151 ± 7.98 g13.9 ± 0.58 g9.42 ± 0.45 bcd
EC 277134194 ± 5.24 a15.2 ± 0.20 e7.89 ± 0.17 f
WH 1105161 ± 2.06 f12.6 ± 0.37 h7.84 ± 0.24 f
WH 711185 ± 4.94 b14.8 ± 0.46 f8.01 ± 0.20 f
WH 542135 ± 2.93 h12.3 ± 0.41 i9.06 ± 0.19 de
PBW 725172 ± 8.82 c13.6 ± 0.54 g8.09 ± 0.36 f
HD 3086164 ± 8.44 e14.8 ± 0.55 f9.14 ± 0.27 cde
HD 2967194 ± 5.28 a19.4 ± 0.66 a10.0 ± 0.15 a
DBW 88195 ± 6.32 a17.1 ± 0.74 c8.77 ± 0.24 e
LSDTm 1.600.170.13
LSDGn 2.770.300.22
d.f. 143143143
Values with different letters in the same column for each main effect are statistically different at p = 0.05.
Table 5. Main effects of temperature and genotype on seedling vigor indices and antioxidant enzyme activity of wheat.
Main EffectsLevelsSeedling Vigor Index-I
(Mean ± SE)
Seedling Vigor Index-II
(Mean ± SE)
Catalase Activity (Units min−1 g−1 F.W.)
(Mean ± SE)
Peroxidase Activity (Units min−1 g−1 F.W.)
(Mean ± SE)
Superoxide Dismutase Activity (Units min−1 g−1 F.W.)
(Mean ± SE)
Temperature, Tm20 °C2364 ± 45.6 b1263 ± 27.8 b0.474 ± 0.02 c50.9 ± 0.55 c23.3 ± 1.51 d
25 °C3207 ± 36.1 a1596 ± 48.7 a0.482 ± 0.02 c55.3 ± 0.42 a39.3 ± 1.43 b
30 °C2195 ± 61.1 c1468 ± 47.5 c0.511 ± 0.02 b54.4 ± 0.86 b54.1 ± 1.90 a
35 °C2379 ± 54.9 b1310 ± 47.0 d0.885 ± 0.01 a42.9 ± 0.80 d30.2 ± 2.11 c
Genotype, GWH 7302967 ± 98.7 a1779 ± 79.6 a0.636 ± 0.04 b53.1 ± 1.33 c26.1 ± 3.36 i
WH 11232287 ± 102 g1519 ± 50.0 b0.608 ± 0.05 d51.4 ± 1.82 e38.5 ± 5.83 cd
WH 10212738 ± 113 c1415 ± 45.9 cd0.461 ± 0.08 g54.0 ± 1.47 b38.3 ± 4.69 d
IC 4436612405 ± 103 f1275 ± 46.2 e0.486 ± 0.08 f58.2 ± 1.97 a41.0 ± 2.66 b
EC 2771342815 ± 141 b1441 ± 21.6 c0.685 ± 0.06 a49.7 ± 1.47 f40.4 ± 5.83 b
WH 11052363 ± 160 f1098 ± 33.2 g0.556 ± 0.04 e52.0 ± 1.80 de33.3 ± 2.56 g
WH 7112587 ± 170 d1399 ± 60.6 cd0.496 ± 0.07 f51.9 ± 1.35 de27.9 ± 3.71 h
WH 5422440 ± 136 ef1130 ± 39.7 fg0.621 ± 0.06 c48.6 ± 1.50 g39.1 ± 5.69 c
PBW 7252099 ± 177 h1158 ± 74.9 f0.683 ± 0.06 a46.6 ± 2.05 i35.5 ± 4.93 f
HD 30862589 ± 109 d1372 ± 41.0 d0.629 ± 0.07 c44.9 ± 1.83 j34.1 ± 4.37 f
HD 29672638 ± 111 d1792 ± 62.6 a0.643 ± 0.05 b52.3 ± 1.65 d49.4 ± 3.64 a
DBW 882507 ± 129 e1532 ± 94.1 b0.551 ± 0.04 e47.8 ± 1.86 h37.4 ± 2.79 e
LSDTm 41.026.80.0060.3590.421
LSDG 71.046.50.0110.6230.729
d.f. 143143143143143
Values with different letters in the same column for each main effect are statistically different at p = 0.05.
Publisher’s Note: MDPI stays neutral with regard to jurisdictional claims in published maps and institutional affiliations.