Article

Efficiency of Mineral Nitrogen Fertilization in Winter Wheat under Pannonian Climate Conditions

by
Gerhard Moitzi
1,*,
Reinhard W. Neugschwandtner
2,
Hans-Peter Kaul
2 and
Helmut Wagentristl
1
1
Experimental Farm Groß-Enzersdorf, Department of Crop Sciences, University of Natural Resources and Life Sciences, Vienna (BOKU), Schloßhofer Straße 31, 2301 Groß-Enzersdorf, Austria
2
Department of Crop Sciences, Institute of Agronomy, University of Natural Resources and Life Sciences, Vienna (BOKU), Konrad-Lorenz-Straße 24, 3430 Tulln an der Donau, Austria
*
Author to whom correspondence should be addressed.
Agriculture 2020, 10(11), 541; https://doi.org/10.3390/agriculture10110541
Submission received: 1 October 2020 / Revised: 6 November 2020 / Accepted: 6 November 2020 / Published: 11 November 2020
(This article belongs to the Special Issue Nitrogen Fertilization in Crop Production)

Abstract

:
Improvements in nitrogen (N) use efficiency in crop production are important for addressing the triple challenges of food security, environmental degradation and climate change. The three fertilizers, calcium ammonium nitrate (CAN), urea (Urea) and stabilized urea (Ureastab), were applied at a rate of 160 kg N ha−1 with two or three splits to winter wheat (Triticum aestivum L.) in the Pannonian climate region of eastern Austria. On average, over all fertilization treatments, the grain yield (GY) increased by about a quarter and the grain N concentration (GNC) doubled compared to the control without fertilization. Consequently, the grain N yield (NYGRAIN) was increased with N fertilization by 154%. The GY increased due to a higher grain density with no differences between N fertilizers but with a tendency of a higher grain yield with three compared to two splits. Three splits also slightly increased the GNC and consequently the NYGRAIN of CAN and Ureastab in one year. The removal of N fertilizer with the NYGRAIN (N surplus) was higher than the amount of applied fertilizer. Fertilization decreased the N use efficiency (NUE), the N uptake efficiency (NUpE) and the N utilization efficiency (NUtE) but increased the soil mineral nitrate (NO3-N) at harvest and the apparent N loss (ANL). Three compared to two applications resulted in a higher NO3-N at harvest but also a lower N surplus due to partly higher NYGRAIN. Consequently, the ANL was lower with three compared to two splits. Also, the NUpE and the apparent N recovery efficiency (ANRE) were higher with three splits. The best N treatment regarding highest above-ground biomass yield with lowest N surplus, N balance and ANL was the three-split treatment (50 CAN, 50 CAN, 60 liquid urea ammonium nitrate). Three splits can, under semi-arid conditions, be beneficial when aiming high-quality wheat for bread-making and also for reducing the N loss. Whereas, two splits are recommended when aiming only at high GY, e.g., for ethanol-wheat production.

1. Introduction

Nitrogen (N) is a major driver in crop production, but too much nitrogen is harmful for the ecosystems and potentially also to human health [1]. Nitrogen management in agriculture aims to achieve agronomic objectives (farm income, high crop and livestock productivity) and environmental objectives (minimal N losses) simultaneously. Nitrogen use efficiency (NUE) and their components are indirect measurements of the sustainability of cereals production systems [2,3,4]. Improving the NUE, especially the fraction of N input harvested as product, is one of the most effective means of increasing crop productivity while decreasing environmental degradation [5]. In the global analysis of cropping systems (also including mixed crop-livestock production systems, which use manure N) using the FAO (Food and Agriculture Organization of the United Nations) database, Zhang et al. [5] reported a N output-input ratio (the fraction of N input harvested as product) of 0.42 kg harvest N kg−1 input N, and for Europe, 0.52 kg harvest N kg−1 input N. The global target annual output-input ratio of N for 2050, using FAO projections for food demand and the allowable N pollution, was calculated with 0.67 kg harvest N kg−1 input N, and for Europe, 0.75 kg harvest N kg−1 input N.
Nitrogen fertilization is increasing grain yield (GY) and grain quality (protein concentration) of wheat [6]. But, fertilizer production energy is also the highest portion of the energy input in arable farming, even ahead of soil tillage [7]. The amount of fertilizer and the fertilizing strategy are influencing the energy efficiency, as shown for maize [8] and wheat [7]. An efficient N use is therefore a key indicator in sustainable plant production. Basically, there are two primary efficiency aspects: N fertilizer efficiency and crop N efficiency. N fertilizer efficiency is the fraction of applied fertilizer N that is recovered in the crop [2]. Crop N efficiency can be partitioned into the capture of N by roots (N uptake efficiency (NUpE) = crop N uptake/N available) and its conversion to grain by shoots (N utilization efficiency (NUtE) = GY/crop N uptake) [9]. NUpE is a breeding goal for wheat, whereas there was no need in breeding independently for increasing the NUtE because this automatically went up with improved yield [10]. New varieties encouraged excessive use of fertilizer with consequences for the environment which have become all too apparent according to Barraclough et al. [2], who described four key variables determining N efficiency in a wheat crop—GY, grain N concentration (GNC), N yield of the above-ground biomass (NYAGB) and nitrogen harvest index (NHI), which are ultimately constrained by the law of conservation of matter. Improving the NUtE at a given N uptake and NHI can only be achieved at the expense of GNC. A high GY with a high grain quality (i.e., a high GNC) requires a high input and uptake of nitrogen. A comparison of high-yielding European hybrid vs. line cultivars of winter wheat showed on average a higher GY but a lower GNC, mainly due to higher harvest index for hybrid cultivars compared to line cultivars. The current wheat hybrids seem to be more efficient in overall N use because they are better converting comparable amounts of N taken up into grain biomass, thus they have a higher NUtE [11].
Besides genotype, the N fertilization management also determines the N efficiency in plant production [3,12,13]. The N management variables are amount of fertilized N, the source of N fertilizer (organic N, inorganic N: nitrate N, ammonium N, carbamide N), splitting (one, two or three doses) and timing of application.
N efficiency can be improved by matching N applications to crop N demand throughout the growing season by applying N in several smaller doses at periods of high N demand during rapid crop growth [6,14]. Many studies (e.g., References [14,15]) showed an increase of GY and N efficiency and a reduction of N losses through splitting of applied N fertilizer. A split application reduces lodging and N losses by leaching as N application and N uptake can be balanced both in time and amount [16]. Other research [17,18,19] indicates that weather conditions and total N supply are more important for yield and crude protein contents in cereals than splitting and the timing of applications. The effect of N splitting is small, if the total amount of N is sufficient [20] and the last N application cannot be taken up efficiently by the plants, particularly under dry weather conditions in May and June during the heading stage [21]. Especially under climate conditions with dry periods, N fertilization is more challenging.
Studies on efficiency of N fertilization were often carried out in wet climate regions, with the aim of mitigating environmental pollution (N leaching, gaseous emission of ammonia and nitrous oxide). There is a lack of studies on N fertilizer efficiency under climate conditions of the Pannonian region (Eastern part of Austria, Hungary, parts of Slovakia, the Czech Republic, Romania, Serbia, Croatia and the Ukraine). The aim of this study was therefore to quantify the effect of N fertilizer (calcium ammonium nitrate, urea, stabilized urea, incorporated urea, liquid urea ammonium nitrate) applied in various doses and phases of plant growth (tillering, stem elongation and ear emergence) on (i) crop yield and yield components, (ii) plant N concentrations and N yield, (iii) N balance and apparent N loss and (iv) different N efficiency parameters of winter wheat under Pannonian climate conditions.

2. Materials and Methods

2.1. Experimental Site and Climatic Conditions

A two-year experiment was performed in the growing seasons 2016/2017 (2017) to 2017/2018 (2018) at the Experimental Station of the University of Natural Resources and Life Sciences, Vienna (BOKU), in Groß-Enzersdorf (48°11′59.13″ N, 16°33′42.45″ E, 154 m elevation). The field site was located in the east of Vienna (Austria) on the edge of the Marchfeld plain, which is an important crop production region in the north-western part of the Pannonian Basin. The region is in the transition zone between the semi-humid Western-European climate and the continental East-European one. According to the phytogeographical and climatological aspect, Marchfeld is part of the Pannonicum, with high levels of sunshine, high average temperature during the growing period and low precipitation. The silt loam soil ( p H C a C l 2 : 7.6, soil organic carbon: 16.3 g kg−1) is classified as a Calcaric Chernozem of alluvial origin [22]. The Pannonian climate area is characterized by hot summers with low rainfall and cold winters with little snow. The mean annual temperature is 10.8 °C, the mean annual precipitation is 568 mm (1994–2018; [23]). Long-term precipitation pattern shows that most rainfall occurs from May to September, with monthly values above 60 mm and with the highest rainfall in July (76 mm). The mean monthly temperature and mean total precipitation during the growing season of winter wheat from October to June are shown in Table 1. Long-term average temperature and precipitation during the growing season of winter wheat (from October until June) were 8.0 °C and 361 mm (1994–2018). The deviations in the growing season of the experimental years were 0.0 °C and –48 mm (2016/2017) and +1.1 °C and +10 mm (2017/2018). The growing season of 2017 was thereby dryer and the growing season of 2018 was warmer than the long-term average. Due to a high rainfall deficiency in the year 2017 (Table 1), a supplemental irrigation with 30 mm of water was performed on the 23 May.

2.2. Experimental Design and Management

The experiment was arranged in a randomized complete block design with three replications. Plot size was 18 m2 (6 × 3 m). Treatments consisted of nine N fertilization variants with a total N application of 160 kg ha−1 and an unfertilized control (Table 2). The three nitrogen fertilizers, calcium ammonium nitrate (CAN), urea (Urea) and stabilized urea (Ureastab), were compared with two different fertilization regimes, giving the full N doses in either two splits (at tillering and stem elongation) or in three splits (at tillering, stem elongation and ear emergence) in an orthogonal matrix. An additional three N treatments were tested: Ureastab, where the full dose was given at the first split, incorporated urea (Ureaincorp), with harrowing between plant rows after the first split of 100 kg N ha−1 and 60 kg N ha−1 at the second split without harrowing, and CAN + liquid urea ammonium nitrate (CAN + UANliquid), with CAN given at the first two splits and UANliquid at the third. Urea-based fertilizers are susceptible to N losses through volatilization, denitrification and leaching, but nitrogen stabilizers (urease and nitrification inhibitors) can improve its efficiency [24]. We used in our study a stabilized urea (46% N), where a nitrification inhibitor decelerates the nitrification of ammonium-N to nitrate-N (Table 2).
No potassium, phosphorus, magnesium and sulfur fertilization were carried out, because these nutrients were sufficiently plant-available according to former soil analysis.
The winter wheat cultivar Bernstein (quality bread wheat without awns) was sown on the 20 October 2016 and on the 17 October 2017 with a disc seed drill (row distance: 12.5 cm, seeding depth: 3–4 cm) with 340 germinable seeds m−2. Pre-crop was spring barley. Plants were sprayed against weeds in one pass-over (130 g ha−1 of Broadway®; active ingredients: Florasulam—22.8 g kg−1, Pyroxsulam—68.3 g kg−1 and Cloquintocet—68.3 g kg−1) in mid-April of each year.

2.3. Plant and Soil Sampling and Measurements

Harvest was done at physiological maturity manually on 1 m2 from the center of each plot on 5 July 2017 and on 27 June 2018. The yield of above-ground biomass (YAGB) and the yields of grain (GY) and straw (SY) are given at 14% moisture. The ear density (ED, ears m−2) was counted and the thousand kernel weight (TKW) was determined with a seed counter (Condator, Pfeuffer GmbH, Kitzingen, Germany). Thereof, the grains ear−1, the grain density (GD, grains m−2) and the single ear yield (SEY, g) were calculated.
Soil samples for analyzing soil nitrate (NO3-N) were taken with a soil auger to a depth of 0.9 m, separated into the soil horizons of 0–30, 30–60 and 60–90 cm at start of the growing season in spring (9 March 2017 and 23 March 2018) and at harvest. For each plot, a composite sample consisting of four sub-samples was taken. Soil samples were deep-frozen immediately after sampling. For analyzing NO3-N, the soil samples were extracted with 0.01 mol L−1 CaCl2 solution using a soil extraction ratio of 1:4 (w:v) for 30 min (shaking frequency 180 min−1) using an over-head shaker. The extracts were filtrated and analyzed with a photometric flow analyzer (FIAstar™ 5000 Analyzer, FOSS, Höganäs, Sweden) [26].
The nitrogen concentrations of grain (GNC) and straw (SNC) were determined by oxidative combustions of the samples followed by reduction of nitrogen oxide to elementary nitrogen and detection with thermo-conductivity detector according Dumas [27] using an elemental analyzer (vario MAX cube CNS, Elementar Analysensysteme GmbH, Germany).

2.4. Calculations

The harvest index (HI) was calculated using Equation (1):
HI   ( % ) =   GY Y AGB × 100 .
where GY or YAGB are dry yields of grain or above-ground biomass (kg ha−1).
Grain N yield (NYGRAIN) and straw N yield (NYSTRAW) were calculated using Equations (2) and (3) according to Liu et al. [13]:
NY GRAIN   ( kg   ha 1 ) = GY   ×   GNC 100
NY STRAW   ( kg   ha 1 ) = SY   ×   SNC 100
where GY and SY are dry grain and straw yields (kg ha−1) and GNC and SNC are the N concentrations (%) in grain and straw. The N yield in the above-ground biomass (NYAGB) and N harvest index (NHI) were calculated using Equations (4) and (5):
NY AGB   ( kg   ha 1 ) = NY GRAIN +   NY STRAW
NHI   ( % ) =   NY GRAIN NY AGB × 100
The N surplus (Equation (6)) or the N balance (Equation (7)) were calculated as the difference of the fertilized N (NFERT, kg ha−1) minus the NYGRAIN or NYAGB according to Hartmann et al. [28]. These simple balance calculations do not include the gaseous losses as well as the atmospheric deposition of N.
N   surplus   ( kg   ha 1 ) = N FERT NY GRAIN
N   balance   ( kg   ha 1 ) = N FERT NY AGB
The apparent net N mineralization (ANM) of the control was calculated as the difference between N recovered at harvest (sum of NYAGB and NO3-NEND) and N supplied (NO3-NSTART) using Equation (8) according to Cui et al. [29] and Hartmann et al. [28]:
ANM   ( kg   ha 1 ) = NY AGB + NO 3 - N END NO 3 - N START
where NO3-NEND or NO3-NSTART are the soil mineral nitrate contents at harvest or at the start of the growing season in spring in a depth of 0–90 cm. The NO3-N (0–90 cm) at the start of the growing season was, in 2017 significantly higher than in 2018, with no differences between plots (Table 3). The ANM in the control differed between years, with a lower value in 2017 (with 15.9 kg ha−1), which was the drier year, than in 2018 with 44.6 kg ha−1.
The supplied N (NSUPP), which is the total N supply through both fertilizer and N from the soil, was calculated using Equation (9):
N SUPP   ( kg   ha 1 ) =   N FERT + NO 3 - N START + ANM
The apparent N loss (ANL) was calculated as the difference between the total N in the soil-plant system at harvest and the NSUPP using Equation (10) according to Hartmann et al. [28]:
ANL   ( kg   ha 1 ) = NY AGB +   NO 3 - N END N SUPP
The N use efficiency (NUE) gives the amount of grain which is produced by the NSUPP. It was calculated using Equation (11) according to Barraclough et al. [2]:
NUE   ( kg   kg 1 ) =   GY N SUPP
The N uptake efficiency (NUpE) was calculated using Equation (12) according to Barraclough et al. [2]:
NUpE   ( % ) =   NY AGB N SUPP × 100
The agronomic N efficiency (ANE) is defined as the increase of GY per unit nitrogen applied and was calculated using Equation (13) according to Yang et al. [3] and Tian et al. [12]:
ANE   ( kg   kg 1 ) =   ( GY FERT     GY CONTROL ) N FERT
where GYFERT or GYCONTROL are the GY in N treatments or the control.
The apparent N recovery efficiency (ANRE) of the applied N was calculated using Equation (14) according to Tian et al. [12] and Liu et al. [14]:
ANRE   ( % )   = ( NY AGB FERT     NY AGB CONTROL N FERT ) × 100
where NYAGB-FERT or NYAGB-CONTROL are the NYAGB (kg ha−1) of the fertilized treatments or the control. A precise method to measure the fertilizer N recovery efficiency is by labelling the fertilizer with 15N to differentiate fertilizer N from the indigenous soil N [2]. The apparent N recovery efficiency is an easier approach but the recovery of the applied N in the fertilized treatments is just ‘apparent’ as the amount of fertilization is also affecting mineralization, and thereby, the difference in the N uptake of the fertilized and the control treatments might not be solely explained by N fertilization. Grain N utilization efficiency (NUtE) was calculated using Equation (15) according to Barraclough et al. [2]:
NUtE   ( kg   kg 1 ) =   GY NY AGB

2.5. Statistical Analysis

Statistical analyses were conducted using IBM® SPSS® Statistics 21. The requirements for analysis of variance (ANOVA) were tested with the Levene test for homogeneity of variances and the Shapiro–Wilk test for normal distribution of residuals. ANOVA tests were carried out to detect growing season (year) and N treatment effects using a general linear model. Multiple comparisons to separate means were carried out with the Student-Newman-Keuls test (p < 0.05). For testing the split effect, the orthogonal dataset was used (i.e., two and three splits of CAN, Urea and Ureastab).

3. Results

3.1. Crop Yields and Yield Components

The means for crop yields, HI and yield components (over all fertilization treatments and both years) were: YAGB—12,504 kg ha−1, GY—5683 kg ha−1, SY—6821 kg ha−1, HI—45.3%, ED—429 m−2, grains ear−1—38.1, TKW—36.0 g, GD—16,247 m−2 and SEY—1.33 g (Table 3).
The YAGB in all N fertilized treatments was higher than in the unfertilized control (by a mean of +24.9% over both years) with no differences between N fertilization treatments.
The GY was highest with Ureastab (50:50:60), Ureastab (100:60:0) and Urea (50:50:60), and lowest for the control with other treatments showing intermediate values. The GY of N fertilized treatments was +23.4% higher than that of the control (mean over all N fertilization treatments and both years). Splitting of CAN, Ureastab and Urea three times (50:50:60) resulted in an increase in GY of 344 kg ha−1 compared to two splits (100:60:0) (6048 vs. 5704 kg ha−1, means over fertilizers and years, p = 0.099, not significant (n.s.)).
The SY did not differ between treatments and also not between years. The SY of N fertilized treatments was +23.4% higher than that of the control (mean over all N fertilization treatments and both years).
There was a significant N fertilization × year interaction for the HI (Table 4). In 2017, the HI was highest in the control and lowest in CAN 100:60:0, Urea 100:60:0 and Ureaincorp 100:60:0, with other treatments showing intermediate values. Whereas in 2018, it was highest in Ureastab 50:50:60 and Ureastab 100:60:0, and lowest in the control. The HI did not differ between the splitting regimes of the individual fertilizers in 2017. Whereas in 2018, applying the fertilizers just once (160:0:0) significantly reduced the HI of Ureastab compared to two- and three-times applications, and two applications of Urea also tended to cause a lower HI than three applications (n.s.). The HI was higher for some fertilization treatments in 2017 than in 2018.
The ED did not differ between treatments and between years. Anyhow, it was +14.3% higher in N fertilized treatments compared to the control (mean over all N fertilization treatments and both years).
The number of grains ear−1 did not differ between fertilization treatments and between years, but the control had the second lowest value after Ureastab (100:60:0) (n.s.). The TKW did not differ between fertilization treatments.
The GD was lower in the control than in the N fertilized treatments, except for Ureastab (100:60:0), which showed intermediate values. The N fertilized treatments, except for Ureastab (100:60:0), had a GD of about 30% higher than the control (mean of both years).
There was a significant N fertilization × year interaction for the SEY (Table 4). In 2017, the SEY was highest in the control and lowest with Ureaincorp, with other treatments showing intermediate values. Whereas in 2018, the SEY was lowest in the control and highest with Ureastab 50:50:60, with all fertilized treatments except Ureastab 160:0:0 and CAN + UANliquid showing higher values than the control. The SEY was higher in all treatments in 2017 than in 2018. Splitting of individual fertilizers tended to decrease the SEY with all fertilizers in 2017 and with Urea in 2018 (n.s.), and significantly decreased the SEY with Ureastab from three to one split in 2018.
On average over all treatments, yield and all yield components except for ED and TKW were higher in 2017 than in 2018: YAGB—+3382 kg ha−1 (=31%), GY—+2271 kg ha−1 (=50%), SY—+1111 kg ha−1 (=18%), HI—+5.9% (=14%), grains ear−1—+21.9 (=81%), GD—+9403 m−2 (=82%) and SEY—+0.52 g (=49%). The ED did not differ between the years. The TKW was +6.9 g (=21%) higher in 2018 than in 2017.

3.2. N Concentration, N Yield and N Harvest Index

The means for N concentration, N yield and NHI (over all treatments and both years) were: GNC—2.62%, SNC—0.43%, NYGRAIN—127.7 kg N ha−1, NYSTRAW—25.6 kg N ha−1, NYAGB—153.3 kg N ha−1 and NHI—82.9% (Table 5).
The GNC was +102% (mean over both years) higher in all N fertilized treatments than in the control. The highest value was observed with CAN + UANliquid, with +122% (mean over both years) compared to the control. The GNC was affected by splitting individual fertilizers as follows: CAN and Urea—no differences between three and two splits, and Ureastab—higher values with three compared to one split, with two splits showing intermediate values. The lowest GNC of the N fertilized treatments was found with Ureastab 160:0:0.
The SNC was +104% (mean over both years) higher in all N fertilized treatments than in the control, with no differences between N treatments. The GNC and SNC did not differ between three or two splits for CAN, Urea or Ureastab. The GNC was 13% higher and the SNC 49% higher in 2018 than in 2017.
The NYGRAIN was +154% (mean over both years) higher in the N fertilized treatments than in the control. There was a significant N fertilization × year interaction for the NYGRAIN (Table 4). All fertilized treatments had a significantly higher uptake than the control. Splitting of individual fertilizers significantly increased the NYGRAIN from two to three splits of CAN in 2017 but not in 2018. No significant differences but higher values with three than two splits were observed for Urea. Whereas, the NYGRAIN with Ureastab increased from one and two splits to three splits in 2017 and one to three splits in 2018. The highest NYGRAIN was obtained by CAN+UANliquid in 2017 and by Ureastab 50:50:60 in 2018. The NYGRAIN was higher in 2017 than in 2018 in all treatments.
The NYSTRAW was +132% (mean over both years) higher in all N fertilized treatments than in the control. It was higher with N fertilization than in the control, except for Ureastab (50:50:60), Ureastab (100:60:0) and Urea (50:50:60), which showed intermediate values. The NYSTRAW of individual fertilizers did not differ between the splitting regimes. The NYSTRAW was 22% higher in 2018 than in 2017.
The NYAGB was +154% (mean over both years) higher in all N fertilized treatments than in the control. The highest value was observed for CAN + UANliquid. The NYAGB was affected by splitting individual fertilizers as follows: CAN and Urea—no differences between three and two splits and Ureastab—higher values with three compared to one split, with two splits showing intermediate values. The NYAGB was 20% higher in 2017 than in 2018.
There was a significant N fertilization × year interaction for the NHI (Table 4). It was highest in 2017 in the control and lowest with Ureaincorp, the other treatments showed generally intermediate values. In 2018, the NHI was lowest in the control and highest in Ureastab (50:50:60). In 2017, splitting of individual fertilizers caused no differences of the NHI. Whereas in 2018, the NHI of Urea was significantly lower with two than with three splits and of Ureastab with one than with two and three splits. The NHI was higher in 2017 than in 2018 except for the control, CAN + UANliquid, Ureastab (160:0:0) and Urea (100:60:0).

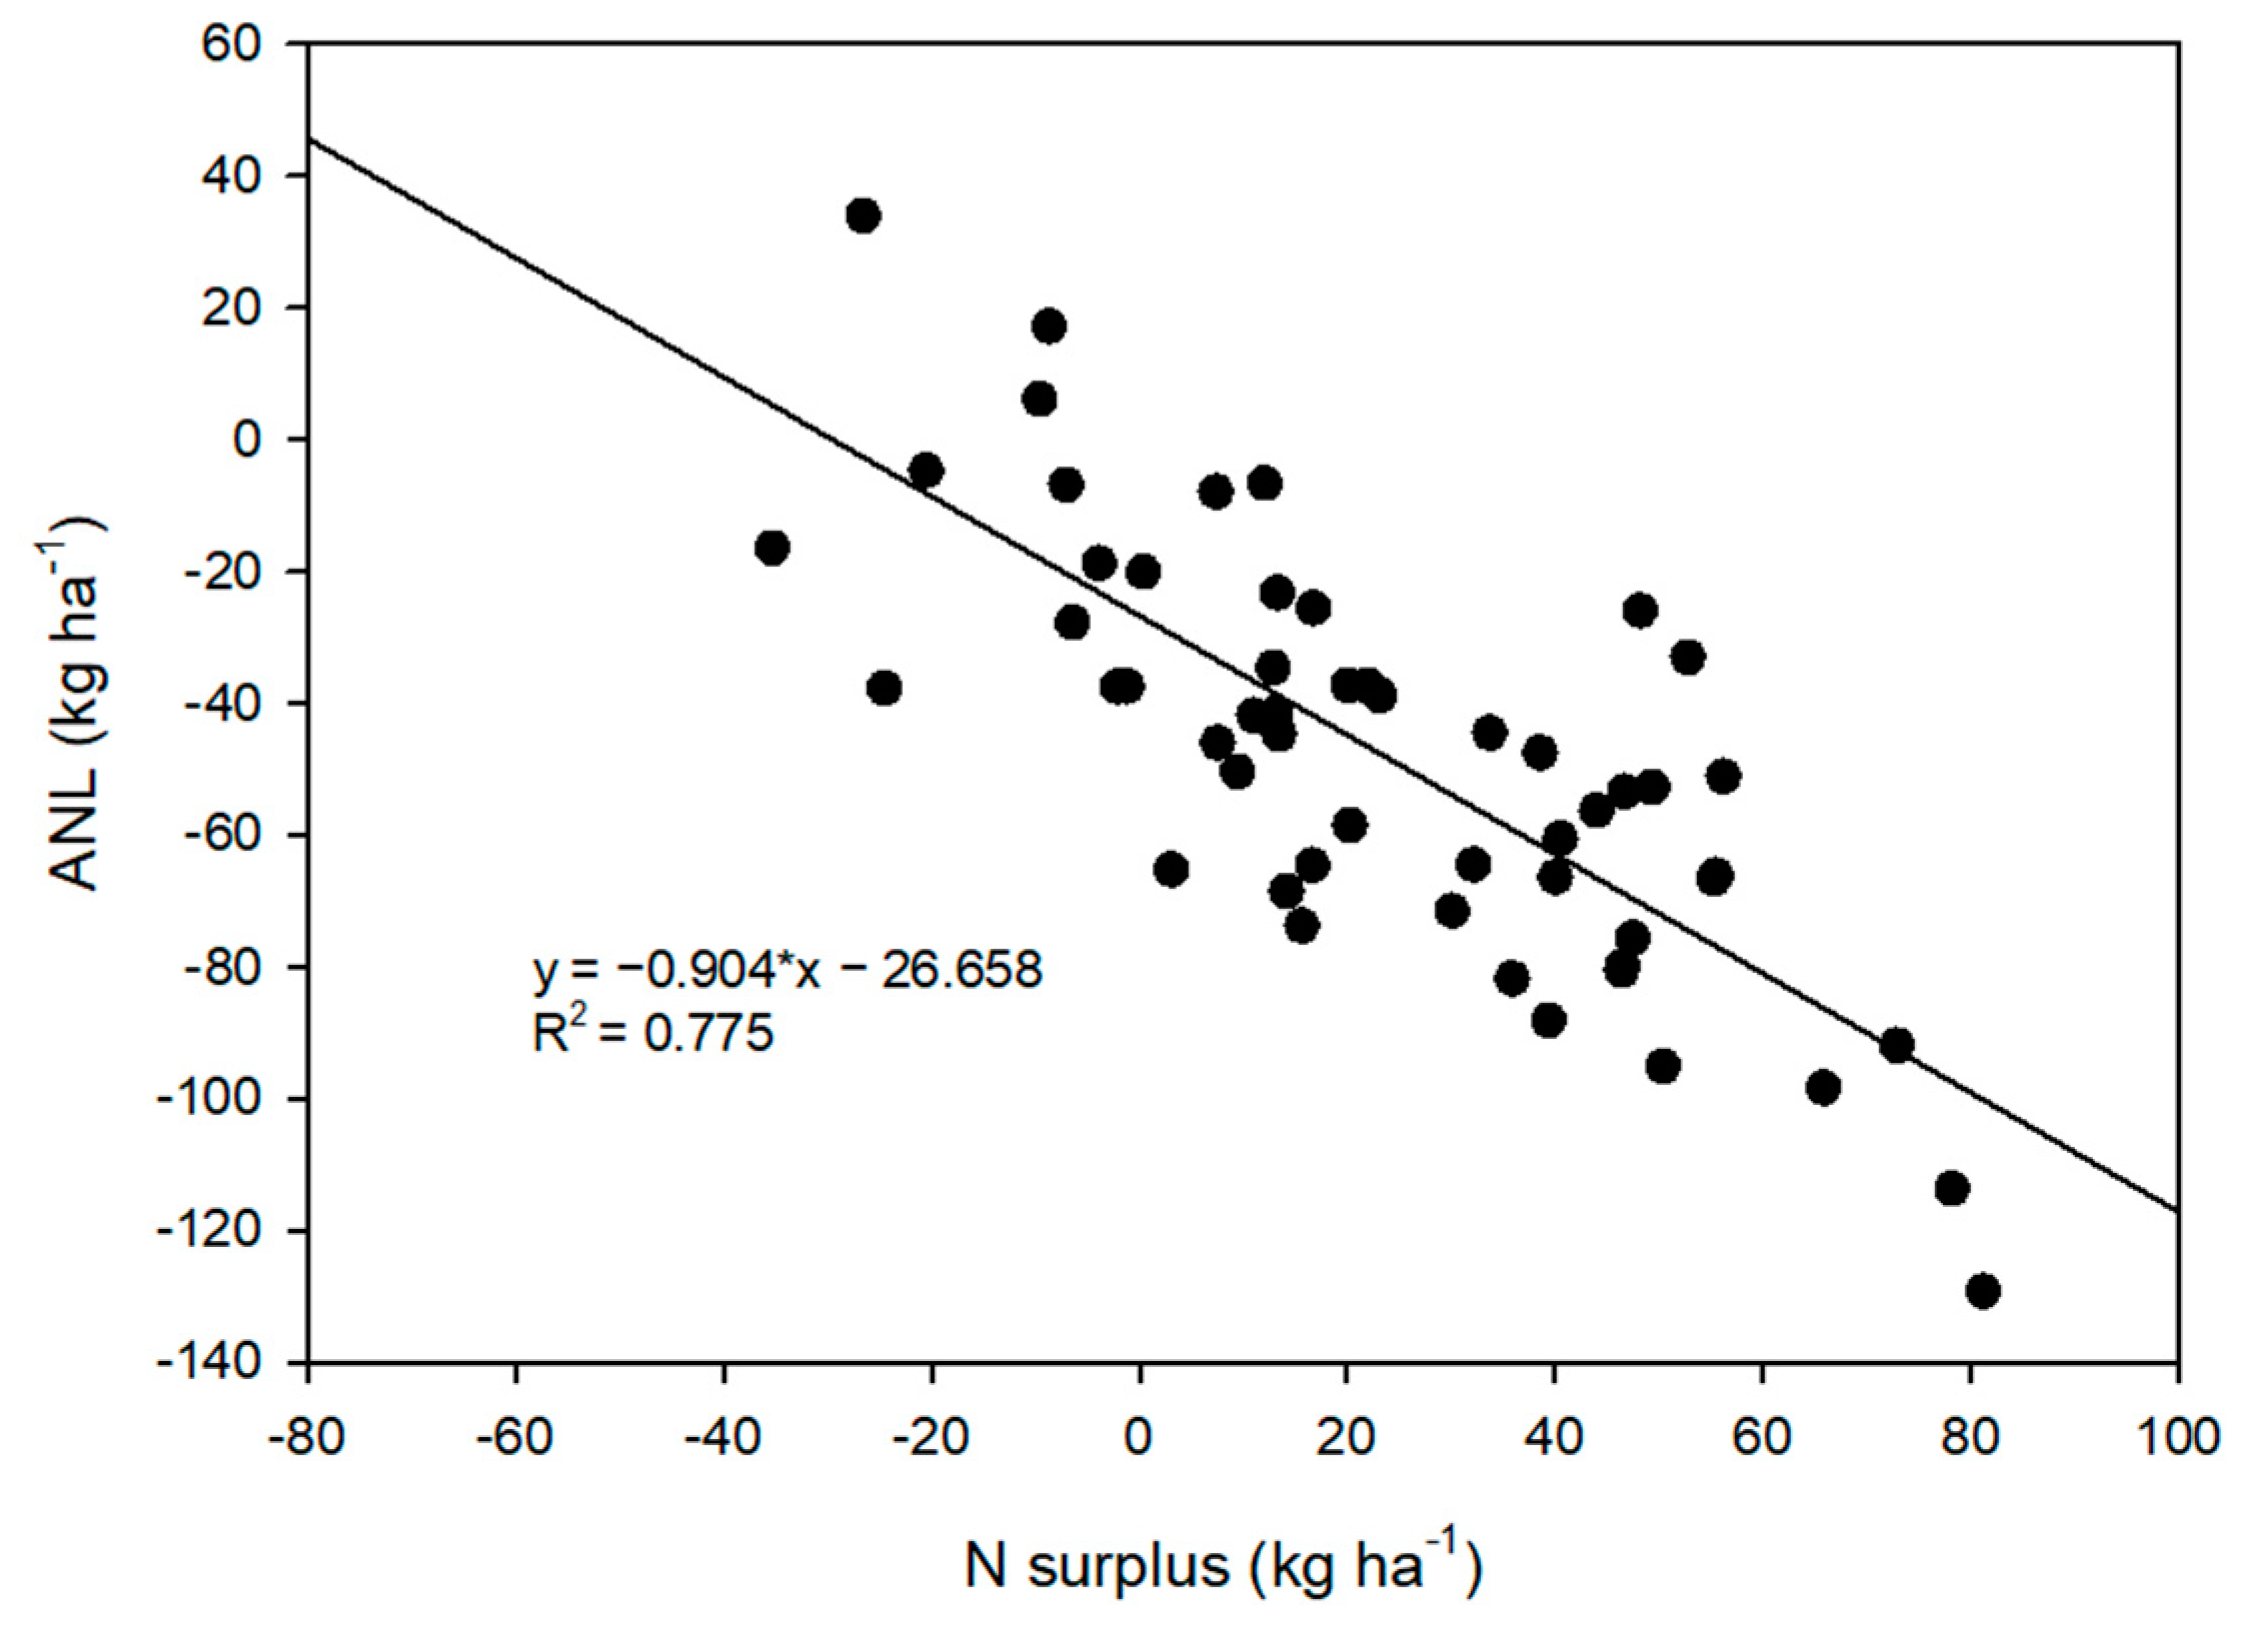
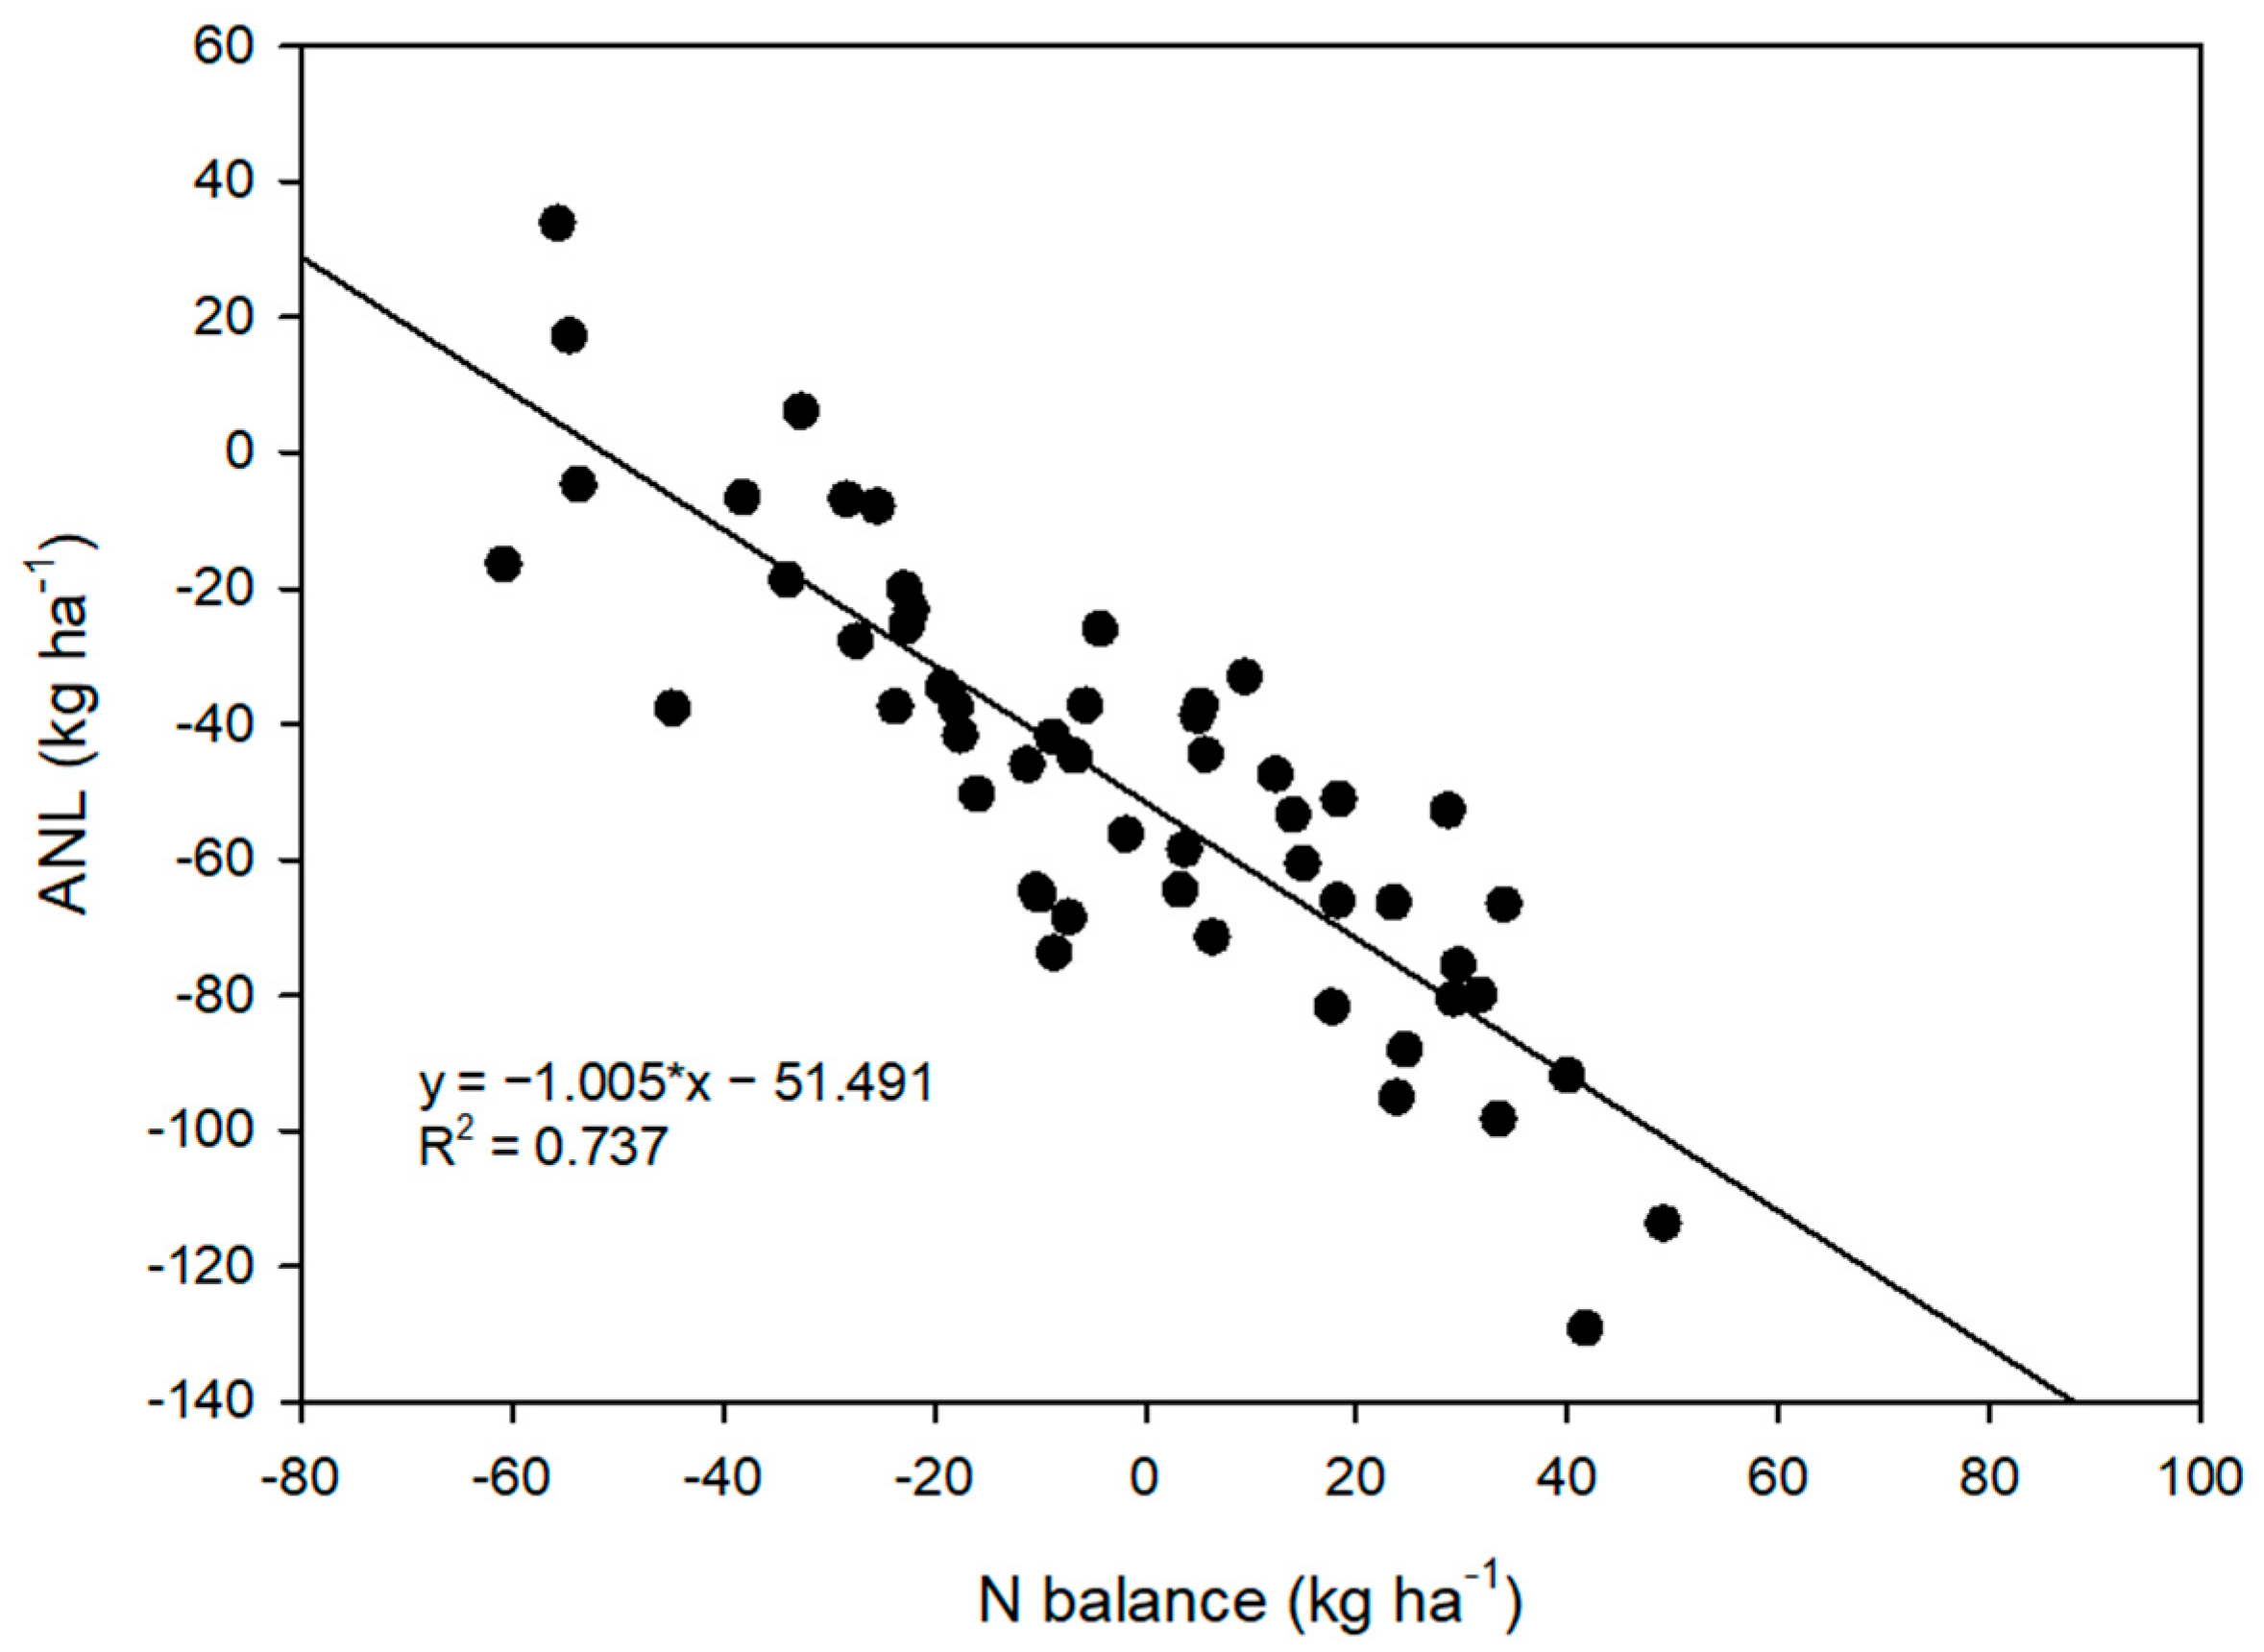
3.3. N Surplus, N Balance, Soil Mineral Nitrate and Apparent N Loss

The means for N surplus, N balance, NO3-N and ANL (over all treatments and both years) were: N surplus—16.3 kg N ha−1, N balance—−9.3 kg N ha−1, NO3-N at the start of the growing season in spring—54.0 kg N ha−1, NO3-N at the end of the growing season—31.5 kg N ha−1 and ANL—48.3 kg ha−1 (Table 6).
The N surplus was between 6.0 kg N ha−1 for Ureastab (50:50:60) and 49.3 kg N ha−1 for Ureastab (160:0:0). Consequently, all values of fertilized treatments were positive. The N balance was between −27.1 kg N ha−1 for CAN + UANliquid (50:50:60) and 21.1 kg N ha−1 for Ureastab (160:0:0), with negative values for all treatments, where the fertilizers were applied in three splits. The mean N surplus or N balance were, in all N fertilized treatments, at 24.0 kg N ha−1 or at −3.1 kg N ha−1, and were thereby 146% or 95% higher than in the control (means over both years). The N surplus and N balance were, in 2018, 25% or 124% higher than in 2017. The three doses application regime (50:60:60) of CAN, Urea and Ureastab resulted in a 18.6 kg N ha−1 lower N surplus than the two doses application regime (100:60:0) (11.5 vs. 30.1 kg N ha−1, means over fertilizers and years, p < 0.001). The N balance was, in the three doses application, 14.7 kg N ha−1 lower than in the two doses application (−11.8 vs. 2.9 kg N ha−1, means over fertilizers and years, p = 0.024).
The NO3-N (0–90 cm) at the end of the growing season was highest in CAN (50:50:60) and CAN + UANliquid and lowest in the control, with other treatments showing intermediate values. There were no differences between the years. The NO3-N (0–90 cm) of N fertilized treatments was +113% higher than that of the control (mean over all N fertilization treatments and both years). Three compared to two splits of CAN, Urea and Ureastab resulted in higher NO3-N content in 0–90 cm (36.9 kg ha−1 vs. 29.9 kg ha−1, means over fertilizers and years, p = 0.080, n.s.) and in 0–60 cm (33.0 kg ha−1 vs. 25.5 kg ha−1 (p = 0.047).
The NO3-N at the end of the growing season was significantly influenced by the treatment in all three soil horizons. The mean values of fertilized treatments were: 0–30 cm—22.9 kg ha−1, 30–60 cm—6.1 kg ha−1, 60–90 cm—4.3 kg ha−1 (means over all fertilizers and years). Thereby, the NO3-N was: in 0–30 cm, 2.66-fold, in 30–60 cm, 1.56-fold, and in 60–90 cm, 1.38-fold higher than in the control. In 0–30 cm, the highest NO3-N was found in CAN (50:50:60) and CAN + UANliquid. In these two treatments, the NO3-N was higher than in the control and in Ureastab (160:0:0). Three compared to two splits of CAN, Urea and Ureastab resulted in a higher NO3-N content in 0–30 cm (27.6 kg ha−1 vs. 19.4 kg ha−1, means over fertilizers and years, p = 0.024). In 30–60 cm, Ureaincorp had a higher NO3-N than the control, with other treatments showing intermediate values. Three compared to two splits of CAN, Urea and Ureastab resulted in a lower NO3-N content in 30–60 cm (5.49 kg ha−1 vs. 6.02 kg ha−1, means over fertilizers and years, n.s.)
In 60–90 cm, Ureastab (100:60:0) and Ureaincorp had a higher NO3-N content than the control, whereas the other treatments showed intermediate values. Three compared to two splits of CAN, Urea and Ureastab resulted in a lower NO3-N content in 60–90 cm (3.87 kg ha−1 vs. 4.40 kg ha−1, means over fertilizers and years, n.s.).
In 2018, the NO3-N content at harvest was significantly higher than in 2017 in this soil. The ANL was highest in Ureastab (160:0:0) with −83.1 kg N ha−1 and lowest in CAN + UANliquid (50:50:60) with −14.0 kg N ha−1. Two times application (100:60:0) of CAN, Urea and Ureastab resulted in a significantly higher ANL than the three times application (50:50:60) strategy (−54.6 kg ha−1 vs. −35.3 kg N ha−1, means over fertilizers and years, p = 0.012). The ANL was significantly higher in 2018 than in 2017.
The correlation between the apparent N loss and the N surplus is shown in Figure 1 and that of the apparent N loss and the N balance in Figure 2. The graphs show that the apparent N loss was negatively correlated with both a higher N surplus and a higher N balance. From the graphs, it can be estimated that a zero-loss of ANL can be reached with a N surplus of −29.5 kg ha−1 and a N balance of −51.2 kg ha−1. A theoretical zero N surplus and zero N balance showed an estimated ANL of −26.7 and −51.5 kg N ha−1.

3.4. Nitrogen Efficiency

The means for the N efficiency parameters (over all fertilization treatments and both years) were: NUE—27.1 kg grain kg−1 NSUPP, NUpE—68.1%, ANE—6.57 kg grain kg−1 NFERT, ANRE—61.8% and NUtE—39.1 kg grain kg−1 NYAGB (Table 7).
The NUE in the control was 34.1 kg grain kg−1 NSUPP (= +144%, mean over both years) higher than in the N fertilized treatments, which did not differ among each other. There was a significant N fertilization × year interaction. In 2017, there were no differences in the NUE between splitting regimes of the individual fertilizers. Whereas in 2018, Ureastab with two and three splits had a higher NUE than with one split. The NUE was higher in all treatments, except for Ureastab 100:60:0 and Ureaincorp, in 2017 than in 2018 (Table 5).
The NUpE in the control was 14.4% (= +22%, mean over both years) higher than in the N fertilized treatments. It was highest in the control and CAN + UANliquid and lowest in Ureastab (160:0:0), with other treatments showing intermediate values. The NUpE was 14% higher in 2017 than in 2018.
The ANE did not differ between fertilizers and splitting rates: it was 76% higher in 2018 than in 2017.
The ANRE of N fertilized treatments was highest for CAN + UANliquid and lowest for Ureastab (160:0:0). The ANRE was 24% higher in 2017 than in 2018. It was affected by N fertilizers as follows (Table 7): The highest ANRE was found in CAN + UANliquid (50:50:60), which was 64% higher than the lowest ANRE in Ureastab (160:0:0). The other treatments showed intermediate values. Through splitting of CAN, Urea and Ureastab, the ANRE increased from 58.0% (two splits) to 67.2% (three splits) (mean over fertilizers and years, p = 0.024).
The NUtE in the control was 35.8 kg grain kg−1 NYAGB (= +101%, mean over both years) higher than in the N fertilized treatments. The NUtE was 26% higher in 2017 than in 2018. A highly significant N fertilization × year interaction was found for NUtE. The NUtE was highest in both years in the control and lowest with CAN + UANliquid. Splitting regimes of individual fertilizers did not affect the NUtE. The NUtE in the control, CAN 100:60:0, Urea 160:0:0 and Ureastab 100:60:0 was higher in 2017 than in 2018 (Table 4).
The NUE, ANE and NUtE of CAN, Urea and Ureastab did not significantly differ between the splitting regimes. There was a tendency of a splitting × year interaction for NUpE of CAN, Urea and Ureastab (p = 0.055, n.s.). NUpE in 2017 and 2018 for the three-splitting regime was 75.5% and 64.9% respectively, and for the two splitting regime was 65.3% and 65.1%, respectively. Splitting CAN, Urea and Ureastab three times (50:50:60) also tended to increase the ANE from 6.0 kg grain kg−1 NFER to 7.9 kg grain kg−1 NFER, thus by 1.9 kg grain kg−1 NFER or +32% (means over the fertilizers, p = 0.099, n.s.). Splitting of CAN, Urea and Ureastab increased the ANRE from 58.0% (two splits) to 67.2% (three splits) (means over fertilizers and years, p = 0.024).
The N efficiency parameters are positively correlated with each other. The Pearson correlation coefficient of NUE with NUpE was 0.63 (p < 0.001), with ANE was 0.27 (p = 0.46), with ANRE was 0.54 (p < 0.001) and with NUtE was 0.91 (p < 0.001).

4. Discussion

4.1. Crop Yields, Nitrogen Concentrations and Yields

The increase of the GY with N fertilization in our experiment explained a higher grain density, which resulted from the tendency of both a higher ear density and more grains ear−1 with N fertilization, whereas the TKW was not affected by N. In the same location, the yield increase of oat with CAN fertilization was attributed to a higher panicle density with no differences in grains panicle−1 or TKW [30].
The lower number of grains ear−1 in 2018 is explained by the dry and cold spring, whereby less productive tillers were generated. The competition of unproductive and productive tillers for water and nutrients in spring was also found by Lu et al. [31]. It is assumed that the intra-plant competition was lower in spring 2017, which allowed the plant to allocate resources into productive stems and favored a higher number of fertile florets.
Three splits compared to two splits of the fertilizers CAN, Urea and Ureastab (urea with nitrification inhibitor) tended to also increase the GY, whereas both the GY and also the YAGB did not differ between fertilizer types. Amount, type and time of N application is affecting the plant-available amount of N in the soil and thereby the formation of yield components [32]. Similar to our observation with a tendency of a higher number of grains ear−1, N fertilization was reported to increase the spikelets of barley [33]. But, contrary to our observation that the TKW of winter wheat was not affected by N fertilization, the grain size of barley was reduced when the N dose was mainly given at early tillering [34]. N fertilization increased grain but not SY of winter wheat in both years. Contrary to that, the GY of spring-sown chickpea, pea, barley and oat was not affected by N fertilization in a two-year experiment in the same location, but the SY was increased in the more humid year but also stayed unaffected in the dry year. Similar to our study, where the GY did not differ between N fertilizer types, the SY of the four spring-sown crops was also not affected by the N fertilizer type [35].
Both GNC and SNC were increased in all N treatments compared to the control. The GNC also differed between splitting regimes of Ureastab, where three splits caused a higher value compared to one split, whereas no differences between splits were observed for CAN and Urea. Consequently, also both the NYGRAIN and NYSTRAW and thereby the NYAGB were more than doubled with N fertilization, with little differences between N treatments, except for a higher NYGRAIN and NYAGB with three compared to one splits of Ureastab, and also a tendency of higher values with more rather than less splits of CAN and Urea. A high protein content in the grain, caused by N fertilization, has a positive effect on wheat grain intended for baking bread, but negatively if the grain is to be used for malt. Higher N concentrations rather than higher yields were also the reason for higher N yields of spring-sown chickpea, pea, barley and oat in the same location in an earlier experiment, whereas in their case, higher values of both the N concentrations and the N yields during crop growth and at harvest were observed for CAN than for a depot fertilizer [36,37]. Similar to our observations, Aufhammer et al. [38] also reported a similar N uptake of maize with different N fertilizer types, attributing this to the high initial soil mineral N contents and a high mineralization from the soil. The differences of the NHI between the unfertilized control and the N treatments were considerably lower than the differences of the N yields in grain and straw, with even a higher NHI in 2017 but the lowest in 2018 for the control. Thus, the reason for the higher N yields in both grain and straw were the better uptake in both with N fertilization but not a better translocation to the grain. Splitting of N doses of Urea and Ureastab but not of CAN enhanced the NHI. Contrary to that, a lower translocation of macro- and micro-nutrients has been reported for oat and pea after fertilization with N [39,40].

4.2. N Surplus, N Balance, Soil Mineral Nitrate and Apparent N Loss

N fertilizer, which is not taken up by the crop during the growing season, will partly accumulate in the soil [3] and partly be lost from the plant-soil system via ammonia volatilization [41] and emissions of gases such N2O and NO [42]. The parameters N surplus, N balance, NO3-N content and ANL provide information if and where non-recovered fertilizer N is remaining in the system.
In our study, much more N has been removed in the fertilized treatments than in the control. Although, the N surplus and the N balance were considerably higher in fertilized treatments. The positive values of the N surplus of the fertilized treatments show that less N has been removed with the NYGRAIN than has been applied with fertilization. Consequently, more N remains with fertilization after the removal of the NYGRAIN in the system for the subsequent crop than initially present. Three split applications of CAN, Urea and Ureastab (urea with nitrification inhibitor) reduced both the N surplus and the N balance, with negative values for the N balance with three splits. At the same time, the NO3-N content at harvest was higher with fertilization than in the control and a higher accumulation occurred with three compared to two splits in the first soil layer (0–30 cm). The combination of initial NO3-N content, N mineralization and NFERT led to a N supply exceeding the crop N demand. This has been explained as a main driving factor for N loss [28].
Both the higher values of N surplus and N balance as well as the higher NO3-N content with three compared to two splits could be obtained as the ANL was considerably lower with three than with two splits. Already, Wallace et al. [43] have reported that deferring the N application can reduce N losses and thereby environmental damage. Enhancing the synchronization between N supply and crop demand especially with more splits is a major task for enhancing the N transfer into the crop [4,14]. But, under Pannonian climate conditions, the crop needs sufficient rainfall for the uptake of the third N dose. In case of low rainfall after application, both the grain yield and the fertilizer uptake might be reduced [43]. The best N treatment regarding highest YAGB and lowest N surplus, N balance and ANL, was CAN + UANliquid, whereas Ureastab (160:0:0) had the worst performance. Similar to that observation, Shi et al. [44] reported a lower N uptake and a higher N loss for basal compared to top-dressed of N to winter wheat.
Sieling and Kage [45] reported a poor correlation between N balances and N leaching and therefore, stated that N balance is not an appropriate indicator for the environmental impact of N fertilization in the short-term but it might if set up over a longer period. Contrary to that, we found a strong negative correlation of both N surplus and N balance with ANL. Under the semi-arid conditions of eastern Austria, N fertilizer loss through volatilization and not through leaching is the problem. For that, the N balance might be a good indicator also in the short-term.

4.3. Nitrogen Efficiency

Several authors have stated that an optimum N fertilizer management is a strategy for improving the N efficiency (e.g., References [2,15,21]). Applying N fertilizer decreased NUE, NUpE and NUtE, which has also been reported by others [3,5,46].
The N efficiency parameters differed between years. These parameters are highly impacted by water availability according to Kirda et al. [47] and Neugschwandtner et al. [46]. As the total sum of rainfall (plus irrigation in 2017) was quite similar in both years, the distribution of the rainfall or the temperature regime might have caused these differences. Crop response to applied nitrogen varies spatially and temporally [48] as environmental systems show a high degree of complexity, there is also a high variability of the nitrogen-use efficiency, depending on season, soil type, N fertilizer input and amount and distribution of rainfall [49].
The N efficiency parameters focusing on yield formation were less affected by splitting of CAN, Urea and Ureastab (urea with nitrification inhibitor), as also, the differences of GY between splitting regimes were small. Splitting had no effect on NUE and NUtE but tended to increase the ANE with three compared to two splits. Schulte auf´m Erley et al. [50] stated that N fertilization tends to decrease the HI and thereby is further impairing N efficiency parameters like NUtE. This effect was also absent in our study, as the HI did not differ between treatments.
Contrary to that, the N efficiency parameters focusing on N uptake and N recovery were affected by fertilization treatments as the effects of fertilization on N concentrations and thereby on N yields were higher than the effects on biomass yields. The NUpE tended to be higher in 2017 with three compared to two splits and the ANRE was significantly higher with three compared to two splits.
High grain protein concentration for high-quality wheat can be expected to have a low NUtE, which was found in our study and was confirmed by Barraclough et al. [2].
Splitting is commonly recommended for producing high-quality wheat for bread-making. This can be achieved, according to Lu et al. [31], especially by low-tillering large-spike cultivars. Schulz et al. [16] on the other hand recommended a reduction of N applications when the protein content in wheat production is not a target, i.e., in ethanol-wheat, where a single application might be sufficient. The low differences in GY in our study support this observation. Especially, as every work operation is costing time and fuel and is affecting the energy efficiency of the production system [7,8,51].
NUE is mainly controlled by NUtE and less by NUpE, as the correlation coefficients show in Section 3.4. The low correlation between NUE and ANE indicated that the two N efficiency parameters should be separately considered. The NUE components NUpE and NUtE have been typically used for characterizing newly developed cereal genotypes [2,9]. NUpE and ANRE can also show potential N losses (leaching, volatilization and denitrification) of N fertilization to the environment [52,53]. For testing the N efficiency of agronomic practices according grain yield and grain protein content, the efficiency parameters NUtE and ANE have been proposed [4,52]. Applying increased amounts of N only has a minor impact on yield above the optimal application but can give significant increases in grain N, however at the expense of NUtE [2,54]. ANE is useful for the economic assessment of the mineral N fertilization, and according to Ladha et al. [55] and Hawkesford [52], can be improved by crop management practices such as amount, timing, placement and N source.

5. Conclusions

In the Pannonian region, water is the most limiting factor for N fertilizer efficiency. In spring, it is necessary to have enough rainfall for developing plants with fertile tillers. Fertile tillers produce more grains ear−1 and affect the GY and N efficiency positively, with lower N losses. Splitting of N fertilizer influenced the crop yield, apparent losses and N efficiency more than the fertilizer type.
Dividing the N rate of 160 kg N ha−1 in three splits (50:50:60) increased the GY and the ANRE and reduced the N surplus and the N balance compared with two splits (100:60:0). Also, the ANL was lower with three compared to two splits which shows that with three splits, the N demand of the crop during the growing period could be better matched. Three splits are therefore recommended under semi-dry conditions in the Pannonian region for producing high-quality wheat for bread-making.
There are many N efficiency parameters for analyzing the fertilization systems. Each of them has a different explanatory power depending on crop yield or/and environmental perspective.

Author Contributions

Conceptualization, G.M. and H.W.; methodology, G.M. and H.W; software, G.M.; validation, R.W.N. and H.-P.K.; formal analysis, G.M.; investigation, G.M.; resources, H.W.; data curation, G.M. and R.W.N.; writing—original draft preparation, G.M. and R.W.N.; writing—review and editing, G.M.; visualization, G.M.; supervision, H.W.; project administration, H.W. and G.M. All authors have read and agreed to the published version of the manuscript.

Funding

This research received no external funding.

Acknowledgments

The authors thank the technical staff of the experimental farm Groß-Enzersdorf of the University of Natural Resources and Life Sciences, Vienna (BOKU), and the students Caroline Gass, Anton Gingl, Stefan Havranek, Tobias Wittmann, Tanja Gruber, Christina Kainz, Laura Messemer, Florian Schraivogl and David Tischler for conducting the field experiments. The authors also want to express their gratitude to Craig Jackson for proofreading.

Conflicts of Interest

The authors declare no conflict of interest.

References

  1. Liu, Z.; Sun, K.; Liu, W.; Gao, T.; Li, G.; Han, H.; Li, Z.; Ning, T. Responses of soil carbon, nitrogen, and wheat and maize productivity to 10 years of decreased nitrogen fertilizer under contrasting tillage systems. Soil Tillage Res. 2020, 196. [Google Scholar] [CrossRef]
  2. Barraclough, P.B.; Howarth, J.R.; Jones, J.; Lopez-Bellido, R.; Parmar, S.; Shepherd, C.E.; Hawkesford, M.J. Nitrogen efficiency of wheat: Genotypic and environmental variation and prospects for improvement. Eur. J. Agron. 2010, 33, 1–11. [Google Scholar] [CrossRef]
  3. Yang, X.; Lu, Y.; Ding, Y.; Yin, X.; Raza, S.; Tong, Y. Optimising nitrogen fertilisation: A key to improving nitrogen-use efficiency and minimising nitrate leaching losses in an intensive wheat/maize rotation (2008–2014). Field Crop. Res. 2017, 206, 1–10. [Google Scholar] [CrossRef]
  4. Santillano-Cázares, J.; Núñez-Ramírez, F.; Ruíz-Alvarado, C.; Cárdenas-Castañeda, M.E.; Ortiz-Monasterio, I. Assessment of fertilizer management strategies aiming to increase nitrogen use efficiency of wheat grown under conservation agriculture. Agronomy 2018, 8, 304. [Google Scholar] [CrossRef] [Green Version]
  5. Zhang, X.; Davidson, E.A.; Mauzerall, D.L.; Searchinger, T.D.; Dumas, P.; Shen, Y. Managing nitrogen for sustainable development. Nature 2015, 528, 51–59. [Google Scholar] [CrossRef] [Green Version]
  6. Dachler, M.; Köchl, A. Der Einfluss von Fruchtfolge, Vorfrucht, Stickstoffdüngung und Einarbeitung der Ernterückstände auf Ertrag und Rohproteingehalt von Winterweizen und nachfolgender Sommergerste. Die Bodenkult J. Land Manag. Food Environ. 2003, 54, 23–34. [Google Scholar]
  7. Moitzi, G.; Neugschwandtner, R.W.; Kaul, H.-P.; Wagentristl, H. Energy efficiency of winter wheat in a long-term tillage experiment under Pannonian climate conditions. Eur. J. Agron. 2019, 103, 24–31. [Google Scholar] [CrossRef]
  8. Moitzi, G.; Thünauer, G.; Robier, J.; Gronauer, A. Energieeinsatz und Energieeffizienz in der Körnermaisproduktion bei unterschiedlicher Stickstoffdüngung in der Südsteiermark. Die Bodenkult J. Land Manag. Food Environ. 2015, 66, 25–37. [Google Scholar]
  9. Moll, R.H.; Kamprath, E.J.; Jackson, W.A. Analysis and interpretation of factors which contribute to efficiency of nitrogen utilization. Agron. J. 1982, 74, 562–564. [Google Scholar] [CrossRef]
  10. Fischer, R.A. Optimizing the use of water and nitrogen through breeding of crops. Plant Soil 1981, 58, 249–278. [Google Scholar] [CrossRef]
  11. Prey, L.; Kipp, S.; Hu, Y.; Schmidhalter, U. Nitrogen use efficiency and carbon traits of high-yielding European hybrid vs. line winter wheat cultivars: Potentials and limitations. Front. Plant Sci. 2019, 9, 1–15. [Google Scholar] [CrossRef] [Green Version]
  12. Tian, Z.; Liu, X.; Gu, S.; Yu, J.; Zhang, L.; Zhang, W.; Jiang, D.; Cao, W.; Dai, T. Postponed and reduced basal nitrogen application improves nitrogen use efficiency and plant growth of winter wheat. J. Integr. Agric. 2018, 17, 2648–2661. [Google Scholar] [CrossRef] [Green Version]
  13. Yin, L.; Dai, X.; He, M. Delayed sowing improves nitrogen utilization efficiency in winter wheat without impacting yield. Field Crop. Res. 2018, 221, 90–97. [Google Scholar] [CrossRef]
  14. Liu, Z.; Gao, F.; Liu, Y.; Yang, J.; Zhen, X.; Li, X.; Li, Y.; Zhao, J.; Li, J.; Qian, B.; et al. Timing and splitting of nitrogen fertilizer supply to increase crop yield and efficiency of nitrogen utilization in a wheat–peanut relay intercropping system in China. Crop J. 2019, 7, 101–112. [Google Scholar] [CrossRef]
  15. Chen, X.; Zhang, F.; Römheld, V.; Horlacher, D.; Schulz, R.; Böning-Zilkens, M.; Wang, P.; Claupein, W. Synchronizing N supply from soil and fertilizer and N demand of winter wheat by an improved Nmin method. Nutr. Cycl. Agroecosyst. 2006, 74, 91–98. [Google Scholar] [CrossRef]
  16. Schulz, R.; Makary, T.; Hubert, S.; Hartung, K.; Gruber, S.; Donath, S.; Döhler, J.; Weiß, K.; Ehrhart, E.; Claupein, W.; et al. Is it necessary to split nitrogen fertilization for winter wheat? On-farm research on Luvisols in South-West Germany. J. Agric. Sci. 2015, 153, 575–587. [Google Scholar] [CrossRef] [Green Version]
  17. Fischbeck, G.; Dennert, J.; Müller, R. N-Dynamik des Bodens, Ertragsbildung und Stickstoffentzug von Winterweizen bei unterschiedlicher Höhe und Verteilung der mineralischen N-Düngung. J. Agron. Crop Sci. 1990, 164, 297–311. [Google Scholar] [CrossRef]
  18. Maidl, F.X.; Panse, A.; Dennert, J.; Ruser, R.; Fischbeck, G. Effect of varied N rates and N timings on yield, N uptake and fertilizer N use efficiency of a six-row and a two-row winter barley. Eur. J. Agron. 1996, 5, 247–257. [Google Scholar] [CrossRef]
  19. Rossmann, A.; Pitann, B.; Mühling, K.-H. Splitting nitrogen applications improves wheat storage protein composition under low N supply. J. Plant Nutr. Soil Sci. 2019, 182, 347–355. [Google Scholar] [CrossRef]
  20. Müller, S.; Ansorge, H.; Weigert, I. Einfluss der Stickstoffdüngung auf Ertrag, Ertragsstruktur und N-Verwertung von Winterweizen—Möglichkeiten und Grenzen der Bestandesführung. Zeitschrift für Pflanzenernährung und Bodenkunde 1991, 154, 115–119. [Google Scholar] [CrossRef]
  21. Hartman, M.D.; Nyborg, M. Effect of early growing season moisture stress on barley utilization of broadcastincorporated and deep-banded urea. Can. J. Soil Sci. 1989, 69, 381–389. [Google Scholar] [CrossRef]
  22. WRB. World reference base for soil resources. In World Soil Resources Reports 2006; No. 103; FAO: Rome, Italy, 2006; ISSN 0532-0488. [Google Scholar]
  23. ZAMG. Klimaübersichten. Zentralanstalt für Meterologie und Geodynamik (ZAMG). ZAMG Online Database. 2019. Available online: http://www.zamg.ac.at/cms/de/klima/klimauebersichten/jahrbuch (accessed on 14 October 2019).
  24. Harty, M.A.; Forrestal, P.J.; Watson, C.J.; McGeough, K.L.; Carolan, R.; Elliot, C.; Krol, D.; Laughlin, R.J.; Richards, K.G.; Lanigan, G.J. Reducing nitrous oxide emissions by changing N fertiliser use from calcium ammonium nitrate (CAN) to urea based formulations. Sci. Total Environ. 2016, 563–564, 576–586. [Google Scholar] [CrossRef] [PubMed] [Green Version]
  25. Witzenberger, A.; Hack, H.; van den Boom, T. Erläuterungen zum BBCH-Dezimal-Code für die Entwicklungsstadien des Getreides—Mit Abbildungen. Gesunde Pflanz. 1989, 41, 384–388. [Google Scholar]
  26. ÖNORM L 1091. Chemische Bodenuntersuchungen: Bestimmung von Mineralischem Stickstoff-Nmin-Methode; Österreichisches Normungsinstitut: Wien, Austria, 2012. [Google Scholar]
  27. Winkler, R.; Botterbrodt, S.; Rabe, E.; Lindhauer, M.G. Stickstoff-/Proteinbestimmung mit der Dumas-Methode in Getreide und Getreideprodukten. Getreide Mehl und Brot 2000, 54, 86–91. [Google Scholar]
  28. Hartmann, T.E.; Yue, S.; Schulz, S.; Chen, X.; Zhang, F.; Müller, T. Nitrogen dynamics, apparent mineralization and balance calculations in a maize—Wheat double cropping system of the North China Plain. Field Crops Res. 2014, 160, 22–30. [Google Scholar] [CrossRef]
  29. Cui, Z.L.; Zhang, F.S.; Chen, X.P.; Miao, Y.X.; Li, J.L.; Shi, L.W.; Xu, L.W.; Ye, Y.L.; Liu, C.S.; Yang, Z.P.; et al. On-farm estimation of indigenous nitrogen supply for site specific nitrogen management in the North China Plain. Nutr. Cycl. Agroecosyst. 2008, 81, 37–47. [Google Scholar] [CrossRef]
  30. Neugschwandtner, R.W.; Kaul, H.-P. Sowing ratio and N fertilization affect yield and yield components of oat and pea in intercrops. Field Crops Res. 2014, 155, 159–163. [Google Scholar] [CrossRef]
  31. Lu, D.; Lu, F.; Pan, J.; Cui, Z.; Zou, C.; Chen, X.; He, M.; Wang, Z. The effects of cultivar and nitrogen management on wheat yield and nitrogen use efficiency in the North China Plain. Field Crops Res. 2015, 171, 157–164. [Google Scholar] [CrossRef]
  32. Heyland, K.-U.; Triebel, U. Gezielte Stickstoffdüngung zur gesteuerten Ertragsbildung von Winterweizen unter Berücksichtigung verschiedener anbautechnischer Maßnahmen. Die Bodenkult J. Land Manag. Food Environ. 1986, 37, 133–148. [Google Scholar]
  33. Aufhammer, W.; Kübler, E. Zur Leistungsfähigkeit von Gerste in Abhängigkeit von Form und Sorte sowie von Standort und Produktionstechnik—II. Die Ertragsrelevanz produktionstechnischer Maßnahmen bei verschiedenen Gerstenformen unter differenzierten Aufwuchsbedingungen. Die Bodenkult J. Land Manag. Food Environ. 1988, 39, 1–13. [Google Scholar]
  34. Aufhammer, W.; Kübler, E. Zur Leistungsfähigkeit von Gerste in Abhängigkeit von Form und Sorte sowie von Standort und Produktionstechnik—III. Die Relevanz produktionstechnischer Maßnahmen für die Kornqualität verschiedenen Gerstenformen unter differenzierten Aufwuchsbedingungen. Die Bodenkult J. Land Manag. Food Environ. 1989, 40, 47–59. [Google Scholar]
  35. Neugschwandtner, R.W.; Wichmann, S.; Gimplinger, D.M.; Wagentristl, H.; Kaul, H.-P. Chickpea performance compared to pea, barley and oat in Central Europe: Growth analysis and yield. Turk. J. Field Crops 2013, 18, 179–184. [Google Scholar]
  36. Neugschwandtner, R.W.; Wagentristl, H.; Kaul, H.-P. Nitrogen concentrations and nitrogen yields of above-ground dry matter of chickpea during crop growth compared to pea, barley and oat in Central Europe. Turk. J. Field Crop. 2014, 19, 136–141. [Google Scholar] [CrossRef] [Green Version]
  37. Neugschwandtner, R.W.; Wagentristl, H.; Kaul, H.-P. Nitrogen yield and nitrogen use of chickpea compared to pea, barley and oat in Central Europe. Intern. J. Plant Prod. 2015, 9, 291–304. [Google Scholar]
  38. Aufhammer, W.; Kübler, E.; Kaul, H.-P. Untersuchungen zur Anpassung des Stickstoff-Angebots aus unterschiedlichen N-Quellen an den Verlauf der N-Aufnahme von Maisbeständen. Z. Pflanz. Bodenkund. 1996, 159, 471–478. [Google Scholar] [CrossRef]
  39. Neugschwandtner, R.W.; Kaul, H.-P. Concentrations and uptake of macronutrients by oat and pea in intercrops in response to N fertilization and sowing ratio. Arch. Agron. Soil Sci. 2016, 62, 1236–1249. [Google Scholar] [CrossRef]
  40. Neugschwandtner, R.W.; Kaul, H.-P. Concentrations and uptake of micronutrients by oat and pea in intercrops in response to N fertilization and sowing ratio. Die Bodenkult. J. Land Manag. Food Environ. 2016, 67, 1–15. [Google Scholar] [CrossRef] [Green Version]
  41. Silva, A.G.B.; Sequeira, C.H.; Sermarini, R.A.; Otto, R. Urease inhibitor NBPT on ammonia volatilisation and crop productivity: A meta-analysis. Agron. J. 2017, 109, 1–13. [Google Scholar] [CrossRef]
  42. Nayak, D.; Saetnan, E.; Cheng, K.; Wang, W.; Koslowski, F.; Cheng, Y.F.; Zhu, W.Y.; Wang, J.K.; Liu, J.X.; Moran, D.; et al. Management opportunities to mitigate greenhouse gas emissions from Chinese agriculture. Agric. Ecosyst. Environ. 2015, 209, 108–124. [Google Scholar] [CrossRef] [Green Version]
  43. Wallace, A.J.; Armstrong, R.D.; Grace, P.R.; Scheer, C.; Partington, D.L. Nitrogen use efficiency of 15N urea applied to wheat based on fertiliser timing and use of inhibitors. Nutr. Cycl. Agroecosyst. 2020, 116, 41–56. [Google Scholar] [CrossRef] [Green Version]
  44. Shi, Z.; Jing, Q.; Cai, J.; Jiang, D.; Cao, W.; Dai, T. The fates of 15N fertilizer in relation to root distributions of winter wheat under different N splits. Eur. J. Agron. 2012, 40, 86–93. [Google Scholar] [CrossRef]
  45. Sieling, K.; Kage, H. N balance as an indicator of N leaching in an oilseed rape—Winter wheat—Winter barley rotation. Agric. Ecosyst. Environ. 2006, 115, 261–269. [Google Scholar] [CrossRef]
  46. Neugschwandtner, R.W.; Kaul, H.-P. Nitrogen uptake, use and utilization efficiency by oat-pea intercrops. Field Crop. Res. 2015, 179, 113–119. [Google Scholar] [CrossRef]
  47. Kirda, C.; Topcu, S.; Kaman, H.; Ulger, A.C.; Yazici, A.; Cetin, M.; Derici, M.R. Grain yield response and N-fertiliser recovery of maize under deficit irrigation. Field Crop. Res. 2005, 93, 132–141. [Google Scholar] [CrossRef]
  48. Robertson, G.P.; Bruulsema, T.W.; Gehl, R.J.; Kanter, D.; Mauzerall, D.L.; Rotz, C.A.; Williams, C.O. Nitrogen–climate interactions in US agriculture. Biogeochemistry 2013, 114, 41–70. [Google Scholar] [CrossRef] [Green Version]
  49. Asseng, S.; Turner, N.C.; Keating, B.A. Analysis of water- and nitrogen-use efficiency of wheat in a Mediterranean climate. Plant Soil 2001, 233, 127–143. [Google Scholar] [CrossRef]
  50. Schulte auf´m Erley, G.; Kaul, H.-P.; Kruse, M.; Aufhammer, W. Yield and nitrogen utilization efficiency of the pseudocereals amaranth, quinoa, and buckwheat under differing nitrogen fertilization. Eur. J. Agron. 2005, 22, 95–100. [Google Scholar] [CrossRef]
  51. Moitzi, G.; Spiegel, H.; Sandén, T.; Vuolo, F.; Essl, L.; Neugschwandtner, R.W.; Wagentristl, H. Energieeinsatz und Energieeffizienz von Winterweizen bei unterschiedlicher mineralischer Stickstoffdüngung im Marchfeld. Die Bodenkult J. Land Manag. Food Environ. 2020, 71, 55–67. [Google Scholar] [CrossRef]
  52. Hawkesford, M.J. Genetic Variation in Traits for Nitrogen Use Efficiency in Wheat. J. Exp. Bot. 2017, 68, 2627–2632. [Google Scholar] [CrossRef]
  53. Raun, W.R.; Johnson, G.V. Improving nitrogen use efficiency for cereal production. Agron. J. 1999, 91, 357–363. [Google Scholar] [CrossRef] [Green Version]
  54. Hawkesford, M.J. Reducing the reliance on nitrogen fertilizer for wheat production. J. Cereal Sci. 2014, 59, 276–283. [Google Scholar] [CrossRef] [PubMed] [Green Version]
  55. Ladha, J.K.; Pathak, H.; Krupnik, T.J.; Six, J.; van Kessel, C. Efficiency of fertilizer nitrogen in cereal production: Retrospects and prospects. Adv. Agron. 2005, 87, 85–156. [Google Scholar]
Figure 1. Correlation between apparent N loss (ANL) and N surplus.
Agriculture 10 00541 g001
Figure 2. Correlation between apparent N loss (ANL) and N balance.
Agriculture 10 00541 g002
Table 1. Long-term average monthly temperature and precipitation (1994–2018) and deviations during the growing seasons 2017 und 2018 (weather station: Groß-Enzersdorf).
Temperature (°C)Precipitation (mm)
1994–2018201720181994–20182017 12018
October10.4−0.8+1.739+25+13
November5.8−1.0+0.433+3−2
December1.2−0.4+1.730−17−3
January0.3−4.1+3.627−15+7
February2.0+0.9−2.922+1−3
March5.7+3.2−2.435−6+5
April11.2−1.2+4.141+14−28
May16.0+0.5+2.563−18+18
June19.5+2.5+1.671−35+3
1 A supplemental irrigation with 30 mm of water was performed on 23 May 2017.
Table 2. Fertilizer types and splitting regimes with growth stages (BBCH [Biologische Bundesanstalt, Bundessortenamt and CHemical industry] -code according to Witzenberger et al. [25]) at the application dates.
Type of N FertilizerPercentage of N in the FertilizerFertilization ScheduleDose of Fertilizer in the Plant Development Stage (kg N ha−1)
Splits First split 5Second split 6Third split 7
Growth stage Tillering
(BBCH 22/23)
Stem elongation
BBCH 31/32)
Ear emergence
(BBCH 52)
Control (N0)-0:0:0000
CAN 12750:50:60505060
CAN27100:60:0100600
Urea4650:50:60505060
Urea46100:60:0100600
Ureastab 24650:50:60505060
Ureastab46100:60:0100600
Ureastab46160:0:016000
Ureaincorp 346100:60:0100 (Ureaincorp)600
CAN+UANliquid 427/3250:50:6050 (CAN)50 (CAN)60 (UANliquid)
1 Calcium ammonium nitrate (27% N), 2 Stabilized urea (46% N) with nitrification-inhibitor (DCD—Dicyandiamid and 1 H-1,2,4 Triazol)—Alzon®, 3 Incorporated urea, 4 Liquid urea ammonium nitrate (8.0% nitrate N, 8.0% ammonium N, 16.0% N carbamide), 5 9 March 2017 or 23 March 2018, 6 25 April 2017 or 27 April 2018, 7 23 May 2017 or 24 May 2018.
Table 3. Above-ground biomass yield (YAGB), grain yield (GY), straw yield (SY), harvest index (HI), ear density (ED), grains ear−1, thousand kernel weight (TKW), grain density (GD) and single ear yield (SEY) depending on fertilizer treatment and year.
N FertilizerN SplittingYAGBGYSYHIEDGrainsTKWGDSEY
(kg ha−1)(kg ha−1)(kg ha−1)(%)(m−2)(ear−1)(g)(m−2)(g)
Control 10,236 a 64604 a563244.738036.335.913,013 a1.27
CAN 150:50:6012,900 b5855 ab704545.043139.035.816,711 b1.37
CAN100:60:012,267 b5354 ab691344.042836.835.915,586 b1.26
Urea50:50:6012,518 b6052 b646648.142439.038.116,325 b1.43
Urea100:60:012,762 b5786 ab697645.043938.035.816,777 b1.32
Ureastab 250:50:6012,713 b6236 b647649.442541.836.017,858 b1.47
Ureastab100:60:012,516 b5971 b654548.045238.535.217,355 b1.33
Ureastab160:0:012,846 b5375 ab747145.043234.037.014,972 ab1.22
Ureaincorp 3100:60:012,516 b5699 ab681745.643038.834.916,818 b1.32
CAN + UANliquid 450:50:6013,761 b5897 ab786442.544938.335.617,051 b1.32
Year
2017 14,194 b6818 b7376 b48.3 b43049.0 b32.6 a20,948 b1.59 b
2018 10,813 a4547 a6265 a42.4 a42827.1 a39.5 b11,545 a1.07 a
ANOVA 5
N treatment (N) **n.s.n.s.n.s.n.s.n.s.***n.s.
Year (Y) ************n.s.************
N × Y n.s. 7n.s.n.s.*n.s.n.s.n.s.n.s.*
1 Calcium ammonium nitrate, 2 Urea with nitrification inhibitor, 3 Incorporated Urea, 4 Liquid urea ammonium nitrate, 5 Analysis of variance, 6 Different letters indicate significant differences. Significant effects: p < 0.05 (*) and p < 0.001 (***), 7 Not significant.
Table 4. Harvest index (HI), single ear yield (SEY), grain N yield (NYGRAIN), N harvest index (NHI), N surplus, N use efficiency (NUE) and N utilization efficiency (NUtE) as affected by N treatment × year.
N FertilizerN SplittingHISEYNYGRAINNHIN SurplusNUENUtE
(%)(g)(kg ha−1)(%)(kg ha−1)(kg grain kg−1 NSUPP)(kg grain kg−1 NYAGB)
20172018201720182017201820172018201720182017201820172018
Control 54.7 c 634.4 a1.78 c0.77 a63.8 a41.5 a91.3 b71.5 a63.8 a−41.5 a74.7 b40.9 c86.7 d56.0 d
CAN 150:50:6048.3 abc41.7 abc1.66 abc1.07 bcd166.6 de126.2 cd87.0 ab82.3 cd−6.6 bc33.8 bc28.2 a19.9 ab36.7 abc30.7 abc
CAN100:60:042.3 a44.3 bbcd1.48 ab1.04 bcd131.2 b124.4 cd84.0 a79.0 bc28.8 d35.6 bc24.7 a19.6 ab39.7 abc29.1 a
Urea50:50:6050.7 bc46.0 bcd1.69 bc1.18 cd163.4 cde126.6 cd89.3 ab84.9 cd−3.4 c33.4 bc28.7 a21.6 ab39.1 abc33.4 abc
Urea100:60:051.3 bc38.3 ab1.59 abc1.04 bcd147.9 bcd109.9 c88.0 ab73.1 ab12.1 cd50.1 c28.8 a19.2 ab42.8 bc29.5 ab
Ureastab 250:50:6048.0 abc50.7 d1.67 abc1.27 d172.5 e135.5 d87.7 ab86.5 e−12.5 bc24.5 b28.5a21.3 ab37.4 abc32.9 abc
Ureastab100:60:046.0 ab50.0 d1.49 ab1.16 bcd140.4 b125.7 cd87.0 ab85.3 e19.6 d34.3 bc26.5 a22.9 b41.2 abc36.5 bc
Ureastab160:0:047.0 abc35.0 a1.50 ab0.94 ab138.8 b82.6 b86.0 ab71.0 a21.2 d77.4 e29.2 a15.0 a43.3 c32.2 abc
Ureaincorp 3100:60:044.7 ab47.0 cd1.44 a1.20 cd146.1 bc107.9 c82.7 a80.9 bcd13.9 cd52.1 c23.7 a21.0 ab35.9 ab38.0 c
CAN + UANliquid 450:50:6048.3 abc36.3 a1.64 abc1.00 abc183.5 e119.4 cd84.7 a75.5 ab−23.5 b40.6 bc28.9 a18.7 ab34.3 a27.5 a
LSD 5 7.80.2320.26.020.26.67.3
1 Calcium ammonium nitrate, 2 Urea with nitrification inhibitor, 3 Incorporated Urea, 4 Liquid urea ammonium nitrate, 5 The least significant difference (LSD) is separating means of N treatment × year interactions. 6 Different letters indicate significant differences (p < 0.05) within years, NSUPP = supplied N, NYAGB = N yield of above-ground biomass.
Table 5. N concentration, N yield and N harvest index depending on fertilizer treatment and year.
N TreatmentN SplittingN ConcentrationN YieldNHI
GNCSNCNYGRAINNYSTRAWNYAGB
(%)(kg ha−1)(%)
Control 1.37 a 60.23 a52.6 a11.7 a64.3 a81.4
CAN 150:50:602.94 cd0.44 b146.4 cd26.1 b172.5 cd84.7
CAN100:60:02.85 cd0.52 b127.8 bc29.7 b157.5 bcd81.5
Urea50:50:602.82 cd0.39 b145.0 cd21.4 ab166.4 bcd87.1
Urea100:60:02.67 bcd0.50 b128.9 bc30.5 b159.4 bcd80.6
Ureastab 250:50:602.91 cd0.42 b154.0 d22.4 ab176.4 cd87.1
Ureastab100:60:02.61 bc0.39 b133.1 bcd21.5 ab154.6 bc86.2
Ureastab160:0:02.44 b0.45 b110.7 b28.2 b138.9 b78.5
Ureaincorp 3100:60:02.61 bc0.48 b127.0 bc28.6 b155.6 bc81.8
CAN + UANliquid 450:50:603.03 d0.53 b151.4 cd35.7 b187.1 d80.1
Year
2017 2.47 a0.35 a145.4 b23.0 a168.5 b86.7 b
2018 2.78 b0.52 b110.0 a28.1 b138.1 a79.0 a
ANOVA 5
N treatment (N) ***************n.s.
Year (Y) ******************
N × Y n.s. 7n.s.*n.s.n.s.**
1 Calcium ammonium nitrate, 2 Urea with nitrification inhibitor, 3 Incorporated Urea, 4 Liquid urea ammonium nitrate, 5 Analysis of variance, 6 Different letters indicate significant differences. Significant effects: p < 0.05 (*), p < 0.01 (**) and p < 0.001 (***), 7 Not significant. GNC = N concentration of grain, SNC = N concentration of staw, NYGRAIN = grain N yield, NYSTRAW = straw N yield, NYAGB = N yield of above-ground biomass, NHI = N harvest index.
Table 6. N surplus, N balance, soil mineral nitrate and apparent N loss (ANL) depending on fertilizer treatment and year.
N TreatmentN SplittingN SurplusN BalanceSoil NO3-NANL
Initial
(0–90 cm)
At Harvest
(0–30 cm)
At Harvest
(30–60 cm)
At Harvest
(60–90 cm)
At Harvest
(0–90 cm)
(kg ha−1)(kg ha−1)(kg ha−1)(kg ha−1)
Control −52.6 a 6−64.3 a49.78.6 a3.9 a3.0 a15.6 a-
CAN 150:50:6013.6 bc−12.6 bc52.233.1 c5.6 ab3.9 ab42.6 b−27.3 cd
CAN100:60:032.2 cd2.5 cd53.122.4 abc6.5 ab4.4 ab33.3 ab−52.7 abcd
Urea50:50:6015.0 bc−6.4 bcd49.622.9 abc5.7 ab4.2 ab32.9 ab−40.6 bcd
Urea100:60:031.1 cd0.7 bcd48.617.9 abc6.0 ab3.9 ab27.8 ab−51.8 abcd
Ureastab 250:50:606.0 b−16.4 bc59.426.6 bc5.2 ab3.5 ab35.2 b−38.0 bcd
Ureastab100:60:026.9 bcd5.5 cd52.218.1 abc5.5 ab5.0 b28.6 ab−59.3 abc
Ureastab160:0:049.3 d21.1 d55.714.2 ab5.6 ab4.1 ab23.8 ab−83.3 a
Ureaincorp 3100:60:033.0 cd4.5 cd65.018.1 abc8.4 b5.3 b31.6 ab−68.1 ab
CAN + UANliquid 450:50:608.6 bc−27.1 b54.332.7 c6.4 ab4.3 ab43.5 b−14.0 d
Year
2017 −1.4 a−24.5 a75.0 b23.75.53.3 a32.5−49.6 b
2018 34.0 b+5.9 b33.0 a19.26.35.0 b30.5−86.6 a
ANOVA 5
N treatment (N) ******n.s.********
Year (Y) *********n.s.n.s.*n.s.***
N × Y *n.s. 7n.s.n.s.n.s.n.s.n.s.n.s.
1 Calcium ammonium nitrate, 2 Urea with nitrification inhibitor, 3 Incorporated Urea, 4 Liquid urea ammonium nitrate, 5 Analysis of variance, 6 Different letters indicate significant differences. Significant effects: p < 0.05 (*), p < 0.01 (**) and p < 0.001 (***), 7 Not significant.
Table 7. N use efficiency (NUE), N uptake efficiency (NUpE), agronomic N efficiency (ANE), apparent N recovery efficiency (ANRE) and N utilization efficiency (NUtE) depending on fertilizer treatment and year.
N FertilizerN SplittingNUENUpEANEANRENUtE
(kg grain kg−1 NSUPP)(%)(kg grain kg−1 NFERT)(%)(kg grain kg−1 NYAGB)
Control 57.8 b 681.1 b 71.3 b
CAN 150:50:6024.0 a70.9 ab6.8667.6 bc33.7 a
CAN100:60:022.1 a65.1 ab4.1258.2 abc34.4 a
Urea50:50:6025.1 a69.3 ab7.9463.8 abc36.2 a
Urea100:60:024.0 a66.7 ab6.4859.4 abc36.1 a
Ureastab 250:50:6024.9 a70.4 ab8.9570.1 bc35.2 a
Ureastab100:60:024.7 a63.8 ab7.5056.4 ab38.8 a
Ureastab160:0:022.1 a56.9 a4.2346.6 a37.8 a
Ureaincorp 3100:60:022.4 a60.8 ab6.0057.0 ab37.0 a
CAN + UANliquid 450:50:6023.8 a76.0 b7.0976.7 c30.9 a
Year
2017 32.2 b72.7 b4.77 a68.4 b43.7 b
2018 22.0 a63.5 a8.38 b55.1 a34.6 a
ANOVA 5
N treatment (N) *****n.s.****
Year (Y) *************
N × Y ***n.s. 7n.s.n.s.***
1 Calcium ammonium nitrate, 2 Urea with nitrification inhibitor, 3 Incorporated Urea, 4 Liquid urea ammonium nitrate, 5 Analysis of variance, 6 Different letters indicate significant differences. Significant effects: p < 0.05 (*), p < 0.01 (**) and p < 0.001 (***), 7 Not significant, NSUPP = supplied N, NFERT = fertilized N, NYAGB = N yield of above-ground biomass.
Publisher’s Note: MDPI stays neutral with regard to jurisdictional claims in published maps and institutional affiliations.

