Sex Differences in the Presence and Severity of Alcohol Hangover Symptoms


Abstract
1. Introduction
2. Methods
Statistical Analysis
3. Results
4. Discussion
4.1. Alcohol Sensitivity during Intoxication and during the Hangover State
4.2. Implications
4.3. Strengths and Limitations
5. Conclusions
Author Contributions
Conflicts of Interest
References
- Van Schrojenstein Lantman, M.; Mackus, M.; van de Loo, A.J.A.E.; Verster, J.C. Development of a definition for the alcohol hangover: Consumer descriptions and expert consensus. Curr. Drug Abus. Rev. 2016, 9, 148–154. [Google Scholar] [CrossRef] [PubMed]
- Frone, M.R.; Verster, J.C. Alcohol hangover and the workplace: A need for research. Curr. Drug Abus. Rev. 2013, 6, 177–179. [Google Scholar] [CrossRef]
- Gjerde, H.; Christophersen, A.S.; Moan, I.S.; Yttredal, B.; Walsh, J.M.; Normann, P.T.; Mørland, J. Use of alcohol and drugs by Norwegian employees: A pilot study using questionnaires and analysis of oral fluid. J. Occup. Med. Toxicol. 2010, 15, 13. [Google Scholar] [CrossRef] [PubMed]
- Verster, J.C.; Bervoets, A.C.; de Klerk, S.; Vreman, R.A.; Olivier, B.; Roth, T.; Brookhuis, K.A. Effects of alcohol hangover on simulated highway driving performance. Psychopharmacology 2014, 231, 2999–3008. [Google Scholar] [CrossRef] [PubMed]
- Verster, J.C.; Van Der Maarel, M.A.; McKinney, A.; Olivier, B.; De Haan, L. Driving during alcohol hangover among Dutch professional truck drivers. Traffic Inj. Prev. 2014, 15, 434–438. [Google Scholar] [CrossRef] [PubMed]
- Hartung, B.; Schwender, H.; Mindiashvili, N.; Ritz-Timme, S.; Malczyk, A.; Daldrup, T. The effect of alcohol hangover on the ability to ride a bicycle. Int. J. Legal Med. 2015, 129, 751–758. [Google Scholar] [CrossRef] [PubMed]
- Frezza, M.; di Padova, C.; Pozzato, G.; Terpin, M.; Baraona, E.; Lieber, C.S. High blood alcohol levels in women. The role of decreased gastric alcohol dehydrogenase activity and first-pass metabolism. N. Engl. J. Med. 1990, 322, 95–99. [Google Scholar] [CrossRef]
- Mumenthaler, M.S.; Taylor, J.L.; O’Hara, R.; Yesavage, J.A. Gender differences in moderate drinking effects. Alcohol Res. Health 1999, 23, 55–64. [Google Scholar]
- Jones, B.M.; Jones, M.K. Alcohol and memory impairment in male and female social drinkers. In Alcohol and Human Memory; Birnbaum, I.M., Parker, E.S., Eds.; Lawrence Erlbaum Associates: Hillsdale, NJ, USA, 1977; pp. 127–138. [Google Scholar]
- Haut, J.S.; Beckwith, B.E.; Petros, T.V.; Russel, S. Gender differences in retrieval from long-term memory following acute intoxication with ethanol. Physiol. Behav. 1989, 45, 1161–1165. [Google Scholar] [CrossRef]
- De Haan, L.; van der Palen, J.A.M.; Olivier, B.; Verster, J.C. Effects of consuming alcohol mixed with energy drinks versus consuming alcohol only on overall alcohol consumption and negative alcohol-related consequences. Int. J. Gen. Med. 2012, 5, 953–960. [Google Scholar]
- Schuckit, M.A.; Smith, T.L.; Tipp, J.E. The self-rating of the effects of alcohol (SRE) form a retrospective measure of the risk for alcoholism. Addiction 1997, 92, 979–988. [Google Scholar] [CrossRef] [PubMed]
- Van de Loo, A.J.A.E.; van Andel, N.; Verster, J.C. The relationship between self-Rating of the Effects of Alcohol (SRE) form scores and subjective intoxication and sleepiness scores after alcohol consumption. J. Psychopharmacol. 2014, 28, 19. [Google Scholar]
- Myrsten, A.-L.; Post, B.; Frankenhaeuser, M. Catecholamine output during and after acute alcoholic intoxication. Percept. Mot. Skills 1971, 33, 652–654. [Google Scholar] [CrossRef] [PubMed]
- Ylikahri, R.H.; Huttunen, M.O.; Eriksson, C.J.P.; Nikklä, E.A. Metabolic studies on the pathogenesis of hangover. Eur. J. Clin. Investig. 1974, 4, 93–100. [Google Scholar] [CrossRef]
- Ylikahri, R.H.; Huttunen, M.O.; Härkönen, M. Effect of alcohol on anterior-pituitary secretion of trophic hormones. Lancet 1976, 1, 1353. [Google Scholar] [CrossRef]
- Ylikahri, R.H.; Leino, T.; Huttunen, M.O.; Poso, A.R.; Eriksson, C.J.P.; Nikkilä, E.A. Effects of fructose and glucose on ethanol-induced metabolic changes and on the intensity of alcohol intoxication and hangover. Eur. J. Clin. Investig. 1974, 6, 93–102. [Google Scholar] [CrossRef]
- Ylikahri, R.H.; Huttunen, M.O.; Härkönen, M.; Leino, T.; Helenius, T.; Liewendahl, K.; Karonen, S.-L. Acute effects of alcohol on anterior pituitary secretion of the tropic hormones. J. Clin. Endocrinol. Metab. 1978, 46, 715–720. [Google Scholar] [CrossRef] [PubMed]
- Linkola, J.; Fyhrquist, F.; Nieminen, M.M.; Weber, T.H.; Tontti, K. Renin aldosterone axis in ethanol intoxication and hangover. Eur. J. Clin. Investig. 1976, 6, 191–194. [Google Scholar] [CrossRef]
- Linkola, J.; Ylikahri, R.; Fyhrquist, F.; Wallenius, M. Plasma vasopressin in ethanol intoxication and hangover. Acta Physiol. Scand. 1978, 104, 180–187. [Google Scholar] [CrossRef]
- Linkola, J.; Fyhrquist, F.; Ylikahri, R. Renin, aldoserone and cortisol during ethanol intoxication and hangover. Acta Physiol. Scand. 1979, 106, 75–82. [Google Scholar] [CrossRef]
- Linkola, J.; Fyhrquist, F.; Ylikahri, R. Adenosine 3′, 5′cyclic monophosphate, calcium and magnesium excretion in ethanol intoxication and hangover. Acta Physiol. Scand. 1979, 107, 333–337. [Google Scholar] [CrossRef]
- Heikkonen, E.; Mäki, T.; Kontula, K.; Ylikahri, R.; Härkönen, M. Effect of Acute Ethanol Intake and Hangover on the Levels of Plasma and Urinary Catecholamines and Lymphocytic β-Adrenergic Receptors. Alcohol. Clin. Exp. Res. 1989, 13, 20–24. [Google Scholar] [CrossRef]
- Newlin, D.B.; Pretorius, M.B. Sons of alcoholics report greater hangover symptoms than sons of nonalcoholics: A pilot study. Alcohol. Clin. Exp. Res. 1990, 14, 713–716. [Google Scholar] [CrossRef] [PubMed]
- Heikkonen, E.; Ylikahri, R.; Roine, R.; Välimäki, M.; Härkönen, M.; Salaspuro, M. The combined effect of alcohol and physical exercise on serum testosterone, luteinizing hormone, and cortisol in males. Alcohol. Clin. Exp. Res. 1996, 20, 711–716. [Google Scholar] [CrossRef] [PubMed]
- Heikkonen, E.; Ylikahri, R.; Roine, R.; Välimäki, M.; Härkönen, M.; Salaspuro, M. Effect of alcohol on exercise-induced changes in serum glucose and serum free fatty acids. Alcohol. Clin. Exp. Res. 1998, 22, 437–443. [Google Scholar] [CrossRef]
- Mäki, T.; Toivonen, L.; Koskinen, P.; Näveri, H.; Härkönen, M.; Leinonen, H. Effect of ethanol drinking, hangover, and exercise on adrenergic activity and heart rate variability in patients with a history of alcohol-induced atrial fibrillation. Am. J. Cardiol. 1998, 82, 317–322. [Google Scholar] [CrossRef]
- Kim, D.J.; Kim, W.; Yoon, S.J.; Choi, B.M.; Kim, J.S.; Go, H.J.; Kim, Y.K.; Jeong, J. Effects of alcohol hangover on cytokine production in healthy subjects. Alcohol 2003, 31, 167–170. [Google Scholar] [CrossRef] [PubMed]
- Carrolli, J.R.; Ashe, W.F.; Roberts, L.B. Influence of the aftereffects of alcohol combined with hypoxia on psychomotor performance. Aerosp. Med. Hum. Perform. 1964, 35, 990–993. [Google Scholar]
- Ideström, C.M.; Cadenius, B. Time Relations of the Effects of Alcohol Compared to Placebo. Psychopharmacologia 1968, 13, 189–200. [Google Scholar] [CrossRef] [PubMed]
- Dowd, P.J.; Wolfe, J.W.; Cramer, R.L. Aftereffects of alcohol on the perception and control pitch altitude during centripetal acceleration. Aerosp. Med. Hum. Perform. 1973, 44, 928–930. [Google Scholar]
- Seppålå, T.; Leino, T.; Linnoila, M.; Huttunen, M.; YIikahri, R. Effects of Hangover on Psychomotor Skills Related to Driving: Modification by Fructose and Glucose. Basic Clin. Pharmacol. Toxicol. 1976, 38, 209–218. [Google Scholar]
- Myrsten, A.; Rydberg, U.; Lamble, R. Alcohol Intoxication and Hangover: Modification of Hangover by Chlormethiazole. Psychopharmacology 1980, 125, 117–125. [Google Scholar] [CrossRef]
- Morrow, D.; Leirer, V.; Yesavage, J. The influence of alcohol and aging on radio communication during flight. Aviat. Space Environ. Med. 1990, 61, 12–20. [Google Scholar] [PubMed]
- Roehrs, T.; Yoon, J.; Roth, T. Nocturnal and next-day effects of ethanol and basal level of sleepiness. Hum. Psychopharmacol. Clin. Exp. 1991, 6, 307–311. [Google Scholar] [CrossRef]
- Lemon, J.; Chesher, G.; Fox, A.; Greeley, J.; Nabke, C. Investigation of the “Hangover” Effects of an Acute Dose of Alcohol on Psychomotor Performance. Alcohol. Clin. Exp. Res. 1993, 17, 665–668. [Google Scholar] [CrossRef]
- Roehrs, T.; Beare, D.; Zorick, F.; Roth, T. Sleepiness and Ethanol Effects on Simulated Driving. Alcohol. Clin. Exp. Res. 1994, 18, 154–158. [Google Scholar] [CrossRef]
- Streufert, S.; Pogash, R.; Braig, D.; Gingrich, D.; Kantner, A.; Landis, R.; Lonardi, L.; Roache, J.; Severs, W. Alcohol Hangover and Managerial Effectiveness. Alcohol. Clin. Exp. Res. 1995, 19, 1141–1146. [Google Scholar] [CrossRef] [PubMed]
- Finnigan, F.; Hammersley, R.; Cooper, T. An examination of next-day hangover effects after a 100 mg/100 mL dose of alcohol in heavy social drinkers. Addiction 1998, 93, 1829–1838. [Google Scholar] [CrossRef] [PubMed]
- Petros, T.; Bridewell, J.; Jensen, W.; Ferraro, F.R.; Bates, J.; Moulton, P.; Turnwell, S.; Rawley, D.; Howe, T.; Gorder, D. Postintoxication Effects of Alcohol on Flight Performance after Moderate and High Blood Alcohol Levels. Int. J. Aviat. Psychol. 2003, 13, 287–300. [Google Scholar] [CrossRef]
- Kocher, H.M.; Warwick, J.; Al-Ghnaniem, R.; Patel, A.G. Surgical dexterity after a “night out on the town”. ANZ J. Surg. 2006, 76, 110–112. [Google Scholar] [CrossRef] [PubMed]
- Gallagher, A.G.; Boyle, E.; Toner, P.; Neary, P.C.; Andersen, D.K.; Satava, R.M.; Seymour, N.E. Persistent next-day effects of excessive alcohol consumption on laparoscopic surgical performance. Arch. Surg. 2011, 146, 419–426. [Google Scholar] [CrossRef] [PubMed]
- Stock, A.K.; Hoffmann, S.; Beste, C. Effects of binge drinking and hangover on response selection sub-processes-a study using EEG and drift diffusion modeling. Addict. Biol. 2017, 22, 1355–1365. [Google Scholar] [CrossRef] [PubMed]
- Wolff, N.; Gussek, P.; Stock, A.-K.A.-K.; Beste, C. Effects of high-dose ethanol intoxication and hangover on cognitive flexibility. Addict. Biol. 2016, 23, 503–514. [Google Scholar] [CrossRef] [PubMed]
- Kruisselbrink, L.D.; Martin, K.L.; Megeney, M.; Fowles, J.R.; Murphy, R.J.L. Physical and psychomotor functioning of females the morning after consuming low to moderate quantities of beer. J. Stud. Alcohol Drugs 2006, 67, 416–420. [Google Scholar] [CrossRef]
- Yesavage, J.A.; Dolhert, N.; Taylor, J.L. Flight Simulator Performance of Younger and Older Aircraft Pilots: Effects of Age and Alcohol. J. Am. Geriatr. Soc. 1994, 42, 577–582. [Google Scholar] [CrossRef]
- Van Dyken, I.; Szlabick, R.E.; Sticca, R.P. Effect of alcohol on surgical dexterity after a night of moderate alcohol intake. Am. J. Surg. 2013, 206, 964–969. [Google Scholar] [CrossRef] [PubMed]
- Anderson, S.; Dawson, J. Neuropsychological correlates of alcoholic hangover. S. Afr. J. Sci. 1999, 95, 145–147. [Google Scholar]
- Chait, L.D.; Perry, J.L. Acute and residual effects of alcohol and marijuana, alone and in combination, on mood and performance. Psychopharmacology 1994, 115, 340–349. [Google Scholar] [CrossRef]
- Grange, J.A.; Stephens, R.; Jones, K.; Owen, L. The effect of alcohol hangover on choice response time. J. Psychopharmacol. 2016, 30, 654–661. [Google Scholar] [CrossRef]
- Howse, A.D.; Hassall, C.D.; Williams, C.C.; Hajcak, G.; Krigolson, O.E. Alcohol hangover impacts learning and reward processing within the medial-frontal cortex. Psychophysiology 2018, 55, e13081. [Google Scholar] [CrossRef]
- McKinney, A.; Coyle, K. Next day effects of a normal night’s drinking on memory and psychomotor performance. Alcohol Alcohol. 2004, 39, 509–513. [Google Scholar] [CrossRef] [PubMed]
- McKinney, A.; Coyle, K. Next-day effects of alcohol and an additional stressor on memory and psychomotor performance. J. Stud. Alcohol Drugs 2007, 68, 446–454. [Google Scholar] [CrossRef] [PubMed]
- Rohsenow, D.J.; Howland, J.; Minsky, S.J.; Arnedt, J.T. Effects of heavy drinking by maritime academy cadets on hangover, perceived sleep, and next-day ship power plant operation. J. Stud. Alcohol Drugs 2006, 67, 406–415. [Google Scholar] [CrossRef]
- Chapman, L.F. Experimental induction of hangover. Q. J. Stud. Alcohol 1970, 5, 67–86. [Google Scholar]
- Collins, W.E.; Chiles, W.D. Laboratory Performance during Acute Alcohol Intoxication and Hangover. Hum. Factors 1978, 22, 445–462. [Google Scholar] [CrossRef]
- Collins, W.E. Performance effects of alcohol intoxication and hangover at ground level and at simulated altitude. Aviat. Space Environ. Med. 1980, 51, 327–335. [Google Scholar]
- Verster, J.C.; van Duin, D.; Volkerts, E.; Schreuder, A.; Verbaten, M. Alcohol hangover effects on memory functioning and vigilance performance after an evening of binge drinking. Neuropsychopharmacology 2003, 28, 740–746. [Google Scholar] [CrossRef]
- Howland, J.; Rohsenow, D.J.; Greece, J.A.; Littlefield, C.A.; Almeida, A.; Heeren, T.; Winter, M.; Bliss, C.A.; Hunt, S.; Herman, J. The effects of binge drinking on college students’ next-day academic test-taking performance and mood state. Addiction 2010, 105, 655–665. [Google Scholar] [CrossRef]
- Rohsenow, D.J.; Howland, J.; Arnedt, J.T.; Almeida, A.B.; Greece, J.; Minsky, S.; Kempler, C.S.; Sales, S. Intoxication with bourbon versus vodka: Effects on hangover, sleep, and next-day neurocognitive performance in young adults. Alcohol: Clin. Exp. Res. 2010, 34, 509–518. [Google Scholar] [CrossRef]
- McKinney, A.; Coyle, K.; Penning, R.; Verster, J.C. Next day effects of naturalistic alcohol consumption on tasks of attention. Hum. Psychopharmacol. 2012, 27, 587–594. [Google Scholar] [CrossRef]
- Laurell, H.; Tornros, J. Investigation of alcoholic hangover effects on driving performance. Natl. Swed. Road Traffic Res. Inst. 1983, 581, 489–499. [Google Scholar]
- Howland, J.; Rohsenow, D.J.; Bliss, C.A.; Almeida, A.B.; Vehige Calise, T.; Heeren, T.; Winter, M. Hangover Predicts Residual Alcohol Effects on Psychomotor Vigilance the Morning After Intoxication. J. Addict. Res. Ther. 2010, 23, 101. [Google Scholar] [CrossRef] [PubMed]
- Harburg, E.; Davis, D.; Cummings, K.M.; Gunn, R. Negative affect, alcohol consumption and hangover symptoms among normal drinkers in a small community. J. Stud. Alcohol Drugs 1981, 42, 998–1012. [Google Scholar] [CrossRef]
- Harburg, E.; Gunn, R.; Gleiberman, L.; DiFranceisco, W.; Schork, A. Psychosocial factors, alcohol use, and hangover signs among social drinkers: A reappraisal. J. Clin. Epidemiol. 1993, 46, 413–422. [Google Scholar] [CrossRef]
- Penning, R.; McKinney, A.; Verster, J.C. Alcohol hangover symptoms and their contribution to overall hangover severity. Alcohol Alcohol. 2012, 47, 248–252. [Google Scholar] [CrossRef] [PubMed]
- Van Schrojenstein Lantman, M.; Mackus, M.; van de Loo, A.J.A.E.; Verster, J.C. The impact of alcohol hangover symptoms on cognitive and physical functioning, and mood. Hum. Psychopharmacol. Clin. Exp. 2017, 32. [Google Scholar] [CrossRef] [PubMed]
- Watson, P.E.; Watson, I.D.; Batt, R.D. Prediction of blood alcohol concentrations in human subjects. Updating the Widmark Equation. J. Stud. Alcohol Drugs 1981, 42, 547–556. [Google Scholar] [CrossRef]
- Hogewoning, A.; Van de Loo, A.J.A.E.; Mackus, M.; Raasveld, S.J.; De Zeeuw, R.; Bosma, E.R.; Bouwmeester, N.H.; Brookhuis, K.A.; Garssen, J.; Verster, J.C. Characteristics of social drinkers with and without a hangover after heavy alcohol consumption. Subst. Abus. Rehabil. 2016, 7, 161–167. [Google Scholar] [CrossRef]
- Rohsenow, D.J.; Howland, J.; Minsky, S.J.; Greece, J.; Almeida, A.; Roehrs, T.A. The acute hangover scale: A new measure of immediate hangover symptoms. Addict. Behav. 2007, 32, 1314–1320. [Google Scholar] [CrossRef]
- Slutske, W.S.; Piasecki, T.M.; Hunt-Carter, E.E. Development and initial validation of the Hangover Symptoms Scale: Prevalence and correlates of Hangover Symptoms in college students. Alcohol. Clin. Exp. Res. 2003, 27, 1442–1450. [Google Scholar] [CrossRef]
- Penning, R.; McKinney, A.; Bus, L.D.; Olivier, B.; Slot, K.; Verster, J.C. Measurement of alcohol hangover severity: Development of the Alcohol Hangover Severity Scale (AHSS). Psychopharmacology 2013, 225, 803–810. [Google Scholar] [CrossRef] [PubMed]
- Verster, J.C.; Stephens, R.; Penning, R.; Rohsenow, D.; McGeary, J.; Levy, D.; McKinney, A.; Finnigan, F.; Piasecki, T.M.; Adan, A.; et al. The alcohol hangover research group consensus statement on best practice in alcohol hangover research. Curr. Drug Abus. Rev. 2010, 3, 116–126. [Google Scholar] [CrossRef]
- Piasecki, T.M.; Alley, K.J.; Slutske, W.S.; Wood, P.K.; Sher, K.J.; Shiffman, S.; Heath, A.C. Low Sensitivity to Alcohol: Relations with Hangover Occurrence and Susceptibility in an Ecological Momentary Assessment Investigation. J. Stud. Alcohol Drugs 2012, 73, 925–932. [Google Scholar] [CrossRef] [PubMed]
- Rohsenow, D.J.; Howland, J.; Winter, M.; Bliss, C.A.; Littlefield, C.A.; Heeren, T.C.; Calise, T.V. Hangover sensitivity after controlled alcohol administration as predictor of post-college drinking. J. Abnorm. Psychol. 2012, 121, 270–275. [Google Scholar] [CrossRef] [PubMed]
- Van Schrojenstein Lantman, M.; Mackus, M.; Roth, T.; Verster, J.C. Total sleep time, alcohol consumption and the duration and severity of alcohol hangover. Nat. Sci. Sleep 2017, 9, 181–186. [Google Scholar] [CrossRef] [PubMed]
- Van Schrojenstein Lantman, M.; Roth, T.; Roehrs, T.; Verster, J.C. Alcohol hangover, sleep quality, and daytime sleepiness. Sleep Vigil. 2017, 1, 37–41. [Google Scholar] [CrossRef]
- Bang, J.S.; Chung, Y.H.; Chung, S.J.; Lee, H.S.; Song, E.H.; Shin, Y.K.; Lee, Y.J.; Kim, H.C.; Nam, Y.; Jeong, J.H. Clinical effect of a polysaccharide-rich extract of Acanthopanax senticosus on alcohol hangover. Pharmazie 2015, 70, 269–273. [Google Scholar] [PubMed]
- Chauhan, B.L.; Kulkarni, R.D. Effects of Liv.52, a herbal preparation, on absorption and metabolism of ethanol in humans. Eur. J. Clin. Pharmacol. 1991, 40, 189–191. [Google Scholar]
- Lee, H.S.; Isse, T.; Kawamoto, T.; Baik, H.W.; Park, J.Y.; Yang, M. Effect of Korean pear (Pyruspyrifolia cv. Shingo) juice on hangover severity following alcohol consumption. Food Chem. Toxocol. 2013, 58, 101–106. [Google Scholar] [CrossRef]
- Lee, M.H.; Kwak, J.H.; Jeon, G.; Lee, J.W.; Seo, J.H.; Lee, H.S. and Lee, J.H. Red ginseng relieves the effects of alcohol consumption and hangover symptoms in healthy men: A randomized crossover study. Food Funct. 2014, 5, 528–534. [Google Scholar] [CrossRef]
- Muhonen, T.; Jokelainen, K.; Höök-Nikanne, J.; Methuen, T.; Salaspuro, M. Tropisetron and hangover. Addict. Biol. 1997, 2, 461–462. [Google Scholar] [CrossRef] [PubMed]
- Noh, K.H.; Jang, J.H.; Kim, J.J.; Shin, J.H.; Kim, D.K.; Song, Y.S. Effect of dandelion juice supplementation on alcohol-induced oxidative stress and hangover in healthy male college students. J. Korean Soc. Food Sci. Nutr. 2009, 38, 683–693. [Google Scholar] [CrossRef]
- Verster, J.C.; Penning, R. Treatment and prevention of alcohol hangover. Curr. Drug Abus. Rev. 2010, 3, 103–109. [Google Scholar] [CrossRef]
- Jayawardena, R.; Thejani, T.; Ranasinghe, P.; Fernando, D.; Verster, J.C. Interventions for treatment and/or prevention of alcohol hangover: Systematic review. Hum. Psychopharmacol. Clin. Exp. 2017, 32, e2600. [Google Scholar] [CrossRef] [PubMed]
- Mallett, K.A.; Lee, C.M.; Neighbors, C.; Larimer, M.E.; Turrisi, R. Do we learn from our mistakes? An examination of the impact of negative alcohol-related consequences on college students’ drinking patterns and perceptions. J. Stud. Alcohol 2006, 67, 269–276. [Google Scholar] [CrossRef] [PubMed]
- Mackus, M.; van Schrojenstein Lantman, M.; van de Loo, A.J.A.E.; Nutt, D.J.; Verster, J.C. An effective hangover treatment: Friend or foe? Drug Sci. Policy Law 2017. [Google Scholar] [CrossRef]
- Courtney, K.E.; Worley, M.; Castro, N.; Tapert, S.F. The effects of alcohol hangover on future drinking behavior and the development of alcohol problems. Addict. Behav. 2018, 78, 209–215. [Google Scholar] [CrossRef]
- Greenblatt, D.J.; Harmatz, J.S.; Roth, T. Zolpidem and gender: Are women really at risk? J. Clin. Psychopharmacol. 2019, 39, 189–199. [Google Scholar] [CrossRef]
- Food and Drug Administration (FDA). Guideline for the study and evaluation of gender differences in the clinical evaluation of drugs. Fed. Regist. 1993, 58, 39406–39416. [Google Scholar]
- European Medicines Agency (EMA). Gender Considerations in the Conduct of Clinical Trials. Available online: https://www.ema.europa.eu/en/documents/scientific-guideline/ich-gender-considerations-conduct-clinical-trials-step-5_en.pdf (accessed on 18 May 2019).
- Tolstrup, J.S.; Stephens, R.; Grønbaek, M. Does the severity of hangovers decline with age? Survey of the incidence of hangover in different age groups. Alcohol. Clin. Exp. Res. 2014, 38, 466–470. [Google Scholar] [CrossRef]
- Kanny, D.; Liu, Y.; Brewer, R.D. Binge drinking-United States, 2009. MMWR Surveill. Summ. 2011, 60, 101–104. [Google Scholar]
- Prat, G.; Adan, A.; Sánchez-Turet, M. Alcohol hangover: A critical review of explanatory factors. Hum. Psychopharmacol. 2009, 24, 259–267. [Google Scholar] [CrossRef] [PubMed]
- Tipple, C.T.; Benson, S.; Scholey, A. A Review of the Physiological Factors Associated with Alcohol Hangover. Curr. Drug Abus. Rev. 2016, 9, 93–98. [Google Scholar] [CrossRef] [PubMed]


| Demographics | Overall | Men | Women | p-Value |
|---|---|---|---|---|
| (n = 1765) | (n = 895) | (n = 870) | ||
| Age (years) | 20.9 (2.3) | 21 (2.4) | 20.7 (2.2) | 0.003 * |
| Body weight (kg) | 71.9 (12.2) | 77.4 (11.3) | 66.3 (10.5) | 0.000 * |
| Alcoholic drinks per week | 13.2 (9.8) | 16.6 (10.6) | 9.7 (7.5) | 0.000 * |
| Latest Past Month Drinking Session that Produced a Hangover | ||||
| Number of alcoholic drinks | 12.1 (4.7) | 14.1 (5) | 10.0 (3.4) | 0.000 * |
| Duration of the drinking session (h) | 5.8 (2.0) | 6.0 (2) | 5.5 (1.9) | 0.000 * |
| eBAC (%) | 0.18 (0.08) | 0.18 (0.08) | 0.18 (0.08) | 0.321 |
| Overall hangover severity | 6.1 (1.9) | 6.1 (1.8) | 6.2 (1.9) | 0.367 |
| Symptoms | Mean (SD) All | % All | Mean (SD) Men | % Men | Mean (SD) Women | % Women |
|---|---|---|---|---|---|---|
| Headache | 5.7 (2.5) | 91% | 5.7 (2.4) | 90.7% | 5.8 (2.5) | 91.3% |
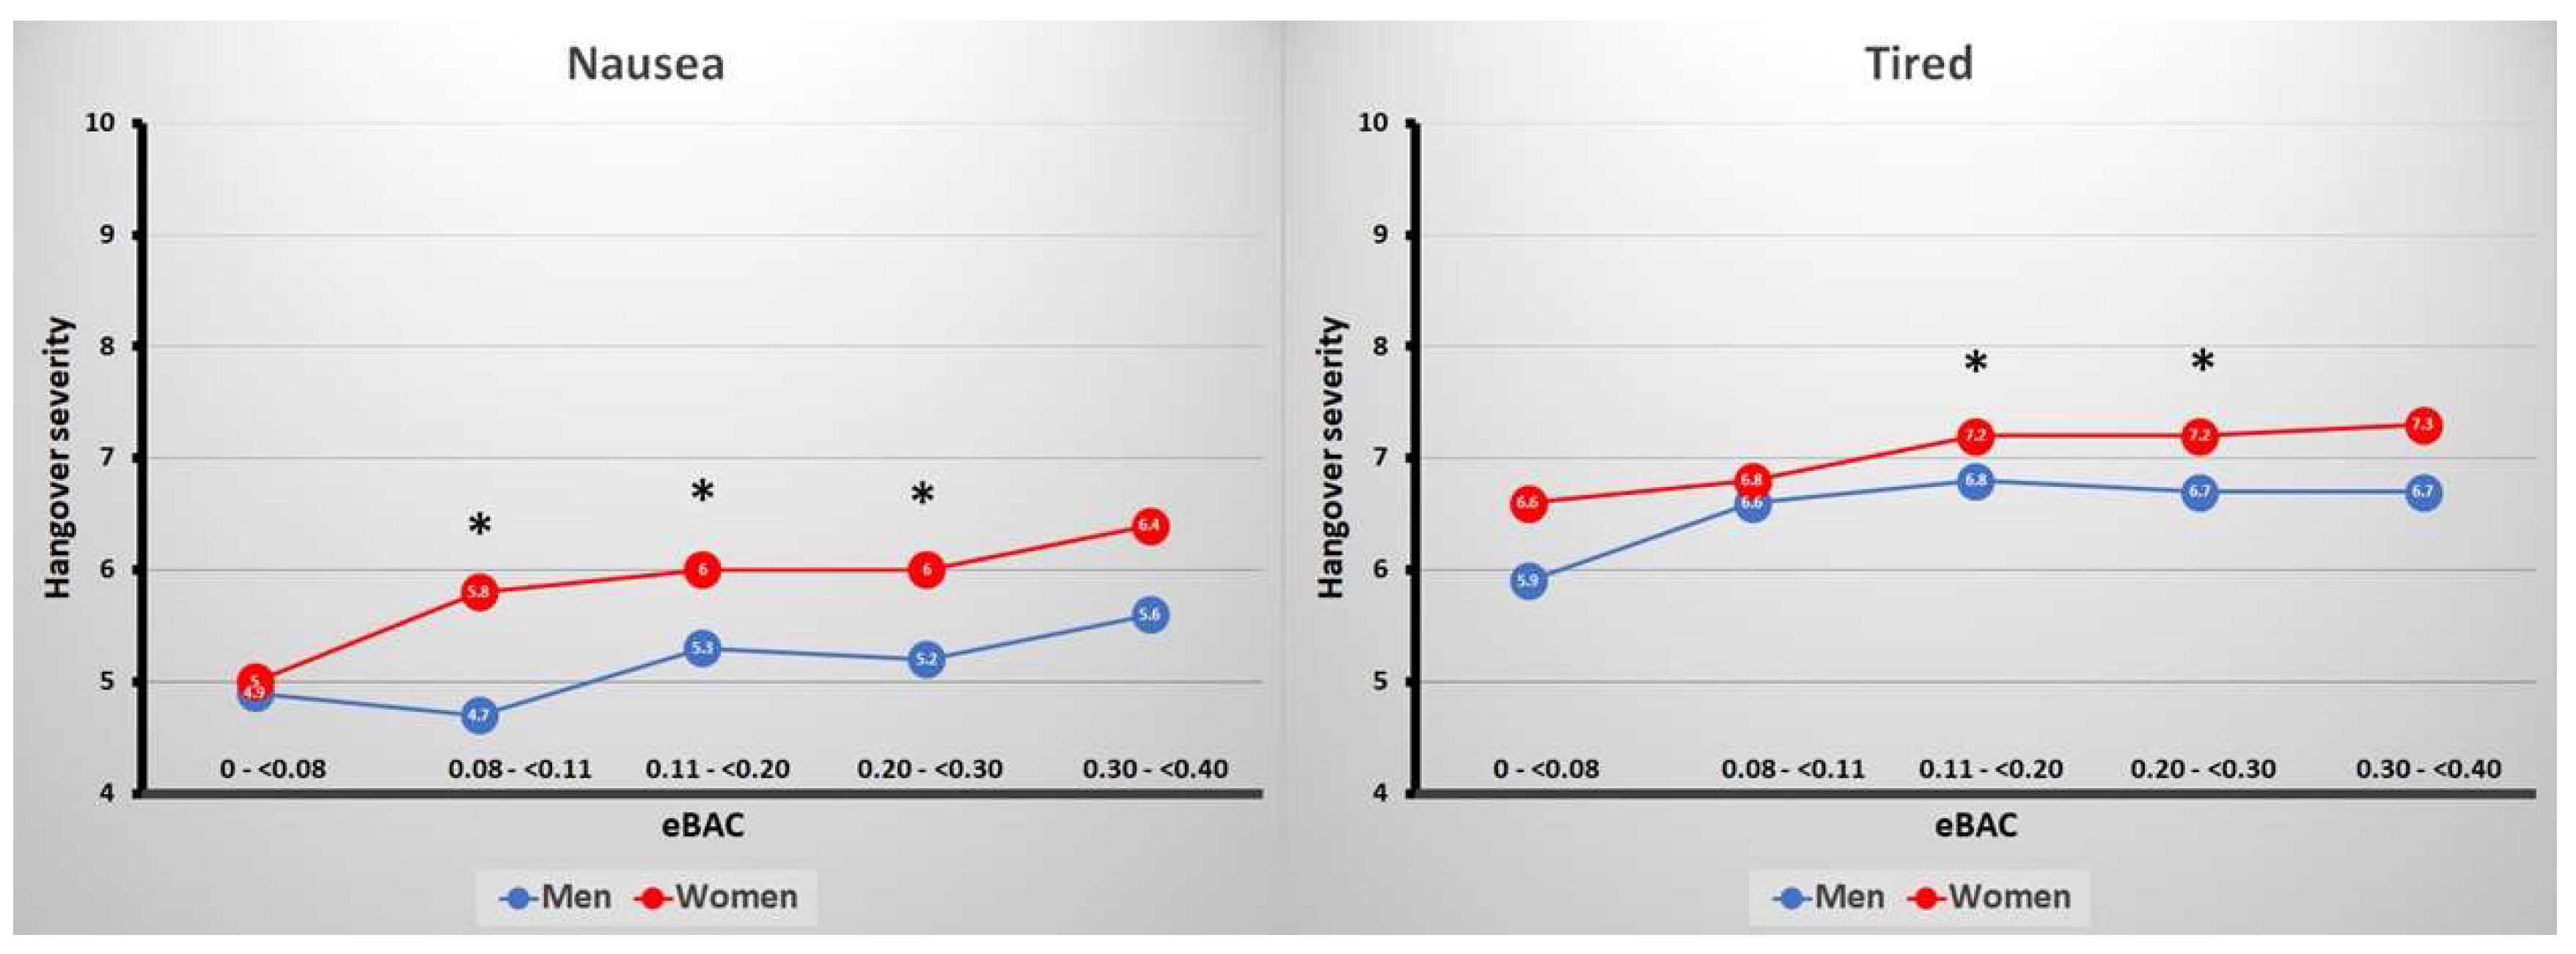
| Nausea | 5.6 (2.6) | 86% | 5.2 (2.5) | 84.1% | 5.9 (2.7) * | 87.5% |
| Concentration problems | 6.0 (2.4) | 91.1% | 6.1 (2.4) | 92.2% | 5.8 (2.5) | 90.1% |
| Regret | 4.5 (2.7) | 58.9% | 4.4 (2.7) | 57.1% | 4.6 (2.7) | 60.2% |
| Sleepiness | 6.6 (2.3) | 94.9% | 6.4 (2.3) | 94.3% | 6.8 (2.2) * | 95.3% |
| Heart pounding | 4 (2.4) | 35.5% | 4 (2.4) | 35.7% | 4.0 (2.5) | 35.3% |
| Vomiting | 5.3 (3.2) | 26% | 4.8 (3.1) | 23.5% | 5.6 (3.2) * | 28.1% |
| Tired | 6.9 (2.2) | 97.7% | 6.6 (2.2) | 96.8% | 7.1 (2.2) * | 98.4% |
| Shivering | 4.2 (2.5) | 45.7% | 4.2 (2.5) | 41.4% | 4.3 (2.5) | 49.1%* |
| Clumsy | 4.9 (2.4) | 72.2% | 4.8 (2.4) | 72.4% | 4.9 (2.4) | 72.1% |
| Weakness | 5.4 (2.4) | 85.2% | 5.1 (2.4) | 83.4% | 5.6 (2.4) * | 86.7% |
| Dizziness | 4.4 (2.6) | 62.3% | 4.1 (2.4) | 61% | 4.6 (2.7) * | 63.3% |
| Apathy | 5.8 (2.5) | 80.1% | 5.6 (2.5) | 78.3% | 5.9 (2.6) | 81.5% |
| Sweating | 4.3 (2.4) | 54.8% | 4.3 (2.4) | 58.5% | 4.3 (2.5) | 51.7%* |
| Stomach Pain | 4.4 (2.5) | 57.3% | 4.3 (2.4) | 54.4% | 4.5 (2.5) | 59.7% |
| Confusion | 4.2 (2.4) | 46.3% | 4.1 (2.4) | 49.9% | 4.2 (4.5) | 43.4%* |
| Light sensitivity | 4.1 (2.4) | 52.2% | 3.9 (2.3) | 52.4% | 4.3 (2.4) * | 52% |
| Thirst | 6.7 (2.4) | 94.5% | 6.7 (2.4) | 95% | 6.6 (2.4) | 94.1% |
| Heart racing | 4.2 (2.5) | 41.6% | 4.2 (2.5) | 45.7% | 4.1 (2.5) | 38.3%* |
| Anxiety | 3.2 (2.4) | 18.3% | 3.2 (2.4) | 17.4% | 3.2 (2.4) | 19.1% |
| Depression | 3.8 (2.5) | 29.9% | 3.9 (2.5) | 28.9% | 3.8 (2.5) | 30.6% |
| Reduced appetite | 5.5 (2.6) | 70.1% | 5.5 (2.6) | 69.9% | 5.5 (2.6) | 70.3% |
| Symptoms | Mean (SD) All | % All | Mean (SD) Men | % Men | Mean (SD) Women | % Women |
|---|---|---|---|---|---|---|
| Headache | 5.5 (2.3) | 90.3% | 5.7 (2.2) | 89% | 5.4 (2.5) | 91.4% |
| Nausea | 4.9 (2.6) | 82.2% | 4.9 (2.6) | 80% | 5 (2.6) | 84.1% |
| Concentration problems | 5.3 (2.4) | 85.4% | 5.4 (2.2) | 86% | 5.3 (2.6) | 84.9% |
| Regret | 4.1 (2.8) | 50.0% | 4.2 (2.8) | 52.9% | 4.1 (2.8) | 47.4% |
| Sleepiness | 6.2 (2.3) | 92.7% | 5.8 (2.3) | 91.1% | 6.5 (2.3) | 94.1% |
| Heart pounding | 3.8 (2.5) | 30.2% | 3.8 (2.7) | 37.5% | 3.8 (2.2) | 23.7% |
| Vomiting | 4.5 (3.1) | 20.5% | 4.4 (3.2) | 22.1% | 4.7 (3.1) | 19.1% |
| Tired | 6.3 (2.4) | 97.2% | 5.9 (2.3) | 95.6% | 6.6 (2.4) | 98.7% |
| Shivering | 3.8 (2.2) | 34.4% | 3.9 (2.4) | 36% | 3.6 (2.0) | 32.9% |
| Clumsy | 4.3 (2.3) | 56.6% | 4.3 (2) | 56.6% | 4.3 (2.5) | 56.6% |
| Weakness | 4.8 (2.4) | 74.3% | 4.7(2.4) | 72.8% | 5 (2.4) | 75.7% |
| Dizziness | 3.9 (2.4) | 52.8% | 3.8 (2.3) | 55.9% | 4 (2.6) | 50.0% |
| Apathy | 5.5 (2.6) | 74.2% | 5.3 (2.6) | 71.9% | 5.8 (2.5) | 76.3% |
| Sweating | 4.1 (2.4) | 44.6% | 4.4 (2.4) | 48.5% | 3.8 (2.5) | 41.1% |
| Stomach Pain | 3.8 (2.2) | 55.4% | 3.8 (2.4) | 53.7% | 3.8 (2.1) | 57.0% |
| Confusion | 3.6 (2.5) | 36.8% | 3.8 (2.4) | 41.2% | 3.4 (2.6) | 32.9% |
| Light sensitivity | 4 (2.3) | 42% | 3.7 (2.3) | 44.1% | 4.3 (2.2) | 40.1% |
| Thirst | 6 (2.5) | 90.9% | 5.9 (2.4) | 88.9% | 6.1 (2.5) | 92.7% |
| Heart racing | 4 (2.6) | 30.3% | 4.2 (2.8) | 36.3% | 3.8 (2.4) | 25% |
| Anxiety | 3.1 (2.4) | 12.9% | 3.5 (2.8) | 14.7% | 2.6 (1.8) | 11.3% |
| Depression | 3.7 (2.3) | 24.6% | 3.9 (2.4) | 25.9% | 3.4 (2.1) | 23.3% |
| Reduced appetite | 4.6 (2.6) | 60.4% | 4.3 (2.5) | 56.6% | 4.8 (2.6) | 63.8% |
| Symptoms | Mean (SD) All | % All | Mean (SD) Men | % Men | Mean (SD) Women | % Women |
|---|---|---|---|---|---|---|
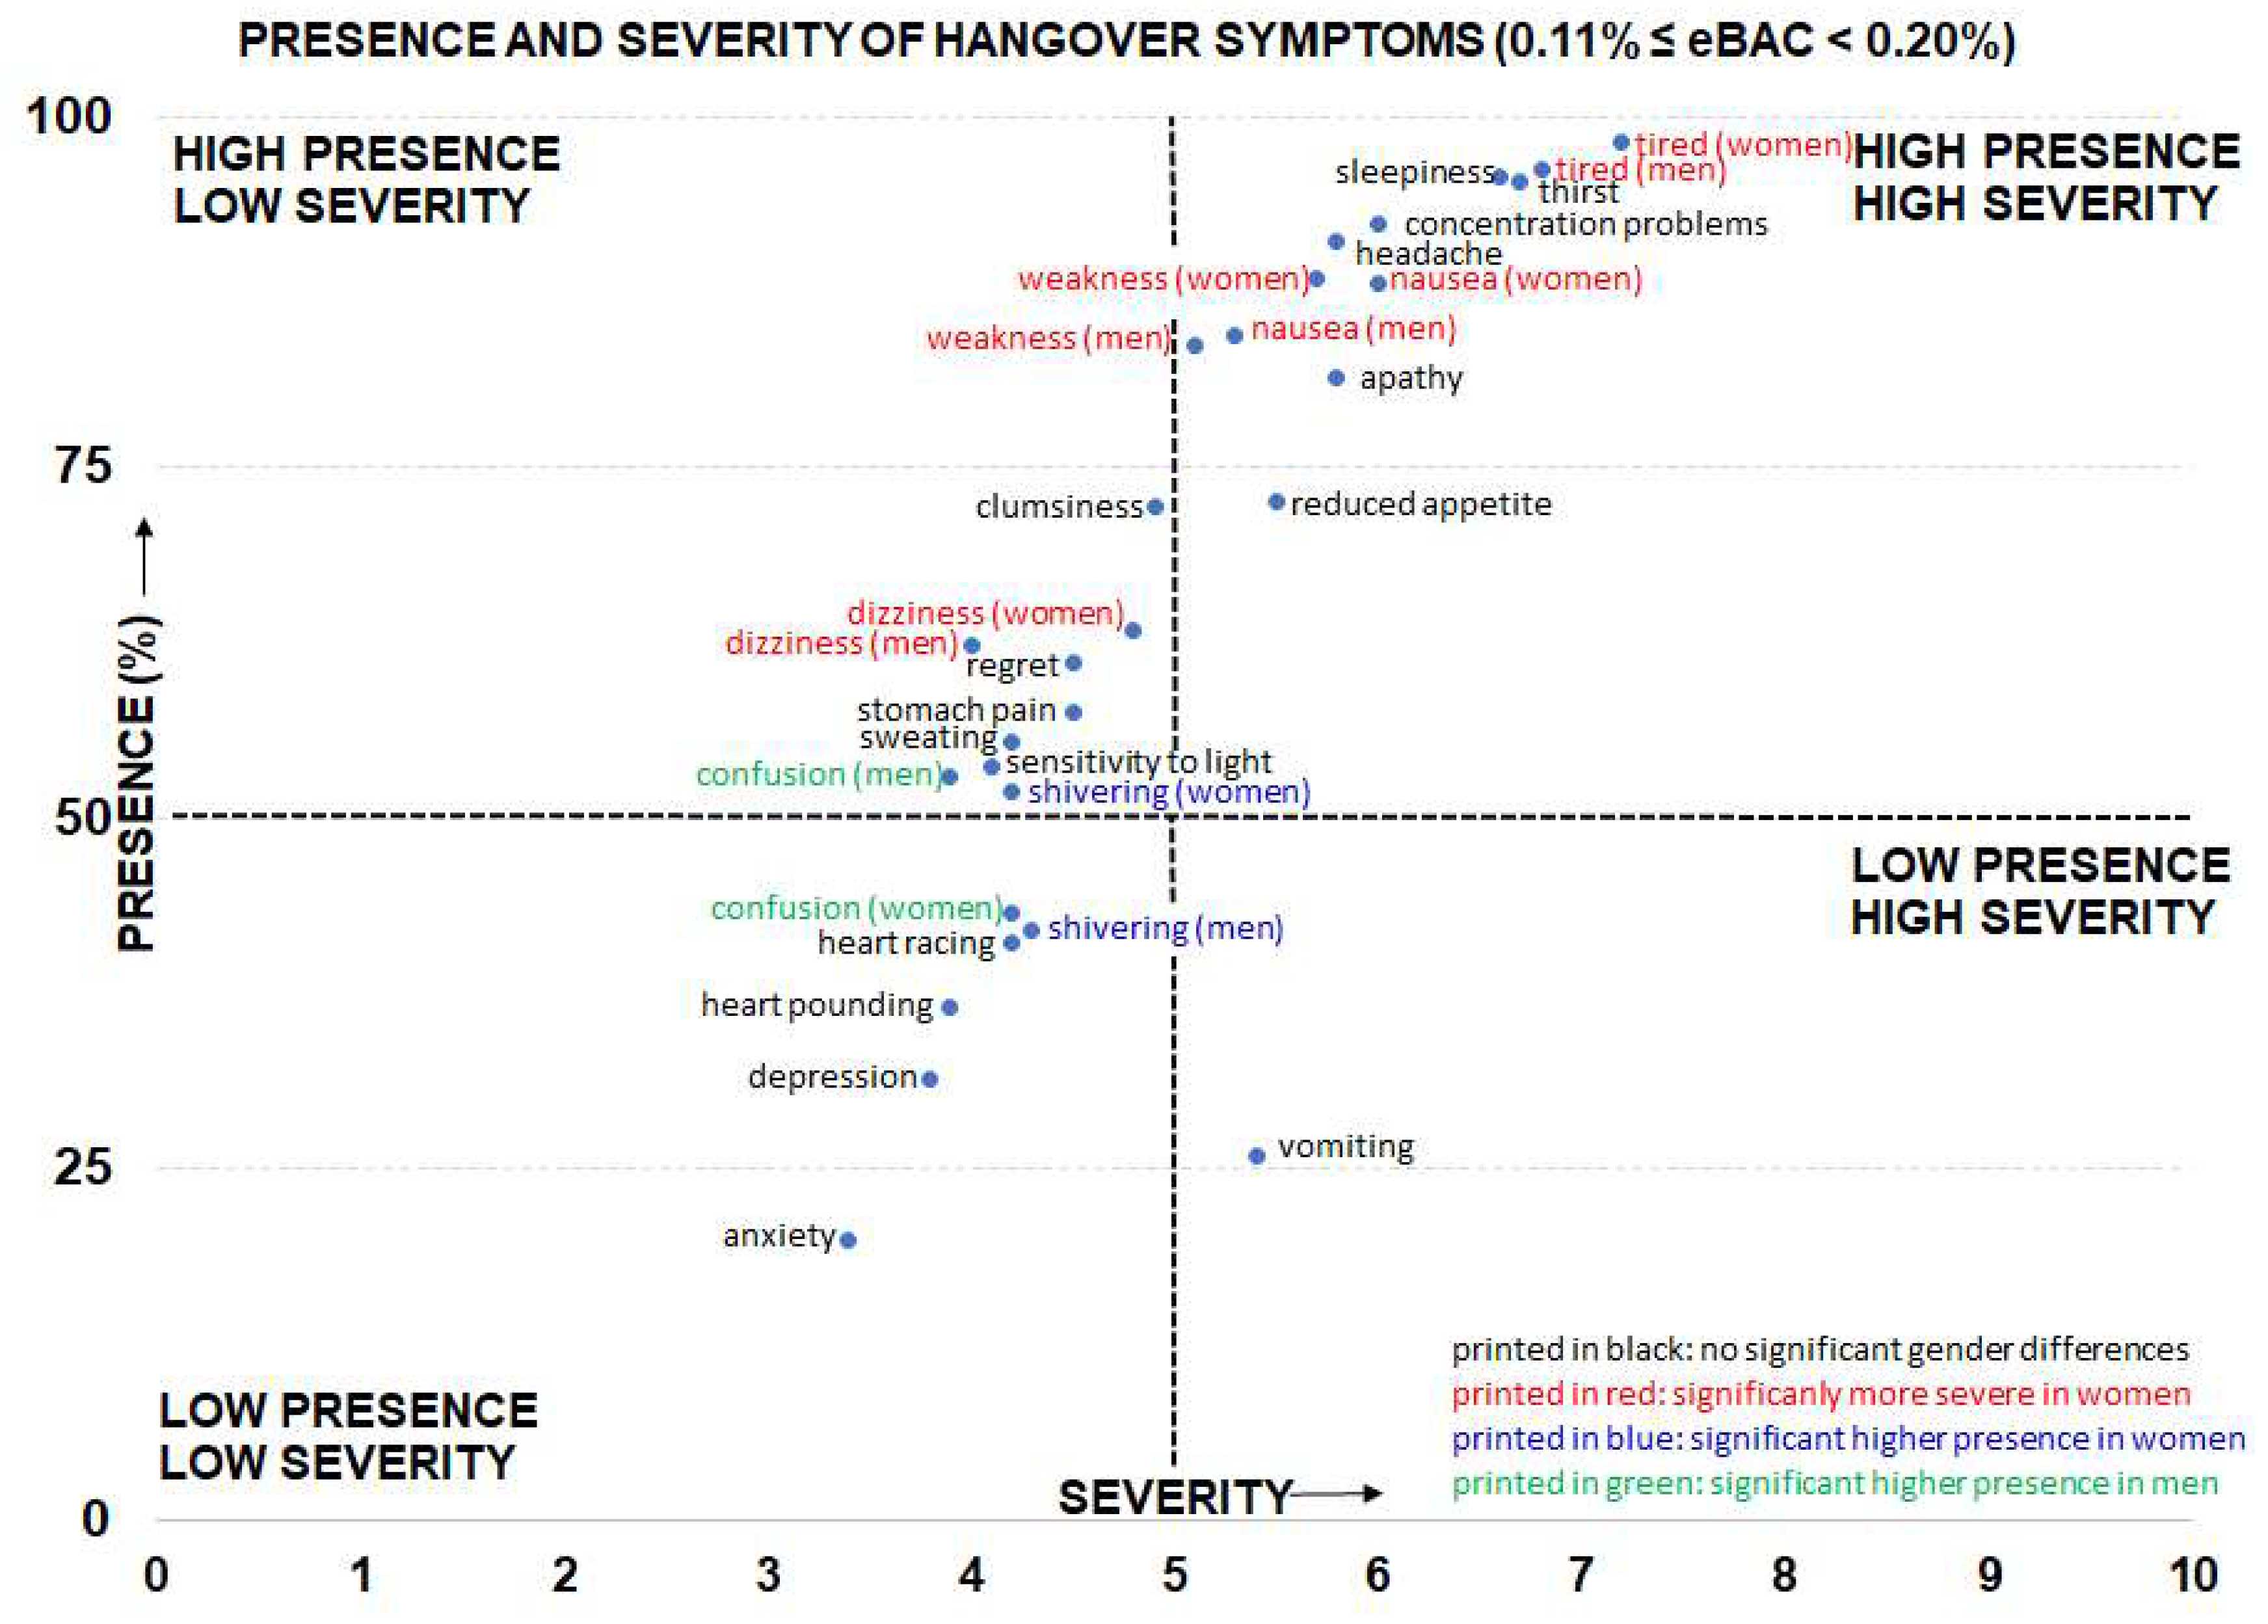
| Headache | 5.6 (2.4) | 88.8% | 5.7 (2.3) | 89.3% | 5.4 (2.5) | 88.4% |
| Nausea | 5.3 (2.6) | 83% | 4.7 (2.5) | 83.5% | 5.8 (2.6) * | 82.6% |
| Concentration problems | 5.4 (2.4) | 88.4% | 5.9 (2.2) | 87.6% | 5.1 (2.5) | 89% |
| Regret | 4.4 (2.6) | 59.8% | 4.5 (2.7) | 57% | 4.3 (2.6) | 61.9% |
| Sleepiness | 6.4 (2.4) | 92.8% | 6.1 (2.4) | 91.7% | 6.5 (2.4) | 93.5% |
| Heart pounding | 3.5 (2.3) | 32.6% | 3.6 (2.4) | 29.8% | 3.4 (2.2) | 34.8% |
| Vomiting | 5.2 (3.1) | 21.4% | 4 (3.1) | 15.7% | 5.8 (3.0) | 25.8% |
| Tired | 6.7 (2.3) | 96.4% | 6.6 (2.2) | 95% | 6.8 (2.4) | 97.4% |
| Shivering | 4.2 (2.7) | 42% | 3.5 (2.5) | 35.5% | 4.6 (2.7) | 47.1% |
| Clumsy | 4.5 (2.3) | 69.1% | 4.6 (2.4) | 68.6% | 4.3 (2.3) | 69.5% |
| Weakness | 5.2 (2.3) | 86.2% | 4.9 (2.3) | 84.3% | 5.3 (2.3) | 87.7% |
| Dizziness | 4.3 (2.6) | 58% | 4.3 (2.3) | 55.4% | 4.2 (2.7) | 60% |
| Apathy | 5.5 (2.5) | 77.5% | 5.5 (2.3) | 71.1% | 5.5 (2.6) | 82.5% |
| Sweating | 3.9 (2.3) | 48.6% | 3.6 (2.2) | 49.6% | 4.2 (2.4) | 47.7% |
| Stomach Pain | 4.4 (2.6) | 52.6% | 4.1 (2.3) | 53.3% | 4.7 (2.8) | 51.9% |
| Confusion | 3.8 (2.2) | 37.1% | 3.7 (2.1) | 40.5% | 3.9 (2.4) | 34.4% |
| Light sensitivity | 4.1 (2.4) | 50% | 3.9 (2.3) | 50.4% | 4.2 (2.6) | 49.7% |
| Thirst | 6.4 (2.5) | 93.1% | 6.5 (2.5) | 94.2% | 6.3 (2.5) | 92.3% |
| Heart racing | 3.4 (2.2) | 38.9% | 3.4 (2.1) | 43% | 3.4 (2.3) | 35.7% |
| Anxiety | 2.9 (2.3) | 16.4% | 2.7 (1.9) | 15.8% | 3 (2.7) | 16.9% |
| Depression | 3.7 (2.5) | 30.4% | 3.4 (2.4) | 25.6% | 3.9 (2.5) | 34.2% |
| Reduced appetite | 5.6 (2.5) | 62% | 5.4 (2.6) | 61.2% | 5.8 (2.5) | 62.6% |
| Symptoms | Mean (SD) All | % All | Mean (SD) Men | % Men | Mean (SD) Women | % Women |
|---|---|---|---|---|---|---|
| Headache | 5.8 (2.4) | 91.1% | 5.6 (2.5) | 90.5% | 5.9 (2.4) | 91.7% |
| Nausea | 5.7 (2.7) | 86.4% | 5.3 (2.7) | 84.4% | 6 (2.6) * | 88.1% |
| Concentration problems | 6.0 (2.4) | 92.3% | 6.1 (2.3) | 94.6% | 6 (2.4) | 90.5% |
| Regret | 4.5 (2.7) | 61.1% | 4.2 (2.6) | 58.8% | 4.7 (2.7) | 62.9% |
| Sleepiness | 6.6 (2.3) | 95.7% | 6.4 (2.3) | 96.3% | 6.8 (2.2) | 95.2% |
| Heart pounding | 3.9 (2.4) | 36.3% | 4 (2.4) | 36.2% | 3.9 (2.4) | 36.3% |
| Vomiting | 5.4 (3.1) | 26% | 5 (3.1) | 23.5% | 5.6 (3.1) | 28.1% |
| Tired | 7 (2.2) | 97.3% | 6.8 (2.2) | 96.3% | 7.2 (2.1) * | 98.1% |
| Shivering | 4.2 (2.6) | 47.6% | 4.3 (2.5) | 42% | 4.2 (2.7) | 51.9%* |
| Clumsy | 4.9 (2.4) | 72.2% | 5 (2.4) | 73.7% | 4.9 (2.5) | 71.1% |
| Weakness | 5.4 (2.4) | 86.3% | 5.1 (2.4) | 83.7% | 5.7 (2.4) * | 88.4% |
| Dizziness | 4.4 (2.5) | 62.9% | 4.0 (2.4) | 62.4% | 4.8 (2.6) * | 63.4% |
| Apathy | 5.8 (2.5) | 81.3% | 5.6 (2.5) | 79% | 6 (2.5) | 83.1% |
| Sweating | 4.2 (2.4) | 55.4% | 4.3 (2.4) | 59.7% | 4.2 (2.4) | 52.1% |
| Stomach Pain | 4.5 (2.5) | 57.6% | 4.3 (2.5) | 54.8% | 4.6 (2.5) | 59.8% |
| Confusion | 4 (2.4) | 47.5% | 3.9 (2.4) | 53% | 4.2 (2.4) | 43.2%* |
| Light sensitivity | 4.1 (2.5) | 53.6% | 3.8 (2.4) | 55% | 4.4 (2.5) | 52.6% |
| Thirst | 6.7 (2.3) | 95.3% | 6.8 (2.3) | 95.9% | 6.7 (2.3) | 94.9% |
| Heart racing | 4.2 (2.5) | 41.2% | 4.3 (2.5) | 45.4% | 4.2 (2.5) | 37.9% |
| Anxiety | 3.4 (2.4) | 20% | 3.3 (2.4) | 19% | 3.4 (2.4) | 20.9% |
| Depression | 3.8 (2.5) | 31.5% | 3.9 (2.5) | 31.6% | 3.8 (2.5) | 31.5% |
| Reduced appetite | 5.5 (2.6) | 72.5% | 5.5 (2.6) | 73.1% | 5.6 (2.6) | 72.1% |
| Symptoms | Mean (SD) All | % All | Mean (SD) Men | % Men | Mean (SD) Women | % Women |
|---|---|---|---|---|---|---|
| Headache | 5.7 (2.6) | 92.2% | 5.8 (2.5) | 92.8% | 5.6 (2.6) | 91.7% |
| Nausea | 5.6 (2.6) | 88.8% | 5.2 (2.4) | 86% | 6 (2.7) * | 91.1% |
| Concentration problems | 6.1 (2.4) | 93.1% | 6.3 (2.4) | 93.8% | 6 (2.4) | 92.5% |
| Regret | 4.6 (2.7) | 60.8% | 4.5 (2.6) | 59.9% | 4.7 (2.8) | 61.5% |
| Sleepiness | 6.8 (2.1) | 95.1% | 6.7 (2.1) | 93.4% | 6.9 (2.1) | 96.4% |
| Heart pounding | 4.3 (2.5) | 37.4% | 4.4 (2.4) | 35.4% | 4.3 (2.5) | 39% |
| Vomiting | 5.5 (3.4) | 27% | 4.8 (3.1) | 24% | 6 (3.5) | 29.5% |
| Tired | 7 (2.1) | 98.6% | 6.7 (2.1) | 98.3% | 7.2 (2.1) * | 98.9% |
| Shivering | 4.4 (2.4) | 48.6% | 4.3 (2.5) | 44.2% | 4.4 (2.3) | 52.2% |
| Clumsy | 5.1 (2.4) | 79% | 4.9 (2.5) | 78.9% | 5.2 (2.4) | 79.1% |
| Weakness | 5.5 (2.4) | 87.7% | 5.3 (2.3) | 86.9% | 5.7 (2.4) | 88.3% |
| Dizziness | 4.4 (2.7) | 66.7% | 4.2 (2.5) | 62.7% | 4.6 (2.8) | 69.9% |
| Apathy | 5.7 (2.5) | 81.9% | 5.7 (2.4) | 83.2% | 5.8 (2.6) | 80.8% |
| Sweating | 4.5 (2.5) | 58.4% | 4.5 (2.4) | 62.3% | 4.5 (2.6) | 55.2% |
| Stomach Pain | 4.5 (2.5) | 59.5% | 4.4 (2.4) | 54.6% | 4.5 (2.6) | 63.5% |
| Confusion | 4.6 (2.5) | 51.4% | 4.5 (2.5) | 52.6% | 4.6 (2.6) | 50.4% |
| Light sensitivity | 4.2 (2.3) | 55.2% | 4.2 (2.2) | 53.4% | 4.3 (2.4) | 56.7% |
| Thirst | 6.8 (2.4) | 95.5% | 6.9 (2.3) | 96.9% | 6.8 (2.4) | 94.4% |
| Heart racing | 4.5 (2.5) | 47.0% | 4.6 (2.5) | 49.5% | 4.4 (2.6) | 45% |
| Anxiety | 3 (2.3) | 19.3% | 2.9 (2.3) | 17.8% | 3.1 (2.2) | 20.6% |
| Depression | 3.9 (2.4) | 29.6% | 4 (2.4) | 29.8% | 3.8 (2.5) | 29.5% |
| Reduced appetite | 5.5 (2.5) | 73.3% | 5.7 (2.4) | 73.6% | 5.4 (2.6) | 73.1% |
| Symptoms | Mean (SD) All | % All | Mean (SD) Men | % Men | Mean (SD) Women | % Women |
|---|---|---|---|---|---|---|
| Headache | 5.9 (2.5) | 90.6% | 5.5 (2.5) | 89.2% | 6.3 (2.4) | 91.8% |
| Nausea | 6 (2.6) | 84.3% | 5.6 (2.5) | 84% | 6.4 (2.6) | 84.5% |
| Concentration problems | 6.4 (2.4) | 89.8% | 6.6 (2.4) | 90% | 6.3 (2.5) | 89.7% |
| Regret | 5.2 (2.8) | 51.7% | 5.4 (2.8) | 45.1% | 5.1 (2.8) | 57.3% |
| Sleepiness | 6.8 (2.4) | 96.1% | 6.4 (2.5) | 95.2% | 7 (2.3) | 96.9% |
| Heart pounding | 4.5 (2.6) | 37.4% | 4.1 (2.5) | 40.2% | 5 (2.6) | 35.1% |
| Vomiting | 5.3 (3.3) | 38.5% | 5.2 (3.2) | 35.4% | 5.5 (3.3) | 41.2% |
| Tired | 7 (2.4) | 98.9% | 6.7 (2.4) | 98.8% | 7.3 (2.3) | 99% |
| Shivering | 4.4 (2.7) | 47.8% | 4.3 (2.9) | 46.3% | 4.4 (2.6) | 49% |
| Clumsy | 5 (2.6) | 77.7% | 4.7 (2.7) | 73.2% | 5.2 (2.5) | 81.4% |
| Weakness | 5.8 (2.4) | 85.4% | 5.4 (2.3) | 85.2% | 6.2 (2.4) | 85.6% |
| Dizziness | 4.6 (2.5) | 64.2% | 4.3 (2.4) | 64.6% | 4.9 (2.6) | 63.9% |
| Apathy | 6.3 (2.5) | 79.9% | 6.3 (2.5) | 78% | 6.3 (2.5) | 81.4% |
| Sweating | 4.6 (2.4) | 63.7% | 4.7 (2.5) | 68.3% | 4.6 (2.3) | 59.8% |
| Stomach Pain | 4.7 (2.5) | 58.2% | 4.7 (2.5) | 53.8% | 4.7 (2.5) | 61.9% |
| Confusion | 4.6 (2.4) | 50.3% | 4.7 (2.3) | 51.2% | 4.6 (2.5) | 49.5% |
| Light sensitivity | 4.2 (2.3) | 52.2% | 3.6 (2.1) | 50.6% | 4.6 (2.3) | 53.6% |
| Thirst | 7 (2.3) | 93.9% | 7 (2.2) | 94% | 7 (2.4) | 93.8% |
| Heart racing | 4.4 (2.5) | 46.9% | 4 (2.4) | 53.7% | 4.9 (2.6) | 41.2% |
| Anxiety | 3.6 (2.5) | 16.3% | 3.3 (2.6) | 13.6% | 3.8 (2.5) | 18.6% |
| Depression | 4.1 (2.7) | 28.5% | 4.3 (3) | 20.7% | 4.1 (2.6) | 35.1% |
| Reduced appetite | 6.2 (2.5) | 72.6% | 6.2 (2.4) | 73.2% | 6.1 (2.5) | 72.2% |
© 2019 by the authors. Licensee MDPI, Basel, Switzerland. This article is an open access article distributed under the terms and conditions of the Creative Commons Attribution (CC BY) license (http://creativecommons.org/licenses/by/4.0/).
Share and Cite
van Lawick van Pabst, A.E.; Devenney, L.E.; Verster, J.C. Sex Differences in the Presence and Severity of Alcohol Hangover Symptoms. J. Clin. Med. 2019, 8, 867. https://doi.org/10.3390/jcm8060867
van Lawick van Pabst AE, Devenney LE, Verster JC. Sex Differences in the Presence and Severity of Alcohol Hangover Symptoms. Journal of Clinical Medicine. 2019; 8(6):867. https://doi.org/10.3390/jcm8060867
Chicago/Turabian Stylevan Lawick van Pabst, Albertine E., Lydia E. Devenney, and Joris C. Verster. 2019. "Sex Differences in the Presence and Severity of Alcohol Hangover Symptoms" Journal of Clinical Medicine 8, no. 6: 867. https://doi.org/10.3390/jcm8060867
APA Stylevan Lawick van Pabst, A. E., Devenney, L. E., & Verster, J. C. (2019). Sex Differences in the Presence and Severity of Alcohol Hangover Symptoms. Journal of Clinical Medicine, 8(6), 867. https://doi.org/10.3390/jcm8060867