Article

Kidney Perfusion in Contrast-Enhanced Ultrasound (CEUS) Correlates with Renal Function in Living Kidney Donors

1
Department of Urology, Charité–Universitätsmedizin Berlin, Corporate Member of Freie Universität Berlin, Humboldt-Universität zu Berlin and Berlin Institute of Health, 10117 Berlin, Germany
2
Department of Radiology, Charité–Universitätsmedizin Berlin, Corporate Member of Freie Universität Berlin, Humboldt-Universität zu Berlin and Berlin Institute of Health, 10117 Berlin, Germany
3
Department of General, Visceral and Vascular Surgery, Charité–Universitätsmedizin Berlin, Corporate Member of Freie Universität Berlin, Humboldt-Universität zu Berlin and Berlin Institute of Health, 10117 Berlin, Germany
4
Department of Nephrology and Internal Intensive Care Medicine, Charité–Universitätsmedizin Berlin, Corporate Member of Freie Universität Berlin, Humboldt-Universität zu Berlin and Berlin Institute of Health, 10117 Berlin, Germany
5
Department of Urology, Evangelisches Krankenhaus Königin Elisabeth Herzberge, 10365 Berlin, Germany
*
Author to whom correspondence should be addressed.
These authors contributed equally to this work.
J. Clin. Med. 2022, 11(3), 791; https://doi.org/10.3390/jcm11030791
Submission received: 26 December 2021 / Revised: 28 January 2022 / Accepted: 30 January 2022 / Published: 1 February 2022
(This article belongs to the Special Issue Progress and Recent Advances in Solid Organ Transplantation)

Abstract

:
Contrast-enhanced ultrasound (CEUS) is a widely used diagnostic tool for analyzing perfusion and characterizing lesions in several organs. However, to date, it has not been sufficiently investigated whether there is an association between CEUS findings and kidney function. This study aimed at identifying the potential relationship between kidney function and the renal perfusion status determined by CEUS in living kidney donors. A total of 30 living kidney donors examined between April 2018 and March 2020 were included in the study. All patients underwent various diagnostic procedures for evaluation of renal function. CEUS was performed in all 30 donors one day before nephrectomy. Kidney perfusion was quantified using a postprocessing tool (VueBox, Bracco Imaging). Various perfusion parameters were subsequently analyzed and compared with the results of the other methods used to evaluate kidney function. Of all parameters, mean signal intensity (MeanLin) had the strongest correlation, showing significant correlations with eGFR (CG) (r = −0.345; p = 0.007) and total kidney volume (r = −0.409; p = 0.001). While there was no significant correlation between any perfusion parameter and diethylenetriaminepentaacetic acid (DTPA), we detected a significant correlation between MeanLin and DTPA (r = −0.502; p = 0.005) in the subgroup of normal-weight donors. The results indicate that signal intensity in CEUS is associated with kidney function in normal-weight individuals. Body mass index (BMI) may be a potential confounder of signal intensity in CEUS. Thus, more research is needed to confirm these results in larger study populations.

1. Introduction

Evaluation of kidney function is crucial in living donor candidates, who should not be exposed to avoidable health impairments. The Amsterdam Guidelines recommend a glomerular filtration rate (GFR) ≥80 as an essential prerequisite for living kidney donation [1]. Accurate assessment and verification of adequate kidney function is essential during evaluation of a potential kidney donor [1]. Several methods are currently in clinical use for assessment of kidney function with differences in accuracy, complexity and duration [2]. However, accurate assessment of kidney function is not only needed in the context of living kidney donation. More importantly, it is needed whenever impairment of kidney function is suspected.
In routine clinical practice, the most frequently used method is measurement of serum creatinine. Determination of serum creatinine for assessment of renal function is limited by the fact that an increase only becomes evident after 50 % of kidney function is lost [2]. Estimated glomerular filtration rate (eGFR) is also widely used and provides a more accurate assessment of kidney function using one of the established formulas, such as “modification of diet in renal disease“ (MDRD), “Cockcroft–Gault“ (CG) or the “chronic kidney disease epidemiology collaboration equation“ (CKD-EPI) [3,4,5,6]. Especially in the context of living kidney donation, use of an estimation formula for assessing kidney function is widely considered as imprecise and not appropriate [1,7,8,9,10]. Radioisotopic techniques provide more accurate information on kidney function and are widely used to measure split and total renal function [10,11]. Radiotracers that are used as exogenous filtration markers to measure GFR include 51Cr-ethylenediaminetetraacetic acid (EDTA), 99mTc-diethylenetriaminepentaacetic acid (DTPA), 99mTc-mercaptoacetyltriglycine (MAG3) and 125I-iothalamate [2,10].
Besides the widely used and established methods for the evaluation of kidney function, various imaging techniques have been reported to significantly correlate with kidney function—including measurement of cortical volume or total kidney volume on computed tomography (CT), measurement of kidney length in ultrasound (US) and assessment of kidney function in dynamic contrast-enhanced magnetic resonance imaging (MRI) [10,12,13,14]. However, it has not been sufficiently investigated if there is a relationship between kidney perfusion in contrast-enhanced US (CEUS) and kidney function. Since hyperperfusion can be considered an early sign of glomerular injury, kidney perfusion in CEUS could possibly provide information for detection of early kidney injury—especially when kidney function appears to be normal [15,16,17]. Thus, a proportion of the patients may be spared an invasive procedure for histological confirmation of kidney injury.
To date, CEUS has been primarily performed to characterize focal renal lesions and assess perfusion patterns based on microvascularization following administration of a strictly intravascular contrast agent [18,19]. Since CEUS has not yet been sufficiently investigated in the context of whole-organ perfusion and kidney function, this pilot study was conducted to analyze the potential relationship between kidney function and CEUS in living kidney donors.

2. Material and Methods

2.1. Study Design and Patient Population

The study was designed as a feasibility study to investigate a potential relationship between kidney function and kidney perfusion in CEUS. For this reason, 30 living kidney donors underwent CEUS one day prior to donor nephrectomy. Overall, 60 kidneys were examined between April 2018 and March 2020. The study was approved by the local institutional review board (Ethical Committee of Charité Universitätsmedizin Berlin) (EA1/406/16) and conformed to the amended Declaration of Helsinki. All donors were informed about the procedure and possible risks 24 h before the examination and provided written informed consent. The results of this study were not used to guide clinical management.
All living kidney donor candidates invariably undergo evaluation of total and split renal function using radioisotopic techniques prior to nephrectomy in our hospital. DTPA clearance was determined for assessment of total kidney function and MAG3-scintigraphy was used for evaluation of split renal function. Additional examination of kidney perfusion by CEUS enabled a direct comparison between CEUS-derived perfusion parameters and various established methods for evaluation of kidney function in individuals with healthy kidneys.

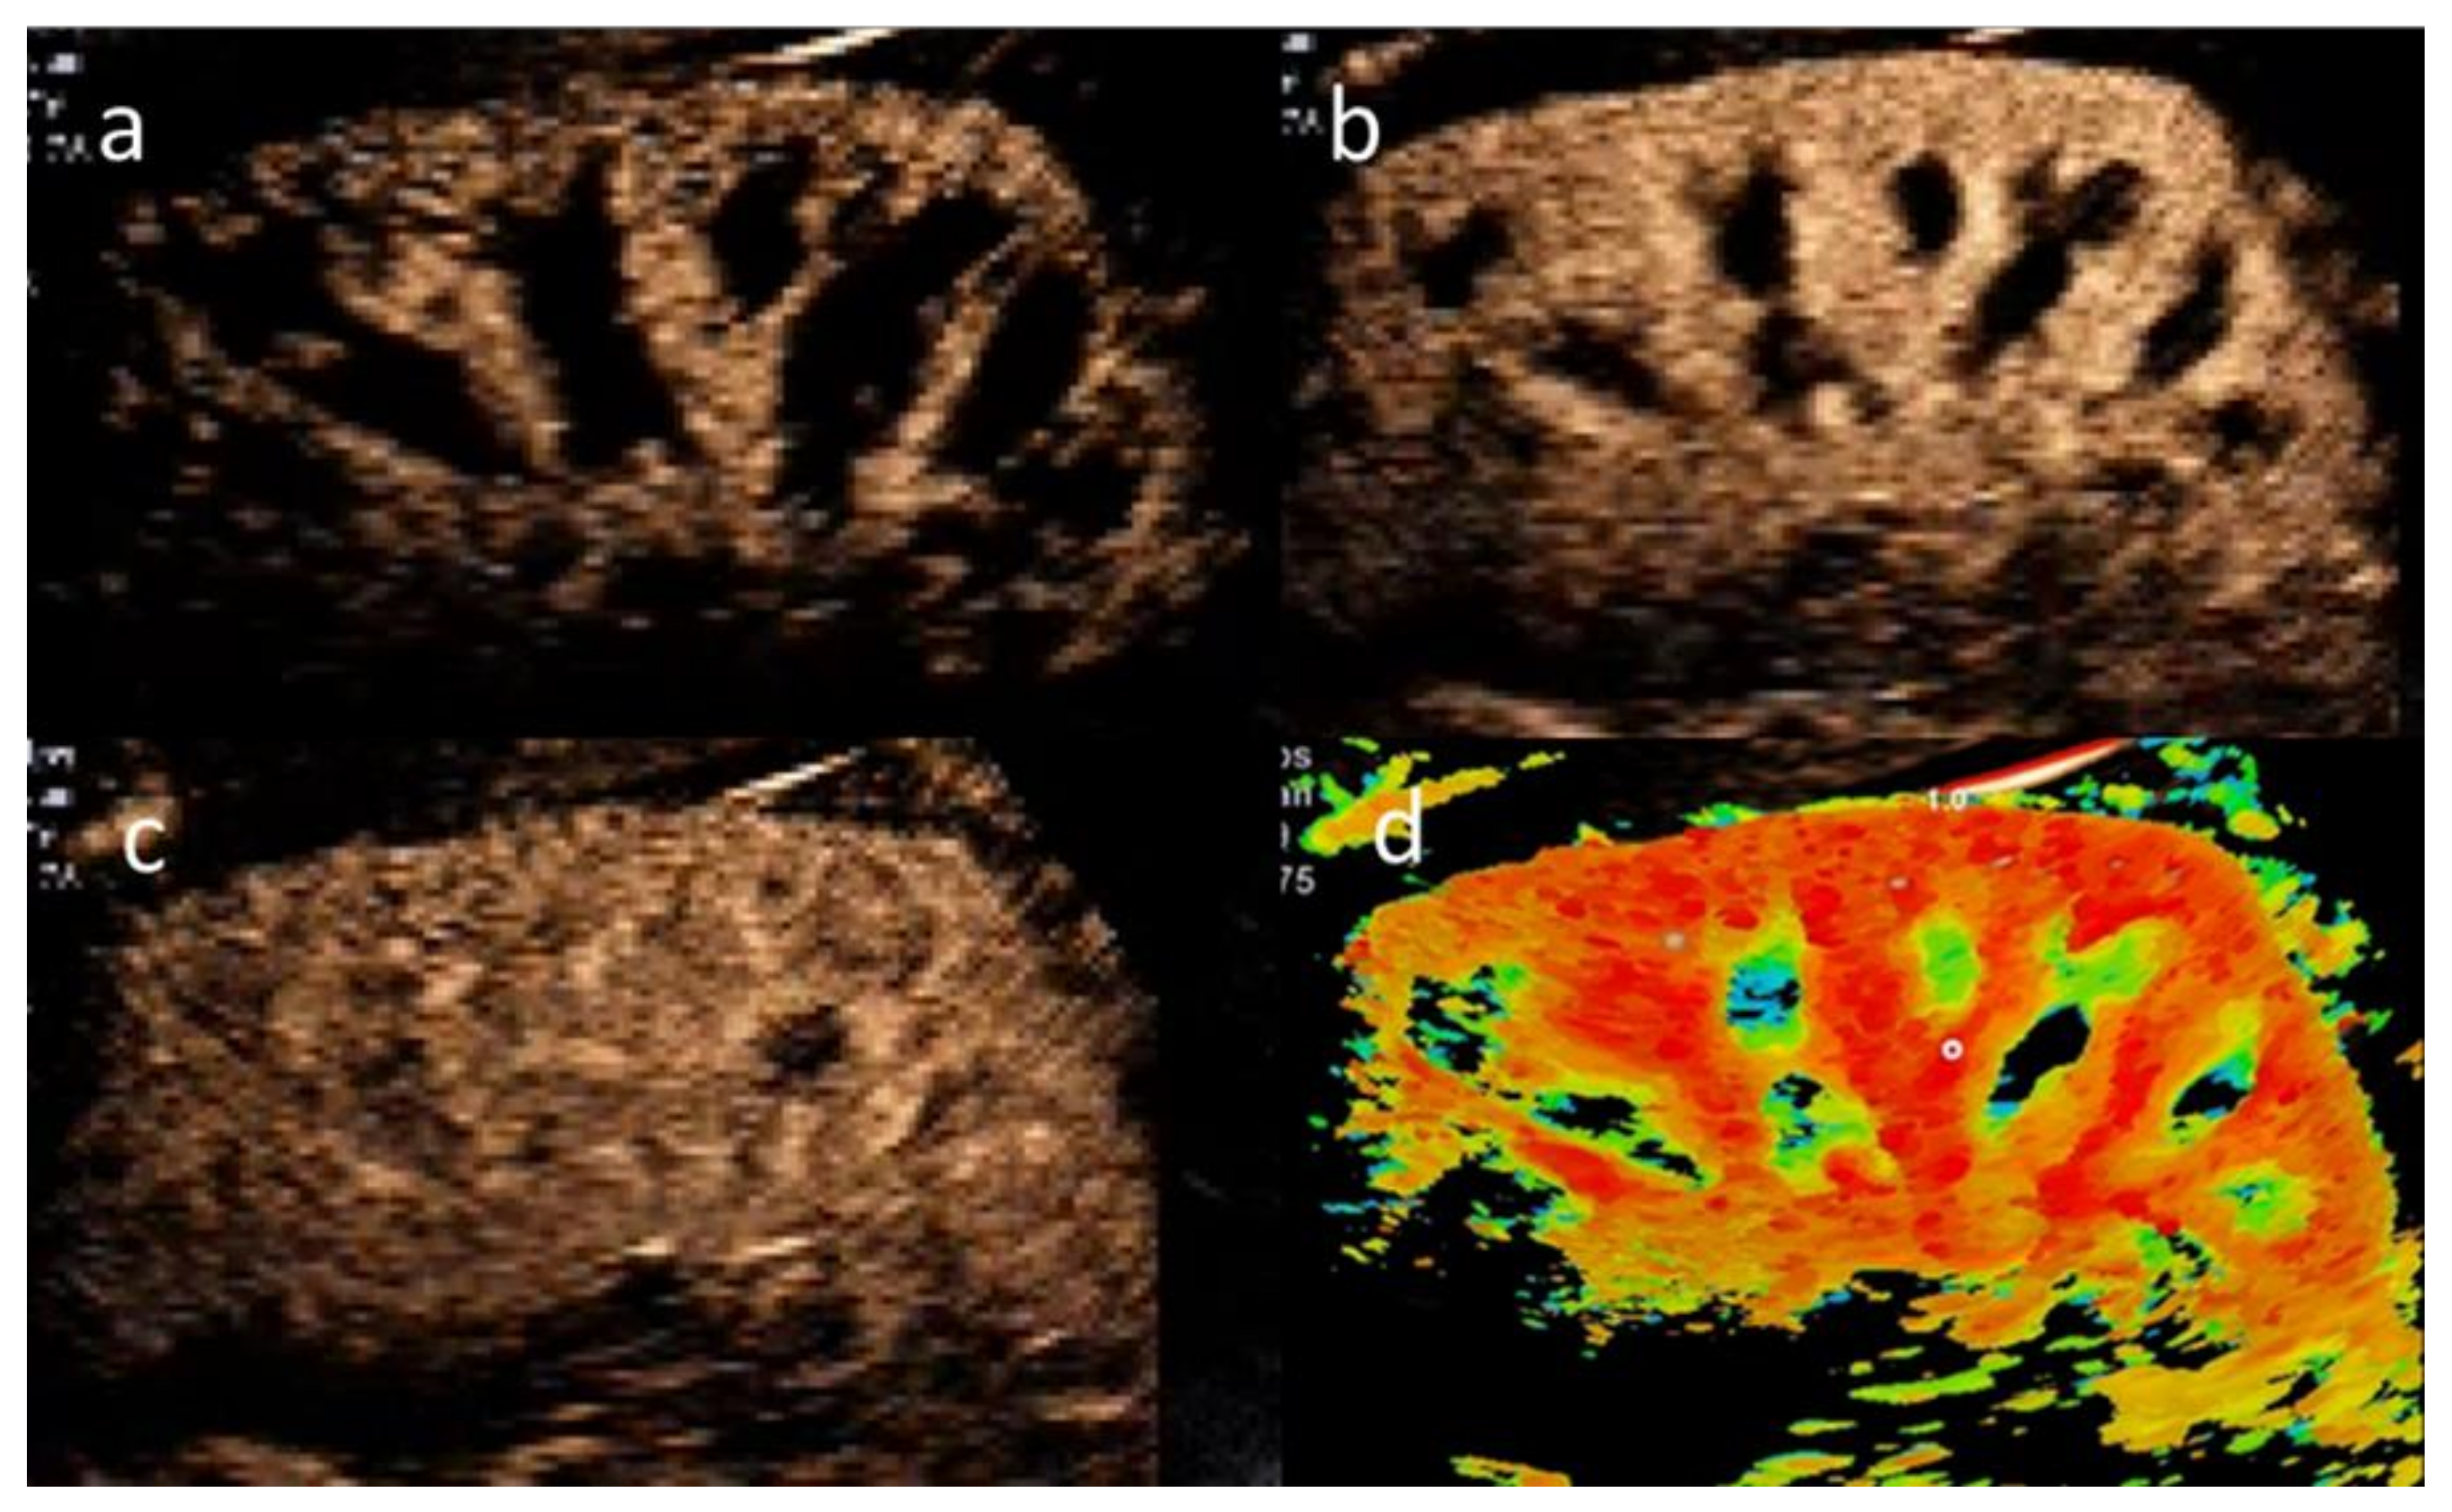
2.2. CEUS Examination Protocol

All examinations were performed by three examiners with many years of experience in CEUS, together with two assistants who administered the ultrasound contrast agent (UCA). SonoVue® (Bracco Imaging, Milan, Italy) was used as a second-generation UCA for all examinations and was administered via a 3-way stopcock in the antecubital vein, followed by a saline flush. The UCA was prepared according to the manufacturer’s instructions.
All CEUS examinations were performed using a high-end ultrasound system (Aplio i900, Canon, Otawara, Japan) with a contrast-specific mode and the same multifrequency (i8CX1). CEUS was performed of the right kidney, followed by the left kidney. After positioning the transducer for renal imaging in the longitudinal plane in deep inspiration, a 1.6 mL UCA bolus was injected, followed by a rapid 10 mL saline flush. Approximately 10 to 20 s (s) after UCA administration, the first microbubbles appeared in the interlobar arteries, followed by rapid filling of the renal cortex and prolonged medullar enhancement (Figure 1). After the first contrast signal was displayed, microflow kinetics were recorded as a 30-s loop during a single breath hold. Since pulmonary elimination of the applied UCA takes approximately 5 to 10 min, CEUS of the left kidney was performed after a 10-min waiting time and when no CEUS signal was apparent in the left kidney.

2.3. Ultrasound Settings

The UCA consists of microbubbles [20]. To avoid microbubble destruction, the UCA was administered in a straight direction. Moreover, scanning was performed with a low mechanical index (MI; 0.07–0.09) [21]. Beside the MI, there are other settings that may have influenced the received signal intensity. In this study population, Gain (G) ranged between 76 and 89 and the dynamic range (DR) was either 75 or 60.

2.4. Quantitative Perfusion Analysis

CEUS cine loops were stored as DICOM raw data and transferred to a software package for further analysis. Quantitative analysis of kidney perfusion with time-intensity curve measurements (TIC) was performed using the VueBox® postprocessing software package (Bracco Imaging, Milan, Italy). Motion compensation—which is offered by the software as an option for optimization of quality of fit (QOF)—was applied to all videos analyzed. Except for three video clips analyzed with QOF of 88, 78 and 74, QOF was over 90.
After motion compensation, a freehand region of interest (ROI) was manually placed in the renal cortex by the same person excluding artifacts. To ensure optimal comparability, the positions of the drawn ROIs had to be consistent. Therefore, all ROIs were drawn in a central position (middle third of the kidney) with adequate image quality. Based on the ROIs, the software generated time-intensity curves and computed different perfusion parameters.

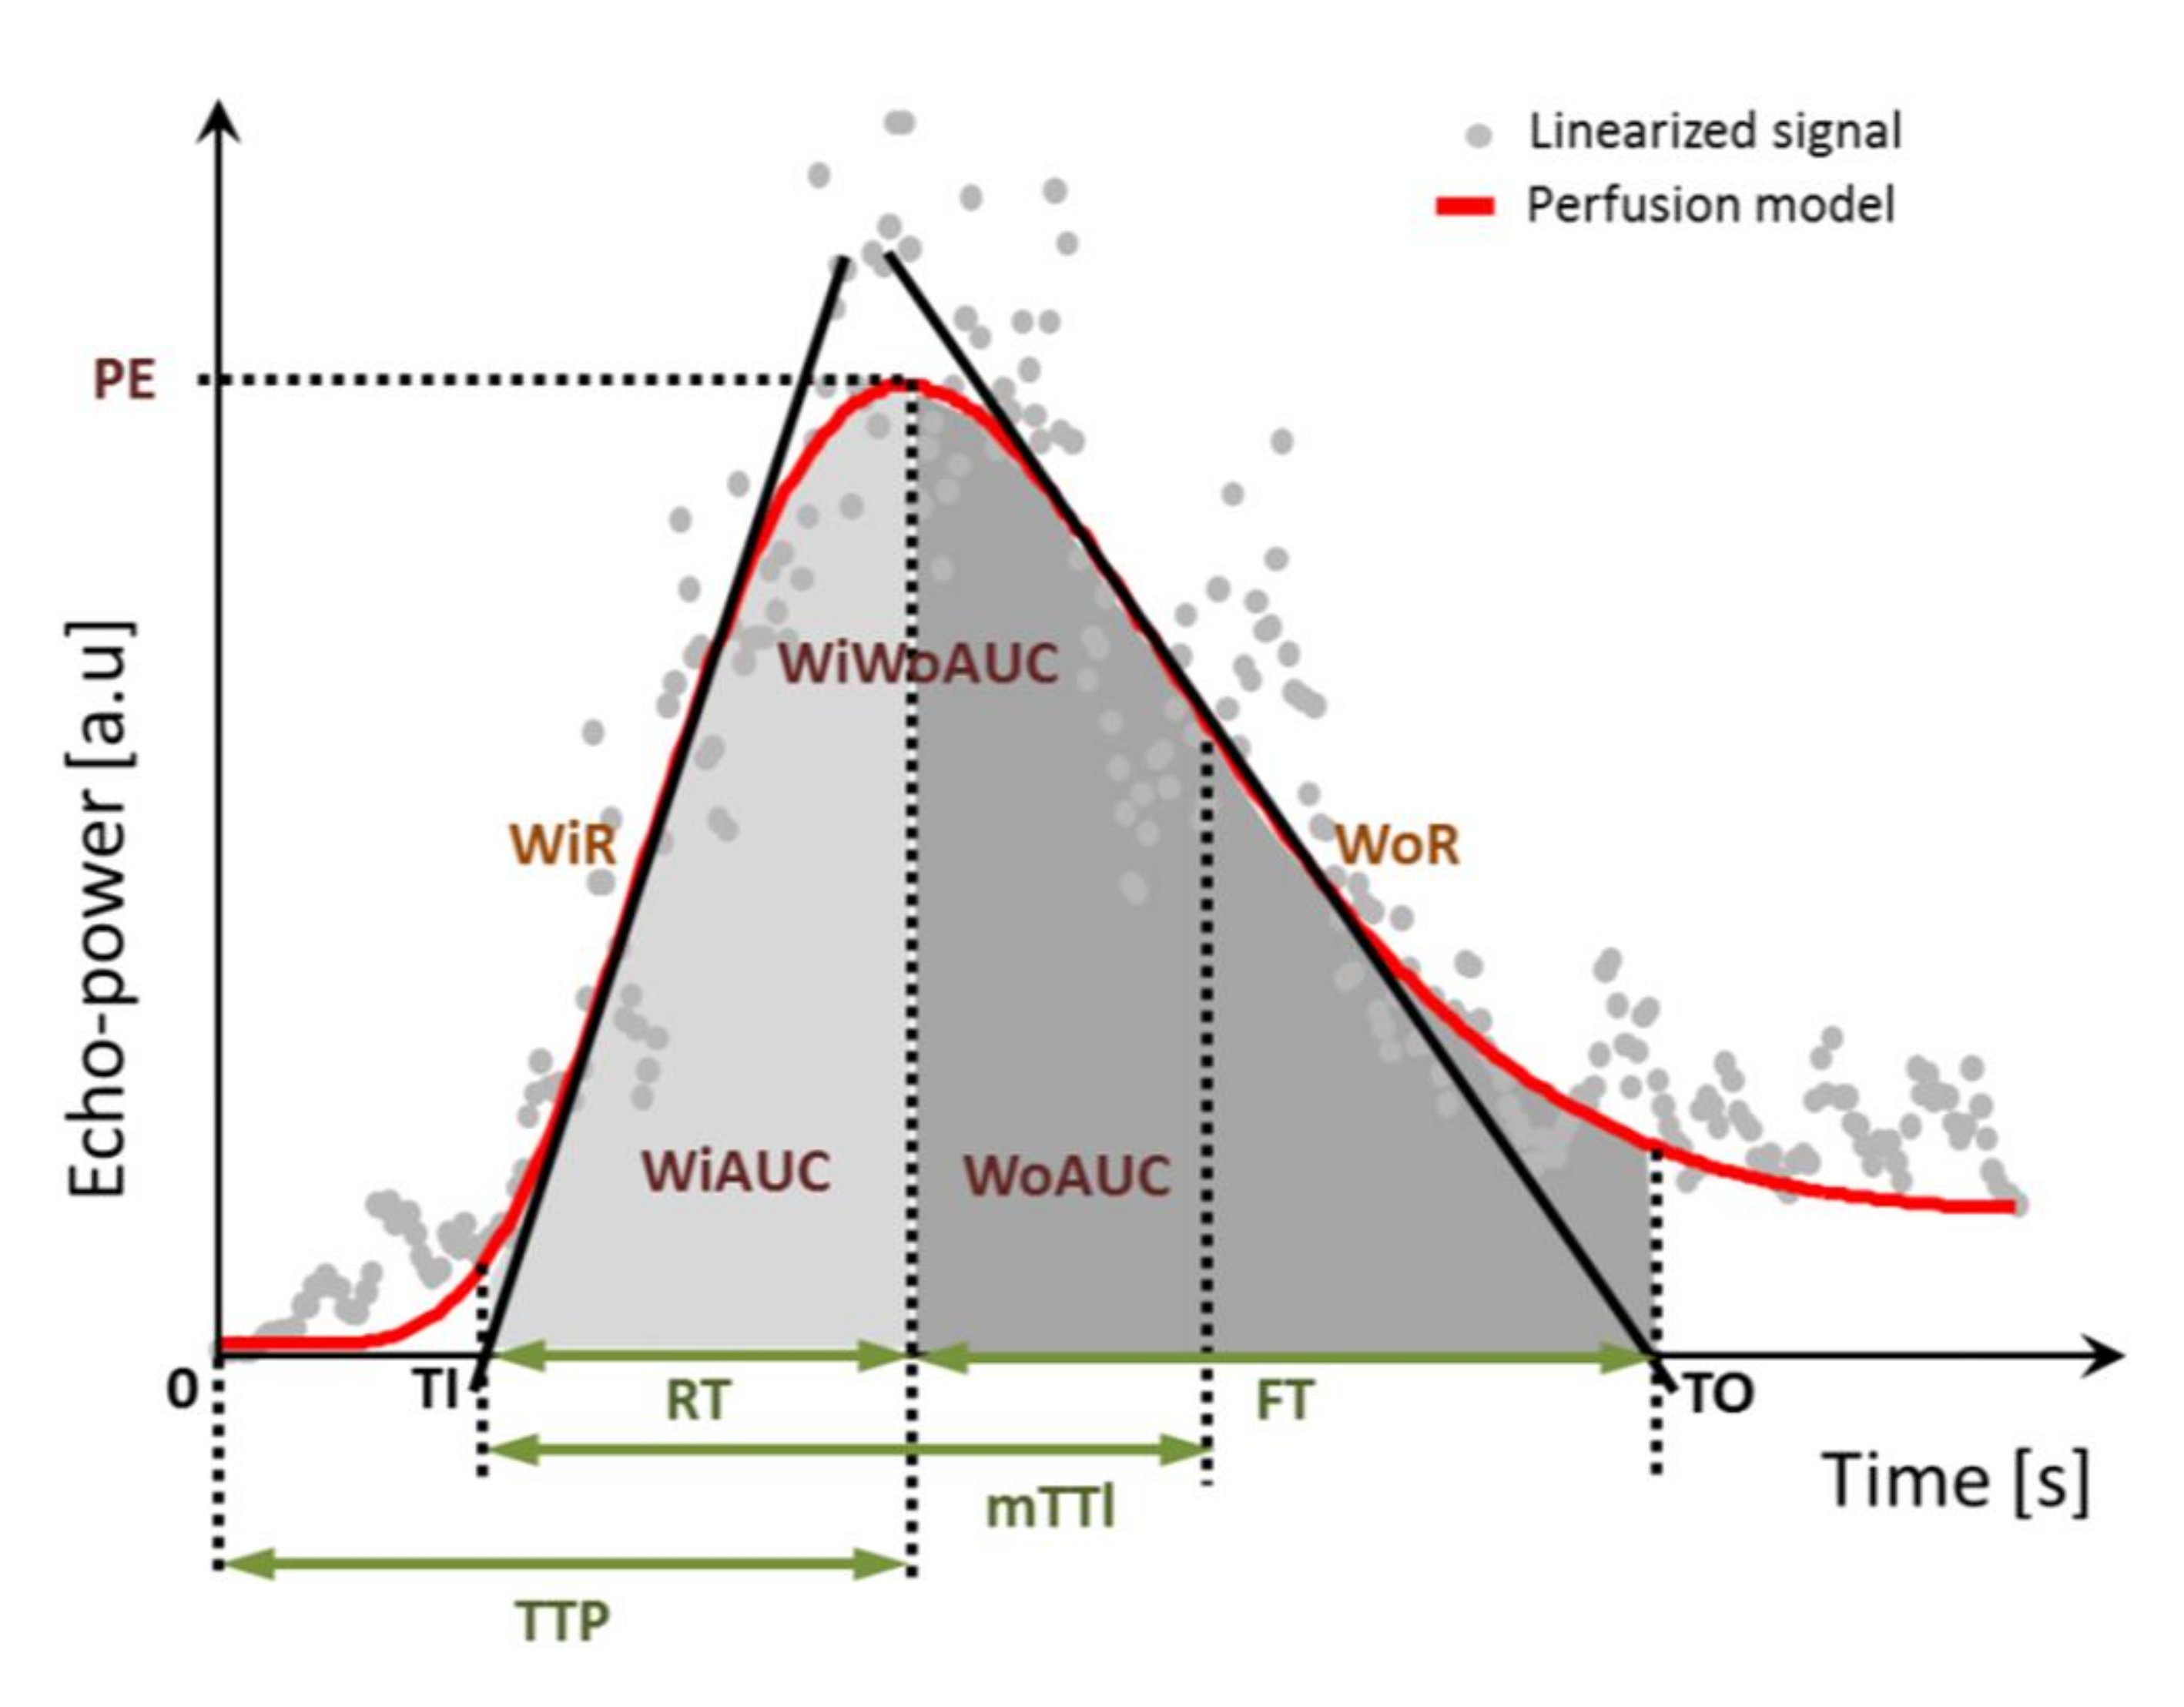
2.5. Perfusion Parameters

Figure 2 shows the perfusion parameters automatically determined by VueBox® (Bracco Imaging, Milan, Italy). [22]. They can be classified into two categories: signal intensity parameters and time-related parameters (Table 1). Signal intensity parameters, such as peak enhancement (PE) and area under the curve (AUC), are determined to describe relative blood volume and mean transit time (mTTl) as a time-related parameter describes the mean blood flow velocity [21]. For simplicity’s sake, and since signal intensities were very high, signal intensity parameters were divided by 1000.

2.6. Patient Data and Methods for Assessment of Kidney Function

Different methods for evaluation of kidney function were applied and the results documented for comparison with CEUS-derived perfusion parameters. MAG3-scintigraphy, DTPA clearance and serum creatinine were collected from the hospital’s general documentation system. eGFR was calculated according to the CG, MDRD and CKD-EPI formulas [3,4,5]. Split kidney volume was determined by an automatic calculation after manually framing the kidneys in CT in all representative slices. Total kidney volume was calculated by adding both right and left split kidney volume. BMI was used to categorize donors into normal weight (18.5–24.9 kg/m2), overweight (25–29.9 kg/m2) and obesity (≥30 kg/m2). A total of 15 patients belonged to the normal-weight group.
DTPA clearance was used as the reference standard for measurement of kidney function. Donors were instructed to drink at least one liter prior to DTPA clearance testing. DTPA clearance was determined using the Fleming formula [23]. MAG3 scintigraphy was performed to determine the proportion of split renal function for each kidney based on tubular extraction rate (TER) according to Bubeck [24]. Split DTPA clearance was calculated by multiplying the proportion of split kidney function derived from MAG3-scintigraphy with absolute DTPA clearance. Split eGFR was also calculated by multiplication with the result of MAG3-scintigraphy.

2.7. Statistical Analysis

First, established methods for evaluation of total kidney function prior to nephrectomy were compared with each other as a basis for comparing the results of these methods with CEUS-derived parameters and determining the degree of correlation. We analyzed whether CEUS parameters were related to (1) total kidney function prior to nephrectomy, (2) split kidney function prior to nephrectomy and (3) total kidney function after nephrectomy. For analysis of a potential relationship between CEUS parameters and postoperative total kidney function, CEUS parameters derived from the retained kidney before donor nephrectomy were used. Finally, confounders that could have an influence on CEUS parameters were analyzed. To investigate potential relationships between kidney function and renal perfusion in CEUS, Pearson correlations were carried out. Descriptive results are presented as mean +/− standard deviation.
A two-sided significance level of α = 0.05 was defined to indicate statistical significance. All statistical analyses were performed using the SPSS software package (IBM Corp. Released 2016. IBM SPSS Statistics for Windows, Version 26.0. Armonk, NY, USA: IBM Corp.).

3. Results

3.1. Epidemiology and Descriptive Presentation of Kidney Function Data

Donors had a mean age of 54 +/− 9 years with a range of 37–75. The majority were female (76.7%), and mean BMI in the study population was 26 kg/m2 (+/−4 kg/m2).
Table 2 provides an overview of the kidney function tests performed both before and after nephrectomy. Prior to nephrectomy, mean DTPA clearance was 97 mL/min/1.73 m2 (+/−14). Estimation of GFR yielded lower values than DTPA clearance. Among all estimation formulas, the CG formula yielded the mean value closest to that obtained by determination of DTPA clearance; however, scatter was also greatest with a standard deviation of 25 mL/min/1.73 m2.

3.2. CEUS Parameters

Table 3 compiles the CEUS-derived values assessing signal intensity and time. Overall, there was large scatter of signal intensity parameters. All signal intensity parameters correlated strongly and significantly with MeanLin as a representative signal intensity parameter (r = 0.930 to r = 0.984; p < 0.001). In addition, CEUS-derived, time-related parameters also showed strong and significant correlation with each other. For correlation of time-related parameters, rise time (RT)—as a marker of arterial inflow—was chosen as a representative parameter.

3.3. Analysis of Total Kidney Function

Established methods for evaluation of total kidney function prior to nephrectomy were compared with each other. Table 4 shows correlations of various kidney function tests with DTPA clearance as the reference method for evaluation of total kidney function. DTPA clearance showed the strongest and most significant correlation with eGFR (CG) (r = 0.531; p = 0.003). In comparison, just a weak correlation was observed for serum creatinine and DTPA clearance (r = −0.228; p = 0.225). Because eGFR (MDRD) and serum creatinine showed only weak correlations, these parameters were not considered for further analysis.

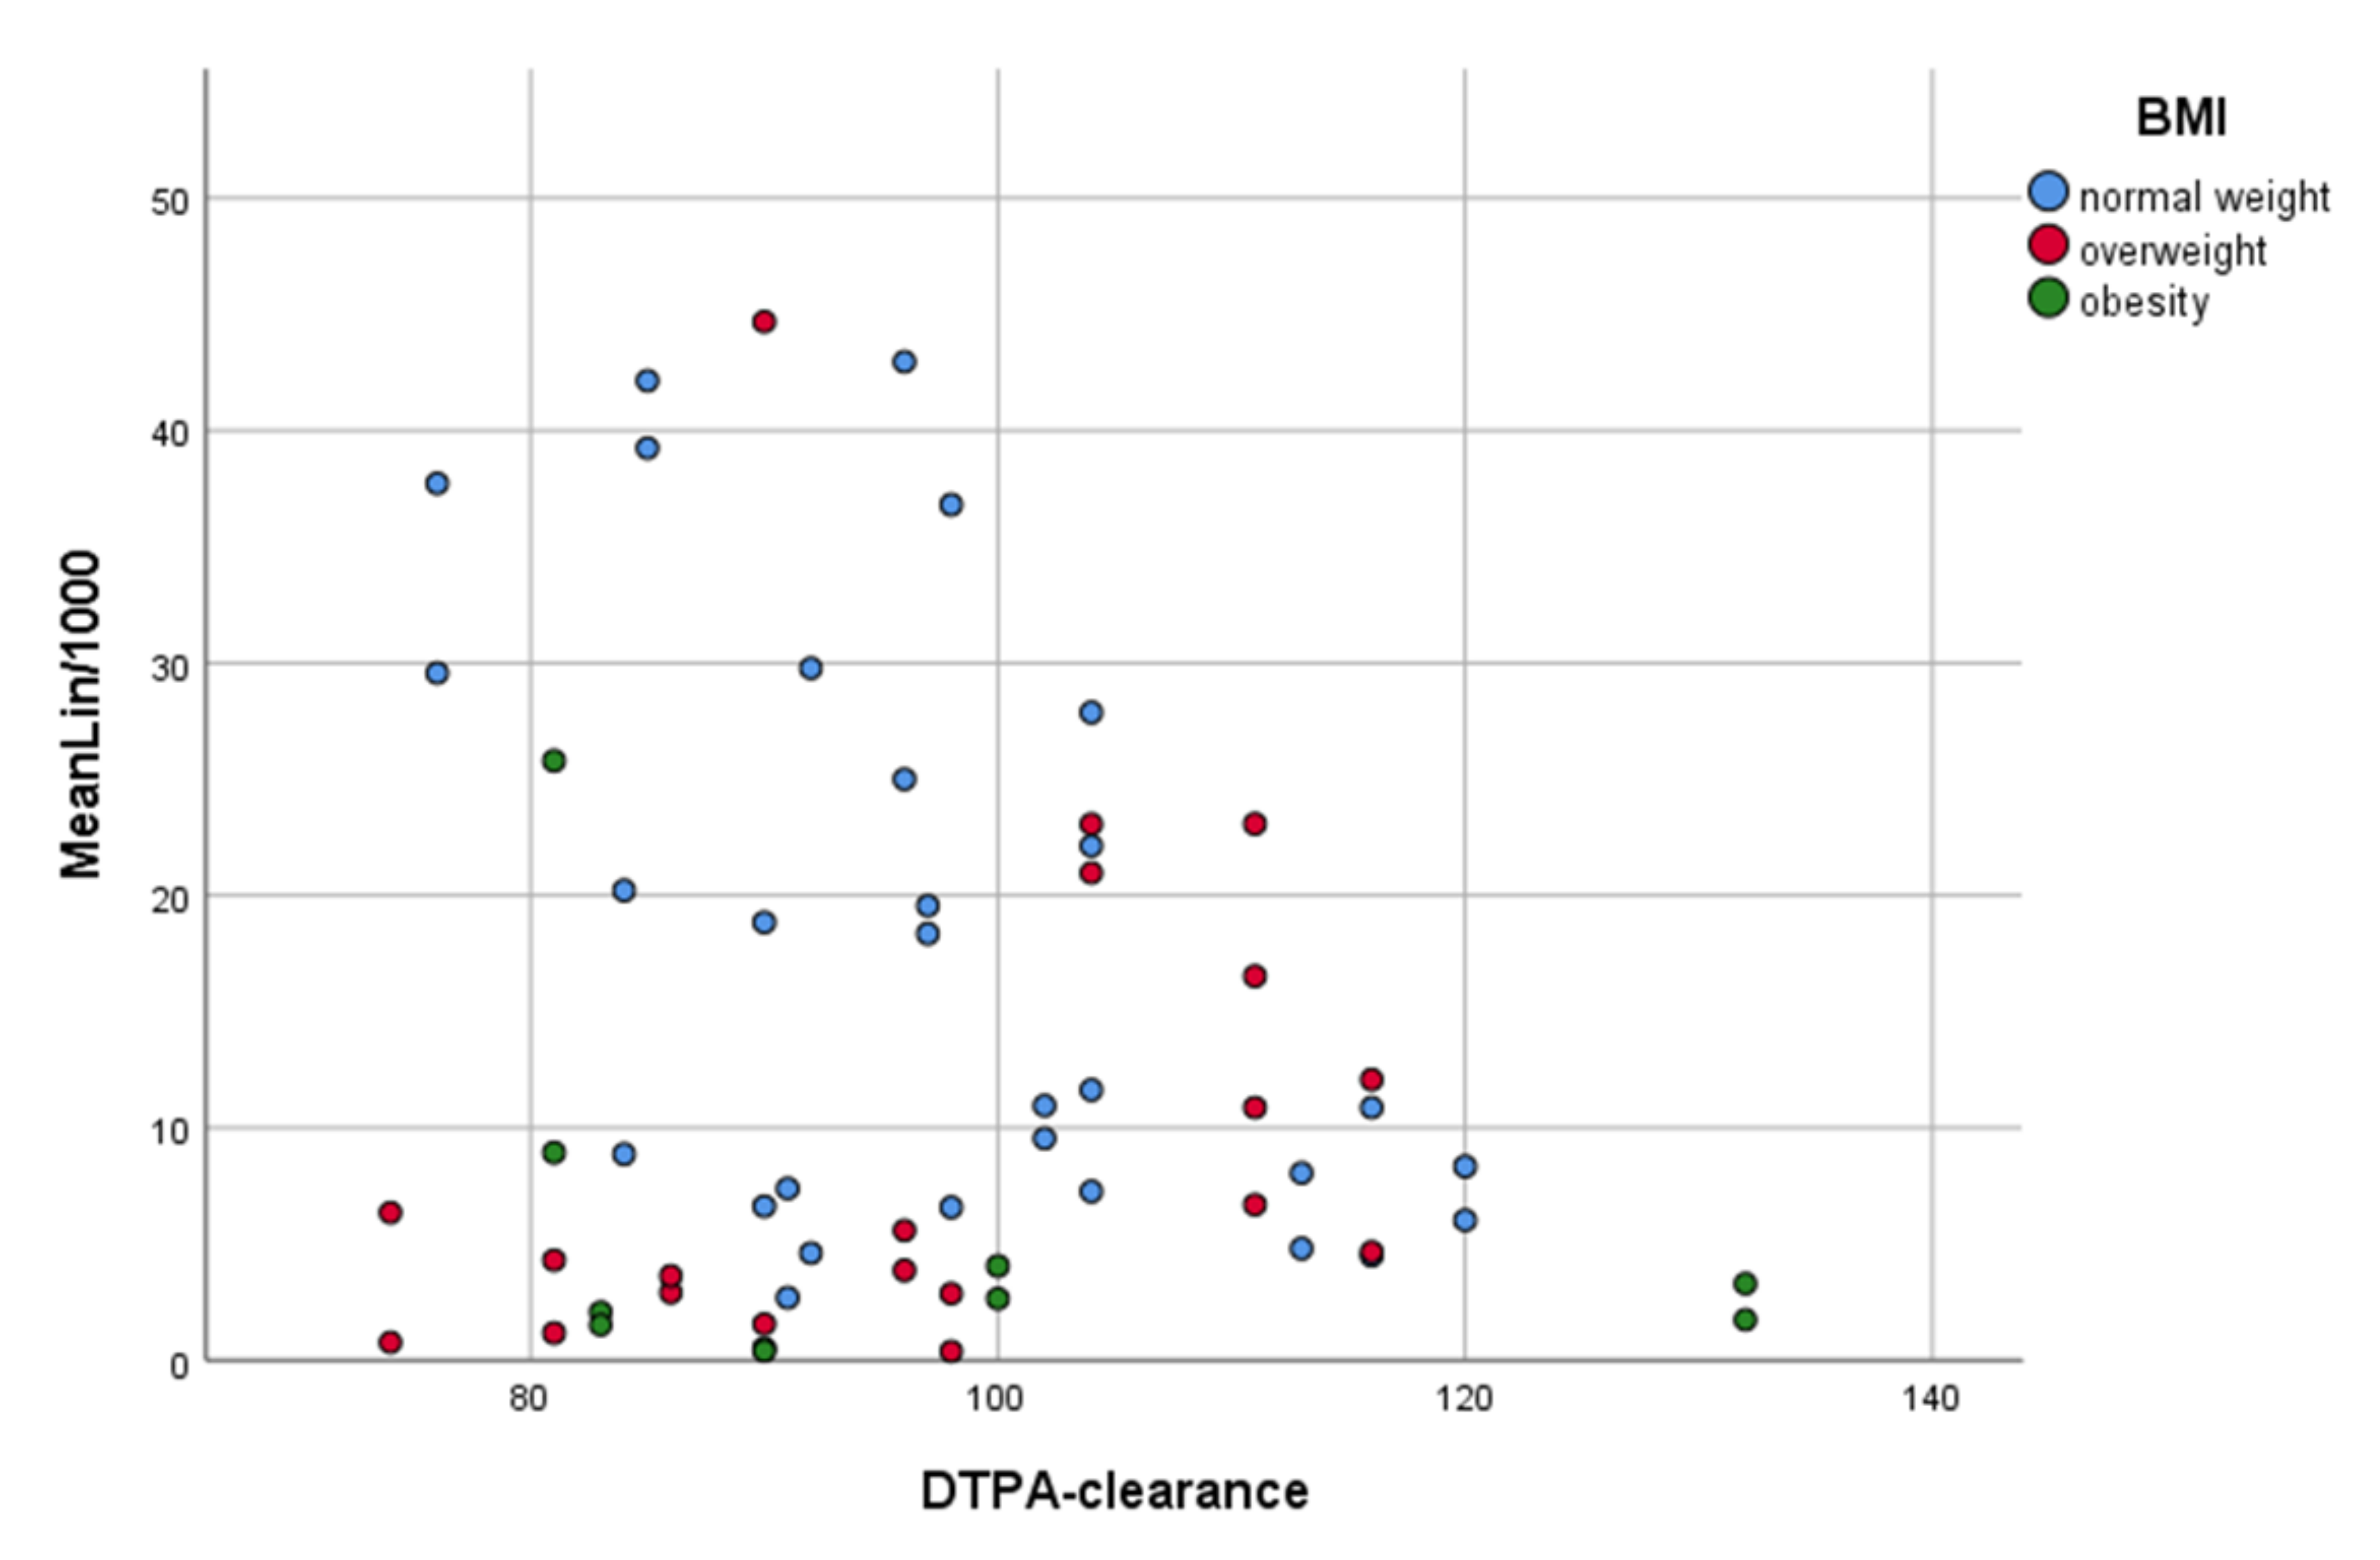
3.4. Comparison of CEUS and Kidney Function Parameters

Table 5 compiles correlations of CEUS signal intensity parameters with the results of different kidney function tests. All signal intensity parameters showed weak and nonsignificant correlations with DTPA and eGFR (CKD-EPI). Conversely, all signal intensity parameters correlated significantly with eGFR (CG) and total kidney volume. MeanLin (r = −0.345; p = 0.007 and r = −0.409; p = 0.001) and WiWoAUC (r = −0.346; p = 0.008 and r = −0.401; p = 0.002) showed the strongest correlations. In contrast to correlations between established methods for evaluation of total kidney function, correlations with CEUS signal intensity parameters were invariably negative. Higher signal intensities were associated with lower kidney function. These correlations were comparable with the correlation between DTPA clearance and eGFR (MDRD) and even stronger than the correlation between serum creatinine and DTPA clearance. Overall, correlations with total kidney volume were stronger than correlations with eGFR (CG). Time-related CEUS parameters did not show any significant correlation with kidney function test results (Table 5). Thus, these CEUS parameters were not taken into consideration for further analysis.
In the assessment of preoperative split kidney function, split kidney volume and split eGFR (CG) also correlated with signal intensity parameters in CEUS (Table 6). Similarly, postoperative kidney function—to be precise eGFR (CG)—significantly correlated with CEUS intensity parameters of the remaining kidney (Table 6). For both preoperative split kidney function and postoperative kidney function correlation values were close to those for total kidney function.

3.5. Evaluation of Confounders

Although CEUS parameters showed significant correlations with eGFR (CG) and kidney volume, no correlations with the reference method DTPA clearance were detected. For identification of potential confounders, relationships of MeanLin and DTPA were depicted in a scatter diagram using three different colors to represent the three BMI subgroups investigated (Figure 3). In this diagram, higher values for MeanLin were associated with lower values for DTPA. On the other hand, smaller values for MeanLin were related to both high and small values for DTPA. However, the diagram also reveals that BMI may have had an impact on signal intensity. Donors with a higher BMI had low values for MeanLin, and no relation between MeanLin and DTPA could be identified. However, for normal-weight donors, the diagram shows a relation between MeanLin and DTPA (i.e., kidney function). The scatter diagram suggests that, in the normal-weight subgroup, higher values for MeanLin were associated with poorer kidney function, and lower values for MeanLin were associated with better kidney function.
Further analysis showed a significant negative correlation between BMI and MeanLin (r = −0.366; p = 0.004). A larger BMI was therefore associated with smaller MeanLin values.
Patients with normal weight (n = 15, defined as BMI of 18.5–24.9 kg/m2) were selected to further analyze the relationship between DTPA and MeanLin. In this subgroup (30 kidney in total), MeanLin showed a significant and strong correlation with DTPA clearance (r = −0.502; p = 0.005).

4. Discussion

Although CEUS has been widely used in various clinical specialties, it has not been sufficiently investigated whether there is a relationship between CEUS-derived perfusion and kidney function. To our knowledge, this is the first standardized and prospective study to analyze the potential relationship between kidney function and CEUS-based perfusion parameters in individuals with healthy kidneys. Our study revealed significant correlations between different methods for evaluating kidney function and CEUS signal intensity parameters. However, no correlations were identified with time-related CEUS parameters. MeanLin was analyzed as a representative signal intensity parameter and showed the strongest correlations, which were similar for preoperative total kidney function, preoperative split kidney function and postoperative kidney function.
Significant correlations were only identified for total kidney volume and eGFR (CG), but not for the reference method—DTPA clearance. Because of the importance of the correlation between CEUS and the reference method for evaluation of kidney function, we analyzed potential confounders for their effects on the relation between DTPA clearance and signal intensity in CEUS.
Since greater penetration depth can attenuate the signal in CEUS, BMI was analyzed as a potential confounder [21]. Indeed, there was a strong correlation between MeanLin and DTPA clearance (r = −0.502; p = 0.005) in the normal-weight subgroup.
While MeanLin did not correlate significantly with DTPA clearance in the total study population, it showed significant correlation with eGFR (CG). The estimation formula used for calculation of eGFR (CG) is the only formula that incorporates information on body weight [5]. This may explain why MeanLin, as a parameter that can be influenced by BMI and thus by body weight, was found to significantly correlate with eGFR (CG).
There was a large scatter for all signal intensity parameters. BMI and kidney depth may have contributed to the large scatter. However, the failure to use consistent US system settings may also have contributed to differences in signal intensities. Mechanical index (MI), frames per second (fps), gain (G) and dynamic range (DR) varied between the CEUS examinations performed in our study population. The fact that ultrasound system settings, in general, affect signal intensity, and may both attenuate and enhance it, hampers comparison of absolute signal intensities [21,25].
Participation of three different examiners may also have contributed to the observed variability in signal intensities. Both inter- and intra-observer variability have been described for CEUS before [26]. However, the fact that CEUS was performed by different examiners alone cannot explain the large scatter.
Another potential confounder of signal intensity is the amount of fluid intake prior to a CEUS examination. In our hospital, patients scheduled for radioisotopic measurement are instructed to drink one liter of water before the examination since the amount of drinking may influence results. In contrast, no recommendation was made regarding fluid intake prior to the CEUS examination in this pilot study. As a result, fluid intake may have influenced signal intensities in CEUS.
According to our results, kidney volume may also influence signal intensities in CEUS. A large kidney appears to attenuate the CEUS signal. The underlying mechanism should be addressed in future studies.
To our knowledge, two studies have been published that investigated possible associations between renal function and perfusion in CEUS [17,27]. Both studies were conducted in patients with diabetic kidney disease (DKD) in comparison to control groups. Similar to our study, patient groups were small, with 33 and 55 patients with diabetic nephropathy. One of these studies, conducted by Ma et al., showed a positive correlation between GFR and the area under the curve (AUC) determined as a signal intensity parameter in CEUS [27]. Wang et al. also reported a significantly increased area under the ascending curve for patients with early-stage DKD (eGFR (MDRD) ≥90 mL/min/1.73 m2) compared to patients with moderate DKD (30–90 mL/min/1.73 m2) [17]. In contrast, our results showed a negative correlation between kidney function and CEUS-derived signal intensity parameters. However, we only investigated kidney function in individuals without underlying kidney disease, while the two earlier studies analyzed kidney function and CEUS-based perfusion in patients with DKD.
Future studies should consider comparison of absolute values with scintigraphic results as presented by Krumm et al. for contrast-enhanced MRI [27]. In general, ultrasound contrast agents are associated with very low adverse event rates and do not interact with renal function or lead to contrast-agent nephropathy [28]. Moreover, microbubble-based contrast agents do not interact with thyroid function as they do not contain iodine. Ultrasound contrast agents are proven as strictly intravascular, allowing the assessment of organ perfusion on microcirculation level. [21] This advantage, combined with a dynamic examination, settles a further argument for CEUS compared to CT and MRI, since iodinated and gadolinium-based contrast media are known to be not strictly intravascular. Nevertheless, CEUS and US are known to be operator-dependent, especially in image/cineloop acquisition for parametric measurements. Although CEUS and US, in general, possess advantages, such as the absence of radiation, lower costs and high availability (nearly every mid-range system contains CEUS specific software), both tomographic modalities (i.e., CT, MRI) are more standardized in the assessment of scans or sequences. Thus, a volume dataset and not a single plane alone (as in US) can be used for whole organ perfusion. Our results demonstrated the potential influence of BMI or body weight on the parametric assessment of renal perfusion in CEUS (driven by lower image quality at higher penetration depth). These confounders may not affect image quality and parametric evaluation of organ perfusion in tomographic imaging.

Limitations

The most important limitation of this study is the small number of subjects included in this pilot study. Moreover, the lack of use of consistent US system settings and the involvement of several examiners could have affected our results. Additionally, since only patients in the subgroup of normal-weight donors showed a strong and significant correlation between MeanLin and DTPA clearance, a broad usage of CEUS is not applicable. Future studies are needed to analyze confounders and correlations in a larger population to enable a broad and standardized usage of this method.

5. Conclusions

This pilot study, for the first time, demonstrated a significant relationship between kidney perfusion in CEUS and kidney function in living kidney donors. However, its significance is limited to patients of normal weight and BMI, and the US settings appear to affect renal perfusion quantified by TIC measurements on CEUS. This pilot study provides important new insights and supports the role of CEUS in assessing whole organ perfusion. Future research should analyze the relationships and potential confounders identified here in a larger population.

Author Contributions

Conceptualization, N.E.-B., F.F. and T.F.; methodology, N.E.-B. and M.H.L.; software, N.E.-B.; validation, F.F., T.F. and B.H.; formal analysis, N.E.-B.; investigation, N.E.-B., M.H.L. and T.F.; data curation, N.E.-B., L.L. and F.F.; writing—original draft preparation, N.E.-B.; writing—review and editing, all authors; visualization, R.P.; supervision, F.F., T.F., M.H.L., T.S., K.K., A.S., K.B., K.M. and A.M. All authors have read and agreed to the published version of the manuscript.

Funding

This research received no external funding.

Institutional Review Board Statement

“The study was conducted in accordance with the Declaration of Helsinki, and approved by the Institutional Ethics Committee) of Charité Universitätsmedizin Berlin (protocol code EA1/406/16, 26.01.2017)”.

Informed Consent Statement

Informed consent was obtained from all subjects involved in the study.

Acknowledgments

The authors thank Bettina Herwig for language editing of the manuscript, Annette Aigner for statistical advice and Christian Greis (Bracco Imaging) for scientific advice.

Conflicts of Interest

The authors declare no conflict of interest. Markus H. Lerchbaumer reports having received consultancy honoraria from Siemens Healthineers. Thomas Fischer reports having received consultancy honoraria from Siemens Healthineers, Bracco Imaging and Canon Medical Imaging.

References

  1. Delmonico, F. A Report of the Amsterdam Forum On the Care of the Live Kidney Donor: Data and Medical Guidelines. Transplantation 2005, 79, S53–S66. [Google Scholar] [PubMed]
  2. Durand, E.; Müller-Suur, R. Zur Messung der Nierenfunktion durch Clearancebestimmungen: Methoden und Indikationen—Ein Update. Der Nukl. 2010, 33, 145–153. [Google Scholar] [CrossRef]
  3. Levey, A.S.; Stevens, L.A.; Schmid, C.H.; Zhang, Y.L.; Castro, A.F., III; Feldman, H.I.; Kusek, J.W.; Eggers, P.; Van Lente, F.; Greene, T.; et al. A new equation to estimate glomerular filtration rate. Ann. Intern. Med. 2009, 150, 604–612. [Google Scholar] [CrossRef] [PubMed]
  4. Levey, A.S.; Bosch, J.P.; Lewis, J.B.; Greene, T.; Rogers, N.; Roth, D. A more accurate method to estimate glomerular filtration rate from serum creatinine: A new prediction equation. Modification of Diet in Renal Disease Study Group. Ann. Intern. Med. 1999, 130, 461–470. [Google Scholar] [CrossRef]
  5. Cockcroft, D.W.; Gault, M.H. Prediction of creatinine clearance from serum creatinine. Nephron 1976, 16, 31–41. [Google Scholar] [CrossRef]
  6. Levey, A.S.; Inker, L.A.; Coresh, J. GFR estimation: From physiology to public health. Am. J. Kidney Dis. 2014, 63, 820–834. [Google Scholar] [CrossRef] [Green Version]
  7. Lentine, K.L.; Kasiske, B.L.; Levey, A.S.; Adams, P.L.; Alberú, J.; Bakr, M.A.; Gallon, L.; Garvey, C.A.; Guleria, S.; Li, P.K.-T.; et al. Summary of Kidney Disease: Improving Global Outcomes (KDIGO) Clinical Practice Guideline on the Evaluation and Care of Living Kidney Donors. Transplantation 2017, 101, 1783–1792. [Google Scholar] [CrossRef] [Green Version]
  8. Abramowicz, D.; Cochat, P.; Claas, F.H.; Heemann, U.; Pascual, J.; Dudley, C.; Harden, P.; Hourmant, M.; Maggiore, U.; Salvadori, M.; et al. European Renal Best Practice Guideline on kidney donor and recipient evaluation and perioperative care. Nephrol. Dial. Transplant. 2015, 30, 1790–1797. [Google Scholar] [CrossRef]
  9. Andrews, P.A.; Burnapp, L.; Manas, D.; Bradley, J.A.; Dudley, C. Summary of the British Transplantation Society/Renal Association U.K. guidelines for living donor kidney transplantation. Transplantation 2012, 93, 666–673. [Google Scholar] [CrossRef]
  10. Halleck, F.; Diederichs, G.; Koehlitz, T.; Slowinski, T.; Engelken, F.; Liefeldt, L.; Friedersdorff, F.; Fuller, T.F.; Magheli, A.; Neumayer, H.-H.; et al. Volume matters: CT-based renal cortex volume measurement in the evaluation of living kidney donors. Transpl. Int. 2013, 26, 1208–1216. [Google Scholar] [CrossRef]
  11. Brar, A.; Jindal, R.M.; Abbott, K.C.; Hurst, F.P.; Salifu, M.O. Practice patterns in evaluation of living kidney donors in United Network for Organ Sharing-approved kidney transplant centers. Am. J. Nephrol. 2012, 35, 466–473. [Google Scholar] [CrossRef]
  12. Poggio, E.D.; Hila, S.; Stephany, B.; Fatica, R.; Krishnamurthi, V.; Del Bosque, C.; Goldfarb, D.; Herts, B.; Dennis, V.W.; Heeger, P.S.; et al. Donor kidney volume and outcomes following live donor kidney transplantation. Am. J. Transplant. 2006, 6, 616–624. [Google Scholar] [CrossRef] [PubMed]
  13. Paleologo, G.; Abdelkawy, H.; Barsotti, M.; Basha, A.; Bernabini, G.; Bianchi, A.; Caprio, F.; Emad, A.; Grassi, G.; Nerucci, B.; et al. Kidney dimensions at sonography are correlated with glomerular filtration rate in renal transplant recipients and in kidney donors. Transplant. Proc. 2007, 39, 1779–1781. [Google Scholar] [CrossRef]
  14. Buckley, D.L.; Shurrab, A.E.; Cheung, C.M.; Jones, A.P.; Mamtora, H.; Kalra, P.A. Measurement of single kidney function using dynamic contrast-enhanced MRI: Comparison of two models in human subjects. J. Magn. Reson. Imaging 2006, 24, 1117–1123. [Google Scholar] [CrossRef]
  15. Raptis, A.E.; Viberti, G. Pathogenesis of diabetic nephropathy. Exp. Clin. Endocrinol. Diabetes 2001, 109 (Suppl. 2), S424–S437. [Google Scholar] [CrossRef] [PubMed]
  16. Hughson, M.D.; Johnson, K.; Young, R.J.; Hoy, W.E.; Bertram, J.F. Glomerular size and glomerulosclerosis: Relationships to disease categories, glomerular solidification, and ischemic obsolescence. Am. J. Kidney Dis. 2002, 39, 679–688. [Google Scholar] [CrossRef] [PubMed]
  17. Wang, L.; Wu, J.; Cheng, J.F.; Liu, X.-Y.; Ma, F.; Guo, L.-H.; Xu, J.-M.; Wu, T.; Mohan, C.; Peng, A.; et al. Diagnostic value of quantitative contrast-enhanced ultrasound (CEUS) for early detection of renal hyperperfusion in diabetic kidney disease. J. Nephrol. 2015, 28, 669–678. [Google Scholar] [CrossRef] [PubMed]
  18. Sidhu, P.S.; Cantisani, V.; Dietrich, C.F.; Gilja, O.H.; Saftoiu, A.; Bartels, E.; Bertolotto, M.; Calliada, F.; Clevert, D.A.; Cosgrove, D.; et al. The EFSUMB Guidelines and Recommendations for the Clinical Practice of Contrast-Enhanced Ultrasound (CEUS) in Non-Hepatic Applications: Update 2017 (Short Version). Ultraschall Med. 2018, 39, 154–180. [Google Scholar] [CrossRef] [Green Version]
  19. Spiesecke, P.; Fischer, T.; Maxeiner, A.; Hamm, B.; Lerchbaumer, M.H. Contrast-enhanced ultrasound (CEUS) reliably rules out neoplasm in developmental renal pseudotumor. Acta Radiol. 2020, 62, 821–829. [Google Scholar] [CrossRef]
  20. Greis, C. Ultrasound contrast agents as markers of vascularity and microcirculation. Clin. Hemorheol. Microcirc. 2009, 43, 1–9. [Google Scholar] [CrossRef]
  21. Greis, C. Quantitative evaluation of microvascular blood flow by contrast-enhanced ultrasound (CEUS). Clin. Hemorheol. Microcirc. 2011, 49, 137–149. [Google Scholar] [CrossRef] [PubMed]
  22. Bracco. User Manual|CEUS—Contrast Enhanced Ultrasound: Bracco Suisse SA; Copyright© 2019 Bracco Suisse SA All Rights Reserved. Available online: https://www.contrastultrasound-modality.com/quantification-software/support/user-manual (accessed on 22 December 2020).
  23. Fleming, J.S.; Persaud, L.; Zivanovic, M.A. A general equation for estimating glomerular filtration rate from a single plasma sample. Nucl. Med. Commun. 2005, 26, 743–748. [Google Scholar] [CrossRef] [PubMed]
  24. Bubeck, B. Renal clearance determination with one blood sample: Improved accuracy and universal applicability by a new calculation principle. Semin. Nucl. Med. 1993, 23, 73–86. [Google Scholar] [CrossRef]
  25. Dietrich, C.F.; Averkiou, M.; Nielsen, M.B.; Barr, R.G.; Burns, P.N.; Calliada, F.; Cantisani, V.; Choi, B.; Chammas, M.C.; Clevert, D.A.; et al. How to perform Contrast-Enhanced Ultrasound (CEUS). Ultrasound Int. Open 2018, 4, E2–E15. [Google Scholar] [CrossRef] [PubMed] [Green Version]
  26. Kunz, P.; Kiesl, S.; Groß, S.; Kauczor, H.-U.; Schmidmaier, G.; Fischer, C. Intra-observer and Device-Dependent Inter-observer Reliability of Contrast-Enhanced Ultrasound for Muscle Perfusion Quantification. Ultrasound Med. Biol. 2020, 46, 275–285. [Google Scholar] [CrossRef]
  27. Krumm, P.; Hupka, T.; Haußmann, F.; Dittmann, H.; Mühlbacher, T.; Nadalin, S.; Königsrainer, A.; Nikolaou, K.; Heyne, N.; Kramer, U.; et al. Contrast-enhanced MRI for simultaneous evaluation of renal morphology and split renal function in living kidney donor candidates. Eur. J. Radiol. 2021, 142, 109864. [Google Scholar] [CrossRef]
  28. Tang, C.; Fang, K.; Guo, Y.; Li, R.; Fan, X.; Chen, P.; Chen, Z.; Liu, Q.; Zou, Y. Safety of Sulfur Hexafluoride Microbubbles in Sonography of Abdominal and Superficial Organs: Retrospective Analysis of 30,222 Cases. J. Ultrasound Med. 2017, 36, 531–538. [Google Scholar] [CrossRef] [Green Version]
Figure 1. Example illustrating kidney perfusion in CEUS approximately 1 s (a), 4 s (b) and 13 s (c) after detection of the first signal (approximately 10–15 s after injection of the ultrasound contrast agent). In (a) the contrast agent enhances the interlobar arteries and part of the renal cortex. Full cortical enhancement is seen in (b), and perfusion of the whole kidney including the renal pyramids is shown in (c). Figure (d) shows the time course of successive enhancement in different colors in a single image. Red indicates earliest enhancement, followed by yellow, green and blue regions.
Jcm 11 00791 g001
Figure 2. CEUS perfusion parameters in a model. TI defines the point in time when the tangent of the maximum increase (WiR) intersects the x-axis. TO is the point in time when the tangent of the maximum decrease intersects the x-axis. Parameters shown are described in Table 1 and Table 2. WiWoAUC: Wash-in and wash-out Area Under the Curve; WoR: Wash-out Rate; WiR: Wash-in Rate; WoAUC: Wash-out Area Under the Curve; WiAUC: Wash-in Area Under the Curve; PE: Peak Enhancement; RT: Rise time; FT: Fall time; mTT1: Mean transit time local (mTT-Tl); TTP: Time to peak; S: seconds; a.u: arbitrary units; Figure source: VueBox—instruction for use [19]. CEUS: Contrast-enhanced ultrasound.
Jcm 11 00791 g002
Figure 3. Scatter diagram of the association between MeanLin and DTPA clearance. Each dot represents one kidney. Data are presented in different colors for each of the three BMI-based subgroups. The results suggest that BMI could have had an impact on signal intensity and might thus be a confounder affecting the relationship between MeanLin and DTPA clearance.
Jcm 11 00791 g003
Table 1. CEUS parameters.
CEUS ParameterLabelDescription
Time-related parameters †RTRise time-
mTTlMean transit time local
(mTT-Tl)
-
TTPTime to peak-
FTFall time-
Signal intensity parameters *MeanLin-Mean signal intensity
PEPeak enhancementMaximum signal enhancement
WiAUCWash-in area under the curve (AUC (TI:TTP))AUC (area under the curve) during wash-in of UCA (between TI and TTP)
WiRWash-in rateMaximum increase
WiPIWash-in perfusion indexWiAUC/RT
WoAUCWash-out AUC
(AUC (TTP:TO))
AUC (area under the curve) during wash-out of UCA (between TTP und TO)
WiWoAUCWash-in and wash-out AUCWiAUC + WiWoAUC
WoRWash-out rateMaximum decrease
* Signal intensity parameters in arbitrary units (a.u.). † Time-related parameters in seconds (s).
Table 2. Results for total and split kidney function.
MeanStandard DeviationTotal
Total kidney function prior to nephrectomyDTPA clearance (mL/min/1.73 m2)971430
Serum creatinine (mg/dL)0.830.1330
eGFR (CG) (mL/min/1.73 m2)952530
eGFR (CKD-EPI) (mL/min/1.73 m2)871430
eGFR (MDRD) (mL/min/1.73 m2)841430
Total kidney volume (cm3)3237430
Split kidney function prior to nephrectomyProportion in MAG3 (%)right47.63.330
left52.43.330
Split DTPA clearance (mL/min/1.73 m2)49860
Split eGFR (CG) (mL/min/1.73 m2)471360
Split eGFR (CKD-EPI) (mL/min/1.73 m2)44860
Split eGFR (MDRD) (mL/min/1.73 m2)42860
Split kidney volume (cm3)1623860
Total kidney function after nephrectomyeGFR (CG) (mL/min/1.73 m2)591730
eGFR (CKD-EPI) (mL/min/1.73 m2)501130
eGFR (MDRD) (mL/min/1.73 m2)49930
Calculation of split DTPA clearance and split eGFR by multiplication with the proportion of split kidney function in MAG3-scintigraphy; no depth correction was applied for calculation of split kidney function.
Table 3. Computed CEUS values.
Parameter *MeanInterquartile RangeCorrelation with MeanLinTotal
MeanLin †12.917.1 (3.7–20.8)-60
PE †27.638.1 (8–46.1)r = 0.984; p < 0.00159
WiAUC †80102.1 (22.4–124.5)r = 0.987; p < 0.00159
WiR †8.813.4 (2.3–15.7)r = 0.937; p < 0.00159
WiPI †17.523.8 (5.6–29.4)r = 0.985; p < 0.00159
WoAUC †150.8192.3 (41.3–233.6)r = 0.983; p < 0.00158
WiWoAUC †230.6292 (64–356)r = 0.983; p < 0.00158
WoR †3.75.3 (0.9–6.2)r = 0.930; p < 0.00158
MeanInterquartile RangeCorrelation with RTTotal
RT ‡4.71.2 (3.8–5)-59
mTTI ‡25.817.1 (14–31.1)r = 0.387; p = 0.00259
TTP ‡7.42.1 (6.2–8.3)r = 0.860; p < 0.00159
FT ‡9.52.2 (7.5–9.7)r = 0.898; p < 0.00158
† values in (a.u.); ‡ values in (s). Since the actual values were very large, they were divided by 1000. * All abbreviations are explained in Table 1.
Table 4. Parameters used for evaluation of kidney function prior to donor nephrectomy.
Correlation with DTPA Clearancep-Value
eGFR (CG)r = 0.531p = 0.003
Total kidney volumer = 0.472p = 0.008
eGFR (CKD-EPI)r = 0.470p = 0.009
eGFR (MDRD)r = 0.377p = 0.040
Serum creatininer = −0.228p = 0.225
Table 5. Correlation of CEUS parameters with different methods for evaluation of preoperative total kidney function.
Correlation with DTPACorrelation with eGFR (CKD-EPI)Correlation with eGFR (CG)Correlation with Total Kidney Volume
MeanLinr = −0.170;
p = 0.194
r = −0.179;
p = 0.172
r = −0.345;
p = 0.007
r = −0.409;
p = 0.001
PEr = −0.162;
p = 0.221
r = −0.182;
p = 0.169
r = −0.322;
p = 0.013
r = −0.392;
p = 0.002
WiAUCr = −0.189;
p = 0.152
r = −0.214;
p = 0.104
r = −0.339;
p = 0.009
r = −0.402;
p = 0.002
WiRr = −0.112;
p = 0.399
r = −0.111;
p = 0.401
r = −0.274;
p = 0.036
r = −0.357;
p = 0.005
WiPIr = −0.160;
p = 0.225
r = −0.177;
p = 0.179
r = −0.319;
p = 0.014
r = −0.391;
p = 0.014
WoAUCr = −0.174;
p = 0.192
r = −0.197;
p = 0.138
r = −0.321;
p = 0.014
r = −0.403;
p = 0.002
WiWoAUCr = −0.160;
p = 0.229
r = −0.214;
p = 0.106
r = −0.346;
p = 0.008
r = −0.401;
p = 0.002
WoRr = −0.123;
p = 0.356
r = −0.155;
p = 0.245
r = −0.306;
p = 0.019
r = −0.355;
p = 0.006
RTr = 0.037;
p = 0.782
r = −0.118;
p = 0.374
r = −0.084;
p = 0.528
r = −0.018;
p = 0.893
mTTlr = −0.160;
p = 0.226
r = 0.024;
p = 0.860
r = 0.045;
p = 0.733
r = −0.015;
p = 0.913
TTPr = −0.007;
p = 0.959
r = −0.216;
p = 0.100
r = −0.178;
p = 0.178
r = −0.092;
p = 0.489
FTr = 0.113;
p = 0.398
r = −0.105;
p = 0.433
r = −0.047;
p = 0.724
r = −0.013;
p = 0.923
The strongest correlations are indicated in bold. MeanLin—analyzed as a representative parameter of signal intensity—shows the strongest correlations as a representative parameter of signal intensity.
Table 6. Correlation of CEUS-based signal intensity parameters with preoperative split kidney function and postoperative kidney function in donors.
Correlation with Split DTPACorrelation with Split eGFR
(CKD-EPI)
Correlation with Split eGFR (CG)Correlation with Split Kidney Volume
Preoperative split kidney function
MeanLinr = −0.150;
p = 0.253
r = −0.176;
p = 0.179
r = −0.331;
p = 0.010
r = −0.398;
p = 0.002
WiWoAUCr = −0.151;
p = 0.258
r = −0.216;
p = 0.104
r = −0.338;
p = 0.009
r = −0.389;
p = 0.003
Postoperative kidney function
MeanLinn.A.r = −0.133;
p = 0.483
r = −0.399;
p = 0.029
n.A.
WiWoAUCn.A.r = −0.148;
p = 0.436
r = −0.393;
p = 0.032
n.A.
The strongest correlations are indicated in bold. n.A.: not available.
Publisher’s Note: MDPI stays neutral with regard to jurisdictional claims in published maps and institutional affiliations.

