
Association of Barriers, Fear of Falling and Fatigue with Objectively Measured Physical Activity and Sedentary Behavior in Chronic Stroke


 ,
, 
 , , and
Abstract
1. Introduction
2. Materials and Methods
2.1. Study Design
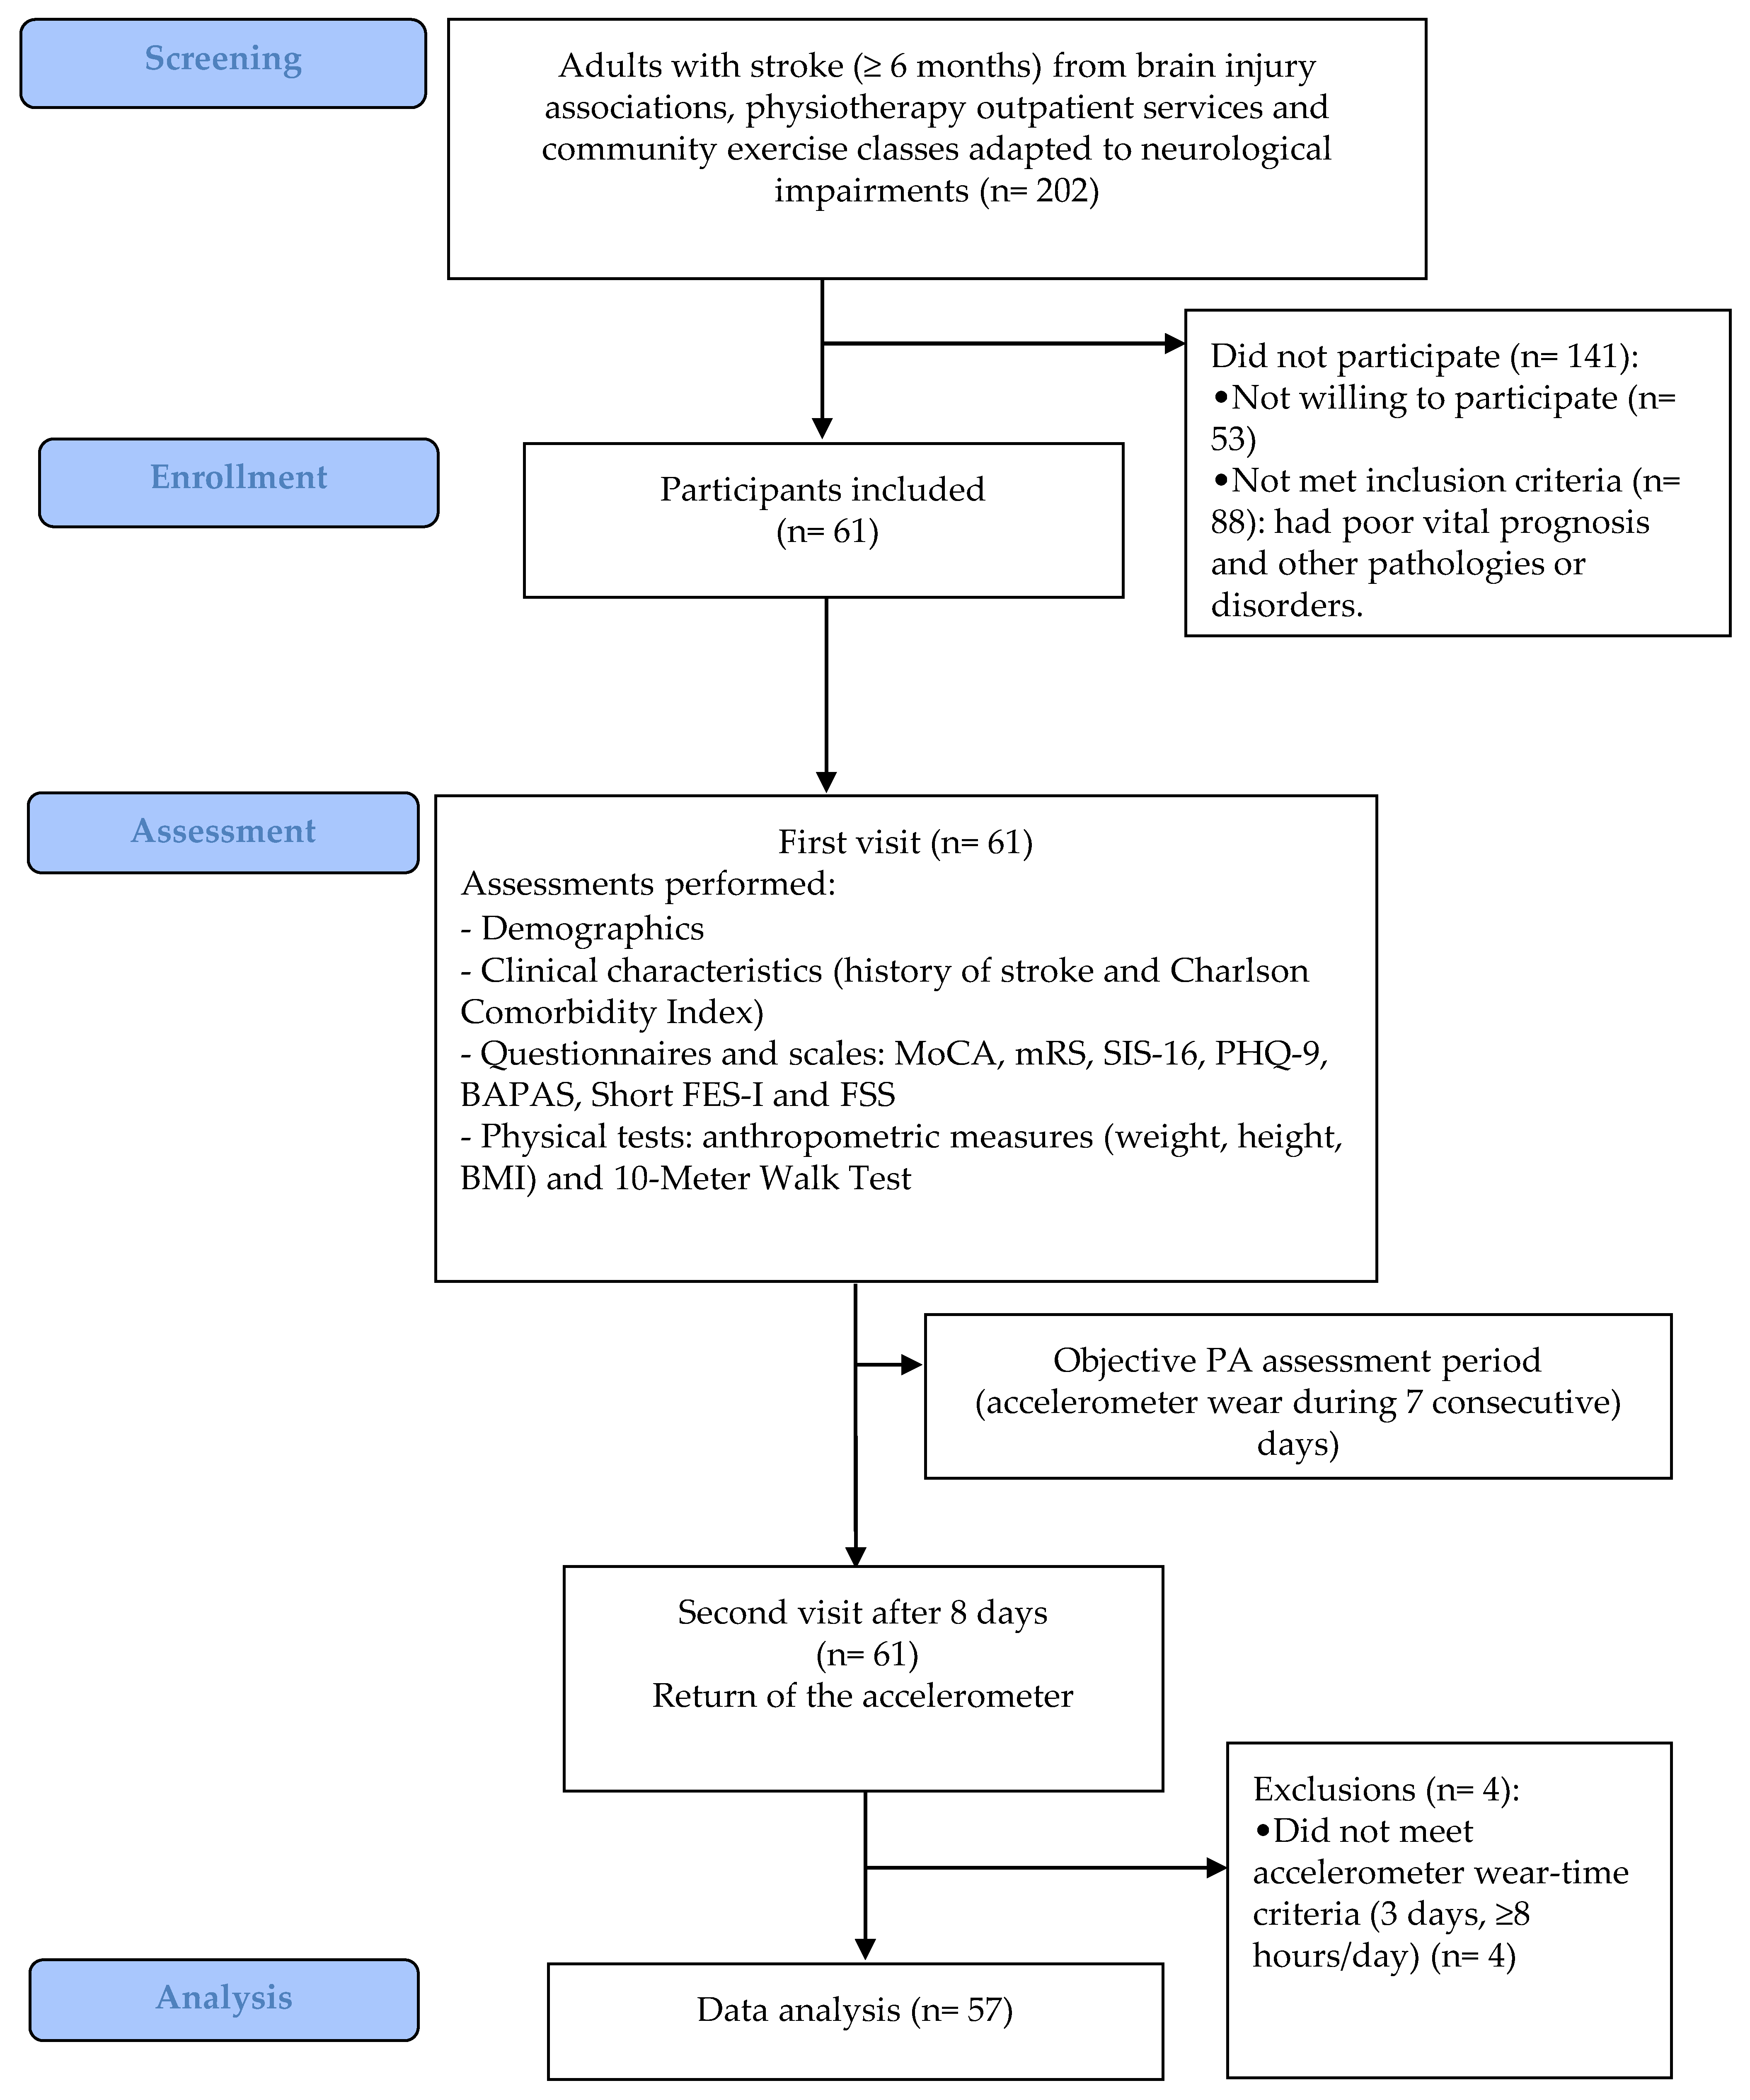
2.2. Participants
2.3. Procedures and Outcomes
- Barriers to physical activity
- 2.
- Fear of falling
- 3.
- Severity of fatigue
- 4.
- Activity Monitoring Measurement
- Sedentary time, percentage of time in SB of the total wear time (time in SB/Total wear time*100).
- Prolonged sedentary time, percentage of time in prolonged SB (total time in SB bouts ≥ 30 min) of the total wear time (time in prolonged SB/Total wear time*100).
- LPA, percentage of time spent in LPA of the total wear time (time in LPA/Total wear time*100).
- MVPA, percentage of time spent in MVPA of the total wear time (time in MVPA/Total wear time*100).
2.4. Sample Size Calculation
2.5. Data Analysis
3. Results
3.1. Participants’ Characteristics
3.2. Results of the Barriers, Fear of Falling and Fatigue Scales and Activity Monitoring Measurement
3.3. Association between Barriers, Fear of Falling, Fatigue and Level of Physical Activity, and Sedentary Behavior
4. Discussion
5. Conclusions
Supplementary Materials
Author Contributions
Funding
Institutional Review Board Statement
Informed Consent Statement
Data Availability Statement
Acknowledgments
Conflicts of Interest
References
- Béjot, Y.; Bailly, H.; Durier, J.; Giroud, M. Epidemiology of stroke in Europe and trends for the 21st century. Presse Med. 2016, 45, e391–e398. [Google Scholar] [CrossRef]
- Purroy, F.; Vena, A.; Forné, C.; de Arce, A.M.; Dávalos, A.; Fuentes, B.; Arenillas, J.F.; Krupinski, J.; Gómez-Choco, M.; Palomeras, E.; et al. Age- and sex-specific risk profiles and in-hospital mortality in 13,932 spanish stroke patients. Cerebrovasc. Dis. 2019, 47, 151–164. [Google Scholar] [CrossRef]
- Wafa, H.A.; Wolfe, C.D.A.; Emmett, E.; Roth, G.A.; Johnson, C.O.; Wang, Y. Burden of stroke in Europe: Thirty-year projections of incidence, prevalence, deaths, and disability-adjusted life years. Stroke 2020, 51, 2418–2427. [Google Scholar] [CrossRef]
- Pickens, C.M.; Pierannunzi, C.; Garvin, W.; Town, M. Surveillance for certain health behaviors and conditions among states and selected local areas—Behavioral risk factor surveillance system, United States, 2015. Morb. Mortal. Wkly. Rep. Surveill. Summ. 2018, 67, 1–90. [Google Scholar] [CrossRef]
- Billinger, S.A.; Arena, R.; Bernhardt, J.; Eng, J.J.; Franklin, B.A.; Johnson, C.M.; MacKay-Lyons, M.; Macko, R.F.; Mead, G.E.; Roth, E.J.; et al. Physical activity and exercise recommendations for stroke survivors: A statement for healthcare professionals from the American Heart Association/American Stroke Association. Stroke 2014, 45, 2532–2553. [Google Scholar] [CrossRef] [PubMed]
- Butte, N.F.; Ekelund, U.; Westerterp, K.R. Assessing physical activity using wearable monitors: Measures of physical activity. Med. Sci. Sports Exerc. 2012, 44, S5–S12. [Google Scholar] [CrossRef] [PubMed]
- Kernan, W.N.; Ovbiagele, B.; Black, H.R.; Bravata, D.M.; Chimowitz, M.I.; Ezekowitz, M.D.; Fang, M.C.; Fisher, M.; Furie, K.L.; Heck, D.V.; et al. Guidelines for the prevention of stroke in patients with stroke and transient ischemic attack: A guideline for healthcare professionals from the American Heart Association/American Stroke Association. Stroke 2014, 45, 2160–2236. [Google Scholar] [CrossRef]
- Jackson, S.; Mercer, C.; Singer, B.J. An exploration of factors influencing physical activity levels amongst a cohort of people living in the community after stroke in the south of England. Disabil. Rehabil. 2018, 40, 414–424. [Google Scholar] [CrossRef] [PubMed]
- Borschmann, K.N.; Ekinci, E.I.; Iuliano, S.; Churilov, L.; Pang, M.Y.; Bernhardt, J. Reducing sedentary time and fat mass may improve glucose tolerance and insulin sensitivity in adults surviving 6 months after stroke: A phase I pilot study. Eur. stroke J. 2017, 2, 144–153. [Google Scholar] [CrossRef]
- Tremblay, M.S.; Aubert, S.; Barnes, J.D.; Saunders, T.J.; Carson, V.; Latimer-Cheung, A.E.; Chastin, S.F.M.; Altenburg, T.M.; Chinapaw, M.J.M. Sedentary Behavior Research Network (SBRN)—Terminology Consensus Project process and outcome. Int. J. Behav. Nutr. Phys. Act. 2017, 14, 75. [Google Scholar] [CrossRef]
- Harmsen, W.J.; Ribbers, G.M.; Heijenbrok-Kal, M.H.; Bussmann, J.B.J.; Sneekes, E.M.; Khajeh, L.; van Kooten, F.; Neggers, S.J.C.M.M.; van den Berg-Emons, R.J. Inactive lifestyles and sedentary behavior in persons with chronic aneurysmal subarachnoid hemorrhage: Evidence from accelerometer-based activity monitoring. J. Neuroeng. Rehabil. 2017, 14, 120. [Google Scholar] [CrossRef] [PubMed]
- English, C.; Healy, G.N.; Coates, A.; Lewis, L.; Olds, T.; Bernhardt, J. Sitting and activity time in people with stroke. Phys. Ther. 2016, 96, 193–201. [Google Scholar] [CrossRef]
- English, C.; Healy, G.N.; Olds, T.; Parfitt, G.; Borkoles, E.; Coates, A.; Kramer, S.; Bernhardt, J. Reducing sitting time after stroke: A phase II safety and feasibility randomized controlled trial. Arch. Phys. Med. Rehabil. 2016, 97, 273–280. [Google Scholar] [CrossRef]
- Falck, R.S.; Best, J.R.; Li, M.C.R.; Eng, J.J.; Liu-Ambrose, T. Revisiting the MotionWatch8©: Calibrating cut-points for measuring physical activity and sedentary behavior among adults with stroke. Front. Aging Neurosci. 2019, 11, 203. [Google Scholar] [CrossRef]
- Fini, N.A.; Bernhardt, J.; Holland, A.E. Low gait speed is associated with low physical activity and high sedentary time following stroke. Disabil. Rehabil. 2019, 1–8. [Google Scholar] [CrossRef] [PubMed]
- Kanai, M.; Izawa, K.P.; Kubo, H.; Nozoe, M.; Mase, K.; Koohsari, M.J.; Oka, K.; Shimada, S. Association of perceived built environment attributes with objectively measured physical activity in community-dwelling ambulatory patients with stroke. Int. J. Environ. Res. Public Health 2019, 16, 3908. [Google Scholar] [CrossRef] [PubMed]
- Wondergem, R.; Veenhof, C.; Wouters, E.M.J.; de Bie, R.A.; Visser-Meily, J.M.A.; Pisters, M.F. Movement behavior patterns in people with first-ever stroke. Stroke 2019, 50, 3553–3560. [Google Scholar] [CrossRef] [PubMed]
- Persson, C.U.; Hansson, P.-O. Early prediction of physical inactivity in 215 individuals 6 months after a mild stroke: The fall study of Gothenburg. J. Rehabil. Med. 2020, 52, jrm00077. [Google Scholar] [CrossRef]
- Simpson, D.B.; Jose, K.; English, C.; Gall, S.L.; Breslin, M.; Callisaya, M.L. Factors influencing sedentary time and physical activity early after stroke: A qualitative study. Disabil. Rehabil. 2021, 1–9. [Google Scholar] [CrossRef] [PubMed]
- Hamre, C.; Fure, B.; Helbostad, J.L.; Wyller, T.B.; Ihle-Hansen, H.; Vlachos, G.; Ursin, M.H.; Tangen, G.G. Factors associated with level of physical activity after minor stroke. J. Stroke Cerebrovasc. Dis. Off. J. Natl. Stroke Assoc. 2021, 30, 105628. [Google Scholar] [CrossRef]
- Thilarajah, S.; Bower, K.J.; Pua, Y.-H.; Tan, D.; Williams, G.; Larik, A.; Bok, C.-W.; Koh, G.; Clark, R.A. Modifiable factors associated with poststroke physical activity at discharge from rehabilitation: Prospective cohort study. Phys. Ther. 2020, 100, 818–828. [Google Scholar] [CrossRef]
- Rand, D.; Eng, J.J.; Tang, P.-F.; Hung, C.; Jeng, J.-S. Daily physical activity and its contribution to the health-related quality of life of ambulatory individuals with chronic stroke. Health Qual. Life Outcomes 2010, 8, 80. [Google Scholar] [CrossRef] [PubMed]
- English, C.; Healy, G.N.; Coates, A.; Lewis, L.K.; Olds, T.; Bernhardt, J. Sitting time and physical activity after stroke: Physical ability is only part of the story. Top. Stroke Rehabil. 2016, 23, 36–42. [Google Scholar] [CrossRef]
- Joseph, C.; Conradsson, D.; Hagströmer, M.; Lawal, I.; Rhoda, A. Objectively assessed physical activity and associated factors of sedentary behavior among survivors of stroke living in Cape Town, South Africa. Disabil. Rehabil. 2018, 40, 2509–2515. [Google Scholar] [CrossRef] [PubMed]
- World Medical Association Declaration of Helsinki: Ethical principles for medical research involving human subjects. JAMA 2013, 310, 2191–2194. [CrossRef] [PubMed]
- von Elm, E.; Altman, D.G.; Egger, M.; Pocock, S.J.; Gøtzsche, P.C.; Vandenbroucke, J.P. The Strengthening the Reporting of Observational Studies in Epidemiology (STROBE) Statement: Guidelines for reporting observational studies. Int. J. Surg. 2014, 12, 1495–1499. [Google Scholar] [CrossRef]
- Viosca, E.; Martínez, J.L.; Almagro, P.L.; Gracia, A.; González, C. Proposal and validation of a new functional ambulation classification scale for clinical use. Arch. Phys. Med. Rehabil. 2005, 86, 1234–1238. [Google Scholar] [CrossRef] [PubMed]
- Goldstein, L.B.; Samsa, G.P.; Matchar, D.B.; Horner, R.D. Charlson Index comorbidity adjustment for ischemic stroke outcome studies. Stroke 2004, 35, 1941–1945. [Google Scholar] [CrossRef]
- Vahlberg, B.; Bring, A.; Hellström, K.; Zetterberg, L. Level of physical activity in men and women with chronic stroke. Physiother. Theory Pract. 2019, 35, 947–955. [Google Scholar] [CrossRef]
- Dong, Y.; Sharma, V.K.; Chan, B.P.-L.; Venketasubramanian, N.; Teoh, H.L.; Seet, R.C.S.; Tanicala, S.; Chan, Y.H.; Chen, C. The Montreal Cognitive Assessment (MoCA) is superior to the Mini-Mental State Examination (MMSE) for the detection of vascular cognitive impairment after acute stroke. J. Neurol. Sci. 2010, 299, 15–18. [Google Scholar] [CrossRef]
- Wilson, J.T.L.; Hareendran, A.; Grant, M.; Baird, T.; Schulz, U.G.R.; Muir, K.W.; Bone, I. Improving the assessment of outcomes in stroke: Use of a structured interview to assign grades on the modified Rankin Scale. Stroke 2002, 33, 2243–2246. [Google Scholar] [CrossRef]
- Lee, S.Y.; Kim, D.Y.; Sohn, M.K.; Lee, J.; Lee, S.G.; Shin, Y.I.; Kim, S.Y.; Oh, G.J.; Lee, Y.H.; Lee, Y.S.; et al. Determining the cut-off score for the Modified Barthel Index and the Modified Rankin Scale for assessment of functional independence and residual disability after stroke. PLoS ONE 2020, 15, e0226324. [Google Scholar] [CrossRef]
- Kroenke, K.; Spitzer, R.L.; Williams, J.B. The PHQ-9: Validity of a brief depression severity measure. J. Gen. Intern. Med. 2001, 16, 606–613. [Google Scholar] [CrossRef]
- Duncan, P.W.; Lai, S.M.; Bode, R.K.; Perera, S.; DeRosa, J. Stroke Impact Scale-16: A brief assessment of physical function. Neurology 2003, 60, 291–296. [Google Scholar] [CrossRef]
- Chou, C.Y.; Ou, Y.C.; Chiang, T.R. Psychometric comparisons of four disease-specific health-related quality of life measures for stroke survivors. Clin. Rehabil. 2015, 29, 816–829. [Google Scholar] [CrossRef]
- Flansbjer, U.B.; Holmbäck, A.M.; Downham, D.; Patten, C.; Lexell, J. Reliability of gait performance tests in men and women with hemiparesis after stroke. J. Rehabil. Med. 2005, 37, 75–82. [Google Scholar] [CrossRef]
- Drigny, J.; Joussain, C.; Gremeaux, V.; Morello, R.; Van Truc, P.H.; Stapley, P.; Touzé, E.; Ruet, A. Development and validation of a questionnaire to assess barriers to physical activity after stroke: The Barriers to Physical Activity After Stroke Scale. Arch. Phys. Med. Rehabil. 2019, 100, 1672–1679. [Google Scholar] [CrossRef]
- Kempen, G.I.J.M.; Yardley, L.; van Haastregt, J.C.M.; Zijlstra, G.A.R.; Beyer, N.; Hauer, K.; Todd, C. The Short FES-I: A shortened version of the falls efficacy scale-international to assess fear of falling. Age Ageing 2008, 37, 45–50. [Google Scholar] [CrossRef] [PubMed]
- Araya, A.X.; Valenzuela, E.; Padilla, O.; Iriarte, E.; Caro, C. Fear of falling: Validation of a measurement tool in Chilean elderly living in the community. Rev. Esp. Geriatr. Gerontol. 2017, 52, 188–192. [Google Scholar] [CrossRef]
- Cumming, T.B.; Packer, M.; Kramer, S.F.; English, C. The prevalence of fatigue after stroke: A systematic review and meta-analysis. Int. J. Stroke Off. J. Int. Stroke Soc. 2016, 11, 968–977. [Google Scholar] [CrossRef]
- Ozyemisci-Taskiran, O.; Batur, E.B.; Yuksel, S.; Cengiz, M.; Karatas, G.K. Validity and reliability of fatigue severity scale in stroke. Top. Stroke Rehabil. 2019, 26, 122–127. [Google Scholar] [CrossRef] [PubMed]
- Duncan, S.; Stewart, T.; Bo Schneller, M.; Godbole, S.; Cain, K.; Kerr, J. Convergent validity of ActiGraph and Actical accelerometers for estimating physical activity in adults. PLoS ONE 2018, 13, e0198587. [Google Scholar] [CrossRef]
- Choi, L.; Liu, Z.; Matthews, C.E.; Buchowski, M.S. Validation of accelerometer wear and nonwear time classification algorithm. Med. Sci. Sports Exerc. 2011, 43, 357–364. [Google Scholar] [CrossRef]
- Joseph, C.; Rhoda, A.; Conradsson, D.M. Levels and patterns of physical activity in stroke survivors with different ambulation status living in low-income areas of Cape Town, South Africa. Top. Stroke Rehabil. 2020, 27, 494–502. [Google Scholar] [CrossRef]
- Freedson, P.S.; Melanson, E.; Sirard, J. Calibration of the Computer Science and Applications, Inc. accelerometer. Med. Sci. Sports Exerc. 1998, 30, 777–781. [Google Scholar] [CrossRef]
- Selya, A.S.; Rose, J.S.; Dierker, L.C.; Hedeker, D.; Mermelstein, R.J. A Practical guide to calculating Cohen’s f(2), a measure of local effect size, from PROC MIXED. Front. Psychol. 2012, 3, 111. [Google Scholar] [CrossRef]
- Faul, F.; Erdfelder, E.; Buchner, A.; Lang, A.G. Statistical power analyses using G*Power 3.1: Tests for correlation and regression analyses. Behav. Res. Methods 2009, 41, 1149–1160. [Google Scholar] [CrossRef]
- Cohen, J. Statistical Power Analysis for the Behavioral Sciences, 2nd ed.; Lawrence Erlbaum Associates: Mahwah, NJ, USA, 1988. [Google Scholar]
- Rimmer, J.H.; Wang, E.; Smith, D. Barriers associated with exercise and community access for individuals with stroke. J. Rehabil. Res. Dev. 2008, 45, 315–322. [Google Scholar] [CrossRef]
- Zalewski, K.R.; Dvorak, L. Barriers to physical activity between adults with stroke and their care partners. Top. Stroke Rehabil. 2011, 18 (Suppl. 1), 666–675. [Google Scholar] [CrossRef]
- Idowu, O.A.; Adeniyi, A.F.; Ogwumike, O.O.; Fawole, H.O.; Akinrolie, O. Perceived barriers to physical activity among Nigerian stroke survivors. Pan Afr. Med. J. 2015, 21, 274. [Google Scholar] [CrossRef]
- Aguiar, L.T.; Nadeau, S.; Teixeira-Salmela, L.F.; Reis, M.T.; Peniche, P.D.; Faria, C.D. Perspectives, satisfaction, self-efficacy, and barriers to aerobic exercise reported by individuals with chronic stroke in a developing country. Disabil. Rehabil. 2020, 1–6. [Google Scholar] [CrossRef]
- Débora Pacheco, B.; Guimarães Caetano, L.C.; Amorim Samora, G.; Sant’Ana, R.; Fuscaldi Teixeira-Salmela, L.; Scianni, A.A. Perceived barriers to exercise reported by individuals with stroke, who are able to walk in the community. Disabil. Rehabil. 2021, 43, 331–337. [Google Scholar] [CrossRef] [PubMed]
- Wist, S.; Clivaz, J.; Sattelmayer, M. Muscle strengthening for hemiparesis after stroke: A meta-analysis. Ann. Phys. Rehabil. Med. 2016, 59, 114–124. [Google Scholar] [CrossRef]
- Han, P.; Zhang, W.; Kang, L.; Ma, Y.; Fu, L.; Jia, L.; Yu, H.; Chen, X.; Hou, L.; Wang, L.; et al. Clinical evidence of exercise benefits for stroke. Adv. Exp. Med. Biol. 2017, 1000, 131–151. [Google Scholar] [CrossRef] [PubMed]
- Fini, N.A.; Holland, A.E.; Keating, J.; Simek, J.; Bernhardt, J. How physically active are people following stroke? Systematic review and quantitative synthesis. Phys. Ther. 2017, 97, 707–717. [Google Scholar] [CrossRef]
- Thilarajah, S.; Mentiplay, B.F.; Bower, K.J.; Tan, D.; Pua, Y.H.; Williams, G.; Koh, G.; Clark, R.A. Factors associated with post-stroke physical activity: A systematic review and meta-analysis. Arch. Phys. Med. Rehabil. 2018, 99, 1876–1889. [Google Scholar] [CrossRef]
- Fitzsimons, C.F.; Nicholson, S.L.; Morris, J.; Mead, G.E.; Chastin, S.; Niven, A. Stroke survivors’ perceptions of their sedentary behaviours three months after stroke. Disabil. Rehabil. 2020, 1–13. [Google Scholar] [CrossRef]
- Hall, J.; Morton, S.; Fitzsimons, C.F.; Hall, J.F.; Corepal, R.; English, C.; Forster, A.; Lawton, R.; Patel, A.; Mead, G.; et al. Factors influencing sedentary behaviours after stroke: Findings from qualitative observations and interviews with stroke survivors and their caregivers. BMC Public Health 2020, 20, 967. [Google Scholar] [CrossRef] [PubMed]
- Gothe, N.P.; Bourbeau, K. Associations between physical activity intensities and physical function in stroke survivors. Am. J. Phys. Med. Rehabil. 2020, 99, 733–738. [Google Scholar] [CrossRef]


| Mean ± Sd, Median [IQR] or n (%) | ||
|---|---|---|
| Age (years) | 58.2 ± 11.1 | |
| Sex, males, n (%) | 37 (64.9) | |
| Weight (kg) | 80.5 ± 14.5 | |
| Height (m) | 1.7 ± 0.1 | |
| Body Mass Index (kg/m2) | 28.6 ± 4.6 | |
| Stroke type | Ischemic | 35 (61.4) |
| Hemorrhagic | 22 (38.6) | |
| Time since stroke onset (months) | 64.0 [38.5; 105.5] | |
| Paretic side | Right | 23 (40.4) |
| Left | 33 (57.9) | |
| Both | 1 (1.8) | |
| Living arrangement | Alone | 6 (10.5) |
| Accompanied | 51 (89.5) | |
| Charlson Comorbidity Index (score) | 0.0 [0.0; 1.0] | |
| MoCA, score (0–30) | 23.0 [20.0; 25.5] | |
| mRS | No disability or slight (%) | 36 (63.2) |
| Moderate or severe disability (%) | 21 (36.8) | |
| PHQ9, score (0–27) | 5.0 [2.0; 8.0] | |
| SIS-16, score (0–100) | 85.9 [73.4; 92.2] | |
| Walking speed (m/s) | 0.8 ± 0.4 | |
| Mean ± Sd or Median [IQR] | |
|---|---|
| BAPAS, score (0–70) | 20.0 [10.0; 30.0] |
| BAPAS-physic, score (0–35) | 12.0 [5.0; 17.0] |
| BAPAS-behav, score (0–35) | 7.0 [4.0; 12.0] |
| Short FES-I, score (7–28) | 10.0 [8.0; 12.0] |
| FSS, score (1–7) | 3.5 ± 1.7 |
| No. Accelerometer wear days | 6.0 [5.0; 7.0] |
| Accelerometer wear time (min/day) | 789.5 ± 125.0 |
| Sedentary time (min/day) | 636.1 ± 119.2 |
| Sedentary time (%) | 81.1 ± 11.8 |
| Prolonged sedentary time (min/day) | 163.80 [68.65; 263.30] |
| Prolonged sedentary time (%) | 21.32 [9.53; 35.86] |
| LPA (min/day) | 112.90 [64.05; 192.30] |
| LPA (%) | 13.97 [8.22; 25.36] |
| MVPA (min/day) | 5.80 [2.45; 22.40] |
| MVPA (%) | 0.87 [0.41; 2.53] |
| Sedentary Time (%) | Prolonged Sedentary Time (%) | LPA (%) | MVPA (%) | |||||
|---|---|---|---|---|---|---|---|---|
| Coefficient | p-Value | Coefficient | p-Value | Coefficient | p-Value | Coefficient | p-Value | |
| CCI | ρ = −0.01 | 0.942 | ρ = 0.303 | 0.022 | ρ = 0.088 | 0.515 | ρ = −0.296 | 0.025 |
| Time since stroke onset | ρ = 0.011 | 0.934 | ρ = −0.154 | 0.253 | ρ = 0.029 | 0.830 | ρ = −0.111 | 0.410 |
| MoCA | ρ = 0.019 | 0.887 | ρ = 0.004 | 0.975 | ρ = −0.059 | 0.662 | ρ = 0.159 | 0.238 |
| PHQ9 | ρ = 0.023 | 0.867 | ρ = 0.000 | 0.998 | ρ = 0.007 | 0.961 | ρ = −0.065 | 0.629 |
| Walking speed | r = −0.388 | 0.003 | ρ = −0.367 | 0.005 | ρ = 0.257 | 0.054 | ρ = 0.592 | <0.001 |
| SIS−16 | ρ = −0.241 | 0.071 | ρ = −0.420 | 0.001 | ρ = 0.100 | 0.461 | ρ = 0.497 | <0.001 |
| Short FES-I | ρ = 0.096 | 0.477 | ρ = 0.290 | 0.028 | ρ = 0.010 | 0.943 | ρ = −0.305 | 0.021 |
| BAPAS | ρ = −0.073 | 0.590 | ρ = 0.451 | <0.001 | ρ = 0.200 | 0.135 | ρ = −0.471 | <0.001 |
| BAPAS_physic | ρ = 0.004 | 0.979 | ρ = 0.582 | <0.001 | ρ = 0.145 | 0.282 | ρ = −0.578 | <0.001 |
| BAPAS_behav | ρ = −0.084 | 0.532 | ρ = 0.129 | 0.337 | ρ = 0.141 | 0.296 | ρ = −0.172 | 0.200 |
| FSS | r = −0.087 | 0.521 | ρ = 0.086 | 0.525 | ρ = 0.134 | 0.320 | ρ = −0.285 | 0.032 |
| Median [IQR] | p-value | Median [IQR] | p-value | Median [IQR] | p-value | Median [IQR] | p-value | |
| Living arrangement | ||||||||
| Alone (n = 6) | 84.02 [72.07;90.76] | 0.849 b | 18.55 [11.71;33.23] | 0.849 b | 13.82 [6.79;27.34] | 0.829 b | 2.01 [0.24;2.57] | 0.771 b |
| Accompanied (n = 51) | 82.03 [73.58;89.85] | 21.62 [9.52;36.05] | 13.97 [8.35;25.49] | 0.85 [0.43;2.70] | ||||
| Modified Rankin Scale (mRS) | ||||||||
| No disability or slight (n = 36) | 78.05 [72.41;87.64] | 0.029 a | 20.17 [8.00;32.09] | 0.118 a | 17.52 [9.35;26.20] | 0.104 a | 1.48 [0.44;3.71] | 0.045 b |
| Moderate or severe disability (n = 21) | 89.02 [78.07;94.67] | 27.61 [9.94;41.65] | 10.72 [4.89;21.56] | 0.52 [0.32;1.12] | ||||
| B | 95% CI for B | β | Adjusted R2 | SEE | |
|---|---|---|---|---|---|
| Sedentary time (%) | |||||
| Constant | 90.781 ± 3.436 | 83.895 to 97.667 | - | - | - |
| Walking speed | −12.351 ± 3.957 | −20.281 to −4.421 | −0.388 | 0.135 | 10.953 |
| Prolonged sedentary time (%) | |||||
| Constant | 11.873 ± 2.850 | 6.161 to 17.586 | - | - | - |
| BAPAS_physic | 0.941 ± 0.194 | 0.552 to 1.330 | 0.547 | 0.287 | 12.553 |
| MVPA (%) | |||||
| Constant | 0.450 ± 1.052 | −1.659 to 2.559 | - | - | - |
| Walking speed | 3.780 ± 0.935 | 1.906 to 5.653 | 0.452 | 0.298 | 2.594 |
| BAPAS_physic | −0.114 ± 0.040 | −0.194 to −0.034 | −0.319 | 0.379 | 2.440 |
Publisher’s Note: MDPI stays neutral with regard to jurisdictional claims in published maps and institutional affiliations. |
© 2021 by the authors. Licensee MDPI, Basel, Switzerland. This article is an open access article distributed under the terms and conditions of the Creative Commons Attribution (CC BY) license (http://creativecommons.org/licenses/by/4.0/).
Share and Cite
Sánchez-Sánchez, M.L.; Arnal-Gómez, A.; Cortes-Amador, S.; Pérez-Alenda, S.; Carrasco, J.J.; Climent-Toledo, A.; Espí-López, G.V.; Ruescas-Nicolau, M.-A. Association of Barriers, Fear of Falling and Fatigue with Objectively Measured Physical Activity and Sedentary Behavior in Chronic Stroke. J. Clin. Med. 2021, 10, 1320. https://doi.org/10.3390/jcm10061320
Sánchez-Sánchez ML, Arnal-Gómez A, Cortes-Amador S, Pérez-Alenda S, Carrasco JJ, Climent-Toledo A, Espí-López GV, Ruescas-Nicolau M-A. Association of Barriers, Fear of Falling and Fatigue with Objectively Measured Physical Activity and Sedentary Behavior in Chronic Stroke. Journal of Clinical Medicine. 2021; 10(6):1320. https://doi.org/10.3390/jcm10061320
Chicago/Turabian StyleSánchez-Sánchez, M. Luz, Anna Arnal-Gómez, Sara Cortes-Amador, Sofía Pérez-Alenda, Juan J. Carrasco, Assumpta Climent-Toledo, Gemma Victoria Espí-López, and Maria-Arantzazu Ruescas-Nicolau. 2021. "Association of Barriers, Fear of Falling and Fatigue with Objectively Measured Physical Activity and Sedentary Behavior in Chronic Stroke" Journal of Clinical Medicine 10, no. 6: 1320. https://doi.org/10.3390/jcm10061320
APA StyleSánchez-Sánchez, M. L., Arnal-Gómez, A., Cortes-Amador, S., Pérez-Alenda, S., Carrasco, J. J., Climent-Toledo, A., Espí-López, G. V., & Ruescas-Nicolau, M.-A. (2021). Association of Barriers, Fear of Falling and Fatigue with Objectively Measured Physical Activity and Sedentary Behavior in Chronic Stroke. Journal of Clinical Medicine, 10(6), 1320. https://doi.org/10.3390/jcm10061320