
Use of the Microheterogeneous Model to Assess the Applicability of Ion-Exchange Membranes in the Process of Generating Electricity from a Concentration Gradient

 ,
,
Abstract
:1. Introduction
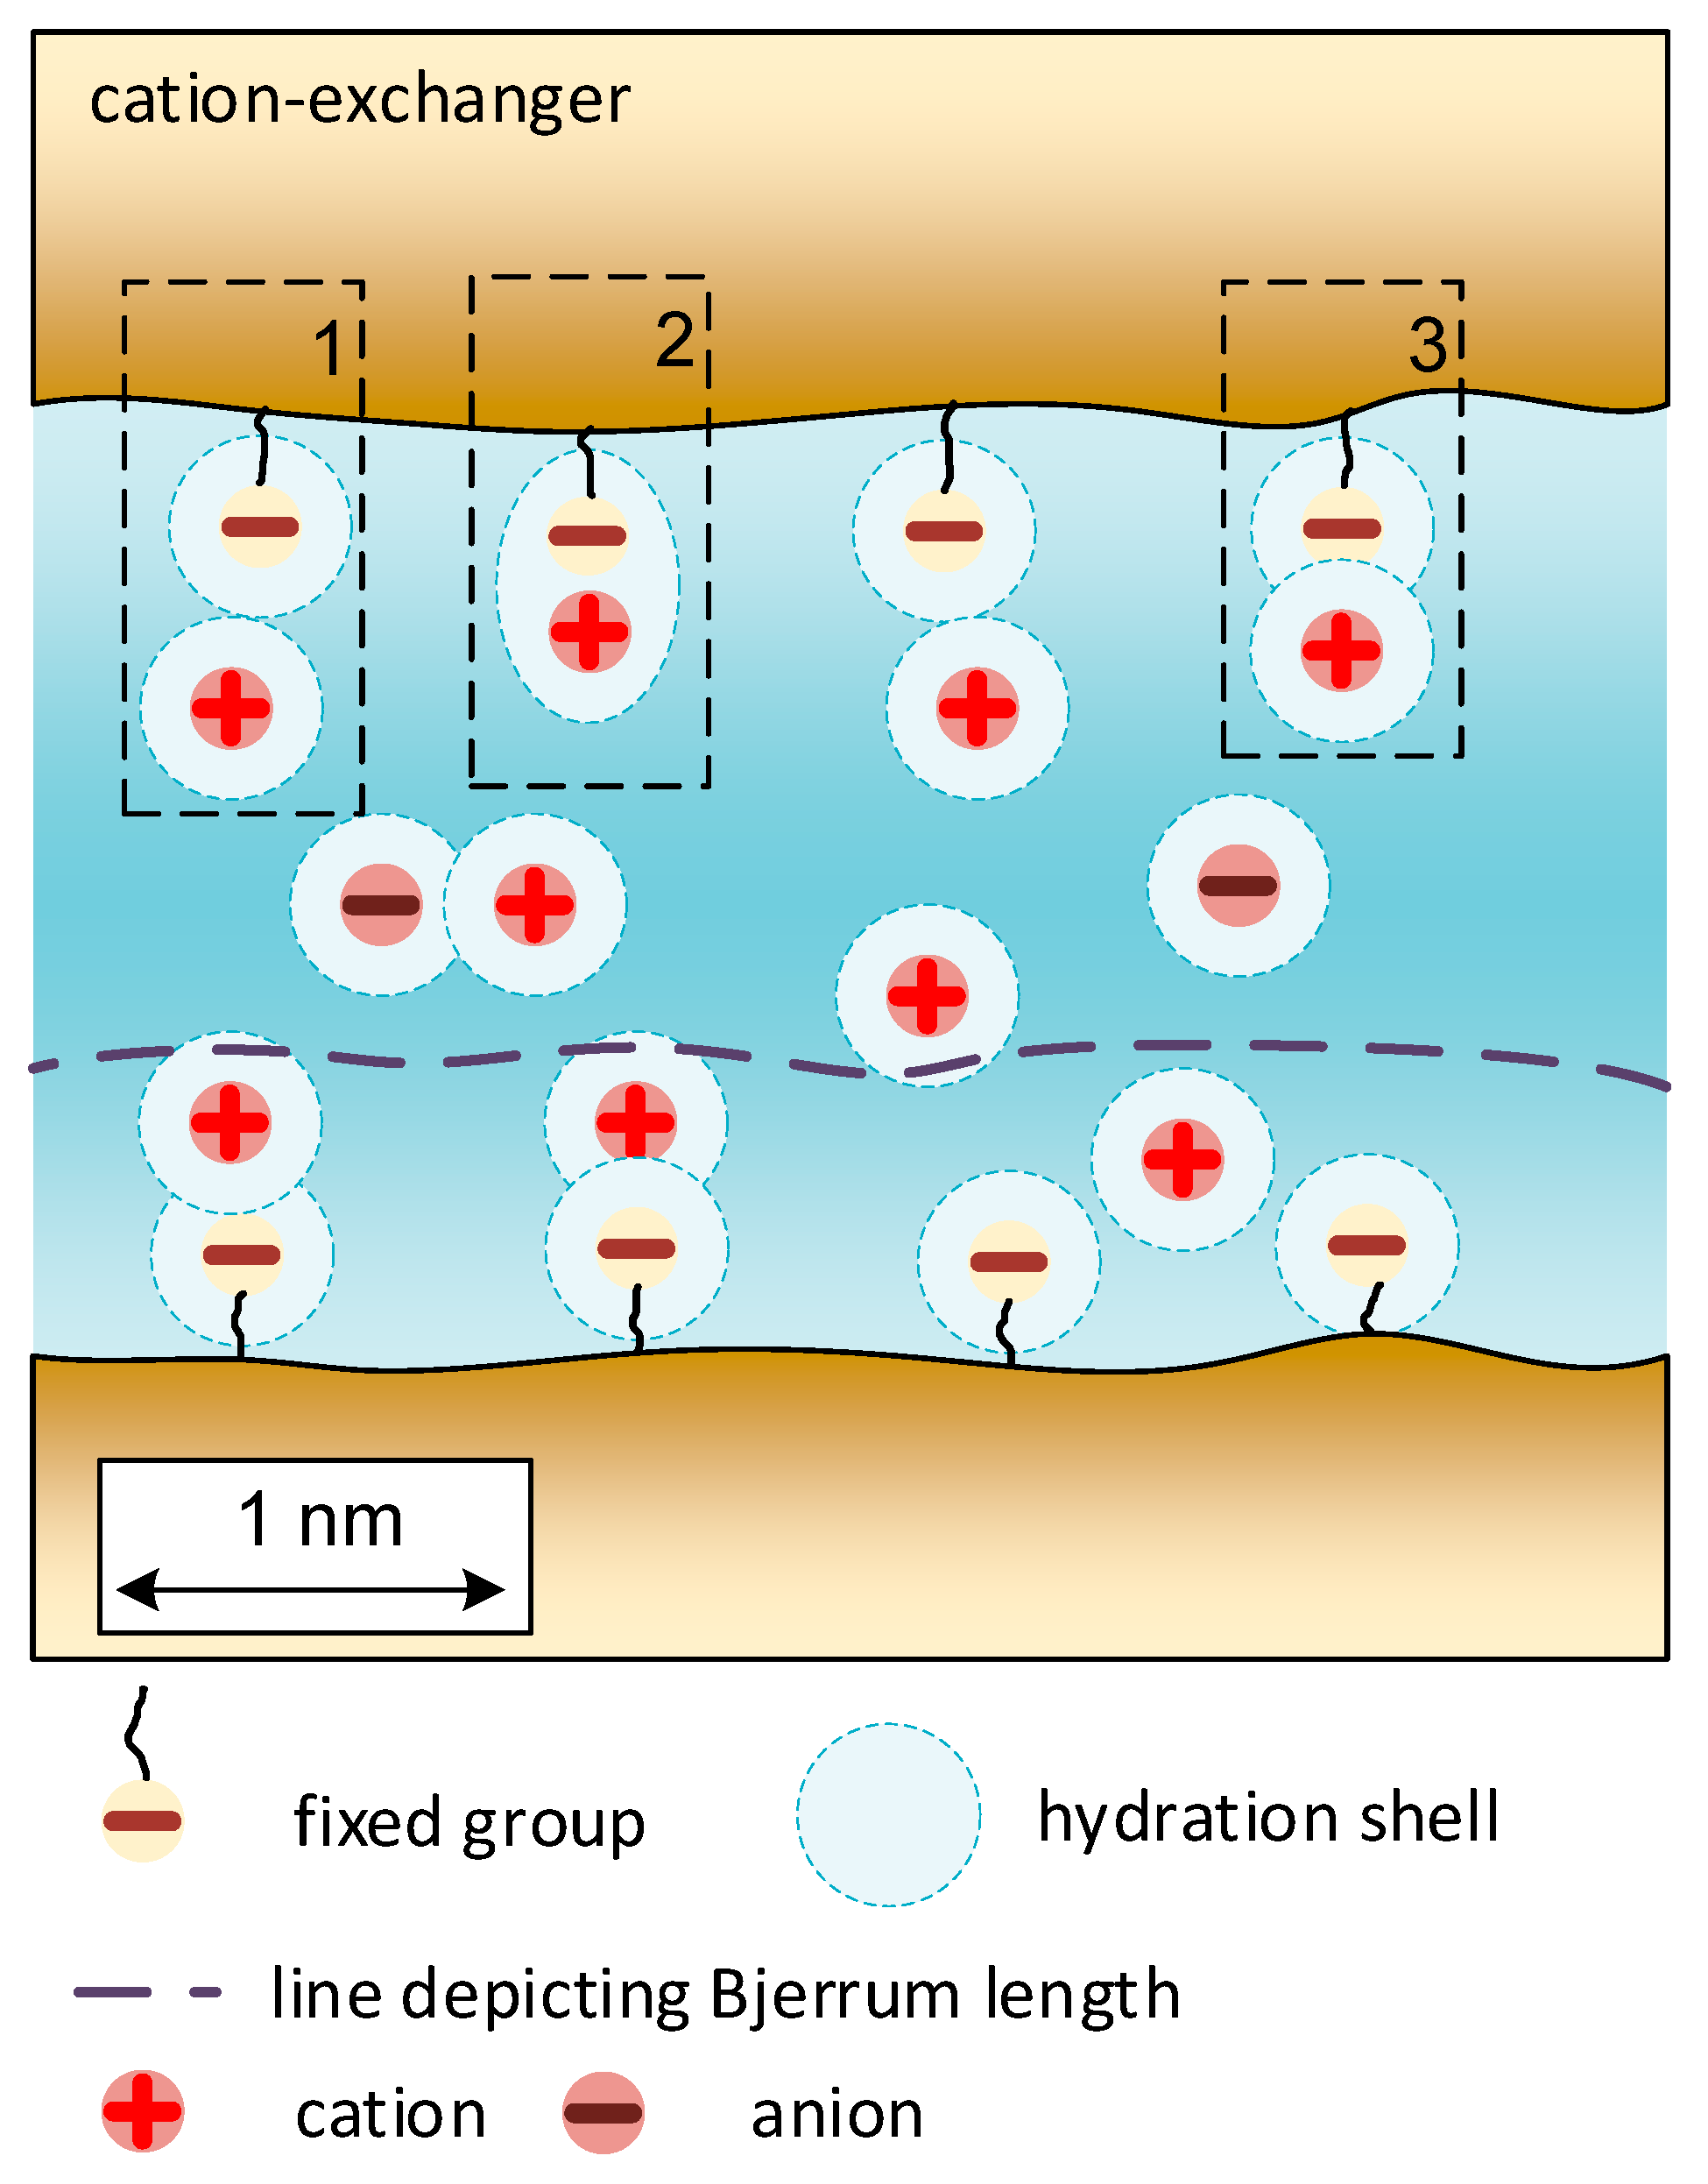
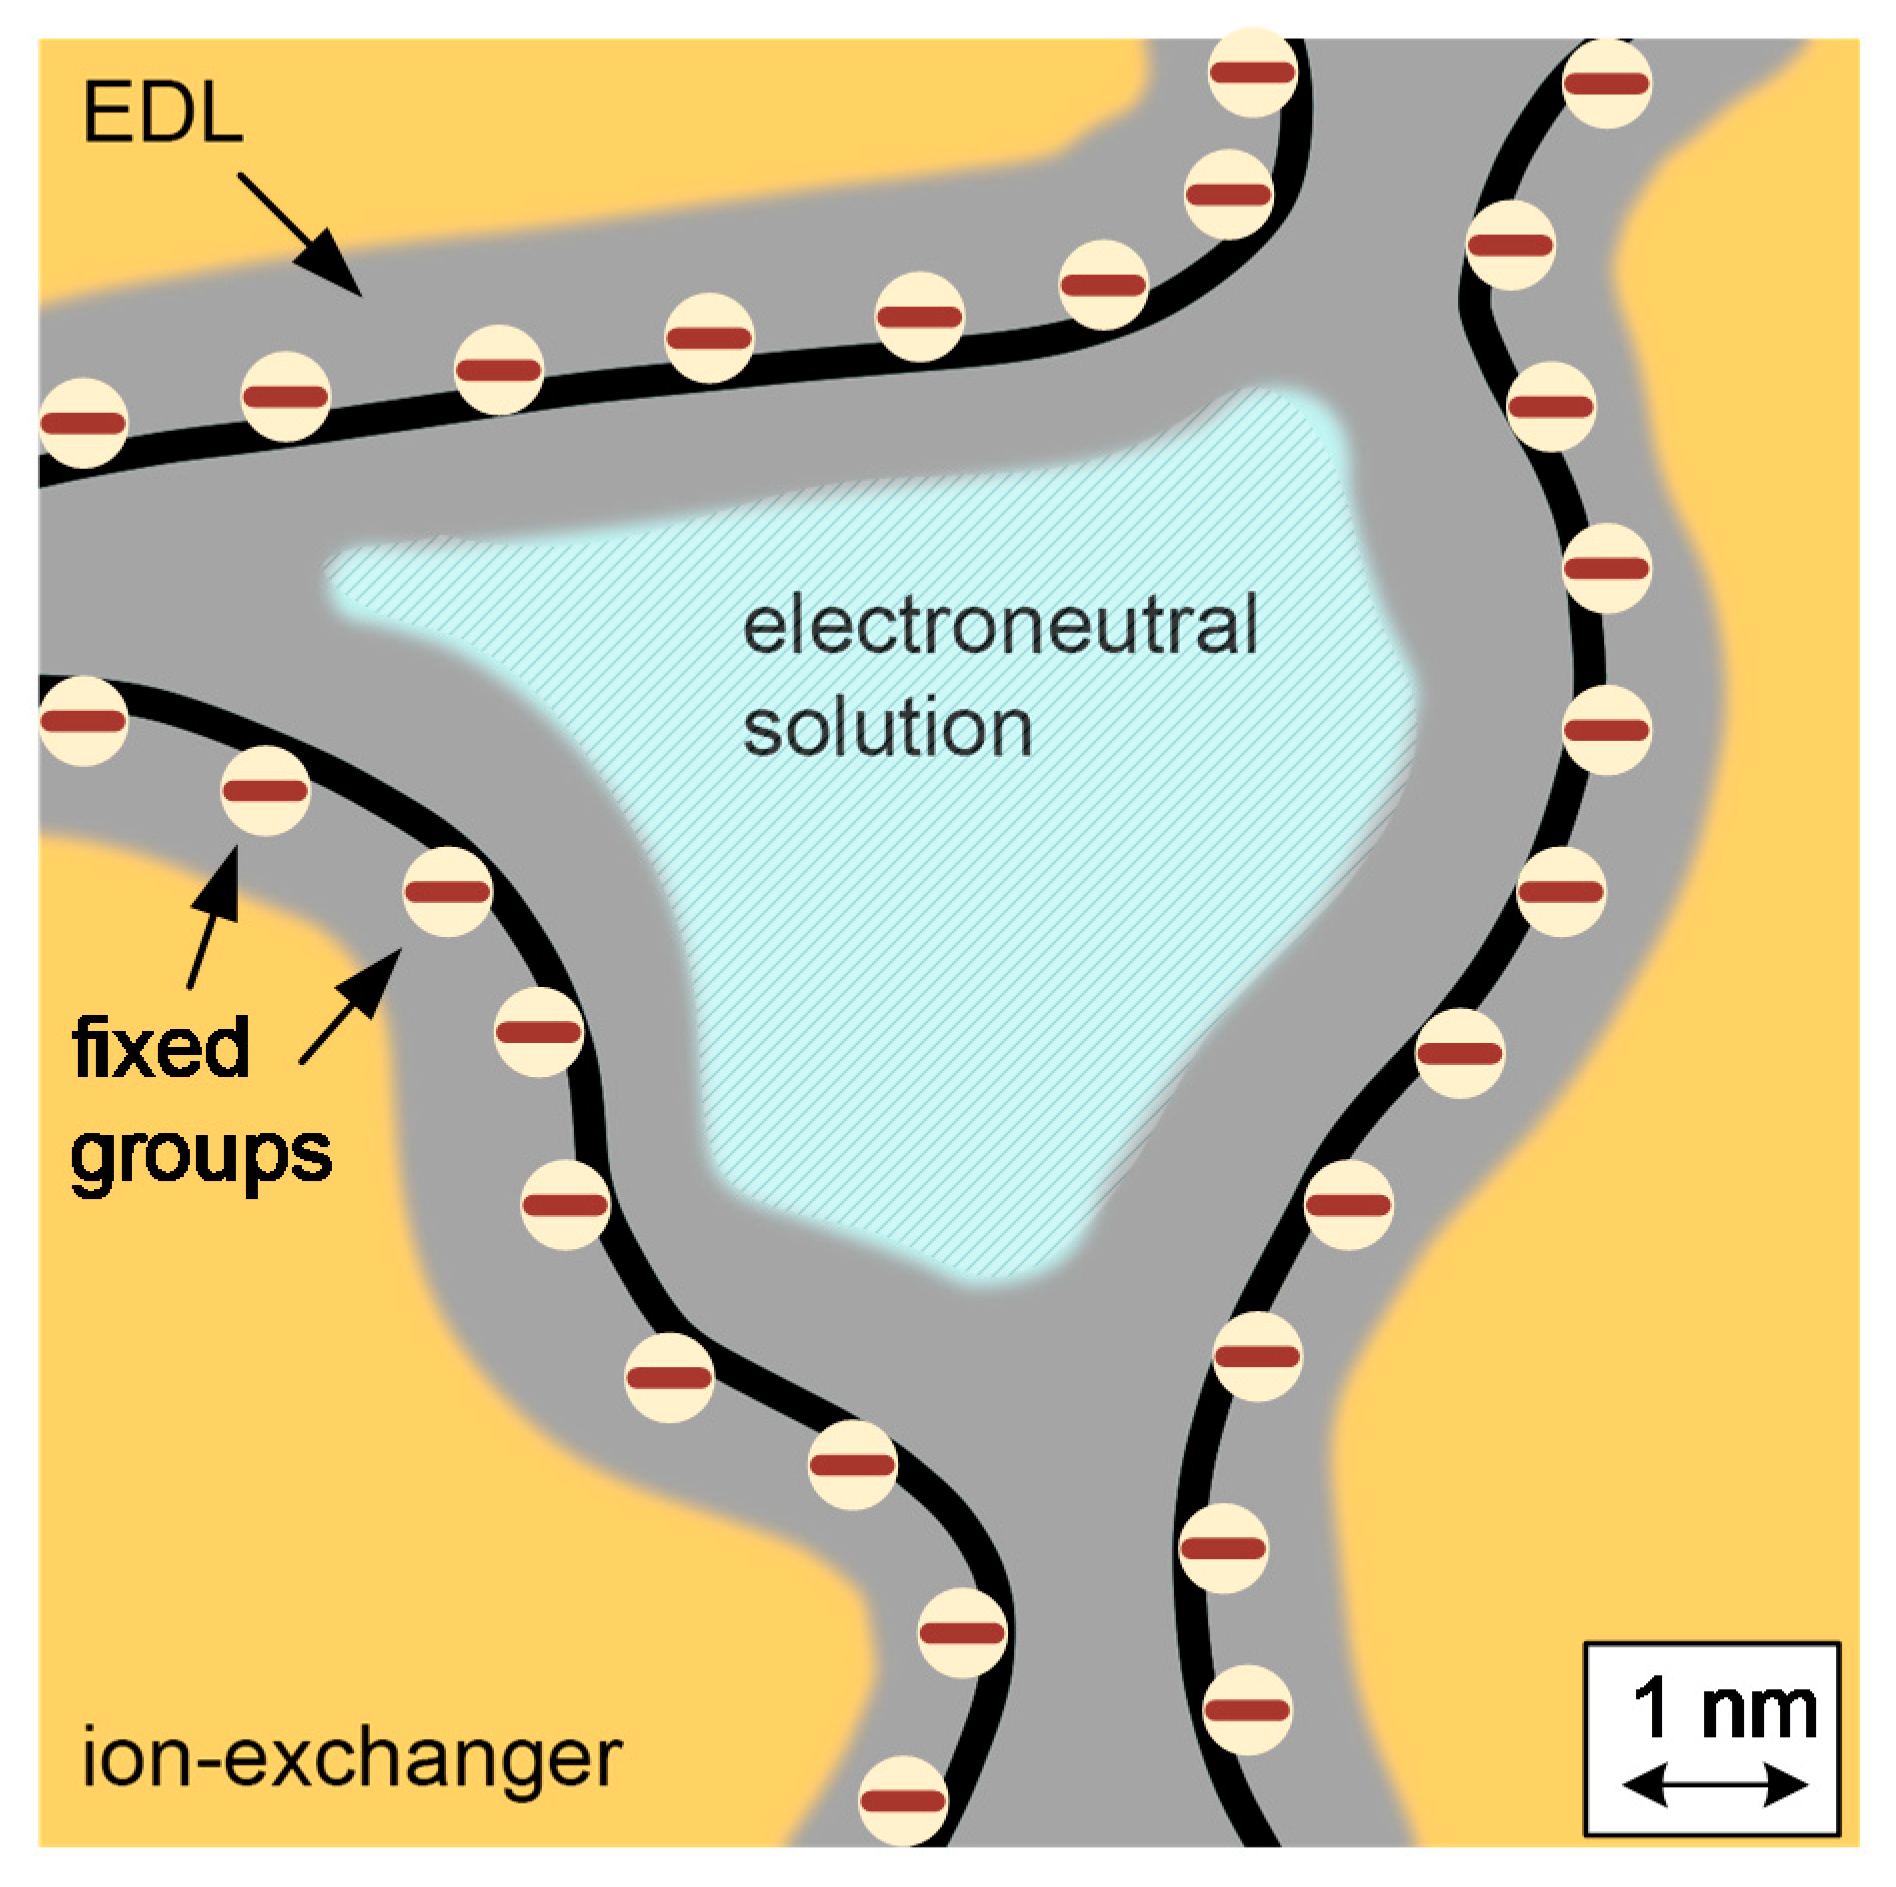
2. Microheterogeneous Model
3. Materials and Methods
3.1. Membranes
- surface treatment with carbon tetrachloride for degreasing;
- soaking in ethanol for 6 h to remove residues of monomers and oligomers from the ion-exchange resin;
- soaking of the membrane in excess volume (≈20 volumes of the membrane) of 1 M NaCl solution for 24 h;
- washing of the obtained membranes with deionized water to a constant value of the electrical conductivity of the wash water.
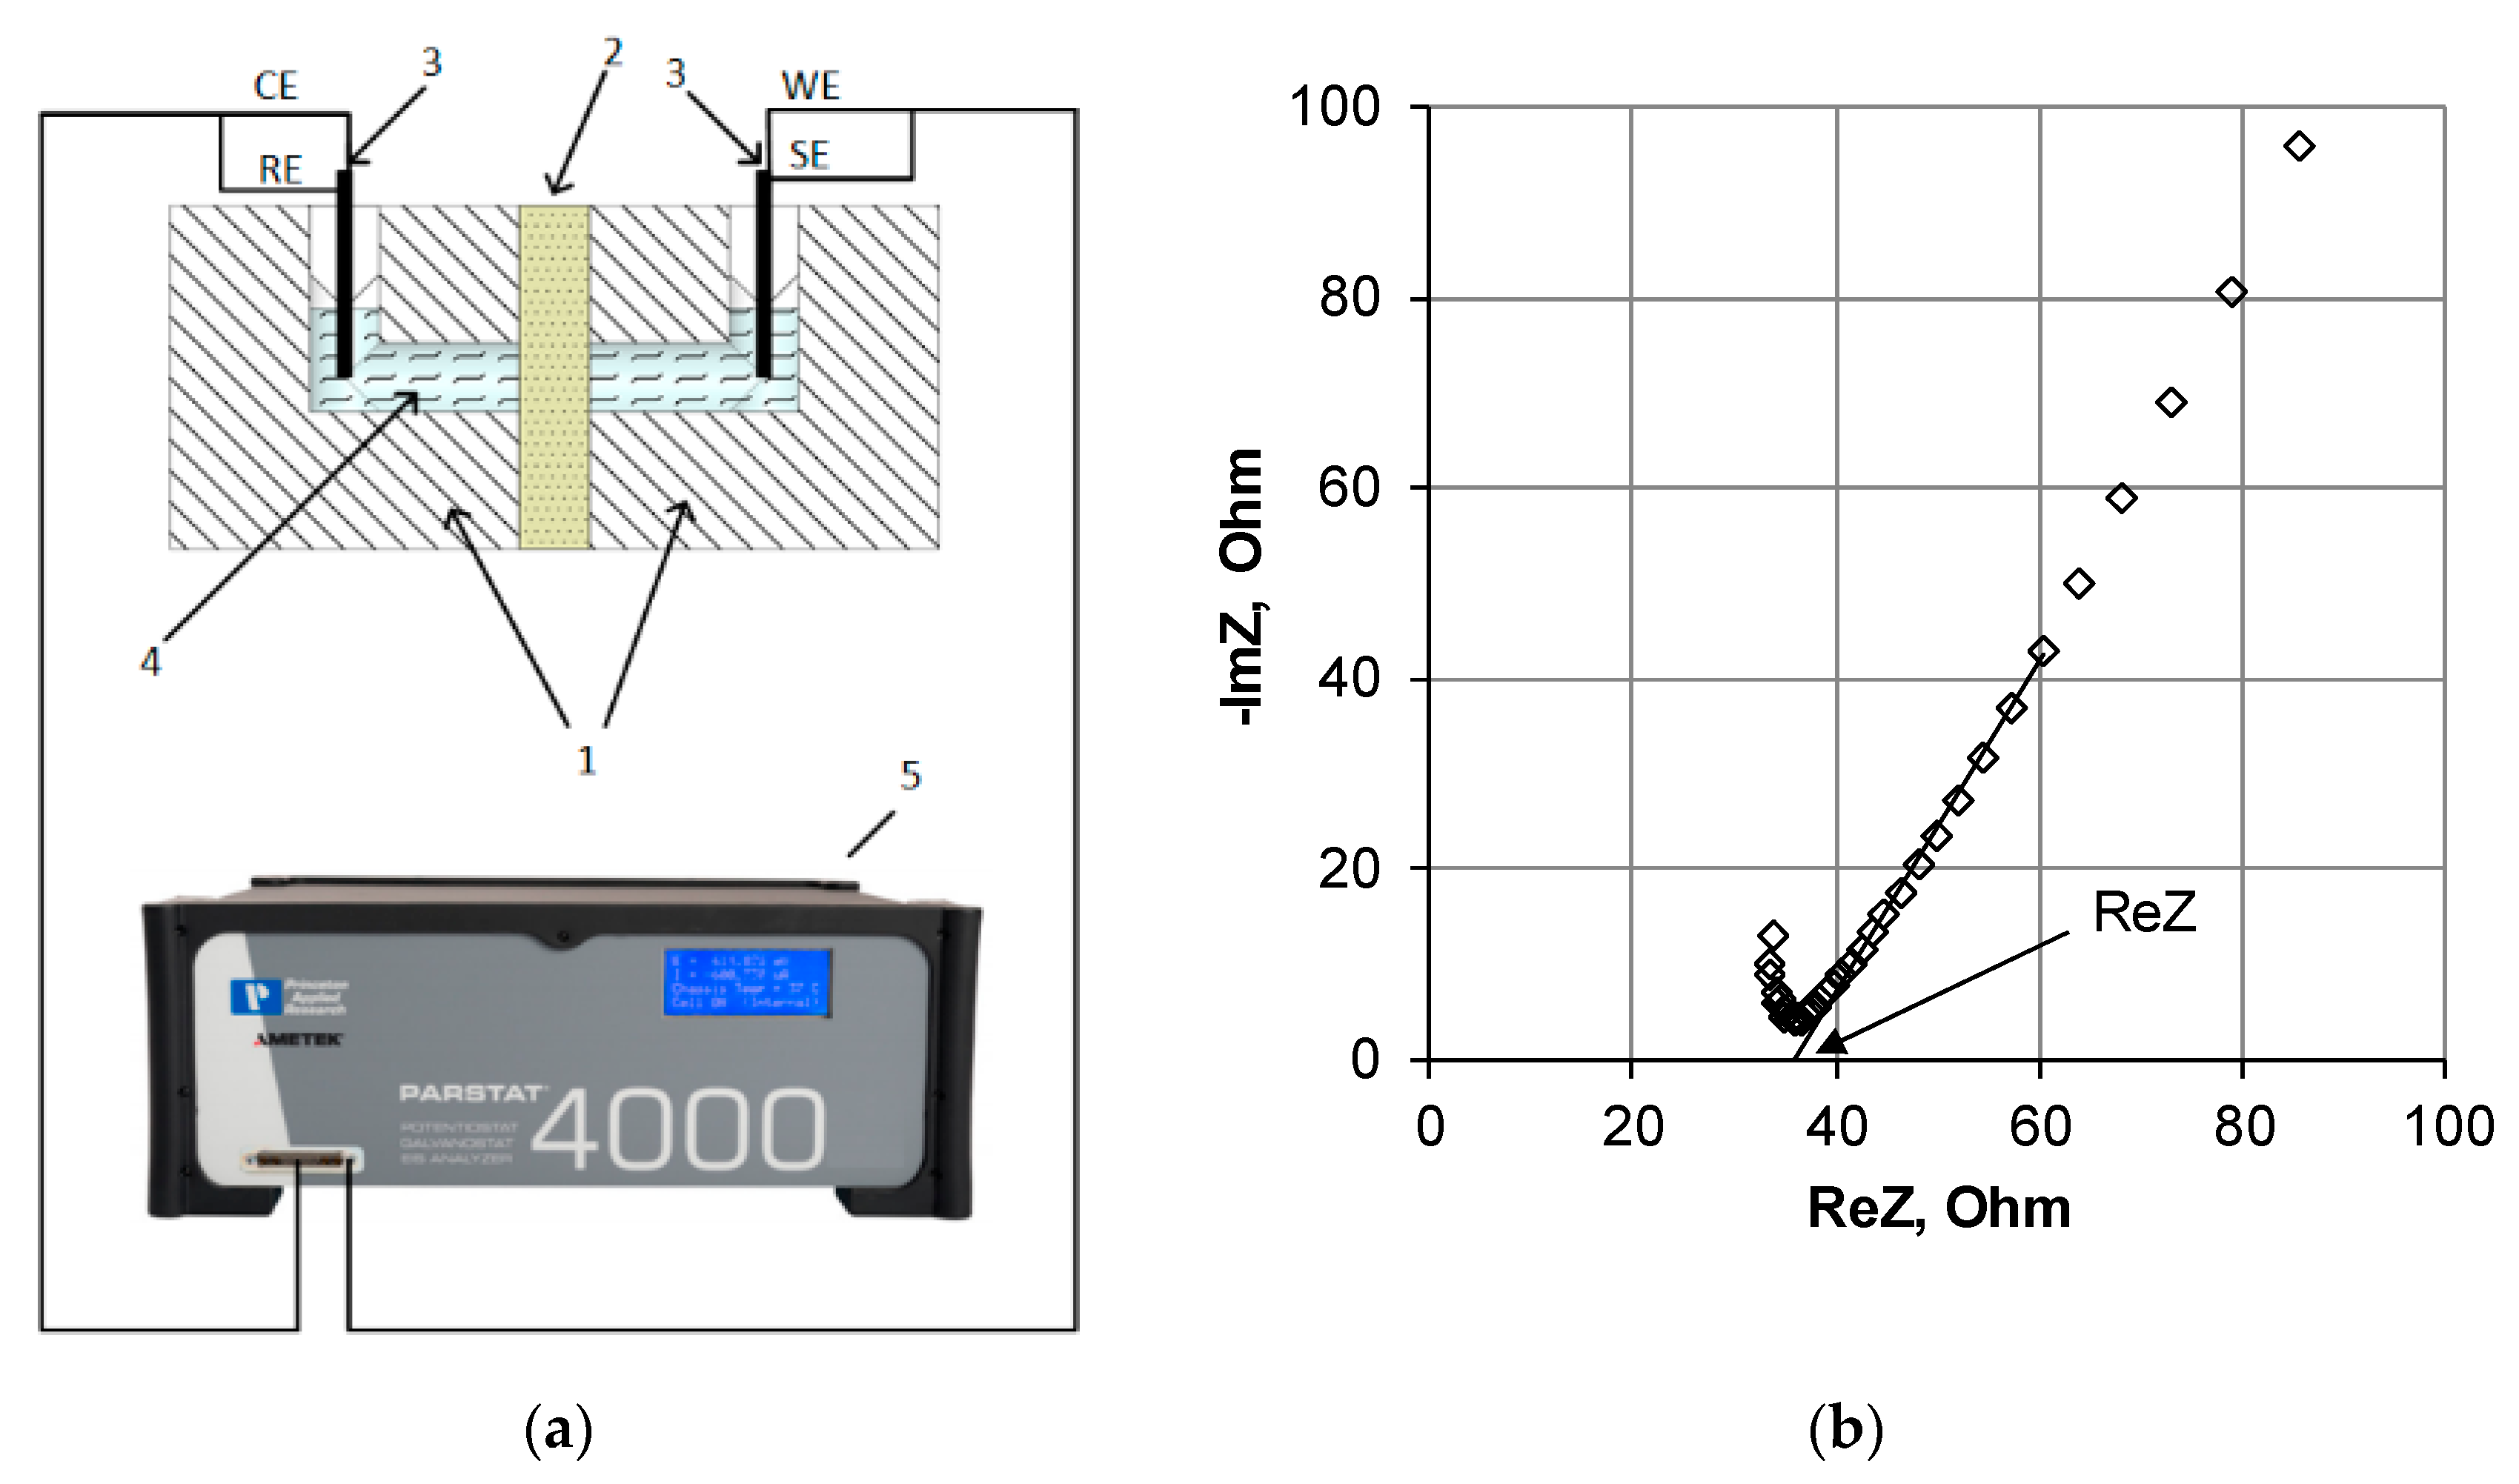
3.2. Study of the Electrical Conductivity
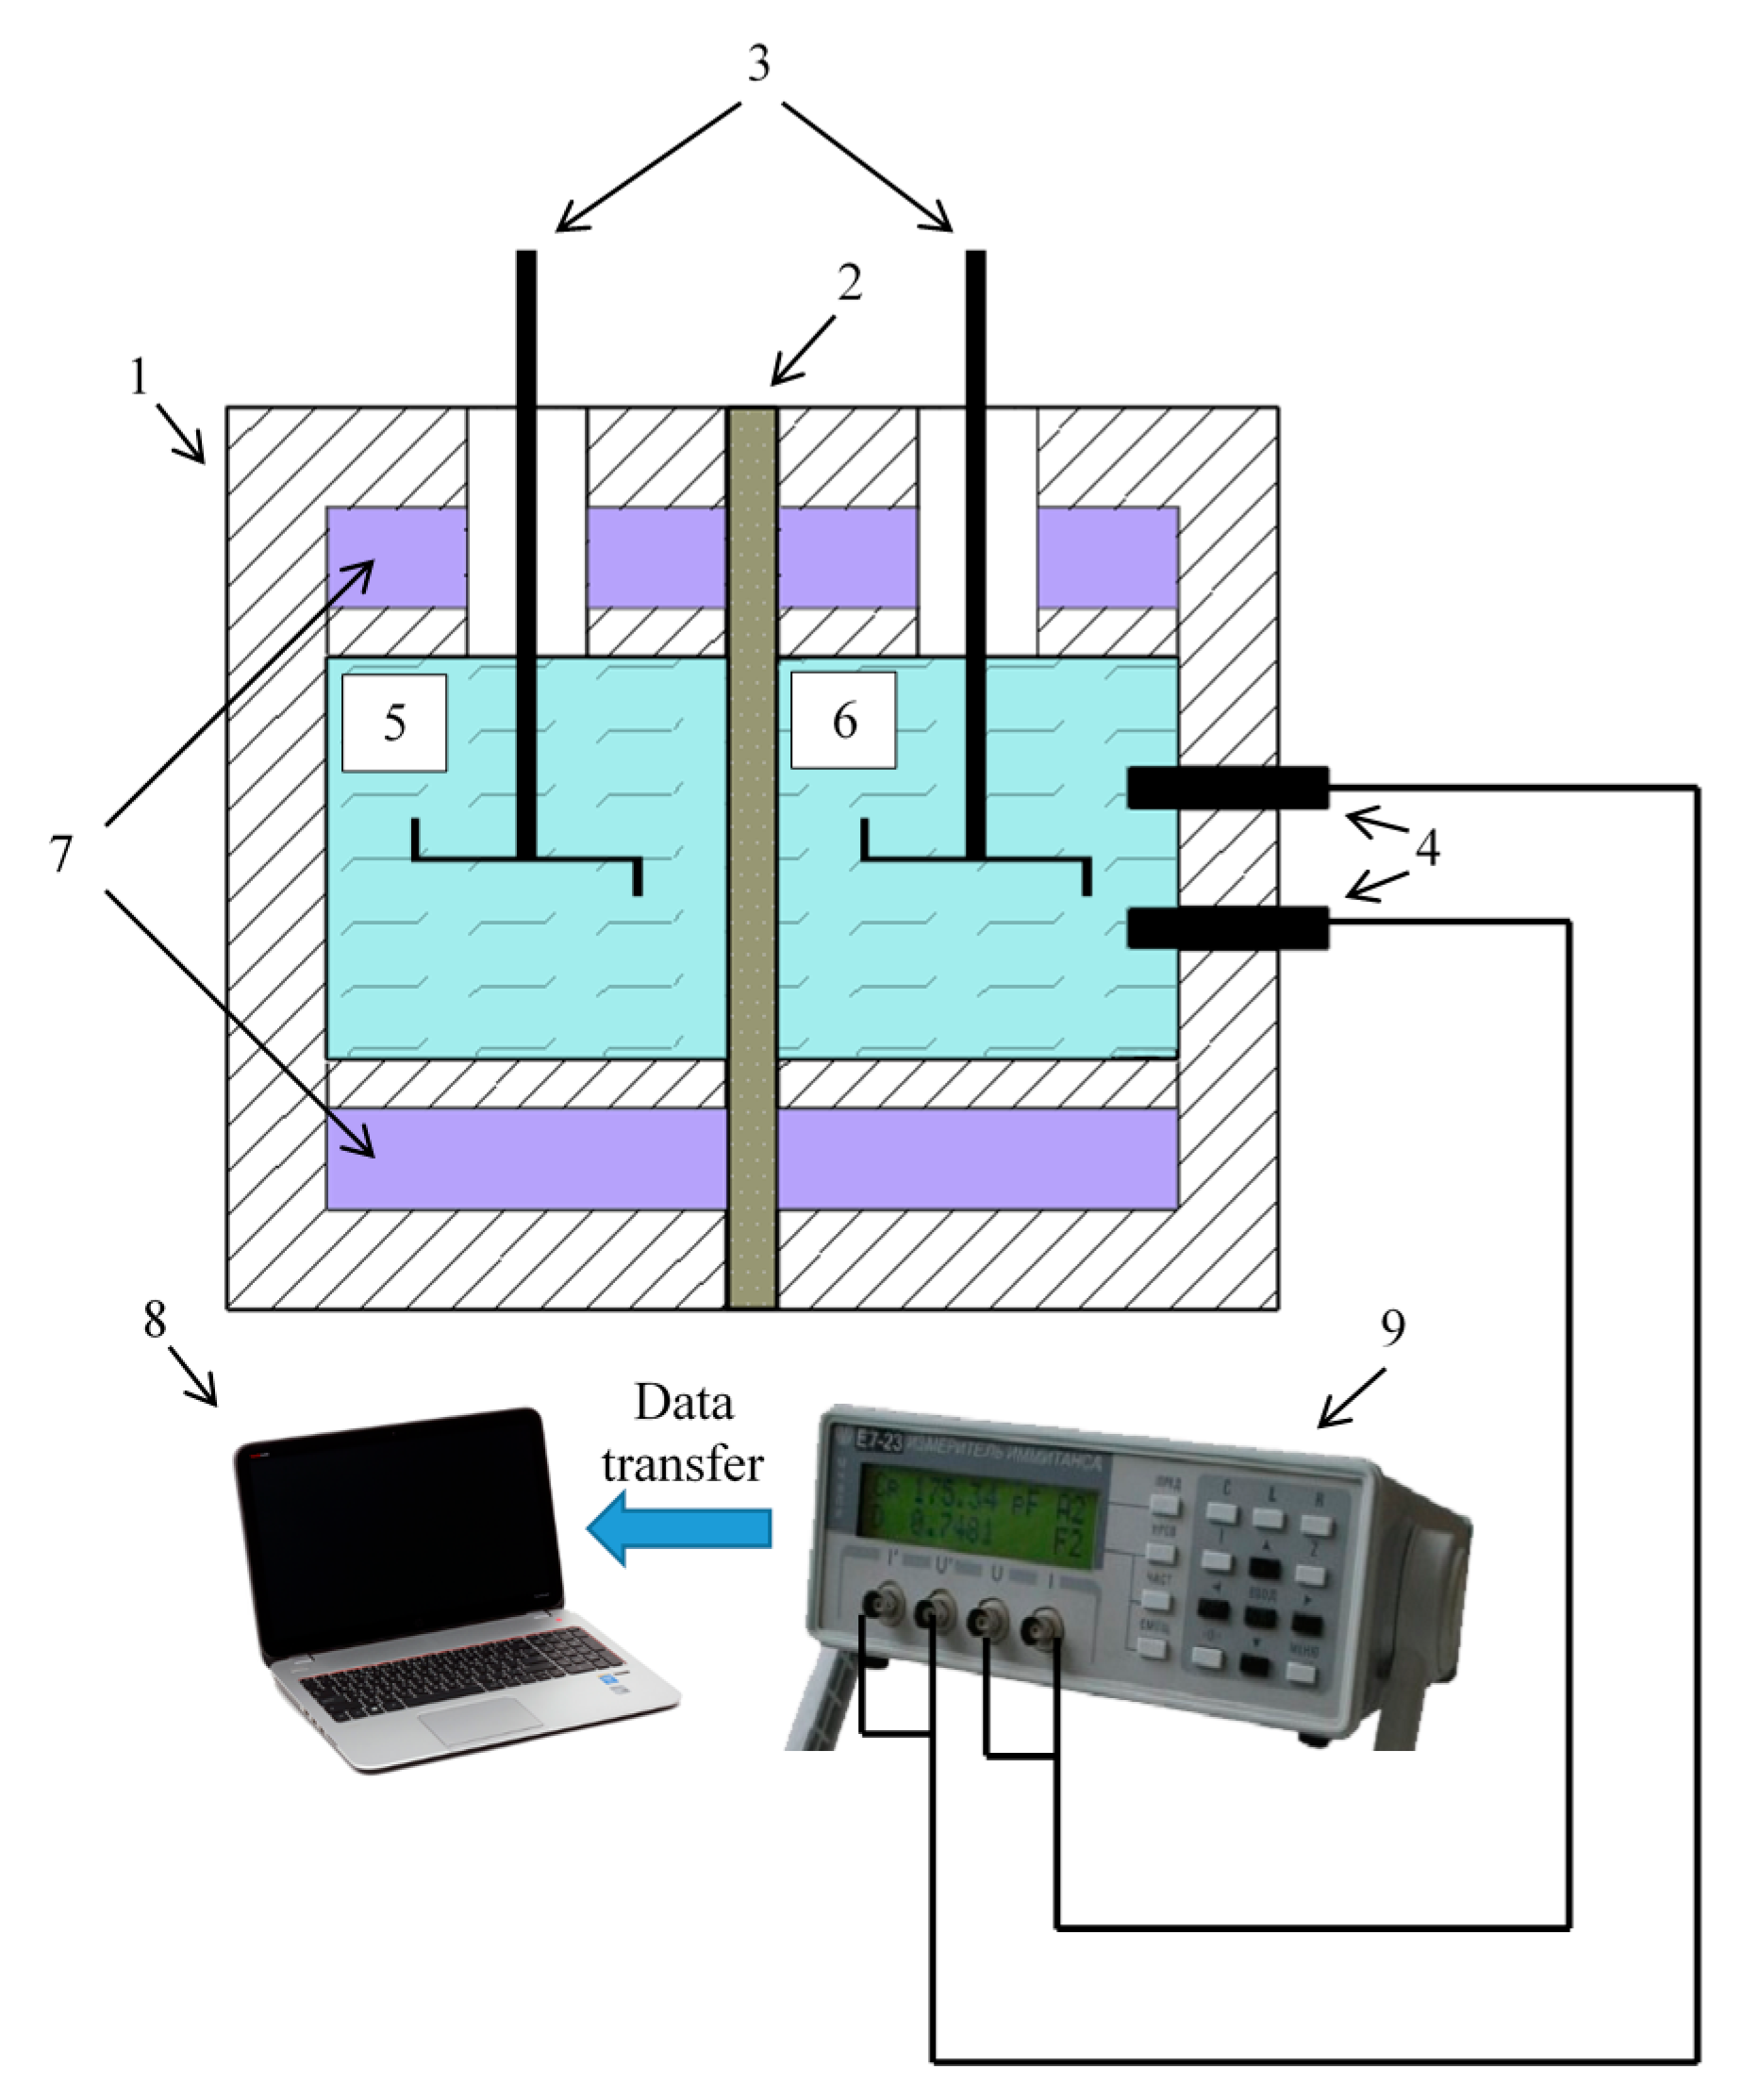
3.3. Study of the Diffusion Permeability
3.4. Reverse Electrodialysis Experiment
4. Results and Discussion
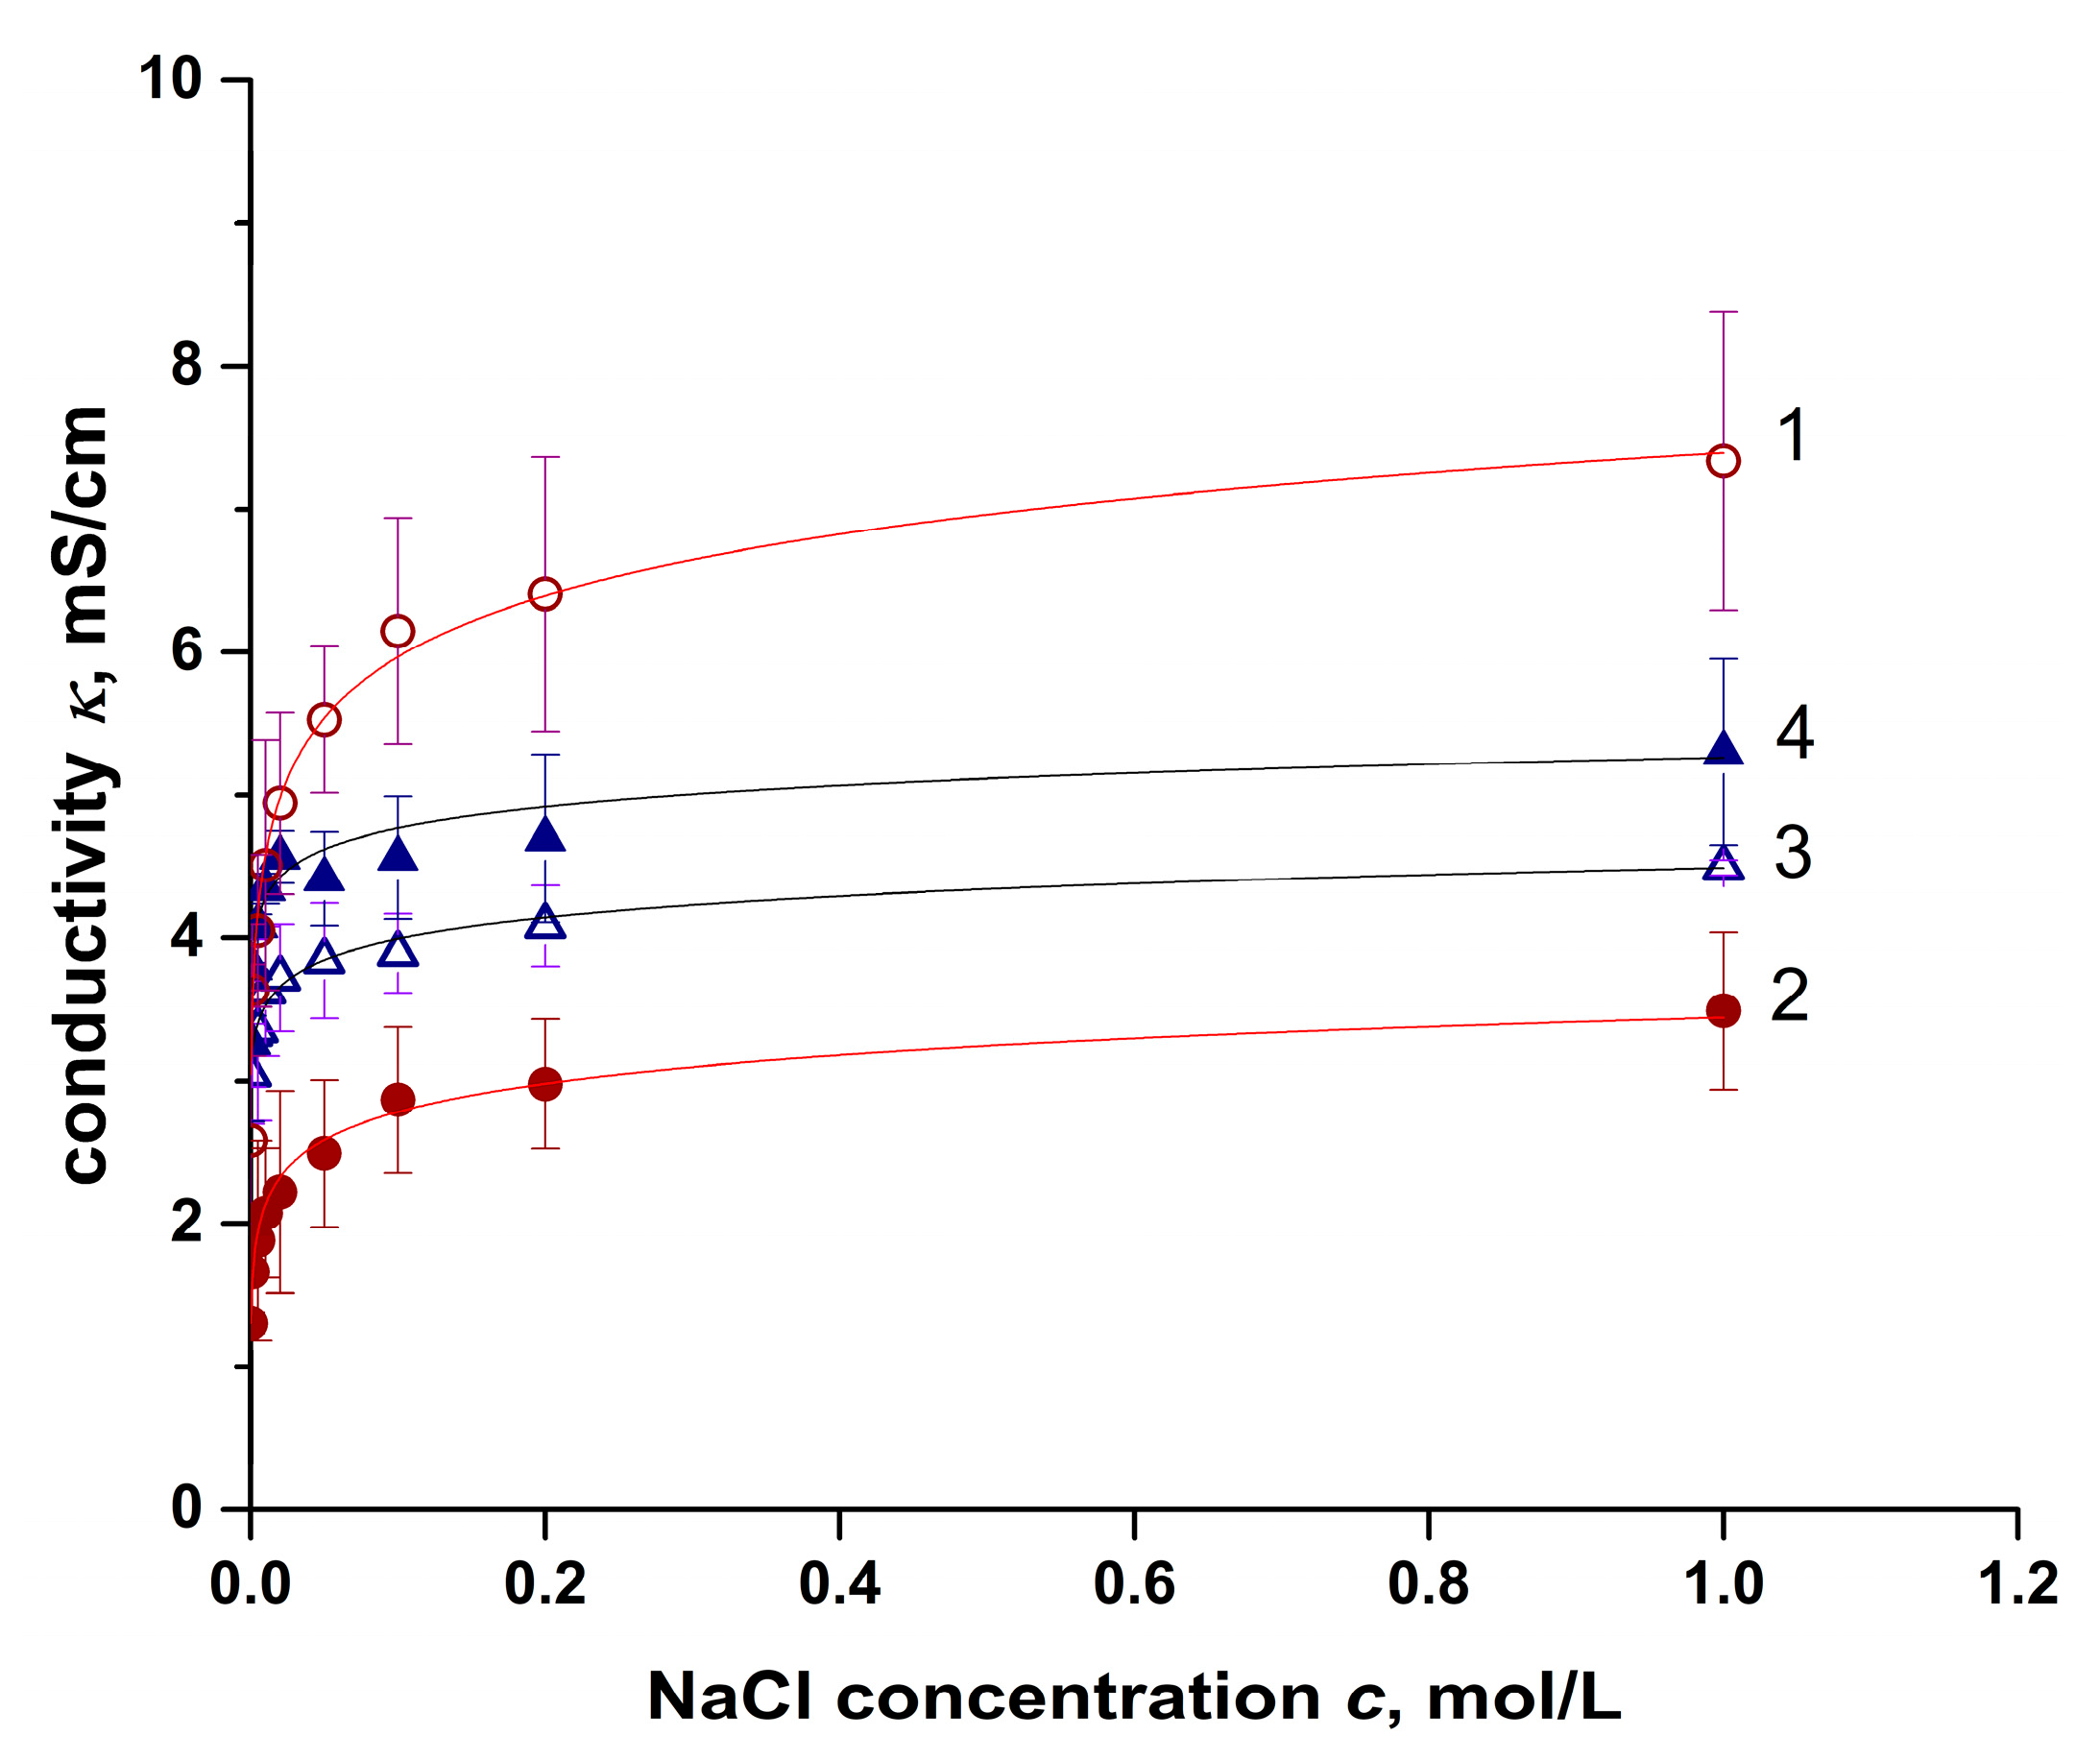
4.1. Conductivity Measurement Results
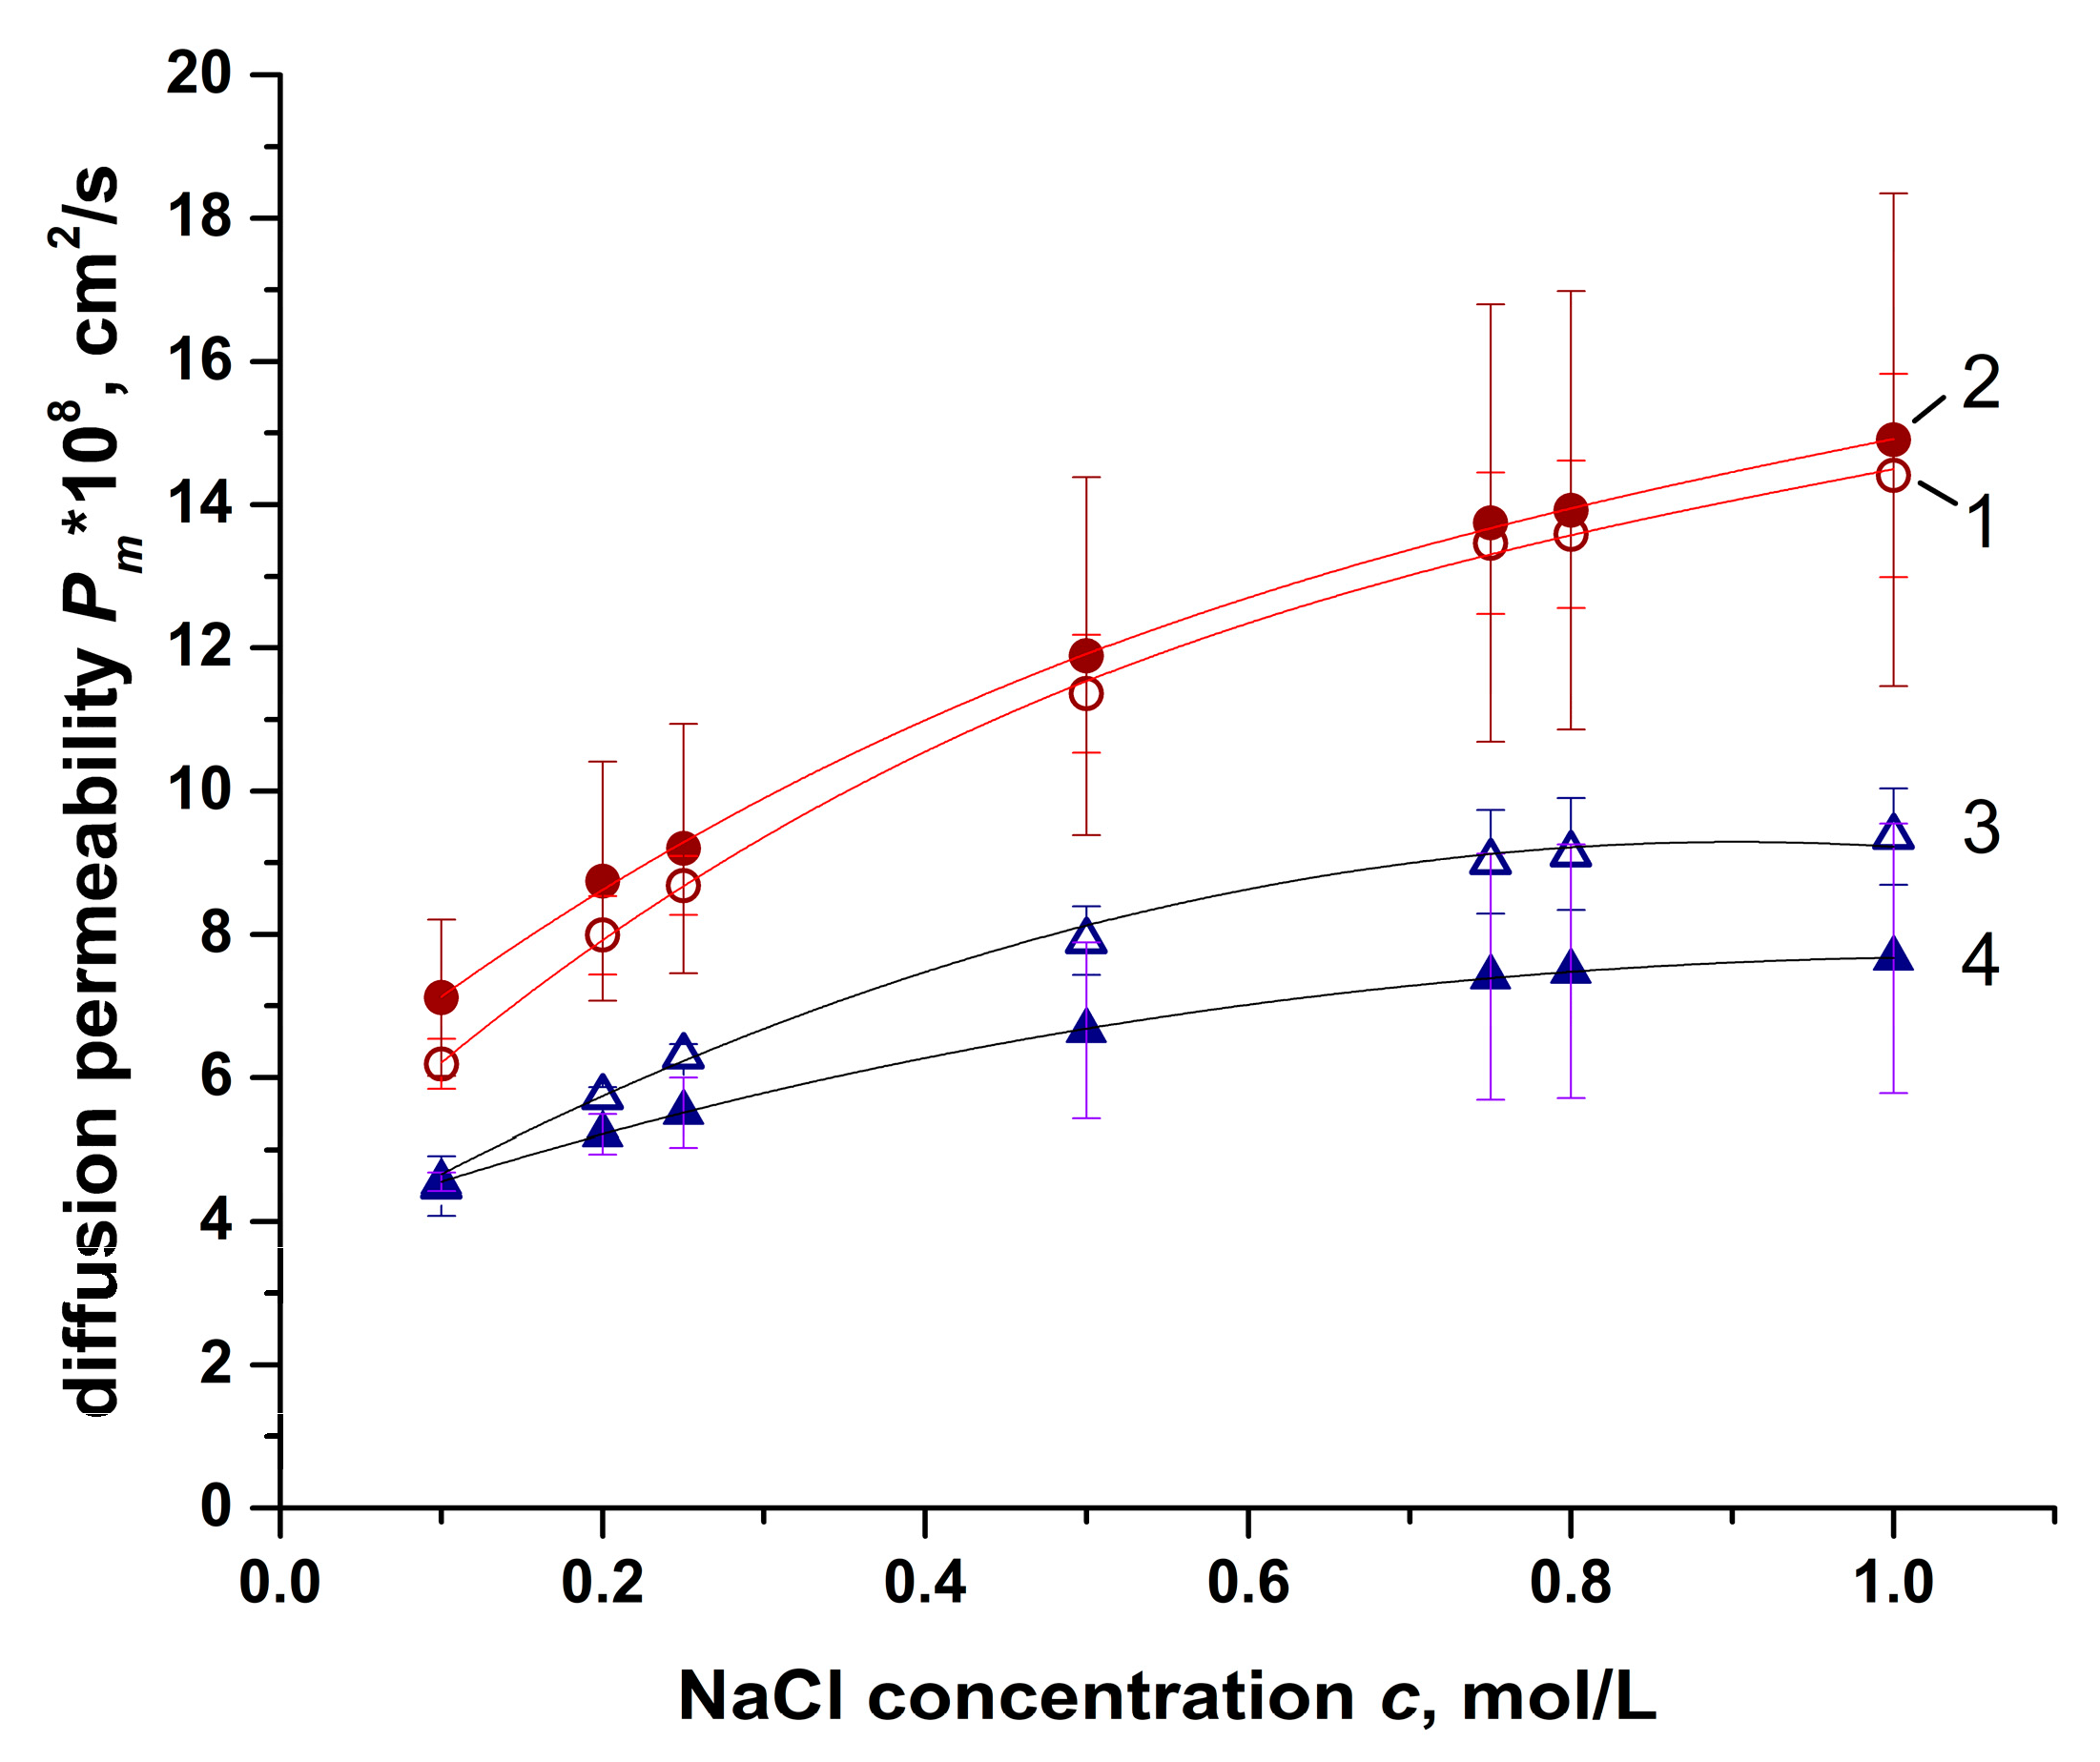
4.2. Diffusion Permeability Results
4.3. Transport Numbers
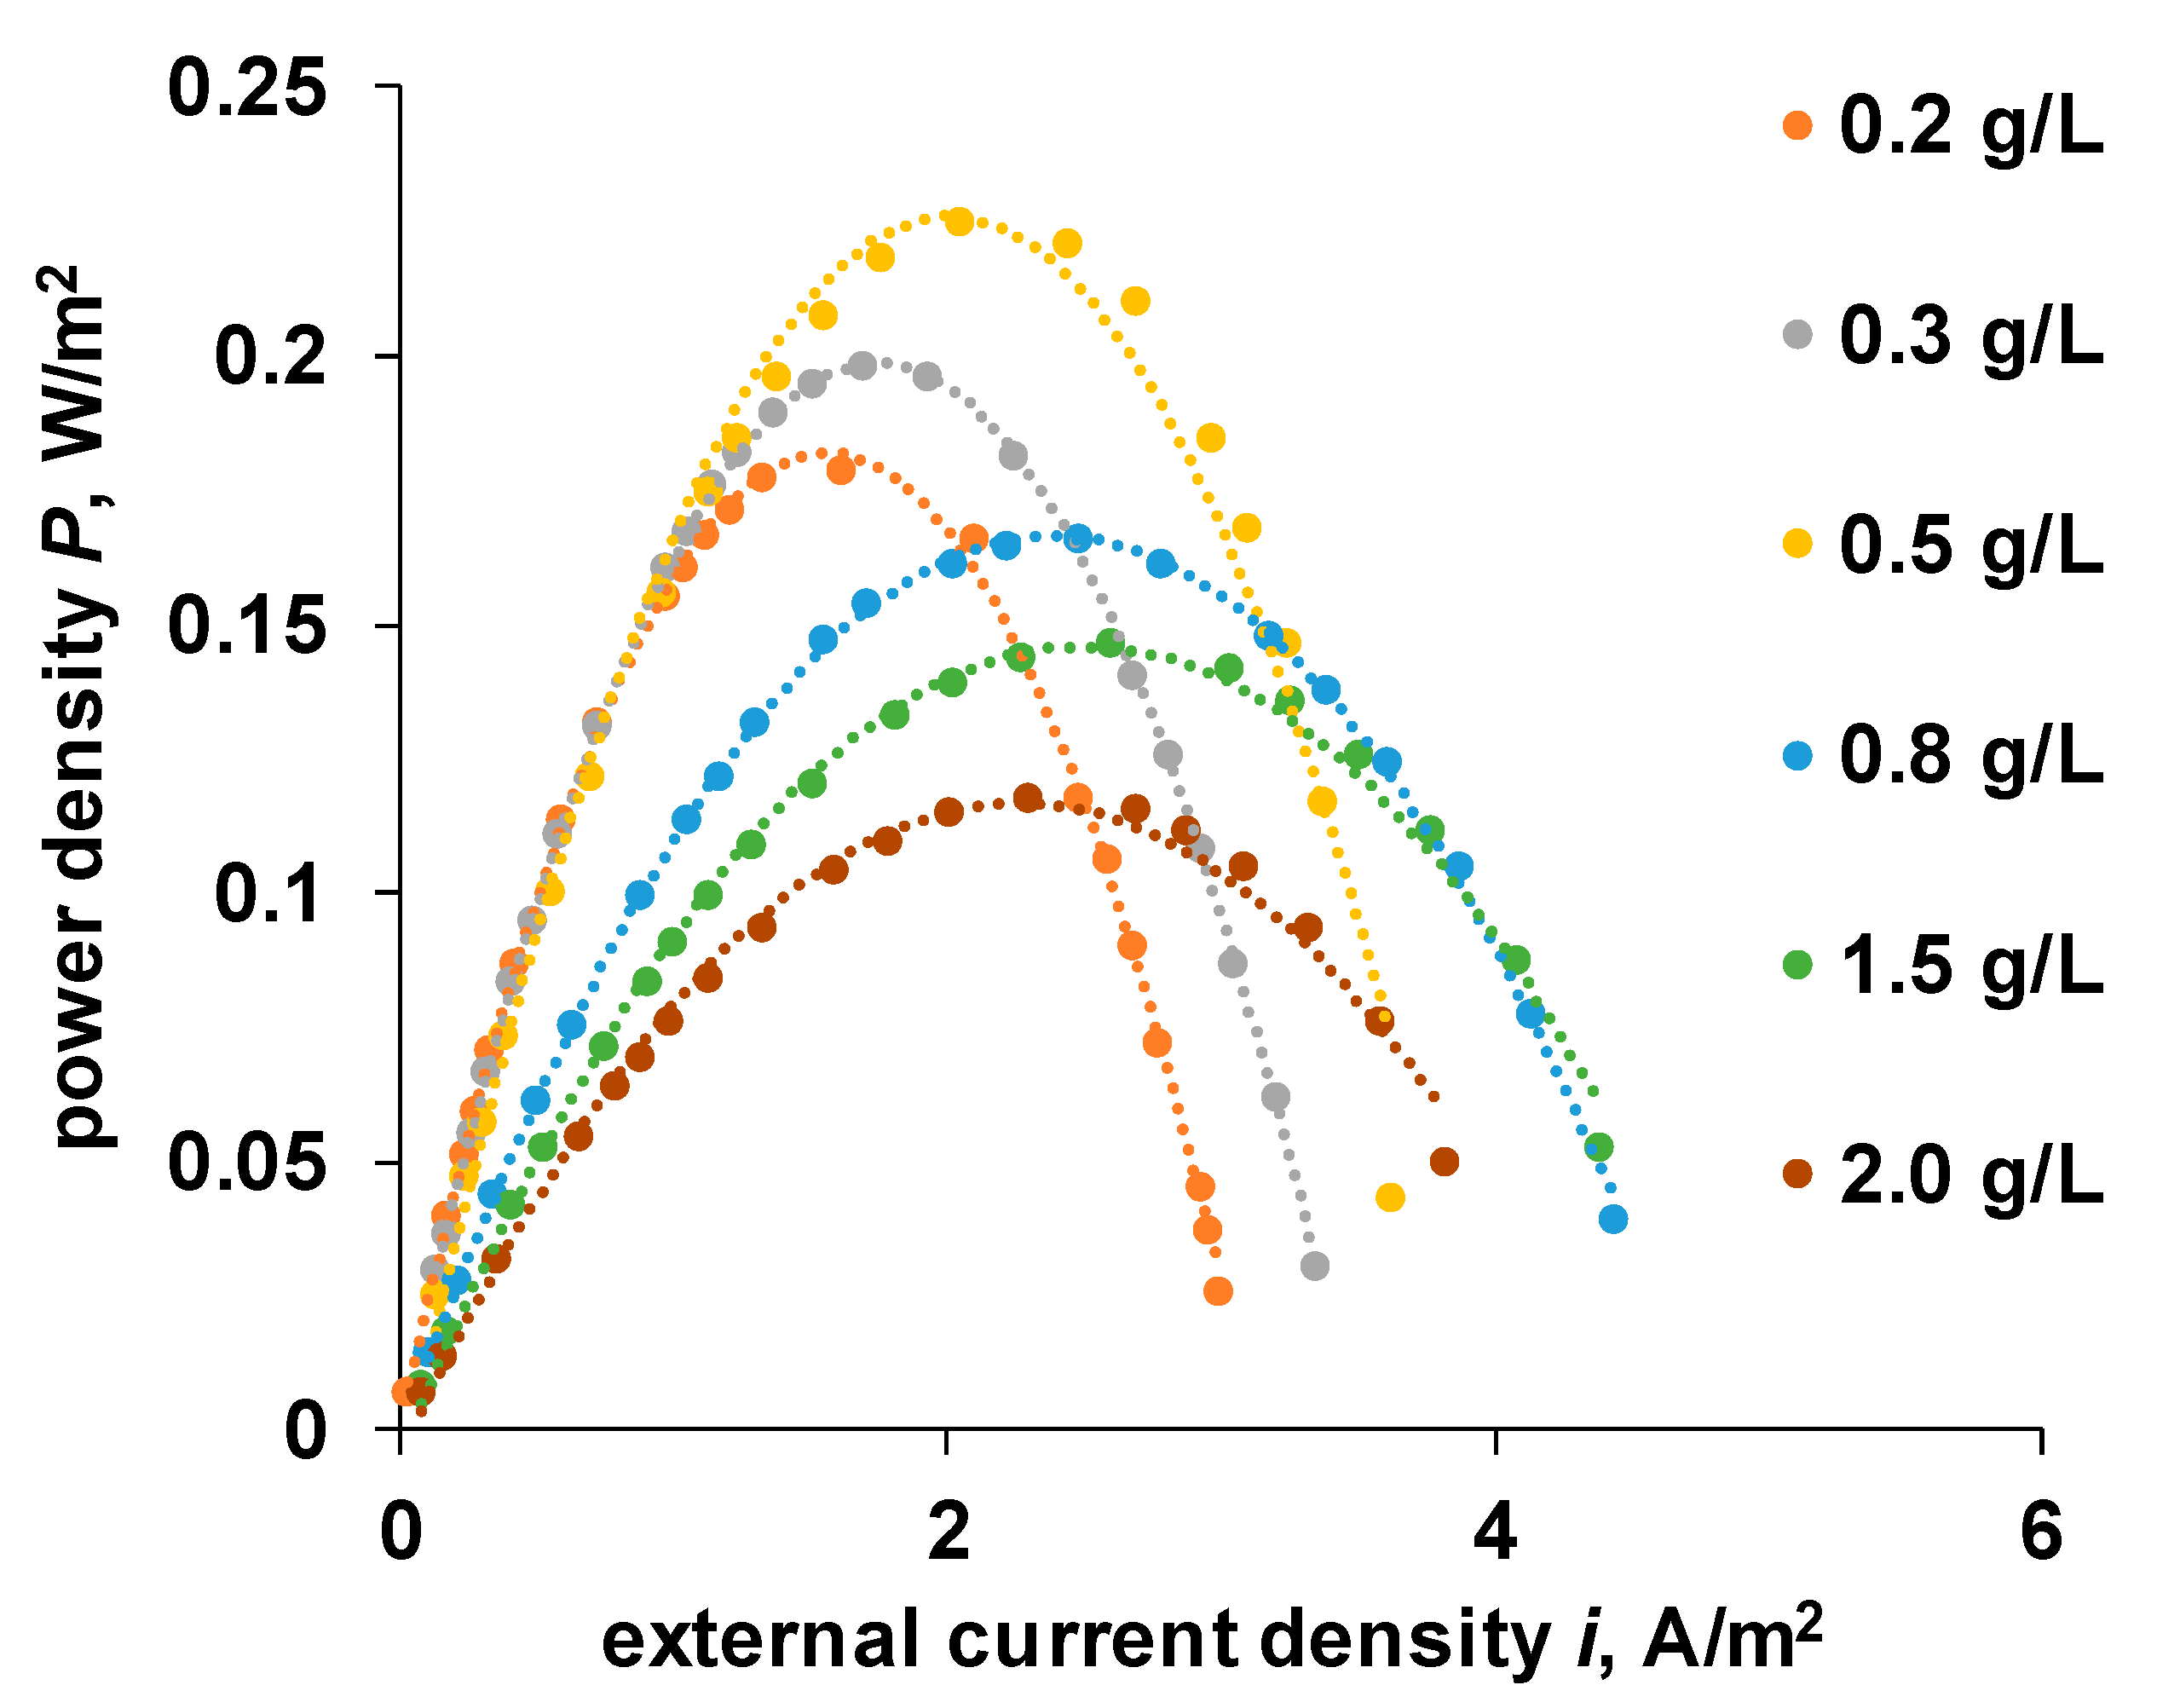
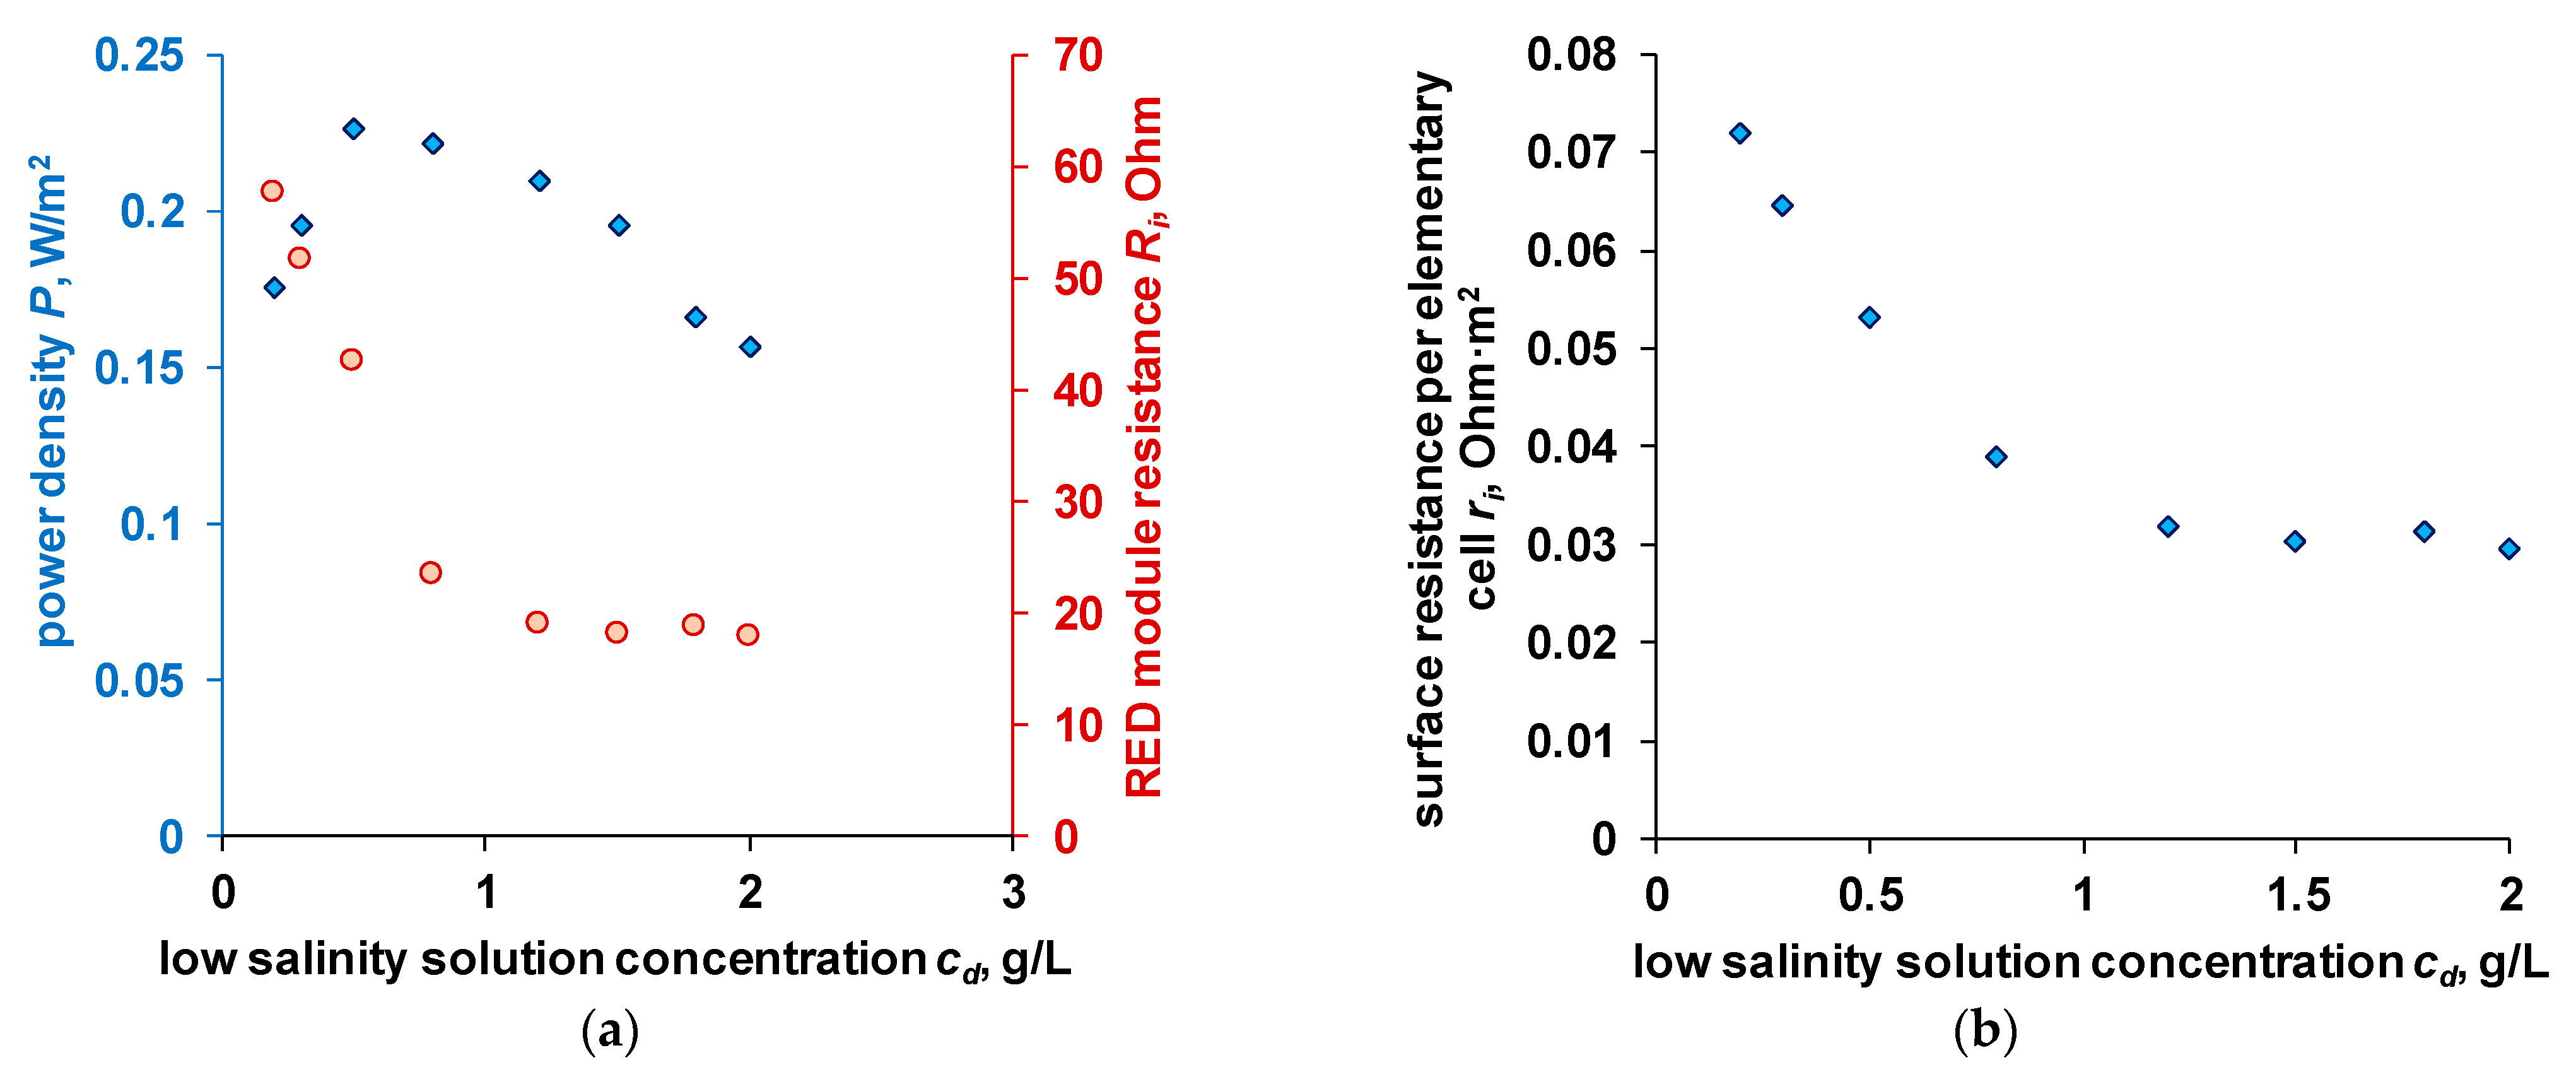
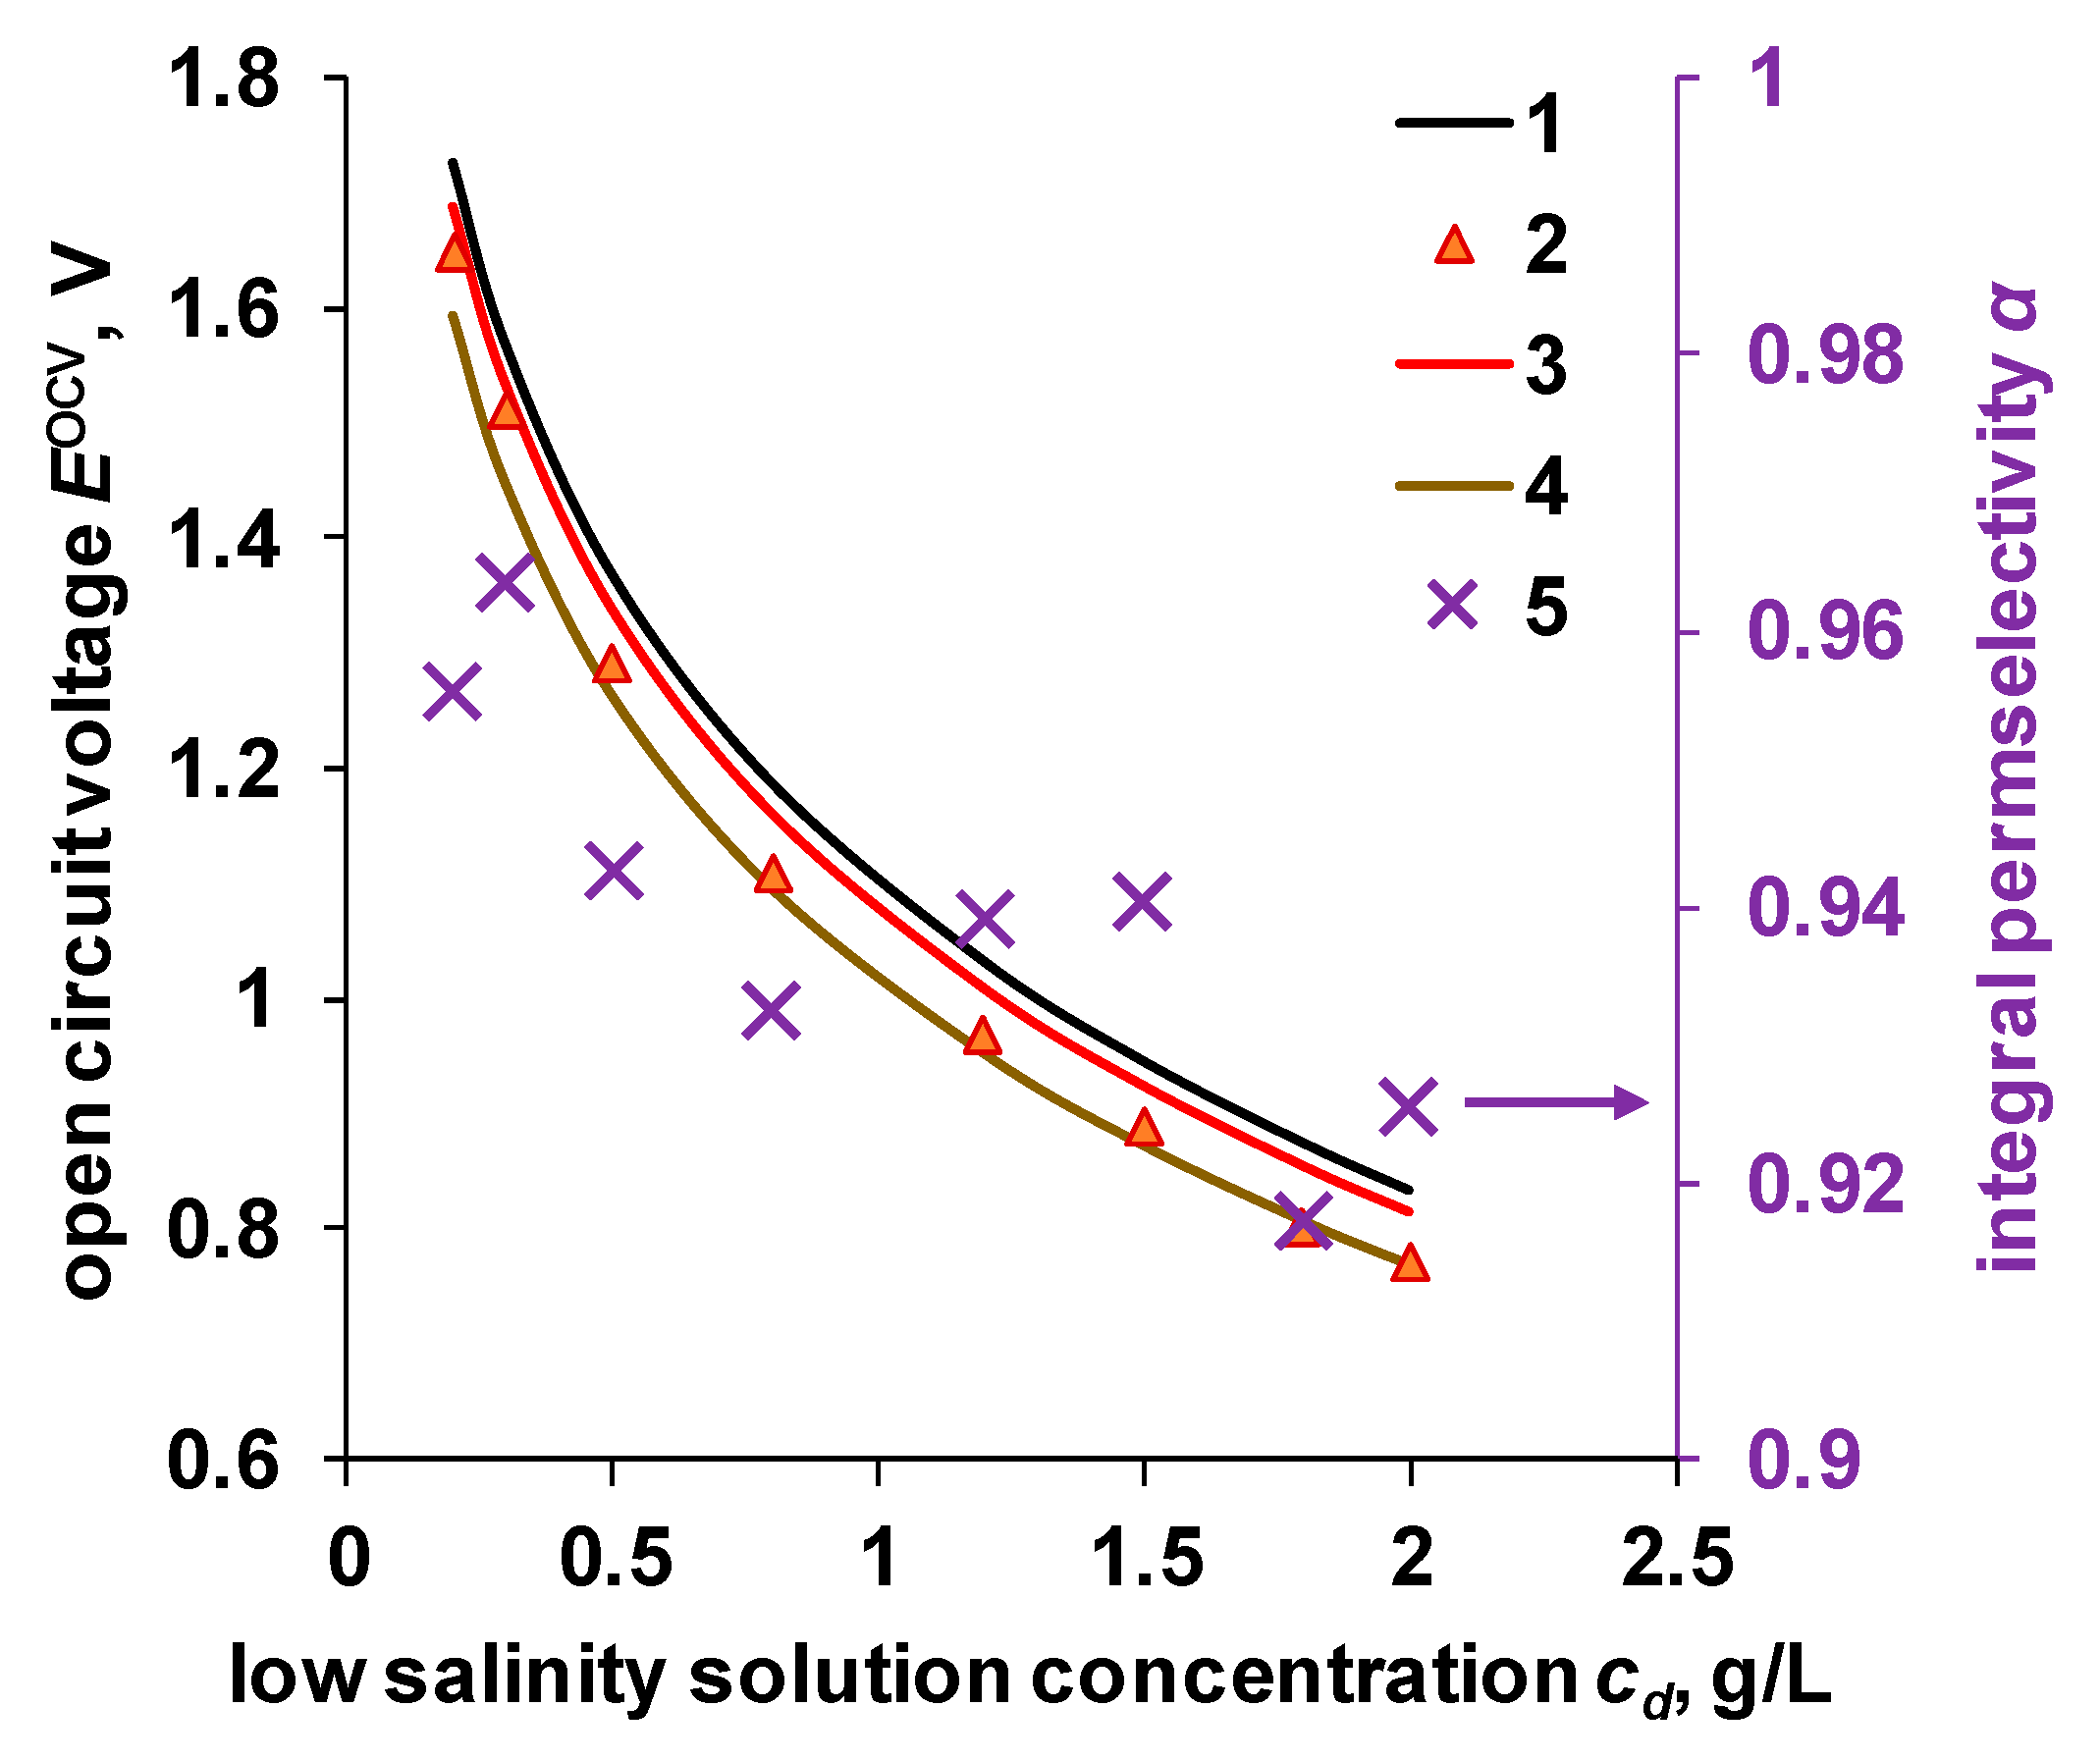
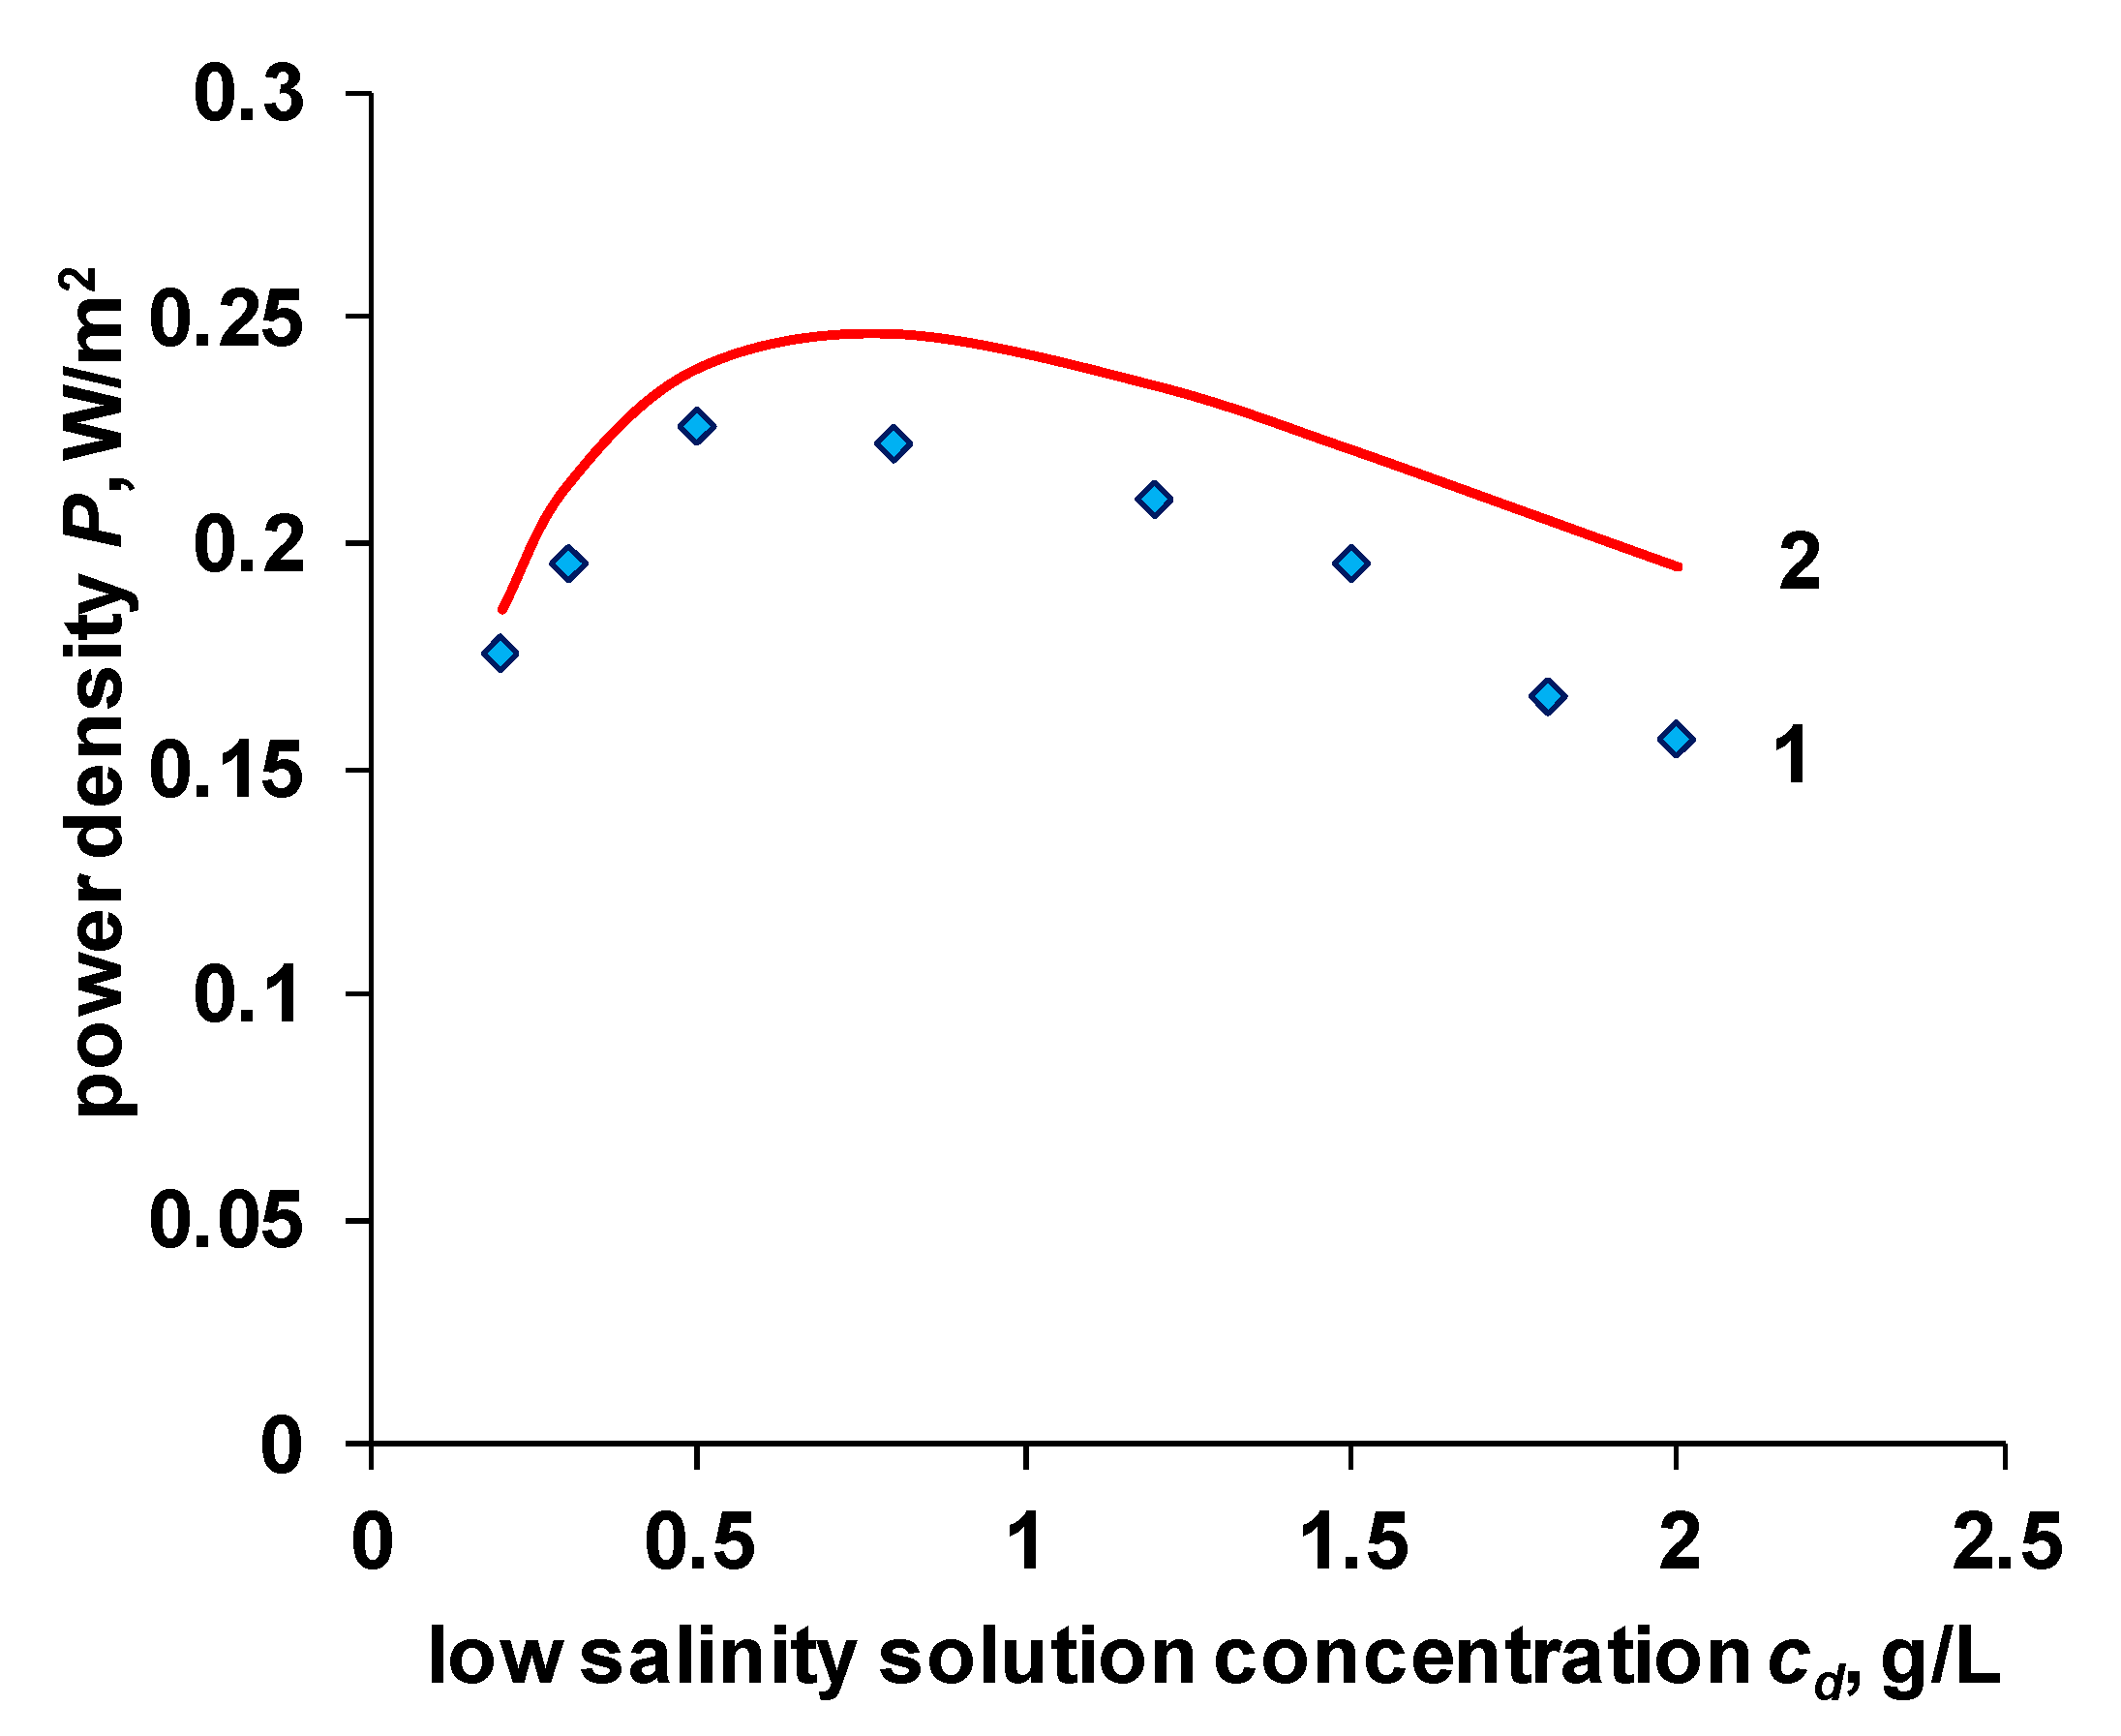
4.4. OCV and Power Density of the RED Stack
- The change in the concentration of the solution with a not very long channel length is insignificant. Considering the values of the integral diffusion permeability coefficient given in Section 4.2 and the linear velocity of the solution, and the geometric parameters of the electrodialyzer, the calculated concentration decrease in the high salinity solution is 0.002 mol/L. Such changes will not have a significant impact on resistance.
- The resistance of diffusion layers is also generally not considered. In the case of an enriched diffusion layer (), the concentration at the membrane surface is higher than in the bulk of the solution, and its resistance will be lower. In the case of a depleted diffusion layer (), it is assumed that a separator is sufficiently effective, so the thickness of this layer is sufficiently small. The decrease of concentration in the depleted diffusion layer against the bulk of a high salinity solution is also assumed to be insignificant. The dependence of power density on the linear velocity of the solution in the high salinity channel verifies the later statement (see Supplementary).
5. Conclusions
Supplementary Materials
Author Contributions
Funding
Conflicts of Interest
List of Symbols and Abbreviations
| Subscripts and superscripts: | ||
| Subscript “b” denotes high concentration solution (brine), | ||
| Subscript “d” denotes low concentration solution (diluate), | ||
| Subscript CEM shows that characteristic is for cation-exchange membrane, | ||
| Subscript AEM shows that characteristic is for anion-exchange membrane, | ||
| Superscript “s” denotes that resistance is in Ohm·m2. | ||
| Abbreviations: | ||
| CEM | cation exchange membrane | |
| AEM | anion exchange membrane | |
| RED | reverse electrodialysis | |
| OCV | open circuit voltage | |
| Greek letters: | ||
| Parameter | Description | Dimension |
| α | permselectivity of ion-exchange membrane | |
| A | characteristic parameter that describes the spatial distribution of conducting phases in the membrane | |
| βj | parameter that characterizes the concentration profile in the ion-exchange membrane | |
| γ+ | cation activity coefficient | |
| γ– | anion activity coefficient | |
| γ± | mean activity coefficient of electrolyte | |
| electrical conductivity of membrane on direct current | S/m | |
| electrical conductivity of membrane on alternating current | S/m | |
| the specific electrical conductivity of the membrane | S/m | |
| the specific electrical conductivity of the electrolyte | S/m | |
| the specific electrical conductivity of the gel phase | S/m | |
| correction factor for the nonideality of the solution | ||
| τ | time | s |
| English letters: | ||
| Parameter | Description | Dimension |
| c | electrolyte concentration | mol/L |
| d | membrane thickness | m |
| EOCV | open circuit voltage | V |
| Em | membrane potential | V |
| ERED | potential generated on the membrane stack | V |
| experimental open circuit potential | V | |
| theoretical open circuit potential | V | |
| f1, f2 | volume fractions of the gel and electroneutral solution phases | |
| F | Faraday’s constant | C/mol |
| h | solution compartment thickness | m |
| i | current density | A/m2 |
| jd | diffusion salt flux through the membrane | mol/(m2·s) |
| Ji | flux of ion i in the membrane | mol/(m2·s) |
| Lg | counterion electrodiffusion coefficient | |
| Lco | co-ion electrodiffusion coefficients | |
| n | number of electrons in RedOx reaction | |
| N | number of membrane pairs (elementary cells) | |
| P* | differential coefficient of diffusion permeability of the membrane | m2/s |
| Pm | integral coefficient of diffusion permeability of the membrane | m2/s |
| maximum power density obtained in RED | W/m2 | |
| R | universal gas constant | J/(K·mol) |
| ri | surface resistance per unit cell | Ohm∙m2/N |
| Ri | internal resistance of the membrane stack | Ohm |
| Rm | measured resistance of the membrane | Ohm |
| ROhm | membrane stack ohmic component of the resistance | Ohm |
| Rn/Ohm | membrane stack non-ohmic component of the resistance | Ohm |
| Rel | resistance of the solution in the electrode chambers | Ohm |
| S | membrane area | m2 |
| electromigration transport number of counterions in the membrane | ||
| electromigration transport number of co-ions in the membrane | ||
| t+ | cation transport number in solution | |
| t– | anion transport number in solution | |
| T | absolute temperature | K |
| V | volume of the solution | m3 |
| Vgel | volume of the gel phase | m3 |
| Vsol | volume of the electroneutral solution phase and total volume of the membrane | m3 |
| Vtotal | total volume of the membrane | m3 |
| zi | charge of ion i | |
References
- Strathmann, H. Electrodialysis, a mature technology with a multitude of new applications. Desalination 2010, 264, 268–288. [Google Scholar] [CrossRef]
- Bazinet, L.; Geoffroy, T.R. Electrodialytic processes: Market overview, membrane phenomena, recent developments and sustainable strategies. Membranes (Basel) 2020, 10, 221. [Google Scholar] [CrossRef]
- Pärnamäe, R.; Mareev, S.; Nikonenko, V.; Melnikov, S.; Sheldeshov, N.; Zabolotskii, V.; Hamelers, H.V.M.; Tedesco, M. Bipolar membranes: A review on principles, latest developments, and applications. J. Memb. Sci. 2020, 617, 118538. [Google Scholar] [CrossRef]
- Bazinet, L.; Lamarche, F.; Ippersiel, D. Bipolar-membrane electrodialysis: Applications of electrodialysis in the food industry. Trends Food Sci. Technol. 1998, 9, 107–113. [Google Scholar] [CrossRef]
- Oren, Y.; Korngold, E.; Daltrophe, N.; Messalem, R.; Volkman, Y.; Aronov, L.; Weismann, M.; Bouriakov, N.; Glueckstern, P.; Gilron, J. Pilot studies on high recovery BWRO-EDR for near zero liquid discharge approach. Desalination 2010, 261, 321–330. [Google Scholar] [CrossRef]
- Ahmed, F.E.; Hashaikeh, R.; Hilal, N. Hybrid technologies: The future of energy efficient desalination—A review. Desalination 2020, 495, 114659. [Google Scholar] [CrossRef]
- Zhao, D.; Lee, L.Y.; Ong, S.L.; Chowdhury, P.; Siah, K.B.; Ng, H.Y. Electrodialysis reversal for industrial reverse osmosis brine treatment. Sep. Purif. Technol. 2019, 213, 339–347. [Google Scholar] [CrossRef]
- Tian, H.; Wang, Y.; Pei, Y.; Crittenden, J.C. Unique applications and improvements of reverse electrodialysis: A review and outlook. Appl. Energy 2020, 262, 114482. [Google Scholar] [CrossRef]
- Mei, Y.; Tang, C.Y. Recent developments and future perspectives of reverse electrodialysis technology: A review. Desalination 2018, 425, 156–174. [Google Scholar] [CrossRef]
- Pawlowski, S.; Huertas, R.M.; Galinha, C.F.; Crespo, J.G.; Velizarov, S. On operation of reverse electrodialysis (RED) and membrane capacitive deionisation (MCDI) with natural saline streams: A critical review. Desalination 2020, 476, 114183. [Google Scholar] [CrossRef]
- Kotoka, F.; Merino-Garcia, I.; Velizarov, S. Surface modifications of anion exchange membranes for an improved reverse electrodialysis process performance: A review. Membranes (Basel) 2020, 10, 160. [Google Scholar] [CrossRef]
- Zoungrana, A.; Çakmakci, M. From non-renewable energy to renewable by harvesting salinity gradient power by reverse electrodialysis: A review. Int. J. Energy Res. 2021, 45, 3495–3522. [Google Scholar] [CrossRef]
- Pattle, R.E. Production of Electric Power by mixing Fresh and Salt Water in the Hydroelectric Pile. Nature 1954, 174, 660. [Google Scholar] [CrossRef]
- Hong, J.G.; Zhang, B.; Glabman, S.; Uzal, N.; Dou, X.; Zhang, H.; Wei, X.; Chen, Y. Potential ion exchange membranes and system performance in reverse electrodialysis for power generation: A review. J. Memb. Sci. 2015, 486, 71–88. [Google Scholar] [CrossRef]
- Długołecki, P.; Nymeijer, K.; Metz, S.; Wessling, M. Current status of ion exchange membranes for power generation from salinity gradients. J. Memb. Sci. 2008, 319, 214–222. [Google Scholar] [CrossRef]
- Ran, J.; Wu, L.; He, Y.; Yang, Z.; Wang, Y.; Jiang, C.; Ge, L.; Bakangura, E.; Xu, T. Ion exchange membranes: New developments and applications. J. Memb. Sci. 2017, 522, 267–291. [Google Scholar] [CrossRef]
- Pawlowski, S.; Crespo, J.; Velizarov, S. Sustainable Power Generation from Salinity Gradient Energy by Reverse Electrodialysis. In Electrokinetics Across Disciplines and Continents; Ribeiro, A.B., Ed.; Springer: Cham, Switzerland, 2016; pp. 57–80. ISBN 978-3-319-20178-8. [Google Scholar]
- Geise, G.M.; Cassady, H.J.; Paul, D.R.; Logan, B.E.; Hickner, M.A. Specific ion effects on membrane potential and the permselectivity of ion exchange membranes. Phys. Chem. Chem. Phys. 2014, 16, 21673–21681. [Google Scholar] [CrossRef]
- Larchet, C.; Dammak, L.; Auclair, B.; Parchikov, S.; Nikonenko, V. A simplified procedure for ion-exchange membrane characterisation. New J. Chem. 2004, 28, 1260–1267. [Google Scholar] [CrossRef]
- Demina, O.A.; Kononenko, N.A.; Falina, I. V New approach to the characterization of ion-exchange membranes using a set of model parameters. Pet. Chem. 2014, 54, 515–525. [Google Scholar] [CrossRef]
- Zabolotsky, V.I.; Nikonenko, V.V. Effect of structural membrane inhomogeneity on transport properties. J. Memb. Sci. 1993, 79, 181–198. [Google Scholar] [CrossRef]
- Gnusin, N.P.; Zabolotsky, V.I.; Meshechkov, A.I. Development of the generalized conductance principle to the description of transfer phenomena in disperse systems under the acting of different forces. Russ. J. Phys. Chem. 1980, 54, 1518–1522. [Google Scholar]
- Berezina, N.P.; Kononenko, N.A.; Dyomina, O.A.; Gnusin, N.P. Characterization of ion-exchange membrane materials: Properties vs. structure. Adv. Colloid Interface Sci. 2008, 139, 3–28. [Google Scholar] [CrossRef]
- Karpenko-Jereb, L.V.; Berezina, N.P. Determination of structural, selective, electrokinetic and percolation characteristics of ion-exchange membranes from conductive data. Desalination 2009, 245, 587–596. [Google Scholar] [CrossRef]
- Sedkaoui, Y.; Szymczyk, A.; Lounici, H.; Arous, O. A new lateral method for characterizing the electrical conductivity of ion-exchange membranes. J. Memb. Sci. 2016, 507, 34–42. [Google Scholar] [CrossRef]
- Kamcev, J.; Paul, D.R.; Freeman, B.D. Ion activity coefficients in ion exchange polymers: Applicability of Manning’s counterion condensation theory. Macromolecules 2015, 48, 8011–8024. [Google Scholar] [CrossRef]
- Kamcev, J.; Galizia, M.; Benedetti, F.M.; Jang, E.S.; Paul, D.R.; Freeman, B.D.; Manning, G.S. Partitioning of mobile ions between ion exchange polymers and aqueous salt solutions: Importance of counter-ion condensation. Phys. Chem. Chem. Phys. 2016, 18, 6021–6031. [Google Scholar] [CrossRef] [PubMed]
- Kamcev, J.; Paul, D.R.; Manning, G.S.; Freeman, B.D. Ion Diffusion Coefficients in Ion Exchange Membranes: Significance of Counterion Condensation. Macromolecules 2018, 51, 5519–5529. [Google Scholar] [CrossRef]
- Falina, I.; Loza, N.; Loza, S.; Titskaya, E.; Romanyuk, N. Permselectivity of cation exchange membranes modified by polyaniline. Membranes (Basel) 2021, 11, 227. [Google Scholar] [CrossRef]
- Shel’deshov, N.V.; Chaika, V.V.; Zabolotskii, V.I. Structural and mathematical models for pressure-dependent electrodiffusion of an electrolyte through heterogeneous ion-exchange membranes: Pressure-dependent electrodiffusion of NaOH through the MA-41 anion-exchange membrane. Russ. J. Electrochem. 2008, 44, 1036–1046. [Google Scholar] [CrossRef]
- Karpenko, L.V.; Demina, O.A.; Dvorkina, G.A.; Parshikov, S.B.; Larchet, C.; Auclair, B.; Berezina, N.P. Comparative Study of Methods Used for the Determination of Electroconductivity of Ion-Exchange Membranes. Russ. J. Electrochem. 2001, 37, 287–293. [Google Scholar] [CrossRef]
- Kamcev, J.; Sujanani, R.; Jang, E.-S.; Yan, N.; Moe, N.; Paul, D.R.; Freeman, B.D. Salt concentration dependence of ionic conductivity in ion exchange membranes. J. Memb. Sci. 2017, 547, 123–133. [Google Scholar] [CrossRef]
- Filippov, A.N.; Shkirskaya, S.A. Influence of the Electric Potential Difference on the Diffusion Permeability of an Ion-Exchange Membrane. Pet. Chem. 2018, 58, 774–779. [Google Scholar] [CrossRef]
- Melnikov, S.; Loza, S.; Sharafan, M.; Zabolotskiy, V. Electrodialysis treatment of secondary steam condensate obtained during production of ammonium nitrate. Technical and economic analysis. Sep. Purif. Technol. 2016, 157, 179–191. [Google Scholar] [CrossRef]
- Sarapulova, V.; Butylskii, D.; Titorova, V.; Wang, Y.; Xu, T.; Zhang, Y.; Nikonenko, V.; Pismenskaya, N. Transport and electrochemical characteristics of CJMCED homogeneous cation exchange membranes in sodium chloride, calcium chloride, and sodium sulfate solutions. Membranes (Basel) 2020, 10, 165. [Google Scholar] [CrossRef] [PubMed]
- Sarapulova, V.; Pismenskaya, N.; Titorova, V.; Sharafan, M.; Wang, Y.; Xu, T.; Zhang, Y.; Nikonenko, V. Transport characteristics of CJMAEDTM homogeneous anion exchange membranes in sodium chloride and sodium sulfate solutions. Int. J. Mol. Sci. 2021, 22, 1415. [Google Scholar] [CrossRef] [PubMed]
- Akberova, E.M.; Vasil’eva, V.I.; Zabolotsky, V.I.; Novak, L. A study of ralex membrane morphology by SEM. Membranes (Basel) 2019, 9, 169. [Google Scholar] [CrossRef] [Green Version]
- Svoboda, M.; Beneš, J.; Vobecká, L.; Slouka, Z. Swelling induced structural changes of a heterogeneous cation-exchange membrane analyzed by micro-computed tomography. J. Memb. Sci. 2017, 525, 195–201. [Google Scholar] [CrossRef]
- Veerman, J. The effect of the NaCl bulk concentration on the resistance of ion exchange membranes-measuring and modeling. Energies 2020, 13, 1946. [Google Scholar] [CrossRef] [Green Version]
- Veerman, J.; Post, J.W.; Saakes, M.; Metz, S.J.; Harmsen, G.J. Reducing power losses caused by ionic shortcut currents in reverse electrodialysis stacks by a validated model. J. Memb. Sci. 2008, 310, 418–430. [Google Scholar] [CrossRef] [Green Version]
- Veerman, J.; Vermaas, D.A. Reverse Electrodialysis: Fundamentals; Elsevier Ltd.: Amsterdam, The Netherlands, 2016; ISBN 9780081003237. [Google Scholar]
- Mehdizadeh, S.; Yasukawa, M.; Abo, T.; Kakihana, Y.; Higa, M. Effect of spacer geometry on membrane and solution compartment resistances in reverse electrodialysis. J. Memb. Sci. 2019, 572, 271–280. [Google Scholar] [CrossRef]
- Mandersloot, W.G.B.; Hicks, R.E. Leakage currents in electrodialytic desalting and brine production. Desalination 1966, 1, 178–193. [Google Scholar] [CrossRef]
- Yamane, R.; Ichikawa, M.; Mizutani, Y.; Onoue, Y. Concentrated Brine Production from Sea Water by Electrodialysis Using Exchange Membranes. Ind. Eng. Chem. Process Des. Dev. 1969, 8, 159–165. [Google Scholar] [CrossRef]
- Kuhn, A.T.; Booth, J.S. Electrical leakage currents in bipolar cell stacks. J. Appl. Electrochem. 1980, 10, 233–237. [Google Scholar] [CrossRef]
- Culcasi, A.; Gurreri, L.; Zaffora, A.; Cosenza, A.; Tamburini, A.; Cipollina, A.; Micale, G. Ionic shortcut currents via manifolds in reverse electrodialysis stacks. Desalination 2020, 485, 114450. [Google Scholar] [CrossRef]

| Name | Method | Advantages | Drawbacks | Ref. |
|---|---|---|---|---|
| Membrane potential | An IEM is placed between solutions with different concentrations of the same ions, and permselectivity (expressed in terms of the ion-transport number) is obtained from the electrochemical potential difference between the two solutions with high and low concentration: | Simplicity of measurement | Only apparent transport numbers can be determined. Additionally, the exact ion-transport numbers determined in this way depend on the measurement conditions | [18] |
| Scatchard | If apparent transport number and water transport numbers are known, the true transport numbers can be calculated: | True transport numbers can be calculated | Requires the knowledge of concentration dependence of water transport numbers. The measurement of the latter is complicated | [19] |
| Three-wire model | If parameters of the three-wire model are known, the true transport number can be calculated in assumption that co-ions are transported only through solution channel of conductivity: | Requires only concentration dependence of electrical conductivity | In concentrated solutions, when transport of co-ions in the gel becomes significant, tends to predict lower values of transport numbers | [20] |
| Microheterogeneous model | True counter ions transport number can be calculated based on the concentration dependence of electrical conductivity and diffusion permeability. See text for more information. | Considers transport through the gel and electroneutral solution. True transport numbers can be calculated. | Large amount of experimental data is required. | [21] |
| Membrane | Ralex CM | Ralex AMH | MK-40 | MA-41 |
|---|---|---|---|---|
| Functional groups | −SO3− | −N+(CH3)3 | −SO3− | −N+(CH3)3 |
| Counterion in NaCl solution | Na+ | Cl– | Na+ | Cl– |
| Ion-exchange resin | Lewatit S100 | Lewatit M500 | KU-2-8 | AV-17-8 |
| Inert binder | LDPE | |||
| Reinforcing mesh | Ulester 32S | Nylon | ||
| Ion-exchange capacity, mmol/g-swollen | 1.12 | 0.86 | 1.08 | 0.91 |
| Water content, % | 44 | 45 | 33 | 36 |
| Surface resistance 1, Ohm·cm 2 | <8 | <7.5 | <10 | <11 |
| Permselectivity 2, % | >90 | <90 | >80 | >94 |
| Wet thickness, microns | 720 | 750 | 540 | 530 |
| Membrane * | f2 | ciso, mol/L | |
|---|---|---|---|
| MK-40 1 | 0.10 | 5.0 | 0.046 |
| MK-40 2 | 0.12 | 6.0 | 0.056 |
| Ralex CM 1 | 0.06 | 3.6 | 0.032 |
| Ralex CM 2 | 0.03 | 4.0 | 0.037 |
| MA-41 1 | 0.12 | 1.9 | 0.017 |
| MA-41 2 | 0.14 | 2.8 | 0.025 |
| Ralex AMH 1 | 0.04 | 4.3 | 0.039 |
| Ralex AMH 2 | 0.07 | 4.6 | 0.042 |
| Membrane * | MK-40 1 | MK-40 2 | MA-41 1 | MA-41 2 | Ralex CM 1 | Ralex CM 2 | Ralex AMH 1 | Ralex AMH 2 |
|---|---|---|---|---|---|---|---|---|
| 1.39 | 1.35 | 1.36 | 1.26 | 1.22 | 1.43 | 1.02 | 1.39 |
| NaCl Concentration | ||||||||
|---|---|---|---|---|---|---|---|---|
| MK-40 1 | MK-40 2 | MA-41 1 | MA-41 2 | Ralex CM 1 | Ralex CM 2 | Ralex AMH 1 | Ralex AMH 2 | |
| 0.05 | 0.99 | 0.99 | 0.99 | 0.99 | 0.99 | 0.99 | 0.99 | 0.99 |
| 0.1 | 0.99 | 0.99 | 0.98 | 0.99 | 0.99 | 0.99 | 0.99 | 0.99 |
| 0.2 | 0.99 | 0.99 | 0.97 | 0.99 | 0.99 | 0.99 | 0.99 | 0.99 |
| 0.5 | 0.96 | 0.98 | 0.91 | 0.97 | 0.97 | 0.97 | 0.98 | 0.98 |
| 0.8 | 0.93 | 0.97 | 0.82 | 0.95 | 0.96 | 0.96 | 0.98 | 0.96 |
| 1.0 | 0.91 | 0.96 | 0.73 | 0.94 | 0.95 | 0.95 | 0.97 | 0.96 |
| Low Salinity Solution Concentration, g/L | CEM | AEM | Low Salinity | High Salinity | Electrode Solution | |
|---|---|---|---|---|---|---|
| Fraction of ohmic resistance () | 0.5 | 0.14 | 0.11 | 0.71 | 0.02 | 0.02 |
| 2.0 | 0.29 | 0.21 | 0.40 | 0.05 | 0.04 |
Publisher’s Note: MDPI stays neutral with regard to jurisdictional claims in published maps and institutional affiliations. |
© 2021 by the authors. Licensee MDPI, Basel, Switzerland. This article is an open access article distributed under the terms and conditions of the Creative Commons Attribution (CC BY) license (https://creativecommons.org/licenses/by/4.0/).
Share and Cite
Davydov, D.; Nosova, E.; Loza, S.; Achoh, A.; Korzhov, A.; Sharafan, M.; Melnikov, S. Use of the Microheterogeneous Model to Assess the Applicability of Ion-Exchange Membranes in the Process of Generating Electricity from a Concentration Gradient. Membranes 2021, 11, 406. https://doi.org/10.3390/membranes11060406
Davydov D, Nosova E, Loza S, Achoh A, Korzhov A, Sharafan M, Melnikov S. Use of the Microheterogeneous Model to Assess the Applicability of Ion-Exchange Membranes in the Process of Generating Electricity from a Concentration Gradient. Membranes. 2021; 11(6):406. https://doi.org/10.3390/membranes11060406
Chicago/Turabian StyleDavydov, Denis, Elena Nosova, Sergey Loza, Aslan Achoh, Alexander Korzhov, Mikhail Sharafan, and Stanislav Melnikov. 2021. "Use of the Microheterogeneous Model to Assess the Applicability of Ion-Exchange Membranes in the Process of Generating Electricity from a Concentration Gradient" Membranes 11, no. 6: 406. https://doi.org/10.3390/membranes11060406
APA StyleDavydov, D., Nosova, E., Loza, S., Achoh, A., Korzhov, A., Sharafan, M., & Melnikov, S. (2021). Use of the Microheterogeneous Model to Assess the Applicability of Ion-Exchange Membranes in the Process of Generating Electricity from a Concentration Gradient. Membranes, 11(6), 406. https://doi.org/10.3390/membranes11060406