
Rational Design Method Based on Techno-Economic Principles for Integration of Organic/Organic Pervaporation with Lipase Catalyzed Transesterification


Abstract
1. Introduction
2. Materials and Methods
2.1. Chemicals
2.2. Analysis
2.3. Reaction Conditions
2.4. Calculations
2.4.1. Determination of Mechanistic Model Parameters
2.4.2. Pervaporation Experiment
2.4.3. Mathematical Description of Transesterification with Pervaporation
2.5. Techno-Economic Assessment
3. Results and Discussion
3.1. Determination of Mechanistic Model Parameters
3.1.1. Geranyl Acetate
3.1.2. Prenyl Acetate
3.2. Empirical Model for Pervaporation
3.3. Model Development Integrating Transesterification with Pervaporation
3.4. Simulations of Conversion as a Function of Time
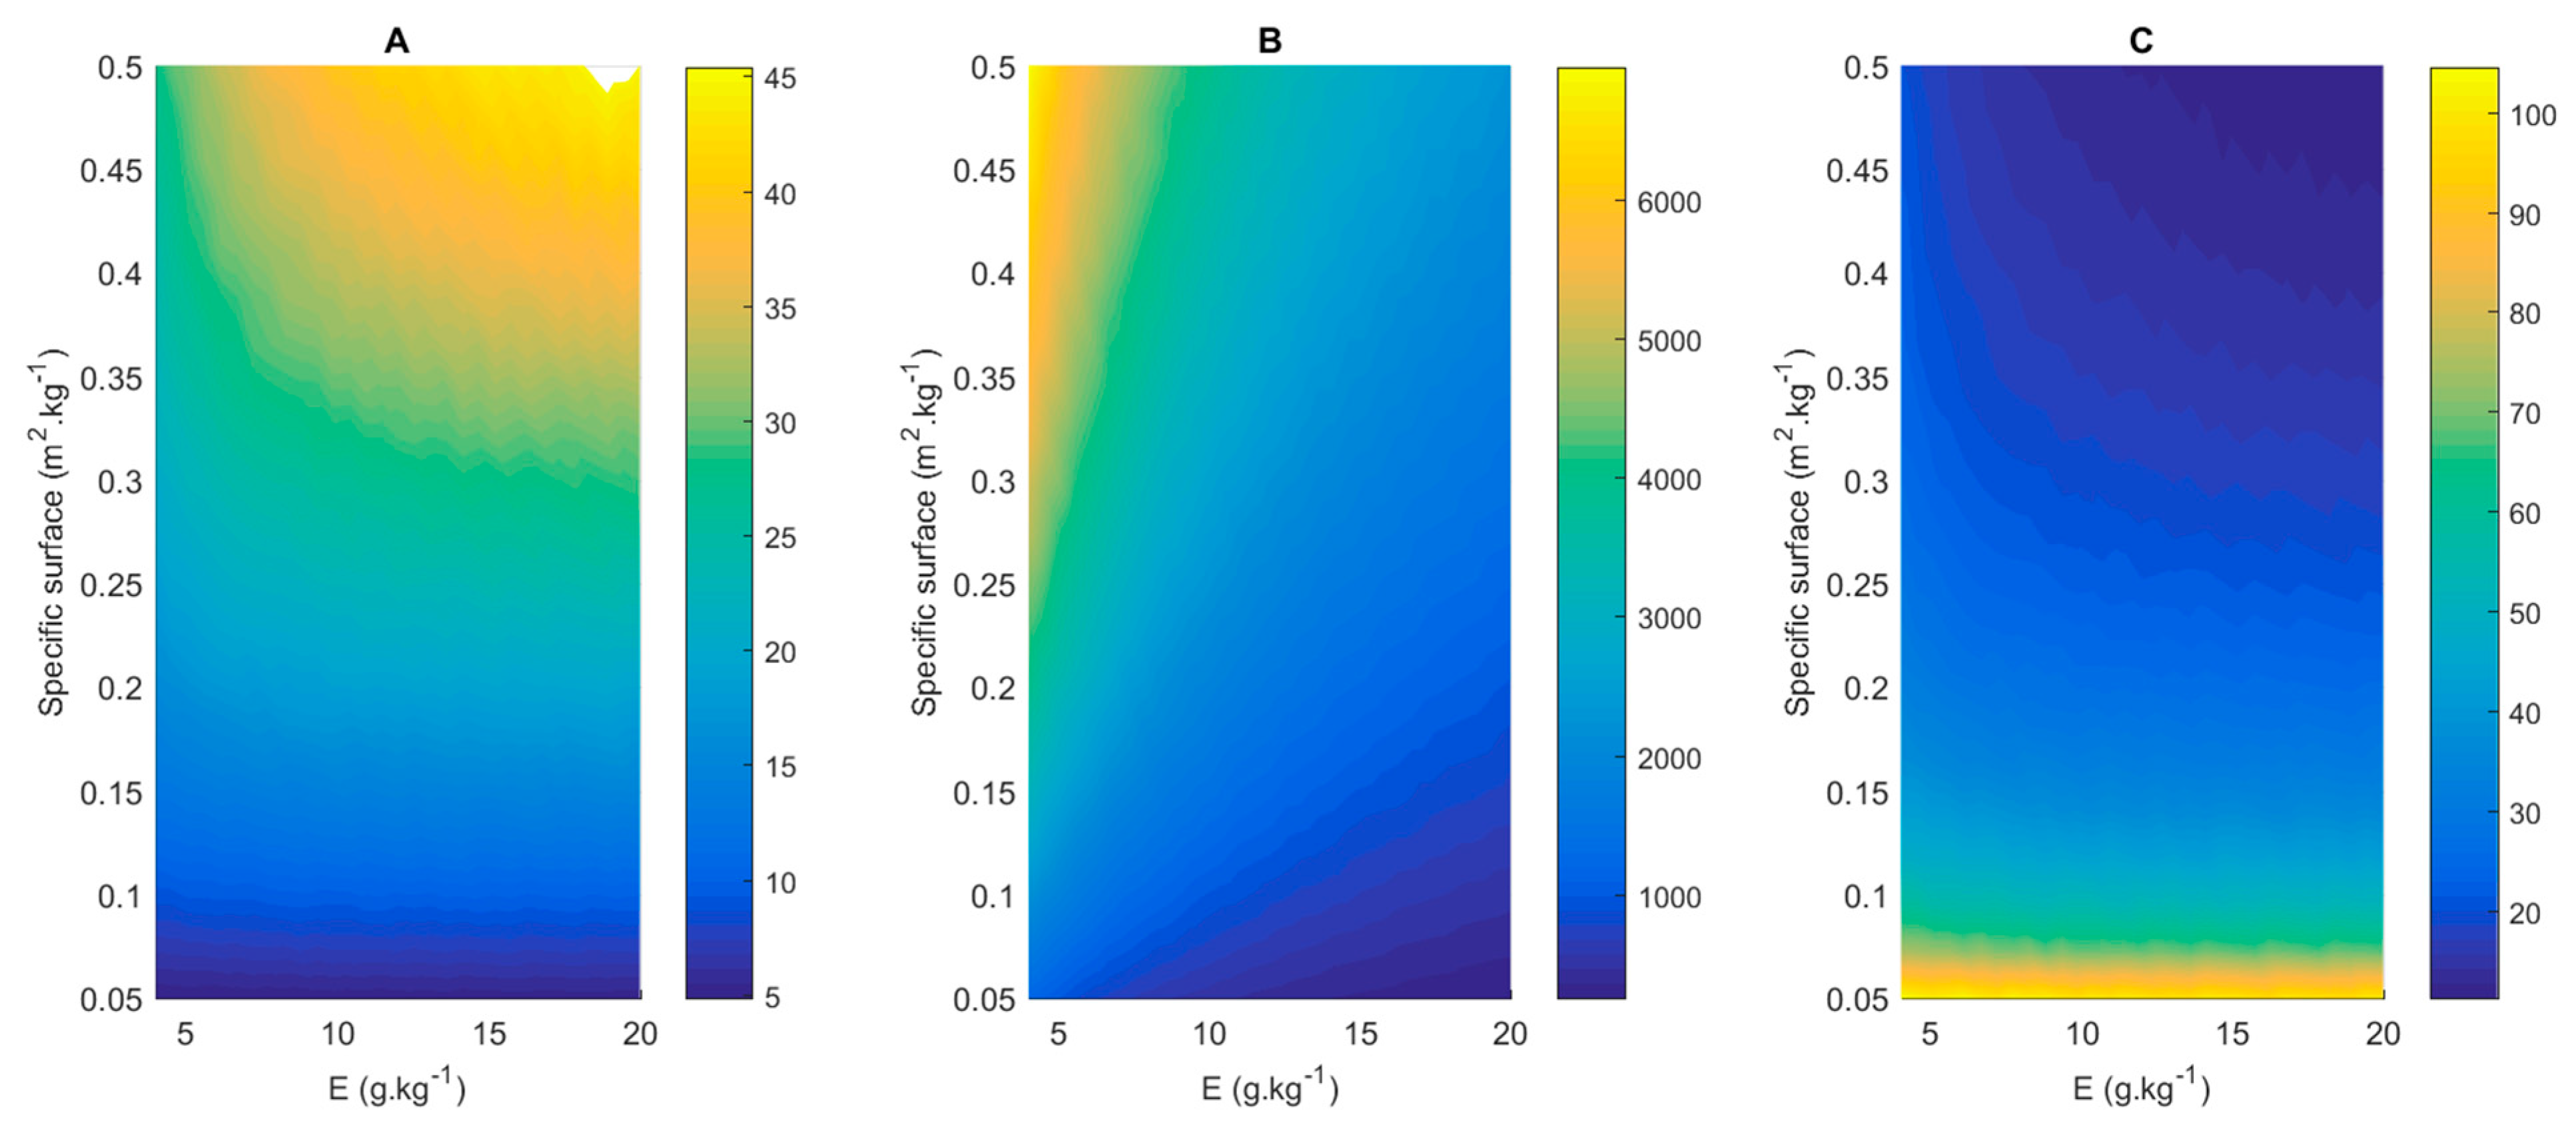
3.5. Effect of Membrane Surface and Enzyme Ratio
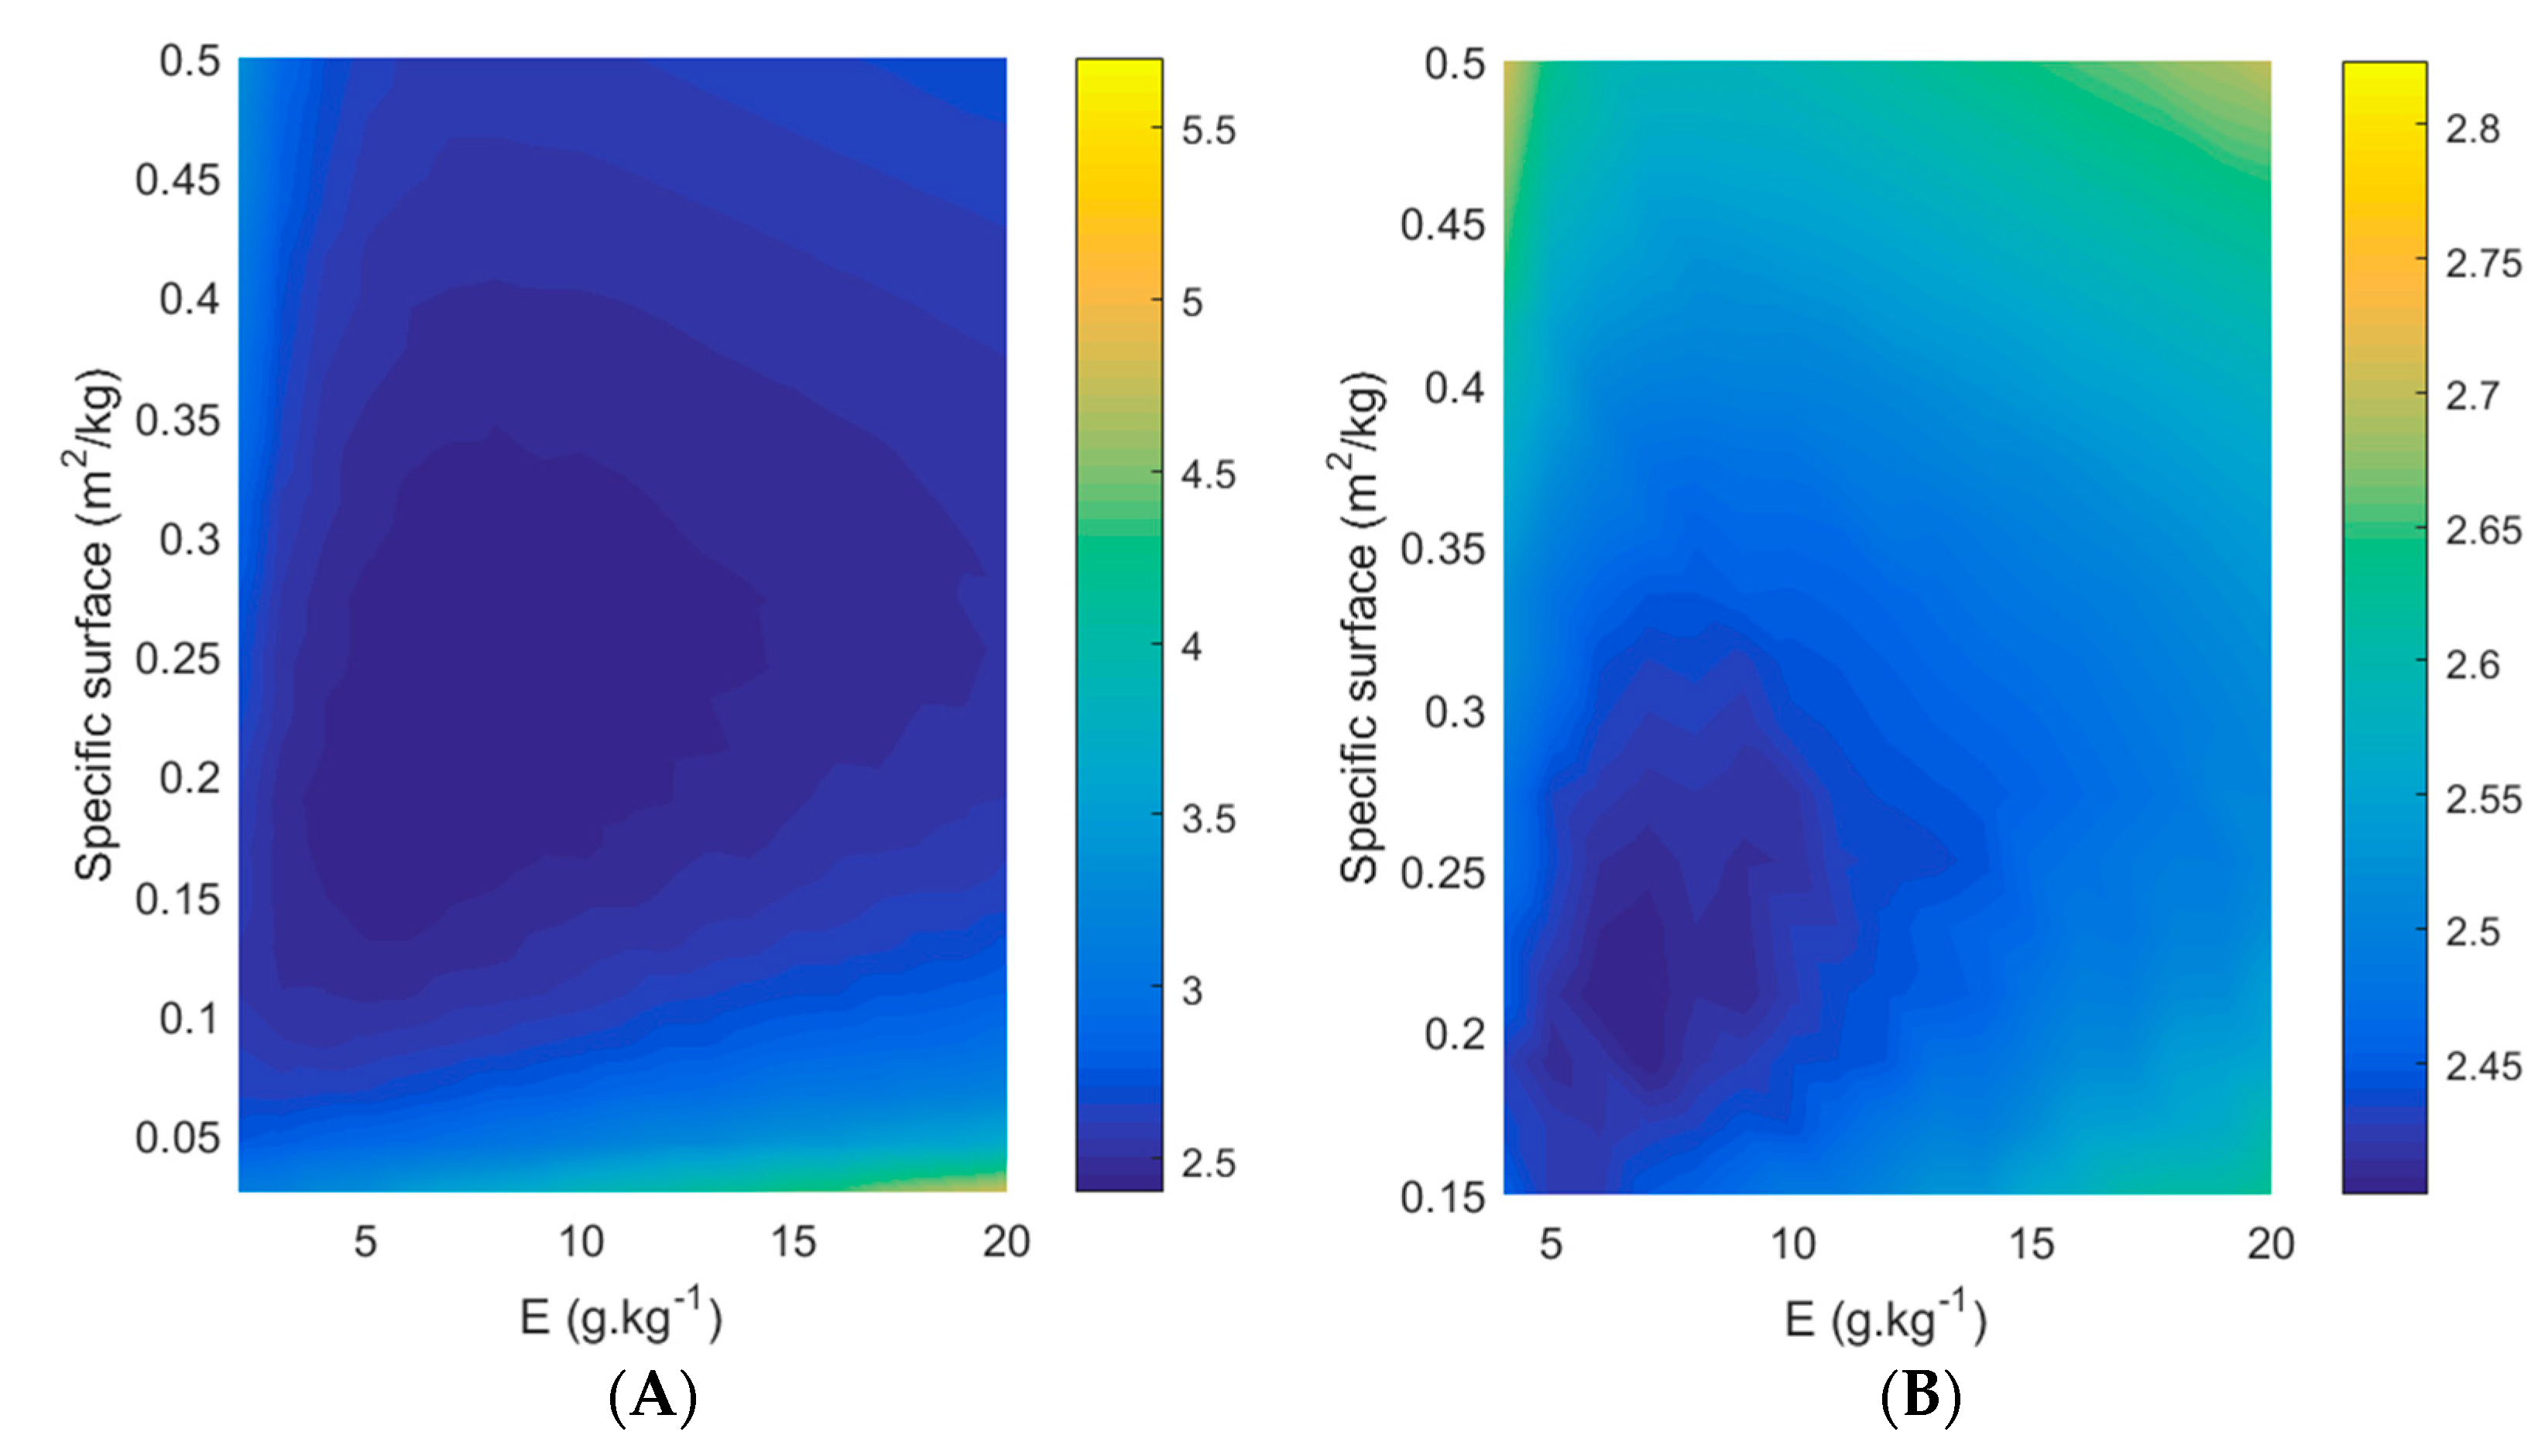
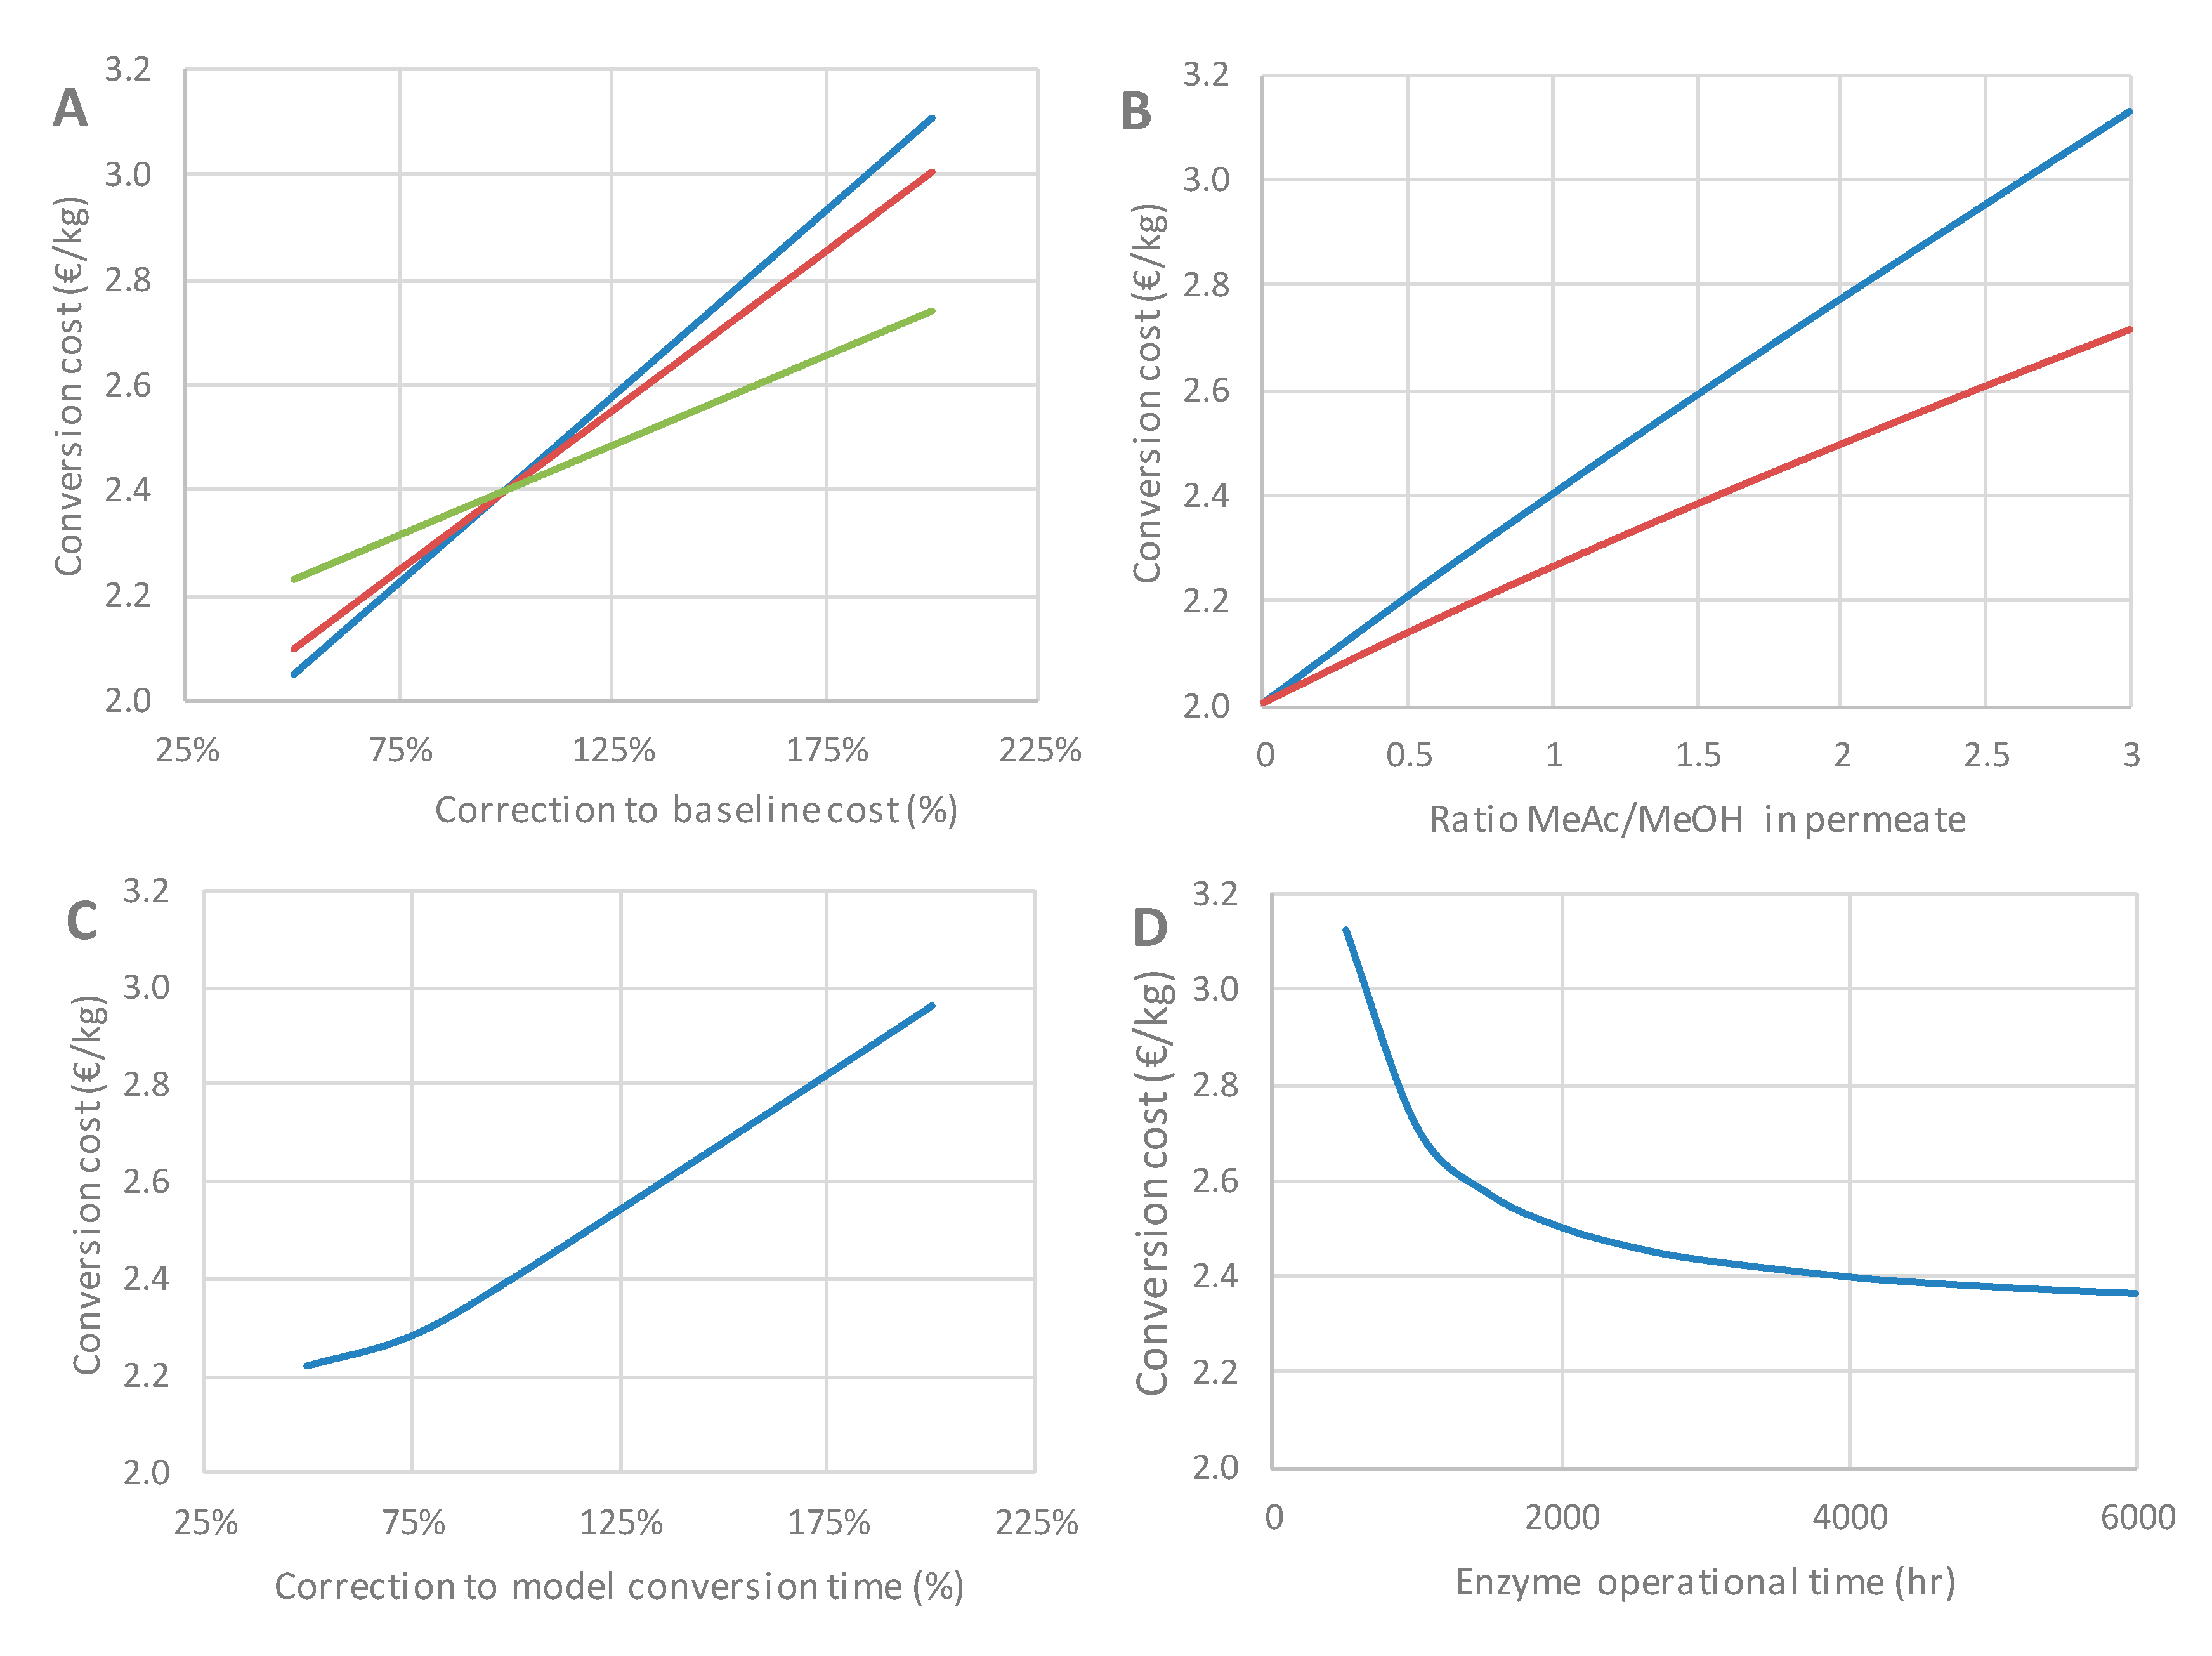
3.6. Techno-Economic Assessment
4. Conclusions
5. Patents
Supplementary Materials
Author Contributions
Funding
Institutional Review Board Statement
Informed Consent Statement
Data Availability Statement
Acknowledgments
Conflicts of Interest
Abbreviations
| APGA | Annual production geranyl acetate (kg year−1) |
| Alcohol concentration (mol kg−1) | |
| Methyl acetate concentration (mol kg−1) | |
| CCAP | Annualized capital investments (EUR year−1) |
| CGER | Geraniol purchase cost (EUR year−1) |
| CL | Labor cost (EUR year−1) |
| CMAC | Methyl acetate purchase cost (EUR year−1) |
| CO&M | Operational expenditures (EUR year−1) |
| Product ester concentration (mol kg−1) | |
| Methanol concentration (mol kg−1) | |
| CCGA | Conversion cost geranyl acetate (EUR kg−1) |
| E | Ratio of catalyst mass to total substrate mass (g g−1) |
| GC-FID | gas chromatography-flame ionization detector |
| GC-MS | gas chromatography-mass spectrometry |
| GUI | graphical user interface |
| ID | Inner diameter (mm) |
| Methyl acetate flux (mol m−2 h−1) | |
| Methanol flux (mol m−2 h−1) | |
| Forward second-order reaction constant (kg mol−1 h−1) | |
| Backward second-order reaction constant (kg mol−1 h−1) | |
| Specific rate constant (kg mol−1 h−1) | |
| Michaelis–Menten constant for alcohol (mol kg−1) | |
| Michaelis–Menten constant for methyl acetate (mol kg−1) | |
| L | Length (mm) |
| LL | Lower limit of the 95% confidence interval for the specific rate constant (kg mol−1 h−1) |
| molar flow rate (mol h−1) | |
| MEHQ | 4-methoxyphenol |
| MW | Molecular weight (g mol−1) |
| OD | Outer diameter (mm) |
| PCGA | Production cost, geranyl acetate (EUR kg−1) |
| PVA | polyvinyl alcohol |
| PTZ | phenothiazine |
| r | Productivity (g kg−1 h−1) |
| S | Exchange surface of the pervaporation membrane (m2) |
| s.c. | supercritical |
| UL | Upper limit of the 95% confidence interval for the specific rate constant (kg mol−1 h−1) |
| mole fraction of component i in the feed | |
| mole fraction of component i in the permeate |
References
- Heeres, A.; Vanbroekhoven, K.; Van Hecke, W. Solvent-free lipase-catalyzed production of (meth)acrylate monomers: Experimental results and kinetic modeling. Biochem. Eng. J. 2019, 142, 162–169. [Google Scholar] [CrossRef]
- Heils, R.; Hu, X.; Liese, A.; Smirnova, I. In situ production and renewal of biocatalytic coatings for use in enzymatic reactive distillation. Chem. Eng. J. 2016, 306, 992–1000. [Google Scholar] [CrossRef]
- Ansorge-Schumacher, M.B.; Thum, O. Immobilised lipases in the cosmetics industry. Chem. Soc. Rev. 2013, 42, 6475–6490. [Google Scholar] [CrossRef] [PubMed]
- Genduso, G.; Luis, P.; Van der Bruggen, B. 19—Pervaporation membrane reactors (PVMRs) for esterification. In Membrane Reactors for Energy Applications and Basic Chemical Production; Basile, A., Di Paola, L., Hai, F.L., Piemonte, V., Eds.; Woodhead Publishing: Sawston, UK, 2015; pp. 565–603. [Google Scholar]
- Wierschem, M.; Schlimper, S.; Heils, R.; Smirnova, I.; Kiss, A.A.; Skiborowski, M.; Lutze, P. Pilot-scale validation of enzymatic reactive distillation for butyl butyrate production. Chem. Eng. J. 2017, 312, 106–117. [Google Scholar] [CrossRef]
- Rathod, A.P.; Wasewar, K.L.; Sonawane, S.S. Enhancement of esterification reaction by pervaporation reactor: An intensifying approach. Procedia Eng. 2013, 51, 330–334. [Google Scholar] [CrossRef]
- Domingues, L.; Recasens, F.; Larrayoz, M. Studies of a pervaporation reactor: Kinetics and equilibrium shift in benzyl alcohol acetylation. Chem. Eng. Sci. 1999, 54, 1461–1465. [Google Scholar] [CrossRef]
- Caro, J.; Noack, M.; Kölsch, P. Zeolite membranes: From the laboratory scale to technical applications. Adsorption 2005, 11, 215–227. [Google Scholar] [CrossRef]
- Caro, J.; Noack, M.; Kölsch, P.; Schäfer, R. Zeolite membranes—State of their development and perspective. Microporous Mesoporous Mater. 2000, 38, 3–24. [Google Scholar] [CrossRef]
- Galiano, F.; Falbo, F.; Figoli, A. Chapter 13—Methanol separation from liquid mixtures via pervaporation using membranes. In Methanol; Basile, A., Dalena, F., Eds.; Elsevier: Amsterdam, The Netherlands, 2018; pp. 361–380. [Google Scholar]
- Bradley, H.C. Some lipase reactions. J. Biol. Chem. 1910, 8, 251–264. [Google Scholar] [CrossRef]
- Gubicza, L.; Kabiri-Badr, A.; Keoves, E.; Belafi-Bako, K. Large-scale enzymatic production of natural flavour esters in organic solvent with continuous water removal. J. Biotechnol. 2000, 84, 193–196. [Google Scholar] [CrossRef]
- Molinari, F.; Villa, R.; Aragozzini, F. Production of geranyl acetate and other acetates by direct esterification catalyzed by mycelium of Rhizopus delemar in organic solvent. Biotechnol. Lett. 1998, 20, 41–44. [Google Scholar] [CrossRef]
- Bourg-Garros, S.; Razafindramboa, N.; Pavia, A.A. Optimization of lipase-catalyzed synthesis of (z)-3-hexen-1-yl acetate by direct esterification in hexane and a solvent-free medium. Enzyme Microb. Technol. 1998, 22, 240–245. [Google Scholar] [CrossRef]
- Fujita, M.; Izato, Y.; Iizuka, Y.; Miyake, A. Thermal hazard evaluation of runaway polymerization of acrylic acid. Process Saf. Environ. 2019, 129, 339–347. [Google Scholar] [CrossRef]
- Levy, L.B. Inhibitor-oxygen interactions in acrylic acid stabilization. Plant Oper. Prog. 1987, 6, 188–189. [Google Scholar] [CrossRef]
- Levy, L.B. Inhibition of acrylic acid polymerization by phenothiazine and p-methoxyphenol. J. Polym. Sci. A Polym. Chem. 1985, 23, 1505–1515. [Google Scholar] [CrossRef]
- Strathmann, H. Membrane process design and operation. In Introduction to Membrane Science and Technology; Wiley-VCH: Weinheim, Germany, 2011; p. 544. [Google Scholar]
- Martin, N. Removal of Methanol by Pervaporation. Available online: https://www.sulzer.com/-/media/files/products/process-techology/processes-and-applications/technicalarticles/2003_01_19_martin_e.ashx?la=en (accessed on 12 April 2021).
- Castro-Muñoz, R.; Galiano, F.; Figoli, A. Chemical and bio-chemical reactions assisted by pervaporation technology. Crit. Rev. Biotechnol. 2019, 39, 884–903. [Google Scholar] [CrossRef]
- Jyoti, G.; Keshav, A.; Anandkumar, J. Review on pervaporation: Theory, membrane performance, and application to intensification of esterification reaction. J. Eng. 2015, 2015. [Google Scholar] [CrossRef]
- Scheper, T.; Beutel, S.; McGuinness, N.; Heiden, S.; Oldiges, M.; Lammers, F.; Reardon, K.F. Digitalization and bioprocessing: Promises and challenges. In Advances in Biochemical Engineering/Biotechnology; Springer: Berlin/Heidelberg, Germany, 2020; pp. 1–13. [Google Scholar]
- Moser, A.; Appl, C.; Brüning, S.; Hass, V.C. Mechanistic mathematical models as a basis for digital twins. In Advances in Biochemical Engineering/Biotechnology; Springer: Berlin/Heidelberg, Germany, 2020; pp. 1–48. [Google Scholar]
- Gargalo, C.L.; de las Heras, S.C.; Jones, M.N.; Udugama, I.; Mansouri, S.S.; Krühne, U.; Gernaey, K.V. Towards the Development of Digital Twins for the Bio-Manufacturing Industry; Springer: Berlin/Heidelberg, Germany, 2020; pp. 1–34. [Google Scholar]
- Ringborg, R.H.; Woodley, J.M. The application of reaction engineering to biocatalysis. React. Chem. Eng. 2016, 1, 10–22. [Google Scholar] [CrossRef]
- 2018 Milestones—Methanol Industry in Focus. 2018. Available online: Methanol.org (accessed on 1 April 2021).
- Sah, A.; Castricum, H.L.; Vente, J.F.; Blank, D.H.A.; ten Elshof, J.E. Microporous Molecular Separation Membrane With High Hydrothermal Stability. EP1976621B1, 5 October 2016. [Google Scholar]
- Gorri, D.; Ibáñez, R.; Ortiz, I. Comparative study of the separation of methanol–methyl acetate mixtures by pervaporation and vapor permeation using a commercial membrane. J. Membr. Sci. 2006, 280, 582–593. [Google Scholar] [CrossRef]
- Seider, W.D.; Seader, J.D.; Lewin, D.R. Cost accounting and capital cost estimation. In Product & Process Design Principles; Wiley: Hoboken, NJ, USA, 2003. [Google Scholar]
- Van Dael, M.; Kuppens, T.; Lizin, S.; Van Passel, S. Techno-economic assessment methodology for ultrasonic production of biofuels. In Production of Biofuels and Chemicals with Ultrasound; Fang, Z., Smith, J.R.L., Qi, X., Eds.; Springer: Dordrecht, The Netherlands, 2015; pp. 317–345. [Google Scholar]
- Towler, G.; Sinnott, R. Chemical Engineering Design: Principles, Practice and Economics of Plant and Process Design; Butterworth-Heinemann: Oxford, UK, 2012. [Google Scholar]
- Peters, M.; Timmerhaus, K.; West, R. Plant Design and Economics for Chemical Engineers, 5th ed.; McGraw-Hill Education: New York, NY, USA, 2003. [Google Scholar]
- Claon, P.A.; Akoh, C.C. Enzymatic synthesis of geranyl acetate in n-hexane with Candida antarctica lipases. J. Am. Oil Chem. Soc. 1994, 71, 575–578. [Google Scholar] [CrossRef]
- Yee, L.N.; Akoh, C.C. Enzymatic synthesis of geranyl acetate by transesterification with acetic anhydride as acyl donor. J. Am. Oil Chem. Soc. 1996, 73, 1379–1384. [Google Scholar] [CrossRef]
- Peres, C.; Gomes da Silva, M.D.R.; Barreiros, S. Water activity effects on geranyl acetate synthesis catalyzed by novozym in supercritical ethane and in supercritical carbon dioxide. J. Agric. Food Chem. 2003, 51, 1884–1888. [Google Scholar] [CrossRef]
- Deltamem AG. Available online: https://www.deltamem.ch/pervaporation.html (accessed on 25 March 2021).
- Van Hecke, W.; Elslander, H.; Vanbroekhoven, K.; De Wever, H.; Beckers, H. Method and Apparatus for In Situ Product Recovery. EP3679150A1, 15 July 2020. [Google Scholar]
- AmberLyst™ Polymeric Catalysts. Available online: https://www.dupont.com/content/dam/dupont/amer/us/en/water-solutions/public/documents/en/45-D01063-en.pdf (accessed on 1 April 2021).
- Luis, P.; Degrève, J.; der Bruggen, B.V. Separation of methanol–n-butyl acetate mixtures by pervaporation: Potential of 10 commercial membranes. J. Membr. Sci. 2013, 429, 1–12. [Google Scholar] [CrossRef]
- Seider, W.D.; Seader, J.D.; Lewin, D.R. Reactor-separator-recycle networks. In Product and Process Design Principles: Synthesis, Analysis and Design, 2nd ed.; Wiley: Hoboken, NJ, USA, 2003. [Google Scholar]
- Technical Data Sheet—Methyl Acetate-Methanol Mixture. Available online: https://www.synthomer.com/pkt/pdf_3.php?ProdId=3050&TdsId=61076&template_id=3&ProdBez=METHYL%20ACETATE-METHANOL%20MIXTURE#:~:text=Technical%20Data%20Sheet-,METHYL%20ACETATE%2DMETHANOL%20MIXTURE,acetic%20acid%20whilst%20recovering%20methanol (accessed on 31 March 2021).
- Graczová, E.; Šulgan, B.; Barabas, S.; Steltenpohl, P. Methyl acetate–methanol mixture separation by extractive distillation: Economic aspects. Front. Chem. Sci. Eng. 2018, 12, 670–682. [Google Scholar] [CrossRef]
- Wernicke, H.-J.; Plass, L.; Schmidt, F. Methanol generation. In Methanol: The Basic Chemical and Energy Feedstock of the Future; Springer: New York, NY, USA, 2014; pp. 51–301. [Google Scholar]


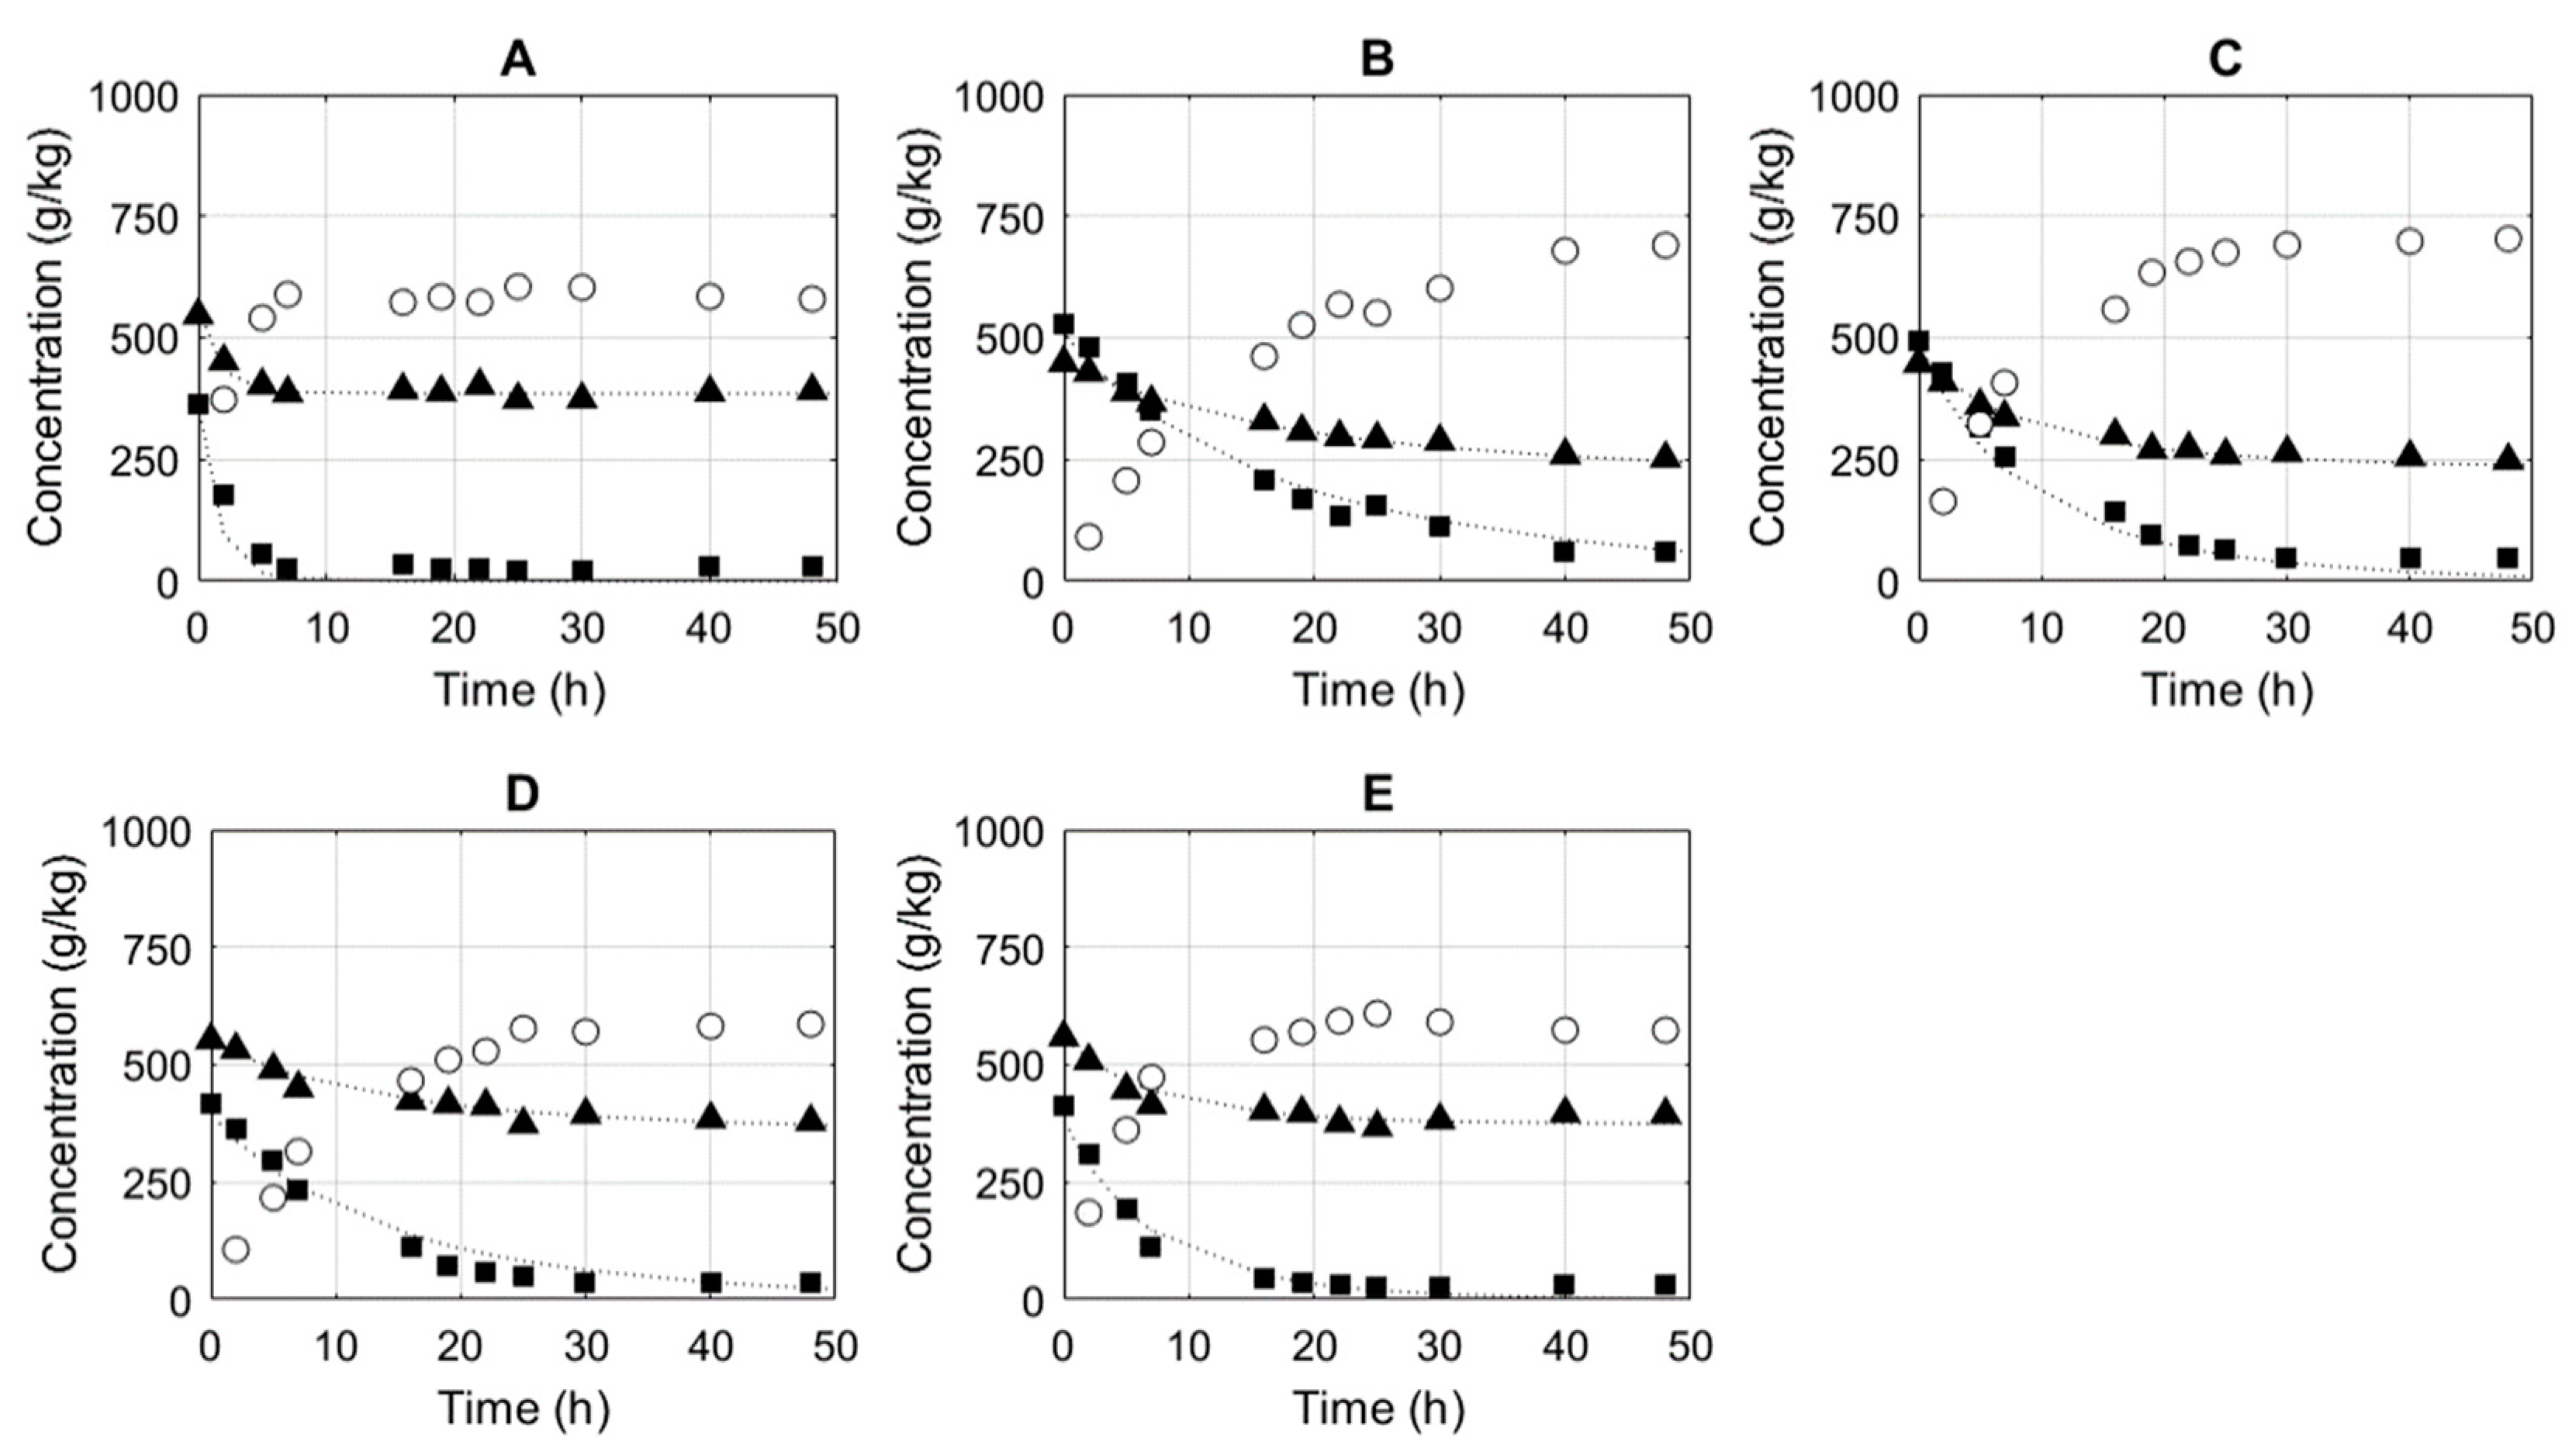
 E = 2 g kg−1;
  E = 5 g kg−1;
  E = 10 g kg−1;
  E = 20 g kg−1.
E = 2 g kg−1; E = 5 g kg−1; E = 10 g kg−1; E = 20 g kg−1.
E = 20 g kg−1.
E = 2 g kg−1; E = 5 g kg−1; E = 10 g kg−1; E = 20 g kg−1.
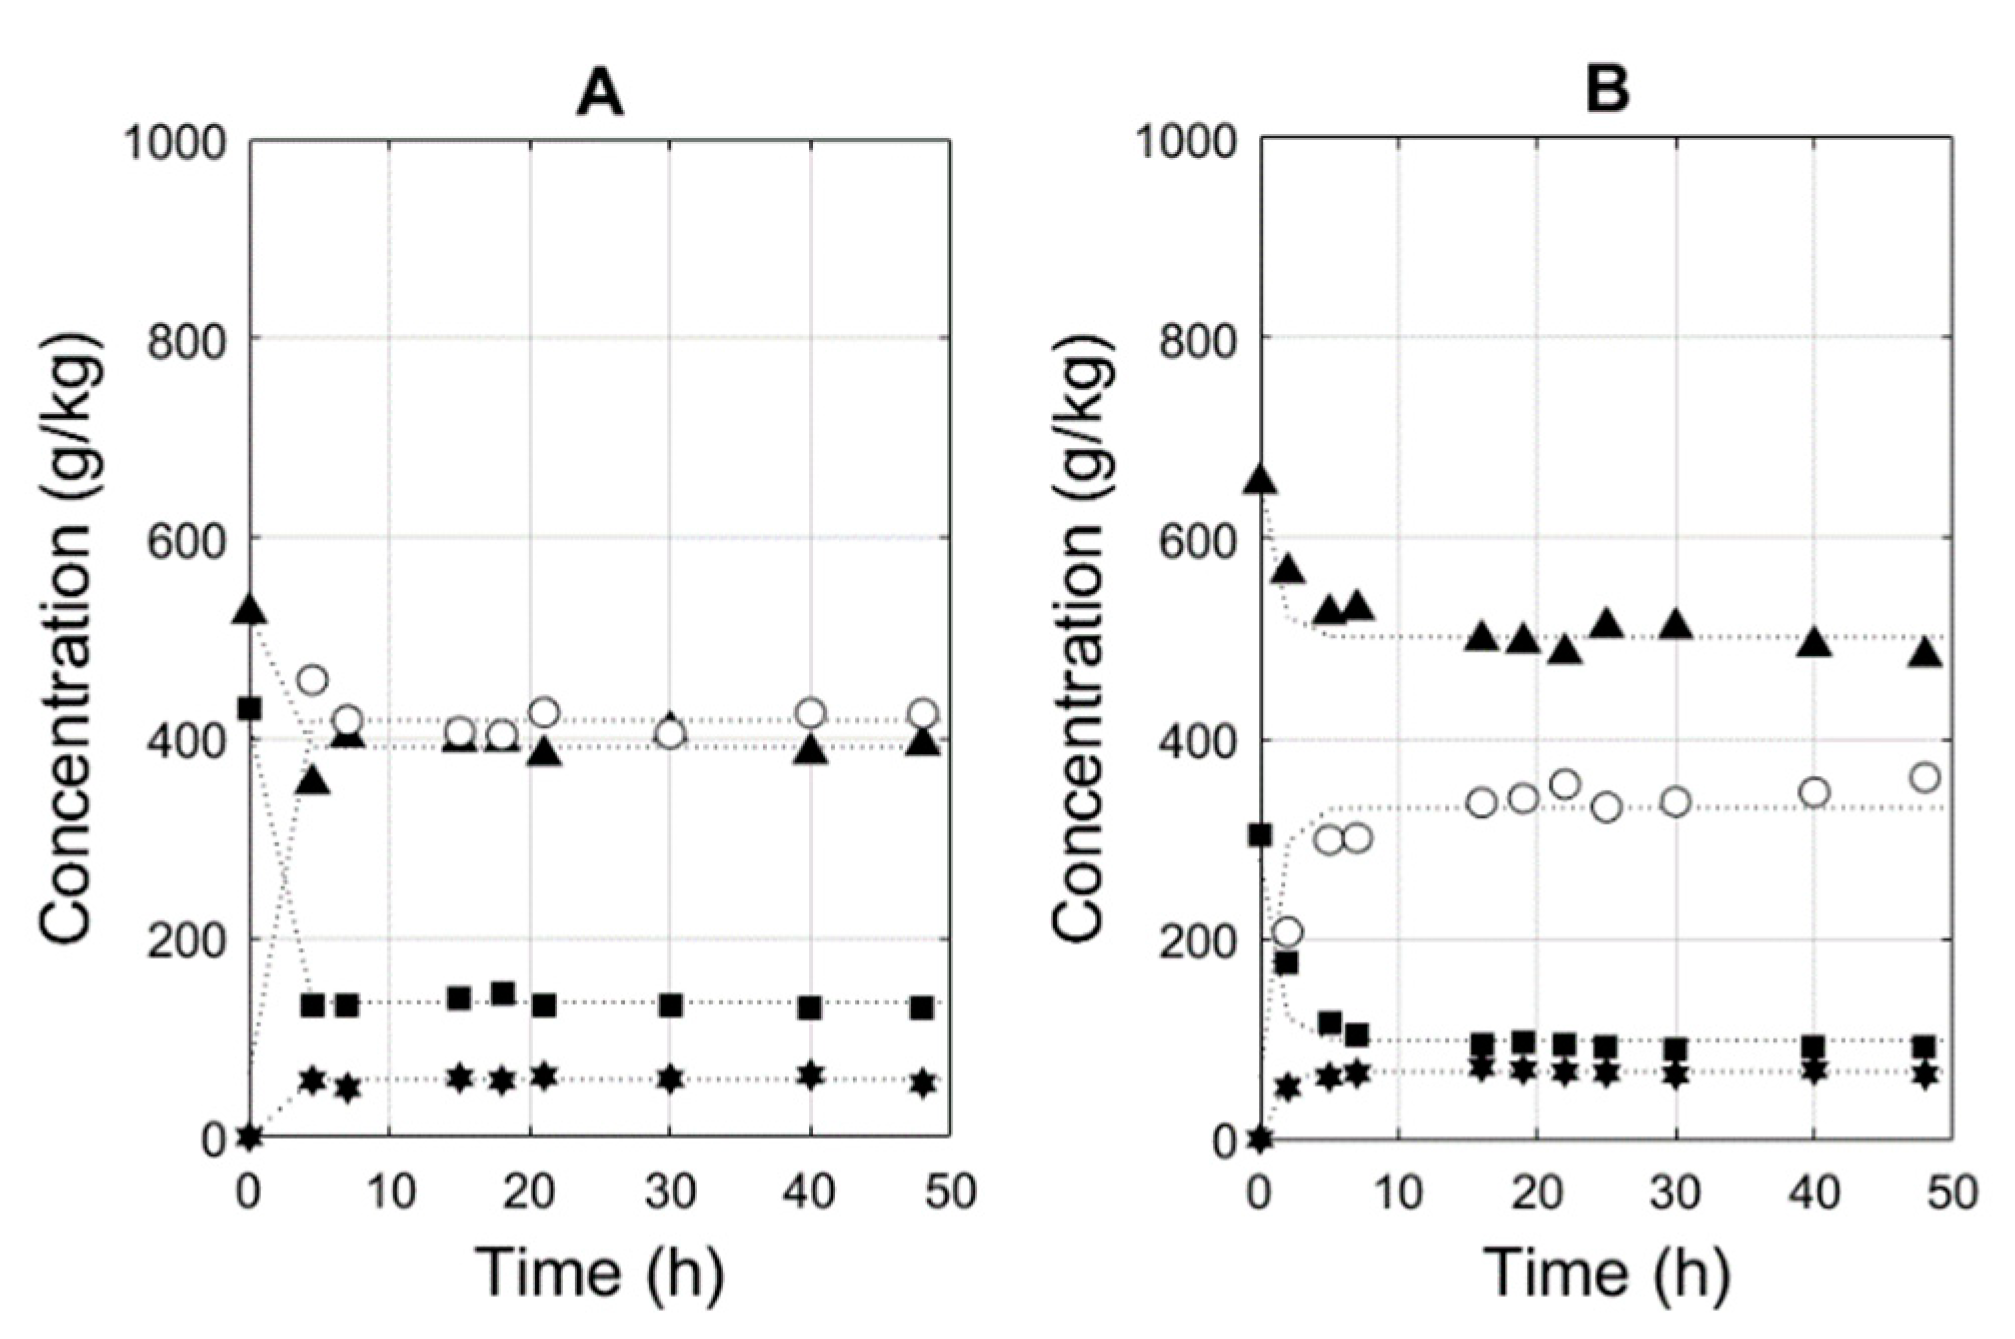
 Reactor;
  Vacuum pump;
  Membrane module. Plot (B): no methyl acetate recovery; full methyl acetate recovery.
Reactor; Vacuum pump; Membrane module. Plot (B): no methyl acetate recovery; full methyl acetate recovery.
Membrane module. Plot (B): no methyl acetate recovery; full methyl acetate recovery.
Reactor; Vacuum pump; Membrane module. Plot (B): no methyl acetate recovery; full methyl acetate recovery.

| Component A | Component B | k1 kg/(mol·h) | CI LL kg/(mol·h) | CI UL kg/(mol·h) | Source |
|---|---|---|---|---|---|
| Geraniol | Methyl acetate | 10.3 | 9.61 | 10.99 | This study |
| Prenol | Methyl acetate | 7.29 | 6.35 | 8.23 | This study |
| Tetrahydrofurfuryl alcohol | Methyl acrylate | 1.69 | 1.26 | 1.71 | [1] |
| Citronellol | Methyl acrylate | 1.31 | 1.18 | 1.45 | [1] |
| Tetrahydrofurfuryl alcohol | Methyl methacrylate | 0.35 | 0.31 | 0.38 | [1] |
| Component A | Component B | k2 kg/(mol·h) | CI LL kg/(mol·h) | CI UL kg/(mol·h) | Source |
|---|---|---|---|---|---|
| Geraniol | Methyl acetate | 12.45 | 11.01 | 13.90 | This study |
| Prenol | Methyl acetate | 10.30 | 8.87 | 11.73 | This study |
| Study | Geraniol | Conversion | Lipase | Solvent |
|---|---|---|---|---|
| Claon and Akoh (1994) [33] | 0.12 M | Up to 99% | C. antarctica lipases (SP382 and SP435) | n-hexane |
| Yee and Akoh (1996) [34] | 0.1 M | Up to 97% | Pseudomonas sp. lipase | n-hexane |
| Molinari et al. (1998) [13] | 0.11 M | 55% | Dry mycelium of Rhizopus delemar MIM | n-heptane |
| Peres et al. (2003) [35] | 0.2 M | 100% | Novozym 435 | sc. Ethane and CO2 |
| This study | 3.2 mol/kg | >98% | Novozym 435 | solventless |
| Parameter | Unit | Baseline | High Enzyme | Low Surface |
|---|---|---|---|---|
| Enzyme loading | g/kg initial substrate | 7 | 30 | 7 |
| Membrane surface | m2/kg initial substrate | 0.191 | 0.191 | 0.026 |
| Conversion time | h | 26 | 23 | 163 |
| Number of batches | # | 279 | 307 | 51 |
| Geraniol (input) | ton/year | 79 | 79 | 79 |
| Methyl acetate (input) | ton/year | 151 | 151 | 151 |
| Novozyme | ton/year | 0.01 | 0.04 | 0.07 |
| Reactor size | m3 | 0.90 | 0.82 | 4.90 |
| Membrane area | m2 | 157 | 143 | 118 |
| Ratio membrane size/reactor size | m2/m3 | 175 | 175 | 24 |
| Geranyl acetate (output) | ton/year | 100 | 100 | 100 |
| Enzyme costs | EUR/year | 10,356 | 39,363 | 65,640 |
| Membrane cost (annualized) | EUR/year | 22,614 | 20,553 | 16,958 |
| Total CAPEX cost (annualized) | EUR/year | 163,599 | 165,068 | 207,924 |
| Conversion cost | EUR/kg ester | 2.4 | 2.7 | 3.6 |
Publisher’s Note: MDPI stays neutral with regard to jurisdictional claims in published maps and institutional affiliations. |
© 2021 by the authors. Licensee MDPI, Basel, Switzerland. This article is an open access article distributed under the terms and conditions of the Creative Commons Attribution (CC BY) license (https://creativecommons.org/licenses/by/4.0/).
Share and Cite
Van Hecke, W.; Debergh, P.; Khan, M.N.; Van Dael, M. Rational Design Method Based on Techno-Economic Principles for Integration of Organic/Organic Pervaporation with Lipase Catalyzed Transesterification. Membranes 2021, 11, 407. https://doi.org/10.3390/membranes11060407
Van Hecke W, Debergh P, Khan MN, Van Dael M. Rational Design Method Based on Techno-Economic Principles for Integration of Organic/Organic Pervaporation with Lipase Catalyzed Transesterification. Membranes. 2021; 11(6):407. https://doi.org/10.3390/membranes11060407
Chicago/Turabian StyleVan Hecke, Wouter, Pieterjan Debergh, Mohammed Nazeer Khan, and Miet Van Dael. 2021. "Rational Design Method Based on Techno-Economic Principles for Integration of Organic/Organic Pervaporation with Lipase Catalyzed Transesterification" Membranes 11, no. 6: 407. https://doi.org/10.3390/membranes11060407
APA StyleVan Hecke, W., Debergh, P., Khan, M. N., & Van Dael, M. (2021). Rational Design Method Based on Techno-Economic Principles for Integration of Organic/Organic Pervaporation with Lipase Catalyzed Transesterification. Membranes, 11(6), 407. https://doi.org/10.3390/membranes11060407