The Peroxidatic Thiol of Peroxiredoxin 1 is Nitrosated by Nitrosoglutathione but Coordinates to the Dinitrosyl Iron Complex of Glutathione


Abstract
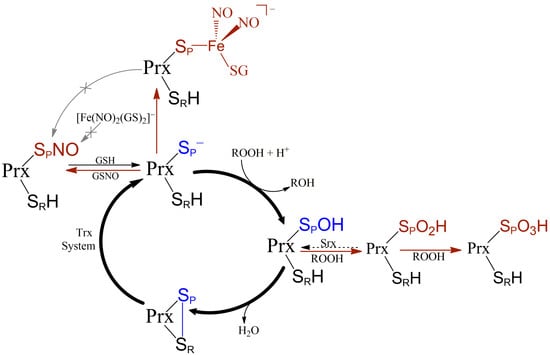
1. Introduction
2. Materials and Methods
2.1. Expression and Purification of Recombinant Proteins
2.2. Prx1 and Prx2 Thiol Reduction
2.3. Quantification of Prx1 Thiol Groups
2.4. Quantification of NO● and NO●-Derived Products
2.5. Kinetic Studies of Prx1 S-Nitrosation by GSNO
2.6. Kinetic Studies of Prx1 S-Denitrosation by GSH
2.7. Prx1 Thiol Alkylation and Prx1 His Ethoxyformylation
2.8. Prx1 Peroxidase Activity Assay
2.9. Dinitrosyl Iron Complex of GSH (DNIC-GS) Synthesis
2.10. Kinetics of Conversion of B-DNIC-GS into M-DNIC-GS
2.11. Electon Paramagnetic Ressonance (EPR)
3. Results
3.1. Kinetics and Products of the Reaction of Prx1 with GSNO
3.2. Kinetics of Prx1 S-Denitrosation
3.3. Interaction of Prx1 with DNIC-GS

3.4. Prx1 Residues Involved in the Coordination to DNIC-GS
3.5. Kinetics of the Cys52-Px1 Binding to DNIC-GS
3.6. Evaluation of DNIC-GS and DNIC-Prx1 as Nitrosating Agents
4. Discussion
5. Conclusions
Supplementary Materials
Author Contributions
Funding
Conflicts of Interest
References
- Hess, D.T.; Matsumoto, A.; Kim, S.-O.; Marshall, H.E.; Stamler, J.S. Protein S-nitrosylation: Purview and parameters. Nat. Rev. Mol. Cell Biol. 2005, 6, 150–166. [Google Scholar] [CrossRef] [PubMed]
- Anand, P.; Stamler, J.S. Enzymatic mechanisms regulating protein S-nitrosylation: Implications in health and disease. J. Mol. Med. 2012, 90, 233–244. [Google Scholar] [CrossRef] [PubMed]
- Nakamura, T.; Lipton, S.A. Protein S-Nitrosylation as a Therapeutic Target for Neurodegenerative Diseases. Trends Pharmacol. Sci. 2016, 37, 73–84. [Google Scholar] [CrossRef] [PubMed]
- Wolhuter, K.; Whitwell, H.J.; Switzer, C.H.; Burgoyne, J.R.; Timms, J.F.; Eaton, P. Evidence against stable protein S-Nitrosylation as a widespread mechanism of post-translational regulation. Mol. Cell 2018, 69, 438–450. [Google Scholar] [CrossRef] [PubMed]
- Toledo, J.C., Jr.; Augusto, O. Connecting the chemical and biological properties of nitric oxide. Chem. Res. Toxicol. 2012, 25, 975–989. [Google Scholar] [CrossRef]
- Broniowska, K.A.; Hogg, N. The chemical biology of S-nitrosothiols. Antioxid. Redox Signal. 2012, 17, 969–980. [Google Scholar] [CrossRef]
- Jia, L.; Bonaventura, C.; Bonaventura, J.; Stamler, J.S. S-nitrosohaemoglobin: A dynamic activity of blood involved in vascular control. Nature 1996, 380, 221–226. [Google Scholar] [CrossRef]
- Weichsel, A.; Maes, E.M.; Andersen, J.F.; Valenzuela, J.G.; Shokhireva, T.K.; Walker, F.A.; Montfort, W.R. Heme-assisted S-nitrosation of a proximal thiolate in a nitric oxide transport protein. Proc. Natl. Acad. Sci. USA 2005, 102, 594–599. [Google Scholar] [CrossRef]
- Boese, M.; Mordvintcev, P.; Vanin, A.; Busse, R.; Mulsch, A. S-nitrosation of serum-albumin by dinitrosyl-iron complex. J. Biol. Chem. 1995, 270, 29244–29249. [Google Scholar] [CrossRef]
- Bosworth, C.A.; Toledo, J.C.; Zmijewski, J.W.; Li, Q.; Lancaster, J.R. Dinitrosyliron complexes and the mechanism(s) of cellular protein nitrosothiol formation from nitric oxide. Proc. Natl. Acad. Sci. USA 2009, 106, 4671–4676. [Google Scholar] [CrossRef]
- Hickok, J.R.; Sahni, S.; Shen, H.; Arvind, A.; Antoniou, C.; Fung, L.W.M.; Thomas, D.D. Dinitrosyliron complexes are the most abundant nitric oxide-derived cellular adduct: Biological parameters of assembly and disappearance. Free Radic. Biol. Med. 2011, 51, 1558–1566. [Google Scholar] [CrossRef] [PubMed]
- Rhee, S.G.; Woo, H.A.; Kil, I.S.; Bae, S.H. Peroxiredoxin functions as a peroxidase and a regulator and sensor of local peroxides. J. Biol. Chem. 2012, 287, 4403–4410. [Google Scholar] [CrossRef] [PubMed]
- Perkins, A.; Nelson, K.J.; Parsonage, D.; Poole, L.B.; Karplus, P.A. Peroxiredoxins: Guardians against oxidative stress and modulators of peroxide signaling. Trends Biochem. Sci. 2015, 40, 435–445. [Google Scholar] [CrossRef] [PubMed]
- Netto, L.E.S.; Antunes, F. The Roles of Peroxiredoxin and Thioredoxin in Hydrogen Peroxide Sensing and in Signal Transduction. Mol. Cells 2016, 39, 65–71. [Google Scholar] [PubMed]
- Wood, Z.A.; Schröder, E.; Robin Harris, J.; Poole, L.B. Structure, mechanism and regulation of peroxiredoxins. Trends Biochem. Sci. 2003, 28, 32–40. [Google Scholar] [CrossRef]
- Barranco-Medina, S.; Lázaro, J.-J.; Dietz, K.-J. The oligomeric conformation of peroxiredoxins links redox state to function. FEBS Lett. 2009, 583, 1809–1816. [Google Scholar] [CrossRef]
- Tairum, C.A.; Santos, M.C.; Breyer, C.A.; Geyer, R.R.; Nieves, C.J.; Portillo-Ledesma, S.; Ferrer-Sueta, G.; Toledo, J.C.; Toyama, M.H.; Augusto, O.; et al. Catalytic Thr or Ser Residue Modulates Structural Switches in 2-Cys Peroxiredoxin by Distinct Mechanisms. Sci. Rep. 2016, 6, 33133. [Google Scholar] [CrossRef]
- Bolduc, J.A.; Nelson, K.J.; Haynes, A.C.; Lee, J.; Reisz, J.A.; Graff, A.H.; Clodfelter, J.E.; Parsonage, D.; Poole, L.B.; Furdui, C.M.; et al. Novel hyperoxidation resistance motifs in 2-Cys peroxiredoxins. J. Biol. Chem. 2018, 293, 11901–11912. [Google Scholar] [CrossRef]
- Veal, E.A.; Underwood, Z.E.; Tomalin, L.E.; Morgan, B.A.; Pillay, C.S. Hyperoxidation of peroxiredoxins: Gain or loss of function? Antioxid. Redox Signal. 2018, 28, 574–590. [Google Scholar] [CrossRef]
- Martínez-Ruiz, A.; Lamas, S. Detection and proteomic identification of S-nitrosylated proteins in endothelial cells. Arch. Biochem. Biophys. 2004, 423, 192–199. [Google Scholar] [CrossRef]
- Forrester, M.T.; Thompson, J.W.; Foster, M.W.; Nogueira, L.; Moseley, M.A.; Stamler, J.S. Proteomic analysis of S-nitrosylation and denitrosylation by resin-assisted capture. Nat. Biotechnol. 2009, 27, 557–559. [Google Scholar] [CrossRef] [PubMed]
- Wu, C.; Liu, T.; Chen, W.; Oka, S.; Fu, C.; Jain, M.R.; Parrott, A.M.; Baykal, A.T.; Sadoshima, J.; Li, H. Redox Regulatory Mechanism of Transnitrosylation by Thioredoxin. Mol. Cell. Proteom. 2010, 9, 2262–2275. [Google Scholar] [CrossRef] [PubMed]
- Engelman, R.; Weisman-Shomer, P.; Ziv, T.; Xu, J.; Arnér, E.S.J.; Benhar, M. Multilevel regulation of 2-Cys peroxiredoxin reaction cycle by S-nitrosylation. J. Biol. Chem. 2013, 288, 11312–11324. [Google Scholar] [CrossRef]
- Chung, M.-C.; Alem, F.; Hamer, S.G.; Narayanan, A.; Shatalin, K.; Bailey, C.; Nudler, E.; Hakami, R.M. S-nitrosylation of peroxiredoxin 1 contributes to viability of lung epithelial cells during Bacillus anthracis infection. Biochim. Biophys. Acta Gen. Subj. 2017, 1861, 3019–3029. [Google Scholar] [CrossRef] [PubMed]
- Fang, J.; Nakamura, T.; Cho, D.-H.; Gu, Z.; Lipton, S.A. S-nitrosylation of peroxiredoxin 2 promotes oxidative stress-induced neuronal cell death in Parkinson’s disease. Proc. Natl. Acad. Sci. USA 2007, 104, 18742–18747. [Google Scholar] [CrossRef] [PubMed]
- Broniowska, K.A.; Diers, A.R.; Hogg, N. S-nitrosoglutathione. Biochim. Biophys. Acta 2013, 1830, 3173–3181. [Google Scholar] [CrossRef] [PubMed]
- Ogusucu, R.; Rettori, D.; Munhoz, D.C.; Netto, L.E.S.; Augusto, O. Reactions of yeast thioredoxin peroxidases I and II with hydrogen peroxide and peroxynitrite: Rate constants by competitive kinetics. Free Radic. Biol. Med. 2007, 42, 326–334. [Google Scholar] [CrossRef] [PubMed]
- Kang, S.W.; Chae, H.Z.; Seo, M.S.; Kim, K.; Baines, I.C.; Rhee, S.G. Mammalian peroxiredoxin isoforms can reduce hydrogen peroxide generated in response to growth factors and tumor necrosis factor-α. J. Biol. Chem. 1998, 273, 6297–6302. [Google Scholar] [CrossRef]
- Nagy, P.; Karton, A.; Betz, A.; Peskin, A.V.; Pace, P.; O’Reilly, R.J.; Hampton, M.B.; Radom, L.; Winterbourn, C.C. Model for the exceptional reactivity of peroxiredoxins 2 and 3 with hydrogen peroxide: A kinetic and computational study. J. Biol. Chem. 2011, 286, 18048–18055. [Google Scholar] [CrossRef]
- Truzzi, D.R.; Coelho, F.R.; Paviani, V.; Alves, S.V.; Netto, L.E.S.; Augusto, O. The bicarbonate/carbon dioxide pair increases hydrogen peroxide-mediated hyperoxidation of human peroxiredoxin 1. J. Biol. Chem. 2019, 294, 14055–14067. [Google Scholar] [CrossRef]
- de Oliveira, M.A.; Discola, K.F.; Alves, S.V.; Barbosa, J.A.R.G.; Medrano, F.J.; Netto, L.E.S.; Guimarães, B.G. Crystallization and preliminary X-ray diffraction analysis of NADPH-dependent thioredoxin reductase I from Saccharomyces cerevisiae. Acta Crystallogr. Sect. F Struct. Biol. Cryst. Commun. 2005, 61, 387–390. [Google Scholar] [CrossRef] [PubMed]
- Gasteiger, E.; Gattiker, A.; Hoogland, C.; Ivanyi, I.; Appel, R.D.; Bairoch, A. ExPASy: the proteomics server for in-depth protein knowledge and analysis. Nucleic Acids Res. 2003, 31, 3784–3788. [Google Scholar] [CrossRef] [PubMed]
- Grassetti, D.R.; Murray, J.F. Determination of sulfhydryl groups with 2,2′- or 4,4′-dithiodipyridine. Arch. Biochem. Biophys. 1967, 119, 41–49. [Google Scholar] [CrossRef]
- Feelisch, M.; Rassaf, T.; Mnaimneh, S.; Singh, N.; Bryan, N.S.; Jourd’Heuil, D.; Kelm, M. Concomitant S-, N-, and heme-nitros(yl)ation in biological tissues and fluids: Implications for the fate of NO in vivo. FASEB J. 2002, 16, 1775–1785. [Google Scholar] [CrossRef] [PubMed]
- Keszler, A.; Diers, A.R.; Ding, Z.; Hogg, N. Thiolate-based dinitrosyl iron complexes: Decomposition and detection and differentiation from S-nitrosothiols. Nitric Oxide 2017, 65, 1–9. [Google Scholar] [CrossRef] [PubMed]
- Green, L.C.; Wagner, D.A.; Glogowski, J.; Skipper, P.L.; Wishnok, J.S.; Tannenbaum, S.R. Analysis of nitrate, nitrite, and [15N]nitrate in biological fluids. Anal. Biochem. 1982, 126, 131–138. [Google Scholar] [CrossRef]
- Monteiro, G.; Horta, B.B.; Pimenta, D.C.; Augusto, O.; Netto, L.E.S. Reduction of 1-Cys peroxiredoxins by ascorbate changes the thiol-specific antioxidant paradigm, revealing another function of vitamin C. Proc. Natl. Acad. Sci. USA 2007, 104, 4886–4891. [Google Scholar] [CrossRef]
- Stamler, J.S.; Simon, D.I.; Osborne, J.A.; Mullins, M.E.; Jaraki, O.; Michel, T.; Singel, D.J.; Loscalzo, J. S-nitrosylation of proteins with nitric-oxide—Synthesis and characterization of biologically-active compounds. Proc. Natl. Acad. Sci. USA 1992, 89, 444–448. [Google Scholar] [CrossRef]
- Roosemont, J.L. Reaction of histidine residues in proteins with diethylpyrocarbonate—Differential molar absorptivities and reactivities. Anal. Biochem. 1978, 88, 314–320. [Google Scholar] [CrossRef]
- Dominici, P.; Valtattorni, C.B. Chemical modification of pig kidney 3,4-dihydroxyphenylalanine decarboxylase with diethyl pyrocarbonate. Evidence for an essential histidyl residue. J. Biol. Chem. 1985, 260, 10583–10589. [Google Scholar]
- Kim, J.A.; Park, S.; Kim, K.; Rhee, S.G.; Kang, S.W. Activity assay of mammalian 2-cys peroxiredoxins using yeast thioredoxin reductase system. Anal. Biochem. 2005, 338, 216–223. [Google Scholar] [CrossRef] [PubMed]
- Borodulin, R.R.; Kubrina, L.N.; Shvydkiy, V.O.; Lakomkin, V.L.; Vanin, A.F. A simple protocol for the synthesis of dinitrosyl iron complexes with glutathione: EPR, optical, chromatographic and biological characterization of reaction products. Nitric Oxide-Biol. Chem. 2013, 35, 110–115. [Google Scholar] [CrossRef] [PubMed]
- Pereira, J.C.M.; Iretskii, A.V.; Han, R.-M.; Ford, P.C. Dinitrosyl iron complexes with cysteine. kinetics studies of the formation and reactions of DNICs in aqueous solution. J. Am. Chem. Soc. 2015, 137, 328–336. [Google Scholar] [CrossRef] [PubMed]
- Trujillo, M.; Clippe, A.; Manta, B.; Ferrer-Sueta, G.; Smeets, A.; Declercq, J.-P.; Knoops, B.; Radi, R. Pre-steady state kinetic characterization of human peroxiredoxin 5: Taking advantage of Trp84 fluorescence increase upon oxidation. Arch. Biochem. Biophys. 2007, 467, 95–106. [Google Scholar] [CrossRef]
- Carvalho, L.A.C.; Truzzi, D.R.; Fallani, T.S.; Alves, S.V.; Toledo, J.C.; Augusto, O.; Netto, L.E.S.; Meotti, F.C. Urate hydroperoxide oxidizes human peroxiredoxin 1 and peroxiredoxin 2. J. Biol. Chem. 2017, 292, 8705–8715. [Google Scholar] [CrossRef]
- Parsonage, D.; Nelson, K.J.; Ferrer-Sueta, G.; Alley, S.; Karplus, P.A.; Furdui, C.M.; Poole, L.B. Dissecting peroxiredoxin catalysis: Separating binding, peroxidation, and resolution for a bacterial AhpC. Biochemistry 2015, 54, 1567–1575. [Google Scholar] [CrossRef]
- Balchin, D.; Wallace, L.; Dirr, H.W. S-nitrosation of glutathione transferase p1-1 is controlled by the conformation of a dynamic active site helix. J. Biol. Chem. 2013, 288, 14973–14984. [Google Scholar] [CrossRef]
- Saville, B. A scheme for the colorimetric determination of microgram amounts of thiols. Analyst 1958, 83, 670–672. [Google Scholar] [CrossRef]
- Peskin, A.V.; Dickerhof, N.; Poynton, R.A.; Paton, L.N.; Pace, P.E.; Hampton, M.B.; Winterbourn, C.C. Hyperoxidation of peroxiredoxins 2 and 3: Rate constants for the reactions of the sulfenic acid of the peroxidatic cysteine. J. Biol. Chem. 2013, 288, 14170–14177. [Google Scholar] [CrossRef]
- McDonald, C.C.; Phillips, W.D.; Mower, H.F. An electron spin resonance study of some complexes of iron, nitric oxide, and anionic ligands. J. Am. Chem. Soc. 1965, 87, 3319–3326. [Google Scholar] [CrossRef]
- Truzzi, D.R.; Augusto, O.; Iretskii, A.V.; Ford, P.C. Dynamics of dinitrosyl iron complex (DNIC) formation with low molecular weight thiols. Inorg. Chem. 2019, 58, 13446–13456. [Google Scholar] [CrossRef] [PubMed]
- Borodulin, R.R.; Kubrina, L.N.; Serezhenkov, V.A.; Burbaev, D.S.; Mikoyan, V.D.; Vanin, A.F. Redox conversions of dinitrosyl iron complexes with natural thiol-containing ligands. Nitric Oxide-Biol. Chem. 2013, 35, 35–41. [Google Scholar] [CrossRef] [PubMed]
- Truzzi, D.R.; Augusto, O.; Ford, P.C. Thiyl radicals are co-products of dinitrosyl iron complex (DNIC) formation. Chem. Commun. 2019, 55, 9156–9159. [Google Scholar] [CrossRef] [PubMed]
- Sundberg, R.J.; Martin, R.B. Interactions of histidine and other imidazole derivatives with transition metal ions in chemical and biological systems. Chem. Rev. 1974, 74, 471–517. [Google Scholar] [CrossRef]
- Winterbourn, C.C. Reconciling the chemistry and biology of reactive oxygen species. Nat. Chem. Biol. 2008, 4, 278–286. [Google Scholar] [CrossRef]
- Borodulin, R.R.; Kubrina, L.N.; Mikoyan, V.D.; Poltorakov, A.P.; Shvydkiy, V.O.; Burbaev, D.S.; Serezhenkov, V.A.; Yakhontova, E.R.; Vanin, A.F. Dinitrosyl iron complexes with glutathione as NO and NO+ donors. Nitric Oxide-Biol. Chem. 2013, 29, 4–16. [Google Scholar] [CrossRef]
- Li, Q.; Li, C.; Mahtani, H.K.; Du, J.; Patel, A.R.; Lancaster, J.R. Nitrosothiol formation and protection against Fenton chemistry by nitric oxide-induced dinitrosyliron complex formation from anoxia-initiated cellular chelatable iron increase. J. Biol. Chem. 2014, 289, 19917–19927. [Google Scholar] [CrossRef]
- Mitchell, D.A.; Marletta, M.A. Thioredoxin catalyzes the S-nitrosation of the caspase-3 active site cysteine. Nat. Chem. Biol. 2005, 1, 154–158. [Google Scholar] [CrossRef]
- Stoyanovsky, D.A.; Tyurina, Y.Y.; Tyurin, V.A.; Anand, D.; Mandavia, D.N.; Gius, D.; Ivanova, J.; Pitt, B.; Billiar, T.R.; Kagan, V.E. Thioredoxin and lipoic acid catalyze the denitrosation of low molecular weight and protein S-nitrosothiols. J. Am. Chem. Soc. 2005, 127, 15815–15823. [Google Scholar] [CrossRef]
- Bocedi, A.; Fabrini, R.; Farrotti, A.; Stella, L.; Ketterman, A.J.; Pedersen, J.Z.; Allocati, N.; Lau, P.C.K.; Grosse, S.; Eltis, L.D.; et al. The Impact of Nitric Oxide Toxicity on the Evolution of the Glutathione Transferase Superfamily. J. Biol. Chem. 2013, 288, 24936–24947. [Google Scholar] [CrossRef]
- Bocedi, A.; Fabrini, R.; Bello, M.L.; Caccuri, A.M.; Federici, G.; Mannervik, B.; Cornish-Bowden, A.; Ricci, G. Evolution of negative cooperativity in glutathione transferase enabled preservation of enzyme function. J. Biol. Chem. 2016, 291, 26739–26749. [Google Scholar] [CrossRef] [PubMed]
- Maria, F.D.; Pedersen, J.Z.; Caccuri, A.M.; Antonini, G.; Turella, P.; Stella, L.; Bello, M.L.; Federici, G.; Ricci, G. The specific interaction of dinitrosyl-diglutathionyl-iron complex, a natural no carrier, with the glutathione transferase superfamily suggestion for an evolutionary pressure in the direction of the storage of nitric oxide. J. Biol. Chem. 2003, 278, 42283–42293. [Google Scholar] [CrossRef] [PubMed]
- Pedersen, J.Z.; De Maria, F.; Turella, P.; Federici, G.; Mattei, M.; Fabrini, R.; Dawood, K.F.; Massimi, M.; Caccuri, A.M.; Ricci, G. Glutathione transferases sequester toxic dinitrosyl-iron complexes in cells. A protection mechanism against excess nitric oxide. J. Biol. Chem. 2007, 282, 6364–6371. [Google Scholar] [CrossRef] [PubMed]


| Protein | Reduced | Pre-Treated with GSNO | |
|---|---|---|---|
| R-SH/Protein | R-SH/Protein | R-SNO/Protein | |
| Prx1C83SC173S | 1.8 ± 0.2 | 1.0 ± 0.2 | 0.7 ± 0.1 |
| Prx1 | 3.5 ± 0.3 | 1.1 ± 0.2 | 1.8 ± 0.3 |
© 2020 by the authors. Licensee MDPI, Basel, Switzerland. This article is an open access article distributed under the terms and conditions of the Creative Commons Attribution (CC BY) license (http://creativecommons.org/licenses/by/4.0/).
Share and Cite
Truzzi, D.R.; Alves, S.V.; Netto, L.E.S.; Augusto, O. The Peroxidatic Thiol of Peroxiredoxin 1 is Nitrosated by Nitrosoglutathione but Coordinates to the Dinitrosyl Iron Complex of Glutathione. Antioxidants 2020, 9, 276. https://doi.org/10.3390/antiox9040276
Truzzi DR, Alves SV, Netto LES, Augusto O. The Peroxidatic Thiol of Peroxiredoxin 1 is Nitrosated by Nitrosoglutathione but Coordinates to the Dinitrosyl Iron Complex of Glutathione. Antioxidants. 2020; 9(4):276. https://doi.org/10.3390/antiox9040276
Chicago/Turabian StyleTruzzi, Daniela R., Simone V. Alves, Luis E. S. Netto, and Ohara Augusto. 2020. "The Peroxidatic Thiol of Peroxiredoxin 1 is Nitrosated by Nitrosoglutathione but Coordinates to the Dinitrosyl Iron Complex of Glutathione" Antioxidants 9, no. 4: 276. https://doi.org/10.3390/antiox9040276
APA StyleTruzzi, D. R., Alves, S. V., Netto, L. E. S., & Augusto, O. (2020). The Peroxidatic Thiol of Peroxiredoxin 1 is Nitrosated by Nitrosoglutathione but Coordinates to the Dinitrosyl Iron Complex of Glutathione. Antioxidants, 9(4), 276. https://doi.org/10.3390/antiox9040276