Article

Synechococcus sp. PCC 7002 Performs Anoxygenic Photosynthesis and Deploys Divergent Strategies to Cope with H2Sn and H2O2

1
School of Pharmaceutical Sciences, Cheeloo College of Medicine, Shandong University, Jinan 250012, China
2
Institute of Marine Science and Technology, Shandong University, Qingdao 266237, China
3
Key Laboratory of Land and Sea Ecological Governance and Systematic Regulation, Ministry of Ecology and Environment, Shandong Academy for Environmental Planning, Jinan 250101, China
*
Author to whom correspondence should be addressed.
These authors contributed equally to this work.
Antioxidants 2025, 14(9), 1122; https://doi.org/10.3390/antiox14091122
Submission received: 20 August 2025 / Revised: 10 September 2025 / Accepted: 12 September 2025 / Published: 16 September 2025

Abstract

Oxygenic and anoxygenic photosynthesis have long been considered defining traits of cyanobacteria. However, whether the important cyanobacterial genus Synechococcus is capable of anoxygenic photosynthesis remains unconfirmed. Here, we report that Synechococcus sp. PCC 7002 is capable of anoxygenic photosynthesis when sulfide (H2S) is supplied as the sole electron donor. Combining the targeted deletion of the sulfide: quinone oxidoreductase gene (Δsqr) with 3-(3,4-dichlorophenyl)-1,1-dimethylurea (DCMU) mediated the inhibition of photosystem II. We demonstrated that SQR-mediated H2S oxidation sustains light-dependent CO2 fixation in the absence of O2 evolution. Our genome-wide transcriptomic profiling further revealed that polysulfide (H2Sn) and hydrogen peroxide (H2O2) function as distinct signaling molecules in oxygenic and anoxygenic photosynthesis, modulating central carbon and energy metabolism. In central carbon metabolism, H2Sn markedly upregulates the expression of key genes, including psbA, petC, rbcL, and rbcS, whereas H2O2 downregulates these genes. Within energy metabolism, both molecules converge on oxidative phosphorylation by upregulating genes encoding NADH dehydrogenase and ATP synthase. Furthermore, H2Sₙ treatment uniquely induces sulfur-assimilation and ROS-detoxifying enzymes, conferring a markedly higher tolerance than H2O2. These findings provide direct evidence of anoxygenic photosynthesis in the genus Synechococcus and uncover a dual regulatory network that allows Synechococcus sp. PCC 7002 to balance redox homeostasis under fluctuating oxic/anoxic conditions.

1. Introduction

Cyanobacteria are an ancient group of prokaryotes capable of both oxygenic and anoxygenic photosynthesis, thereby occupying a pivotal position in the global carbon, nitrogen, and sulfur cycles [1,2]. As the earliest organisms to evolve oxygenic photosynthesis, cyanobacteria split water during this process and release molecular oxygen into the atmosphere [3,4,5], driving the transition of Earth’s atmosphere from a reducing to an oxidizing state and creating the preconditions for the subsequent evolution of aerobic life. Anoxygenic photosynthesis proceeds without O2 evolution and relies on alternative electron donors [6]. Certain cyanobacteria can use H2S as the electron donor in anoxygenic photosynthesis [7], thereby fixing CO2 into organic matter. This metabolic flexibility enables survival under extreme environmental settings. During the early days of the Earth, when the atmospheric O2 concentrations were extremely low, anoxygenic photosynthesis enabled cyanobacteria to thrive in primordial, hostile habitats, laying the foundation for the later evolution of oxygenic photosynthesis. Synechococcus is a prominent genus within the cyanobacteria, renowned for its global distribution and physiological diversity [8]. Although generally considered obligate oxygenic phototrophs, some evidence suggests that, under particular environmental conditions, certain Synechococcus strains may possess the potential to perform anoxygenic photosynthesis. For example, in habitats with elevated sulfide concentrations, Synechococcus might exploit H2S as an electron donor to alleviate oxidative stress and maintain cellular homeostasis [9]; however, definitive experimental proof is still lacking. Verifying of anoxygenic photosynthetic capacity in Synechococcus would provide a more comprehensive understanding of its metabolic versatility under fluctuating environmental conditions, illuminate the adaptive mechanisms that enabled the shift from anoxic to oxic environments across cyanobacterial evolution, and furnish crucial clues for reconstructing the history of early life on Earth.
The fundamental difference between oxygenic and anoxygenic photosynthesis lies in the choice of electron donor and the concomitant production (or absence) of molecular oxygen. Reactive oxygen species (ROS) and reactive sulfur species (RSS) are intermediates generated during these two modes of photosynthesis and function as signaling molecules that modulate cellular processes. Oxygenic photosynthesis produces ROS such as hydrogen peroxide (H2O2), superoxide anion (O2), and hydroxyl radical (OH·). These ROS act as oxidative stress signals that coordinate cellular responses to environmental fluctuations [10]. When cyanobacteria are subjected to lots of light, nutrient limitation, or heavy metal stress, ROS levels increase, thereby activating a suite of protective mechanisms. ROS further modulate the activity of multiple transcription factors, leading to the altered expression of antioxidant enzymes and metabolic genes [11]. In contrast, anoxygenic photosynthesis yields RSS, including hydrogen persulfide (H2S2) and its derivatives (e.g., polysulfides, H2Sn) [12]. RSS are intimately linked to sulfur metabolism and sulfur-dependent signaling. They participate in the regulation of intracellular sulfur homeostasis by influencing the uptake, transformation, and utilization of sulfur. RSS can react with cysteine residues of proteins to generate persulfidation modifications, thereby altering protein activity and function [13]. Although high concentrations of RSS are potentially toxic, at low levels they may serve as antioxidants that protect cells from oxidative damage [14]. Collectively, ROS and RSS fulfill distinct signaling roles via separate pathways and influence divergent physiological processes. Nevertheless, for cyanobacteria capable of both photosynthetic modes, a systematic, genome-wide investigation of ROS- and RSS- mediated signaling has not been performed.
Although ROS and RSS are indispensable for signal transduction, supraphysiological concentrations impose oxidative or sulfide stress, and organisms have evolved multifaceted detoxification strategies. Bacteria eliminate ROS via enzymatic antioxidants such as superoxide dismutase (SOD), catalase (CAT), and glutathione peroxidase (GPx) [15,16,17]. SOD converts O2 to H2O2, which is subsequently decomposed to H2O and O2 via CAT and GPx, thereby alleviating ROS toxicity. Low-molecular-weight antioxidants, including glutathione (GSH) and ascorbate (AsA), directly scavenge ROS by donating electrons or hydrogen atoms, thus preventing oxidative damage. Sulfide detoxification is achieved through sulfide: Quinone oxidoreductase (SQR) [18] and flavocytochrome c sulfide dehydrogenase (FCSD), which oxidize H2S to polysulfides. Also, polysulfides are further converted to harmless thiosulfate via persulfide dioxygenase (PDO) [19,20,21,22,23,24]. Despite the distinct metabolic pathways for ROS and RSS, commonalities exist in bacterial defense systems. For instance, the ROS-detoxifying enzyme peroxiredoxin (Prx) can also reduce sulfane sulfur to H2S, and the ROS-sensing transcriptional regulators OxyR and PerR are capable of detecting RSS and modulating their metabolism [25,26]. Because cyanobacteria can switch between oxygenic and anoxygenic photosynthesis, they must coordinate ROS and RSS metabolizing pathways to sustain redox homeostasis under variable environmental conditions. A systematic, genome-wide elucidation of these pathways in cyanobacteria is therefore essential to understand their environmental adaptability, yet such analyses remain scarce.
In this study, we experimentally demonstrated that Synechococcus sp. (Cyanobacteria) PCC 7002 can perform anoxygenic photosynthesis via the SQR-mediated oxidation of H2S by deleting the sqr gene and pharmacologically inhibiting oxygenic photosynthesis with DCMU. Subsequent transcriptomic profiling was utilized to dissect, on a genome-wide scale, the regulatory effects exerted by H2O2 and H2Sn as signaling molecules on key genes involved in photosynthesis, the tricarboxylic acid (TCA) cycle, glycolysis, and oxidative phosphorylation. The data reveal extensive overlap in the signaling functions of H2O2 and H2Sn, but the cells display heightened sensitivity to RSS. Moreover, Synechococcus sp. PCC 7002 exhibits superior tolerance to H2Sn, which not only induces the expression of sulfur-metabolizing enzymes but also activates antioxidant systems. Collectively, our findings delineate a differential response strategy employed by Synechococcus to ROS and RSS, providing a theoretical framework for dissecting the regulatory mechanisms underlying distinct photosynthetic modes and the adaptation of cyanobacteria to the transition from anoxic to oxic environments.

2. Materials and Methods

2.1. Strains and Culture Conditions

Synechococcus sp. PCC 7002 was kindly provided by the Marine Microbial Ecology Laboratory, Institute of Marine Science and Technology, Shandong University, under a non-commercial material transfer agreement. Synechococcus sp. PCC 7002 and its mutant strain were cultured in conical flasks containing medium A [27], supplemented with 1mg of NaNO3 mL−1 (designed as medium A+), at 30 °C under continuous illumination with 50 μmol of photons m−2 s−1 on a shaker set at 150 rpm. Glycerol (10 mM) was added as a supplement in the medium A+ to serve as the carbon and energy source. The Δsqr mutant of Synechococcus sp. PCC 7002 was constructed using a homologous recombination as described in a previous study [23]. For the mutant strain, the appropriate antibiotic, 50 µg mL−1 of kanamycin, was added.

2.2. Verification of Anoxygenic Photosynthesis

To verify whether the Synechococcus sp. PCC 7002 can utilize H2S as an electron donor for anoxygenic photosynthesis under the action of SQR, the following experiments were performed: DCMU at a concentration of 0.5 µM was employed to inhibit the oxygen-evolving photosynthetic process, thereby ensuring that the observed photosynthesis in the experiment was anoxygenic. Subsequently, H2S was introduced into the culture medium at concentrations of 250 µM and 500 µM, respectively, to examine the photosynthetic capabilities of Synechococcus sp. PCC 7002 under different H2S concentrations. To maximize the removal of oxygen from the culture medium, nitrogen gas was bubbled through it, establishing an anaerobic environment for the experiment. The treated culture medium was then placed in an anaerobic culture bottle for cultivation. After inoculation, both the wild-type Synechococcus sp. PCC 7002 and Δsqr strains were cultured under the continuous illumination of 50 µmol of photons m−2 s−1 at 30 °C, with shaking at 150 rpm. During the cultivation process, cell growth was continuously monitored for 15 days, with cell densities measured spectrophotometrically at OD730 to track the growth status.

2.3. Induction Experiments with H2Sn and H2O2

To investigate the effects of H2Sn and H2O2 on cyanobacteria in the logarithmic growth phase, we designed the following induction experiments. First, Synechococcus sp. PCC7002 was cultured to the logarithmic growth phase. Subsequently, the concentration gradients of H2Sn and H2O2 were established at 250 µM, 500 µM, and 1000 µM, with three biological replicates for each concentration to ensure that the experimental results were reliable and could be reproduced. Synechococcus sp. PCC7002 was then exposed to H2Sn and H2O2 and subjected to induction treatment for 1 h under shaking conditions at 150 rpm and 30 °C. After the induction, cells were immediately collected via centrifugation (4000× g, 4 °C, 10 min) and washed twice with precooled physiological saline to remove residual inducers. Finally, the collected cells were rapidly frozen and stored at −80 °C to ensure that they can be used as high-quality samples for subsequent transcriptomic analysis.

2.4. RNA Extraction and Transcriptome Sequencing

Total RNA was isolated using the TaKaRa MiniBEST Universal RNA Extraction Kit (TaKaRa, Beijing, China), and the RNA concentration was quantified with a Qubit 4 instrument (Thermo Fisher, Shanghai, China). The RNA-seq libraries were constructed with the NEBNext® Ultra II™ Directional RNA Library Prep Kit (New England Biolabs, Ipswich, MA, the US) for Illumina in accordance with the manufacturers’ instructions. Three independent biological replicates were included for each sample. The transcriptome was sequenced using the Illumina HiSeq 2500 platform (Illumina, San Diego, CA, USA) by Magigene.

2.5. RNA-Sequencing Analysis

For quality control purposes, we used fastp (v0.19.7) [28] to remove adapter sequences and low-quality reads from the raw reads to yield high-quality clean reads. Then, the clean reads were aligned to the Rfam ribosomal RNA (rRNA) database [29] using Bowtie2 (v2.33) [30], and the reads that were not mapped to the rRNA sequences were retained for use in the downstream analysis. The filtered reads were then aligned to the reference genome using HISAT2 (v2.1.0) [31]. Gene expression levels were quantified with RSEM (v1.2.12) [32] and normalized using the fragments per kilobase of transcript per million mapped reads (FPKM) method.
Subsequently, read count data were used as the input for differential gene expression analysis with the edgeR (v3.20.2) [33] package in R. Differentially expressed genes (DEGs) were identified using a negative binomial model for each comparison group. p-values were adjusted for multiple tests using the Benjamini–Hochberg (BH) [34] method to control the false discovery rate (FDR). Genes with FDR ≤ 0.05 and |log2 (fold change)| ≥ 1 were considered to be significantly differentially expressed. The overall distribution and significance of DEGs were visualized using volcano plots generated with the ggplot2 package in R. In addition, the heat map was drawn using chiplot (https://www.chiplot.online/, accessed on 5 June 2025).
Significantly differentially expressed genes were subjected to Gene Ontology (GO) [35,36] and Kyoto Encyclopedia of Genes and Genomes (KEGG) [37] enrichment analyses using the clusterProfiler [38] (v3.4.4) R (4.3.1) package. For KEGG pathway enrichment, p-values were corrected using the Benjamini–Hochberg (BH) [34] method, and pathways with an FDR ≤ 0.05 were considered to be significantly enriched among the candidate DEGs. The enrichment results were visualized using bubble plots to highlight the top enriched biological pathways. Additionally, operon structures and transcription start sites (TSSs) were analyzed using Rockhopper (v2.0.3) [39].

2.6. Tolerance of Synechococcus sp. PCC7002 to H2Sn and H2O2

To evaluate the tolerance of Synechococcus sp. PCC 7002 to H2Sn and H2O2, the following experiments were performed: Initially, Synechococcus sp. PCC 7002 cells in the logarithmic growth phase were harvested and treated with H2Sn and H2O2 at concentrations of 1 mM, 2 mM, 3 mM, 4 mM, and 5 mM for 6 h. During the treatment, the cells were cultured under consistent experimental conditions at 30 °C with shaking at 150 rpm. After the treatment, cells were collected using centrifugation (4000× g, 4 °C, 10 min) and washed twice with precooled physiological saline to remove residual H2Sn and H2O2. Subsequently, the treated Synechococcus sp. PCC 7002 cells were subjected to serial dilution with dilution factors of 10, 10−1, 10−2, 10−3, and 10−4. The diluted cells were then spotted onto solid medium A+, with three replicates for each dilution factor. Finally, the spotted culture dishes were incubated at 30 °C in a constant-temperature incubator for 7 days, and we recorded the changes in growth status were recorded.

2.7. Data Availability

Raw sequencing reads were deposited in the NCBI Sequence Read Archive (SRA) under project number PRJNA1289363.

3. Results

3.1. Synechococcus sp. PCC7002 Performed Anoxygenic Photosynthesis

To determine whether Synechococcus sp. PCC7002 is capable of anoxygenic photosynthesis, we employed DCMU to selectively abolish oxygenic photosynthesis. DCMU specifically blocks electron transfer from the primary quinone acceptor (QA) to the secondary quinone acceptor (QB) in photosystem II (PSII). At 0.5 µM, DCMU completely arrested cell proliferation of Synechococcus sp. PCC7002; however, supplementation with H2S alleviated this inhibition (Figure 1 and Figure S1). After 10 days of anaerobic cultivation, the optical density of cultures containing 0.5 µM of DCMU alone remained extremely low. In contrast, cultures additionally supplied with 250 µM or 500 µM of H2S reached densities comparable to the untreated control (Figure 1). Partial recovery was observed at 1 mM of H2S. Still, no beneficial effect was seen at 2 mM, presumably because H2S becomes toxic to Synechococcus sp. PCC7002 at this concentration (Figure S1). In addition, SQR is indispensable for anoxygenic photosynthesis in Synechococcus sp. PCC 7002. To corroborate its functional role, we repeated the above assays using the SQR-deficient mutant we had previously constructed [23]. Earlier work has demonstrated that the deletion of SQR does not impair growth under normal photoautotrophic conditions; rather, it elevates the O2-evolution rate, the maximum photochemical efficiency of PSII (Fv/Fm), the relative electron transport rate (rETR), and the transcript levels of key photosynthetic genes, collectively indicating an enhanced oxygenic photosynthetic capacity. Here, when PSII was pharmacologically inhibited via DCMU, loss of SQR markedly suppressed growth and completely abolished the H2S-mediated rescue. These findings provide direct evidence that Synechococcus sp. PCC 7002 acquires electrons via the SQR-dependent oxidation of H2S to sustain anoxygenic photosynthesis.

3.2. The Transcriptional Response of Synechococcus sp. 7002 to H2Sn and H2O2

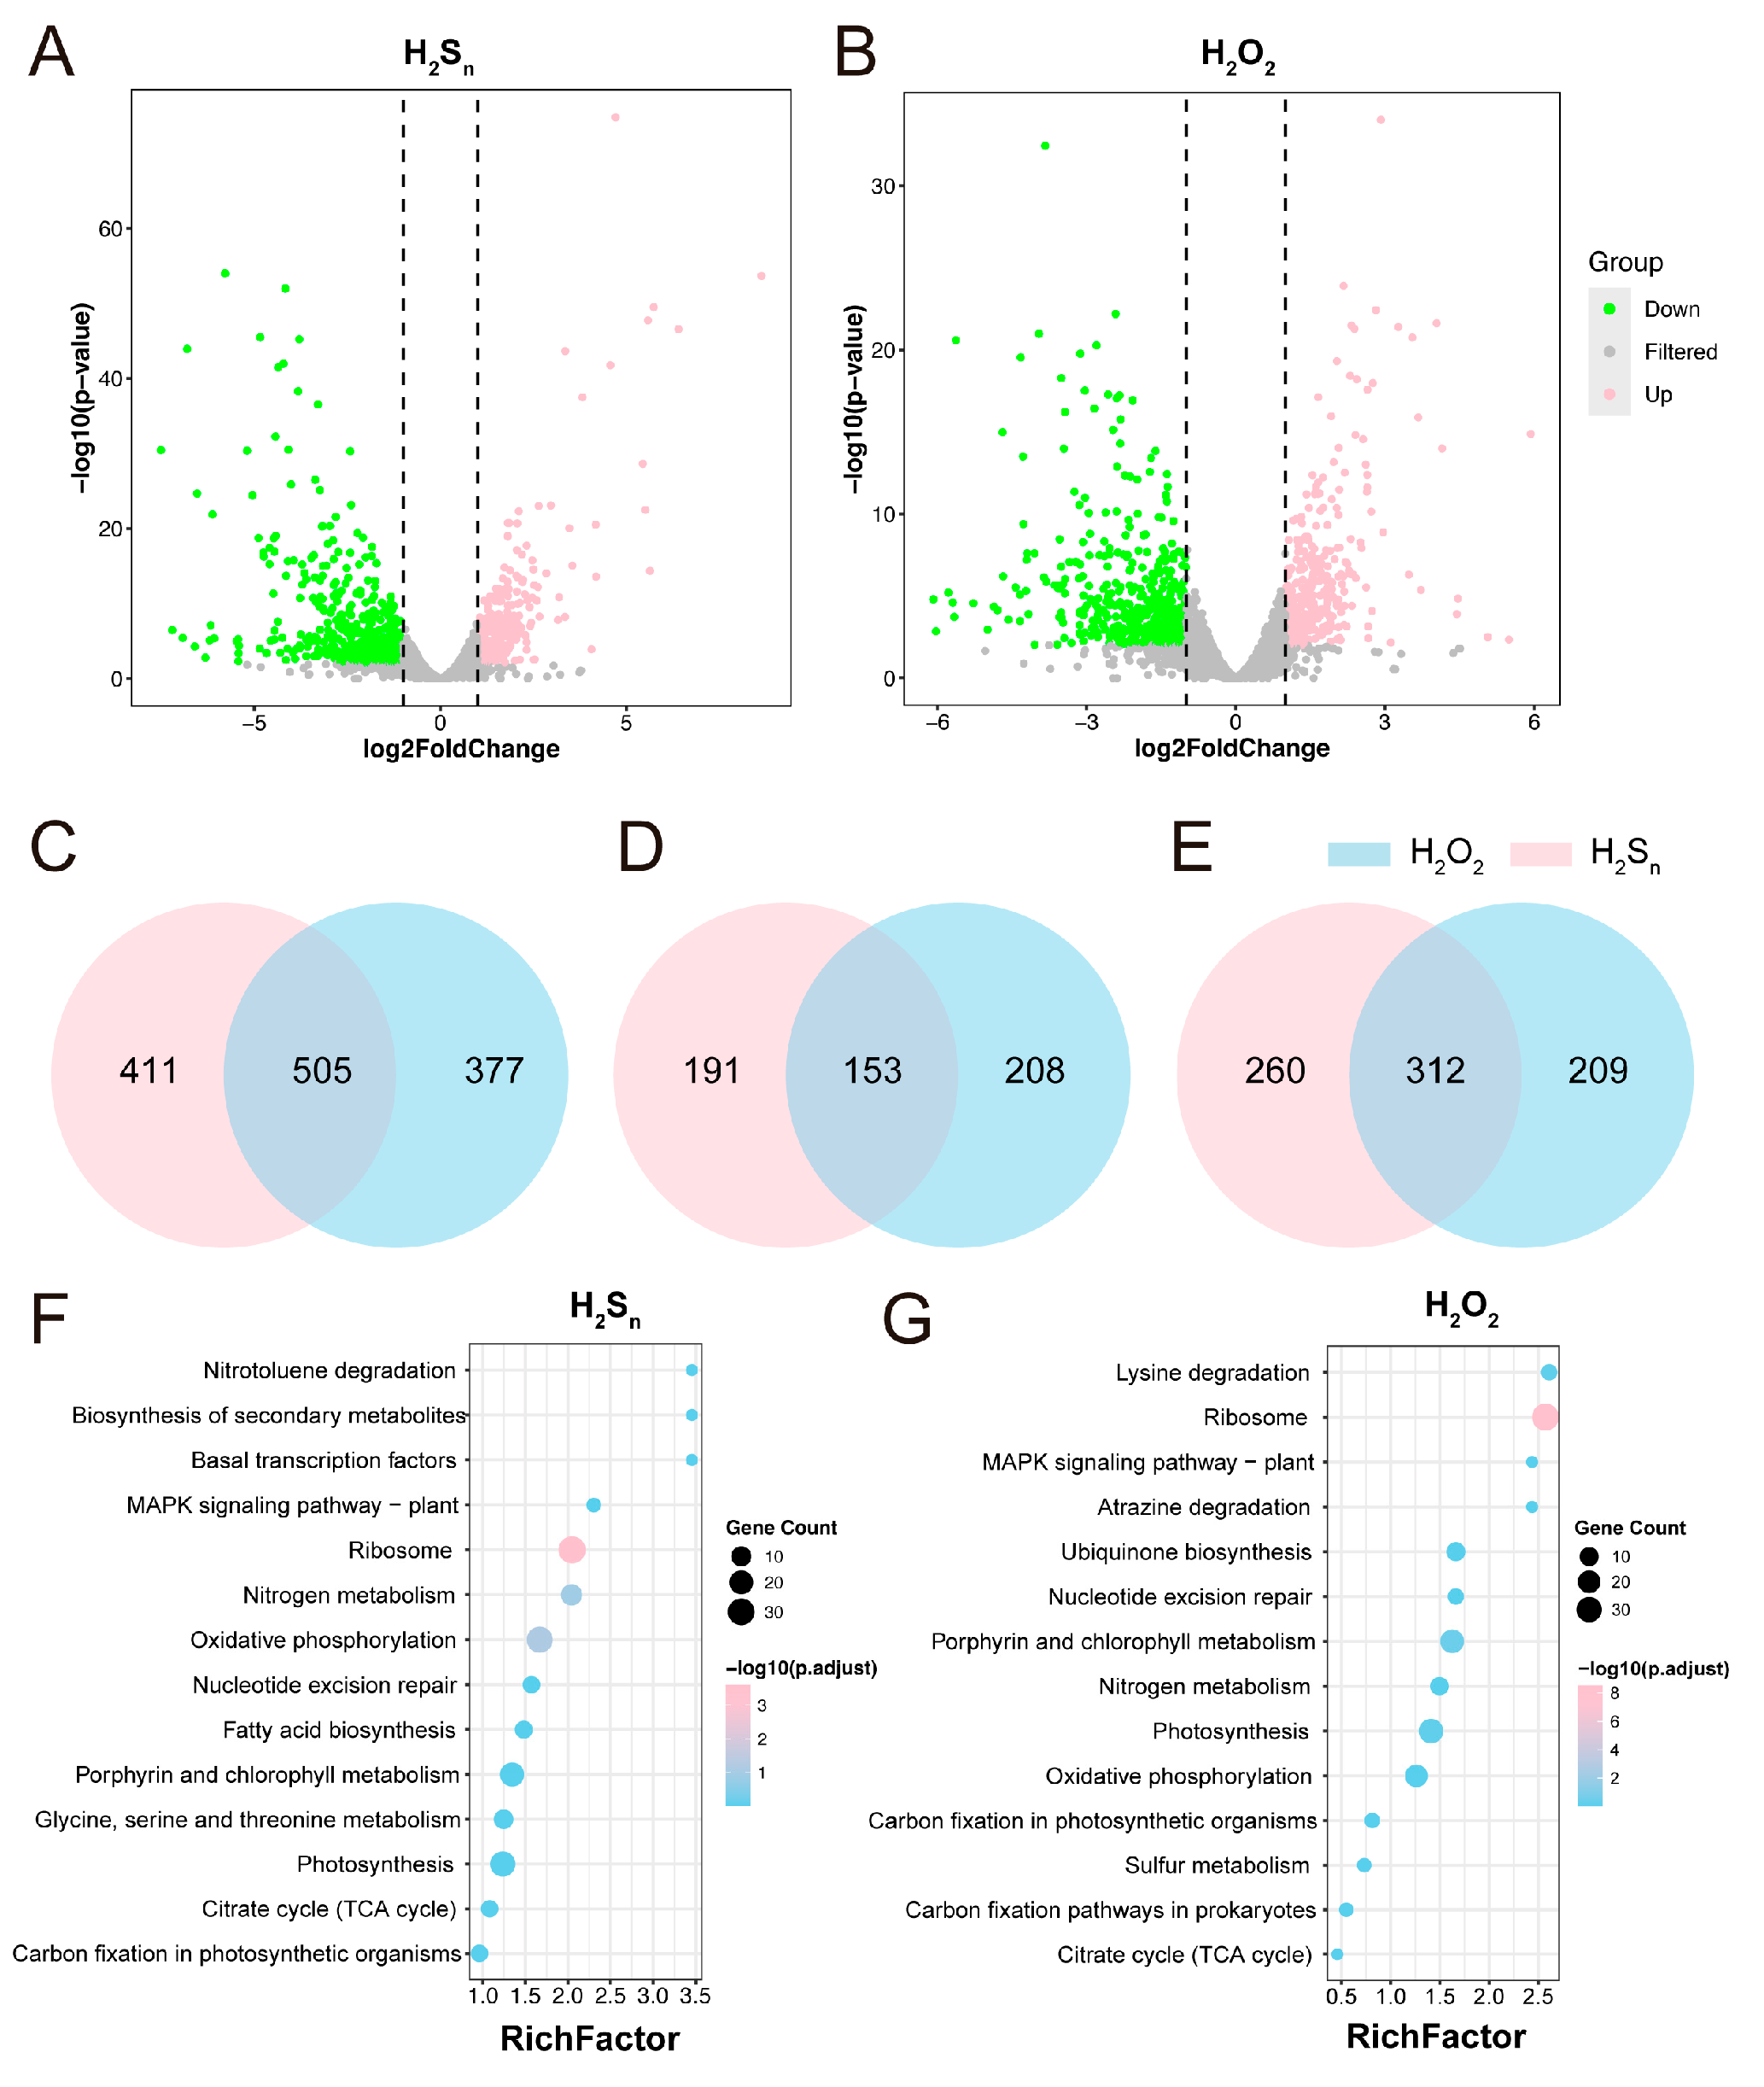
To thoroughly investigate the effects of intermediate products from different photosynthetic modes on the key metabolic processes of Synechococcus sp. PCC7002, we selected H2Sn produced via anoxygenic photosynthesis and H2O2 produced via oxygenic photosynthesis as the subjects of this investigation. We treated Synechococcus sp. PCC7002 cells in the logarithmic growth phase with H2Sn and H2O2 at concentrations of 250 µM, 500 µM, and 1000 µM for 1 h. Each concentration was replicated three times to ensure the reliability of the experimental results. After treatment, cell samples were collected for transcriptomic analysis. Using high-throughput sequencing technology, we obtained a total of 42 GB of raw data (Figure S2). PCoA of log-FPKM profiles (Bray–Curtis) separated samples along PCo1 (33.54% variance) by oxidant identity (H2O2 vs. H2Sn), with minor concentration-dependent shifts along PCo2, revealing distinct and dose-responsive transcriptomic signatures (Figure S3). Volcano plot analysis was performed and the results revealed that after treatment with 1000 µM of H2Sn, a total of 916 genes in Synechococcus sp. PCC7002 cells were differentially expressed, with 344 upregulated (log2FC > 1) and 572 downregulated genes (log2FC < −1) (Figure 2A and Figure S4). In contrast, after treatment with 1000 µM of H2O2, the total number of differentially expressed genes was 882, with 361 upregulated genes (log2FC > 1) and 521 downregulated genes (log2FC < −1) (Figure 2B). Further analysis of all differentially expressed genes (DEGs) showed that 505 genes exhibited the same expression changes after treatment with both H2Sn and H2O2, with 153 upregulated and 312 downregulated genes being identical. Venn diagram analysis revealed that there were 505 differentially expressed genes (DEGs) shared between the H2Sn and H2O2 treatments, of which 153 were co-upregulated and 312 were co-downregulated (Figure 2C–E). To further explore the functions of these DEGs in cellular metabolic processes, we performed KEGG enrichment analysis on all DEGs (Figure 2F,G and Figure S5). The results indicated that the DEGs after treatment with 1000 µM of H2Sn and H2O2 were mainly enriched in key metabolic pathways such as photosynthesis, oxidative phosphorylation, carbon fixation, and chlorophyll synthesis. This finding suggests that despite originating from different photosynthetic modes, H2Sn and H2O2 exhibit certain similarities in their regulatory effects on the key metabolic processes of Synechococcus sp. PCC7002. In summary, as important signaling molecules from anoxygenic and oxygenic photosynthesis, H2Sn and H2O2 have both similarities and differences in their effects on the transcriptional level of Synechococcus sp. PCC7002. This study provides important theoretical insights into the mechanisms by which photosynthetic intermediates regulate the metabolism of Cyanobacteria.

3.3. The Effect of H2Sn and H2O2 on Photosynthesis of Synechococcus sp. PCC7002

We explored the mechanisms by which H2Sn and H2O2 affect photosynthesis, with a particular focus on light reactions and the Calvin cycle (Figure 3A). The results indicated that the effects of H2Sn and H2O2 treatments on photosynthesis generally followed a similar trend: the majority of DEGs were primarily concentrated in photosystem II (PSII), ATPase, and the Calvin cycle, with partial changes also observed in the encoding genes of the cytochrome b6f complex and photosystem I (PSI). The pattern of differentially expressed genes was such that in the presence of H2Sn and H2O2, the expression of most genes was significantly upregulated, and as the concentration increased, the fold change in upregulation also correspondingly increased (Figure 3B). In addition to upregulated genes, some genes exhibited downregulation, such as atpE, atpF, psbA, atpC, psb28, psbD, and atpG. We paid particular attention to genes that showed opposite patterns of change after H2Sn and H2O2 treatments. For instance, the psbA gene was significantly upregulated after H2Sn treatment, with fold changes of 2.00, 8.31, and 8.63, respectively, while it was downregulated after H2O2 treatment. The petC gene was upregulated by 1.17, 5.64, and 5.58 folds after H2Sn treatment but downregulated by 1.35, 1.74, and 1.30 folds after H2O2 treatment, respectively. Additionally, the rbcL and rbcS genes, encoding the large and small subunits of Rubisco, respectively, were upregulated after H2Sn treatment but downregulated after H2O2 treatment. These findings suggest that although H2Sn and H2O2 share similarities in the regulation of the expression of some photosynthesis-related genes, they may influence photosynthesis through different signaling pathways, especially in terms of the transcriptional regulation of PSII repair (psbA), the electron transport chain (petC), and the key enzyme of carbon fixation (Rubisco). This difference may reflect the distinct regulatory mechanisms of the two signaling molecules in photosynthesis, providing an important molecular basis for a deeper understanding of the fine regulation of photosynthesis.

3.4. The Effect of H2Sn and H2O2 on TCA Cycle, Glycolysis, and Oxidative Phosphorylation of Synechococcus sp. PCC7002

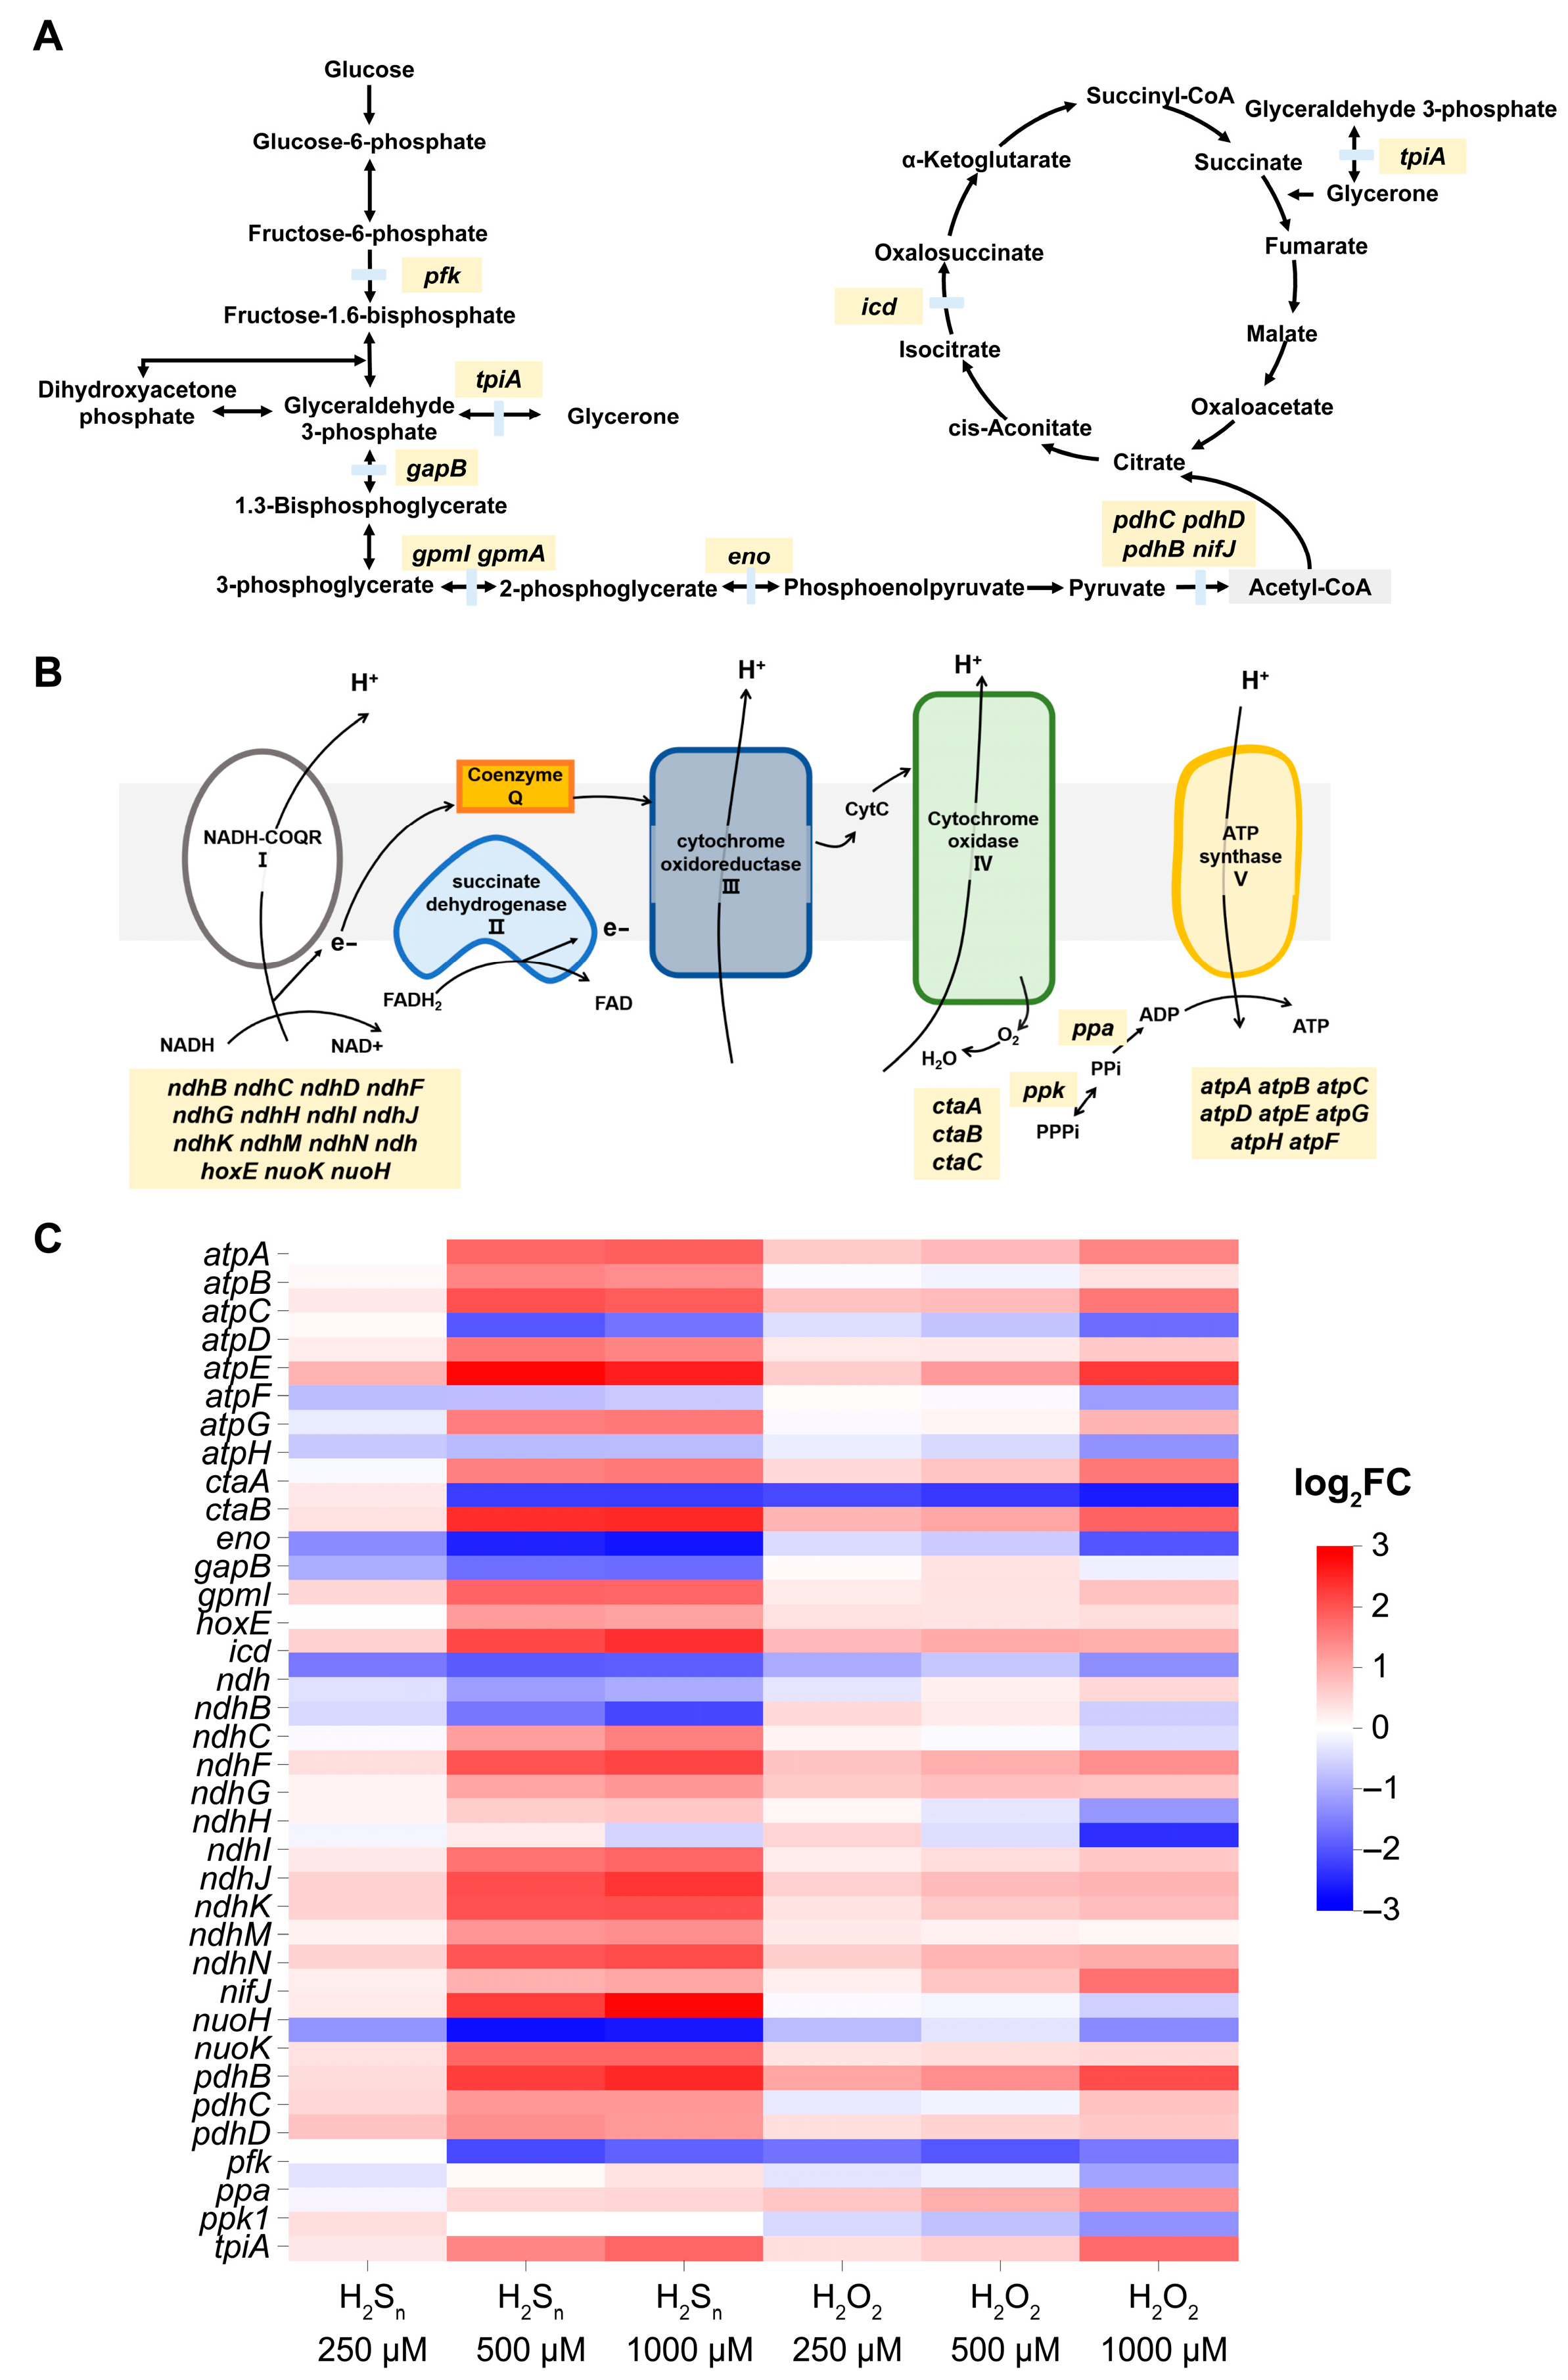
Furthermore, we explored the potential regulatory mechanisms of H2Sn and H2O2 on the key aspects of cellular energy metabolism, including the TCA cycle, glycolysis (Figure 4A), and oxidative phosphorylation (Figure 4B). The results revealed that a total of 42 genes exhibited significant changes in their expression levels under the influence of these two inducers. Notably, the oxidative phosphorylation process was most profoundly affected, with the expression of genes encoding NADH-coenzyme Q reductase (NADH-COQR1) and ATP synthase subunits being generally upregulated (Figure 4C). Further analysis uncovered differential regulation of the ctaA and ctaB genes, which encode subunits of cytochrome c oxidase complex IV, by H2Sn and H2O2. Specifically, under H2Sn induction, the expression of the ctaA gene was downregulated by 1.37- to 2.68-fold, whereas under H2O2 induction, it was downregulated by 0.43- to 1.99-fold. The ctaB gene exhibited a 1.00- to 2.75-fold decrease in expression under the H2Sn treatment, but no significant changes were observed under the H2O2 treatment. These findings suggest that H2Sn may more potently influence respiratory chain function by downregulating the expression of ctaA and ctaB genes.
The impact on the TCA cycle was relatively modest, with alterations observed in only two genes (Figure 4C). The tpiA gene, encoding triosephosphate isomerase (TPI), was upregulated by 0.31- to 1.81-fold under H2Sn induction and by 0.39- to 1.76-fold under H2O2 induction. TPI, a key enzyme in the glycolytic pathway, catalyzes the isomerization between dihydroxyacetone phosphate (DHAP) and glyceraldehyde-3-phosphate (G3P), playing a crucial role in maintaining glycolytic flux and energy conversion efficiency. The icd gene, encoding isocitrate dehydrogenase, was downregulated by 0.31- to 1.16-fold under H2Sn induction but showed no significant changes under H2O2 induction. Isocitrate dehydrogenase, which catalyzes the oxidative decarboxylation of isocitrate to α-ketoglutarate while reducing NAD+ or NADP+ to NADH or NADPH, plays a vital role in energy metabolism and immune responses.
H2Sn and H2O2 also influenced several enzymatic steps in the glycolysis pathway. For instance, the gpmI gene, encoding phosphoglycerate mutase (PGAM), exhibited an upregulation trend under both inducers (Figure 4C). Under H2Sn induction, the expression of gpmI was upregulated by 0.54- to 2.40-fold, whereas under H2O2 induction, it was upregulated by only 0.85- to 1.03-fold. This suggests that H2Sn may have a stronger activating effect on the glycolytic pathway. Additionally, key genes involved in the conversion of pyruvate to acetyl-CoA, including pdhB, pdhC, pdhD, and nifA, were regulated by H2Sn and H2O2. The pdhB and pdhC genes showed an upregulation trend, while pdhD and nifA exhibited a downregulation trend. This indicates that H2Sn and H2O2 may modulate the supply of substrates entering the TCA cycle by regulating the activity of the pyruvate dehydrogenase complex.
Overall, the results of this study demonstrate that H2Sn and H2O2 have the most pronounced impact on oxidative phosphorylation, with cells being more sensitive to H2Sn, as evidenced by the greater magnitude of gene expression changes following H2Sn induction. These findings suggest that H2Sn may play a more significant role than H2O2 in regulating cellular energy metabolism. Collectively, this study provides new insights into the mechanisms by which H2Sn and H2O2 regulate cellular energy metabolism.

3.5. Effects of High Concentrations of H2Sn and H2O2 on Synechococcus sp. PCC7002 Growth and Their Tolerance Mechanisms

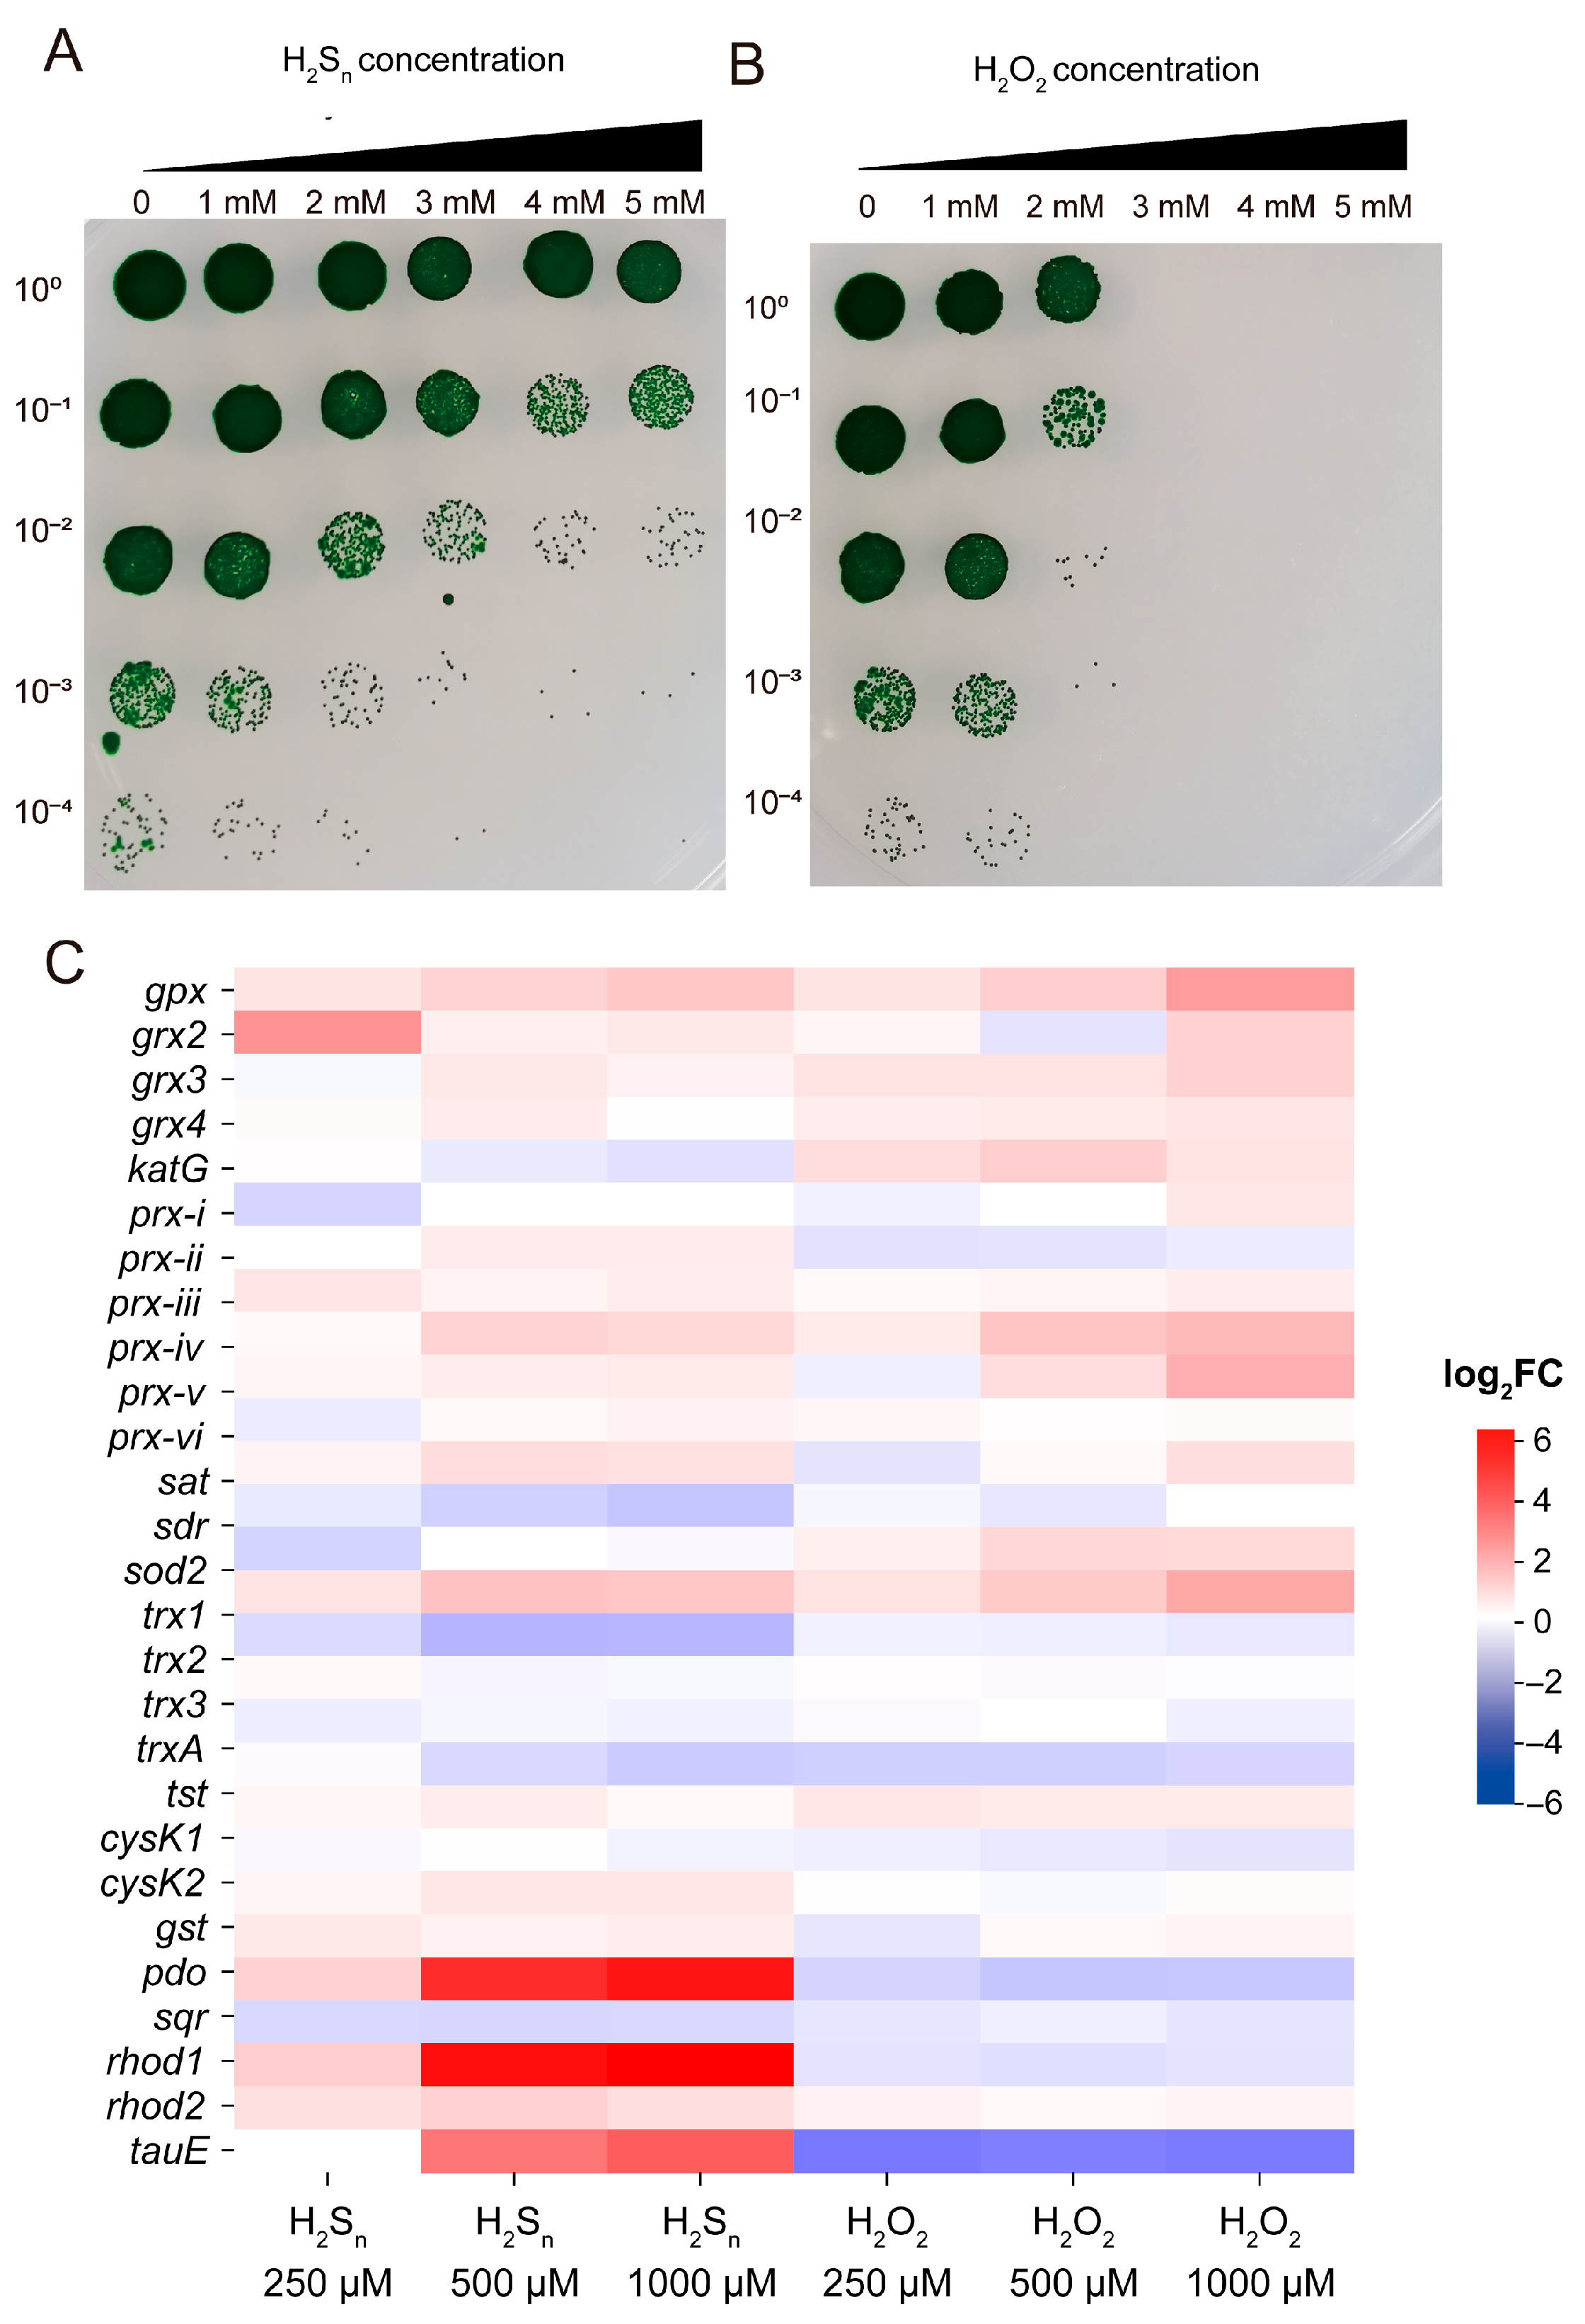
High concentrations of H2Sn and H2O2 can induce oxidative stress in cells, thereby impairing normal growth. To evaluate Synechococcus sp. PCC7002’s tolerance to these compounds, we measured growth inhibition under different concentration treatments. The results demonstrated that Synechococcus sp. PCC7002 exhibited strong tolerance to H2Sn: 1 mM of H2Sn only partially inhibited growth, and while the inhibitory effect gradually increased with higher concentrations (up to 5 mM), complete growth suppression was not achieved (Figure 5A). In contrast, Synechococcus sp. PCC7002 showed significantly higher sensitivity to H2O2, with 2 mM of H2O2 causing substantial growth inhibition and 3 mM leading to complete growth arrest (Figure 5B).
To elucidate the tolerance mechanisms, we analyzed expression changes in key metabolic enzymes related to H2Sn and H2O2 metabolism (Figure 5C). Under H2O2 stress, ROS metabolic genes (including gpx, grx, prx, katG, and sod) were significantly upregulated, while thioredoxin (trx) expression remained unchanged. In H2Sn-treated groups, H2Sn metabolism-related genes (pdo, rhod, tauE, and cysK2) showed marked upregulation. Notably, sqr encoding sulfide quinone oxidoreductase (SQR), which catalyzes H2S oxidation to H2Sn, was significantly downregulated, potentially reducing H2Sn accumulation. Interestingly, H2Sn also induced the upregulation of certain ROS metabolic genes (gpx, grx, prx, and sod). In conclusion, H2Sn not only specifically activates the RSS metabolic pathway but also partially induces adaptive responses in the ROS detoxification system. This dual regulatory mechanism likely underlies Synechococcus sp. PCC7002’s superior H2Sn tolerance. These findings provide important molecular insights into Synechococcus sp. PCC7002’s survival strategies under high H2Sn or H2O2 conditions.

4. Discussion

In this study, we provide direct experimental evidence that Synechococcus sp. PCC 7002 can perform anoxygenic photosynthesis via the SQR-mediated oxidation of H2S by combining targeted gene deletion (Δsqr) with the DCMU-mediated inhibition of oxygenic photosynthesis (Figure 1). Subsequent transcriptomic analyses revealed that H2O2 and H2Sn act as distinct signaling molecules to differentially modulate the expression of key genes involved in photosynthesis, TCA cycle, glycolysis and oxidative phosphorylation (Figure 3 and Figure 4). Notably, although H2O2 and H2Sn display partially overlapping regulatory functions, cells exhibit a markedly higher sensitivity toward RSS. Of particular interest, Synechococcus sp. PCC7002 demonstrates significantly greater tolerance to H2Sn than to H2O2, a phenotype likely attributable to the dual regulatory role played by H2Sn, simultaneously activating sulfur metabolism pathways and inducing antioxidant defense systems (Figure 5).
This study provides the first direct experimental confirmation of anoxygenic photosynthetic capacity within the genus Synechococcus. Although earlier studies have postulated that cyanobacteria might perform anoxygenic photosynthesis under anoxic, sulfide-rich conditions [7,42,43], definitive evidence remains elusive. We previously demonstrated that Synechococcus sp. PCC7002 encodes a functional SQR capable of oxidizing H2S to polysulfide [23]. Building upon this finding, we now establish that Synechococcus sp. PCC7002 can indeed utilize SQR to oxidize H2S for anoxygenic photosynthesis (Figure 1). The ability of cyanobacteria to switch between oxygenic and anoxygenic photosynthesis has profound ecological implications. In the low-oxygen environment of the early days of the Earth, anoxygenic photosynthesis conferred a selective advantage, setting the stage for the subsequent evolution of oxygenic photosynthesis [44,45]. The eventual transition to oxygenic photosynthesis, involving the splitting of water and the release of O2, transformed Earth’s atmosphere from reducing to oxidizing, thereby enabling the radiation of aerobic life [46]. Contemporary Cyanobacteria retain the capacity for anoxygenic photosynthesis, enabling them to thrive in specialized niches characterized by anoxia and elevated sulfide levels, thereby expanding their ecological breadth.
H2Sn and H2O2 participate as signaling molecules in the regulation of numerous metabolic processes, yet their mechanisms of action appear to be different. For example, the psbA and petC genes displayed opposing expression patterns following H2Sn or H2O2 treatment. psbA encodes the D1 protein of photosystem II [47,48], whereas petC encodes a subunit of the cytochrome b6f complex [49]. Both genes were upregulated by H2Sn but downregulated by H2O2. This antagonistic transcriptional response suggests that the two molecules modulate photosynthesis via distinct pathways. H2Sn may enhance photosynthetic efficiency and cellular antioxidant capacity by activating antioxidant defenses and upregulating photosynthesis-related genes [50,51,52], thereby sustaining photosynthetic activity under elevated H2Sn. Conversely, H2O2, a potent oxidant, may trigger oxidative-stress responses and repress photosynthesis-associated genes to minimize ROS production during photosynthesis [53,54], thus protecting cells from oxidative damage. These opposing patterns illuminate the complex regulatory networks underlying photosynthetic modulation, providing a molecular framework for understanding the fine-tuned control of photosynthesis.
Our investigation of the effects of H2Sn and H2O2 on the TCA cycle, glycolysis and oxidative phosphorylation revealed that both molecules predominantly influence oxidative phosphorylation, specifically upregulating genes encoding NADH–CoQ reductase (NADH-COQR1) and ATP synthase [55,56,57]. NADH–CoQ reductase (complex I) catalyzes electron transfer from NADH to coenzyme Q while translocating protons across the membrane to generate the proton-motive force required for ATP synthesis [58]. ATP synthase subsequently utilizes this proton gradient to synthesize ATP. Our transcriptomic data indicate that H2Sn and H2O2 upregulate the expression of NADH-COQR1 and ATP synthase genes (ndh series) [59,60]. This transcriptional activation increases the abundance of these proteins, thereby enhancing electron transport chain activity and elevating ATP production to meet the cellular energy demands. Additionally, H2Sn and H2O2 modulate the expression of the genes involved in glycolysis and the TCA cycle, conferring greater metabolic flexibility and facilitating adaptation to environmental fluctuations. These findings highlight the pivotal roles played by H2Sn and H2O2 in the regulation of cellular energy metabolism and provide molecular insights into the adaptive mechanisms employed under oxidative stress.
A particularly noteworthy observation of this study is that Synechococcus sp. PCC7002 exhibits substantially higher tolerance to H2Sn than to H2O2. Transcriptomic analyses revealed that H2Sn not only induces sulfur metabolism genes but also upregulates ROS-detoxifying enzymes, which may account for the enhanced tolerance. Numerous studies have shown that the enzymes traditionally associated with ROS metabolism are also capable of processing RSS [61,62,63]. From an evolutionary perspective, the sulfide-rich environment of the early Earth may have driven the primordial emergence of RSS-processing systems, whereas ROS-detoxifying mechanisms evolved later in response to the Great Oxidation Event (GOE) [64,65]. The conservation of such metabolic systems thus offers molecular evidence of the transition of life from anoxic to oxic conditions.

5. Conclusions

In summary, this study not only experimentally confirms Synechococcus sp. PCC 7002’s capacity to perform anoxygenic photosynthesis but also elucidates how the photosynthetic intermediates H2Sn and H2O2 differentially regulate photosynthesis, the TCA cycle, and related metabolic pathways. Our findings reveal both the shared and distinct regulatory roles played by H2Sn and H2O2. Moreover, we dissect the mechanistic basis for Synechococcus sp. PCC7002’s superior tolerance to high H2Sn concentrations, demonstrating that elevated H2Sn simultaneously induces ROS and RSS metabolizing enzymes. Collectively, our genome-wide analysis provides a comprehensive understanding of the metabolic regulatory networks underlying distinct photosynthetic modes in Synechococcus, establishes a foundation for investigating the adaptive transition of cyanobacteria from anoxic to oxic environments, and offers mechanistic insights into the resilience of Cyanobacteria under fluctuating environmental conditions.

Supplementary Materials

The following supporting information can be downloaded at https://www.mdpi.com/article/10.3390/antiox14091122/s1. Figure S1: Synechococcus sp. PCC 7002 used H2S as electron donor to perform anoxygenic photosynthesis. Figure S2: Per-base quality scores for the full-length reads. Figure S3: Principal coordinates analysis (PCoA) of gene-expression profiles (log-transformed FPKM values) based on Bray–Curtis dissimilarity under the indicated H2O2 and H2Sn treatments. Figure S4: The transcriptional response of Synechococcus sp. PCC7002 to 250 µM and 500 µM H2Sn/H2O2. Figure S5: KEGG pathway enrichment analyses of DEGs following 250 µM and 500 µM H2Sn (A,B)/H2O2 (C,D) exposure.

Author Contributions

Y.W.: Data curation, Writing—Original draft preparation. Y.M.: Methodology, Visualization, Investigation. H.R.: Methodology, Visualization. R.H.: Software, Validation and Supervision. J.L.: Supervision, Validation. D.L.: Supervision, Methodology, Writing—Original draft preparation, Writing—Reviewing and Editing. All authors have read and agreed to the published version of the manuscript.

Funding

This research was funded by the National Science Foundation of China, grant number 21310005202508 and the Natural Science Foundation of Shandong Province, grant number ZR2022QC044.

Data Availability Statement

Raw sequencing reads were deposited in the NCBI Sequence Read Archive (SRA) under the project number PRJNA1289363.

Conflicts of Interest

The authors declare no conflicts of interest.

References

  1. Sánchez-Baracaldo, P.; Bianchini, G.; Wilson, J.D.; Knoll, A.H. Cyanobacteria and biogeochemical cycles through Earth history. Trends Microbiol. 2022, 30, 143–157. [Google Scholar] [CrossRef]
  2. Grim, S.L.; Voorhies, A.A.; Biddanda, B.A.; Jain, S.; Nold, S.C.; Green, R.; Dick, G.J. Omics-Inferred Partitioning and Expression of Diverse Biogeochemical Functions in a Low-O2 Cyanobacterial Mat Community. mSystems 2021, 6, e01042-21. [Google Scholar] [CrossRef]
  3. Sánchez-Baracaldo, P.; Cardona, T. On the origin of oxygenic photosynthesis and Cyanobacteria. New Phytol. 2020, 225, 1440–1446. [Google Scholar] [CrossRef] [PubMed]
  4. Tan, S.; Liu, L.; Jiao, J.Y.; Li, M.M.; Hu, C.J.; Lv, A.P.; Qi, Y.L.; Li, Y.X.; Rao, Y.Z.; Qu, Y.N.; et al. Exploring the Origins and Evolution of Oxygenic and Anoxygenic Photosynthesis in Deeply Branched Cyanobacteriota. Mol. Biol. Evol. 2024, 41, msae151. [Google Scholar] [CrossRef] [PubMed]
  5. Soo, R.M.; Hemp, J.; Hugenholtz, P. Evolution of photosynthesis and aerobic respiration in the cyanobacteria. Free Radic. Biol. Med. 2019, 140, 200–205. [Google Scholar] [CrossRef]
  6. Kushkevych, I.; Bosáková, V.; Vítězová, M.; Rittmann, S.K.M.R. Anoxygenic Photosynthesis in Photolithotrophic Sulfur Bacteria and Their Role in Detoxication of Hydrogen Sulfide. Antioxidants 2021, 10, 829. [Google Scholar] [CrossRef]
  7. Klatt Judith, M.; Al-Najjar Mohammad, A.A.; Yilmaz, P.; Lavik, G.; de Beer, D.; Polerecky, L. Anoxygenic Photosynthesis Controls Oxygenic Photosynthesis in a Cyanobacterium from a Sulfidic Spring. Appl. Environ. Microbiol. 2015, 81, 2025–2031. [Google Scholar] [CrossRef]
  8. Callieri, C. Synechococcus plasticity under environmental changes. FEMS Microbiol. Lett. 2017, 364, fnx229. [Google Scholar] [CrossRef]
  9. Shabana, E.F.; Ali, G.H. Phytoplankton activities in hypersaline, anoxic conditions. II-Photosynthetic activity of some sulphide adapted cyanobacterial strains isolated from Solar Lake, Taba, Egypt. Water Sci. Technol. 1999, 40, 127–132. [Google Scholar] [CrossRef]
  10. Reczek, C.R.; Chandel, N.S. ROS-dependent signal transduction. Curr. Opin. Cell Biol. 2015, 33, 8–13. [Google Scholar] [CrossRef]
  11. Hong, Y.; Boiti, A.; Vallone, D.; Foulkes, N.S. Reactive Oxygen Species Signaling and Oxidative Stress: Transcriptional Regulation and Evolution. Antioxidants 2024, 13, 312. [Google Scholar] [CrossRef]
  12. Lau, N.; Pluth, M.D. Reactive sulfur species (RSS): Persulfides, polysulfides, potential, and problems. Curr. Opin. Chem. Biol. 2019, 49, 1–8. [Google Scholar] [CrossRef]
  13. Giedroc, D.P.; Antelo, G.T.; Fakhoury, J.N.; Capdevila, D.A. Sensing and regulation of reactive sulfur species (RSS) in bacteria. Curr. Opin. Chem. Biol. 2023, 76, 102358. [Google Scholar] [CrossRef]
  14. Wu, G.; Niu, X.; Chen, J.; Wu, C.; Li, Y.; Li, Y.; Cui, D.; He, X.; Wang, F.; Li, S. Hydrogen Sulfide Alleviates Oxidative Damage Under Chilling Stress Through Mitogen-Activated Protein Kinase in Tomato. Antioxidants 2024, 13, 323. [Google Scholar] [CrossRef]
  15. He, L.; He, T.; Farrar, S.; Ji, L.; Liu, T.; Ma, X. Antioxidants Maintain Cellular Redox Homeostasis by Elimination of Reactive Oxygen Species. Cell. Physiol. Biochem. 2017, 44, 532–553. [Google Scholar] [CrossRef] [PubMed]
  16. Hasanuzzaman, M.; Bhuyan, M.; Zulfiqar, F.; Raza, A.; Mohsin, S.M.; Mahmud, J.A.; Fujita, M.; Fotopoulos, V. Reactive Oxygen Species and Antioxidant Defense in Plants Under Abiotic Stress: Revisiting the Crucial Role of a Universal Defense Regulator. Antioxidants 2020, 9, 681. [Google Scholar] [CrossRef] [PubMed]
  17. Gill, S.S.; Tuteja, N. Reactive oxygen species and antioxidant machinery in abiotic stress tolerance in crop plants. Plant Physiol. Biochem. 2010, 48, 909–930. [Google Scholar] [CrossRef] [PubMed]
  18. Landry, A.P.; Ballou, D.P.; Banerjee, R. Hydrogen Sulfide Oxidation by Sulfide Quinone Oxidoreductase. Chembiochem 2021, 22, 949–960. [Google Scholar] [CrossRef]
  19. Liu, H.; Xin, Y.; Xun, L. Distribution, diversity, and activities of sulfur dioxygenases in heterotrophic bacteria. Appl. Environ. Microbiol. 2014, 80, 1799–1806. [Google Scholar] [CrossRef]
  20. Lü, C.; Xia, Y.; Liu, D.; Zhao, R.; Gao, R.; Liu, H.; Xun, L. Cupriavidus necator H16 Uses Flavocytochrome c Sulfide Dehydrogenase to Oxidize Self-Produced and Added Sulfide. Appl. Environ. Microbiol. 2017, 83, e01610-17. [Google Scholar] [CrossRef]
  21. Wang, Q.; Chen, Z.; Zhang, X.; Xin, Y.; Xia, Y.; Xun, L.; Liu, H. Rhodanese Rdl2 produces reactive sulfur species to protect mitochondria from reactive oxygen species. Free Radic. Biol. Med. 2021, 177, 287–298. [Google Scholar] [CrossRef]
  22. Xia, Y.; Lü, C.; Hou, N.; Xin, Y.; Liu, J.; Liu, H.; Xun, L. Sulfide production and oxidation by heterotrophic bacteria under aerobic conditions. ISME J. 2017, 11, 2754–2766. [Google Scholar] [CrossRef] [PubMed]
  23. Liu, D.; Zhang, J.; Lü, C.; Xia, Y.; Liu, H.; Jiao, N.; Xun, L.; Liu, J. Synechococcus sp. Strain PCC7002 Uses Sulfide:Quinone Oxidoreductase to Detoxify Exogenous Sulfide and to Convert Endogenous Sulfide to Cellular Sulfane Sulfur. mBio 2020, 11, e03420-19. [Google Scholar] [CrossRef]
  24. Xin, Y.; Gao, R.; Cui, F.; Lü, C.; Liu, H.; Liu, H.; Xia, Y.; Xun, L. The Heterotrophic Bacterium Cupriavidus pinatubonensis JMP134 Oxidizes Sulfide to Sulfate with Thiosulfate as a Key Intermediate. Appl. Environ. Microbiol. 2020, 86, e01835-20. [Google Scholar] [CrossRef]
  25. Hou, N.; Yan, Z.; Fan, K.; Li, H.; Zhao, R.; Xia, Y.; Xun, L.; Liu, H. OxyR senses sulfane sulfur and activates the genes for its removal in Escherichia coli. Redox Biol. 2019, 26, 101293. [Google Scholar] [CrossRef]
  26. Liu, D.; Song, H.; Li, Y.; Huang, R.; Liu, H.; Tang, K.; Jiao, N.; Liu, J. The Transcriptional Repressor PerR Senses Sulfane Sulfur by Cysteine Persulfidation at the Structural Zn2+ Site in Synechococcus sp. PCC7002. Antioxidants 2023, 12, 423. [Google Scholar] [CrossRef]
  27. Stevens, S.E.; Porter, R.D. Transformation in Agmenellum quadruplicatum. Proc. Natl. Acad. Sci. USA 1980, 77, 6052–6056. [Google Scholar] [CrossRef] [PubMed]
  28. Chen, S.; Zhou, Y.; Chen, Y.; Gu, J. fastp: An ultra-fast all-in-one FASTQ preprocessor. Bioinformatics 2018, 34, i884–i890. [Google Scholar] [CrossRef]
  29. Kalvari, I.; Nawrocki, E.P.; Ontiveros-Palacios, N.; Argasinska, J.; Lamkiewicz, K.; Marz, M.; Griffiths-Jones, S.; Toffano-Nioche, C.; Gautheret, D.; Weinberg, Z.; et al. Rfam 14: Expanded coverage of metagenomic, viral and microRNA families. Nucleic Acids Res. 2021, 49, D192–D200. [Google Scholar] [CrossRef]
  30. Langmead, B.; Salzberg, S.L. Fast gapped-read alignment with Bowtie 2. Nat. Methods 2012, 9, 357–359. [Google Scholar] [CrossRef] [PubMed]
  31. Kim, D.; Langmead, B.; Salzberg, S.L. HISAT: A fast spliced aligner with low memory requirements. Nat. Methods 2015, 12, 357–360. [Google Scholar] [CrossRef] [PubMed]
  32. Li, B.; Dewey, C.N. RSEM: Accurate transcript quantification from RNA-Seq data with or without a reference genome. BMC Bioinform. 2011, 12, 323. [Google Scholar] [CrossRef]
  33. Robinson, M.D.; McCarthy, D.J.; Smyth, G.K. edgeR: A Bioconductor package for differential expression analysis of digital gene expression data. Bioinformatics 2010, 26, 139–140. [Google Scholar] [CrossRef] [PubMed]
  34. Benjamini, Y.; Hochberg, Y. Controlling the false discovery rate: A practical and powerful approach to multiple hypothesis testing. J. R. Stat. Soc. Ser. B 1995, 57, 289–300. [Google Scholar] [CrossRef]
  35. Ashburner, M.; Ball, C.A.; Blake, J.A.; Botstein, D.; Butler, H.; Cherry, J.M.; Davis, A.P.; Dolinski, K.; Dwight, S.S.; Eppig, J.T.; et al. Gene Ontology: Tool for the unification of biology. Nat. Genet. 2000, 25, 25–29. [Google Scholar] [CrossRef]
  36. The Gene Ontology, C.; Aleksander, S.A.; Balhoff, J.; Carbon, S.; Cherry, J.M.; Drabkin, H.J.; Ebert, D.; Feuermann, M.; Gaudet, P.; Harris, N.L.; et al. The Gene Ontology knowledgebase in 2023. Genetics 2023, 224, iyad031. [Google Scholar] [CrossRef]
  37. Ogata, H.; Goto, S.; Sato, K.; Fujibuchi, W.; Bono, H.; Kanehisa, M. KEGG: Kyoto Encyclopedia of Genes and Genomes. Nucleic Acids Res. 1999, 27, 29–34. [Google Scholar] [CrossRef]
  38. Yu, G.; Wang, L.G.; Han, Y.; He, Q.Y. clusterProfiler: An R package for comparing biological themes among gene clusters. Omics A J. Integr. Biol. 2012, 16, 284–287. [Google Scholar] [CrossRef]
  39. McClure, R.; Balasubramanian, D.; Sun, Y.; Bobrovskyy, M.; Sumby, P.; Genco, C.A.; Vanderpool, C.K.; Tjaden, B. Computational analysis of bacterial RNA-Seq data. Nucleic Acids Res. 2013, 41, e140. [Google Scholar] [CrossRef]
  40. Bryant, D.A.; Gisriel, C.J. The structural basis for light harvesting in organisms producing phycobiliproteins. Plant Cell 2024, 36, 4036–4064. [Google Scholar] [CrossRef] [PubMed]
  41. Zheng, L.; Zheng, Z.; Li, X.; Wang, G.; Zhang, K.; Wei, P.; Zhao, J.; Gao, N. Structural insight into the mechanism of energy transfer in cyanobacterial phycobilisomes. Nat. Commun. 2021, 12, 5497. [Google Scholar] [CrossRef]
  42. Hamilton, T.L.; Klatt, J.M.; de Beer, D.; Macalady, J.L. Cyanobacterial photosynthesis under sulfidic conditions: Insights from the isolate Leptolyngbya sp. strain hensonii. ISME J. 2018, 12, 568–584. [Google Scholar] [CrossRef]
  43. de Beer, D.; Weber, M.; Chennu, A.; Hamilton, T.; Lott, C.; Macalady, J.; Klatt, J.M. Oxygenic and anoxygenic photosynthesis in a microbial mat from an anoxic and sulfidic spring. Environ. Microbiol. 2017, 19, 1251–1265. [Google Scholar] [CrossRef] [PubMed]
  44. Johnston, D.T.; Wolfe-Simon, F.; Pearson, A.; Knoll, A.H. Anoxygenic photosynthesis modulated Proterozoic oxygen and sustained Earth’s middle age. Proc. Natl. Acad. Sci. USA 2009, 106, 16925–16929. [Google Scholar] [CrossRef]
  45. Grim, S.L.; Dick, G.J. Photosynthetic Versatility in the Genome of Geitlerinema sp. PCC 9228 (Formerly Oscillatoria limnetica ‘Solar Lake’), a Model Anoxygenic Photosynthetic Cyanobacterium. Front. Microbiol. 2016, 7, 1546. [Google Scholar] [CrossRef] [PubMed]
  46. Soo, R.M.; Hemp, J.; Parks, D.H.; Fischer, W.W.; Hugenholtz, P. On the origins of oxygenic photosynthesis and aerobic respiration in Cyanobacteria. Science 2017, 355, 1436–1440. [Google Scholar] [CrossRef]
  47. Mulo, P.; Sicora, C.; Aro, E.-M. Cyanobacterial psbA gene family: Optimization of oxygenic photosynthesis. Cell. Mol. Life Sci. 2009, 66, 3697–3710. [Google Scholar] [CrossRef] [PubMed]
  48. Mulo, P.; Sakurai, I.; Aro, E.M. Strategies for psbA gene expression in cyanobacteria, green algae and higher plants: From transcription to PSII repair. Biochim. Et Biophys. Acta 2012, 1817, 247–257. [Google Scholar] [CrossRef]
  49. Schneider, D.; Berry, S.; Volkmer, T.; Seidler, A.; Rögner, M. PetC1 is the major Rieske iron-sulfur protein in the cytochrome b6f complex of Synechocystis sp. PCC 6803. J. Biol. Chem. 2004, 279, 39383–39388. [Google Scholar] [CrossRef]
  50. Wang, H.; Moussa, M.G.; Huang, W.; Han, D.; Dang, B.; Hao, H.; Zhang, L.; Xu, Z.; Jia, W. Exogenous hydrogen sulfide increased Nicotiana tabacum L. resistance against drought by the improved photosynthesis and antioxidant system. Sci. Rep. 2024, 14, 25534. [Google Scholar] [CrossRef]
  51. Wang, J.; Dou, J.; Yue, Z.; Wang, J.; Chen, T.; Li, J.; Dai, H.; Dou, T.; Yu, J.; Liu, Z. Effect of hydrogen sulfide on cabbage photosynthesis under black rot stress. Plant Physiol. Biochem. 2024, 208, 108453. [Google Scholar] [CrossRef]
  52. Klatt, J.M.; Haas, S.; Yilmaz, P.; de Beer, D.; Polerecky, L. Hydrogen sulfide can inhibit and enhance oxygenic photosynthesis in a cyanobacterium from sulfidic springs. Environ. Microbiol. 2015, 17, 3301–3313. [Google Scholar] [CrossRef]
  53. Qian, H.; Yu, S.; Sun, Z.; Xie, X.; Liu, W.; Fu, Z. Effects of copper sulfate, hydrogen peroxide and N-phenyl-2-naphthylamine on oxidative stress and the expression of genes involved photosynthesis and microcystin disposition in Microcystis aeruginosa. Aquat. Toxicol. 2010, 99, 405–412. [Google Scholar] [CrossRef]
  54. Chen, C.; Yang, Z.; Kong, F.; Zhang, M.; Yu, Y.; Shi, X. Growth, physiochemical and antioxidant responses of overwintering benthic cyanobacteria to hydrogen peroxide. Environ. Pollut. 2016, 219, 649–655. [Google Scholar] [CrossRef]
  55. Huang, D.; Jing, G.; Zhu, S. Regulation of Mitochondrial Respiration by Hydrogen Sulfide. Antioxidants 2023, 12, 1644. [Google Scholar] [CrossRef]
  56. Zini, R.; Berdeaux, A.; Morin, D. The differential effects of superoxide anion, hydrogen peroxide and hydroxyl radical on cardiac mitochondrial oxidative phosphorylation. Free Radic. Res. 2007, 41, 1159–1166. [Google Scholar] [CrossRef] [PubMed]
  57. Brand, M.D. Mitochondrial generation of superoxide and hydrogen peroxide as the source of mitochondrial redox signaling. Free Radic. Biol. Med. 2016, 100, 14–31. [Google Scholar] [CrossRef]
  58. Hirst, J. Mitochondrial Complex I. Annu. Rev. Biochem. 2013, 82, 551–575. [Google Scholar] [CrossRef]
  59. Módis, K.; Ju, Y.; Ahmad, A.; Untereiner, A.A.; Altaany, Z.; Wu, L.; Szabo, C.; Wang, R. S-Sulfhydration of ATP synthase by hydrogen sulfide stimulates mitochondrial bioenergetics. Pharmacol. Res. 2016, 113, 116–124. [Google Scholar] [CrossRef] [PubMed]
  60. Qin, G.; Liu, J.; Cao, B.; Li, B.; Tian, S. Hydrogen peroxide acts on sensitive mitochondrial proteins to induce death of a fungal pathogen revealed by proteomic analysis. PLoS ONE 2011, 6, e21945. [Google Scholar] [CrossRef] [PubMed]
  61. Olson, K.R.; Gao, Y.; Arif, F.; Arora, K.; Patel, S.; DeLeon, E.R.; Sutton, T.R.; Feelisch, M.; Cortese-Krott, M.M.; Straub, K.D. Metabolism of hydrogen sulfide (H2S) and Production of Reactive Sulfur Species (RSS) by superoxide dismutase. Redox Biol. 2018, 15, 74–85. [Google Scholar] [CrossRef] [PubMed]
  62. Olson, K.R.; Gao, Y.; DeLeon, E.R.; Arif, M.; Arif, F.; Arora, N.; Straub, K.D. Catalase as a sulfide-sulfur oxido-reductase: An ancient (and modern?) regulator of reactive sulfur species (RSS). Redox Biol. 2017, 12, 325–339. [Google Scholar] [CrossRef] [PubMed]
  63. Olson, K.R.; Takata, T.; Clear, K.J.; Gao, Y.; Ma, Z.; Pfaff, E.; Mouli, K.; Kent, T.A.; Jones, P., Jr.; Fukuto, J.; et al. The SOD1 Inhibitor, LCS-1, Oxidizes H2S to Reactive Sulfur Species, Directly and Indirectly, Through Conversion of SOD1 to an Oxidase. Antioxidants 2024, 13, 991. [Google Scholar] [CrossRef]
  64. Olson, K.R. Reactive oxygen species or reactive sulfur species: Why we should consider the latter. J. Exp. Biol. 2020, 223, jeb196352. [Google Scholar] [CrossRef]
  65. Olson, K.R. Are Reactive Sulfur Species the New Reactive Oxygen Species? Antioxid. Redox Signal. 2020, 33, 1125–1142. [Google Scholar] [CrossRef] [PubMed]
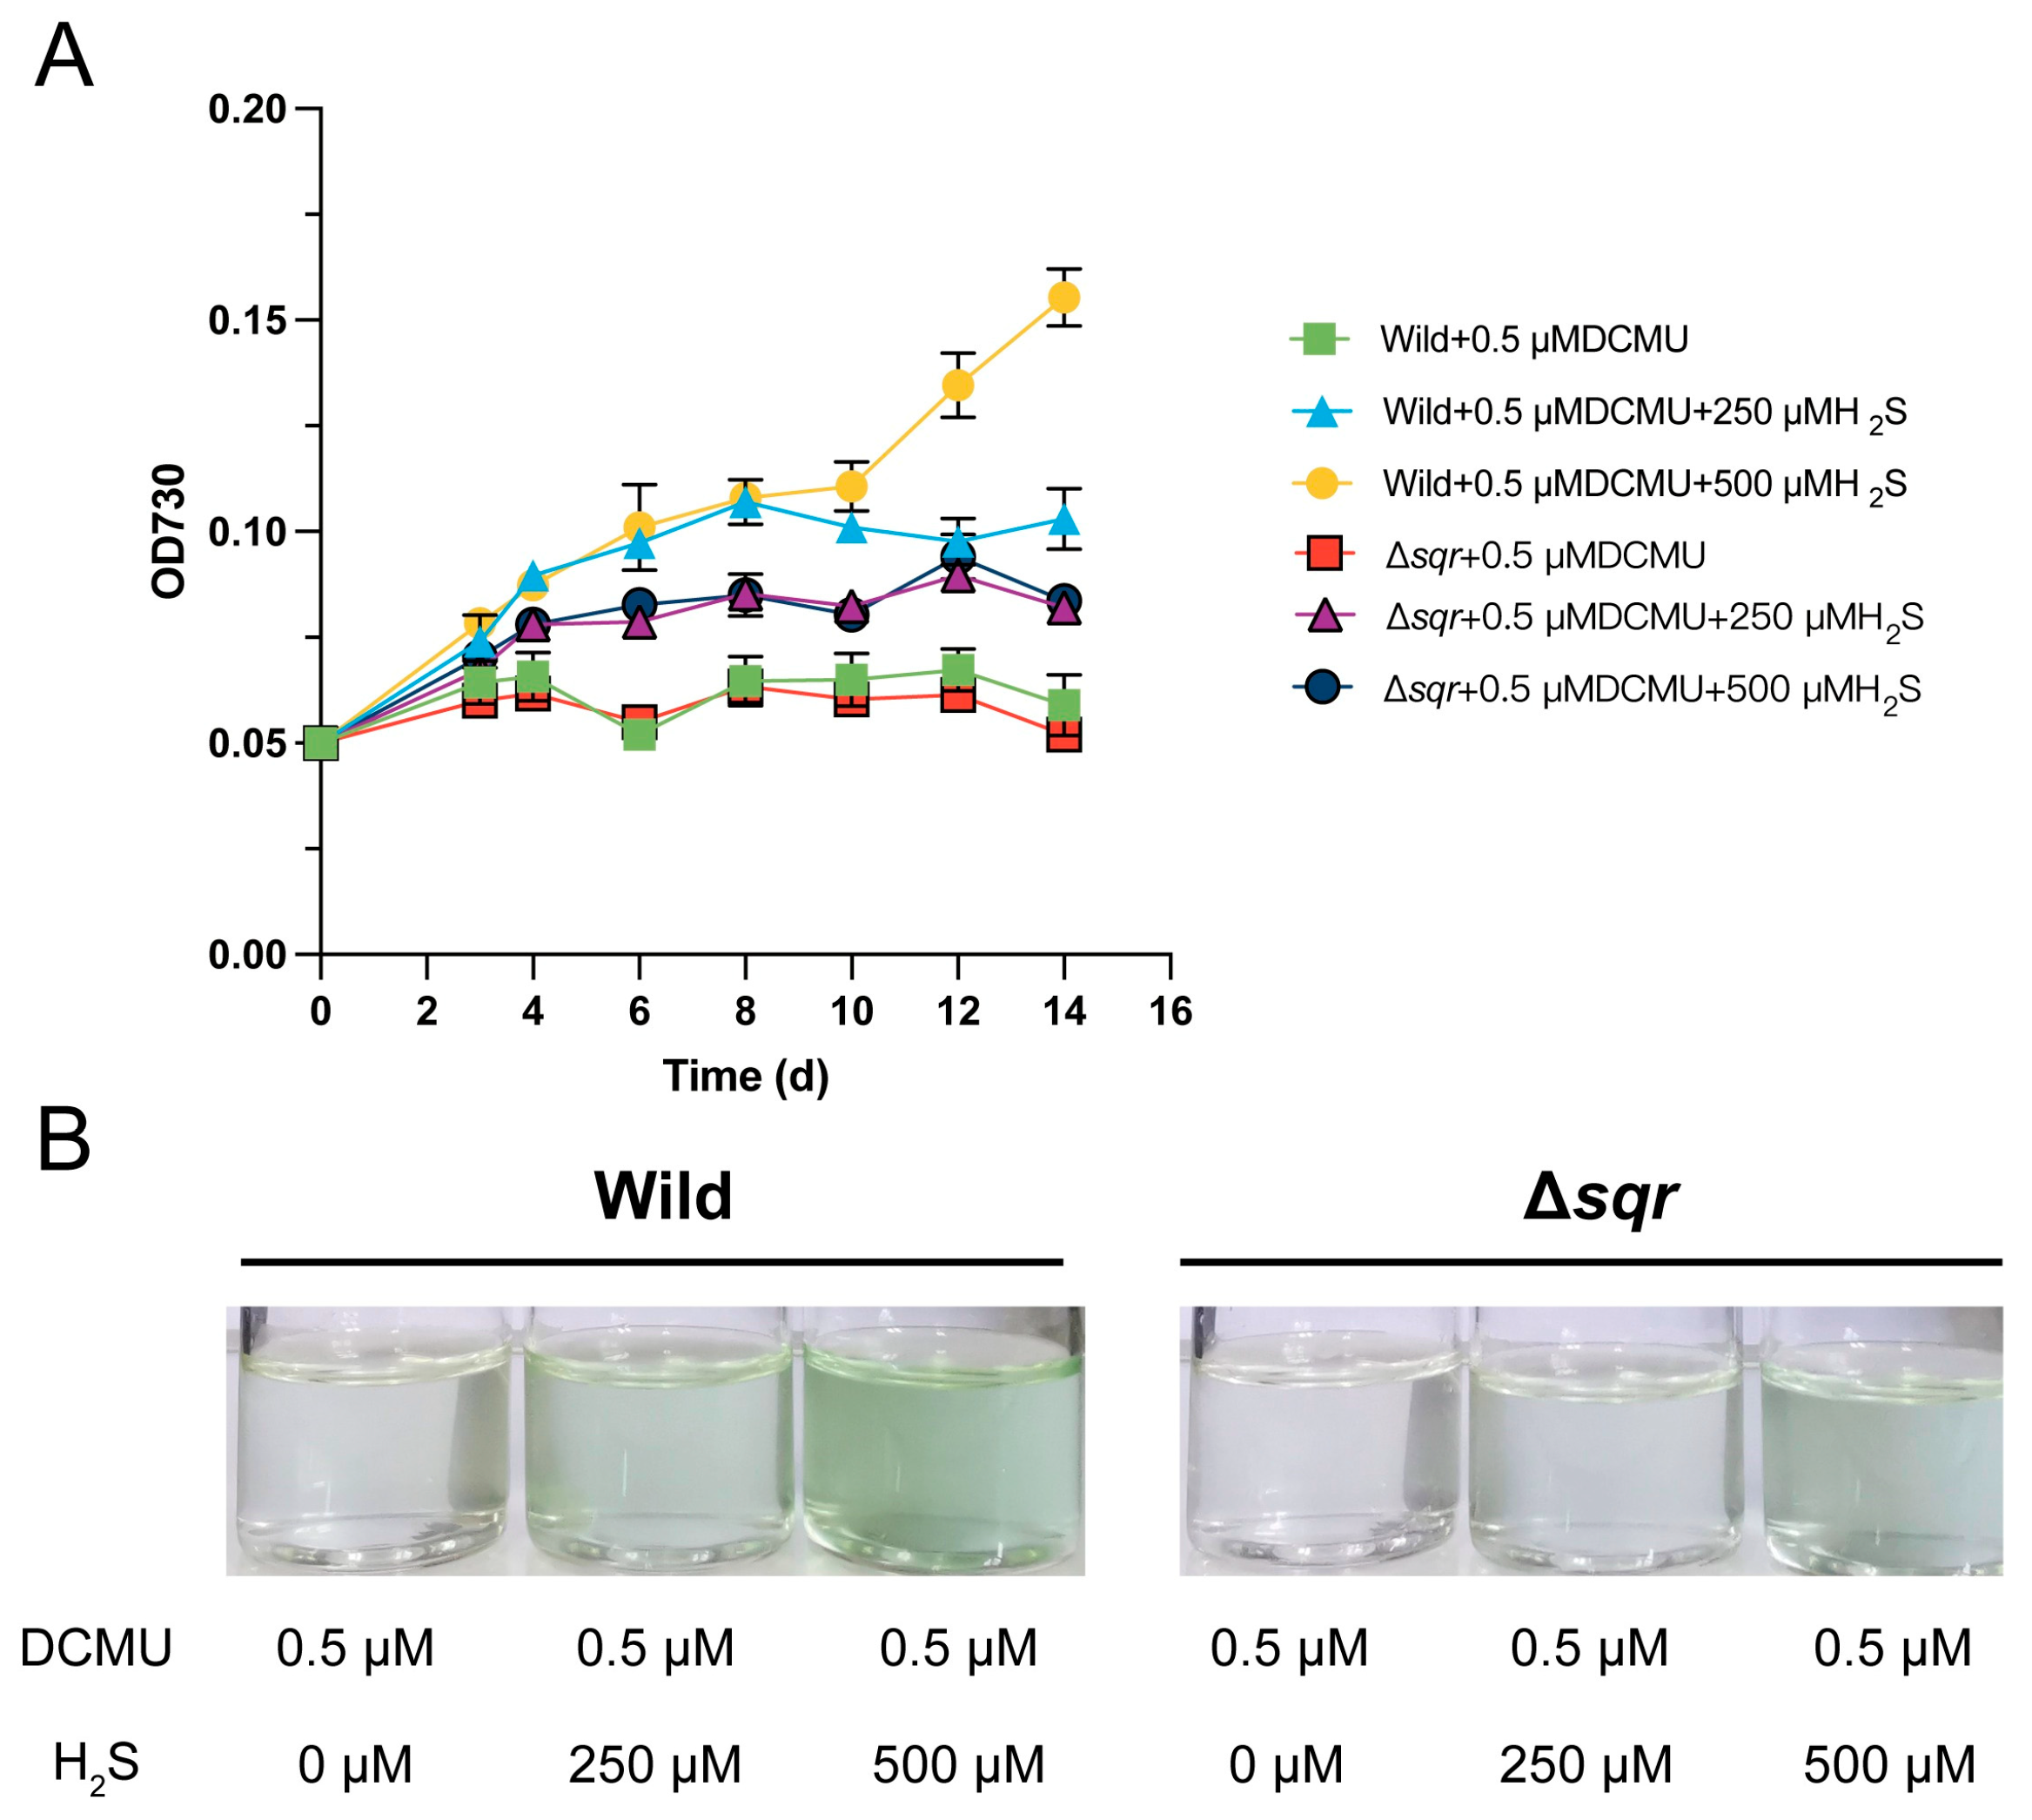
Figure 1. SQR-dependent anoxygenic growth of Synechococcus sp. PCC 7002. (A) Growth kinetics of Synechococcus sp. PCC 7002 (Wild) and the SQR-deficient mutant (Δsqr) cultured under strict anaerobiosis in medium supplemented with 0.5 µM DCMU. Cultures were additionally supplied with 0, 250 or 500 µM H2S. Optical density at 730 nm (OD730) was monitored for 15 days. Data points represent the mean of three biological replicates; error bars indicate ± SD. (B) Representative photographs of the cultures after 15 days of incubation. Synechococcus sp. PCC 7002 cells (Wild) recovered normal growth in the presence of 250–500 µM H2S, whereas the SQR-deficient mutant (Δsqr) remained arrested regardless of H2S addition, confirming that SQR-mediated H2S oxidation is essential for anoxygenic photosynthetic growth.
Antioxidants 14 01122 g001
Figure 2. The transcriptional response of Synechococcus sp. PCC7002 to H2Sn and H2O2. (A,B) Volcano plots displaying differentially expressed genes (DEGs) after 1 mM H2Sn (A) or 1 mM H2O2 (B) treatment for 60 min. Horizontal dashed lines denote the adjusted p-value threshold (padj < 0.05); vertical dashed lines mark |log2 FC| ≥ 1. (C) Venn diagram comparing the total sets of DEGs (up- and downregulated) between the two treatments. (D,E) Overlaps among upregulated (D) and downregulated (E) genes in response to H2Sn and H2O2. (F,G) KEGG pathway enrichment analyses of DEGs following H2Sn (F) and H2O2 (G) exposure. Bubble size indicates the number of enriched genes; color intensity represents log10 (padj); and the x-axis (RichFactor) reflects the proportion of DEGs relative to all genes in each pathway. The dashed line indicates a log2FoldChange of 1.
Antioxidants 14 01122 g002
Figure 3. The effect of H2Sn and H2O2 on photosynthesis process of Synechococcus sp. PCC7002. (A) Schematic of the Calvin–Benson–Bassham cycle and the photosynthetic electron-transport chain (thylakoid membrane) highlighting genes that were differentially expressed (|log2 FC| ≥ 1, padj < 0.05) after exposure to 250, 500 or 1000 µM H2Sn and H2O2. The details of Figure 3 were adapted from the work of Dr. Donald A. Bryant, Dr. Jindong Zhao, and colleagues [40,41]. (B) Heat map displaying the log2 fold-change values of all photosynthesis-related DEGs.
Antioxidants 14 01122 g003
Figure 4. The effect of H2Sn and H2O2 on central carbon metabolism and energy production of Synechococcus sp. PCC7002. (A) Schematic overview of the TCA cycle and glycolysis indicating differentially expressed genes (|log2 FC| ≥ 1, padj < 0.05) after exposure to 250, 500 or 1000 µM H2Sn and H2O2. (B) Simplified oxidative-phosphorylation electron-transport chain highlighting the same DEG sets. Complexes I–V are shown with their corresponding gene products. (C) Heat map of log2 fold-changes for all DEGs associated with glycolysis, the TCA cycle and oxidative phosphorylation. The color scale ranges from −3 (strong repression, blue) to +3 (strong induction, red).
Antioxidants 14 01122 g004
Figure 5. Synechococcus sp. PCC7002 showed different tolerance to H2Sn and H2O2. (A) The effect of H2Sn on the growth of Synechococcus sp. PCC7002; (B) The effect of H2O2 on the growth of Synechococcus sp. PCC7002; (C) Heat map of differentially expressed genes involved in H2Sn and H2O2 metabolism after 60 min treatment with 250, 500 or 1000 µM H2Sn (left) or H2O2 (right). Gene expression changes are shown as log2 FC relative to untreated controls; the color scale spans −6 (blue, strong repression) to +6 (red, strong induction). Core antioxidant genes (sod2, katG, gpx, grx and prx paralogs) were selectively upregulated by H2O2, whereas sulfur-handling genes (sqr, cysK1/2, rhod1/2) responded predominantly to H2Sn.
Antioxidants 14 01122 g005
Disclaimer/Publisher’s Note: The statements, opinions and data contained in all publications are solely those of the individual author(s) and contributor(s) and not of MDPI and/or the editor(s). MDPI and/or the editor(s) disclaim responsibility for any injury to people or property resulting from any ideas, methods, instructions or products referred to in the content.