
Altered Functional Connectivity and Complexity in Major Depressive Disorder after Musical Stimulation
by
 ,
,
Pintao Qiu
1,
Jinxiao Dai
1,2,*,
Ting Wang
1,2,3,*,
Hangcheng Li
4,
Cunbin Ma
3 and
Xugang Xi
1,2,3 1
HDU-ITMO Joint Institute, Hangzhou Dianzi University, Hangzhou 310018, China
2
Key Laboratory of Brain Machine Collaborative Intelligence of Zhejiang Province, Hangzhou 310018, China
3
School of Automation, Hangzhou Dianzi University, Hangzhou 310018, China
4
Hangzhou Mingzhou Naokang Rehabilitation Hospital, Hangzhou 311215, China
*
Authors to whom correspondence should be addressed.
Brain Sci. 2022, 12(12), 1680; https://doi.org/10.3390/brainsci12121680
Submission received: 17 October 2022
/
Revised: 24 November 2022
/
Accepted: 30 November 2022
/
Published: 7 December 2022
(This article belongs to the Special Issue Advanced Functional Connectivity Analysis in Neuropsychiatric Disorders)
Abstract
:Major depressive disorder (MDD) is a common mental illness. This study used electroencephalography (EEG) to explore the effects of music therapy on brain networks in MDD patients and to elucidate changes in functional brain connectivity in subjects before and after musical stimulation. EEG signals were collected from eight MDD patients and eight healthy controls. The phase locking value was adopted to calculate the EEG correlation of different channels in different frequency bands. Correlation matrices and network topologies were studied to analyze changes in functional connectivity between brain regions. The results of the experimental analysis found that the connectivity of the delta and beta bands decreased, while the connectivity of the alpha band increased. Regarding the characteristics of the EEG functional network, the average clustering coefficient, characteristic path length and degree of each node in the delta band decreased significantly after musical stimulation, while the characteristic path length in the beta band increased significantly. Characterized by the average clustering coefficient and characteristic path length, the classification of depression and healthy controls reached 93.75% using a support vector machine.
1. Introduction
Major depressive disorder (MDD) is a common multidimensional disorder [1,2]. Symptoms often include lack of energy and loss of interest in life [3]. Compared with other diseases, MDD mainly impairs social cognitive function [4,5,6]. As a major worldwide disease, the treatment of MDD is usually divided into drug therapy and psychotherapy [7,8]. Although drugs are the main treatment for depression, 20% of patients cannot take them because of strong adverse drug reactions or psychological problems [9]. Psychotherapy as an alternative option, such as through music therapy, has been shown to significantly relieve depression in clinical studies [10]. Numerous studies have shown that the expression of music can improve the functioning of the nervous and endocrine systems [11,12]. At the same time, music therapy also provides patients with the opportunity to express their inner emotions through music, which can enable patients to obtain opportunities for self-expression through musical activities [13,14]. Therefore, musical stimulation therapy has been proven to be a new approach in the treatment of MDD patients, and the effect is widely recognized [15,16,17].
Music therapy is a great help in treating MDD [18,19,20], but the specific changes in brain connectivity that this treatment modifies are unknown. Electroencephalography (EEG) is a non-invasive real-time neuroimaging technique. Benefiting from its high temporal resolution, EEG records electrical activity in relation to neuronal activity with excellent temporal resolution on the order of milliseconds. These advantages of EEG make it an irreplaceable technique when observing the brain [21]. EEG, combined with graph-theory-based network analysis, is gradually being used to explain the topology of brain networks and to analyze functional connections in the brain [22]. Functional connectivity (FC) is defined as the statistical interdependence between spatially distant neurophysiological regions, most commonly the correlation or coherence assessment between signals from pairs of electrodes [23]. FC provides a new approach to the rehabilitation of MDD patients [24]. Most of the research on MDD is based on non-invasive imaging, such as fMRI and EEG [25,26]. Signal features, including FC, are extracted by these techniques to understand data on normal or pathological brain states. EEG research focuses on MDD feature extraction and classification [27,28,29]. EEG-based signal feature extraction and classification of MDD patients focuses on the resting state or repetitive task state, which is different from the test state under natural conditions, as the world in which people live is changeable. As a part of daily entertainment, music can improve people’s spiritual world, open closed hearts, and relieve depression [30,31]. Music therapy has emerged as a powerful tool in the treatment of MDD, and previous research has focused on exploring differences in how the brain responds to musical stimuli [32,33]. However, these approaches have yet to explain what the music changes to dampen the brain’s hypoactive state. By combining EEG with musical stimulation therapy and decomposing EEG signals into different frequency bands, differences in brain function in response to musical stimulation were revealed [34,35,36,37]. When people are in different active states, there are differences in EEG signals of different frequencies [38,39]. Previous studies have demonstrated that the FC of MDD changes in different frequency bands, so the diagnosis of MDD by FC analysis with different frequency bands is worth investigating [40]. Specific frequency changes and specific network connectivity changes were seen in behavioral cognitive tasks, especially during music perception. According to He et al., music therapy relieves clinical MDD symptoms by improving functional brain connectivity and increasing connectivity with changes in FC [41,42]. These results support our hypothesis that functional connectivity across frequency bands is altered during musical stimulation therapy in MDD patients. Nonetheless, the mechanisms underlying functional connectivity problems and brain responses during musical stimulation therapy in MDD patients are unclear.
In the EEG sensor space, the brain network consists of nodes and edges, where electrodes represent nodes and channel connections represent edges [43,44]. Various network properties are valid measures for quantifying functional integration and functional segregation in the brain. At present, the feature matrix of EEG functional connectivity mainly adopts correlation and coherent coupling methods. Phase-locking value (PLV) and coherence have stable effects on bulk conductivity [45]. Therefore, this paper adopts the PLV algorithm to calculate the correlation between EEG channels. By comparing the results of functional linkages, biomarkers that distinguish MDD and control groups were extracted.
This study mainly analyzes the network changes of MDD in different frequency bands before and after musical stimulation. The connectivity matrix and topology graph are compared, and the network properties of graph theory are analyzed. The network features mainly include path length, node degree and clustering coefficient.
2. Materials and Methods
2.1. Participants
A total of 16 subjects were selected for this study, including 8 patients with major depressive disorder and 8 healthy controls. All subjects signed written consent. The ethics review was approved by the Ethics Committee of Hangzhou Mingzhou Naokang Rehabilitation Hospital, approval number 20210201. Of the 8 patients selected, 6 were male and 2 were female. Age: 24–51 years (mean ± SD: 30.85 ± 7.5 years). Patients with severe depression were from the Seventh People’s Hospital of Hangzhou. The patients were surveyed with a depression scale. Questionnaires included the Generalized Anxiety Disorder (GAD-7) and Patient Health Questionnaires (PHQ-9). The short international interview exam for neuropsychiatric disorders was used to screen patients for depression. The main criteria were the Diagnostic and Statistical Manual of Mental Disorders-IV (Dsm-5) fourth edition criteria. The inclusion criteria for major depressive disorder were: patients with PHQ-9 scores greater than 10 and GAD-7 scores greater than 10. All participants signed an informed consent form. To exclude cognitive impairment, the educational background of subjects was required to be reported. The education level of the patients was divided into two levels: 2 with a master’s degree and 6 with a bachelor’s degree.
Eight healthy controls (HC) were selected for the experiment, aged from 24 to 48 years old (mean ± SD: 27.65 ± 8.6 years old), and all were male. They all had college degrees. Demographic variables of depressed patients and healthy controls are shown in Table 1. The inclusion criteria for healthy control samples included:
- (1)
- Age matching with depression patients.
- (2)
- In good physical and mental health, with no history of mental illness.
- (3)
- A PHQ-9 questionnaire score of less than 4.
- (4)
- Exclusion of individuals with chronic diseases.
- (5)
- Cognitively normal, no history of major depression, schizophrenia, bipolar disorder, or drug abuse, and no medication that may affect cognition and walking.
2.2. EEG Data Acquisition and Preprocessing
64-channel (NeuSen.W64, Neuracle, Changzhou City, China) EEG signals were collected at a sampling frequency of 500 Hz. The instrument used in this study adopted the 10–20 international EEG standard. Before the electrodes were connected, each subject cleaned the area of contact. During the experiment, the impedance of each electrode was maintained below 15 . In order to visualize the whole-brain functional connectivity activity, the Fp1, Fp2, Fpz, F3, F4, F7, F8, Cz, C3, C4, T7, T8, Pz, P3, P4, P7, P8, O1 and O2 channels were retained, and the remaining channels were excluded.
We used the EEGLAB toolbox for EEG data processing. EEGLAB is an open-source MATLAB toolkit that uses a visual interface to rapidly process biological signals [46]. The EEG signal whose re-reference form was a common average reference was preprocessed using the EEGLAB toolbox. All EEG signals were bandpass filtered using finite impulse response filters with cutoff frequencies of 0.1 Hz and 30 Hz. Any 50 Hz powerline interference was eliminated using EEGLAB’s independent components. Additionally, abnormal fragments were removed manually. Similarly, blinking and eye movements were eliminated manually by visual examination as well as by using independent component analysis techniques. Here, components that represented artifacts, such as blinking, eye movements and muscle activity, were removed. Typically, for each subject, only one or two independent components associated with blinking or eye movements were removed, and the remaining components were used for analysis.
2.3. Experimental Paradigm
In this experiment, the EEG data of healthy controls and depressed patients were collected. EEG signals were collected while the subjects were in resting state. The experiment was divided into three parts, totaling six minutes. The specific steps are as follows: (1) the patient’s resting state data for 1 min in the relaxed state was collected; (2) music audio was played to stimulate the patient for 4 min; (3) 1 min resting EEG signal was collected again after musical stimulation. The EEG acquisition process is shown in Figure 1. The music signal used in the experiment was a piece of soft music selected by hospital experts conducive to mental relaxation. Music standards were recommended by doctors and voted on by all participants. The final choice was Canon in D Major, author Dylanf.
2.4. Data Analysis
2.4.1. Phase Locking Value
Phase-locking value (PLV) statistics are a time course, so phase-locking values can be used to observe instantaneous changes in connectivity [47]. The synchronization algorithm, based on Hilbert transform, has been widely used in correlation analysis between multi-channel EEG signals. In this experiment, the phase was used to calculate the PLV, and the Hilbert transform of the signal is defined as:
For a single-channel EEG signal x(t), the analytical signal can be defined as:
where is the phase of and is the magnitude of . is the complex signal obtained with the help of phase by Euler’s formula. The PLV of this study was defined as:
where represents the phase difference of the two signals. If PLV = 0, and are not synchronized, and if PLV = 1, it means that the two signals are completely synchronized. represents the average over time.
Determining the adjacency matrix based on the PLV is defined as:
where is the length of the time series.
2.4.2. Network Characteristics
The constructed PLV-based functional brain network was used to characterize the connection structure between the MDD brain channel pairs under different musical stimuli. The building process of the brain functional network can be thought of as a process of abstractly representing connections between brain regions as nodes and connecting edges. The analysis of brain functional segregation is based on the local scale, and local measures focus on the functional differentiation capacity of the brain and measure the clustering properties within the brain network [48]. Because the brain functional network is complex and changeable, in order to further monitor the functional state of the brain, graph theory is used to extract multiple topological properties of the brain functional network: the brain functional network is constructed to extract the clustering coefficients and characteristic path lengths under different bands [49,50,51]. In this study, the corresponding local features are extracted for each PLV network constructed.
The degree in the network represents the number of connections between a node and other nodes, and can be used as a measure to analyze the importance of a node in the network. The clustering coefficient of the brain function network indicates the possibility that the neighbors of a node become neighbors of each other [52,53,54]. The clustering coefficient (CC) of a node can reflect the closeness of the association relationship between the node groups in the network and is defined as:
where is the total number of nodes, represents the number of adjacent nodes that the node has, and represents the number of relationships between the network through i-neighbor nodes.
The characteristic path length is the average of the shortest path lengths between two nodes [55]. The length of the characteristic path can measure the information interaction strength between two nodes. The shorter the length, the stronger the information interaction between the two nodes, which can effectively characterize the connectivity of the two nodes. The characteristic path length (CPL) is used to measure the robustness of the network topology, and it is defined as:
where represents the number of nodes in the network, and represent different types of nodes in the network, and represents the distance between point and point .
3. Results
3.1. Network Analysis
Figure 2 shows the correlation matrix constructed using the PLV of the EEG signals for MDD (before and after music stimuli) and HC in four frequency bands: delta (0.5–4 Hz), theta (4–8 Hz), alpha (8–13 Hz), and beta (13–30 Hz). In the delta band, the phase lag index of depressed patients was higher than that of healthy controls, and the phase lag index of depressed patients decreased in multiple channels after the musical stimulation. In the theta band, the phase lag index was slightly higher in healthy controls than in depressed patients in the parieto-occipital lobe. However, after musical stimulation, the phase lag index of depressed patients showed different changes in different regions, although there was an overall increase, but no obvious regularity. In the alpha band, the phase lag index of the EEG signals in depressed patients increased significantly in the parietal and occipital regions and slightly in the frontal and polar regions after musical stimulation, but decreased in other locations. Compared with the healthy control group, the phase lag index of depressed patients in the alpha frequency band was decreased overall, and some regions were higher than the control group. In the beta band, the index of the healthy control group was higher than that of depressed patients, and after musical stimulation, the phase lag index of depressed patients also increased. According to the matrix, it can be found that in the beta band, the phase lag index changed significantly with significant regularity.
In order to show the connection of brain regions more clearly, we drew a network topology map using the binary sentence method as shown in Figure 3. In the delta band, the association of depressed patients decreased after musical stimulation, mainly in the frontal pole and frontal lobe, and also in the parietal lobe. Healthy controls were less connected to this band than depressed patients. In the theta band, the topological connection increased after musical stimulation, and the connection in the central region increased. In the alpha band, depressed patients showed improved left–right brain symmetry and slightly improved connectivity between the frontal and central regions after musical stimulation. Healthy controls and musical stimulation did not change much in the brain topology of depression. In the beta band, after musical stimulation, the functional topology connectivity of depressed patients’ brains was reduced, mainly in the frontal lobe and central region, especially in the left hemisphere. Healthy controls were also less connected than depressed patients. In this study, the threshold was 80% of the maximum value.
3.2. Network Properties
The average clustering coefficients of depressed patients before and after musical stimulation and healthy controls in different frequency bands are shown in Figure 4a. As can be seen from the Figure, in the delta band, the clustering coefficient increased significantly after musical stimulation, and the clustering coefficient was higher in depressed patients than in healthy controls (with a significant difference). In other frequency bands, the average clustering coefficient of depressed patients decreased after musical stimulation, but the difference was not significant.
The characteristic path length of the brain functional network in depressed patients before and after musical stimulation, and healthy controls at each frequency band, is shown in Figure 4b. In the beta band, the characteristic path length of the brain functional network in depressed patients increased significantly after musical stimulation, while the characteristic path length of other bands decreased. In addition, compared with healthy controls, the characteristic path length of depressed patients in the beta band was significantly lower than that of healthy samples, while the characteristic path length in the delta band was significantly higher.
The number of node degrees in different frequency bands in the brain functional network of depressed patients and healthy controls is shown in Figure 5. In the delta band, the values of all node degrees decreased in the depressed patients after musical stimulation, and the node degrees were much lower in the normal control group than in the depressed patients. In the theta band, the node degree in the temporal lobe region (T7, T8) was significantly increased in depressed patients compared with healthy controls. In the alpha frequency band, there was no obvious difference in node degree of the brain functional network among different states. In the beta band, the node degree of the central region (Cz, C3, C4) was significantly different between depressed patients and healthy controls, and the musical stimulation had little effect.
3.3. Classification
The main purpose of this section is to classify depression patients and the healthy control group, and discuss the effect of feature recognition from individual directions. According to the above analysis, the average clustering coefficient of the delta band and the characteristic path length and the characteristic path length of the beta band were adopted as the effective features of recognition. Features were classified using Support Vector Machine (SVM), Decision Tree (DT), K-Nearest Neighbor (KNN) and Random Forest (RF) algorithms [56,57,58,59,60]. Ten-fold cross-validation was used. The classification results are shown in Table 2:
4. Discussion
This study explores the effect of musical stimulation therapy on functional brain connectivity in patients with MDD. Specifically, first, subjects’ EEGs before and after music therapy were recorded and preprocessed. Secondly, a PLV-based correlation matrix was constructed according to frequency segmentation, and the phase lag index was used as an evaluation criterion for analysis. In order to intuitively characterize the connectivity of brain regions, we drew the network topology corresponding to the binary matrix. Then, the characteristic path length and average clustering coefficient of the brain function network in each frequency band of depression patients and the healthy control group before and after musical stimulation were used as indicators to calculate the network characteristics. Finally, four machine learning methods were used to classify patients with depression and healthy controls, and the effect of feature recognition was discussed from an individual perspective.
According to Figure 2 and Figure 3, we can analyze the changes in the brain networks before and after musical stimulation. In the delta band, the associated connections in depressed patients were reduced after musical stimulation, and were mainly concentrated in the frontal pole and frontal lobe regions. Studies have shown that delta signals brain abnormalities to a certain extent. The frontal lobe of the brain is responsible for higher levels of thought, including language, emotional expression, and working memory. This partly explains the lower connectivity of the frontal lobe region in the delta band in healthy patients than in depressed patients. The functional network in the delta band may be an important band to distinguish between types of depression. In the theta band, the change in the topology was not obvious. Changes in the alpha band can be analyzed using alpha asymmetry. Alpha is a frequency band that indicates brain health and is strongly associated with depression, and alpha asymmetry is also a biological feature of depression [61,62]. In the beta band, after musical stimulation, the functional topology connectivity of depressed patients was reduced, mainly in the frontal lobe and central region. The reason for this phenomenon may be that beta bands indicate the degree of emotional change and reflect the level of arousal in the brain. In addition, the cluster degree of the healthy control group also decreased in this frequency band, and the difference between the depressed patients and the healthy control group was significant.
The frequency is related to the frequency of the musical stimulus [40]. According to the analysis of the statistical results, for the clustering coefficient, there was a significant difference in the delta frequency band before and after the musical stimulation, and there was also a significant difference between the patients and the control group. For the characteristic path length, there was a significant difference between the delta and beta bands. The results obtained were similar to previous studies [28].
Figure 4 and Figure 5 show the changes to network properties. For average clustering coefficient, the clustering coefficient, which measures the degree of aggregation of nodes in the functional brain network, meant that depressed people were less connected in the delta band and improved after musical stimulation. In other bands, there was little difference between healthy controls and depressed patients. Based on the above analysis, the clustering coefficient in the delta band can be used as a feature to classify depression and health samples. According to Figure 4, since the path length shows the path from a node to another node, the shorter path length also represents the higher information transmission efficiency, indicating that in the beta band, depressed patients have a poor information transmission rate and a tendency of random network. In the theta and alpha bands, the difference between healthy samples and depressed patients was small, making it difficult to analyze their information transmission efficiency.
According to the classification results, SVM had the best classification effect, reaching 93.75%, followed by KNN at 81.25%, and DT had the worst classification performance of only 68.75%. In addition, SVM also had the highest accuracy and recall rate among the classifiers, which shows that SVM has unique advantages in solving the problem of small samples and nonlinear dichotomy. Therefore, the clustering coefficient and characteristic path length can be considered as biomarkers to distinguish MDD from healthy controls.
This study has some limitations. First of all, EEG signals are very susceptible to ex-ternal interference. Although we collected signals in a quiet environment and supplemented the preprocessing, there were still some interferences that we could not completely eliminate. Second, the number of subjects were relatively small, and the decision tree appears to be over-under-fit. Therefore, we need more samples to further verify the results. Finally, the choice of depression assessment scale was too singular, and we can consider choosing MADRS or HAM-A, which is actively implemented by doctors and can analyze individual items. Music therapy has been shown to be effective in the treatment of depression, and future research can consider the effects of different styles of music on depression.
5. Conclusions
This study obtained the following three results. First, delta and beta band connectivity decreased after musical stimulation, while alpha band connectivity increased. Secondly, in terms of EEG functional network characteristics, the average clustering coefficient, characteristic path length and degree of each node in the delta band decreased significantly after musical stimulation, while the characteristic path length in the beta band increased significantly. Finally, the average clustering coefficient and characteristic path length can be used as features to distinguish MDD from healthy controls.
Author Contributions
Conceptualization, P.Q. and J.D.; data curation, X.X.; investigation, H.L.; methodology, C.M.; software, J.D. and T.W.; supervision, T.W.; validation, P.Q.; visualization, P.Q.; writing—original draft, X.X.; writing—review and editing, J.D. All authors have read and agreed to the published version of the manuscript.
Funding
This work was supported by Zhejiang Provincial Key Research and Development Program of China (No. 2021C03031), the National Natural Science Foundation of China (No. 61971169) and Zhejiang Provincial Natural Science Foundation of China (No. LQ21H180005).
Institutional Review Board Statement
The study was conducted in accordance with the Declaration of Helsinki, and approved by the Ethics Committee of Hangzhou Mingzhou Naokang Rehabilitation Hospital (Reference Number: 20210201).
Informed Consent Statement
Informed consent was obtained from all subjects involved in the study.
Data Availability Statement
The data presented in this study are available on request from the corresponding author. The data are not publicly available due to privacy or ethical restrictions.
Acknowledgments
We thank Hangzhou Mingzhou Naokang Rehabilitation Hospital and medical staff for their help in this study.
Conflicts of Interest
The authors declare no conflict of interest.
References
- Otte, C.; Gold, S.M.; Penninx, B.W.; Pariante, C.M.; Etkin, A.; Fava, M.; Mohr, D.C.; Schatzberg, A.F. Major Depressive Disorder. Nat. Rev. Dis. Primers 2016, 2, 16065. [Google Scholar] [CrossRef] [Green Version]
- Ventriglio, A.; Bhugra, D.; Sampogna, G.; Luciano, M.; de Berardis, D.; Sani, G.; Fiorillo, A. From Dysthymia to Treatment-Resistant Depression: Evolution of a Psychopathological Construct. Int. Rev. Psychiatry 2020, 32, 471–476. [Google Scholar] [CrossRef]
- Nystrom, C.; Matousek, M.; Hallstrom, T. Relationships between EEG and Clinical Characteristics in Major Depressive Disorder. Acta Psychiatr. Scand. 1986, 73, 390–394. [Google Scholar] [CrossRef]
- Fava, M.; Kendler, K.S. Major Depressive Disorder. Neuron 2000, 28, 335–341. [Google Scholar] [CrossRef] [Green Version]
- Perna, G.; Daccò, S.; Alciati, A.; Cuniberti, F.; de Berardis, D.; Caldirola, D. Childhood Maltreatment History for Guiding Personalized Antidepressant Choice in Major Depressive Disorder: Preliminary Results from a Systematic Review. Prog. Neuro-Psychopharmacol. Biol. Psychiatry 2021, 107, 110208. [Google Scholar] [CrossRef] [PubMed]
- Tanaka, M.; Vécsei, L. Editorial of Special Issue “Crosstalk between Depression, Anxiety, and Dementia: Comorbidity in Behavioral Neurology and Neuropsychiatry”. Biomedicines 2021, 9, 517. [Google Scholar] [CrossRef] [PubMed]
- Paluska, S.A.; Schwenk, T.L. Physical Activity and Mental Health. Sports Med. 2000, 29, 167–180. [Google Scholar] [CrossRef]
- Tanaka, M.; Szabó, Á.; Spekker, E.; Polyák, H.; Tóth, F.; Vécsei, L. Mitochondrial Impairment: A Common Motif in Neuropsychiatric Presentation? The Link to the Tryptophan–Kynurenine Metabolic System. Cells 2022, 11, 2607. [Google Scholar] [CrossRef] [PubMed]
- Xing, S.; DiPaula, B.A.; Lee, H.Y.; Cooke, C.E. Failure to Fill Electronically Prescribed Antidepressant Medications: A Retrospective Study. Prim. Care Companion CNS Disord. 2011, 13, 26352. [Google Scholar] [CrossRef] [Green Version]
- Aalbers, S.; Fusar-Poli, L.; Freeman, R.E.; Spreen, M.; Ket, J.C.; Vink, A.C.; Maratos, A.; Crawford, M.; Chen, X.-J.; Gold, C. Music Therapy for Depression. Cochrane Database Syst. Rev. 2017, 2017, CD004517. [Google Scholar] [CrossRef] [PubMed]
- Gartlehner, G.; Gaynes, B.N.; Amick, H.R.; Asher, G.N.; Morgan, L.C.; Coker-Schwimmer, E.; Forneris, C.; Boland, E.; Lux, L.J.; Gaylord, S.; et al. Comparative Benefits and Harms of Antidepressant, Psychological, Complementary, and Exercise Treatments for Major Depression: An Evidence Report for a Clinical Practice Guideline from the American College of Physicians. Ann. Intern. Med. 2016, 164, 331–341. [Google Scholar] [CrossRef] [PubMed]
- Erkkilä, J.; Punkanen, M.; Fachner, J.; Ala-Ruona, E.; Pöntiö, I.; Tervaniemi, M.; Vanhala, M.; Gold, C. Individual Music Therapy for Depression: Randomised Controlled Trial. Br. J. Psychiatry 2011, 199, 132–139. [Google Scholar] [CrossRef] [Green Version]
- Frisch, A. Symbol and Structure: Music Therapy for the Adolescent Psychiatric Inpatient. Music Ther. 1990, 9, 16–34. [Google Scholar] [CrossRef] [Green Version]
- Partesotti, E.; Peñalba, A.; Manzolli, J. Digital Instruments and Their Uses in Music Therapy. Nord. J. Music Ther. 2018, 27, 399–418. [Google Scholar] [CrossRef]
- Hanser, S.B. A Music Therapy Strategy for Depressed Older Adults in the Community. J. Appl. Gerontol. 1990, 9, 283–298. [Google Scholar] [CrossRef]
- Deng, J.; Chen, Y.; Zeng, W.; Luo, X.; Li, Y. Brain Response of Major Depressive Disorder Patients to Emotionally Positive and Negative Music. J. Mol. Neurosci. 2022, 72, 2094–2105. [Google Scholar] [CrossRef] [PubMed]
- Bodner, E.; Iancu, I.; Gilboa, A.; Sarel, A.; Mazor, A.; Amir, D. Finding Words for Emotions: The Reactions of Patients with Major Depressive Disorder towards Various Musical Excerpts. Arts Psychother. 2007, 34, 142–150. [Google Scholar] [CrossRef]
- Mahato, S.; Paul, S. Electroencephalogram (EEG) Signal Analysis for Diagnosis of Major Depressive Disorder (MDD): A Review. In Nanoelectronics, Circuits and Communication Systems; Nath, V., Mandal, J.K., Eds.; Springer: Singapore, 2019; pp. 323–335. [Google Scholar]
- Koelsch, S. A Neuroscientific Perspective on Music Therapy. Ann. N. Y. Acad. Sci. 2009, 1169, 374–384. [Google Scholar] [CrossRef]
- Geipel, J.; Koenig, J.; Hillecke, T.K.; Resch, F. Short-Term Music Therapy Treatment for Adolescents with Depression—A Pilot Study. Arts Psychother. 2022, 77, 101874. [Google Scholar] [CrossRef]
- Yasin, S.; Hussain, S.A.; Aslan, S.; Raza, I.; Muzammel, M.; Othmani, A. EEG Based Major Depressive Disorder and Bipolar Disorder Detection Using Neural Networks:A Review. Comput. Methods Programs Biomed. 2021, 202, 106007. [Google Scholar] [CrossRef]
- Shao, X.; Sun, S.; Li, J.; Kong, W.; Zhu, J.; Li, X.; Hu, B. Analysis of Functional Brain Network in MDD Based on Improved Empirical Mode Decomposition with Resting State EEG Data. IEEE Trans. Neural Syst. Rehabil. Eng. 2021, 29, 1546–1556. [Google Scholar] [CrossRef]
- Fingelkurts, A.A.; Fingelkurts, A.A.; Kähkönen, S. Functional Connectivity in the Brain—Is It an Elusive Concept? Neurosci. Biobehav. Rev. 2005, 28, 827–836. [Google Scholar] [CrossRef] [PubMed]
- Sun, S.; Li, X.; Zhu, J.; Wang, Y.; La, R.; Zhang, X.; Wei, L.; Hu, B. Graph Theory Analysis of Functional Connectivity in Major Depression Disorder with High-Density Resting State EEG Data. IEEE Trans. Neural Syst. Rehabil. Eng. 2019, 27, 429–439. [Google Scholar] [CrossRef] [PubMed]
- Porta-Casteràs, D.; Cano, M.; Camprodon, J.A.; Loo, C.; Palao, D.; Soriano-Mas, C.; Cardoner, N. A Multimetric Systematic Review of FMRI Findings in Patients with MDD Receiving ECT. Prog. Neuro-Psychopharmacol. Biol. Psychiatry 2021, 108, 110178. [Google Scholar] [CrossRef] [PubMed]
- Mumtaz, W.; Ali, S.S.A.; Yasin, M.A.M.; Malik, A.S. A Machine Learning Framework Involving EEG-Based Functional Connectivity to Diagnose Major Depressive Disorder (MDD). Med. Biol. Eng. Comput. 2018, 56, 233–246. [Google Scholar] [CrossRef]
- Ebneabbasi, A.; Mahdipour, M.; Nejati, V.; Li, M.; Liebe, T.; Colic, L.; Leutritz, A.L.; Vogel, M.; Zarei, M.; Walter, M.; et al. Emotion Processing and Regulation in Major Depressive Disorder: A 7T Resting-State FMRI Study. Hum. Brain Mapp. 2021, 42, 797–810. [Google Scholar] [CrossRef] [PubMed]
- Liu, W.; Zhang, C.; Wang, X.; Xu, J.; Chang, Y.; Ristaniemi, T.; Cong, F. Functional Connectivity of Major Depression Disorder Using Ongoing EEG during Music Perception. Clin. Neurophysiol. 2020, 131, 2413–2422. [Google Scholar] [CrossRef] [PubMed]
- Di Gregorio, F.; La Porta, F.; Petrone, V.; Battaglia, S.; Orlandi, S.; Ippolito, G.; Romei, V.; Piperno, R.; Lullini, G. Accuracy of EEG Biomarkers in the Detection of Clinical Outcome in Disorders of Consciousness after Severe Acquired Brain Injury: Preliminary Results of a Pilot Study Using a Machine Learning Approach. Biomedicines 2022, 10, 1897. [Google Scholar] [CrossRef] [PubMed]
- Mercadié, L.; Caballe, J.; Aucouturier, J.-J.; Bigand, E. Effect of Synchronized or Desynchronized Music Listening during Osteopathic Treatment: An EEG Study. Psychophysiology 2014, 51, 52–59. [Google Scholar] [CrossRef]
- Kim, J.; André, E. Emotion Recognition Based on Physiological Changes in Music Listening. IEEE Trans. Pattern Anal. Mach. Intell. 2008, 30, 2067–2083. [Google Scholar] [CrossRef]
- Juslin, P.N.; Harmat, L.; Eerola, T. What Makes Music Emotionally Significant? Exploring the Underlying Mechanisms. Psychol. Music 2014, 42, 599–623. [Google Scholar] [CrossRef]
- Juslin, P.N.; Västfjäll, D. Emotional Responses to Music: The Need to Consider Underlying Mechanisms. Behav. Brain Sci. 2008, 31, 559–575. [Google Scholar] [CrossRef] [Green Version]
- Xue, J. EEG Analysis with Wavelet Transform under Music Perception Stimulation. J. Healthc. Eng. 2021, 2021, e9725762. [Google Scholar] [CrossRef]
- Wang, T.; Tang, J.; Wang, C.; Yang, D.; Li, J.; Kong, W.; Xi, X. Effect of Music Stimuli on Corticomuscular Coupling and the Brain Functional Connectivity Network. Biomed. Signal Process. Control 2023, 79, 104264. [Google Scholar] [CrossRef]
- Roh, T.; Song, K.; Cho, H.; Shin, D.; Yoo, H.-J. A Wearable Neuro-Feedback System With EEG-Based Mental Status Monitoring and Transcranial Electrical Stimulation. IEEE Trans. Biomed. Circuits Syst. 2014, 8, 755–764. [Google Scholar] [CrossRef] [PubMed]
- Olbrich, S.; Arns, M. EEG Biomarkers in Major Depressive Disorder: Discriminative Power and Prediction of Treatment Response. Int. Rev. Psychiatry 2013, 25, 604–618. [Google Scholar] [CrossRef] [PubMed]
- Khambhati, A.N.; Shafi, A.; Rao, V.R.; Chang, E.F. Long-Term Brain Network Reorganization Predicts Responsive Neurostimulation Outcomes for Focal Epilepsy. Sci. Transl. Med. 2021, 13, eabf6588. [Google Scholar] [CrossRef]
- Pulvermüller, F.; Tomasello, R.; Henningsen-Schomers, M.R.; Wennekers, T. Biological Constraints on Neural Network Models of Cognitive Function. Nat. Rev. Neurosci. 2021, 22, 488–502. [Google Scholar] [CrossRef] [PubMed]
- Wang, Z.; Fang, J.; Liu, J.; Rong, P.; Jorgenson, K.; Park, J.; Lang, C.; Hong, Y.; Zhu, B.; Kong, J. Frequency-Dependent Functional Connectivity of the Nucleus Accumbens during Continuous Transcutaneous Vagus Nerve Stimulation in Major Depressive Disorder. J. Psychiatr. Res. 2018, 102, 123–131. [Google Scholar] [CrossRef]
- He, H.; Yang, M.; Duan, M.; Chen, X.; Lai, Y.; Xia, Y.; Shao, J.; Biswal, B.B.; Luo, C.; Yao, D. Music Intervention Leads to Increased Insular Connectivity and Improved Clinical Symptoms in Schizophrenia. Front. Neurosci. 2018, 11, 744. [Google Scholar] [CrossRef]
- Fachner, J.; Gold, C.; Erkkilä, J. Music Therapy Modulates Fronto-Temporal Activity in Rest-EEG in Depressed Clients. Brain Topogr 2013, 26, 338–354. [Google Scholar] [CrossRef]
- Sporns, O. Network Analysis, Complexity, and Brain Function. Complexity 2002, 8, 56–60. [Google Scholar] [CrossRef]
- Mammone, N.; de Salvo, S.; Bonanno, L.; Ieracitano, C.; Marino, S.; Marra, A.; Bramanti, A.; Morabito, F.C. Brain Network Analysis of Compressive Sensed High-Density EEG Signals in AD and MCI Subjects. IEEE Trans. Ind. Inform. 2019, 15, 527–536. [Google Scholar] [CrossRef]
- Behrouzi, T.; Hatzinakos, D. Graph Variational Auto-Encoder for Deriving EEG-Based Graph Embedding. Pattern Recognit. 2022, 121, 108202. [Google Scholar] [CrossRef]
- Delorme, A.; Makeig, S. EEGLAB: An Open Source Toolbox for Analysis of Single-Trial EEG Dynamics Including Independent Component Analysis. J. Neurosci. Methods 2004, 134, 9–21. [Google Scholar] [CrossRef] [PubMed] [Green Version]
- Duc, N.T.; Lee, B. Microstate Functional Connectivity in EEG Cognitive Tasks Revealed by a Multivariate Gaussian Hidden Markov Model with Phase Locking Value. J. Neural Eng. 2019, 16, 026033. [Google Scholar] [CrossRef]
- Power, J.D.; Fair, D.A.; Schlaggar, B.L.; Petersen, S.E. The Development of Human Functional Brain Networks. Neuron 2010, 67, 735–748. [Google Scholar] [CrossRef] [Green Version]
- Stam, C.J.; de Haan, W.; Daffertshofer, A.; Jones, B.F.; Manshanden, I.; van Cappellen van Walsum, A.M.; Montez, T.; Verbunt, J.P.A.; de Munck, J.C.; van Dijk, B.W.; et al. Graph Theoretical Analysis of Magnetoencephalographic Functional Connectivity in Alzheimer’s Disease. Brain 2009, 132, 213–224. [Google Scholar] [CrossRef] [PubMed]
- Zhang, J.; Wang, J.; Wu, Q.; Kuang, W.; Huang, X.; He, Y.; Gong, Q. Disrupted Brain Connectivity Networks in Drug-Naive, First-Episode Major Depressive Disorder. Biol. Psychiatry 2011, 70, 334–342. [Google Scholar] [CrossRef]
- Singh, M.K.; Kesler, S.R.; Hadi Hosseini, S.M.; Kelley, R.G.; Amatya, D.; Hamilton, J.P.; Chen, M.C.; Gotlib, I.H. Anomalous Gray Matter Structural Networks in Major Depressive Disorder. Biol. Psychiatry 2013, 74, 777–785. [Google Scholar] [CrossRef]
- Fraiman, D.; Saunier, G.; Martins, E.F.; Vargas, C.D. Biological Motion Coding in the Brain: Analysis of Visually Driven EEG Functional Networks. PLoS ONE 2014, 9, e84612. [Google Scholar] [CrossRef]
- Vecchio, F.; Miraglia, F.; Marra, C.; Quaranta, D.; Vita, M.G.; Bramanti, P.; Rossini, P.M. Human Brain Networks in Cognitive Decline: A Graph Theoretical Analysis of Cortical Connectivity from EEG Data. J. Alzheimer’s Dis. 2014, 41, 113–127. [Google Scholar] [CrossRef]
- Liu, T.; Chen, Y.; Lin, P.; Wang, J. Small-World Brain Functional Networks in Children with Attention-Deficit/Hyperactivity Disorder Revealed by EEG Synchrony. Clin. EEG Neurosci. 2015, 46, 183–191. [Google Scholar] [CrossRef]
- Brumbaugh-Smith, J.; Shier, D. An Empirical Investigation of Some Bicriterion Shortest Path Algorithms. Eur. J. Oper. Res. 1989, 43, 216–224. [Google Scholar] [CrossRef]
- Tatar, A.B. Biometric Identification System Using EEG Signals. Neural Comput. Appl. 2022, 1–15. [Google Scholar] [CrossRef]
- Cervantes, J.; Garcia-Lamont, F.; Rodríguez-Mazahua, L.; Lopez, A. A Comprehensive Survey on Support Vector Machine Classification: Applications, Challenges and Trends. Neurocomputing 2020, 408, 189–215. [Google Scholar] [CrossRef]
- Zulfiqar, H.; Yuan, S.-S.; Huang, Q.-L.; Sun, Z.-J.; Dao, F.-Y.; Yu, X.-L.; Lin, H. Identification of Cyclin Protein Using Gradient Boost Decision Tree Algorithm. Comput. Struct. Biotechnol. J. 2021, 19, 4123–4131. [Google Scholar] [CrossRef]
- Mucherino, A.; Papajorgji, P.J.; Pardalos, P.M. K-Nearest Neighbor Classification. In Data Mining in Agriculture; Mucherino, A., Papajorgji, P.J., Pardalos, P.M., Eds.; Springer Optimization and Its Applications; Springer: New York, NY, USA, 2009; pp. 83–106. ISBN 978-0-387-88615-2. [Google Scholar]
- Belgiu, M.; Drăguţ, L. Random Forest in Remote Sensing: A Review of Applications and Future Directions. ISPRS J. Photogramm. Remote Sens. 2016, 114, 24–31. [Google Scholar] [CrossRef]
- Van der Vinne, N.; Vollebregt, M.A.; van Putten, M.J.A.M.; Arns, M. Frontal Alpha Asymmetry as a Diagnostic Marker in Depression: Fact or Fiction? A Meta-Analysis. NeuroImage Clin. 2017, 16, 79–87. [Google Scholar] [CrossRef]
- Roh, S.-C.; Kim, J.S.; Kim, S.; Kim, Y.; Lee, S.-H. Frontal Alpha Asymmetry Moderated by Suicidal Ideation in Patients with Major Depressive Disorder: A Comparison with Healthy Individuals. Clin. Psychopharmacol. Neurosci. 2020, 18, 58–66. [Google Scholar] [CrossRef]
Figure 1.
EEG acquisition process. (A) Experimental flowchart; (B) time distribution of musical stimulation.
Figure 1.
EEG acquisition process. (A) Experimental flowchart; (B) time distribution of musical stimulation.
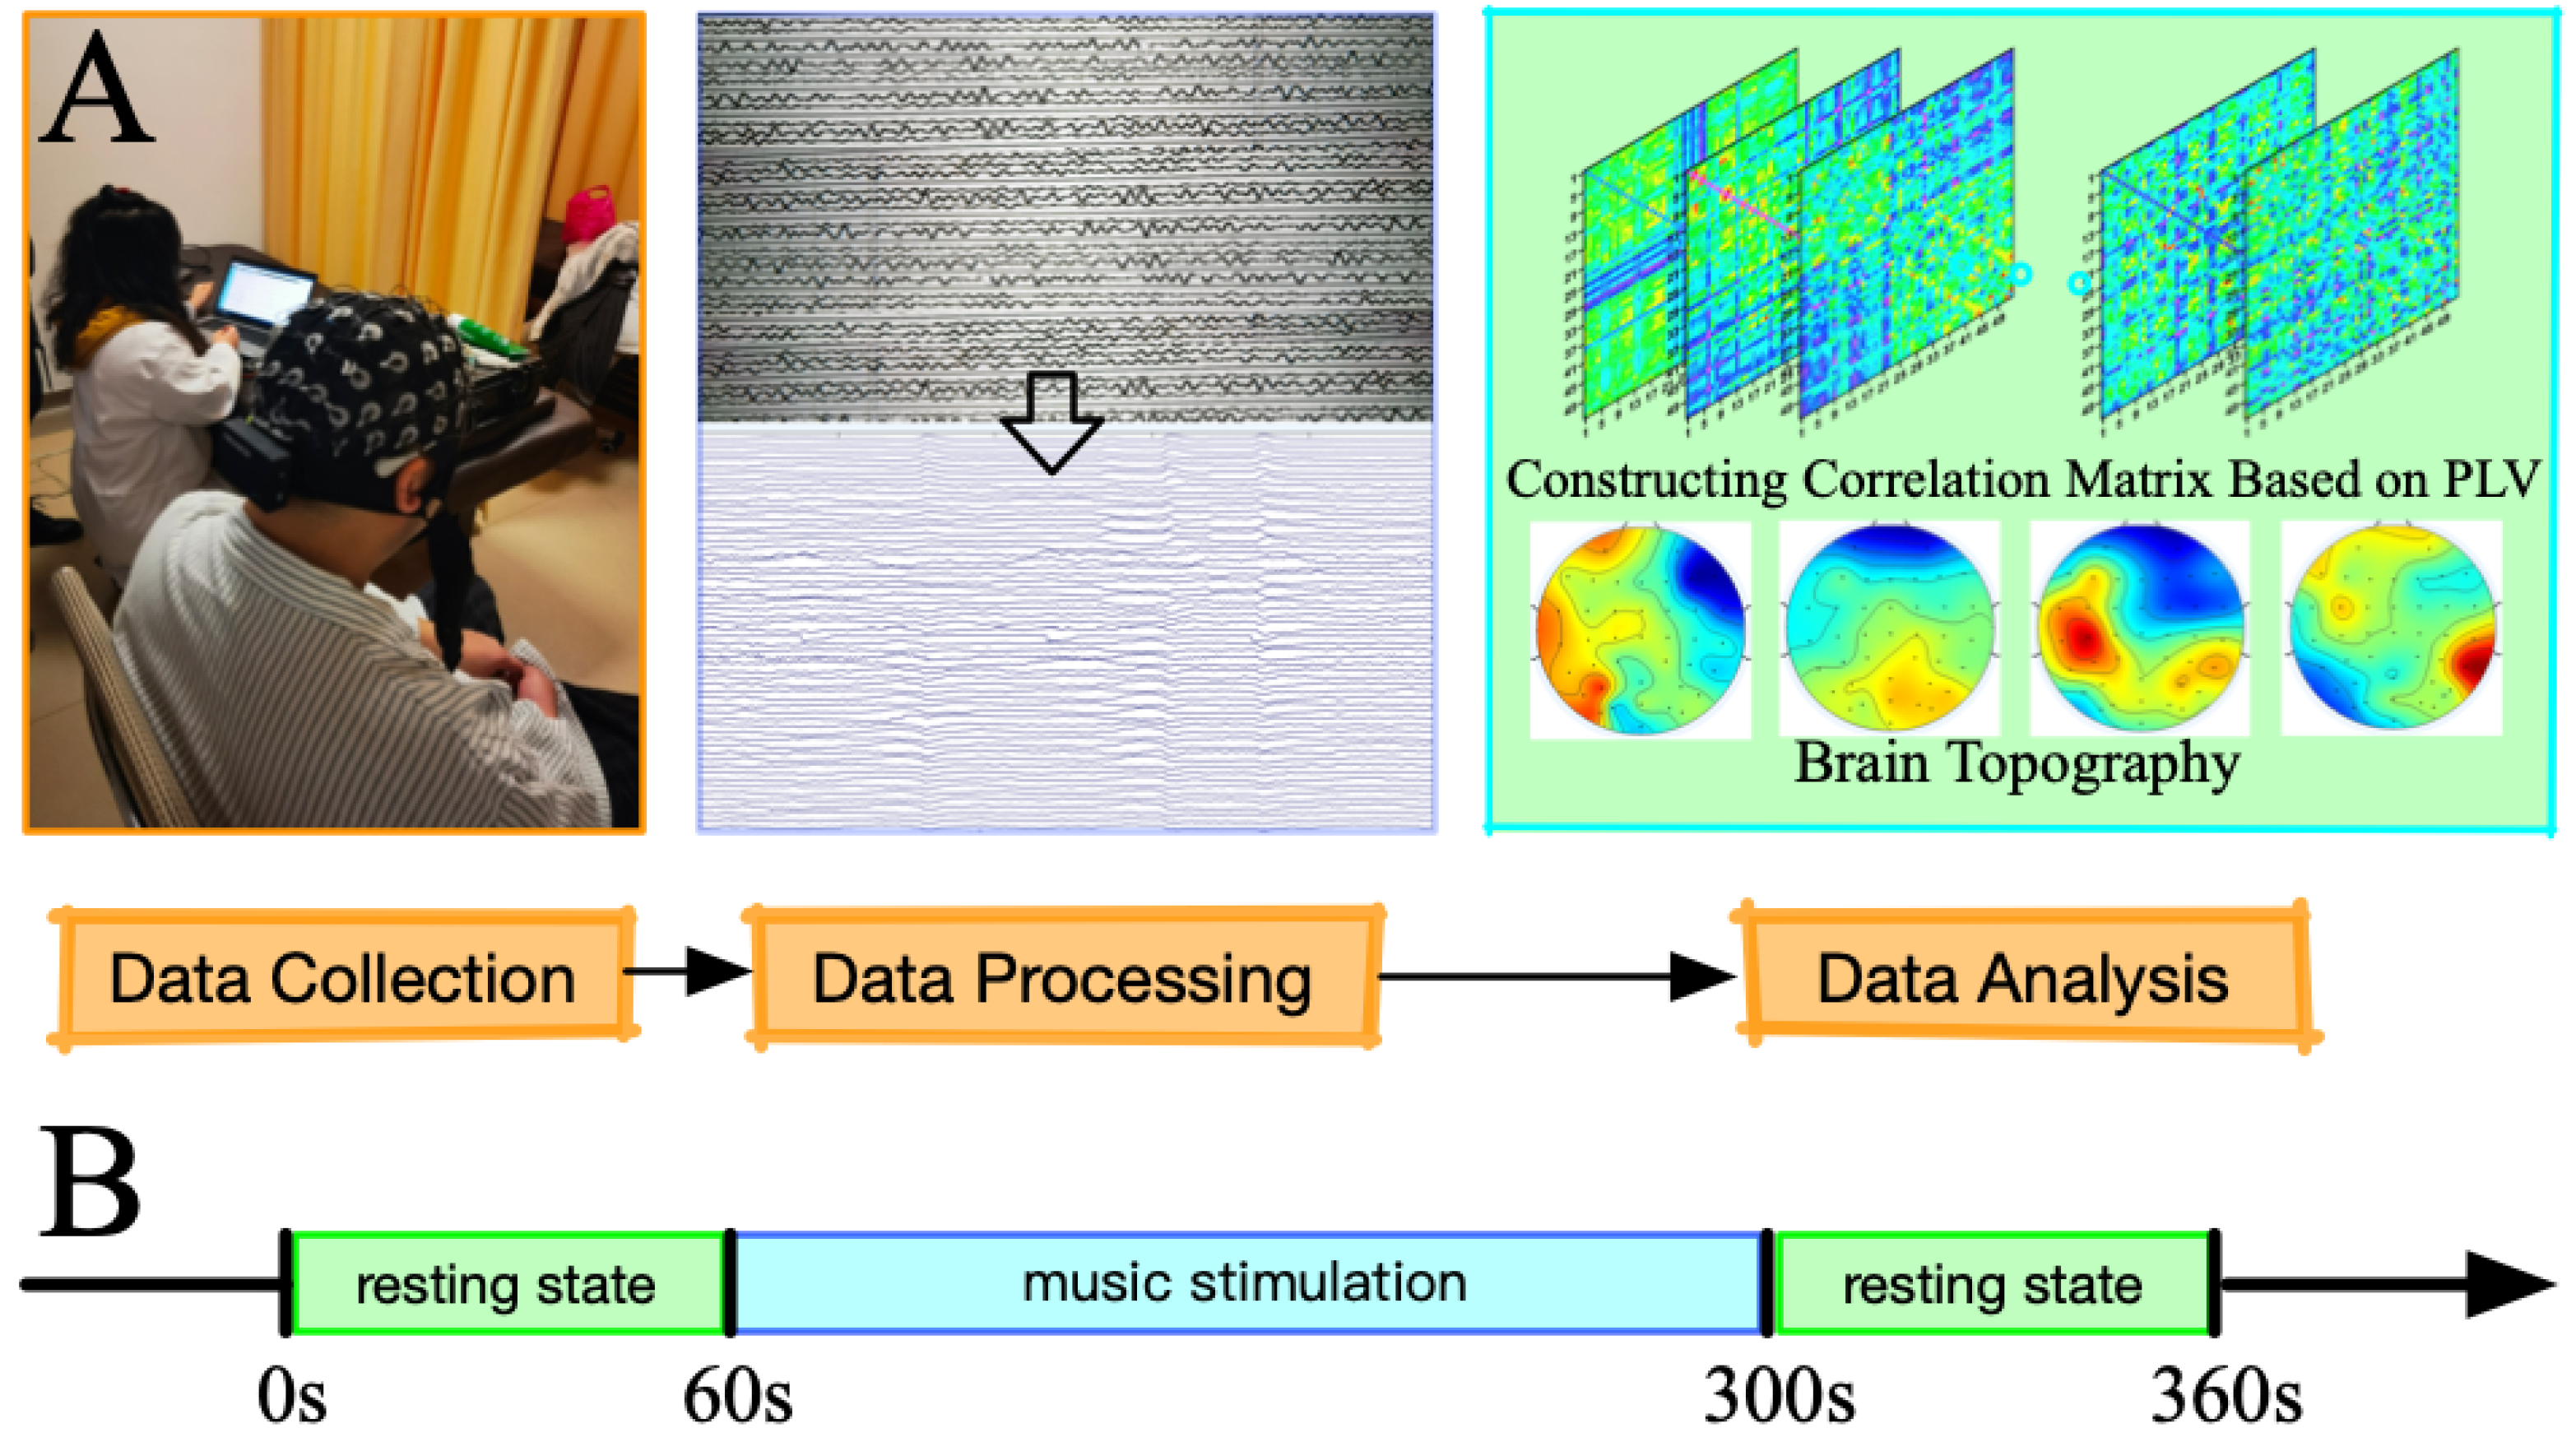
Figure 2.
Before and after musical stimulation, depressed patients and healthy controls had different frequency band association matrices. Each row shows the state of the subject, and each column shows the frequency band of the signal (a–l).
Figure 2.
Before and after musical stimulation, depressed patients and healthy controls had different frequency band association matrices. Each row shows the state of the subject, and each column shows the frequency band of the signal (a–l).
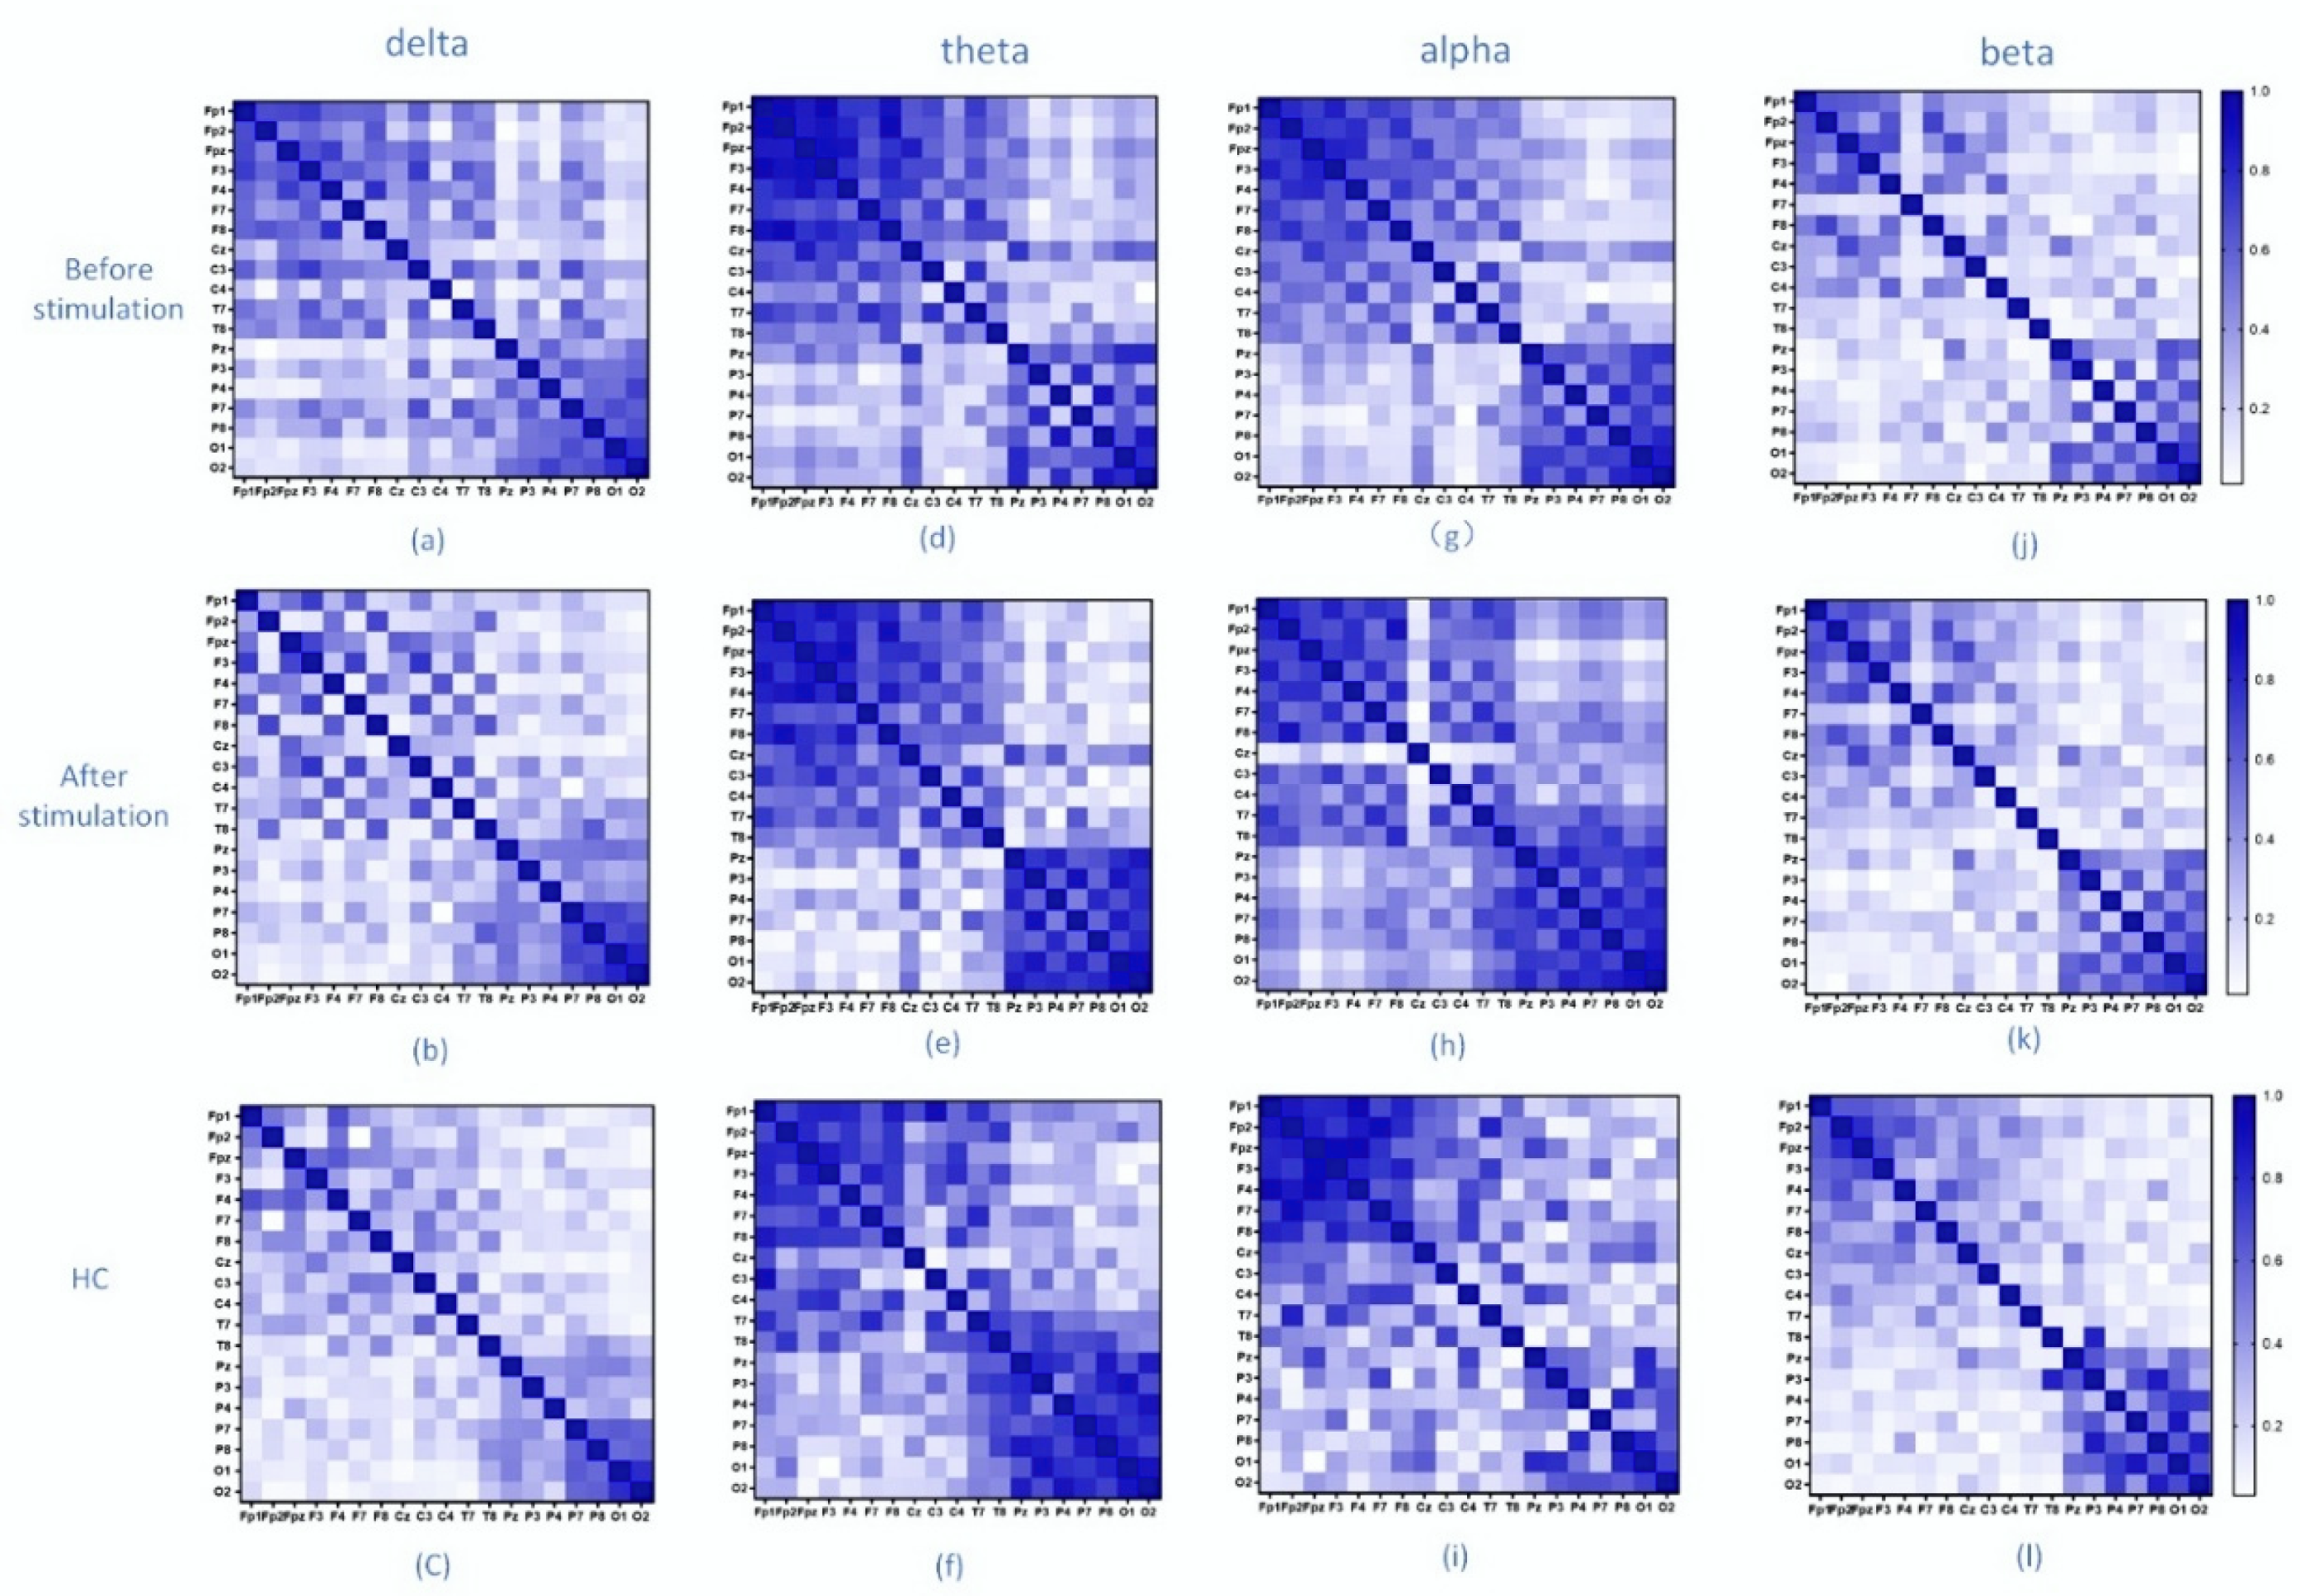
Figure 3.
Brain network topology of depressed patients and healthy controls at different frequency bands before and after musical stimulation. Each row shows the state of the subject, and each column shows the frequency band of the signal (a–l). The blue dots represent the poles of light, and the yellow lines represent the connections of the channels.

Figure 4.
EEG functional brain network results. (a) Clustering coefficient, (b) characteristic path length. * p < 0.05, data are expressed as mean ± SEM.
Figure 4.
EEG functional brain network results. (a) Clustering coefficient, (b) characteristic path length. * p < 0.05, data are expressed as mean ± SEM.

Figure 5.
Degree of nodes in EEG functional brain network. (a) Delta band; (b) theta band; (c) alpha band; (d) beta band. The horizontal axis represents the channel position, and the vertical axis represents the number of nodes.
Figure 5.
Degree of nodes in EEG functional brain network. (a) Delta band; (b) theta band; (c) alpha band; (d) beta band. The horizontal axis represents the channel position, and the vertical axis represents the number of nodes.


Table 1.
Demographic variables of depression patients and healthy controls.
| MDD (n = 8) | HC (n = 8) | p | |||
|---|---|---|---|---|---|
| Average | SD | Average | SD | ||
| age | 30.85 | 7.5 | 27.65 | 8.6 | 0.89 |
| gender | 6 male/2 female | 8 male | |||
| PHQ-9 | 15.42 | 5.32 | 2.44 | 0.92 | 0.00 |
| GAD-7 | 11.62 | 6.50 | 2.19 | 3.74 | 0.00 |
Table 2.
Classification accuracy of association matrix.
| Classifier | Accuracy | Precision | Recall |
|---|---|---|---|
| KNN | 81.25% | 75% | 68.75% |
| SVM | 93.75% | 87.5% | 93.75% |
| DT | 68.75% | 62.5% | 62.5% |
| RF | 75% | 68.75% | 75% |
Publisher’s Note: MDPI stays neutral with regard to jurisdictional claims in published maps and institutional affiliations. |
© 2022 by the authors. Licensee MDPI, Basel, Switzerland. This article is an open access article distributed under the terms and conditions of the Creative Commons Attribution (CC BY) license (https://creativecommons.org/licenses/by/4.0/).
Share and Cite
MDPI and ACS Style
Qiu, P.; Dai, J.; Wang, T.; Li, H.; Ma, C.; Xi, X. Altered Functional Connectivity and Complexity in Major Depressive Disorder after Musical Stimulation. Brain Sci. 2022, 12, 1680. https://doi.org/10.3390/brainsci12121680
AMA Style
Qiu P, Dai J, Wang T, Li H, Ma C, Xi X. Altered Functional Connectivity and Complexity in Major Depressive Disorder after Musical Stimulation. Brain Sciences. 2022; 12(12):1680. https://doi.org/10.3390/brainsci12121680
Chicago/Turabian StyleQiu, Pintao, Jinxiao Dai, Ting Wang, Hangcheng Li, Cunbin Ma, and Xugang Xi. 2022. "Altered Functional Connectivity and Complexity in Major Depressive Disorder after Musical Stimulation" Brain Sciences 12, no. 12: 1680. https://doi.org/10.3390/brainsci12121680
Note that from the first issue of 2016, this journal uses article numbers instead of page numbers. See further details here.