Article

Potential of Solar Collectors for Clean Thermal Energy Production in Smart Cities using Nanofluids: Experimental Assessment and Efficiency Improvement

by
M. M. Sarafraz
1,
Iskander Tlili
2,
Mohammad Abdul Baseer
3 and
Mohammad Reza Safaei
4,5,*
1
School of Mechanical Engineering, the University of Adelaide, Adelaide, South Australia, Australia
2
Department of Mechanical and Industrial Engineering, College of Engineering, Majmaah University, Al-Majmaah 11952, Saudi Arabia
3
Department of Electrical Engineering, College of Engineering, Majmaah University, Al-Majmaah 11952, Saudi Arabia
4
Division of Computational Physics, Institute for Computational Science, Ton Duc Thang University, Ho Chi Minh City, Vietnam
5
Faculty of Electrical and Electronics Engineering, Ton Duc Thang University, Ho Chi Minh City, Vietnam
*
Author to whom correspondence should be addressed.
Appl. Sci. 2019, 9(9), 1877; https://doi.org/10.3390/app9091877
Submission received: 3 April 2019 / Revised: 22 April 2019 / Accepted: 27 April 2019 / Published: 7 May 2019
(This article belongs to the Special Issue Solar Energy Applications in Houses, Smart Cities and Microgrids)

Abstract

:
In this article, an experimental study was performed to assess the potential thermal application of a new nanofluid comprising carbon nanoparticles dispersed in acetone inside an evacuated tube solar thermal collector. The effect of various parameters including the circulating volumetric flow of the collector, mass fraction of the nanoparticles, the solar irradiance, the tilt angle and the filling ratio values of the heat pipes on the thermal performance of the solar collector was investigated. It was found that with an increase in the flow rate of the working fluid within the system, the thermal efficiency of the system was improved. Additionally, the highest thermal performance and the highest temperature difference between the inlet and the outlet ports of the collector were achieved for the nanofluid at wt. % = 0.1. The best tilt angle and the filling ratio values of the collector were 30° and 60% and the maximum thermal efficiency of the collector was 91% for a nanofluid at wt. % = 0.1 and flow rate of 3 L/min.

1. Introduction

Solar thermal energy is a free and abundant source of energy. However, the intermittent access to the solar thermal energy during the day and also during the off-sun period together with a lack of reliable and mature technology are drawbacks of using solar thermal energy [1,2,3]. Hence, immense research has been done to utilize solar thermal energy in industrial and domestic sectors.
Solar thermal collectors are devices that absorb solar thermal energy and an evacuated solar thermal collector is an apparatus with several evacuated tubes embedded with a heat pipe (HP), which absorbs the solar irradiance and converts it into thermal energy using phase change mechanism inside the heat pipes. Each evacuated tube has an internal HP, which delivers the heat from the absorbance to the header tank. A HP is a two-phase heat exchanging medium, consisting of three domains of evaporator, adiabatic and the condenser sections. Generally, the condenser section of the HP is constantly cooled with water, while the evaporator section is exposed to the high heat flux thermal energy absorbed from the sun [4,5]. Hence, in the evaporator section, boiling is the general heat transfer mechanism, which provides a large heat transfer coefficient (HTC) [6,7,8]. This is because the generation of the bubbles in the evaporator section not only improves the heat transfer in the evaporator but also provides an efficient phase change and two-phase heat transfer throughout the HP.
The working fluid inside the HP is a key parameter determining the overall thermal performance (TP) of the system. A working fluid with a low boiling temperature, high thermal conductivity and plausible thermal properties can increase the TP of the HP leading to more heat transfer within the collector. Since the introduction of nanofluid by the Aragon National Laboratory (ANL) [9,10,11], much effort has been made to utilize it in various thermal applications including solar thermal energy [12,13,14,15,16,17,18,19,20,21,22,23,24,25]. For example, Dehaj et al. [26] performed experiments to study the TP of an evacuated HP solar collector. They used nanofluids to boost the heat transfer within the solar collector. The influence of the fluid flow rate of the MgO/water nanofluid within the collector together with the particle’s concentration on the efficiency of the collector was experimentally investigated and it was found that the efficiency of the collector enhanced by increasing the flow rate. In addition, the efficiency of the solar collector was further improved with augmentation of MgO based nanofluid concentration. In another study, Ziyadanogullari et al. [27] experimentally assessed the influence of the presence of various nanoparticles on the TP of a flat plate collector. Nanoparticles including alumina, copper oxide and Titania were dispersed in water at volumetric concentrations of 0.2–0.8% and the flow rate of the carrying fluid was set to 250 L/h for each nanofluid. It was found that the use of nanofluid increased the collector efficiency in comparison with water. Sharafeldin et al. [28] performed experiments to quantify the TP of the evacuated tube solar collector (ETSC) working with WO3 suspended in water at vol.% of 0.014, 0.028, and 0.042. They demonstrated that the TP of the collector can be improved by 21% for the nanofluid. Also, the efficiency of the system increased by 23% in comparison with the system without nanofluid. With nanofluid inside the collector, the maximum thermal efficiency of 72.8% was obtained. Cesium oxide was also identified as a plausible nanoparticle and was tested in an ETSC [29]. Using zeta potential value, they stabilized the nanofluid and the TP of the ETSC was quantified. It was demonstrated that the TP of the collector can be improved for the case of the nanofluid. The maximum efficiency of 34% was recorded for the system.
Ozsoy et al. [30] conducted a set of experiments to quantify the TP of a thermosyphon HP with a potential to be used in an ETSC. Silver-water nanofluid was used in the system with the view to evaluate its potential application for a continuous operation in the system. The nanoparticles were synthesized to ensure that the particles have longer stability. They found that the nanofluid enhanced the efficiency of solar collector between 20.7–40% in comparison with pure water and it was also identified that the use of silver-water nanofluid can provide better heat transfer and TP within the system. To further intensify the influence of nanoparticles on the thermo-hydraulic performance of the system, several modifications have been suggested by the authors. The most promising one is the functionalization of the nanoparticles with the view to increase their stability, thermal conductivity and other thermo-physical properties of the nanofluids.
Heat pipes and thermosyphons are the heart of the solar collectors. Hence, improving the TP of the HP influences the TP of the collectors. Therefore, extensive research has been conducted to better understand the effect of nanoparticles on the TP of the heat pipes. For example, in a study conducted by Nazari et al. [31] the thermal characteristic of a HP working with the graphene oxide nanofluid was experimentally studied and it was identified that the nanofluid can amend the thermo-physical properties of the working fluid including the thermal conductivity. This also led to a 43% decrease in overall TP of the system. Arya et al. [32] studied the TP of a HP working with carbon nanotube dispersed in deionized water and showed that the TP of a HP can be improved with an increment in the value of the input heat applied to the evaporator section. In addition, they identified a trade-off behavior between the filling ratio, tilt angle and the TP of the HP. Their experiments showed that the optimum value for the filling ratio for the test HP was 0.8. In addition, the nano-suspension improved the TP of the HP by 40%. The same results were also obtained by Vijayakumar et al. [33] by investigating the potential application of copper-water and alumina-water nanofluid inside a HP. They also observed that for the case of nanofluid, the temperature profile of the HP was augmented and the thermal resistance of the HP was detracted.
For most of the works discussed in the aforementioned literature, the base fluid is normally water or a material with a boiling point larger than water. Hence, the evaporation of the working fluid within the HP at low temperature is relatively low and the dominant mechanism in the evaporator is convective mixed with the evaporation. Hence, the order of magnitude for the TP in the evaporator and in the condenser is relatively smaller than those reported for the heat pipes working in the nucleate boiling two-phase regime. Thus, in the present work, acetone as a traditional working fluid for the low-temperature heat pipes was fortified with carbon nanoparticles to be used in the ETSC. By doing this, the efficiency of the HP is expected to be higher as the boiling temperature of acetone is smaller than conventional coolants including water, ethylene glycol and oils. In addition, the carbon nanoparticles are cheap, available with a relatively good thermal conductivity. Thereby dispersing it into acetone can provide the plausible TP for the evacuated tube. The effect of different operating parameters including the mass concentration of carbon in acetone, the filling ratio, and tilt angle of the collector, operating time and the fluid flow rate within the collector on the TP of the collector was investigated.

2. Experimental

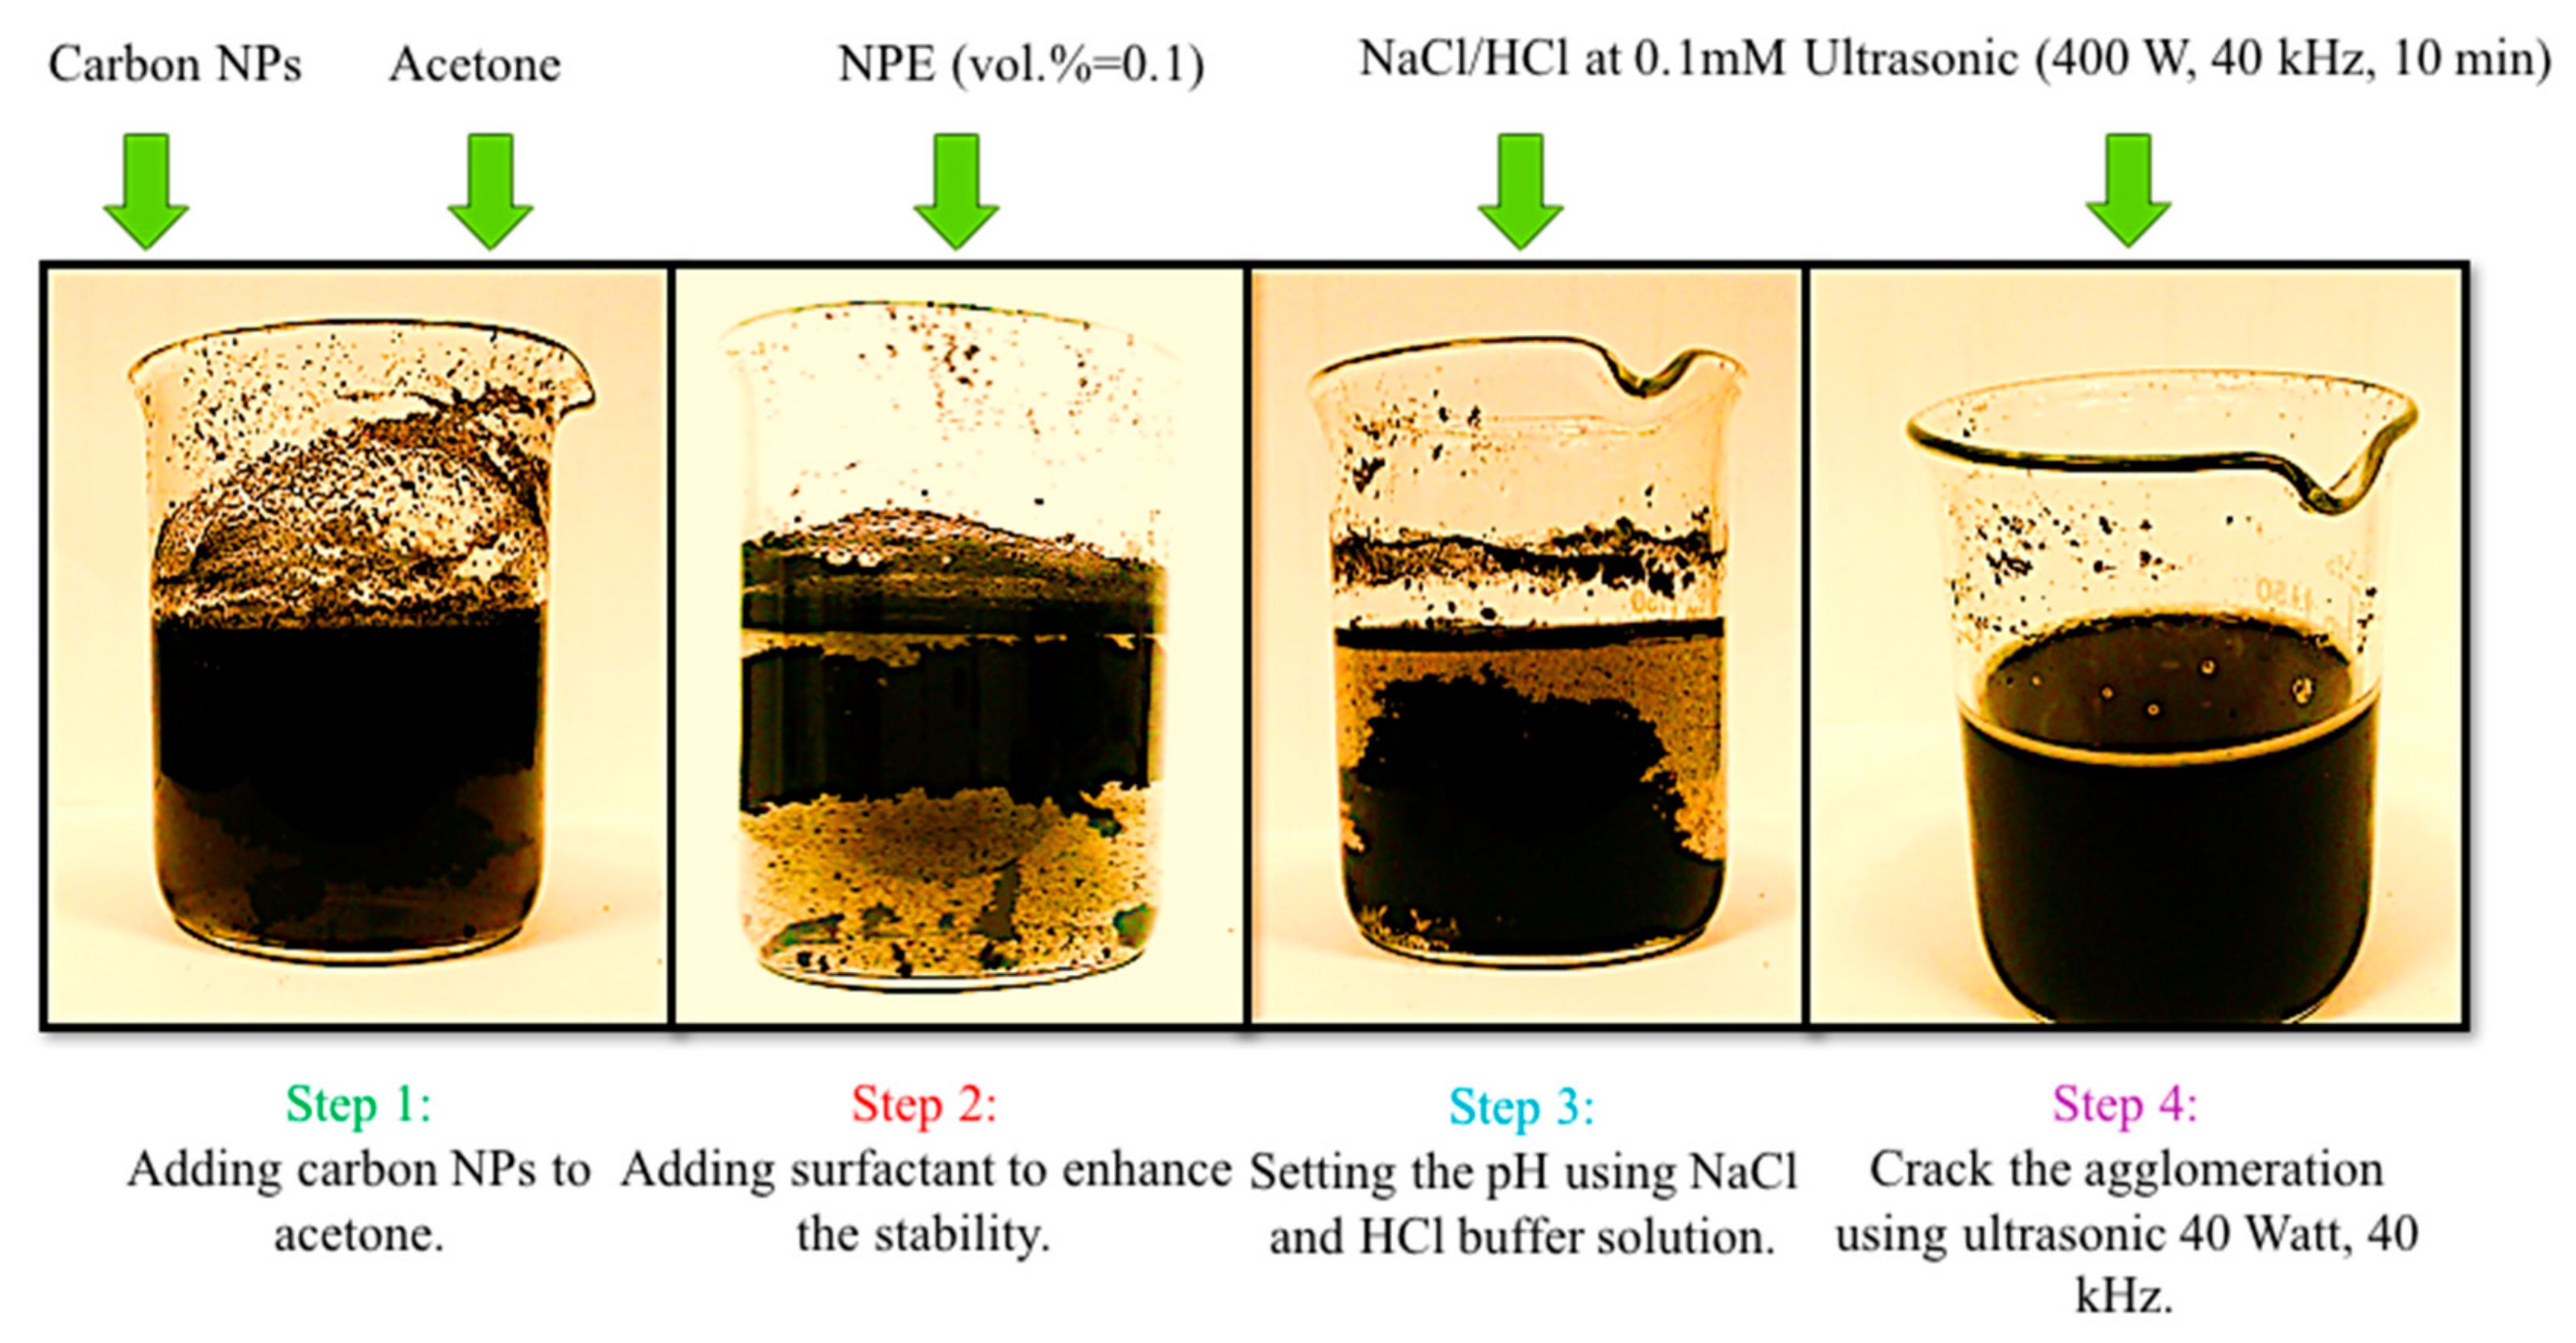
2.1. Preparation, Quality Tests and Physical Properties

Carbon nano-powder (CNP hereafter, purchased from Sigma) was used. Acetone was selected as a base fluid and was purchased from Sigma Aldrich and the characteristic tests were performed on the nanoparticles including the nitrogen adsorption test, the x-ray diffraction, pore-particle size, and the morphology assessment with the view to further identify the quality of the carbon particles used in the present research. The morphology of the nanoparticles not only influences the particle–particle interaction but also changes the stability of the nanofluids as well. Also, the composition of the carbon can directly influence the thermal conductivity together with other thermo-physical properties of the nanofluid. Notably, most of the properties of the nanofluid are functions of the particle size, and the quality of the dispersion. Hence, the physical properties were experimentally measured. For nanofluids preparation, the following steps were performed:
  • Disperse the desire mass of carbon nanoparticles into acetone using magnetic stirrer at 250 rpm;
  • Add an anionic surfactant, Nonyl Phenol Ethoxilate (NPE) (at vol.% = 0.1 of total prepared nanofluid);
  • Set pH of the nanofluid to a value, in which the highest zeta potential was observed. After setting the pH value of each sample, to measure the zeta potential, the sample was assessed with a zeta sizer digital light scattering device manufactured by Malvern CO (Malvern, UK). So, the measurement was carried out after the pH was regulated using the buffer solution.
  • Sonicate the nanofluid to disperse the particles uniformly; inside the working fluid.
Figure 1 shows the image of the prepared nanofluid.

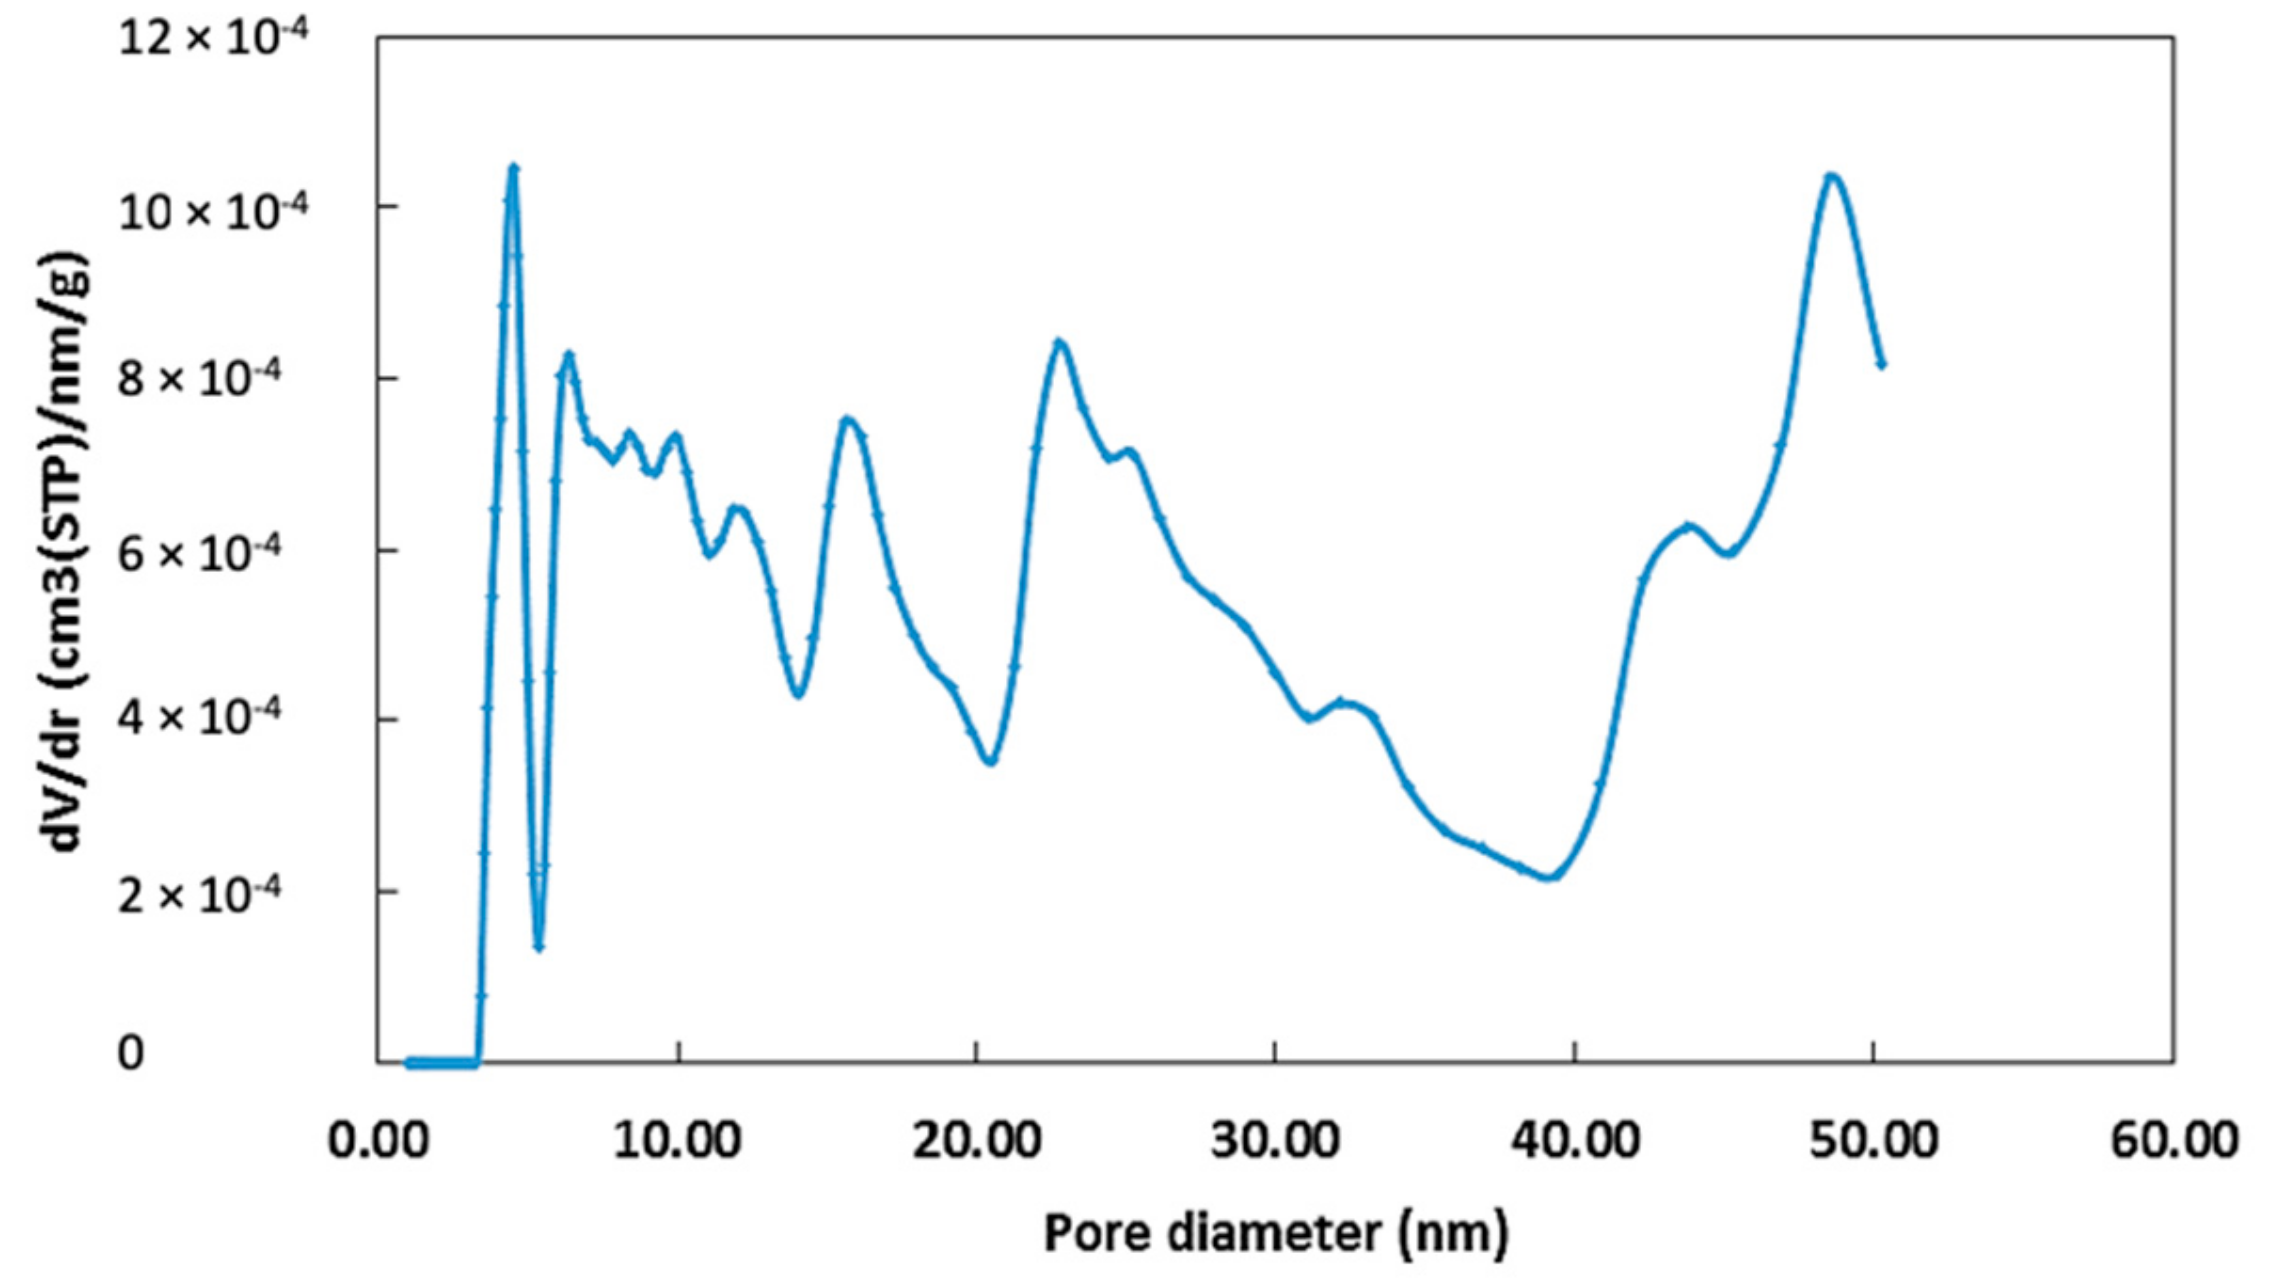
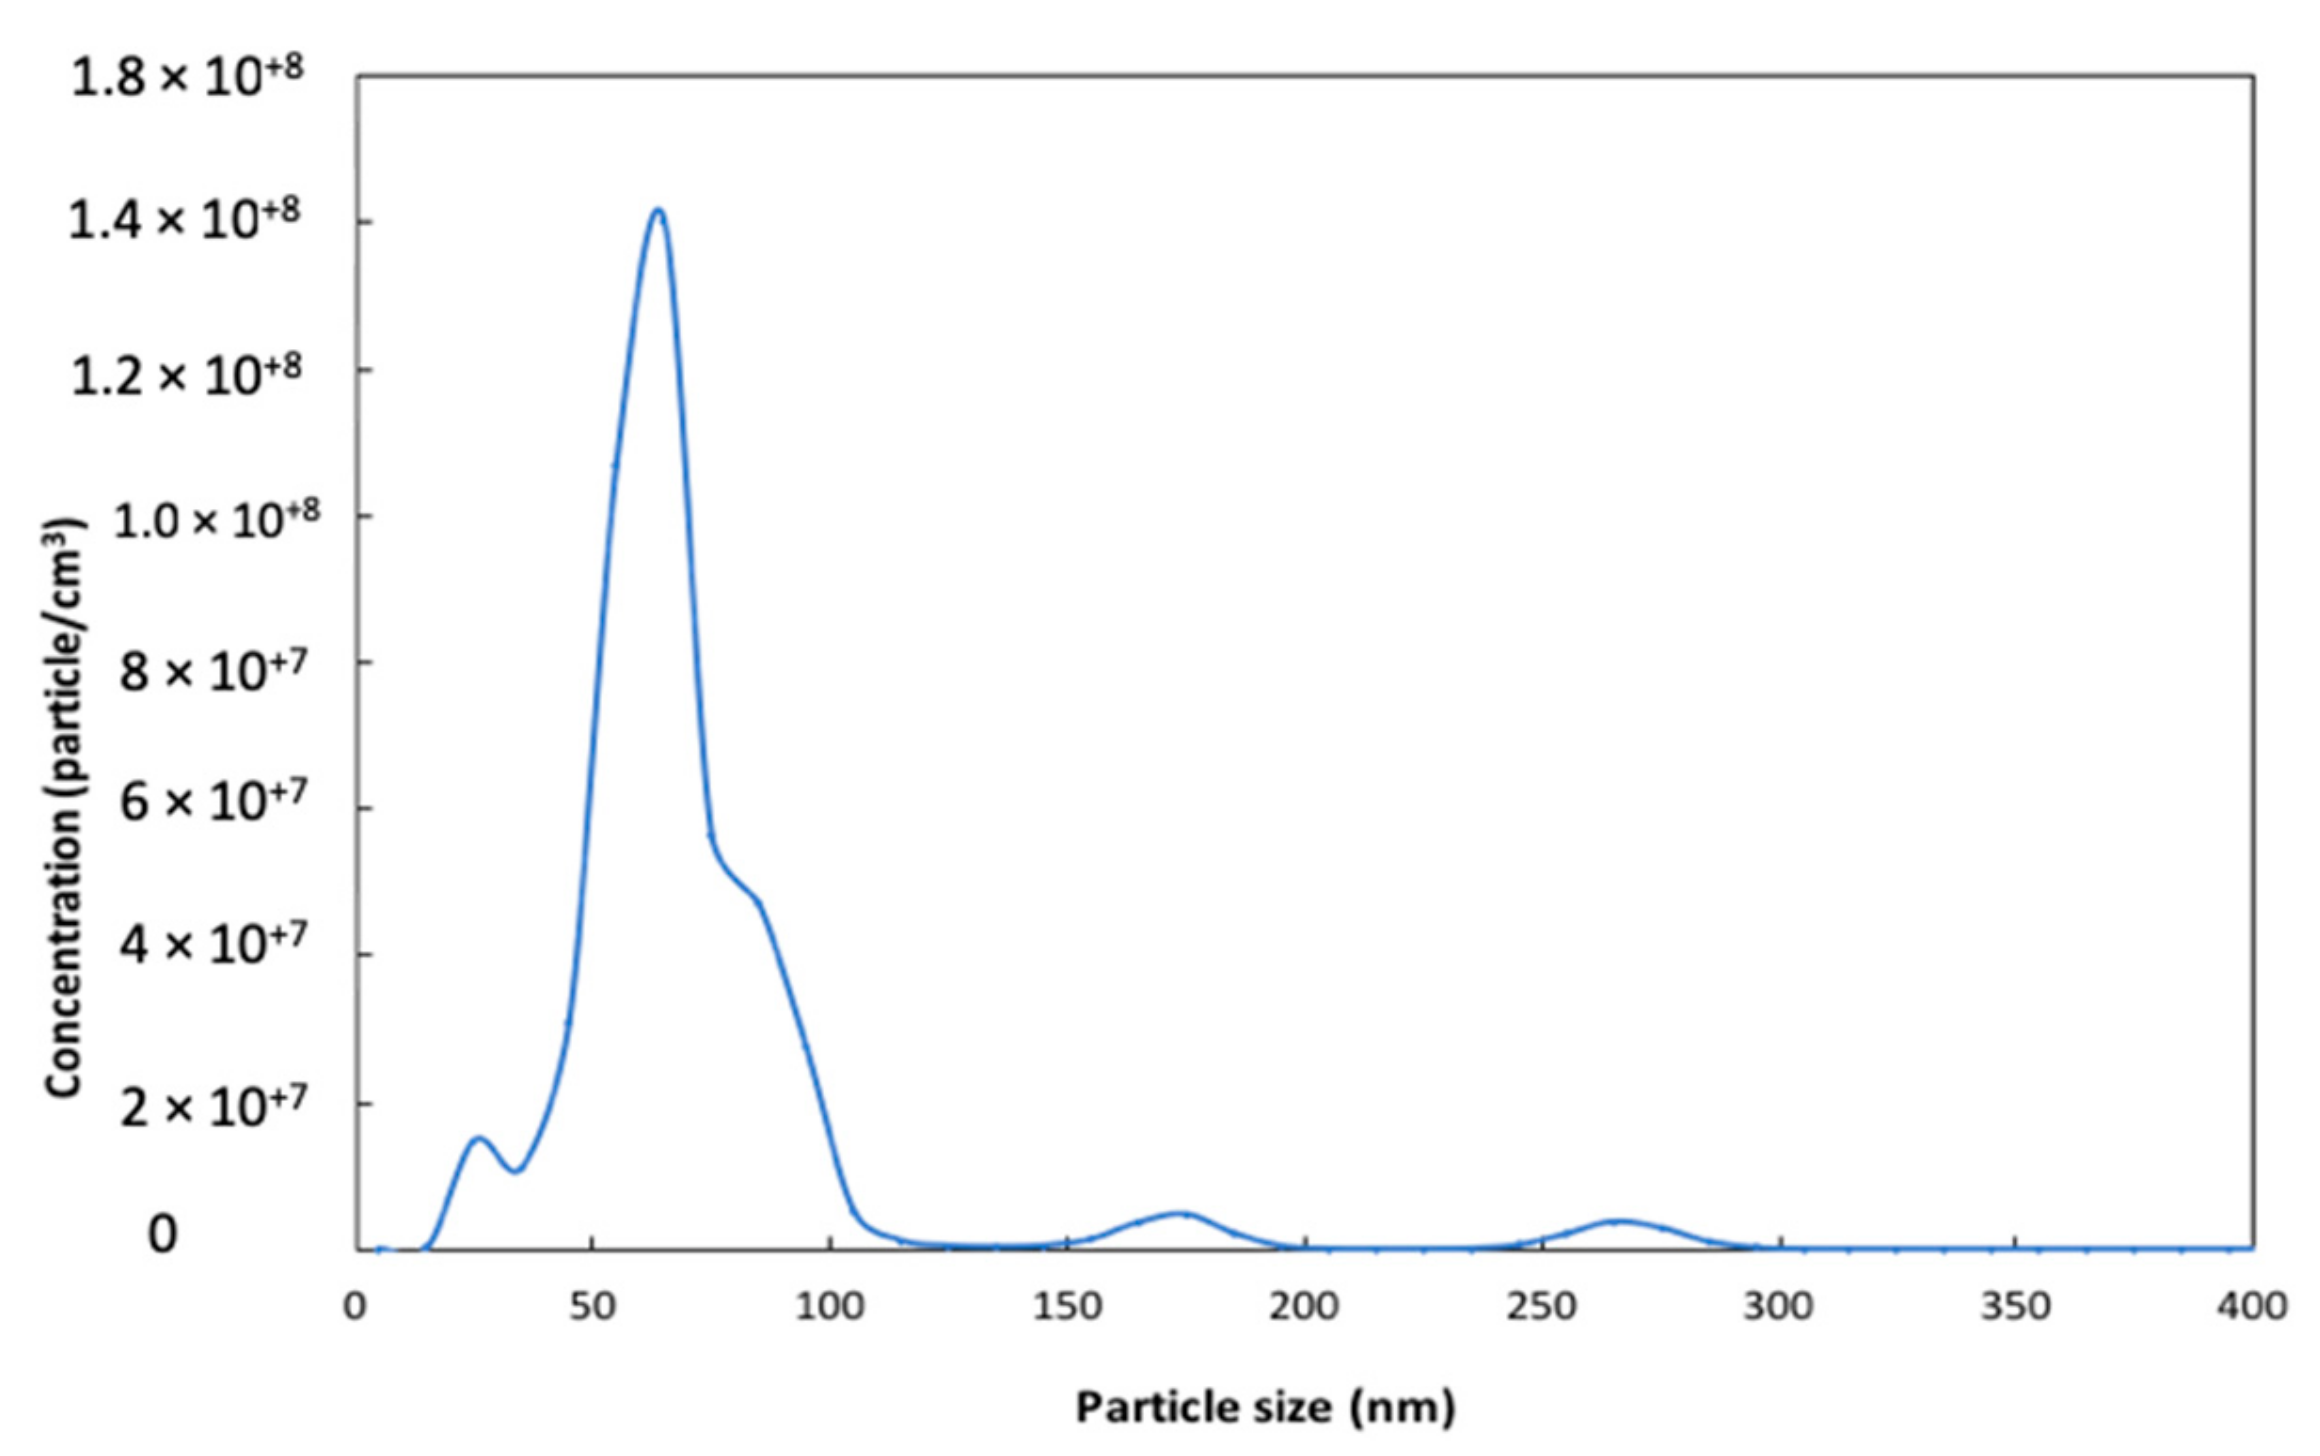
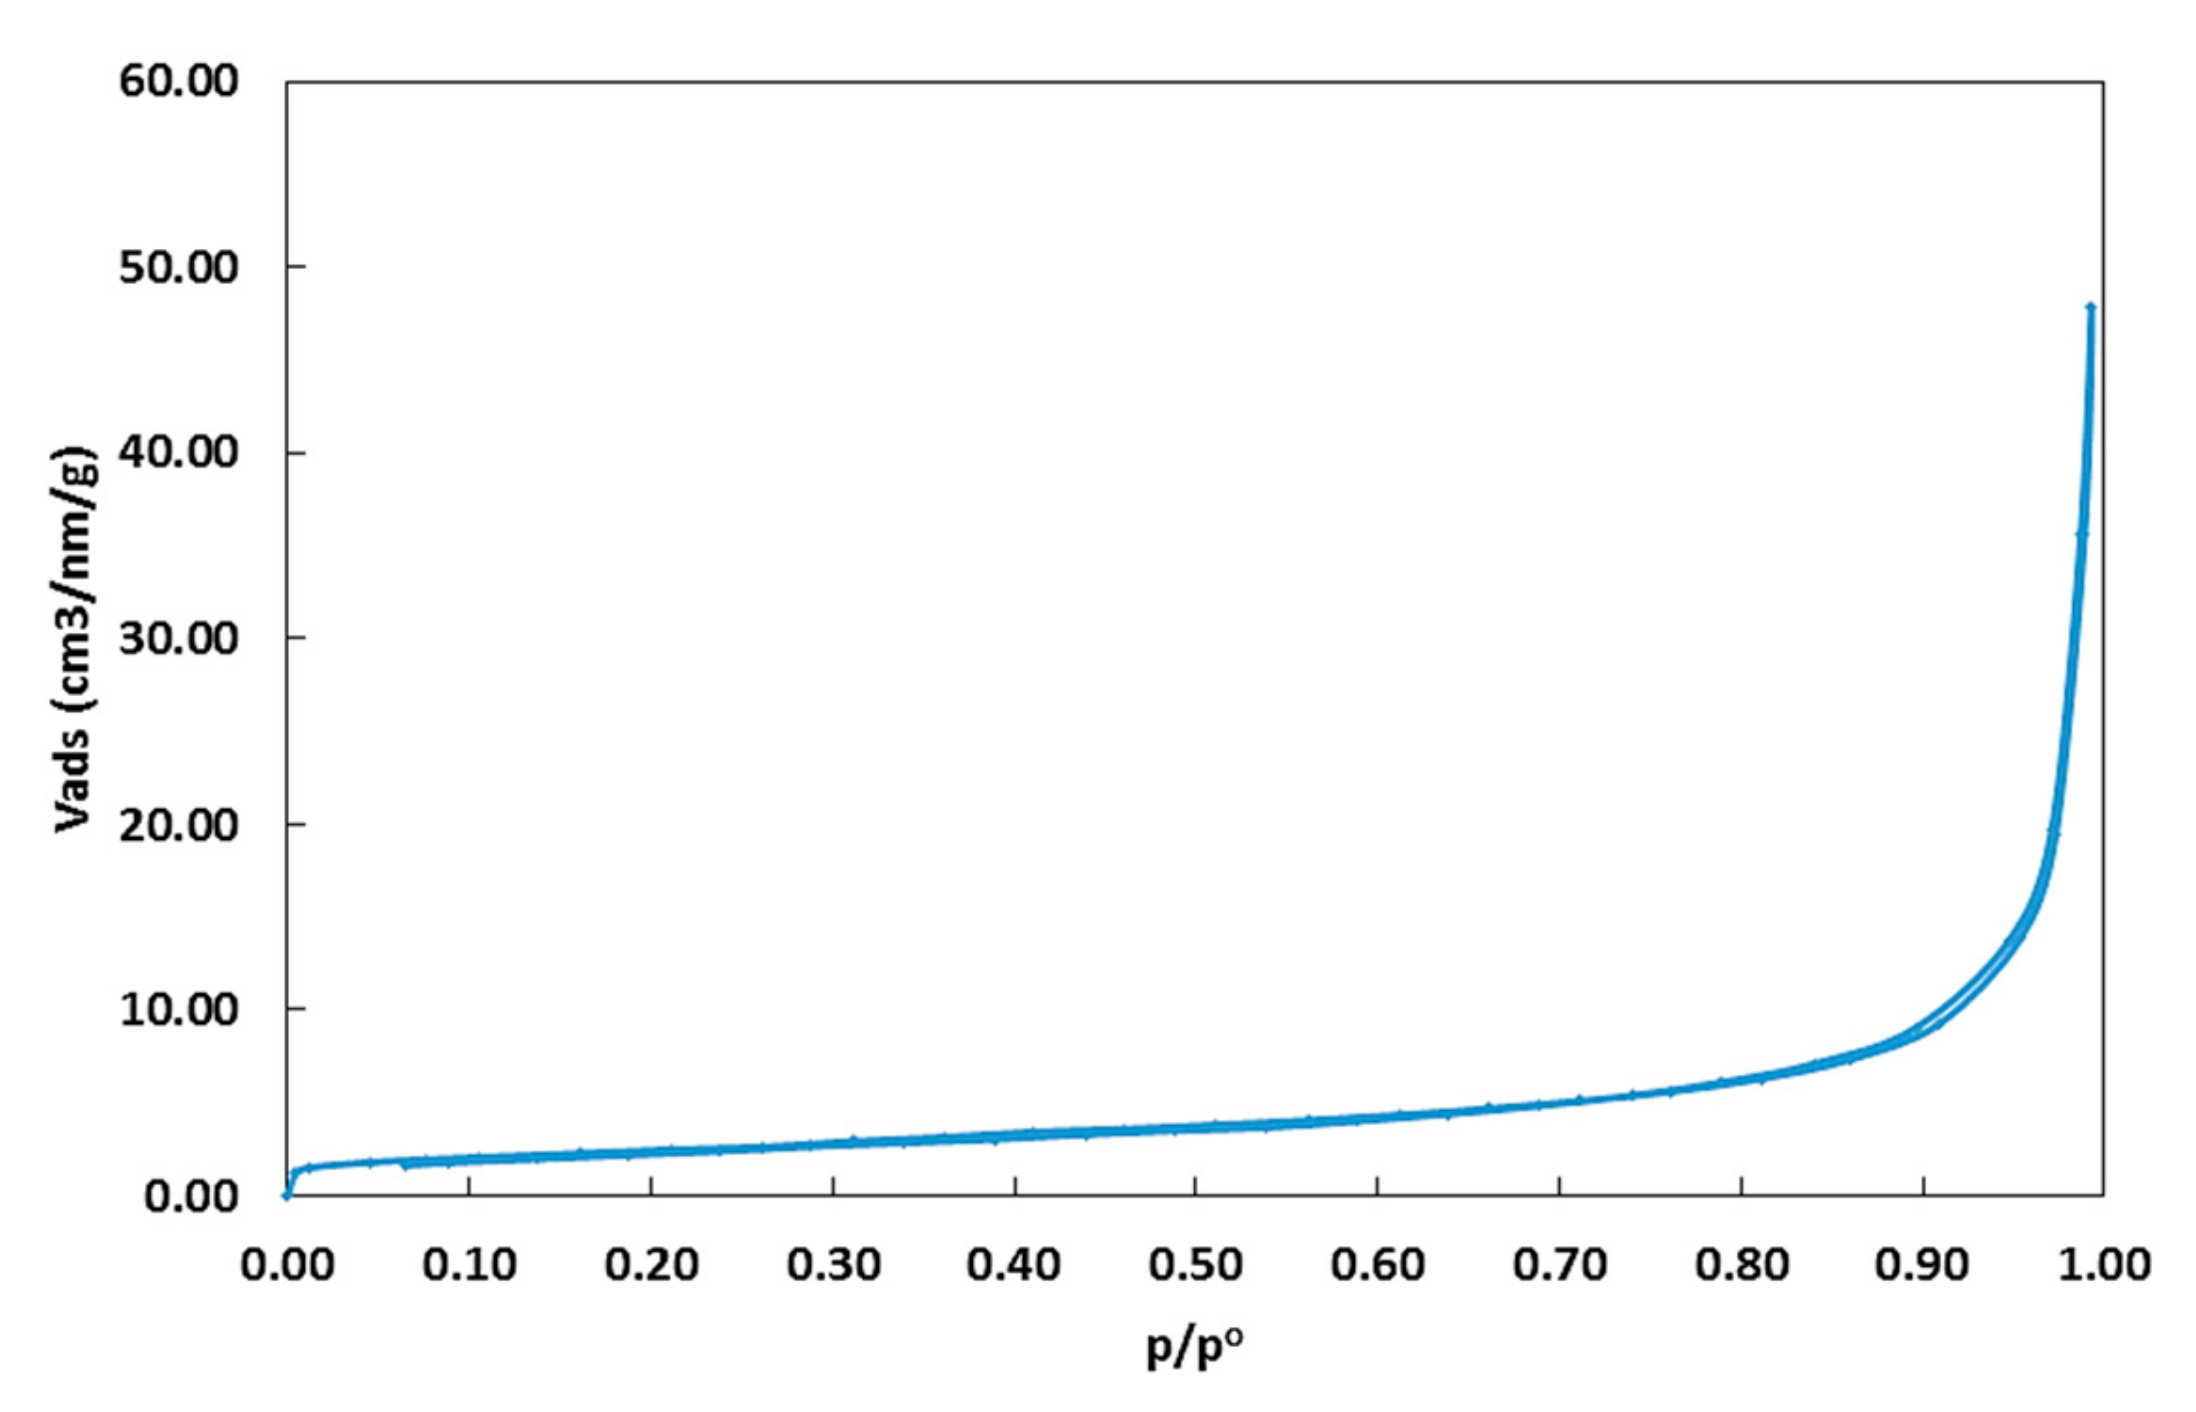
2.1.1. Surface Area and Particle Size

Nitrogen adsorption test was utilized to identify the average surface area and the distribution of size of the particles of the carbon nanoparticles, and the result has been represented in Figure 2. The higher surface area, the higher the TP. Prior to the adsorption experiments, samples were degassed at 140 °C for 10 h under vacuum pressure of 10−5 torr. Nitrogen adsorption isotherms were plotted using a Tristar instrument (Micromeritics, Norcross, Georgia, GA, USA) at liquid nitrogen temperature (~−196 °C). An ultra-high purity nitrogen and helium (>99.999 %) were used for the adsorption and the dead volume measurements, respectively. The Brunauer–Emmett–Teller (BET) method was employed for specific surface area evaluation [34]. The quenched solid density functional theory method (QSDFT) [35], was utilized to evaluate the particle size diameter, (PSD) for the CNP sample. This figure exhibits a Type II isotherm based on International Union of Pure and Applied Chemistry, IUPAC classification representing the presence of mesoporous structure with negligible contributions from microspores. It also shows a very narrow Type H3 hysteresis loop, representing possible aggregates particles. The calculated BET equivalent surface area and total pore volume of the sample are relatively small (8.8 m3/g and 0.027 cm3/g, respectively), indicating small porosity of the sample. Total pore volume (VP) was calculated based on nitrogen amount adsorbed at near saturation pressure converted to liquid volume. The PSD for the CNP sample is shown in Figure 3. The distribution is multimodal, showing a broad range of 4–50 nm. The intensity of the distribution curve is very small. This low intensity and broad distribution of pores confirm that the available surface area is primarily due to the particle’s external surface rather than its internal porosity.
Figure 4 shows the results of particle size test for the carbon nanoparticles. Analysis of the particle size test showed that the average particle size for the carbon nanoparticles dispersed in acetone was 50 nm. This also further confirms the size claimed by the manufacturer. This also minimizes the possibility of the deposition and scale formation within the solar collector as well.

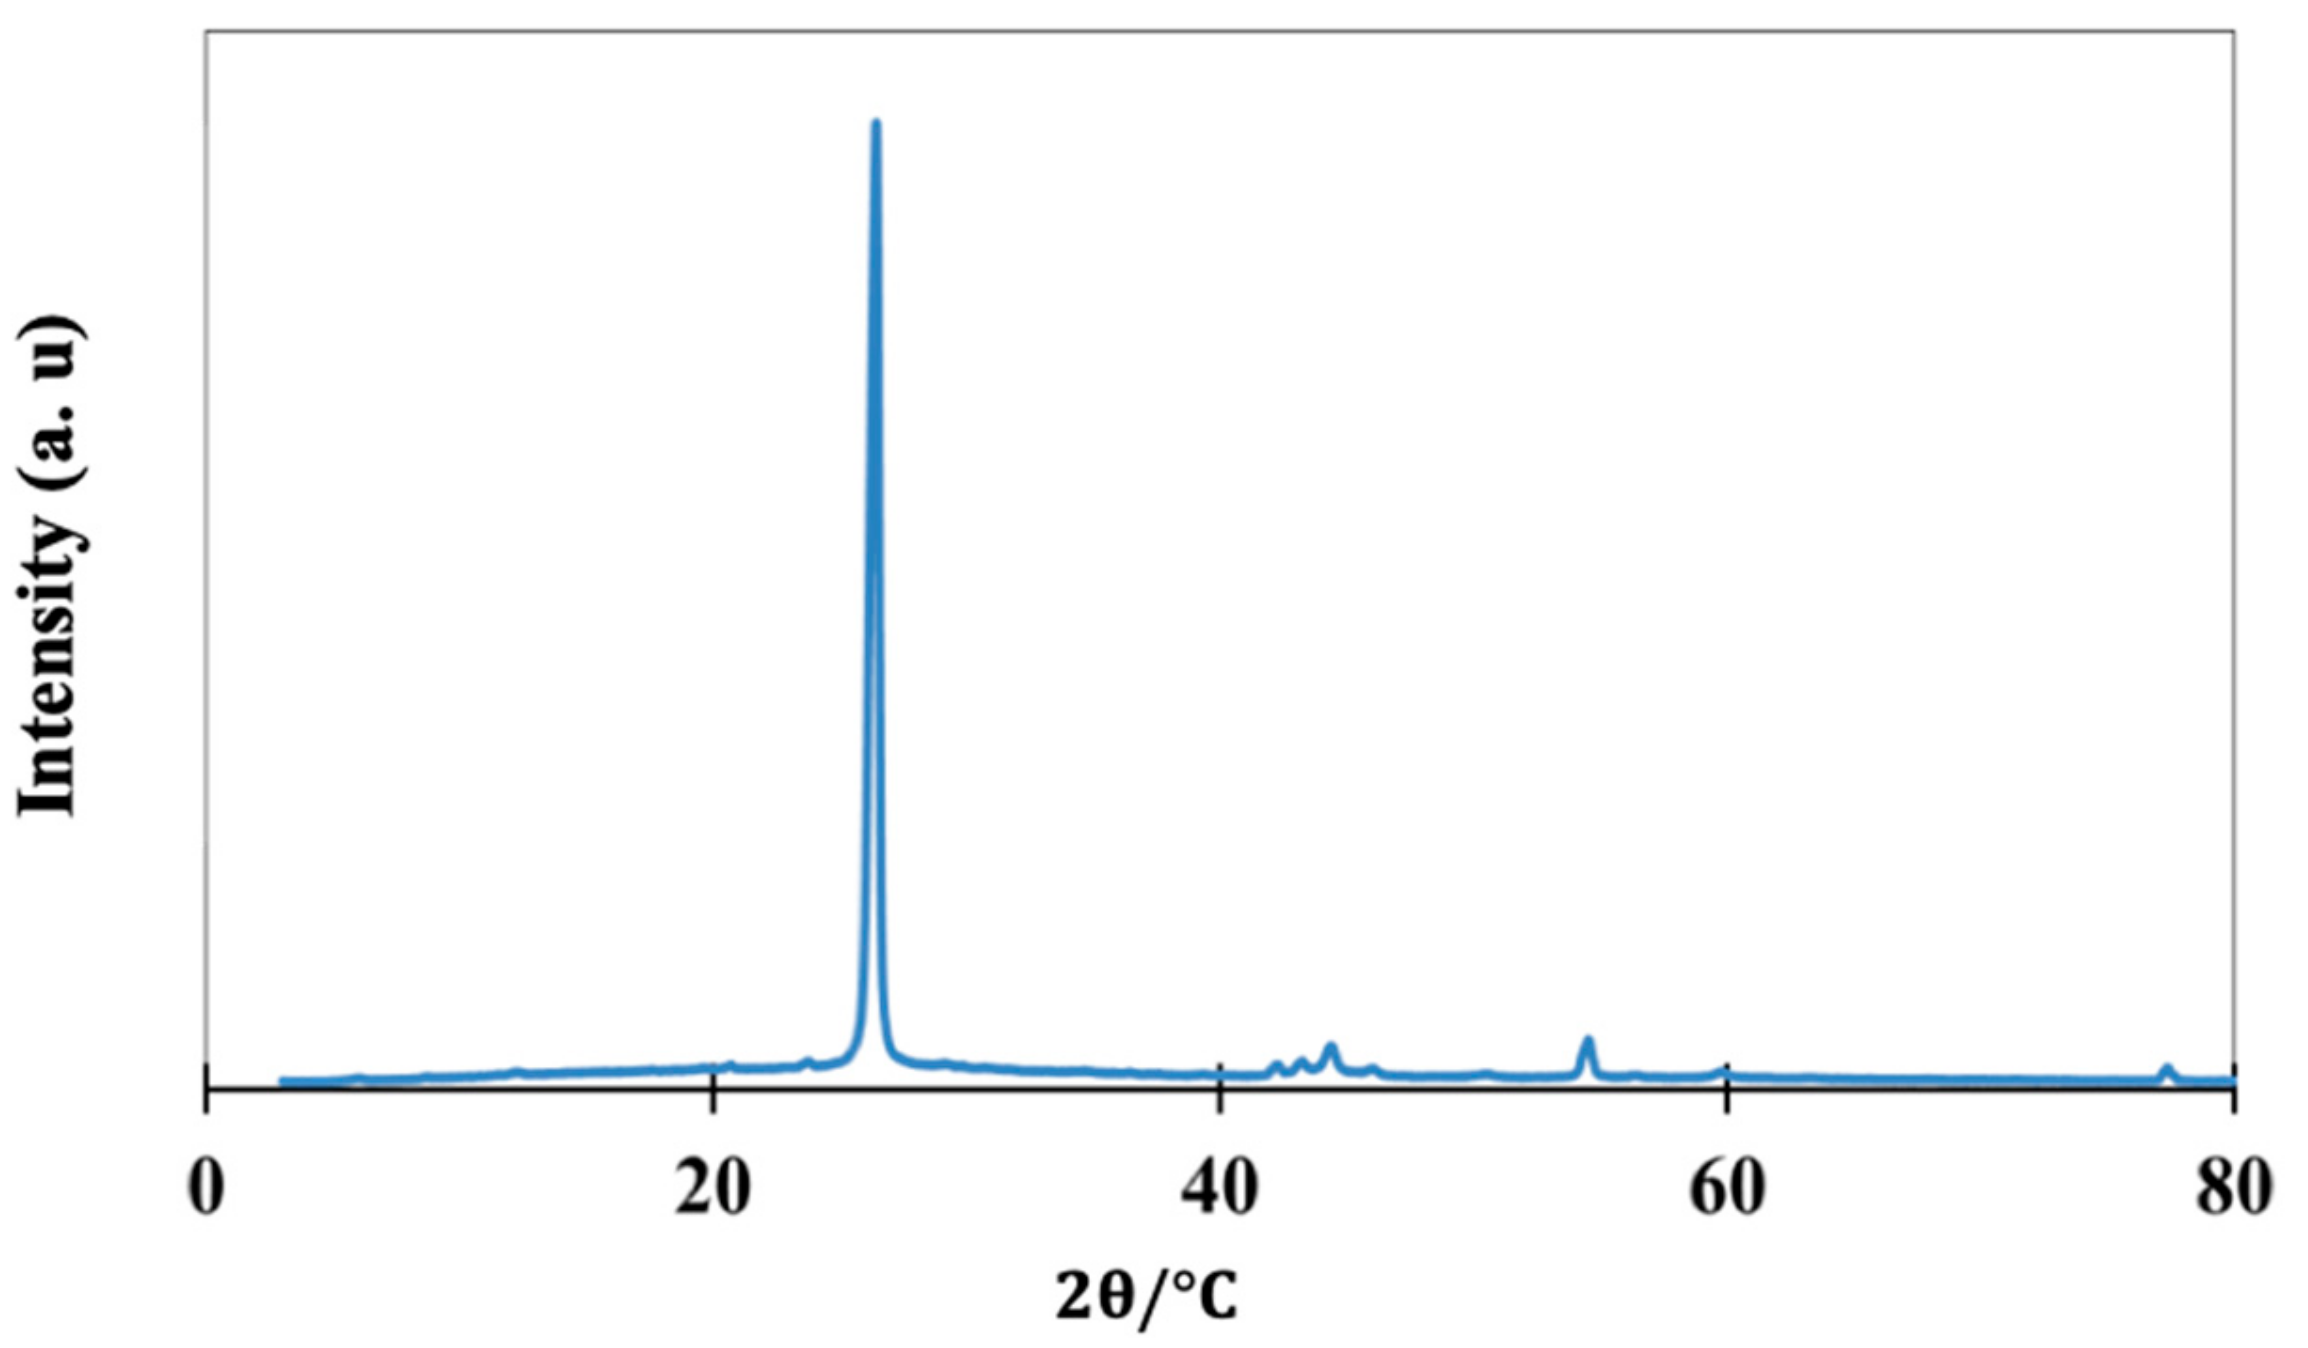
2.1.2. Structure and Composition
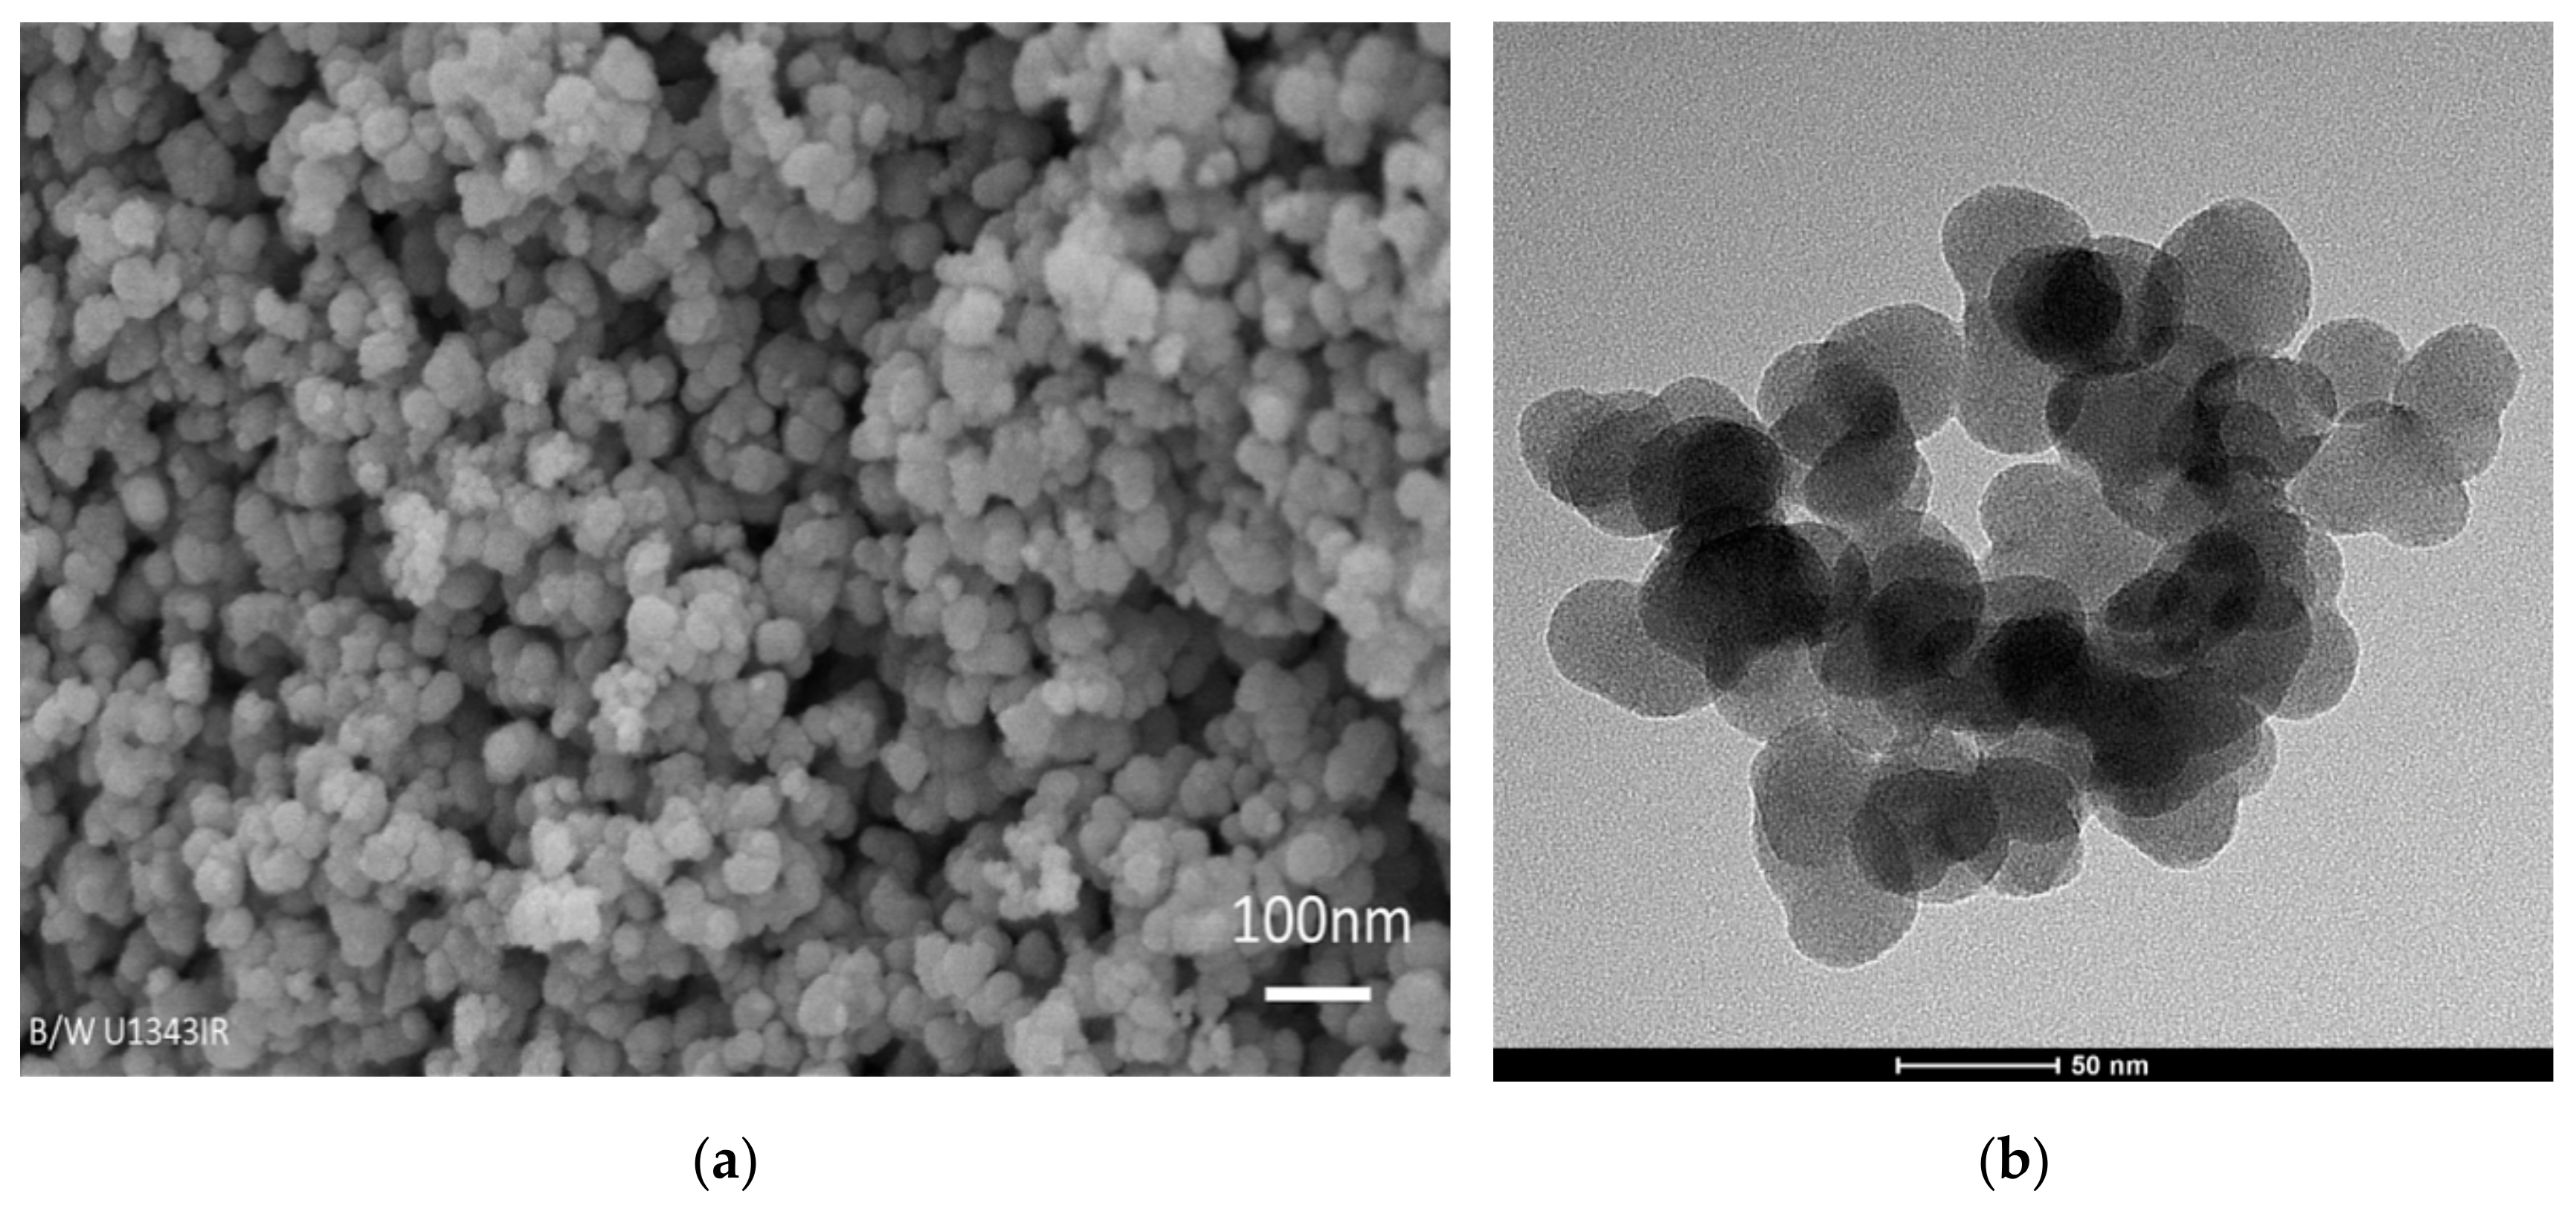
The x-ray diffraction test, known as XRD, was carried out for a sample of CNP using GNR APD 2000 (Italy) at ambient temperature. The data were collected in continuous mode and with the step size of 0.01⁰ and at the range of 3–80° similar to our previous works [36,37,38,39]. For the particle size determination, solid samples were dispersed in Milli-Q water in an ultrasound bath (Sonorex Super, Bandelin, Germany) for 30 min. High resolution particle detecting and sizing experiment on the CNP sample was performed using a NanoSight LM10 instrument (Malvern Instruments, Malvern, UK). Results of the XRD test have been represented in Figure 5. The peak observed at 26 degree is the main characteristic peak of carbon due to structure of the particle, which is (002) lattice plane. In addition, the small peak seen in 45 degree is due to the presence of some amorphous carbon in the system, which can be ignored.

2.1.3. Morphology

To assess the morphology, dispersion and agglomeration, Scanning Electron Microscopic image (SEM, represented in Figure 6a) and Transmission Electron Microscopic images, (TEM) were captured from a sample of 1% by volume of carbon nanoparticles inside the acetone as presented in Figure 6b. The required information was added to the paper. To prepare the sample for SEM imaging, the desired mass of CNP was weighted (1.25 g) and the sample was washed with methanol and then dried to remove any dust and oily material from the sample. Then the sample was coated with a conductive material using a use of a sputter-coater. To prepare the sample for TEM imaging, the prepared nanofluid was placed on the specimen grid using Formvar with a uniform thickness. The temperature of the room must be well below the boiling temperature of the liquid to prevent from the evaporation. In addition, the specimen grid disk was washed with methanol and dried to ensure that there was no impurity stick to the mesh and surface of the specimen disk. As can be seen, the morphology is spherical and the same for the particles. Importantly, neither cluster nor agglomeration is formed during the dispersion.

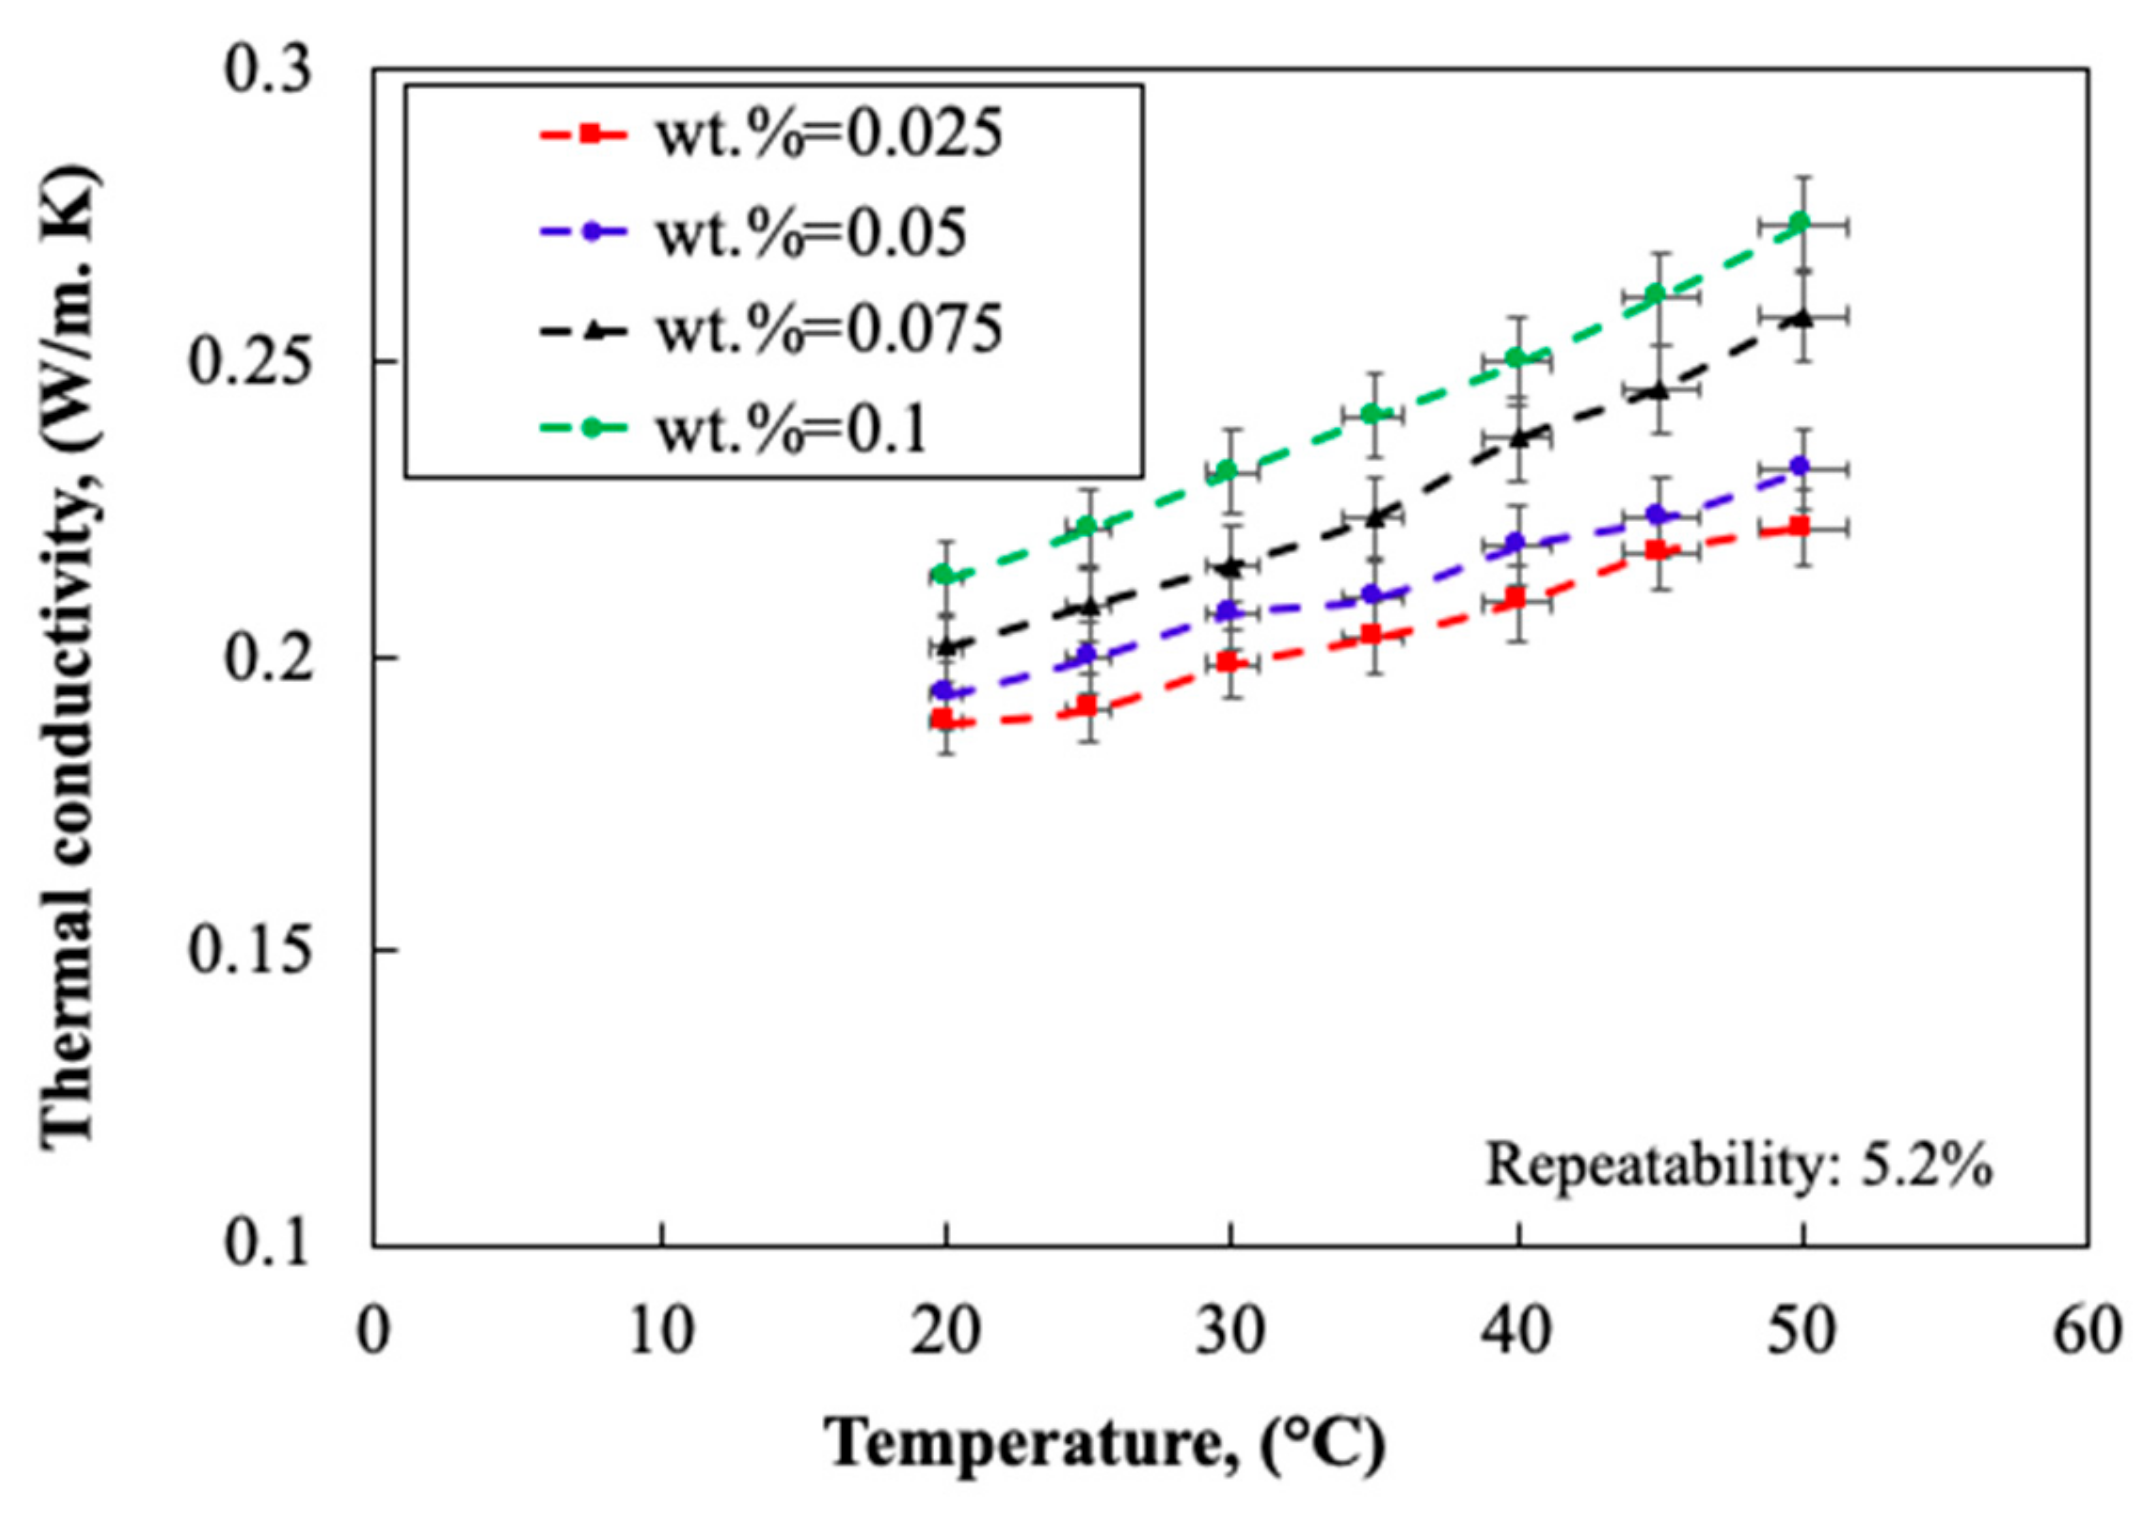
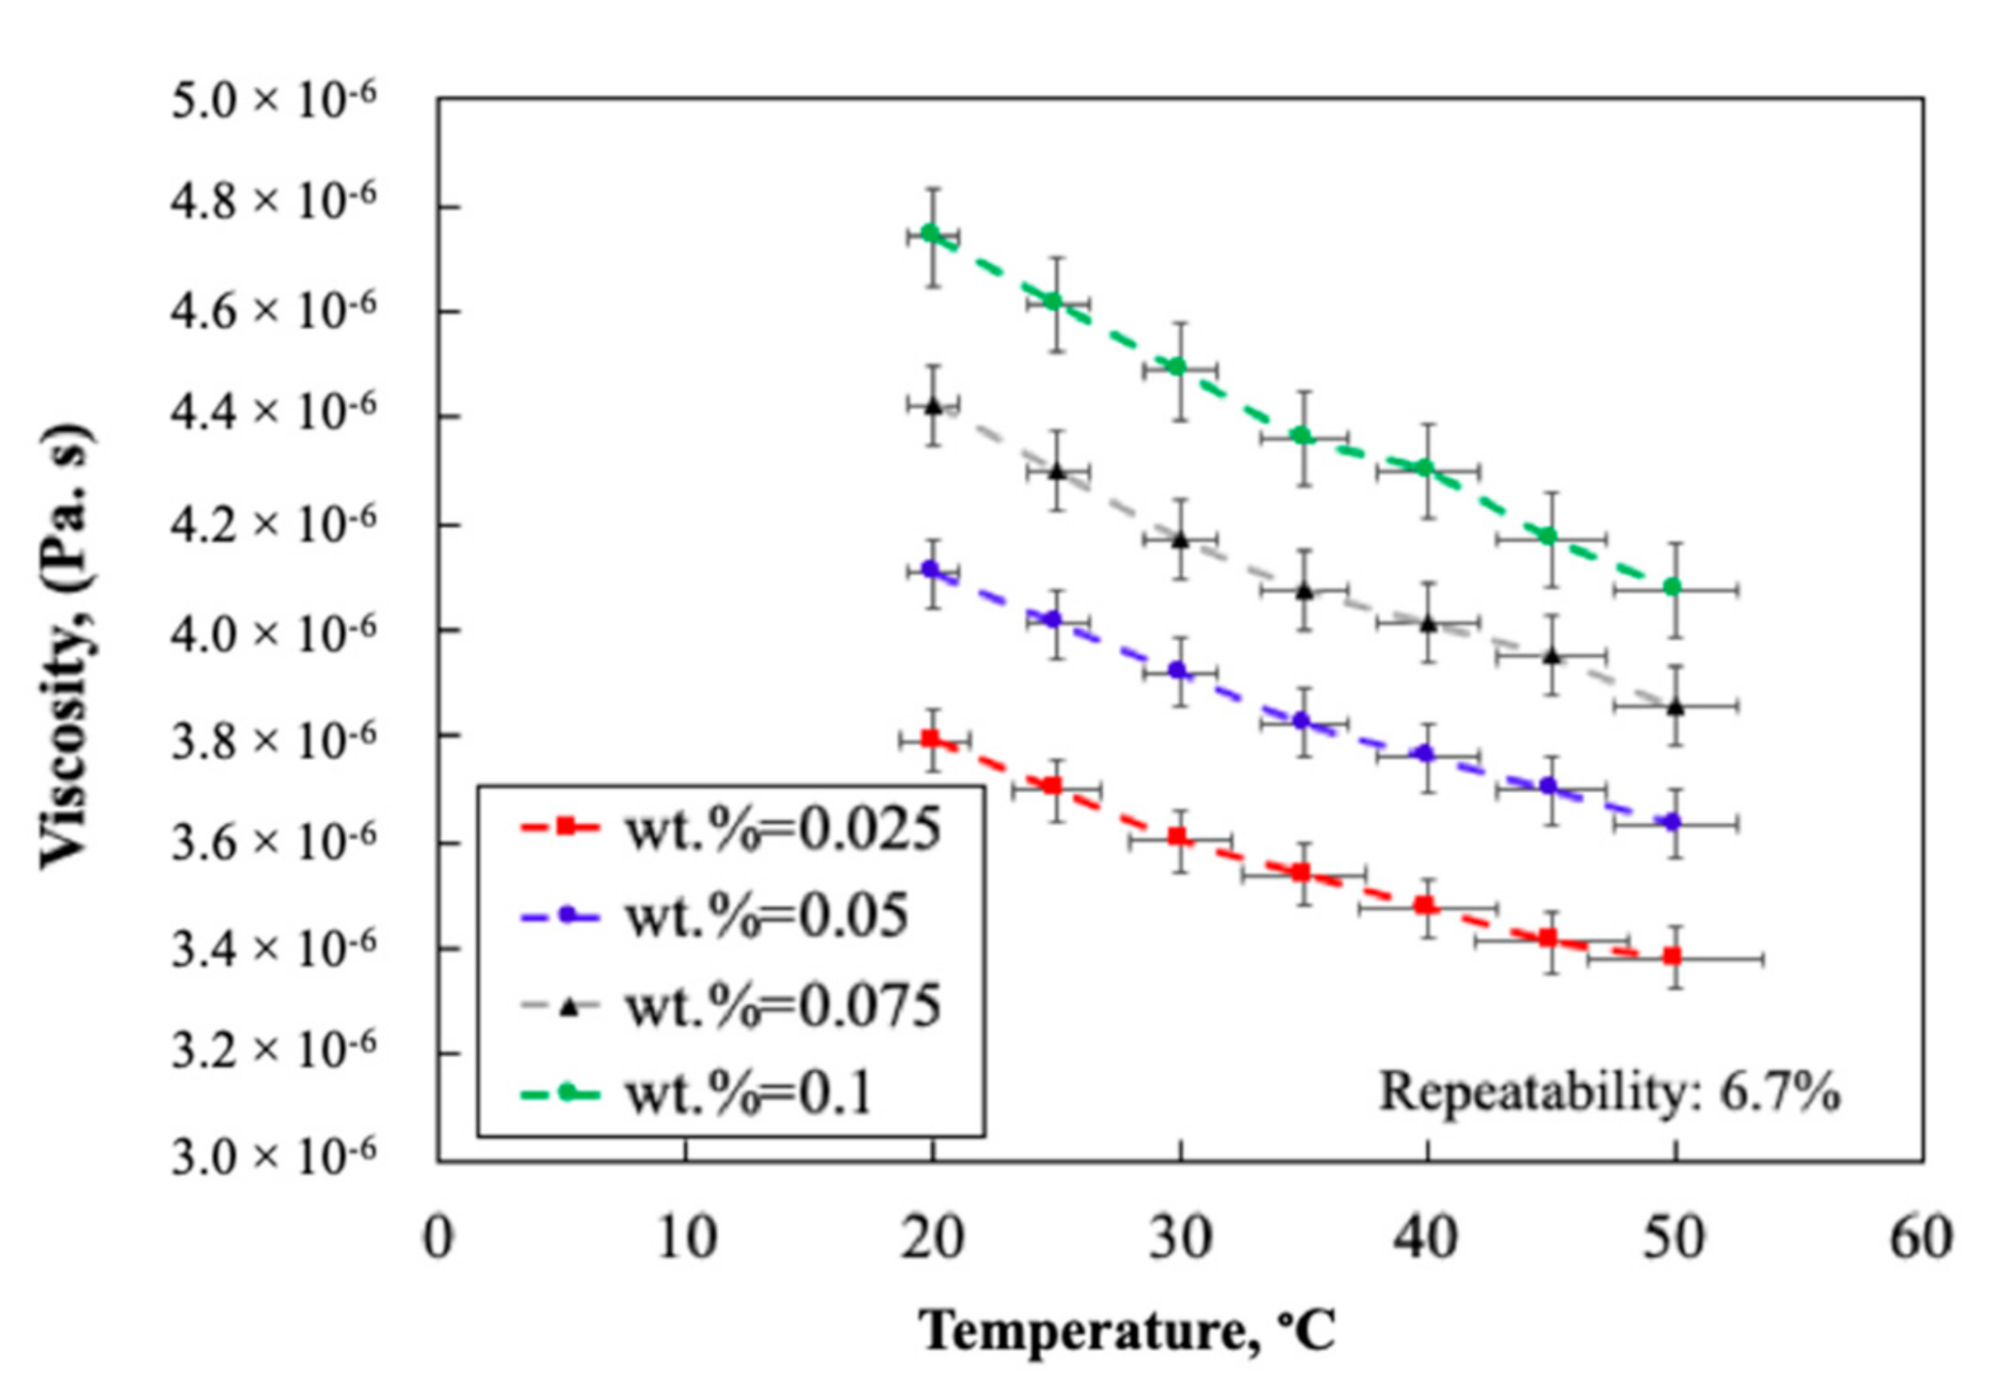
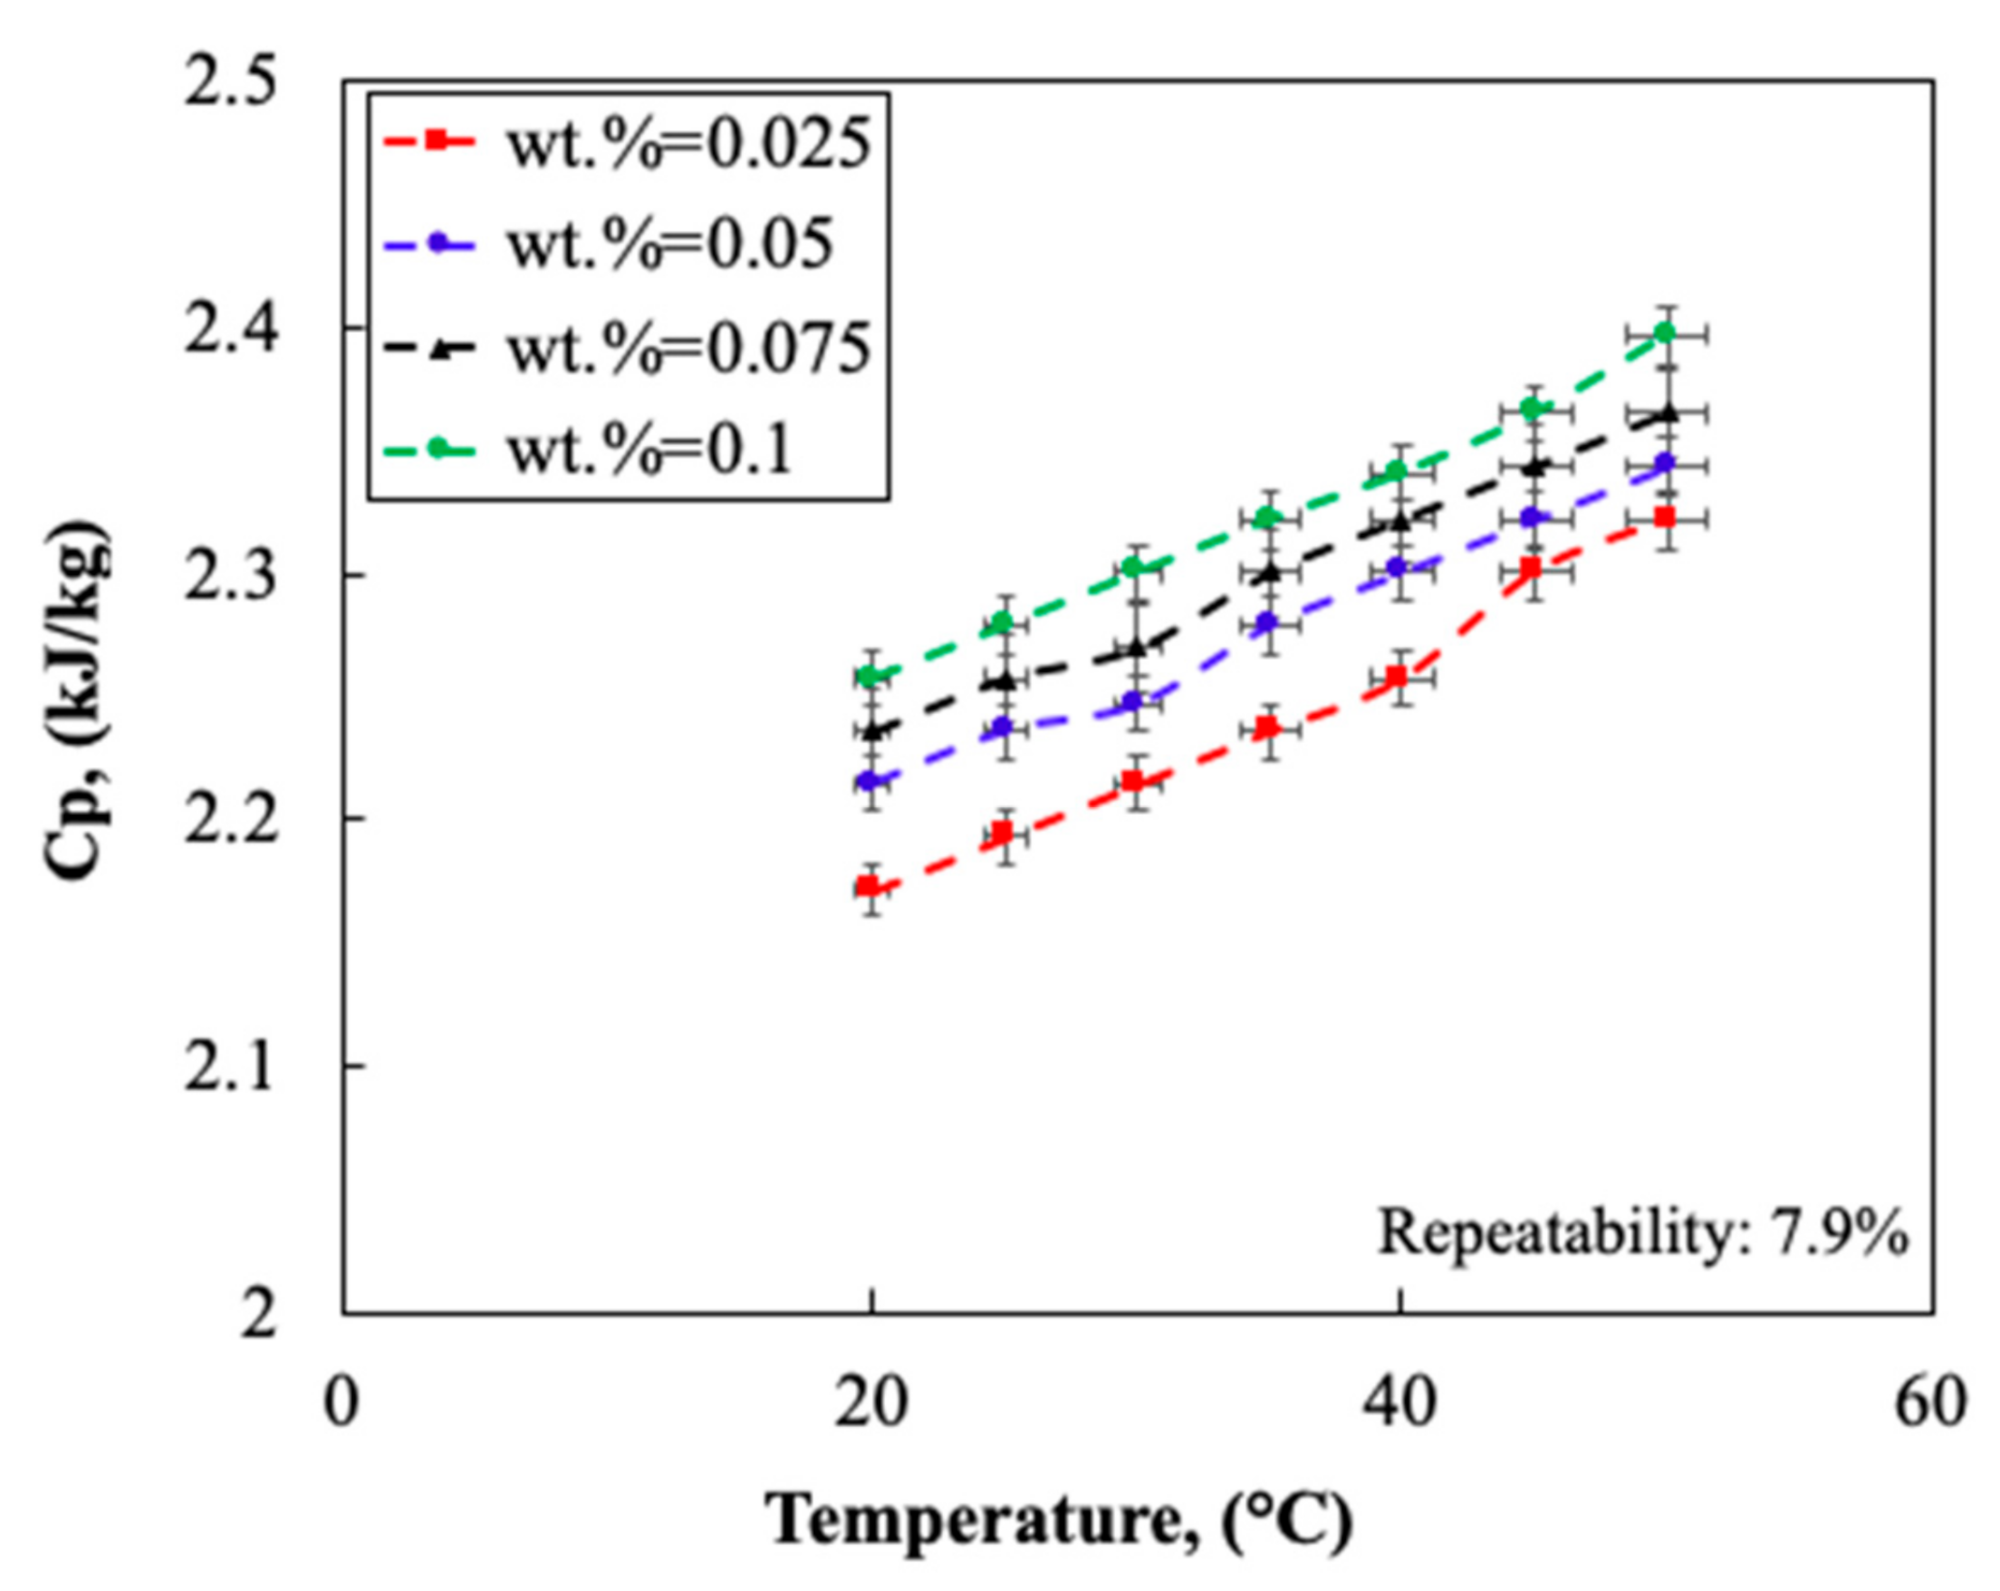
2.1.4. Thermo-Physical Properties

To identify the influence of the nanoparticles on the thermo-physical properties of the base fluid, a series of experiments were performed with instruments to measure the thermo-physical properties of the nanofluids including the density, the thermal conductivity and the heat capacity of the nanofluid. To measure the thermal conductivity and the heat capacity of the system, a KD2 pro manufactured by Decagon (with the accuracy of ~5% and ~8% of the reading value were used. To measure the viscosity, the viscometer manufactured by Brookfield DV I series with accuracy of ~6% was used. As can also be seen in Figure 7, adding more nanoparticles to the carrying fluid, thermal conductivity of the fluid increases. For example, at 40 °C, at wt. % = 0.025, the measured thermal conductivity was ~0.21 W/(mK), while for the same temperature, at wt. % = 0.1, the thermal conductivity increased to ~0.25 W/(mK), increasing by 19%. Notably, the thermal conductivity of acetone was 0.18 W/(mK), while those of CNP-acetone were larger than pure acetone. Interestingly, with temperature increment, the thermal conductivity of the nanofluid increased. This can be attributed to the Brownian motion boosting within the bulk of the nanofluid, which enhances the collision and the conduction–conduction heat transfer between the particles. The maximum thermal conductivity was 0.27 W/(mK) at the largest temperature of 50 °C and wt. % = 0.1.
Figure 8 represents the influence of temperature on the viscosity of CNP-acetone nanofluid for different mass fractions of CNP. According to the figure, an increment in the mass fraction of the nanofluid increases the frictional forces between the layers of the base fluid increases resulting in higher viscosity of the nanofluid. In addition, temperature slightly reduces the viscosity of the nanofluid. The highest viscosity was 0.00048 Pa.s and belonged to the nanofluid at wt. % = 0.1 and T = 20 °C.
Figure 9 shows the impact of the temperature on the heat capacity of the nanofluid for various mass fractions of CNP in acetone. With temperature increment, the heat capacity boosts which is owing to the augmentation in the heat capacity of acetone. In addition, with growth in the number of nanoparticles dispersed within the nanofluid, the heat capacity of the nanofluid increases. This is because the heat capacity of carbon by itself is larger than acetone. Thereby, raising the mass fraction of the nanofluid promotes the heat capacity of the nanofluid.

2.2. Experimental Setup

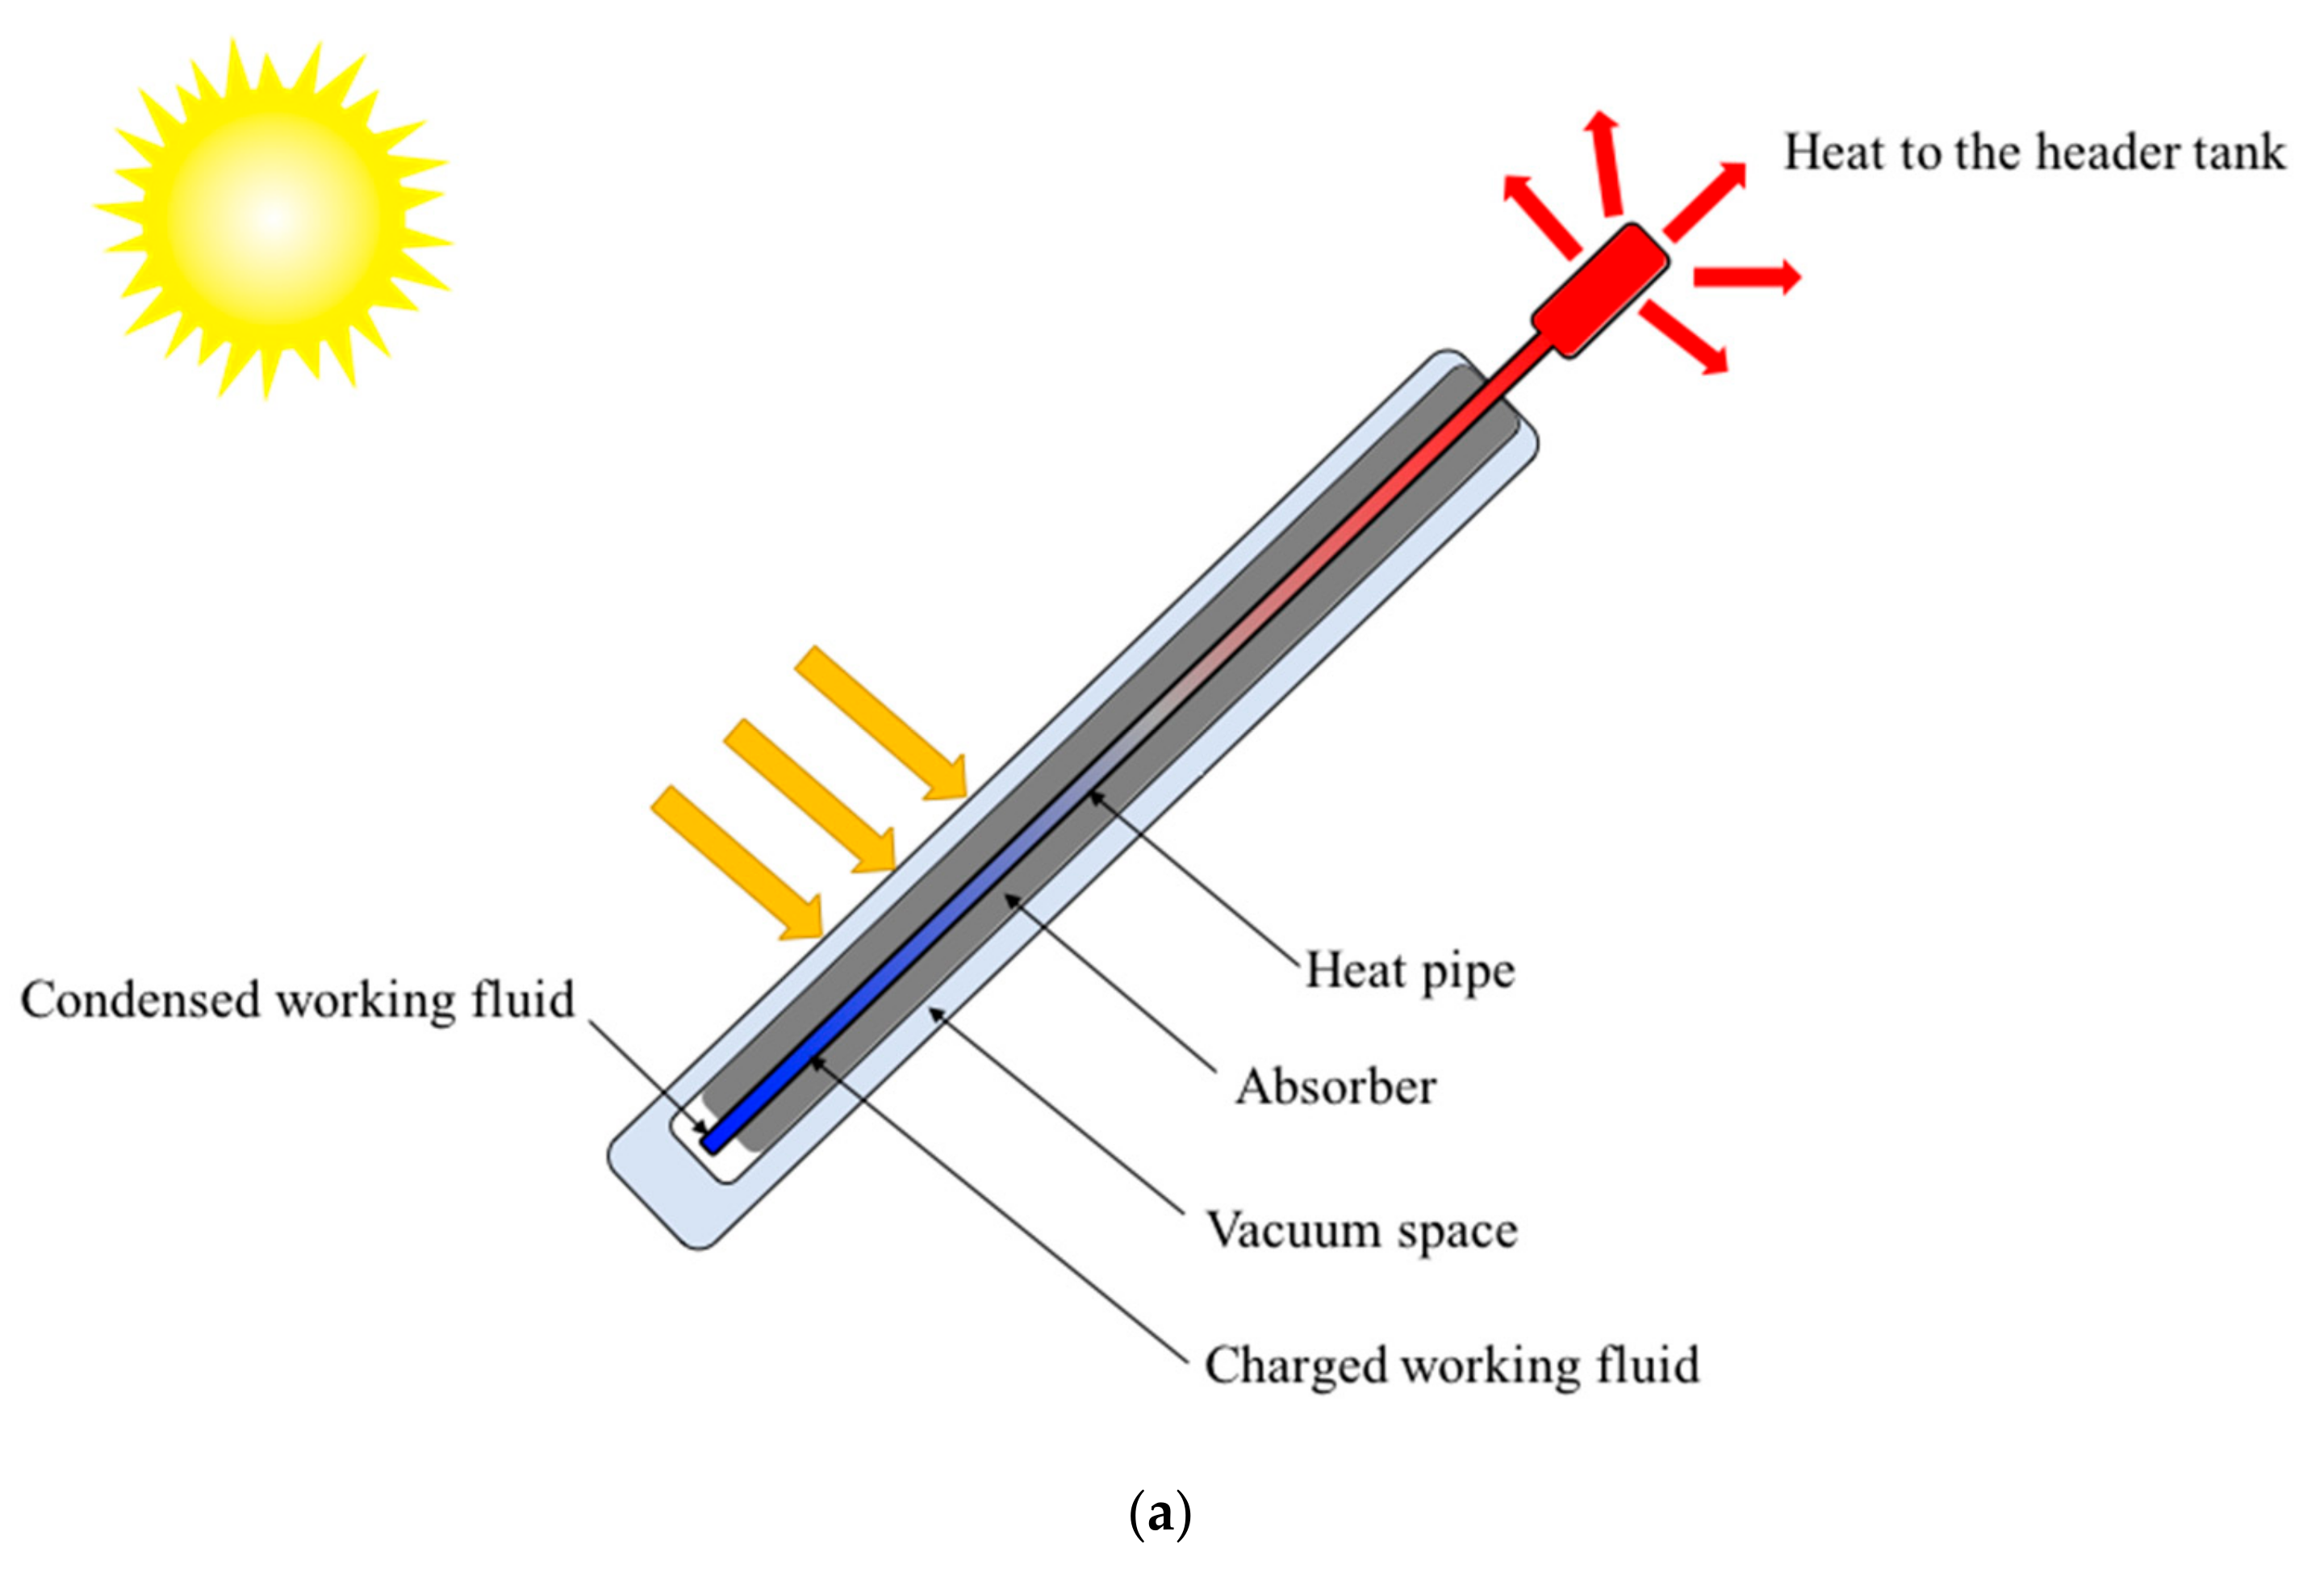
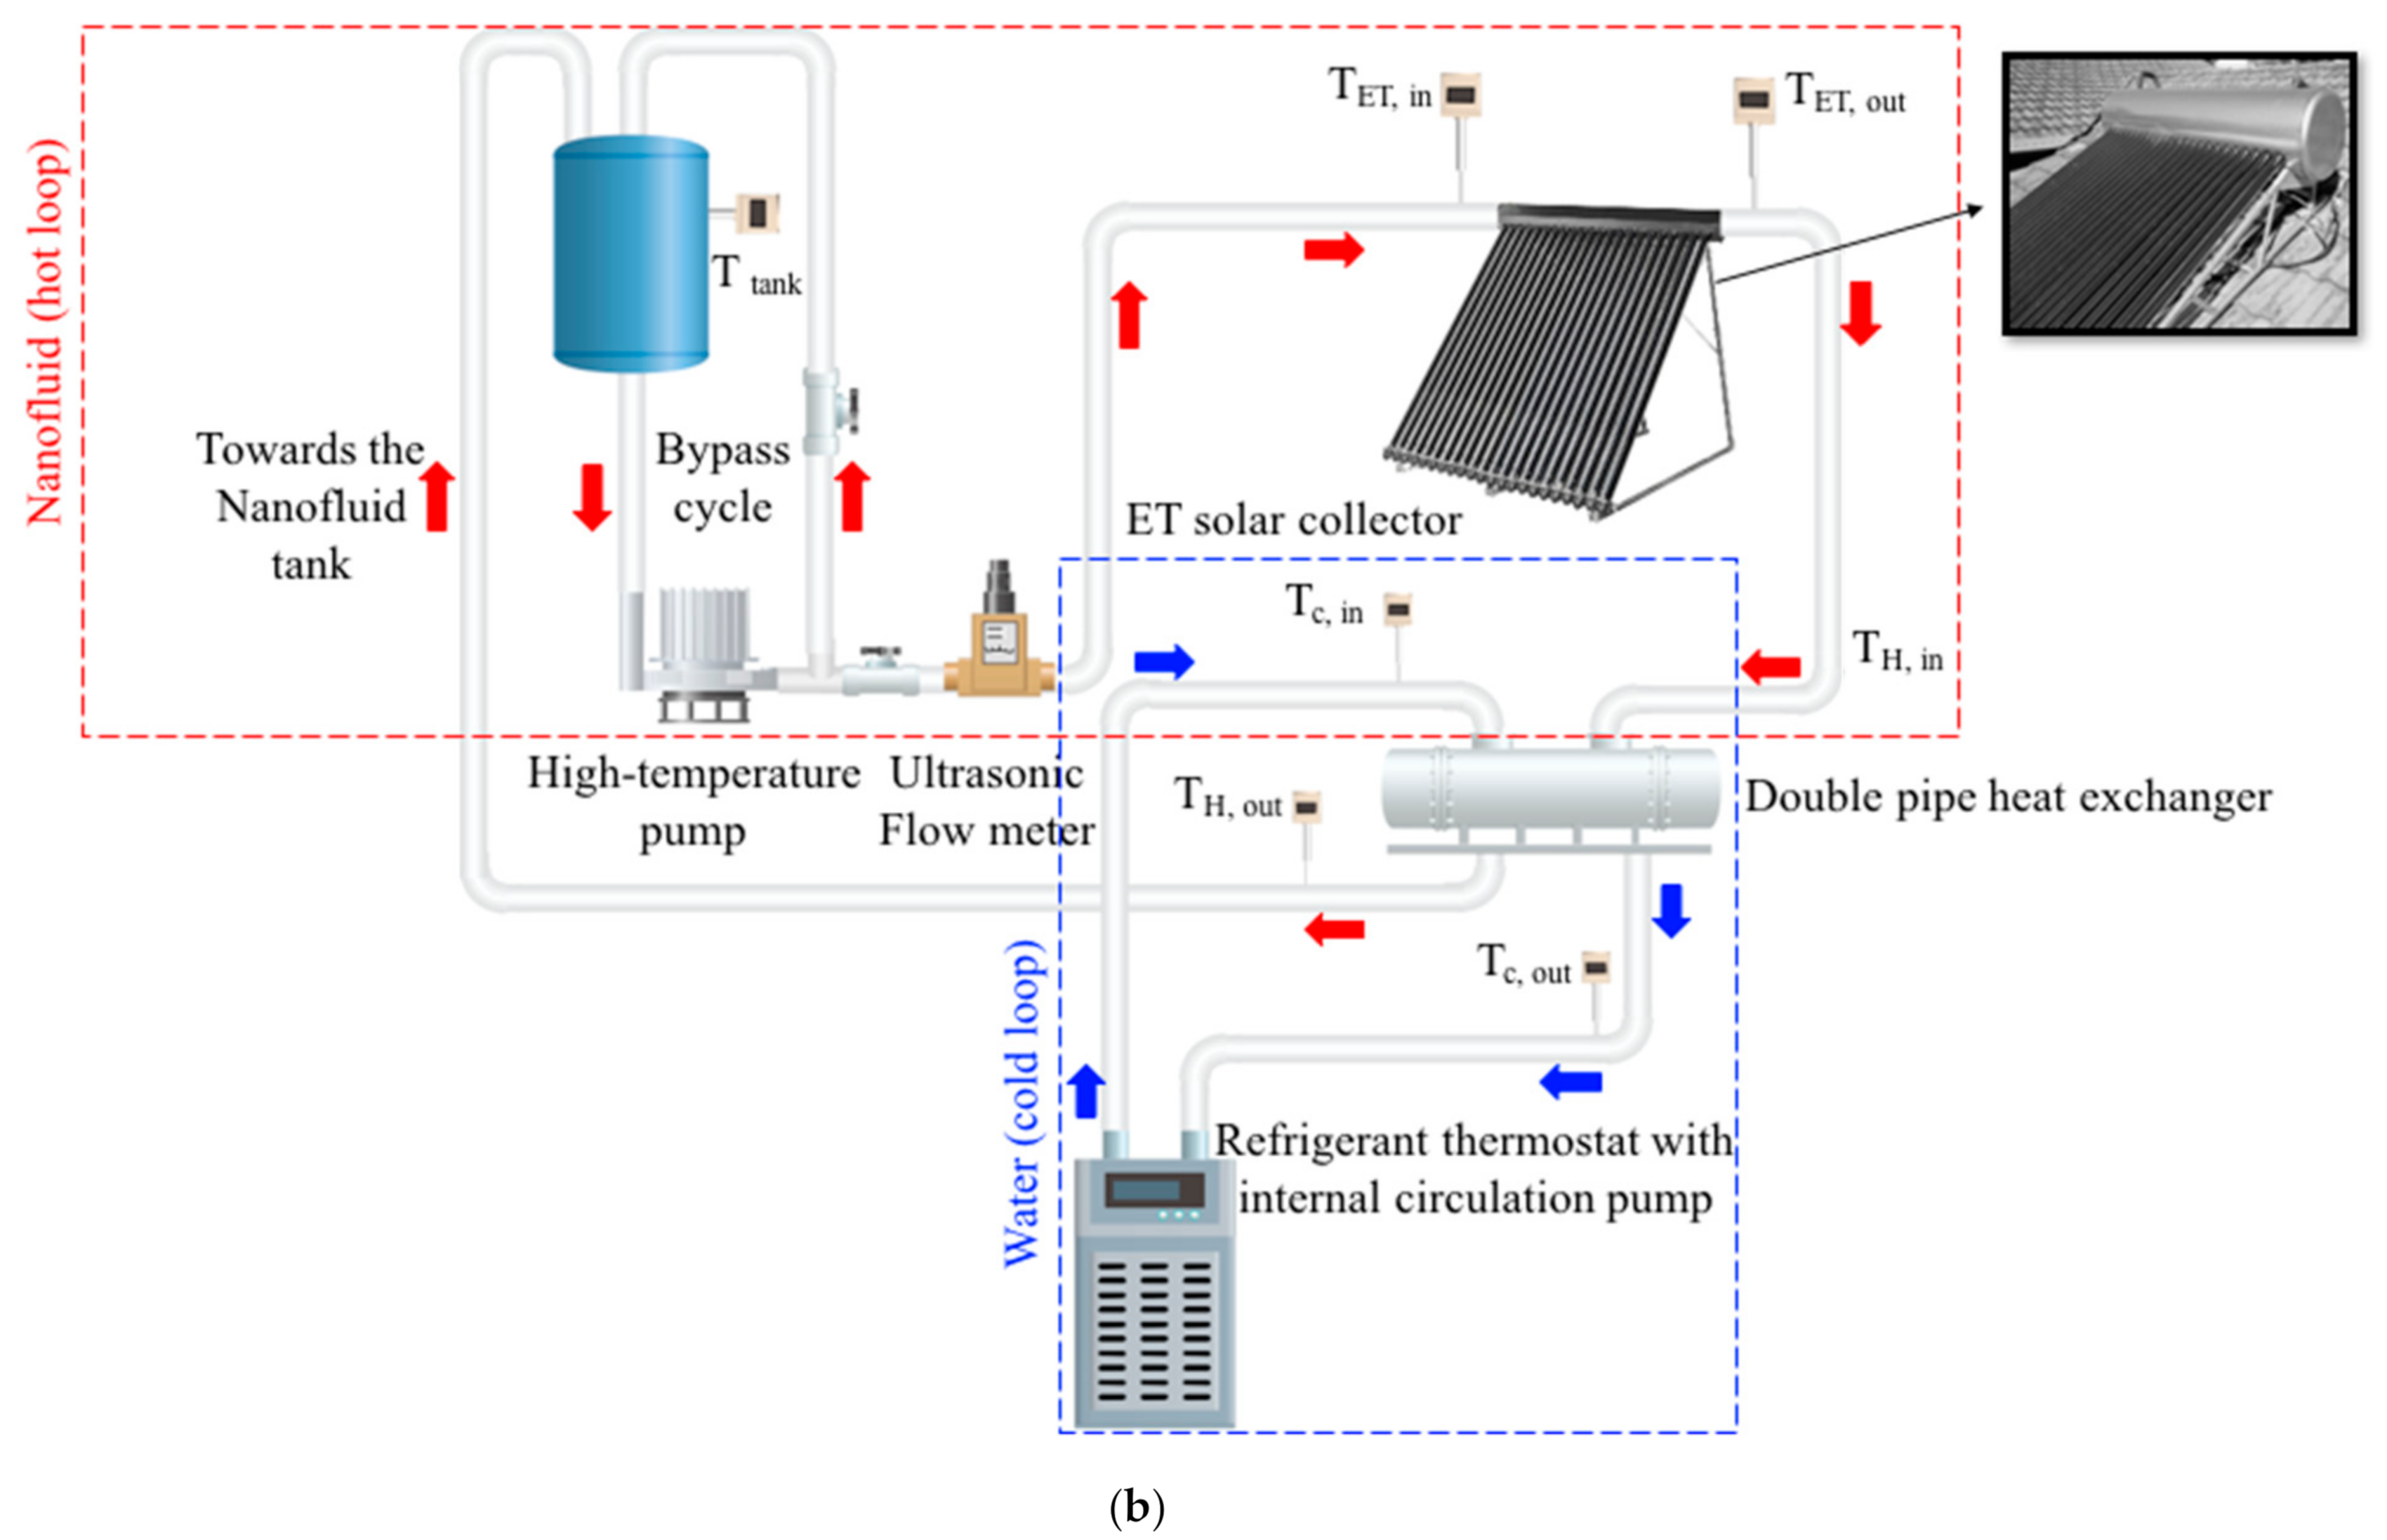
2.2.1. Experimental Setup

Figure 10a shows a schematic illustration of the ET used in the solar collector, consisting of an evaporator, an adiabatic and a condenser located at the header tank. The solar irradiance is absorbed with the absorber layer and is transferred to the evaporator section in which the internal carrying fluid of the evacuated tube is evaporated with the boiling mechanism and the heat together with the vapor are transported to the header tank in which the thermal energy is delivered to the cold water. The condensed carrying fluid is returned to the bottom of the HP under a gravity-assisted falling film of liquid. The detailed information about the HP and the evacuated tube are represented in Figure 10a. Figure 10b shows the schematic of the apparatus; accompanied with an image of the ETSC. The heat pipes inside the evacuated tubes are charged with the working fluid (CNP/acetone nanofluid) and water is pumped from a reservoir to a solar collector with a centrifugal pump (manufactured by DAB). The flow rate of the flow is controlled with an ultrasonic flow meter connected to a valve and a servo. The temperature of the tank was monitored with a PID controller and a thermostat bath to ensure a back-to-back comparison between the data obtained for each test. The inlet and the outlet temperature of the solar collector was constantly monitored with two k-type thermocouples connected to a digital data logging system with reading frequency of 1 kHz. The outlet of the collector was chilled with a water jacket connected to the thermostat bath to ensure that the temperature of the tank is constant. Notably, a bypass was also utilized to adjust the flow rate within the system. This ensures a very accurate flow rate adjustment within the system.
The experiments were conducted in a geographical location with the coordination of 27.19 latitude and 56.28 longitude and situated at an elevation of 8.9 m above sea level. The location has a population of 352,173. Hence, the importance of using solar thermal energy in this city is pivotal for domestic and industrial sectors. Given the fact that this city can take advantage of almost 300 sunny days within a year, the experiments were conducted there to ensure that the maximum solar share can be achieved. The maximum solar irradiance obtained in the city was 920 W/m2 well above the average of the other large cities all over the world (850–890 W/m2).

2.2.2. Data Reduction and Uncertainty Analysis

To measure the mass concentration of the nanofluid, Equation (1) was employed:
w t . %   =   w n p w b f
Here, wnp and wbf stand for the weight of carbon particles and pure acetone, respectively. In addition, the filling ratio is the volumetric ratio of a nanofluid to the total volume of the HP as follows:
i l l i n g   r a t i o %   =   v o l .   o f   N F v o l .   o f   H P
To measure the cumulative thermal energy absorbed by the collector, at each hour the thermal energy absorbed by the collector was measured and the following correlation was used to obtain the daily cumulative thermal energy absorbed by the collector:
Q c u m .   =   t   =   1   h r t   =   24   h r Q c o l . . d t
and
Q c o l .   =   m ˙ × C p × T E T , o u t T E T , i n
Here, Cp is the fluid’s heat capacity, ET, in and ET, out, stand for the inlet and outlet temperatures of the collector. In addition, m ˙ is the mass flow rate of the fluid introducing to the collector which can be calculated with Equation (5):
m ˙   =   ρ × Q ˙
Here, ρ is the density and Q ˙ is the volumetric flow rate of fluid, which can be acquired from the ultrasonic flow meter. Thus, the thermal efficiency of the collector can be obtained with the following equation:
η   =   m ˙ × C p × T E T , o u t T E T , i n G × A c
Here, G stands for the solar irradiance and Ac is the area of the collector. To compute the overall value of the uncertainty of the experiments, the Moffat method was employed [41] using the values given in Table 1. According to the uncertainty values of the instruments utilized in the research, the uncertainty for the efficiency measurements is deviation within ±3.5% of the results. Table 2 also shows the geometrical specification of the evacuated tube solar collector.

3. Results and Discussion

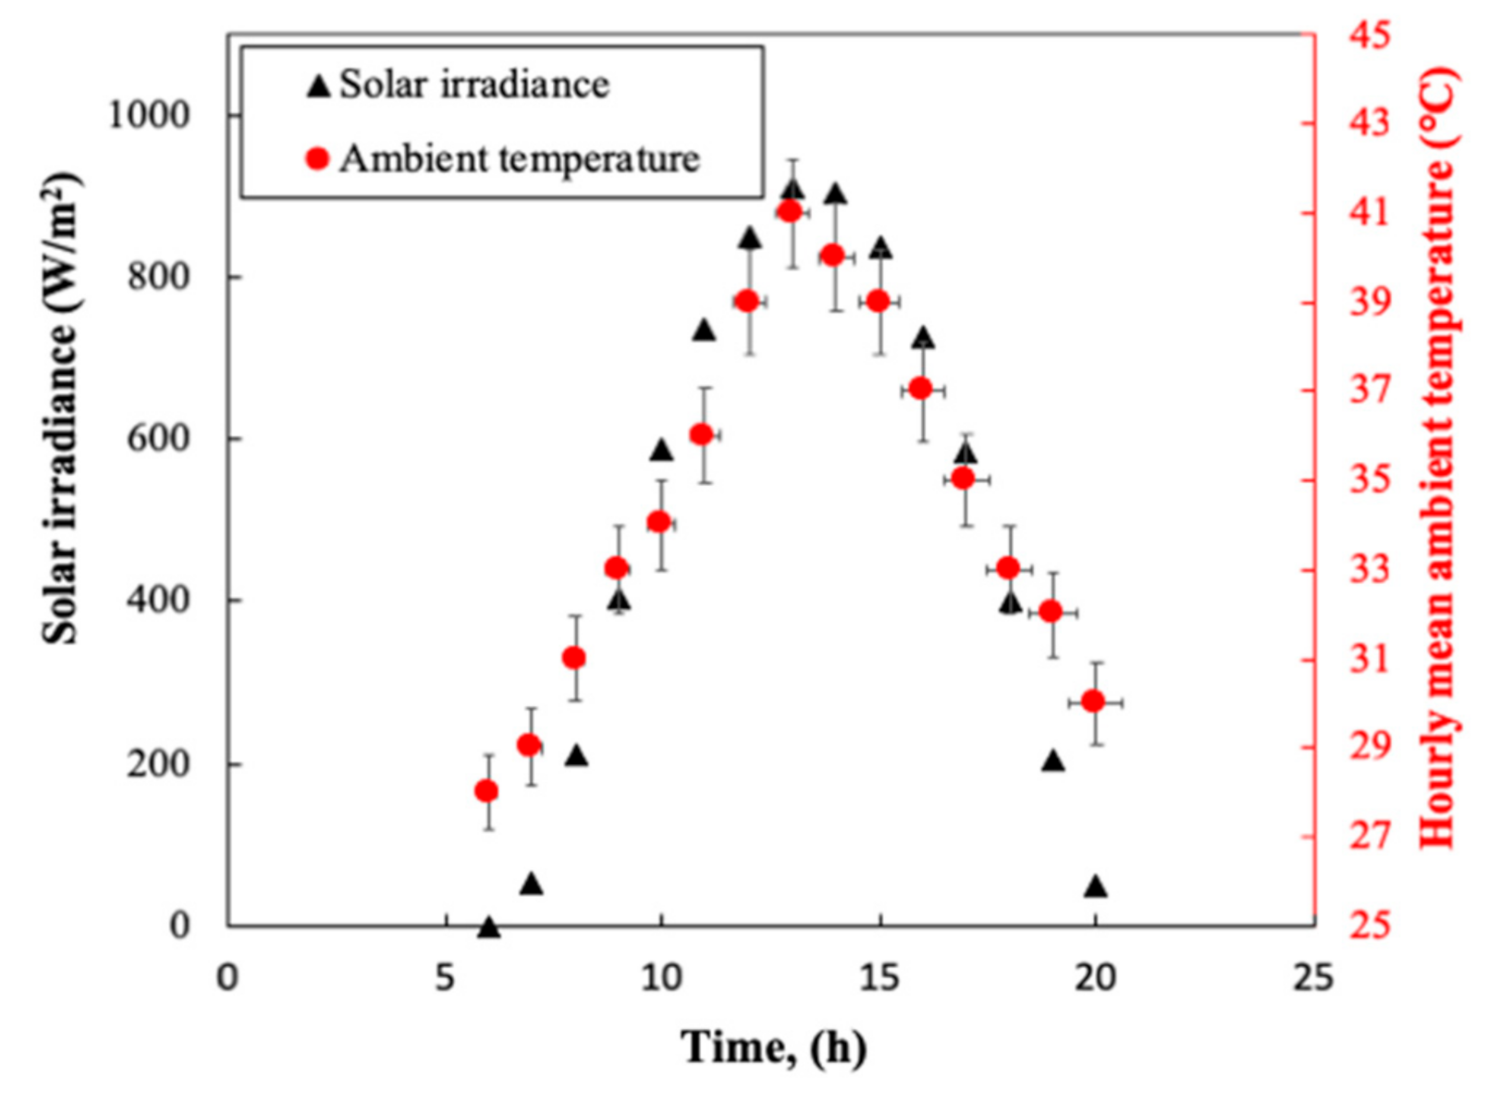
3.1. Solar Irradiance and Ambient Temperature

Figure 11 represents the dependence on time of the solar irradiance and the hourly average ambient temperature of the location of the experiments. As can be seen, the highest solar irradiance is observed between 10:00 am and 3:00 pm reaching 920 W/m2 at 1:00 pm. The solar irradiance represented in Figure 11 was obtained at the hottest day in midsummer to maximize the solar thermal energy and the thermal absorption by the solar collector. The same trend was also observed for other days in summer and other seasons, however, the highest solar irradiance value varied from 410 W/m2 in winter to 520 W/m2 and 780 W/m2 in winter, autumn and spring, respectively. As can also be seen, the hourly mean ambient temperature followed the trend obtained for the solar irradiance such that the highest ambient temperature was obtained between 10:00 am and 3:00 pm. The lowest and the highest temperature readings were 27.5 °C and 41 °C, respectively. In addition, the temperature rectilinearly increased with the time spanning. Hence, the experiments were conducted from 6:00 am to 8:00 pm to maximize the utilization of the available solar irradiance in the region. Notably, the solar irradiance was measured with pyranometer manufactured by EKO CO. at various time of the day. The pyranometer was used to measure the planar solar irradiance on the location on which the solar collector was installed. The maximum of 920 W/m2 was measured during hot days of summer in the location.

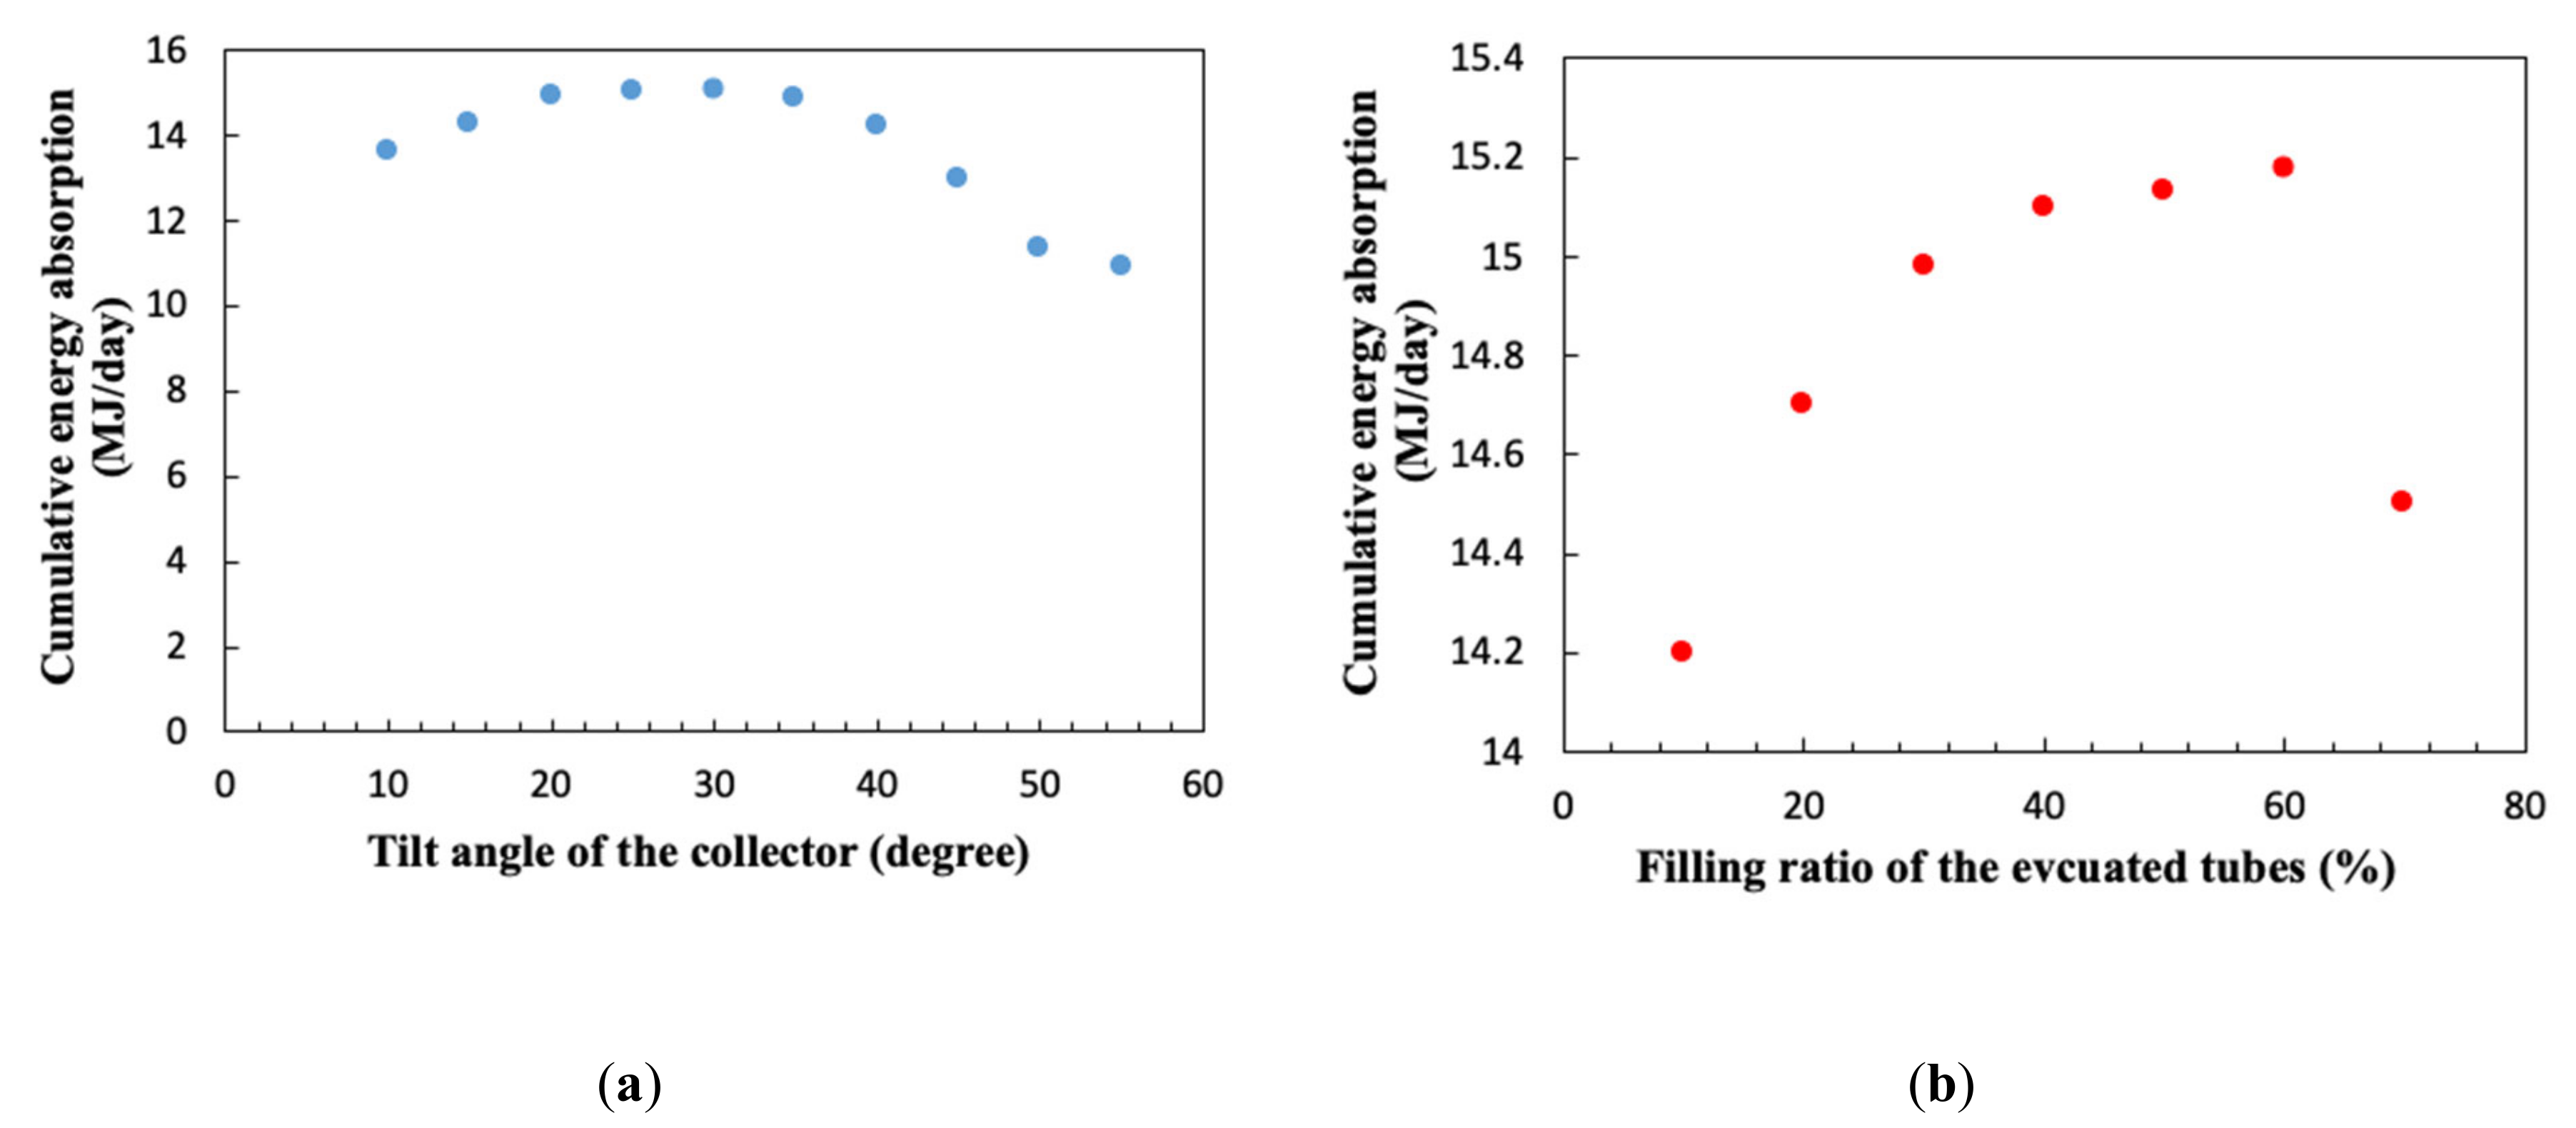
3.2. Tilt Angle and Filling Ratio

Figure 12a,b represent the variation of the cumulative energy absorption from the collector with the tilt angle and filling ratio of the evacuated tubes in the 15th and 16th August, 2017 with the same solar irradiance profiles. As can be seen in Figure 12a, with an increment in the tilt angle of the collector, the cumulative energy absorption initially increased and then was suppressed with boosting the tilt angle of the collector. The highest cumulative thermal energy absorption belonged to the collector at tilt angle of 30° (the blue rectangular), while the lowest thermal energy was absorbed with the collector at tilt angle of 45° and higher. As can be seen in Figure 12b, with a growth in the filling ratio of the HP from 10% to 60%, the cumulative thermal energy absorbed by the collector increased from 14.2 MJ/day to 15.1 MJ/day, and suddenly decreased to 14.5 MJ/day at filling ratio of 70%. This behavior can be attributed to the trade-off between the space available inside the HP and also the heat capacity of the carrying fluid (m × Cp). With the filling ratio increment of the working fluid, the total heat capacity of the working fluid increases, while also the space available for transporting the vapor inside the HP significantly decreases. Hence, there is an optimum value for the filling ratio in which the thermal transport within the HP is maximized, while the heat capacity of the working fluid is plausible as well. Notably, for the tilt angle value, there is another trade-off in between the gravity forces, residence time of the carrying fluid and also the area of the collector exposed to solar insolation. With tilt angle increment, the gravity force facilitates the return of the carrying fluid to the evaporator section while in turn decreases the area exposed to the solar insolation and also decreases the residence time of the carrying fluid in the condenser region. Hence for both parameters, depending on the type of the carrying fluid, the optimum value should be identified.

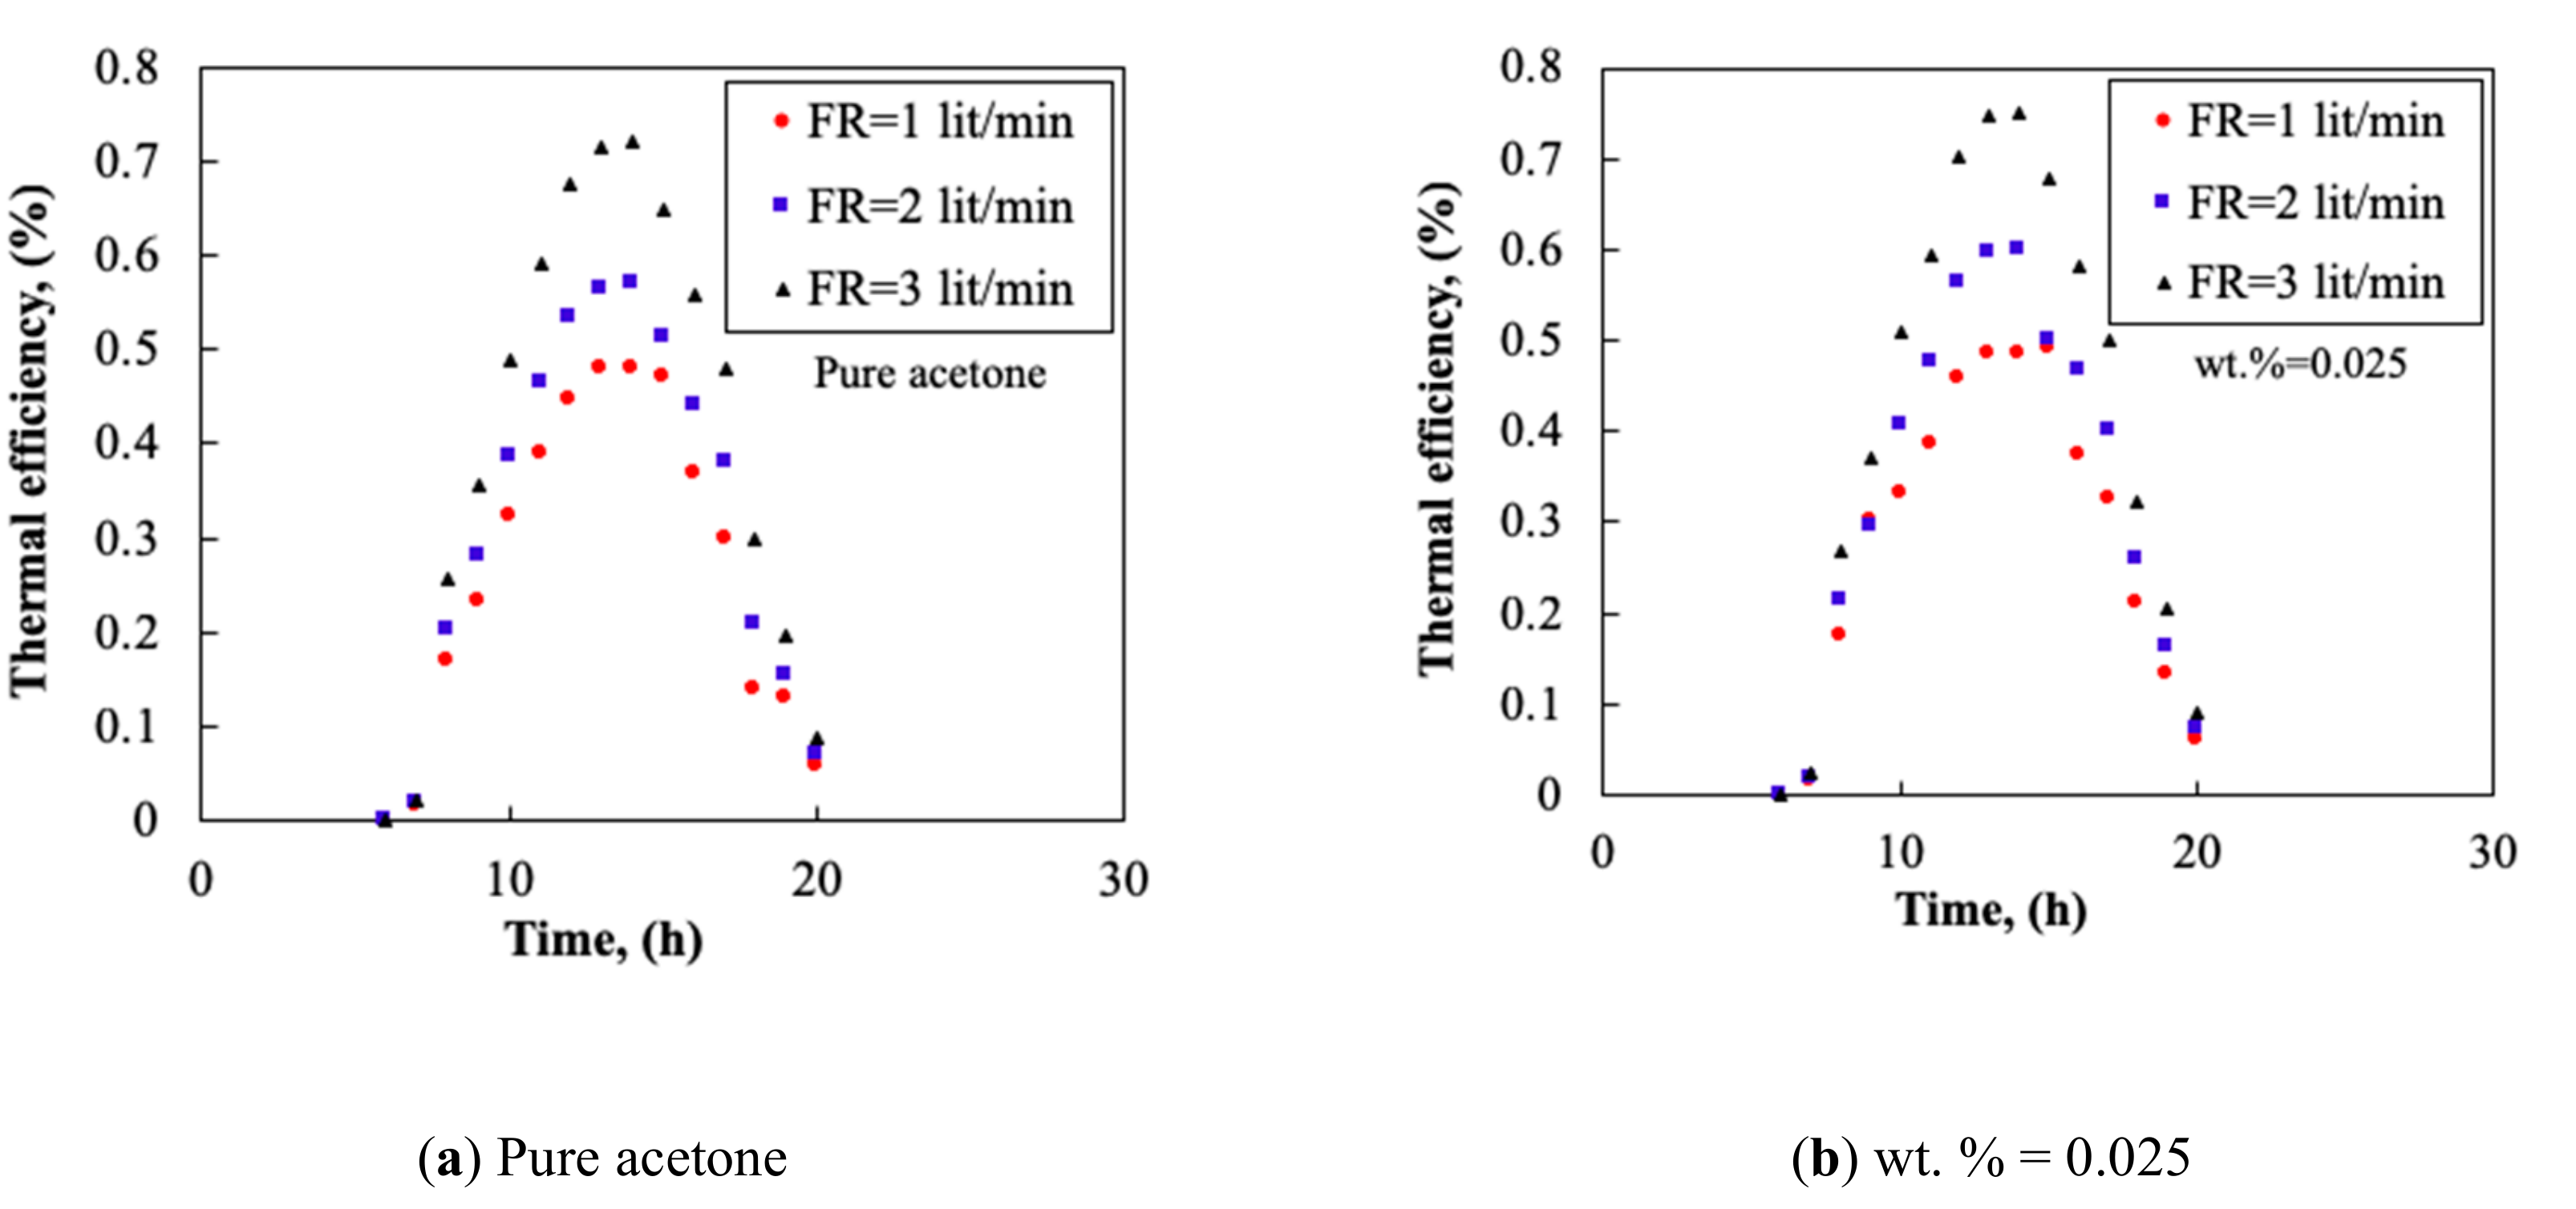
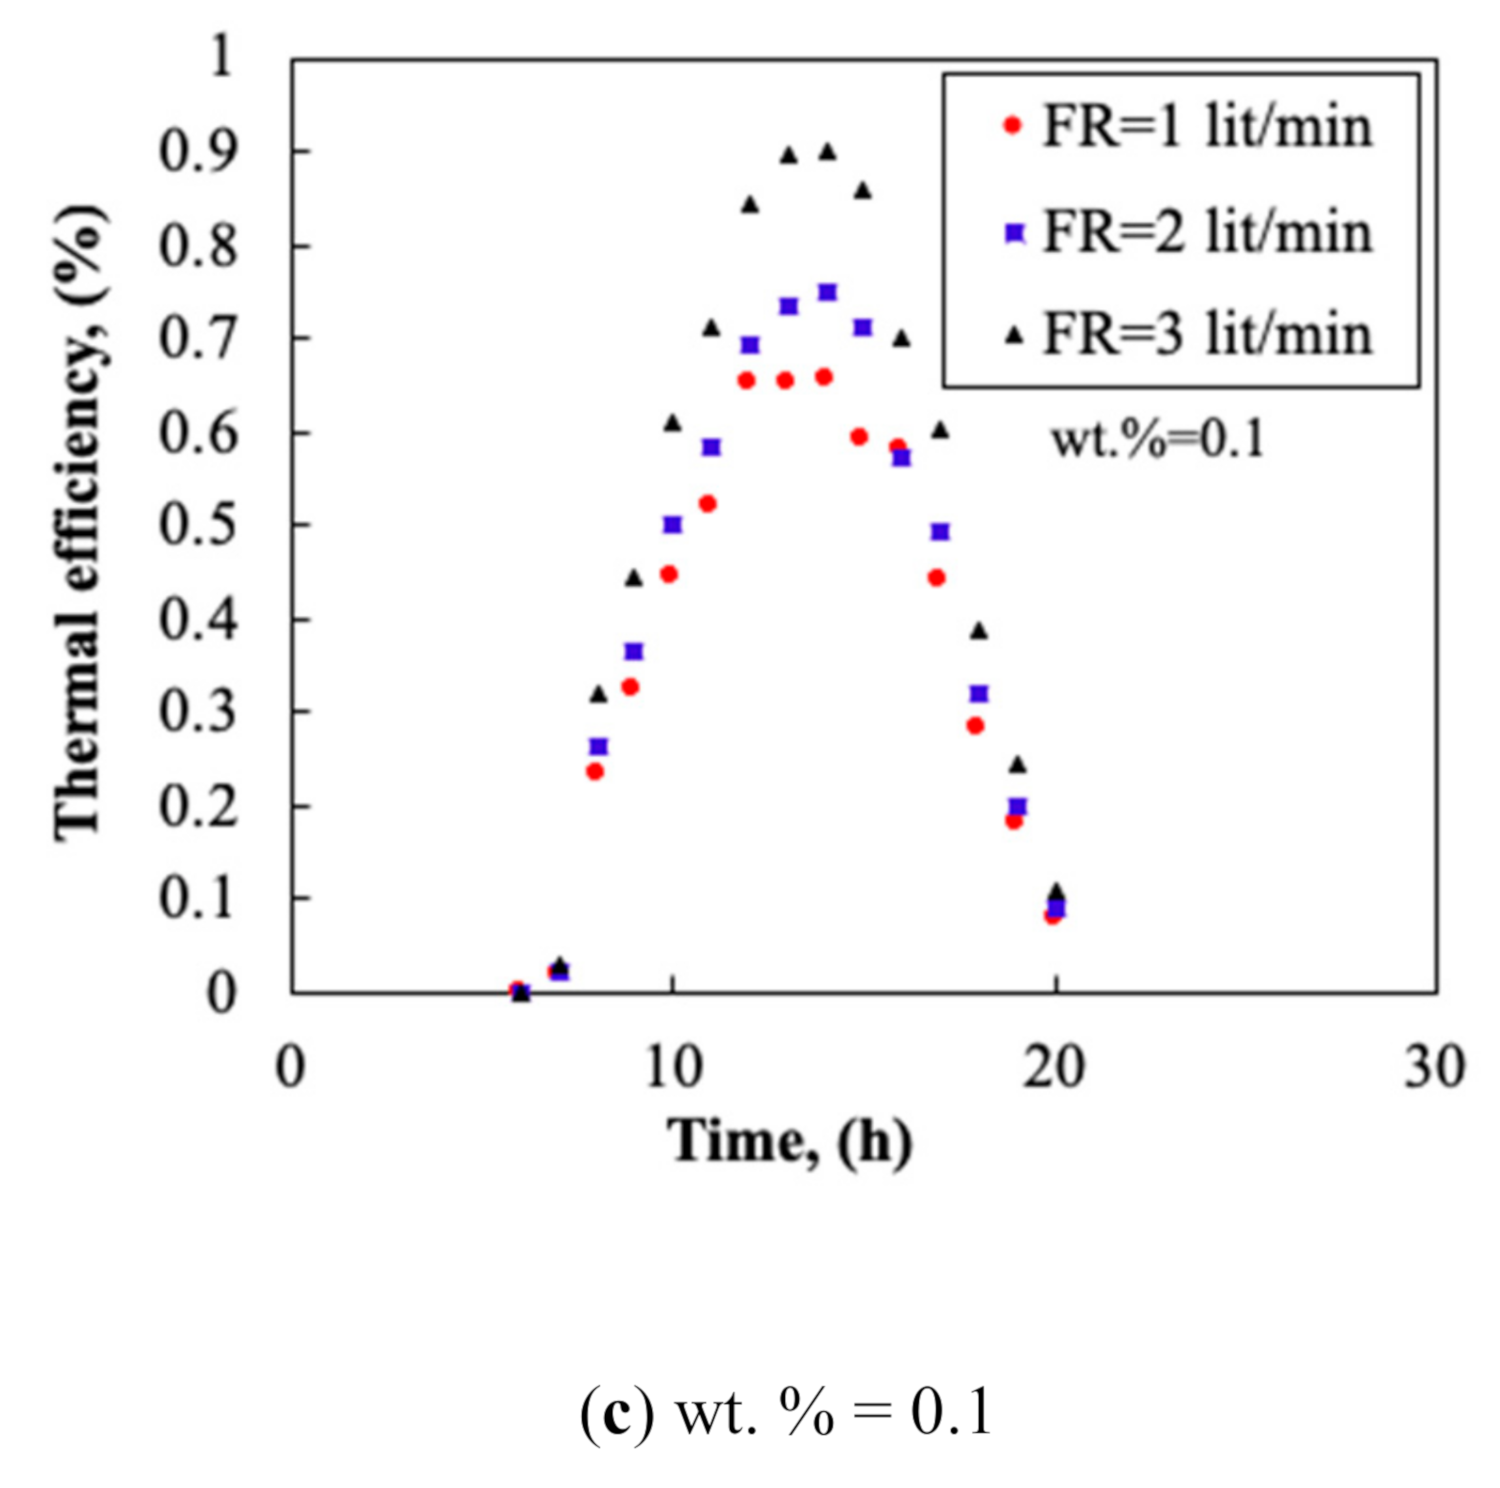
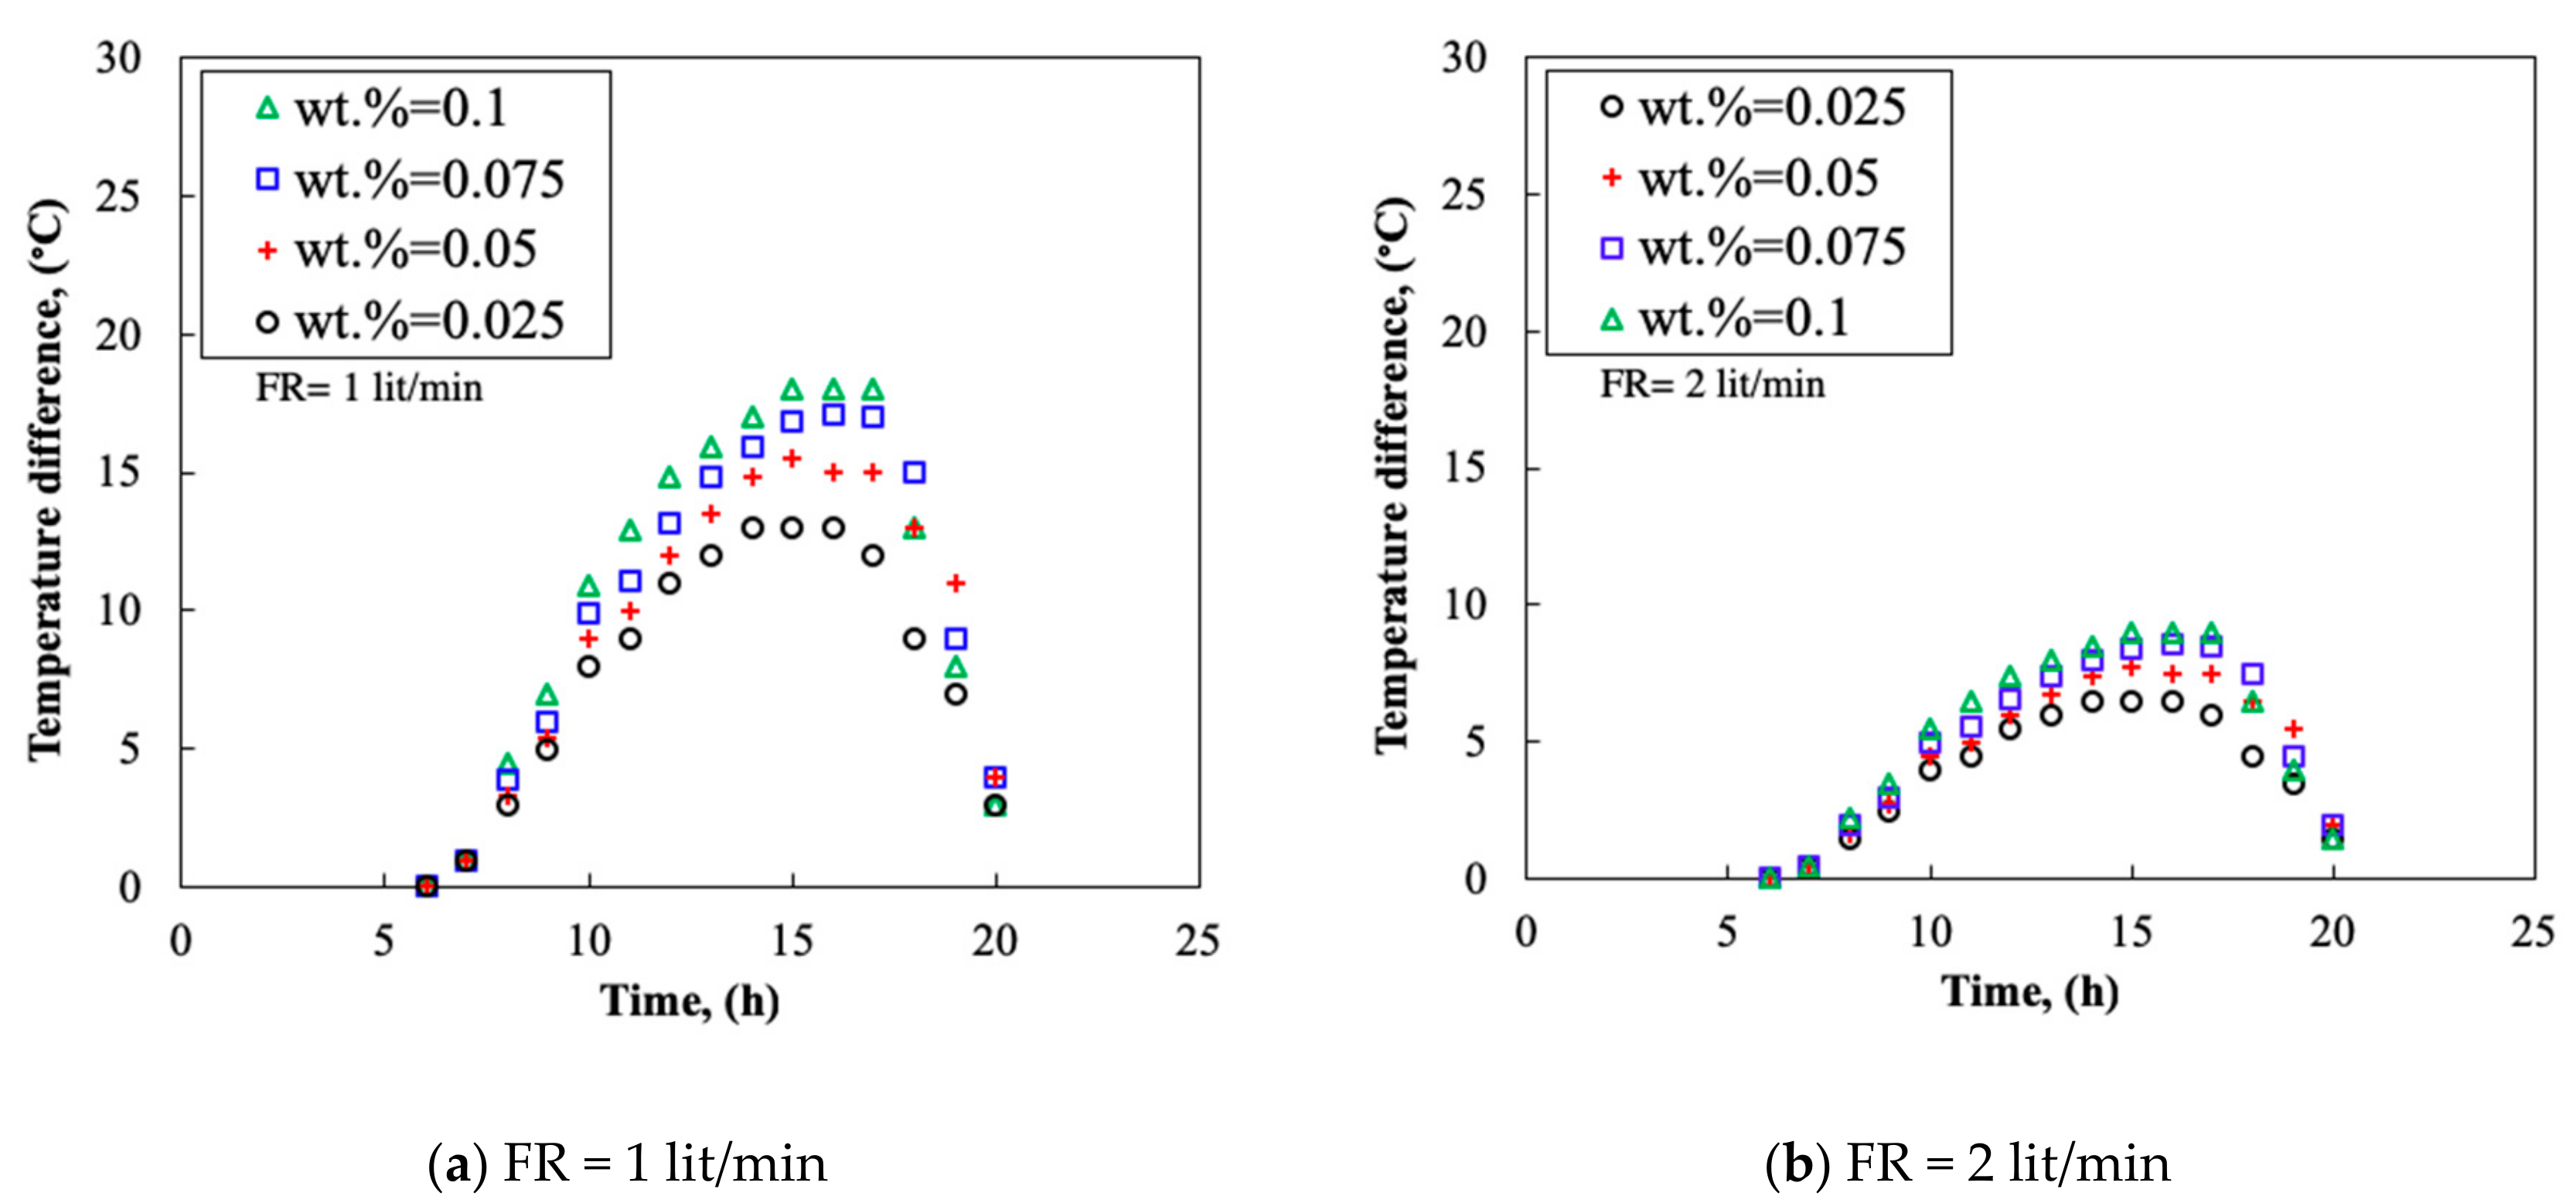
3.3. Collector’s Flow Rate

Figure 13a–c present the variation of the thermal efficiency of the collector with time for pure acetone and nanofluids at various mass concentration of the carbon nanoparticles and for various flow rates. As can be seen from Figure 13a, with the time spanning, the thermal efficiency increases reaching a peak at 1:00 pm (e.g., 0.7 at flow rate of 3 L/min) and decreases to 0.1 at 8:00 pm interestingly, flow rate of the collector prompted the thermal efficiency of the collector. For example, at 10:00 am, for flow rate of 1 L/min, the thermal efficiency of the collector is 0.31, which reaches 0.5 at flow rate of 3 L/min. For nanofluid, the magnitude of the thermal efficiency increases such that the maximum efficiency reaches from 0.7 to 0.91 for pure acetone and nanofluid at wt. % = 0.1 and at flow rate of 3 L/min. This improvement in the efficiency of the collector can be assigned to the enhancement in the thermal properties of the working fluid inside the evacuated tube and due to the Brownian motion of the carbon nanoparticles inside the heat pipes, which further improves the HTC inside the evaporator especially in the evaporator section.

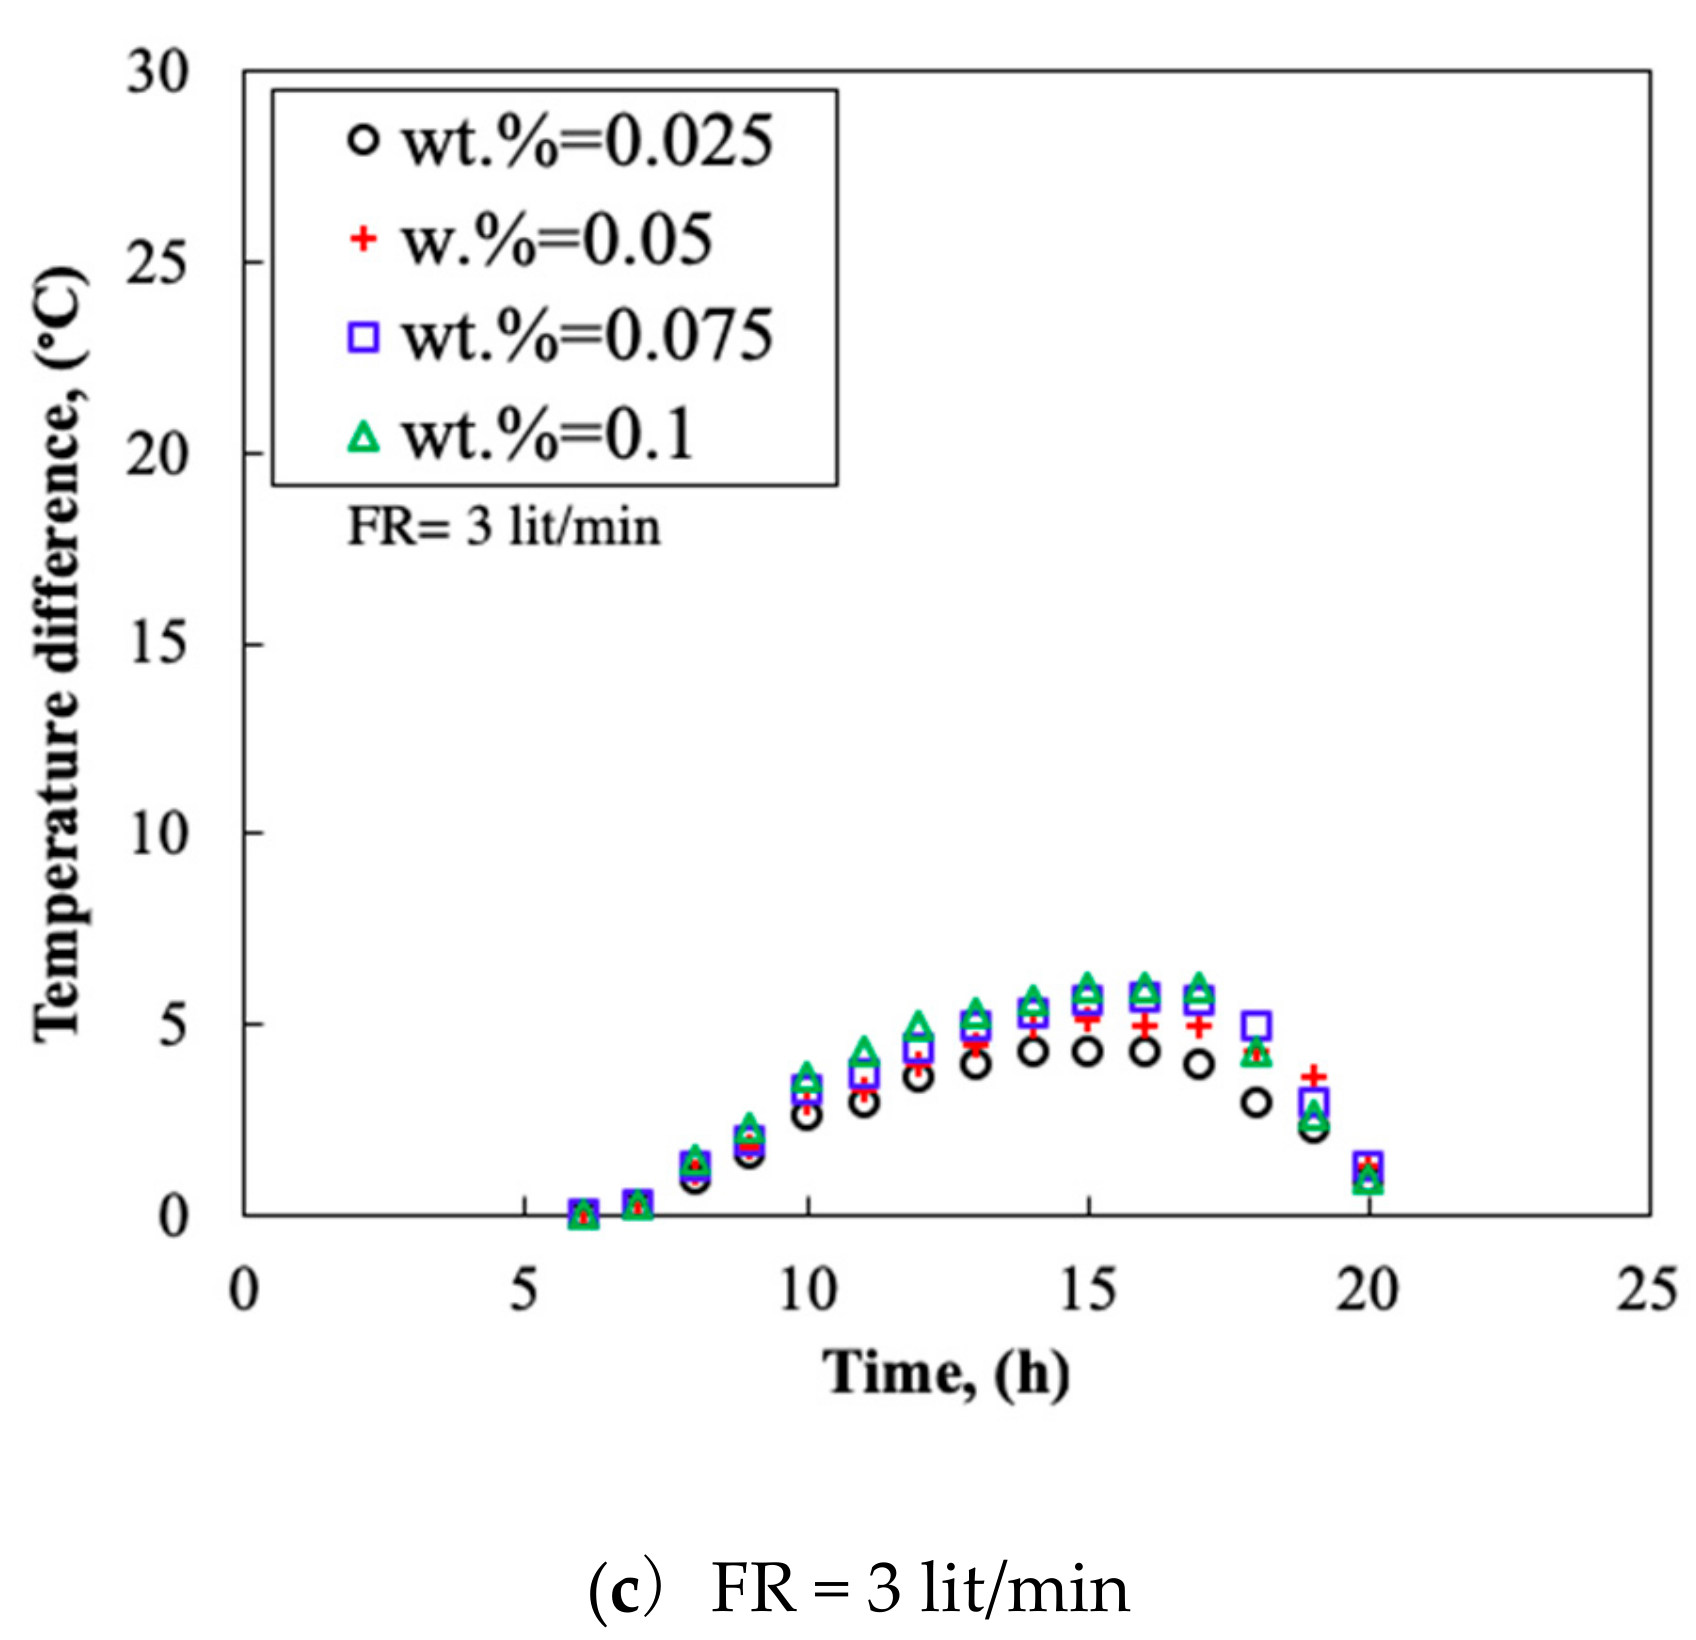
3.4. Temperature Difference

Figure 14 represents the dependence on time of the temperature difference of the thermal collector for different mass concentrations of the nanofluid and at various flow rates. As can be seen from the figure, an increase in the mass fraction of the carbon nanoparticles can potentially improve the TD value, which in turn improves the TP of the system. For example, the maximum value of TD for the collector working at 1.0 L/min is ~18 °C, which was registered for the nanofluid at wt.% = 0.1. However, the maximum TD was 10 °C and 7.8 °C for flow rates of 2.0 and 3.0 L/min. This can be attributed to the reduction in the residence time inside the collector and inside the header tank, which causes smaller TD values.
Apart from the advantages of the carbon nanoparticles for the collector, the deposition of the carbon nanoparticles on the internal walls of the evaporator might technically be challenging to the continuous operation of the system. Hence, the internal wall of the evaporator of the HP was sent for the scanning electron microscopy to evaluate the potential effect of deposition of CNPs on the internal wall of the evaporator section.

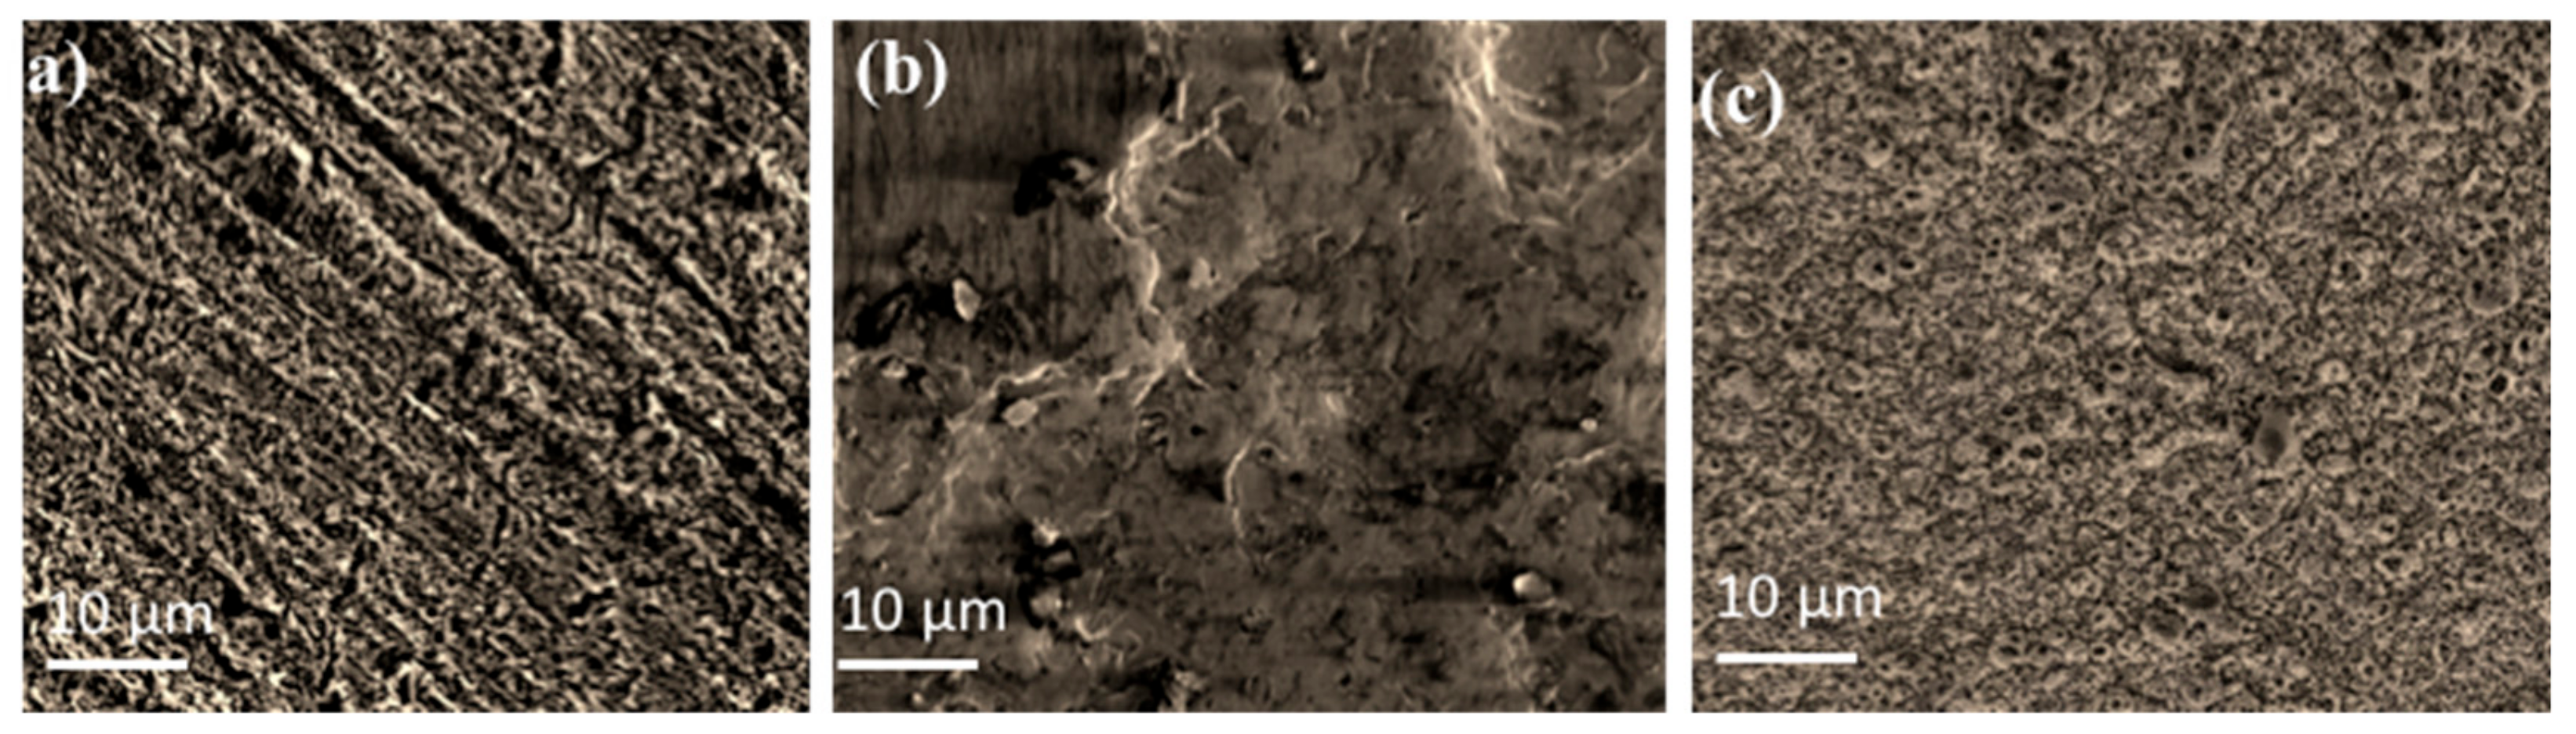
3.5. Evaporator’s Surface

Figure 15 presents the SEM images taken from the internal walls of the evaporator of the HP after continuous working with various nanofluids. As can be seen from Figure 15a, a continual layer of deposition was formed on the surface of the evaporator. This layer increased the roughness and irregularities of the surface, which can potentially be some ideal places for the nucleation, and the growth of the bubbles. Interestingly, in Figure 15b, the roughness of the surface together with its morphology changed, which provided different types of the micro-cavities for the nucleation and bubble formation. However, for both surfaces represented in Figure 15a,b, the irregularities and also the non-uniformity of the surface was relatively higher than that of observed for the clean surface presented in Figure 15c. Therefore, despite the stability of the nanofluid, the deposition layer of the nanoparticles forms inside the evaporator section, which is not necessary, a disadvantage. If the main heat transfer mechanism of the evaporator is the nucleate boiling heat transfer, such deposition layers can intensify the TP by generating more bubbles on the surface. However, further research on the mechanism of the deposition of nanoparticles on the surface is required before this finding can be generalized to all types of nanofluids and experimental cases.

4. Conclusions

In the present study, an experimental study was carried out to evaluate the performance of an ETSC working with carbon-acetone and the following remarks were made:
  • Carbon nanoparticles were stable up to 10 days within acetone and provided a significant change in the thermo-physical properties of the acetone. The thermal conductivity enhancement of the nanofluid improved the heat transfer mechanism in the HP and enhanced the TP of the collector. The maximum thermal efficiency of 91% was achieved which was well above the average thermal performance of the current collectors working with conventional working fluid (e.g., 72.6% for an acetone solar collector).
  • By increasing the mass fraction of the nanofluid, the TP and the TD of the collector increased. The thermal efficiency could reach 0.91 and the maximum TD of 20 °C was obtained at flow rate of 3.0 L/min.
  • The deposition of the nanoparticles on the internal wall of the evaporator created an irregular coating on the surface, which was a suitable medium for the nucleation and the formation of the bubbles. Besides the augmentation in the thermal conductivity of acetone, this irregular surface can intensify the bubble formation and their interaction, which resulted in the improvement of the HTC in the evaporator section.
The tilt angle and the filling ratio value were found to influence the cumulative thermal energy of the collector. Hence, the optimum filling ratio of 60% and the optimum tilt angle of 30° were identified, in which the highest TP can be achieved from the collector.

Author Contributions

Conceptualization, M.M.S, I.T. and M.R.S.; methodology, I.T. and M.M.S.; validation, M.M.S.; formal analysis, M.M.S. and I.T.; investigation, M.M.S., I.T. and M.A.B.; resources, M.M.S., I.T. and M.A.B.; data curation, M.M.S., M.R.S. and M.A.B.; writing—original draft preparation, M.M.S., M.R.S.; writing—review and editing, M.M.S., I.T., M.R.S. and M.A.B.; visualization, M.M.S, M.R.S.; supervision, I.T. and M.M.S.; project administration, M.R.S.

Funding

Mohammad Abdul Baseer would like to thank Deanship of Scientific Research at Majmaah University for supporting this work under the Project Number No. 1440-102.

Acknowledgments

The first author appreciates Rain Sanat CO. and Khurshid Bandar CO. for sharing the thermal collector facility.

Conflicts of Interest

The authors of the present work declare that there is no conflict of interest regarding the paper.

References

  1. Mahendran, M.; Lee, G.; Sharma, K.; Shahrani, A.; Bakar, R. Performance of evacuated tube solar collector using water-based titanium oxide nanofluid. J. Mech. Eng. Sci. 2012, 3, 301–310. [Google Scholar]
  2. Sabiha, M.; Saidur, R.; Hassani, S.; Said, Z.; Mekhilef, S. Energy performance of an evacuated tube solar collector using single walled carbon nanotubes nanofluids. Energy Convers. Manag. 2015, 105, 1377–1388. [Google Scholar] [CrossRef]
  3. Liu, Z.-H.; Hu, R.-L.; Lu, L.; Zhao, F.; Xiao, H.-s. Thermal performance of an open thermosyphon using nanofluid for evacuated tubular high temperature air solar collector. Energy Convers. Manag. 2013, 73, 135–143. [Google Scholar] [CrossRef]
  4. Tsai, C.; Chien, H.; Ding, P.; Chan, B.; Luh, T.; Chen, P. Effect of structural character of gold nanoparticles in nanofluid on heat pipe thermal performance. Mater. Lett. 2004, 58, 1461–1465. [Google Scholar] [CrossRef]
  5. Kang, S.-W.; Wei, W.-C.; Tsai, S.-H.; Yang, S.-Y. Experimental investigation of silver nano-fluid on heat pipe thermal performance. Appl. Therm. Eng. 2006, 26, 2377–2382. [Google Scholar] [CrossRef]
  6. Barber, J.; Brutin, D.; Tadrist, L. A review on boiling heat transfer enhancement with nanofluids. Nanoscale Res. Lett. 2011, 6, 280–296. [Google Scholar] [CrossRef] [PubMed]
  7. Taylor, R.A.; Phelan, P.E. Pool boiling of nanofluids: Comprehensive review of existing data and limited new data. Int. J. Heat Mass Transf. 2009, 52, 5339–5347. [Google Scholar] [CrossRef]
  8. Kwark, S.M.; Kumar, R.; Moreno, G.; Yoo, J.; You, S.M. Pool boiling characteristics of low concentration nanofluids. Int. J. Heat Mass Transf. 2010, 53, 972–981. [Google Scholar] [CrossRef]
  9. Das, S.K.; Choi, S.U.; Patel, H.E. Heat transfer in nanofluids—A review. Heat Transf. Eng. 2006, 27, 3–19. [Google Scholar] [CrossRef]
  10. Verma, S.K.; Tiwari, A.K. Progress of nanofluid application in solar collectors: A review. Energy Convers. Manag. 2015, 100, 324–346. [Google Scholar] [CrossRef]
  11. Xuan, Y.; Roetzel, W. Conceptions for heat transfer correlation of nanofluids. Int. J. Heat Mass Transf. 2000, 43, 3701–3707. [Google Scholar] [CrossRef]
  12. Nakhjavani, M.; Nikkhah, V.; Sarafraz, M.; Shoja, S.; Sarafraz, M. Green synthesis of silver nanoparticles using green tea leaves: Experimental study on the morphological, rheological and antibacterial behaviour. Heat Mass Transf. 2017, 53, 3201–3209. [Google Scholar] [CrossRef]
  13. Nikkhah, V.; Sarafraz, M.; Hormozi, F. Application of spherical copper oxide (ii) water nano-fluid as a potential coolant in a boiling annular heat exchanger. Chem. Biochem. Eng. Q. 2015, 29, 405–415. [Google Scholar] [CrossRef]
  14. Salari, E.; Peyghambarzadeh, S.; Sarafraz, M.; Hormozi, F.; Nikkhah, V. Thermal behavior of aqueous iron oxide nano-fluid as a coolant on a flat disc heater under the pool boiling condition. Heat Mass Transf. 2017, 53, 265–275. [Google Scholar] [CrossRef]
  15. Sarafraz, M. Experimental investigation on pool boiling heat transfer to formic acid, propanol and 2-butanol pure liquids under the atmospheric pressure. J. Appl. Fluid Mech. 2013, 6, 73–79. [Google Scholar]
  16. Sarafraz, M.; Hormozi, F.; Peyghambarzadeh, S.; Vaeli, N. Upward flow boiling to di-water and cuo nanofluids inside the concentric annuli. J. Appl. Fluid Mech. 2015, 8, 651–659. [Google Scholar]
  17. Sarafraz, M.; Nikkhah, V.; Madani, S.; Jafarian, M.; Hormozi, F. Low-frequency vibration for fouling mitigation and intensification of thermal performance of a plate heat exchanger working with cuo/water nanofluid. Appl. Therm. Eng. 2017, 121, 388–399. [Google Scholar] [CrossRef]
  18. Sarafraz, M.; Nikkhah, V.; Nakhjavani, M.; Arya, A. Thermal performance of a heat sink microchannel working with biologically produced silver-water nanofluid: Experimental assessment. Exp. Therm. Fluid Sci. 2018, 91, 509–519. [Google Scholar] [CrossRef]
  19. Sarafraz, M.; Peyghambarzadeh, S.; Alavi Fazel, S.; Vaeli, N. Nucleate pool boiling heat transfer of binary nano mixtures under atmospheric pressure around a smooth horizontal cylinder. Period. Polytech. Chem. Eng. 2013, 57, 71–77. [Google Scholar] [CrossRef]
  20. Sarafraz, M.; Peyghambarzadeh, S. Nucleate pool boiling heat transfer to al2o3-water and tio2-water nanofluids on horizontal smooth tubes with dissimilar homogeneous materials. Chem. Biochem. Eng. Q. 2012, 26, 199–206. [Google Scholar]
  21. Sarafraz, M.; Arjomandi, M. Demonstration of plausible application of gallium nano-suspension in microchannel solar thermal receiver: Experimental assessment of thermo-hydraulic performance of microchannel. Int. Commun. Heat Mass Transf. 2018, 94, 39–46. [Google Scholar] [CrossRef]
  22. Sarafraz, M.; Arjomandi, M. Thermal performance analysis of a microchannel heat sink cooling with copper oxide-indium (cuo/in) nano-suspensions at high-temperatures. Appl. Therm. Eng. 2018, 137, 700–709. [Google Scholar] [CrossRef]
  23. Sarafraz, M.; Arya, H.; Arjomandi, M. Thermal and hydraulic analysis of a rectangular microchannel with gallium-copper oxide nano-suspension. J. Mol. Liq. 2018, 263, 382–389. [Google Scholar] [CrossRef]
  24. Sarafraz, M.; Arya, H.; Saeedi, M.; Ahmadi, D. Flow boiling heat transfer to mgo-therminol 66 heat transfer fluid: Experimental assessment and correlation development. Appl. Therm. Eng. 2018, 138, 552–562. [Google Scholar] [CrossRef]
  25. Sarafraz, M.; Hart, J.; Shrestha, E.; Arya, H.; Arjomandi, M. Experimental thermal energy assessment of a liquid metal eutectic in a microchannel heat exchanger equipped with a (10 hz/50 hz) resonator. Appl. Therm. Eng. 2019, 148, 578–590. [Google Scholar] [CrossRef]
  26. Dehaj, M.S.; Mohiabadi, M.Z. Experimental investigation of heat pipe solar collector using mgo nanofluids. Sol. Energy Mater. Sol. Cells 2019, 191, 91–99. [Google Scholar] [CrossRef]
  27. Ziyadanogullari, N.B.; Yucel, H.; Yildiz, C. Thermal performance enhancement of flat-plate solar collectors by means of three different nanofluids. Therm. Sci. Eng. Prog. 2018, 8, 55–65. [Google Scholar] [CrossRef]
  28. Sharafeldin, M.; Gróf, G. Efficiency of evacuated tube solar collector using wo3/water nanofluid. Renew. Energy 2019, 134, 453–460. [Google Scholar] [CrossRef]
  29. Sharafeldin, M.; Gróf, G. Evacuated tube solar collector performance using ceo 2/water nanofluid. J. Clean. Prod. 2018, 185, 347–356. [Google Scholar] [CrossRef]
  30. Ozsoy, A.; Corumlu, V. Thermal performance of a thermosyphon heat pipe evacuated tube solar collector using silver-water nanofluid for commercial applications. Renew. Energy 2018, 122, 26–34. [Google Scholar] [CrossRef]
  31. Nazari, M.A.; Ghasempour, R.; Ahmadi, M.H.; Heydarian, G.; Shafii, M.B. Experimental investigation of graphene oxide nanofluid on heat transfer enhancement of pulsating heat pipe. Int. Commun. Heat Mass Transf. 2018, 91, 90–94. [Google Scholar] [CrossRef]
  32. Arya, A.; Sarafraz, M.; Shahmiri, S.; Madani, S.; Nikkhah, V.; Nakhjavani, S. Thermal performance analysis of a flat heat pipe working with carbon nanotube-water nanofluid for cooling of a high heat flux heater. Heat Mass Transf. 2018, 54, 985–997. [Google Scholar] [CrossRef]
  33. Vijayakumar, M.; Navaneethakrishnan, P.; Kumaresan, G. Thermal characteristics studies on sintered wick heat pipe using cuo and al2o3 nanofluids. Exp. Therm. Fluid Sci. 2016, 79, 25–35. [Google Scholar] [CrossRef]
  34. Brunauer, S.; Emmett, P.H.; Teller, E. Adsorption of gases in multimolecular layers. J. Am. Chem. Soc. 1938, 60, 309–319. [Google Scholar] [CrossRef]
  35. Gor, G.Y.; Thommes, M.; Cychosz, K.A.; Neimark, A.V. Quenched solid density functional theory method for characterization of mesoporous carbons by nitrogen adsorption. Carbon 2012, 50, 1583–1590. [Google Scholar] [CrossRef]
  36. Sarafraz, M.; Hormozi, F. Experimental study on the thermal performance and efficiency of a copper made thermosyphon heat pipe charged with alumina–glycol based nanofluids. Powder Technol. 2014, 266, 378–387. [Google Scholar] [CrossRef]
  37. Sarafraz, M.; Hormozi, F. Heat transfer, pressure drop and fouling studies of multi-walled carbon nanotube nano-fluids inside a plate heat exchanger. Exp. Therm. Fluid Sci. 2016, 72, 1–11. [Google Scholar] [CrossRef]
  38. Sarafraz, M.; Hormozi, F.; Peyghambarzadeh, S. Role of nanofluid fouling on thermal performance of a thermosyphon: Are nanofluids reliable working fluid? Appl. Therm. Eng. 2015, 82, 212–224. [Google Scholar] [CrossRef]
  39. Sarafraz, M.; Hormozi, F.; Peyghambarzadeh, S. Thermal performance and efficiency of a thermosyphon heat pipe working with a biologically ecofriendly nanofluid. Int. Commun. Heat Mass Transf. 2014, 57, 297–303. [Google Scholar] [CrossRef]
  40. Sarafraz, M.; Safaei, M.R. Diurnal thermal evaluation of an evacuated tube solar collector (ETSC) charged with graphene nanoplatelets-methanol nano-suspension. Renew. Energy 2019. In press, accepted manuscript. [Google Scholar] [CrossRef]
  41. Moffat, R.J. Describing the uncertainties in experimental results. Exp. Therm. Fluid Sci. 1988, 1, 3–17. [Google Scholar] [CrossRef] [Green Version]
Figure 1. Preparation and dispersion of the carbon nanoparticles in acetone in four steps.
Applsci 09 01877 g001
Figure 2. Nitrogen adsorption isotherm obtained for the carbon nanoparticle sample.
Applsci 09 01877 g002
Figure 3. The pore size distributions obtained with quenched solid-state functional theory method for the CNP sample used in the present research.
Applsci 09 01877 g003
Figure 4. Results of particle size test for CNPs.
Applsci 09 01877 g004
Figure 5. Results of XRD test conducted on carbon nanoparticles.
Applsci 09 01877 g005
Figure 6. (a) Scanning electron microscopic image of the CNPs, (b) TEM image of CNPs.
Applsci 09 01877 g006
Figure 7. Variation of the thermal conductivity of the prepared nanofluids on temperature for various mass fractions of CNPs in acetone.
Applsci 09 01877 g007
Figure 8. Dependence of viscosity of nanofluids on temperature for different concentrations of CNPs in acetone.
Applsci 09 01877 g008
Figure 9. Dependence of heat capacity of nanofluids on temperature for various concentrations of CNPs in acetone.
Applsci 09 01877 g009
Figure 10. Schematic diagram of the test facility used in the present study, (a) the structure of the evacuated tube utilized in the solar collector, (b) the test rig [40]. Figure is reprinted with permission from publisher.
Applsci 09 01877 g010aApplsci 09 01877 g010b
Figure 11. Variation of the solar irradiance and hourly ambient temperature with time.
Applsci 09 01877 g011
Figure 12. Dependence of energy absorption by evacuated tube solar collector on tilt angle and filling ratio of the carrying fluid, (a) tilt angle, (b) filing ratio.
Applsci 09 01877 g012
Figure 13. Dependence of thermal efficiency of collector on time for various mass fractions of CNPs in acetone.
Applsci 09 01877 g013aApplsci 09 01877 g013b
Figure 14. Variation of the temperature difference with time for various concentration of CNPs.
Applsci 09 01877 g014aApplsci 09 01877 g014b
Figure 15. SEM images taken from the evaporator after continuous operation with nanofluid, (a) wt. % = 0.025, (b) wt. % = 0.075, (c) clean surface (and also the case of working with acetone had the same roughness shape).
Applsci 09 01877 g015
Table 1. The accuracy and uncertainty value for the apparatuses used in this work.
ParameterInstrumentUncertainty
GPyranometer, EKO±1% of reading value (W/m2)
Temperature Omega k type thermocouple±1 (°C)
Ambient temperatureRTD, PT-100 Omega±0.5 (°C)
Flow rateFLownetix ultrasonic sensor1% of reading value (L/min)
Tilt angleEuropacTM Inclinometer±0.1 (degree)
WeightA&D balancer±1% of reading value (g)
The accuracy and uncertainty value for the apparatuses used in this work.
Table 2. Geometrical details of the evacuated tube and the collector used in the present research.
ParameterValue
Tube’s gross area 1.75 m2
Tube’s aperture area0.77 m2
Total liquid capacity of the tube0.4 lit
Absorbance0.91
Emission parameter0.04
Collector’s dimension (L × H × W)2 × 0.15 × 0.9 m

