Case Report

Modeling of the Accidentality Phenomenon in the Construction Industry

Department of Construction Technology and Management, Faculty of Civil Engineering, Wroclaw University of Science and Technology, 50-370 Wrocław, Poland
*
Author to whom correspondence should be addressed.
Appl. Sci. 2019, 9(9), 1878; https://doi.org/10.3390/app9091878
Submission received: 1 March 2019 / Revised: 18 April 2019 / Accepted: 6 May 2019 / Published: 7 May 2019
(This article belongs to the Section Environmental Sciences)

Abstract

:
The aim of the conducted research was to develop a methodology of investigating the accidentality phenomenon in the construction industry, which is considered as a process that is created by a sequence of accidents occurring at discrete periods of time and at various construction sites in terms of their location, construction, and technical equipment. In order to investigate the circumstances of accidents, a methodology developed by the European Statistical Office of the European Union (ESAW) was used during the research. The basic elements of the proposed methodology is the IT database (computer knowledge database (CKD)), which includes information about the circumstances and causes of accidents and also constitutes a repository for the collected data, as well as a graphic and IT model of the accident process in the form of a directed graph. In order to detect the characteristic features of the accidentality phenomenon in the construction industry, a simulation of a sequence that consists of 485 occupational accidents that occurred in 2008–2016 in five Polish voivodeships was carried out. The conducted research and analysis allowed the most common accident scenarios that occur in the construction industry to be identified, as well as the probability of their occurrence and the critical path in the graph that indicates the most accident-causing activities to be determined. The proposed model is important for construction practice. Based on a large set of data on accidents included in the CKD, it is possible to study the impact of the following on the accidentality phenomenon: Technologies used in the construction industry, the types of carried out construction works, and the methods used to organize work and equipment.

1. Introduction

Accidentality is a phenomenon that describes employees being affected by occupational accidents. This phenomenon can be assessed as the sum of accidents occurring at a given time, usually during a year, presented with the use of various factors, e.g., the occupational accident frequency rate, the accident severity index, or the standardized accident index [1,2]. The accident rate is an undesirable and negative phenomenon, and therefore every reduction of it brings benefits in the form of:
  • A decreasing number of people that are injured in occupational accidents,
  • Lower material losses related to, among others, the suspension of production, the necessity of replacing an injured employee with another employee, the repair or replacement of damaged equipment, and sometimes the rebuilding of an entire destroyed workstation,
  • Lower social losses related to costs that are incurred by society, such as the costs of treatment or the costs of compensations paid by insurance companies [3].
The construction industry is one of the most accident-susceptible sectors of the national economy and is characterized by a high rate of accidentality. This is confirmed by the data contained in numerous publications [4,5,6]. In order to increase the level of occupational safety in the construction industry, a detailed analysis of the accidentality phenomenon should be conducted, the circumstances and main causes for the occurrence of this phenomenon should be identified, and intensive and continuous preventive actions should also be carried out.
The main purpose of the research presented in the article is to examine the characteristic features of the accidentality phenomenon as a process that creates a sequence of accidents that occur at discrete moments of time on various construction sites in terms of their location, construction, and technical equipment. The subject of the research concerned circumstances related to an accident. For this purpose, a model of the development of an accident situation in the construction industry was developed. It enables the phenomenon of accidentality and the IT database (computer knowledge database) on occupational accidents to be investigated. Tests were carried out on the model for the selected set of accidents. The circumstances in which accidents and accident scenarios most frequently occur were then identified, and on this basis, scientific and prophylactic conclusions were formulated.
The studies involved elements of graph theory, mathematical statistics, as well as the method of experts concerning decision making and IT programming.

2. Literature Review

High accidentality in the construction industry is noticeable in many countries around the world. This is confirmed by numerous publications and reports of organizations and offices that deal with issues related to occupational safety [7,8,9,10]. In order to reduce unfavorable trends in occupational safety, scientists from around the world analyze the accidentality phenomenon, while at the same time look for causes and mechanisms of the occurrence of occupational accidents [11,12,13,14]. The construction industry is characterized by a high variability of work implementation conditions that result from the number of used technologies, types of executed building structures, carried out construction works, continuous changes in the location of works, and also the possibility of using different solutions in the field of applied organization methods and construction machines. Therefore, accidents that happen in the construction industry are generated in various circumstances and proceed according to different scenarios.
Research carried out in many countries has shown, among other things, that the most common events that cause accidents to employees were falls from height, and also being hit by a moving or falling object [15,16]. The most common result of falls from height is the death of an employee or severe injury [17,18]. The authors analyzed accidents in which falling factors were a source of hazard. The most numerous groups of material factors were beams and columns, large mechanical equipment, and pipes. The most dangerous operation was the lifting of a material factor.
In turn, on the basis of the analysis of accidents that took place in Great Britain, Denmark, and the Netherlands [19], it was found that in the construction industry, an event that causes an injury to an employee was most often: Contact of a victim with the moving and rotating parts of a machine, the falling of a victim from height, the falling of a victim from a ladder, being hit by a falling object, collision of a victim with a moving object, or the falling of a victim from scaffolding.
Understanding the mechanisms of occupational accidents is the first step in the process of preventing accidents and improving workplace safety. For this purpose, detailed analyses of the circumstances and causes of occupational accidents are carried out, which form the basis for the construction of various models. The aim of research conducted on models is to identify long-lasting and significant features of the accidentality phenomenon. This knowledge enables preventive activities and trainings in the field of occupational safety to be properly targeted towards the improvement of working conditions, as well as labor law regulations to be formulated or modified.
Many different models of occupational accidents, which were proposed by subsequent researchers, can be found in the subject literature. The following groups of models can be distinguished: General models of the accident process (including, among others, sequential models, energy transfer models, or systemic models), human error and dangerous behavior models, and also models that present the mechanisms of the occurrence of human injury [20].
Heinrich, the American pioneer in the field of occupational safety, is considered to be the creator of the first model of an accident. In the domino model proposed by Heinrich [21], an accident is a sequence of five factors: the working environment, the human being, the hazard, the accident and the injury [12]. Researchers, such as Bird [22] and Benner [23], based on the Heinrich model, later made changes and modifications to it.
The models proposed by subsequent researchers are based on various assumptions regarding the accident process. For example, in energy transfer models, it is assumed that in order for an occupational accident to occur, a person must be exposed to energy that can occur in a workplace in a variety of forms. Energy is anything that can cause human injury or damage to an object or machine [24]. The first energy transfer model was developed by Haddon [25]. In turn, the aim of research conducted by Chua et al. [26] was to identify all possible types of energy that could lead to an accident, as well as to analyze barriers used and their failure.
There have also been many models developed in which the subject is a human being, who is seen as the perpetrator of an accident. During the construction of these models, the attention of researchers was focused on risky behavior and human errors, which are considered to be the causes of accidents. Rasmussen, in his proposed model, concentrated on the mechanisms of human behavior in real and dynamic working conditions, rather than only on the errors made by employees during tasks and activities [15]. Hinze proposed the theory of distraction for the analysis of human behavior [26].
This theory assumes that the probability of the occurrence of an accident increases as a result of an employee’s inattention while performing activities at a workstation. This inattention is caused by mechanical hazards and excessive mental strain, such as stress [27]. Another example of a model that takes into account the human factor is the accident model proposed by Reason [28]. This model assumes that in order for an accident to occur, a single human, organizational, or technical error is not sufficient. An accident occurs as a result of overlapping hidden and dangerous conditions at different levels of making decisions and carrying out activities. The model identifies three types of errors that lead to a dangerous event, namely errors in the assessment of a situation, errors in choosing the right action, and errors in the performance of activities.
The course of an accident cannot only be represented by a single cause–effect chain of events, but also by using multi-line and branched chains of events, e.g., by means of models with the construction of an event tree, cause tree, or fault tree. The construction of the event tree allows the accident process to be presented as a sequence of events, starting from the event that initiates the accident process, running through successive branches of the chains, and finishing with the set of final events [29]. Mistikoglu et al. effectively used the fault tree method and the data mining technique for multidimensional analysis of the course of the accident process [30].
In order to explain the links between the course of an accident and its causes, process models were developed. A typical example of a process model is the OARU (occupational accident research unit) model developed by Kjellen and Larsson [31,32]. In this model, the accident process is divided into three phases: The initial phase, the concluding phase, and the injury phase. There are four transitional states between the phases: The transition from normal conditions to the state of deficiencies in the situation of control, the transition from the lack of control to the loss of control, the transition at which the human body begins to absorb energy, and the state of completing the process of energy absorption.
The ORM model (occupational risk model) is also a process model [19]. This model is a part of the occupational risk assessment methodology, which includes, among others, the identification of operations performed by an employee at a workstation, the selection and identification of potential barriers that protect against an accident, the analysis of descriptions of the course of an accident, the construction of the dependence network, and also the construction of sets of barriers that are called strategies. The process of building the ORM model is cyclical. It starts with the selected accident event, which is treated as a central event in the model and an event that causes an injury. Afterwards, elements in the close vicinity of the accident are assessed, namely hazard analysis, and also identification of the causes and circumstances of the accident. Further accidents are then analyzed and in this way, a network of dependencies is created.
In turn, the basis for the building of the ARCTM model (accident root causes tracing model) were theories of accident causation and theories of human error. Based on the research carried out on the model, three causes of accidents were identified, namely failing to identify an unsafe condition that existed before an activity was started or that developed after an activity was started, deciding to proceed with a work activity after the worker identifies an existing unsafe condition, and deciding to act in an unsafe manner regardless of the initial conditions of the work environment [33].
The subject of the research presented in this article is the modeling of the accidentality phenomenon in the construction industry, which is created from a sequence of accidents that occur at discrete moments of time on various construction sites in terms of their location and applied technical and organizational solutions. Individual accidents occur in different circumstances and follow individual scenarios.
The approach, which takes into account the processional nature of the accidentality phenomenon, the variety of conditions for the construction of building objects, and also their structural characteristics, will enable a series of information about the studied phenomenon to be obtained that would not have been received on the basis of an analysis of individual accidents and available statistical data. Such information may include, e.g., the probability of the occurrence of a specific accident scenario or the probability of the occurrence of specific relations between successive elements specified in the model.

3. Assumptions for the Creation of the Model

The construction of the model was based on the methodology of collecting statistical data on occupational accidents in European Union countries (ESAW), which was developed by the Statistical Office of the European Union (EUROSTAT) [2]. The developed methodology defines a uniform method of obtaining and coding statistical data.
The following assumptions were made for the building of the model:
1.
Occupational accidents in the construction industry occur in different places and at different times, and each accident follows a specific individual scenario.
2.
Accidents ordered in accordance with the passage of time t z form an infinite sequence, which can be analyzed as the discrete resultant process presented in Figure 1, where:
  • W —a set of all identified accident scenarios,
  • w l —a single accident event that follows a specific individual scenario. The following accident scenarios are identified by an index l placed next to a small letter w ,
  • L —a set of all occupational accidents, where: l = 1 , 2 , , L .
3.
Every occupational accident can be presented in the form of the sequence of successive events that illustrate the circumstances of an accident and its course, which is shown in Figure 2. In this sequence, the following event is a consequence of the occurrence of the preceding event.
The following events were distinguished in this sequence:
A —the place where the accident occurred (working environment),
B the work process during which the accident occurred,
C the action performed by the victim at the time of the accident,
D the material agent related to the activity performed by the victim at the time of the accident,
E the event that is a deviation from the normal state,
F the material agent associated with the deviation from the normal state,
G the event causing the injury,
H the material agent that is the source of the injury associated with the event that causes the injury,
U the type of injury,
R the severity of injury.
Events E and G are real events, while the remaining events have the character of apparent events and describe the circumstances and consequences of accidents.
4.
Every single accident takes place through a specific intermediate event, from node A to node U , and is accompanied by specific circumstances that lead to the occurrence of the final event, which is a result of an accident R with different degrees of severity, e.g., death, severe body injuries, light accident.
5.
Each node in the model shown in Figure 2, depending on the location of work, activities, machines, and used devices, can have many different meanings. This is due to the fact that the construction industry is characterized by large diversity and a high variability of implementation conditions. Individual detailed cases concerning different situations and circumstances are identified by an index placed next to a small letter that denotes a node. The numbers that are used to describe the indexes are identical to the indexes proposed by the Central Statistical Office of the European Union and those used in statistical accident cards [2,34]. From the set of all the detailed cases proposed by ESAW, cases that are definitely not found in the construction industry were eliminated. For this purpose, a method of experts was used. The experts were inspectors from the National Labor Inspectorate who examine occupational accidents in the Polish construction industry. Table 1 presents the main groups of nodes in the model, which is shown in Figure 2, as well as their individual components.

4. A Model of a Complex Accident Process in the Construction Industry

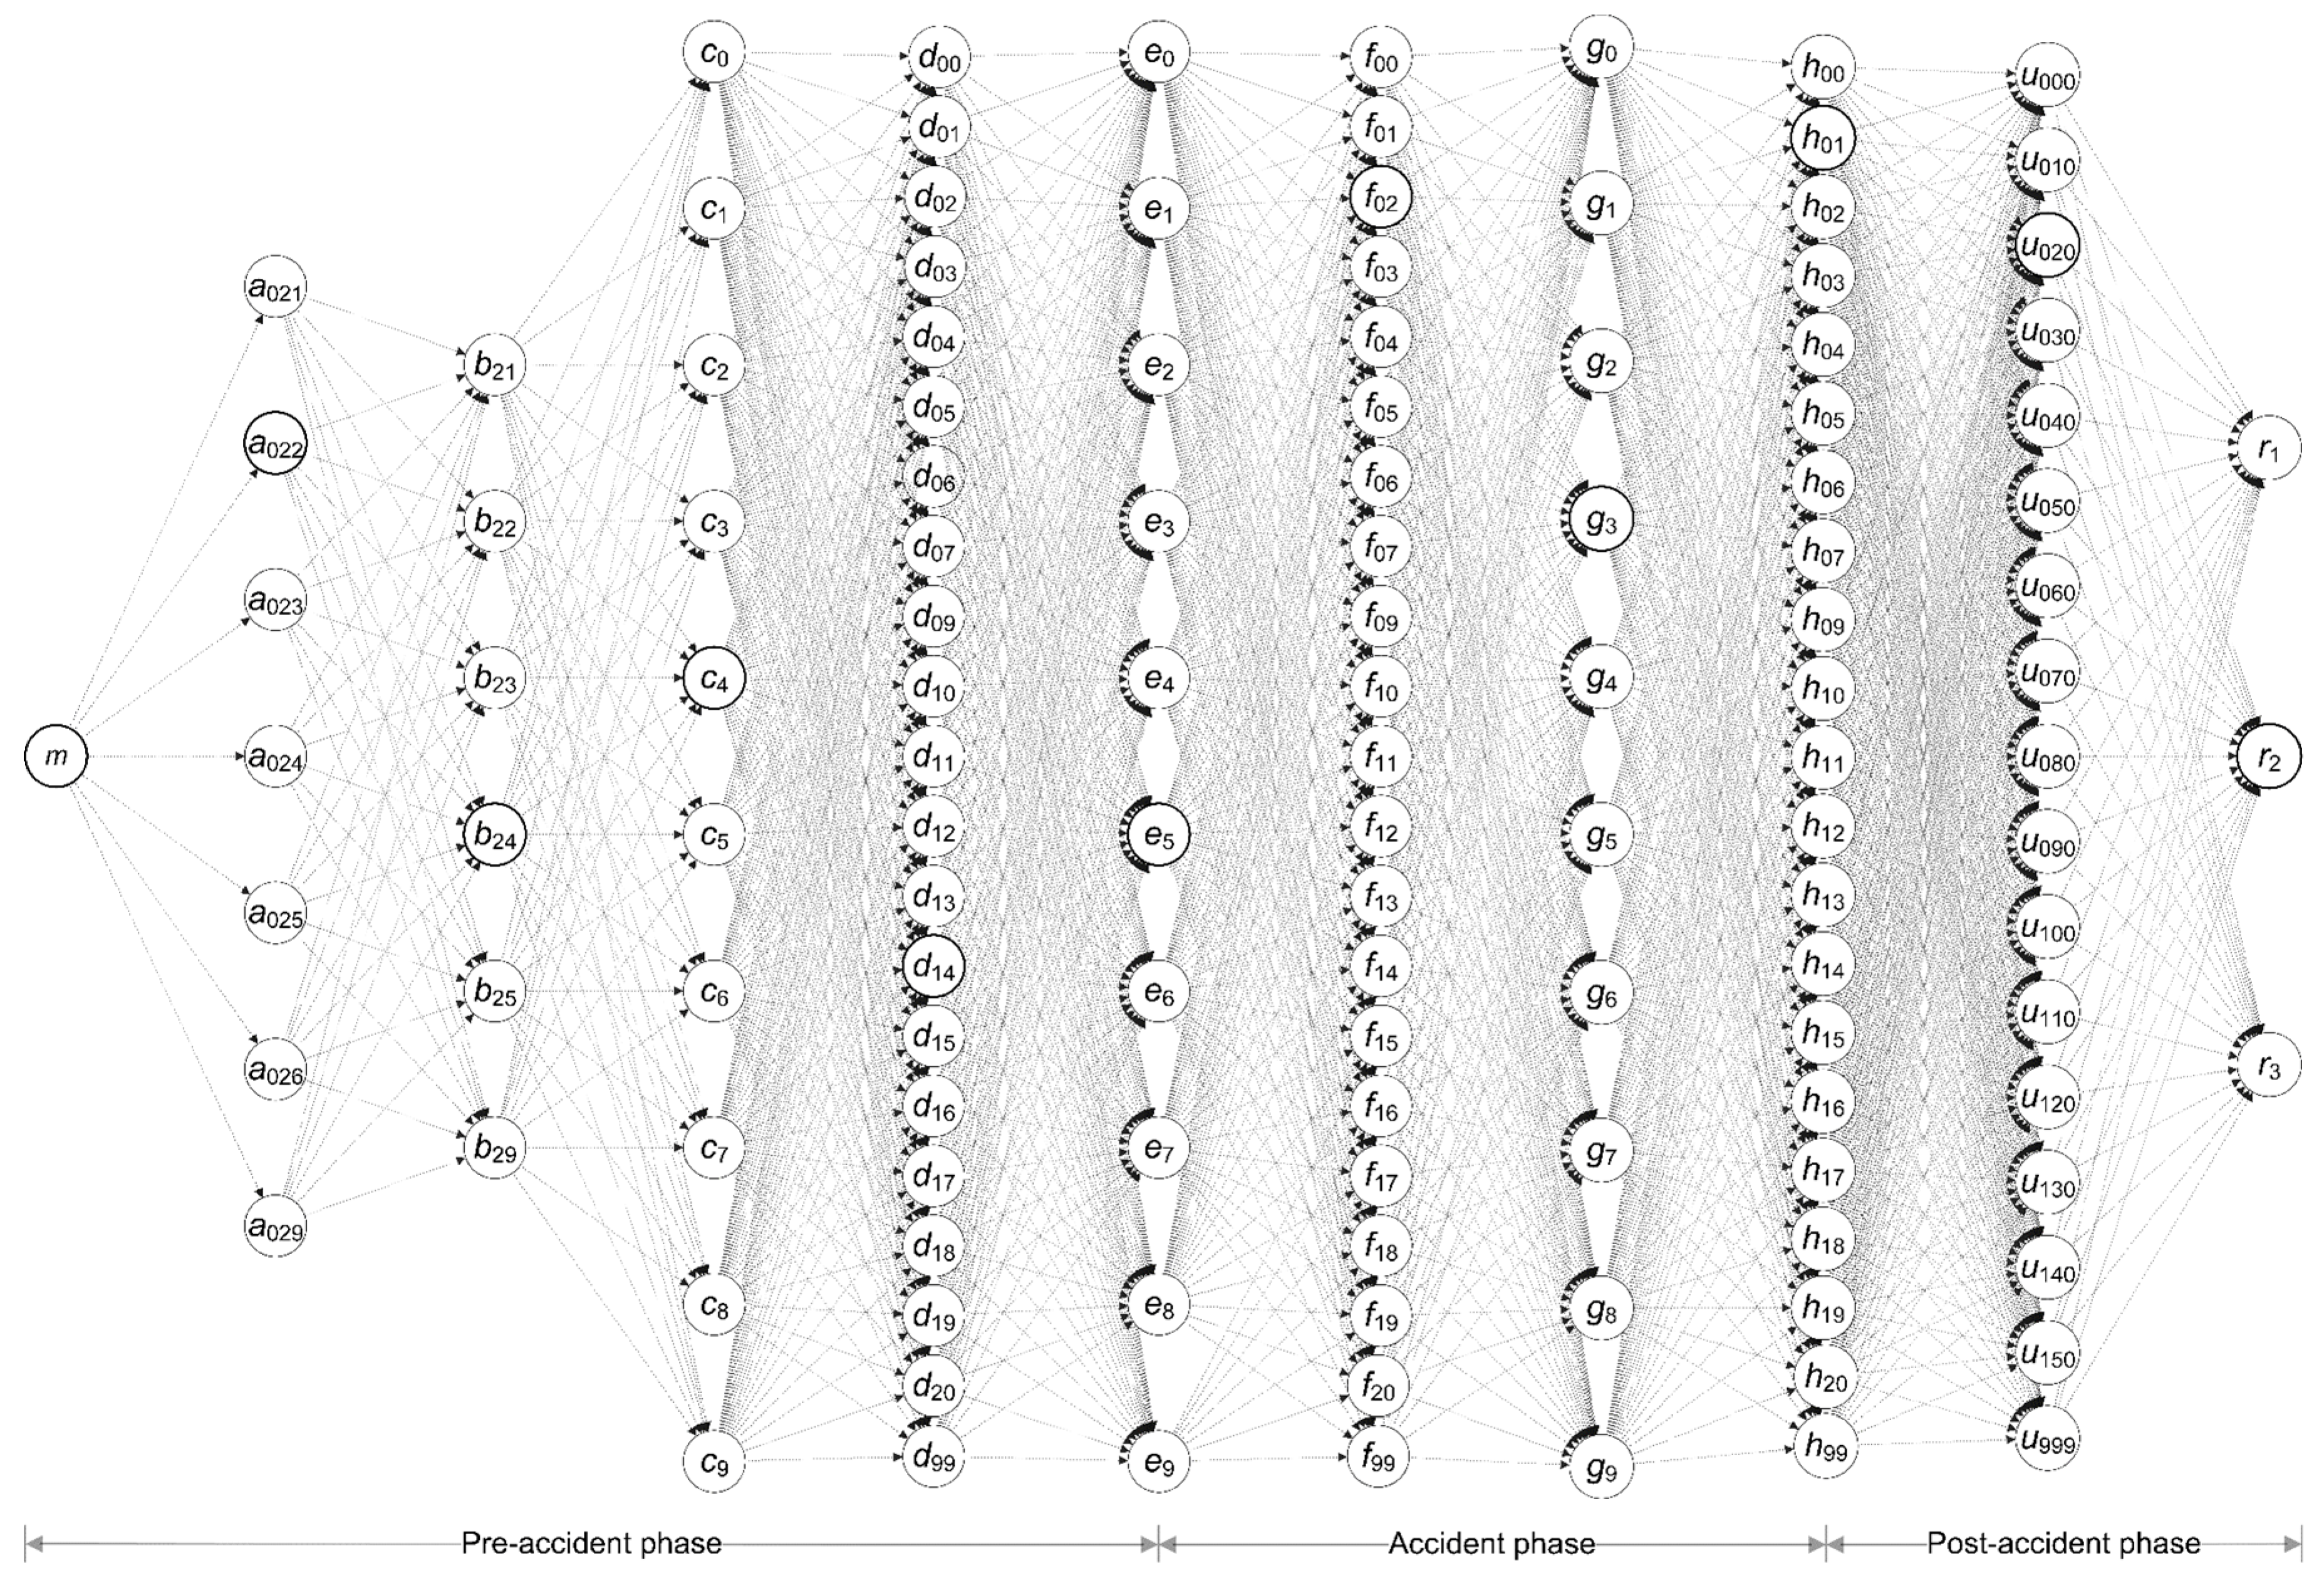
Taking into account the assumptions described in Section 3, a model of a complex accident process was developed in the form of a Y -directed graph, which takes into account the detailed cases listed in Table 1. Due to the fact that each accident occurs on different building sites in terms of their location, in order to avoid several independent entries to the model in nodes a 021 to a 029 , an additional node was introduced— m —an apparent event that illustrates a common hypothetical source of generating accidents. The developed model is shown in Figure 3.
The directed graph ( Y ) was defined as an ordered pair of sets N and K :
Y = N , K ,
where:
N —any non-empty set of nodes,
K —a set of possible ordered pairs of neighboring N nodes called directed edges or arcs.
Relations between individual nodes were presented using arcs (directed edges). Graph arcs connect individual nodes in neighboring subsets of nodes on a peer-to-peer basis and result from the possible theoretical consequence of subsequent events.
The set N consists of 11 subsets that include events qualified for individual groups: M , A , B , C , D , E , F , G H , U , and R , each of which contain selected detail information about the course of an accident.
N = M   A   B   C   D   E   F   G   H   U   R N = m   a i   b j   c k   d n   e o   f p   g q   h s   u v   r x
The set K of ordered pairs of neighboring N events (nodes) can be written as follows:
K = { ( M , A ) , ( A , B ) , ( B , C ) , ( C , D ) , ( D , E ) , ( E , F ) , ( F , G ) , ( G , H ) , ( H , U ) , ( U , R ) } K = { ( m , a i ) ( a i , b j ) , ( b j , c k ) , ( c k , d n ) , ( d n , e o ) , ( e o , f p ) , ( f p , g q ) , ( g q , h s ) , ( h s , u v ) , ( u v , r x ) } .
In order to detect the characteristic features of the accident phenomenon, a simulation of a chain that consists of 485 occupational accidents in the construction industry was carried out. The aim of the research was to identify the most common accident scenarios and to determine the probability of their occurrence. For this purpose, the following actions were carried out:
  • quantitative analysis of the node activation in the graph,
  • analysis of the relations between neighboring nodes in the graph.

4.1. Quantitative Analysis of the Node Activation in the Graph

The detailed course of each accident is described by the selected attributes contained in Table 1. Each of the sets from M to R can be written in vector form, e.g., B = [ b 21   b 22   b 23   b 24   b 25   b 29   ] . The occurrence or absence of a specific attribute in the course of an accident was coded with a zero–one system. The value 1 means that the defined attribute is present, while the value 0 means that the defined attribute does not exist, e.g., vector B = [ 0   1   0   0   0   0   ] , where b 22 = 1 , which means that the accident happened during the construction of a new building.
Information about the attributes of all appropriate nodes for the analyzed accident can be written in the form of a two-dimensional table W L = [ w ] L N L K , with the number of columns L K equal to the number of main nodes in the model, and the number of rows L N equal to the maximum number of possible cases in the most numerous group in terms of nodes. By putting 0 or 1 into the matrix, a zero–one matrix that characterizes all nodes that occur in a single accident w i will be obtained. The course of each subsequent accident w i can be described by another table, which has identical dimensions as the previous one. Collective information about the activation of individual nodes in a complex accident process that consists of L consecutive accidents is obtained by adding additional matrixes.
W L = [ w 1 ] + + [ w i ] + + [ w L ]

4.2. Analysis of the Relations Between Neighboring Nodes

Neighboring nodes, which represent events defined in the accident process, are connected by specific relations (arcs). The number of activations of individual connections illustrates how often a specific connection was active in the process that simulates the course of the analyzed accident sequence. The connection activity between neighboring nodes can also be encoded with a zero–one system. A value of 1 means that in an individual accident, a particular relationship was active, e.g., the relation matrix for nodes A and B for an exemplary accident can be described as follows:
K a i , b j = | a 021 b 21 a 022 b 21 a 023 b 21 a 024 b 21 a 025 b 21 a 026 b 21 a 029 b 21 a 021 b 22 a 022 b 22 a 023 b 22 a 024 b 22 a 025 b 22 a 026 b 22 a 029 b 22 a 021 b 23 a 022 b 23 a 023 b 23 a 024 b 23 a 025 b 23 a 026 b 23 a 029 b 23 a 021 b 24 a 022 b 24 a 023 b 24 a 024 b 24 a 025 b 24 a 026 b 24 a 029 b 24 a 021 b 25 a 022 b 25 a 023 b 25 a 024 b 25 a 025 b 25 a 026 b 25 a 029 b 25 a 021 b 29 a 022 b 29 a 023 b 29 a 024 b 29 a 025 b 29 a 026 b 29 a 029 b 29 | = | 0 0 0 0 0 0 0 0 0 0 0 0 0 0 0 0 0 0 0 0 0 0 1 0 0 0 0 0 0 0 0 0 0 0 0 0 0 0 0 0 0 0 |
where a 022 b 24 = 1 , which means that the accident happened on the area of a dismantled, demolished, or renovated building object ( a 022 ) during rebuilding, repair, extension, or maintenance of the building object ( b 24 ). Collective information on the activation of individual relationships in a complex accident process that consists of L consecutive accidents is obtained by adding further matrixes.
K L ( a i , b j ) = [ K w 1 ] + + [ K w l ] + + [ K w L ]

4.3. The Probability of the Occurrence of Accident Scenarios

Knowledge concerning the number of activations of individual nodes and the relations between nodes is the basis for conducting various analyses, including the determination of the probability of occurrence of individual relations and accident scenarios, as well as the determination of the critical path.
The probability of the occurrence of individual relations can be calculated based on the following formula [35]:
P ( φ ψ ) = N ( φ ψ ) M · 100 %
where:
P ( φ ψ ) —the probability of the occurrence of relationship φ ψ ,
N ( φ ψ ) —the number of φ ψ relationship activations,
M —the set of all analyzed accidents,
φ —the symbol and code of the preceding node in the relation,
ψ —the symbol and code of the following node in the relation.
In the proposed model, each accident scenario describes a different path leading from node M to node R . The probability of the occurrence of scenario P ( K ) can be represented by a formula for the probability of conditional events of dependent events [36]:
P ( K ) = P ( M A B C D E F G H U R ) = = = P ( A | M ) P ( B | M A ) P ( C | M A B ) P ( D | M A B C ) P ( E | M A B C D ) P ( F | M A B C D E ) P ( G | M A B C D E F ) P ( G | M A B C D E F G ) P ( U | M A B C D E F G H ) P ( R | M A B C D E F G H U )
The probability value that was obtained from the above formula for different paths leading from node M to node R enables the most probable accident scenarios in the construction industry to be identified.
The path with the highest probability creates the so-called critical path in the set of analyzed accidents. The critical path is formed by the sequence of relationships with the largest number of activations.
Within the framework of conducted research, a computer system was created, the basic elements of which are the informatics database on occupational accidents (the computer knowledge database (CKD)), a computational module that enables statistical quantities resulting from the set of accidents contained in the CKD to be calculated, and also a module of graphics that is required in order to construct a graph model for each accident selected from the CKD subset of accidents. The scope of data on accidents collected in the CKD includes general data concerning the accident, data on the injured person, information on the course of the accident and its consequences, and also the cause of the accident [37].

5. Case Study

The analysis covered 485 occupational accidents, which occurred in 2008–2016 in five Polish voivodeships: Kujawsko-Pomorskie, Śląskie, Lubelskie, Lubuskie, and Dolnośląskie. Data on occupational accidents were obtained from the archival collections of the National Labor Inspectorate, which is the basic body for the supervision and control of complying with labor law in Poland. In accordance with applicable regulations, the National Labor Inspectorate’s authorities have an obligation to investigate the circumstances and causes of accidents. After the post-accident investigation, the labor inspector draws up the control protocol that contains a description of the course of the event, including its circumstances and causes, and also conclusions from the investigation.
The authors, after a thorough analysis of accident documentation while taking into account detailed cases listed in Table 1, determined the course of each accident, and introduced coded data into the CKD. From the moment of activating the model from the CKD, information about all the accidents, or selected ones, is collected and their course is simulated in the graph presented in Figure 3. Statistical characteristics of the analyzed accident process are calculated in accordance with the methodology included in Section 4.
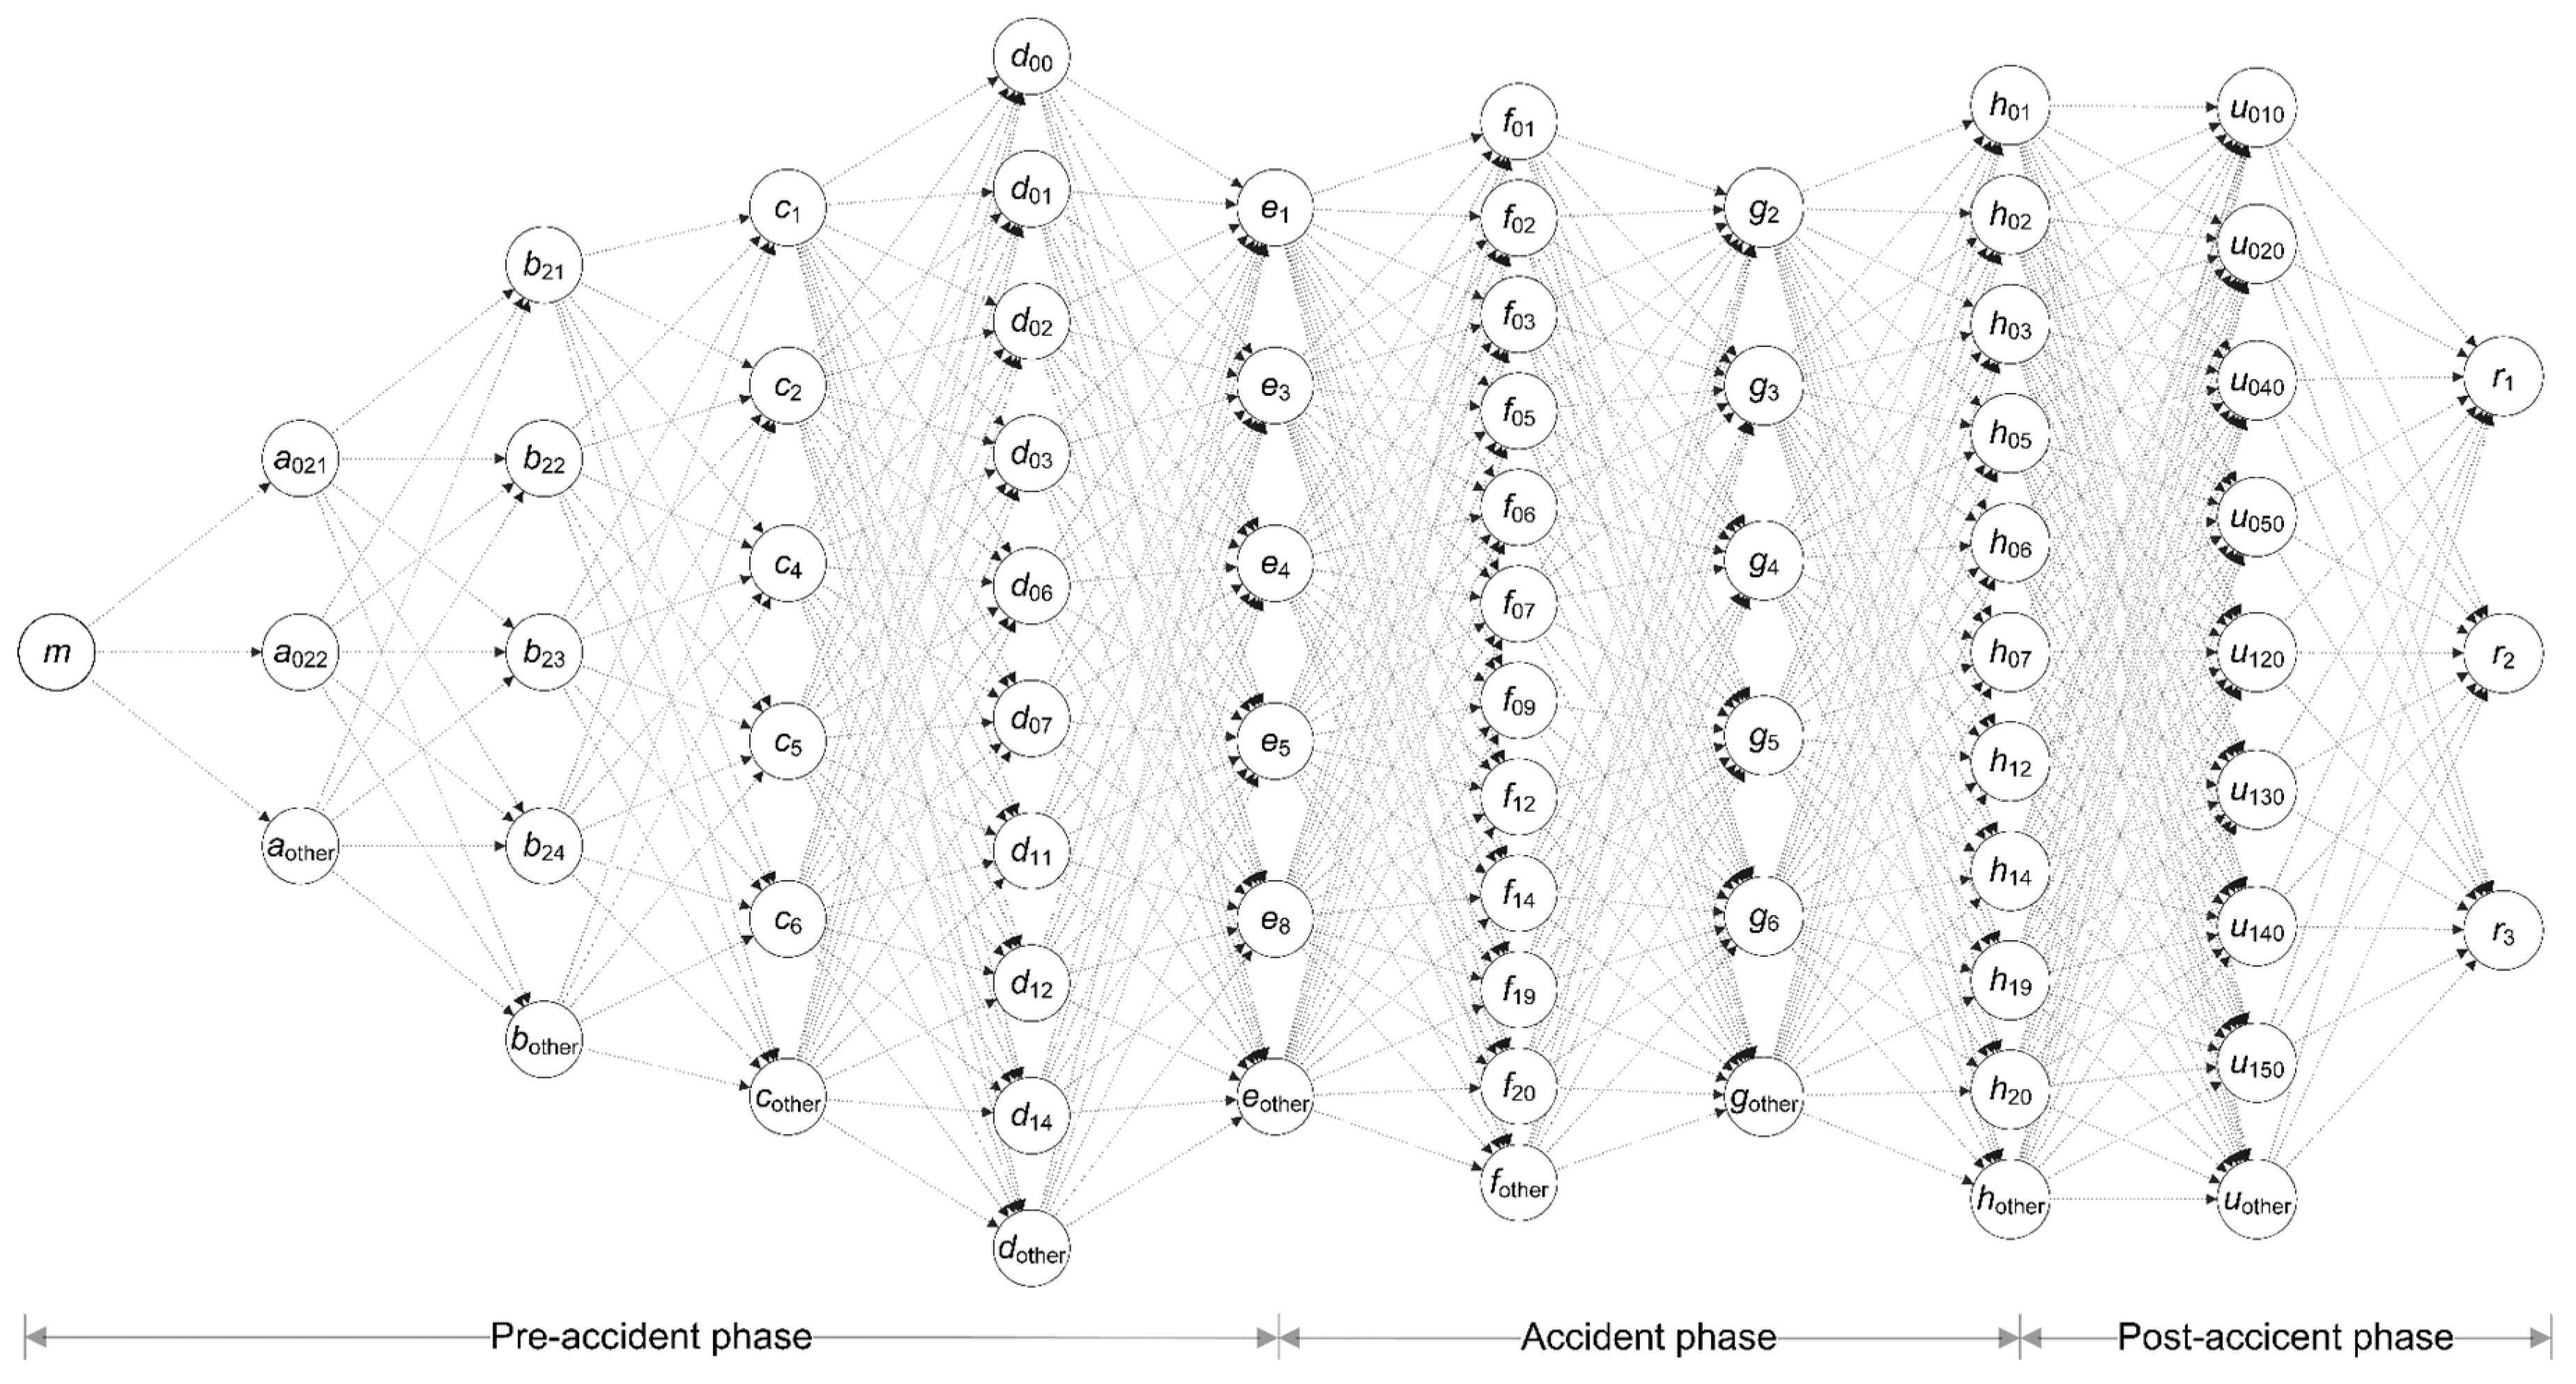
The space of events and relations that most often lead to accidents in the construction industry was determined on the basis of the conducted simulation of the course of accidents, quantitative analysis of the activation of nodes in the graph, and the relationships between neighboring nodes. By rejecting the zero nodes and relations from the set of all the nodes and relations that were included in the prototype of the model of the accident situation development that is presented in Figure 3, and by connecting nonessential nodes for which the number of occurrences was less than 5% into one collective node identified as “other”, a graphical model of the development of the accident situation in the construction industry was obtained and is shown in Figure 4.
Table 2 contains numerical data on the number of activations of individual nodes in the graph, which were identified in the analyzed accident sets. In turn, Table 3 contains one exemplary table out of 10 tables that contain data on the number of relation activations between neighboring nodes.
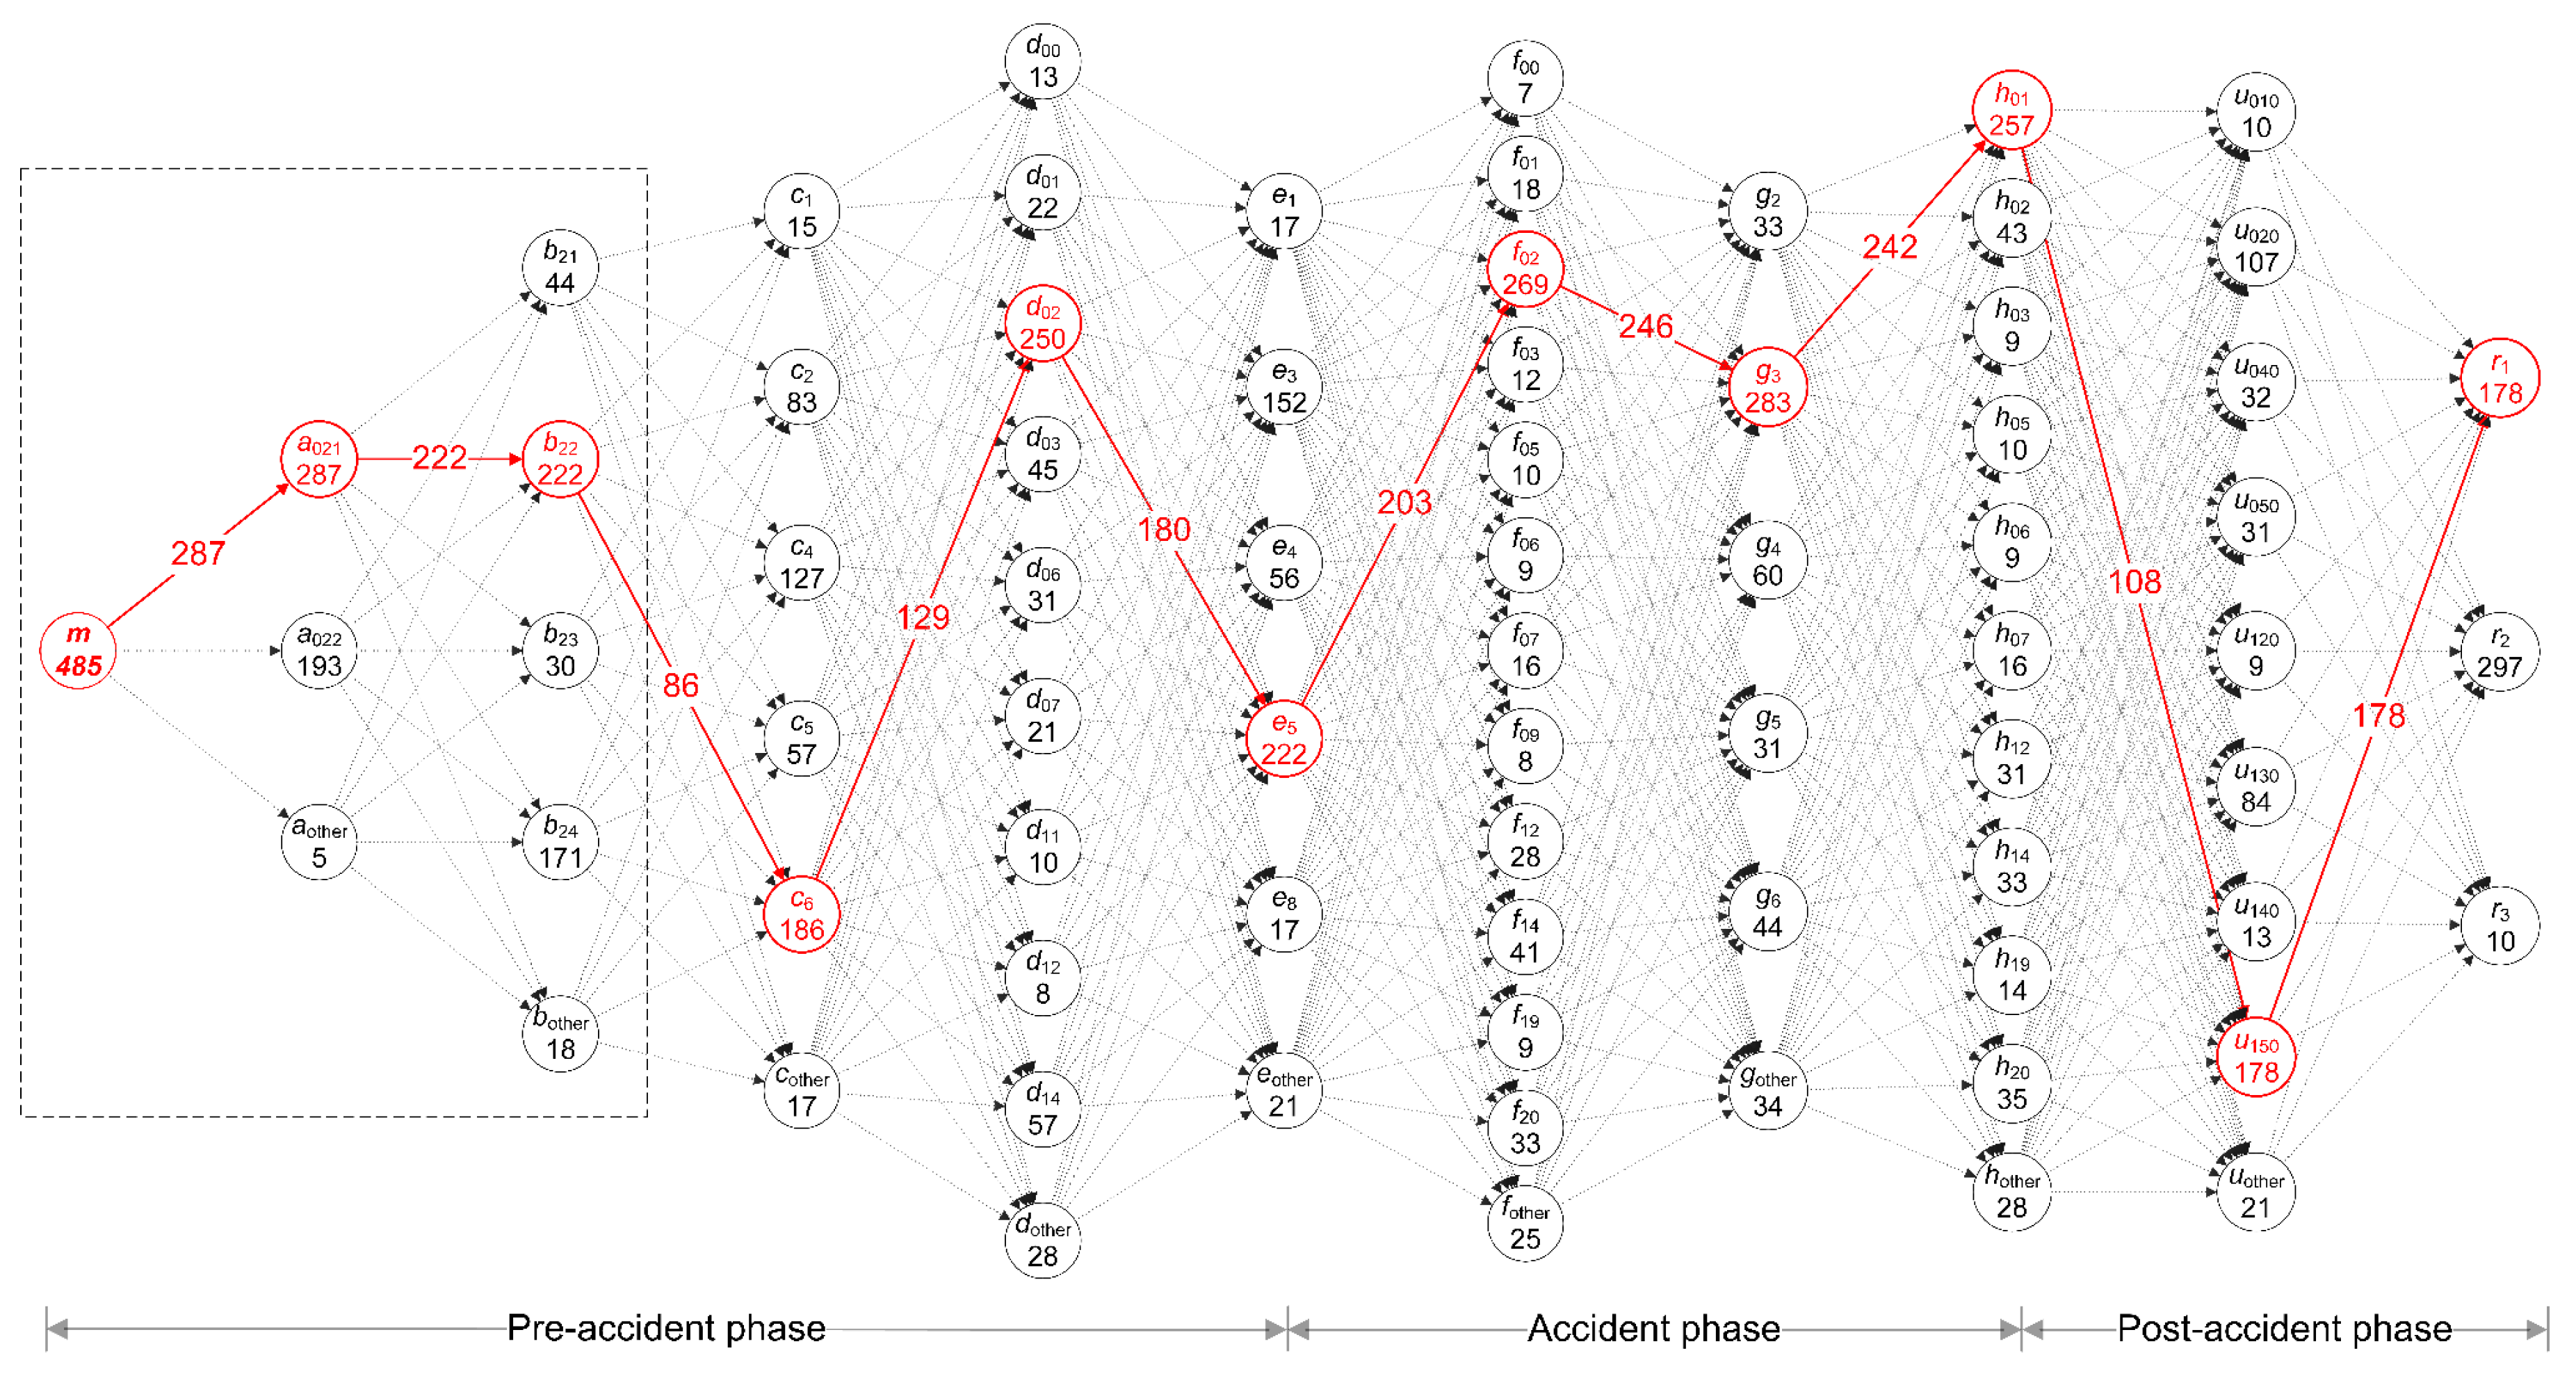
Table 4 includes numerical data on the relations connecting neighboring nodes, which are characterized by the largest number of activations and which are located on the critical path. The course of the critical path in the set of 485 accidents is marked in red in Figure 5.
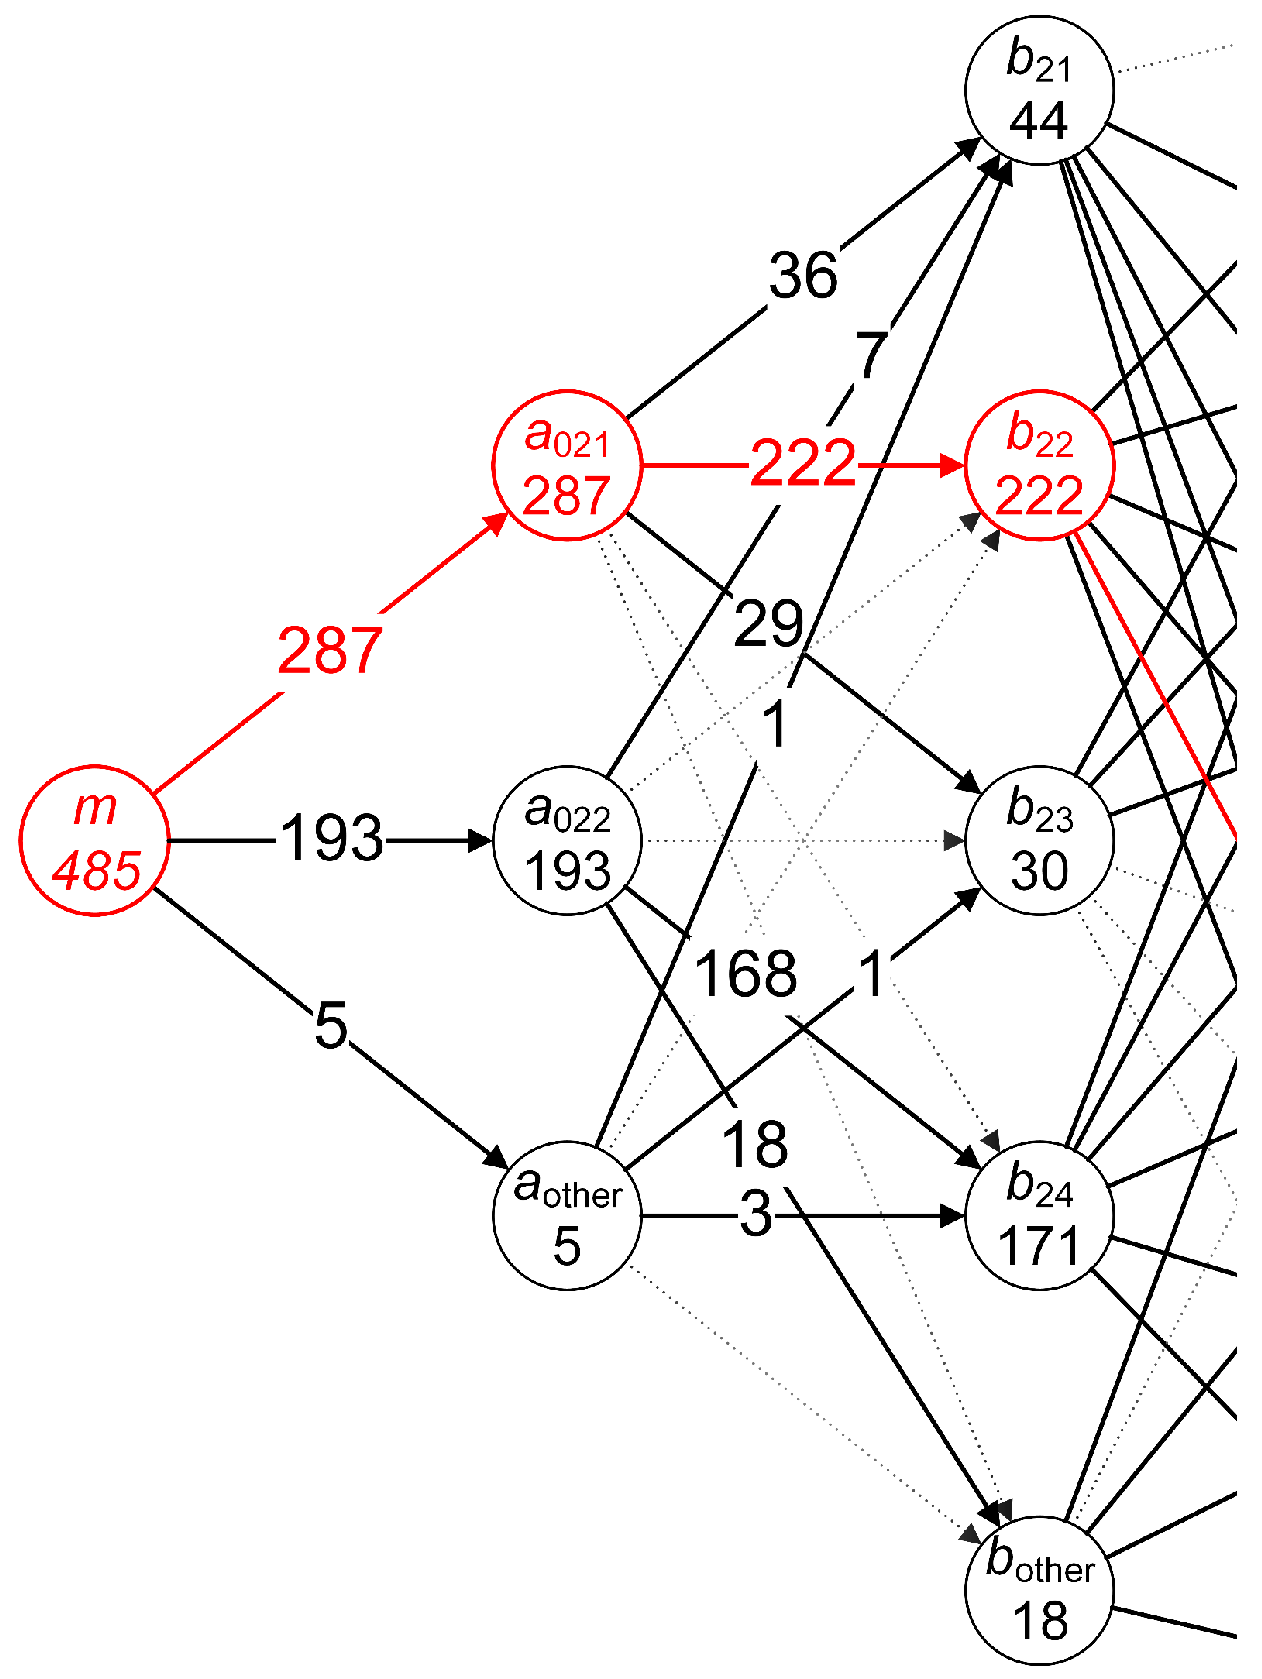
Figure 6 shows a fragment of the model on which all active relations and active nodes are marked. Each node includes the symbol, code, and number of activations. The numbers above the arcs determine the number of active connections between individual nodes.
As a result of the conducted calculations, the following course of the critical path was obtained: m a 021 b 22 c 6 d 02 e 5 f 02 g 3 h 01 u 150 r 1 . The values of relations that connect the neighboring nodes that have the largest number of activations and that lie on the critical path are shown in Table 4. The analysis indicated the following:
  • In the set of 485 analyzed cases, the highest probability value was obtained by relation m a 021 , which connects the source of an accident with the place where the accident occurred—which in this case was the construction site of new buildings. The probability of such a relationship was equal to 59.2%;
  • The probability that a victim at the time of an accident was working while constructing a new facility is equal to 45.8% and applies to relationship a 021 b 22 ;
  • The probability that an employee was moving around a construction site at the time of the accident was equal to 17.7% and applies to relationship b 22 c 6 ;
  • The probability that an injured person was moving on surfaces or building constructions located above ground level at the time of the accident was equal to 26.6% and applies to relationship c 6 d 02 ;
  • The probability of slipping, stumbling, or falling of an employee when moving around surfaces that are located above ground level was equal to 37.1% and applies to relationship d 02 e 5 ;
  • The probability that the material agent, which is associated with the slipping, tripping, or falling of an injured person, were surfaces of objects and structures located above ground level was equal to 41.9% and applies to relationship e 5 f 02 ;
  • The probability that a collision or hitting a stationary object would occur as a result of slipping, tripping, or falling of an injured person, who was on surfaces or building structures located above ground level was equal to 50.7% and applies to relationship f 02 g 3 ;
  • The probability that the object with which the impact will occur, or which a victim hits, are structures and their elements located at ground level was equal to 49.9% and applies to relationship g 3 h 01 ;
  • The probability that a victim suffers injuries due to falling from a height as a result of a collision or hitting structures and their elements located at ground level was equal to 22.3% and applies to relationship h 01 u 150 ;
  • The probability that the result of an injury will be the death of an injured person amounted to 36.7% and applies to relationship u 150 r 1 .

6. Conclusions and Limitations

The collected data on 485 injured people involved in occupational accidents constituted the basis for the calculations and analyses, as well as for the formulation of the following conclusions:
  • The developed model of a complex accident process in the form of a directed graph and its computer application, which is combined with the IT Database (CKD) that contains information on occupational accidents, enabled a selected sequence of accidents to be analyzed as a discrete dynamic process. Accidents that create a sequence of events occur at discrete time periods and at various workstations in terms of their location, construction, and technical equipment.
  • Conducted research and analysis with the use of the model enabled individual accident scenarios in the examined set of accidents to be identified, and the probability of their occurrence and the critical path that indicates the most accident-causing operations to be determined.
  • The most common event in the set of analyzed accidents, which is a deviation from the normal state and the cause of an accident, was the slipping, stumbling, or falling of an injured person ( e 5 ) on surfaces of constructions located above ground level ( f 02 ). As a result of such an event, a fall to a lower level took place ( g 3 ). Most often, such an event resulted in a severe body injury ( r 2 ) or death of an employee ( r 1 ).
  • The prepared model of the development of an accident situation, due to its construction based on the methodology of collecting statistical data on occupational accidents in European Union countries, is a tool, which after its previous adaptation, can be used to analyze the accidentality phenomenon in various European Union countries and various sections of the national economy.
  • The proposed model is of great importance for construction practice. On the basis of a large set of data on accidents contained in the IT Database (CKD), it is possible to study the impact of technologies used in the construction industry, the types of carried out construction works, and the applied equipment and methods of work organization on the accident rate.
  • The proposed model for the development of an accident situation in the construction industry can be the basis for conducting similar research in other areas of construction activity. This is important for comparison purposes. The results of comparative studies can be the basis for determining the most dangerous construction areas.
  • Knowledge of the circumstances of accidents will allow labor law regulations to be properly formulated or modified, as well as preventive activities and training in the field of occupational safety to be targeted. This will certainly reduce the number of accidents. The obtained test results form the basis for determining the most dangerous types of construction works and situations in the construction industry. The identification of such situations is the basis for formulating new, or modifying existing, labor law provisions, e.g., regarding the imposition of fines on enterprises in which significant safety deficiencies were found.
  • The results obtained on the basis of the conducted research may be a justification for the directions of preventive actions carried out in order to reduce the number of occupational accidents in the construction industry. This will significantly contribute to an increase of the level of occupational safety in the Polish construction industry.
  • The presented model of the development of an accident situation is focused on the circumstances that lead to accidents. The model cannot be used to analyze the causes of accidents. This issue is currently the subject of research and analysis.

Author Contributions

Formal analysis, M.S.; methodology, B.H. and M.S.; project administration, B.H.; software, M.S., resources, M.S.; supervision, B.H.

Funding

This research was funded by statute of the Wroclaw University of Science and Technology, Faculty of Civil Engineering.

Conflicts of Interest

The authors declare no conflict of interest.

References

  1. Hoła, B. Qualitative and Quantitative Modelling of Accident Situation in Building Industry; Scientific Works of the Institute of Building Engineering at the Wrocław University of Technology: Wrocław, Poland, 2008; Volume 89. [Google Scholar]
  2. European Statistics on Accident at Work ESAW. Summary Methodology; Eurostat Methodologies & Working Papers: Luxembourg, 2013. [Google Scholar]
  3. Hoła, A.; Hoła, B.; Sawicki, M.; Szóstak, M. Analysis of selected factors that generate the costs of accidents at work using the Polish construction industry as an example. MATEC Web. Conf. 2016, 86, 07005. [Google Scholar] [CrossRef]
  4. Okoye, P.U. Occupational Health and Safety Risk Levels of Building Construction Trades in Nigeria. Australas. J. Constr. Econ. Build. 2018, 18, 92–109. [Google Scholar] [CrossRef]
  5. Sanchez, F.A.S.; Pelaez, G.I.C.; Alis, J.C. Occupational safety and health in construction: A review of applications and trends. Ind. Health 2017, 55, 210–218. [Google Scholar] [CrossRef]
  6. Hui Liy, C.; Ibrahim, S.H.; Affandi, R.; Rosli, N.A.; Mohd Nawi, M.N. Causes of fall hazards in construction site management. Int. Rev. Manag. Mark. 2016, 6, 257–263. [Google Scholar]
  7. López Arquillos, A.; Rubio Romero, J.C.; Gibb, A. Analysis of construction accidents in Spain, 2003–2008. J. Saf. Res. 2012, 43, 381–388. [Google Scholar] [CrossRef]
  8. Leung, M.; Chan, I.Y.S.; Yu, J. Preventing construction worker injury incidents through the management of personal stress and organizational stressors. Accid. Anal. Prev. 2012, 48, 156–166. [Google Scholar] [CrossRef] [PubMed]
  9. Irumba, R. Spatial analysis of construction accidents in Kampala, Uganda. Saf. Sci. 2014, 64, 109–120. [Google Scholar] [CrossRef]
  10. Samuel, O.; Adul Hamid, R.; Saidin Misnan, M. Analysis of Fatal Building Construction Accidents: Cases and Causes. J. Multidiscip. Eng. Sci. Technol. 2017, 4, 8030–8040. [Google Scholar]
  11. Hoque, I.; Ahmed, S.; Sobuz, H.R. Identification of Factors Influencing Accidents on Construction Sites. J. Syst. Manag. Sci. 2017, 7, 1–16. [Google Scholar]
  12. Chi, S.; Han, S. Analyses of systems theory for construction accident prevention with specific reference to OSHA accident reports. Int. J. Proj. Manag. 2013, 31, 1027–1041. [Google Scholar] [CrossRef]
  13. Drozd, W.; Kowalik, M. A study on the state of knowledge of managers of construction sites in the field of occupational safety. MATEC Web Conf. 2019, 262, 07001. [Google Scholar] [CrossRef]
  14. Di Bona, G.; Silvestri, A.; Forcina, A.; Petrillo, A. Total efficient risk priority number (TERPN): A new method for risk assessment. J. Risk Res. 2018, 21, 1384–1408. [Google Scholar] [CrossRef]
  15. Haslam, R.A.; Hide, S.A.; Gibb, A.G.F.; Gyi, D.E.; Pavitt, T.; Atkinson, S.; Duff, A.R. Contributing factors in construction accidents. Appl. Ergon. 2005, 36, 401–415. [Google Scholar] [CrossRef]
  16. Lin, Y.-H.; Chen, C.-Y.; Wang, W.; Wang, T.-W. Fatal occupational falls in the Taiwan construction industry. J. Chin. Inst. Ind. Eng. 2011, 28, 586–596. [Google Scholar] [CrossRef]
  17. Islam, M.S.; Razwanul, I.; Mahmud, M.T. Safety Practices and Causes of Fatality in Building Construction Projects: A Case Study for Bangladesh. Jordan J. Civ. Eng. 2017, 11, 267–278. [Google Scholar]
  18. Camino López, M.A.; Ritzel, D.O.; Fontaneda, I.; González Alcantara, O.J. Construction industry accidents in Spain. J. Saf. Res. 2008, 39, 497–507. [Google Scholar] [CrossRef] [PubMed]
  19. Bellamy, L.J.; Ale, B.J.M.; Whiston, J.Y.; Mud, M.L.; Baksteen, H.; Hale, A.R.; Papazoglou, I.A.; Bloemhoff, A.; Damen, M.; Oh, J.I.H. The software tool storybuilder and the analysis of the horrible stories of occupational accidents. Saf. Sci. 2008, 46, 186–197. [Google Scholar] [CrossRef]
  20. Mitropoulos, P.; Abdelhamid, T.S.; Howell, G.A. Systems Model of Construction Accident Causation. J. Constr. Eng. Manag. 2005, 131, 816–825. [Google Scholar] [CrossRef]
  21. Heinrich, H.W. Industrial Accidents Prevention; Mc Graw Hill Book Company, Inc.: New York, NY, USA, 1959. [Google Scholar]
  22. Bird, F.E. Management Guide to Loss Control, Atlanta, Institute Press; InternatioSafety Academy: Houston, TX, USA, 1974. [Google Scholar]
  23. Benner, L. Accident Theory and Accident Investigation; Proceedings of the Society of Air Safety Investigators Annual Seminar: Ottawa, ON, Canada, 1975. [Google Scholar]
  24. Manu, P.A.; Ankrah, N.A.; Proverbs, D.G.; Suresh, S. Investigating the multi-causal and complex nature of the accident causal influence of construction project features. Accid. Anal. Prev. 2012, 48, 126–133. [Google Scholar] [CrossRef]
  25. Haddon, W. Energy Damage and the Ten Countermeasure Strategies. Hum. Factors J. Hum. Factors Ergon. Soc. 1973, 15, 355–366. [Google Scholar] [CrossRef]
  26. Chua, D.K.H.; Goh, Y.M. Incident Causation Model for Improving Feedback of Safety Knowledge. J. Constr. Eng. Manag. 2004, 130, 542–551. [Google Scholar] [CrossRef]
  27. Behm, M.; Schneller, A. Application of the Loughborough Construction Accident Causation model: A framework for organizational learning. Constr. Manag. Econ. 2013, 31, 580–595. [Google Scholar] [CrossRef]
  28. Reason, J. Human Error; Cambridge University Press: New York, NY, USA, 1990; ISBN 9781139062367. [Google Scholar]
  29. Shao, B.; Hu, Z.; Liu, Q.; Chen, S.; He, W. Fatal accident patterns of building construction activities in China. Saf. Sci. 2019, 111, 253–263. [Google Scholar] [CrossRef]
  30. Mistikoglu, G.; Gerek, I.H.; Erdis, E.; Mumtaz Usmen, P.E.; Cakan, H.; Kazan, E.E. Decision tree analysis of construction fall accidents involving roofers. Expert Syst. Appl. 2015, 42, 2256–2263. [Google Scholar] [CrossRef]
  31. Kjellen, U.; Larsson, T.J. Investigating accidents and reducing risks—A dynamic approach. J. Occup. Accid. 1981, 3, 129–140. [Google Scholar] [CrossRef]
  32. Kjellén, U. The deviation concept in occupational accident control-II. Data collection and assessment of significance. Accid. Anal. Prev. 1984, 16, 307–323. [Google Scholar] [CrossRef]
  33. Abdelhamid, T.S.; Everett, J.G. Identifying Root Causes of Construction Accidents. J. Constr. Eng. Manag. 2000, 126, 52–60. [Google Scholar] [CrossRef]
  34. Minister of Labour and Social Policy Order of 8 November 2010 Amending the Order Concerning the Statistical Accident-at-Work Card (Law Gazette, No. 218, it. 1440, No 240, it. 1612). Available online: http://prawo.sejm.gov.pl/isap.nsf/DocDetails.xsp?id=WDU20102181440 (accessed on 1 March 2019).
  35. Kordecki, W. Theory of Probability and Mathematical Statistics. Definitions, Theorems, Formulas; Printing House GiS: Wrocław, Poland, 2010. [Google Scholar]
  36. Hebda, A. A Method of Engineering and Economical Assessment of Components and Occupational Risk Disutility in Coal Mines; The AGH University of Science and Technology Press: Krakow, Poland, 2005. [Google Scholar]
  37. Hoła, B.; Szóstak, M. A Computer Knowledge Database of accidents at work in the construction industry. IOP Conf. Ser. Mater. Sci. Eng. 2017, 251. [Google Scholar] [CrossRef]
Figure 1. Discrete accident process (own elaboration).
Applsci 09 01878 g001
Figure 2. Accident model in the form of a sequence of events that illustrate the circumstances of an accident and its course (own elaboration).
Applsci 09 01878 g002
Figure 3. A model for the development of an accident situation in the construction industry (own elaboration).
Applsci 09 01878 g003
Figure 4. Model of the development of an accident situation for the analyzed set of 485 accidents (own elaboration).
Applsci 09 01878 g004
Figure 5. Critical path defined for the set of 485 analyzed accidents (own elaboration).
Applsci 09 01878 g005
Figure 6. A fragment of the accident situation development model (own elaboration).
Applsci 09 01878 g006
Table 1. Summary of detailed cases in the model.
A = { a i ; i = 021 ,   022 , ,   029 } The location of an occupational accident (working environment)
a 021 —construction site—building being constructed a 022 —construction site—building being demolished, repaired, maintained
a 023 —opencast quarry, opencast mine, excavation, trench a 024 —construction site—underground
a 026 —construction site—in a high-pressure environment
a 025 —construction site—on/over water
a 029 —other unnamed or unknown places in this group
B = { b j ; j   = 21 , 22 ,   ,   29 } The work process
b 21 —excavation b 22 —new construction building
b 23 —new construction—civil engineering, infrastructures, roads, bridges, dams b 24 —remodeling, repairing, extending, building maintenance—all types of constructions
b 25 —demolition—all types of construction
b 29 —other unnamed or unknown works in this group
C = { c k ; k = 0 , 1 , , 9 } The action performed by the victim at the time of the accident
c 0 —no information c 1 —operating machines
c 2 —working with hand-held tools c 3 —driving/being on board a means of transport or handling equipment
c 4 —handling of objects
c 5 —carrying by hand c 6 —movement
c 7 —presence c 9 —other physical activities not listed in this group
D = { d n ; n = 00 ,   01 , , 20 ,   99 } The material agent related to the operation performed by the victim at the time of an accident
d 00 —no material agent or no information d 01 —buildings, structures, surface—at ground level
d 02 —buildings, structures surfaces—above ground level
d 03 —buildings, structures surfaces—below ground level
d 04 —systems for the supply and distribution of materials, pipe networks
d 05 —motors, systems for energy transmission and storage
d 06 —hand tools, not powered d 07 —hand-held or hand-guided tools, mechanical
d 09 —machines and equipment—portable or mobile
d 10 —machines and equipment—fixed
d 11 —conveying, transport and storage systems d 12 —land vehicles
d 13 —other transport vehicles
d 14 —materials, objects, products, machine or vehicle components, debris, dust d 15 —chemical, explosive, radioactive, biological substances
d 16 —safety devices and equipment d 17 —office equipment: personal equipment, sports equipment, weapons
d 18 —living organisms and human-beings
d 19 —bulk waste d 20 —physical phenomena and natural elements
d 99 —other material agents not listed in this group
E = { e o ; o = 0 ,   1 , , 9 } The event being a deviation from the normal state
e 0 —no information e 1 —deviation due to electrical problems, explosion, fire
e 2 —deviation by overflow, overturn, leak, flow, vaporization, emission
e 3 —breakage, bursting, splitting, slipping, fall, collapse of material agent
e 4 —loss of control (total or partial) of machine, means of transport or handling equipment, hand-held tool, object
e 5 —slipping, stumbling and falling—fall of persons
e 6 —body movement without any physical stress (generally leading to an external injury) e 7 —body movement under or with physical stress (generally leading to an internal injury)
e 8 —shock, fright, violence, aggression, threat, presence e 9 —other deviations not listed in this group
F = { f p ; p = 00 ,   01 , , 20 ,   99 } The material agent associated with a deviation from the normal state. Classification of material agents as in nodeD
G = { g q ; q = 0 , 1 , , 9 } The event causing an injury
g 0 —no information g 1 —contact with electrical voltage, temperature, hazardous substances
g 2 drowned, buried, enveloped
g 3 —horizontal or vertical impact with or against a stationary object (the victim is in motion) g 4 —struck by object in motion, collision with
g 5 —contact with sharp, pointed, rough, coarse material agent
g 6 —trapped, crushed, etc. g 7 —physical or mental stress
g 8 —bite, kick, etc. (human) g 9 —other events not listed in this group
H = { h s ; s = 00 ,   01 , , 20 ,   99 }   The material agent that is the source of an injury associated with an event that causes the injury. Classification of material agents as in nodeD
U = { u v ; v = 000 ,   010 , , 140 ,   999 } The type of injury
u 000 —type of injury unknown or unspecified u 010 —wounds and superficial injuries
u 020 —bone fractures
u 030 —dislocations, sprains and strains u 040 —traumatic amputations (loss of body parts)
u 050 —concussion and internal injuries
u 060 —burns, scalds and frostbites u 070 —poisonings and infections
u 080 —drowning and asphyxiation u 090 —effects of sounds, vibrations and pressure
u 100 —effects of temperature extremes, light and radiation u 110 —shocks (acute reaction to stress, traumatic shock)
u 120 —multiple injuries u 130 —unspecified injuries as a result of falling from height
u 140 —unspecified injury as a result of backfilling with ground
u 150 —unspecified injuries leading to death
u 999 —other specified injuries not included under other headings
R = { r x ; x   = 1 ,   2 ,   3 } The severity of injury
r 1 —fatal accident r 2 —severe body injuries
r 3 —minor body injuries
Table 2. Number of activations of individual nodes in the graph.
NodeCodeNumberNodeCodeNumber
Location of accident A a 021 287Event that causes injury G g 2 33
a 022 193 g 3 283
a o t h e r 5 g 4 60
Work process B b 21 44 g 5 31
b 22 222 g 6 44
b 23 30 g o t h e r 34
b 24 171Material agent that is the source of an injury, which is associated with the event causing the injury H h 01 257
b o t h e r 18 h 02 43
Material agent related to the operation performed by the victim at the time of the accident C c 1 15 h 03 9
c 2 83 h 05 10
c 4 127 h 06 9
c 5 57 h 07 16
c 6 186 h 12 31
c o t h e r 17 h 14 33
Material agent related to the operation performed by the victim at the time of the accident D d 00 13 h 19 14
d 01 22 h 20 35
d 02 250 h o t h e r 28
d 03 45Type of injury U u 010 10
d 06 31 u 020 107
d 07 21 u 040 32
d 11 10 u 050 31
d 12 8 u 120 9
d 14 57 u 130 84
d o t h e r 28 u 140 13
Event that is a deviation from the normal state E e 1 17 u 150 178
e 3 152 u o t h e r 21
e 4 56Severity of injury R r 1 178
e 5 222 r 2 297
e 8 17 r 3 10
e o t h e r 21
Material agent related to a deviation from the normal state F f 00 7
f 01 18
f 02 269
f 03 12
f 05 10
f 06 9
f 07 16
f 09 8
f 12 28
f 14 41
f 19 9
f 20 33
f o t h e r 25
Table 3. Matrix of relationships between the place where the accident occurred and the work process.
Work process B
b 21 b 22 b 23 b 24 b 25 b 29
Place of accident A a 021 3622229000287
a 022 700168180193
a 023 0000000
a 024 1003004
a 025 0010001
a 026 0000000
a 029 0000000
4422230171180485
Table 4. Summary of relations connecting neighboring nodes that are characterized with the largest number of activations and lying on the critical path.
Type of Relation φ ψ Number of Relationship Activations N ( φ ψ ) [-]Probability of the Occurrence of Relation   P ( φ ψ ) [%]
m a 021 28759,2
a 021 b 22 22245,8
b 22 c 6 8617,7
c 6 d 02 12926,6
d 02 e 5 18037,1
e 5 f 02 20341,9
f 02 g 3 24650,7
g 3 h 01 24249,9
h 01 u 150 10822,3
u 150 r 1 17836,7