Myocardial Infarction Classification Based on Convolutional Neural Network and Recurrent Neural Network

Abstract
:1. Introduction
2. Methods
2.1. One-Dimensional CNN
2.2. RNN
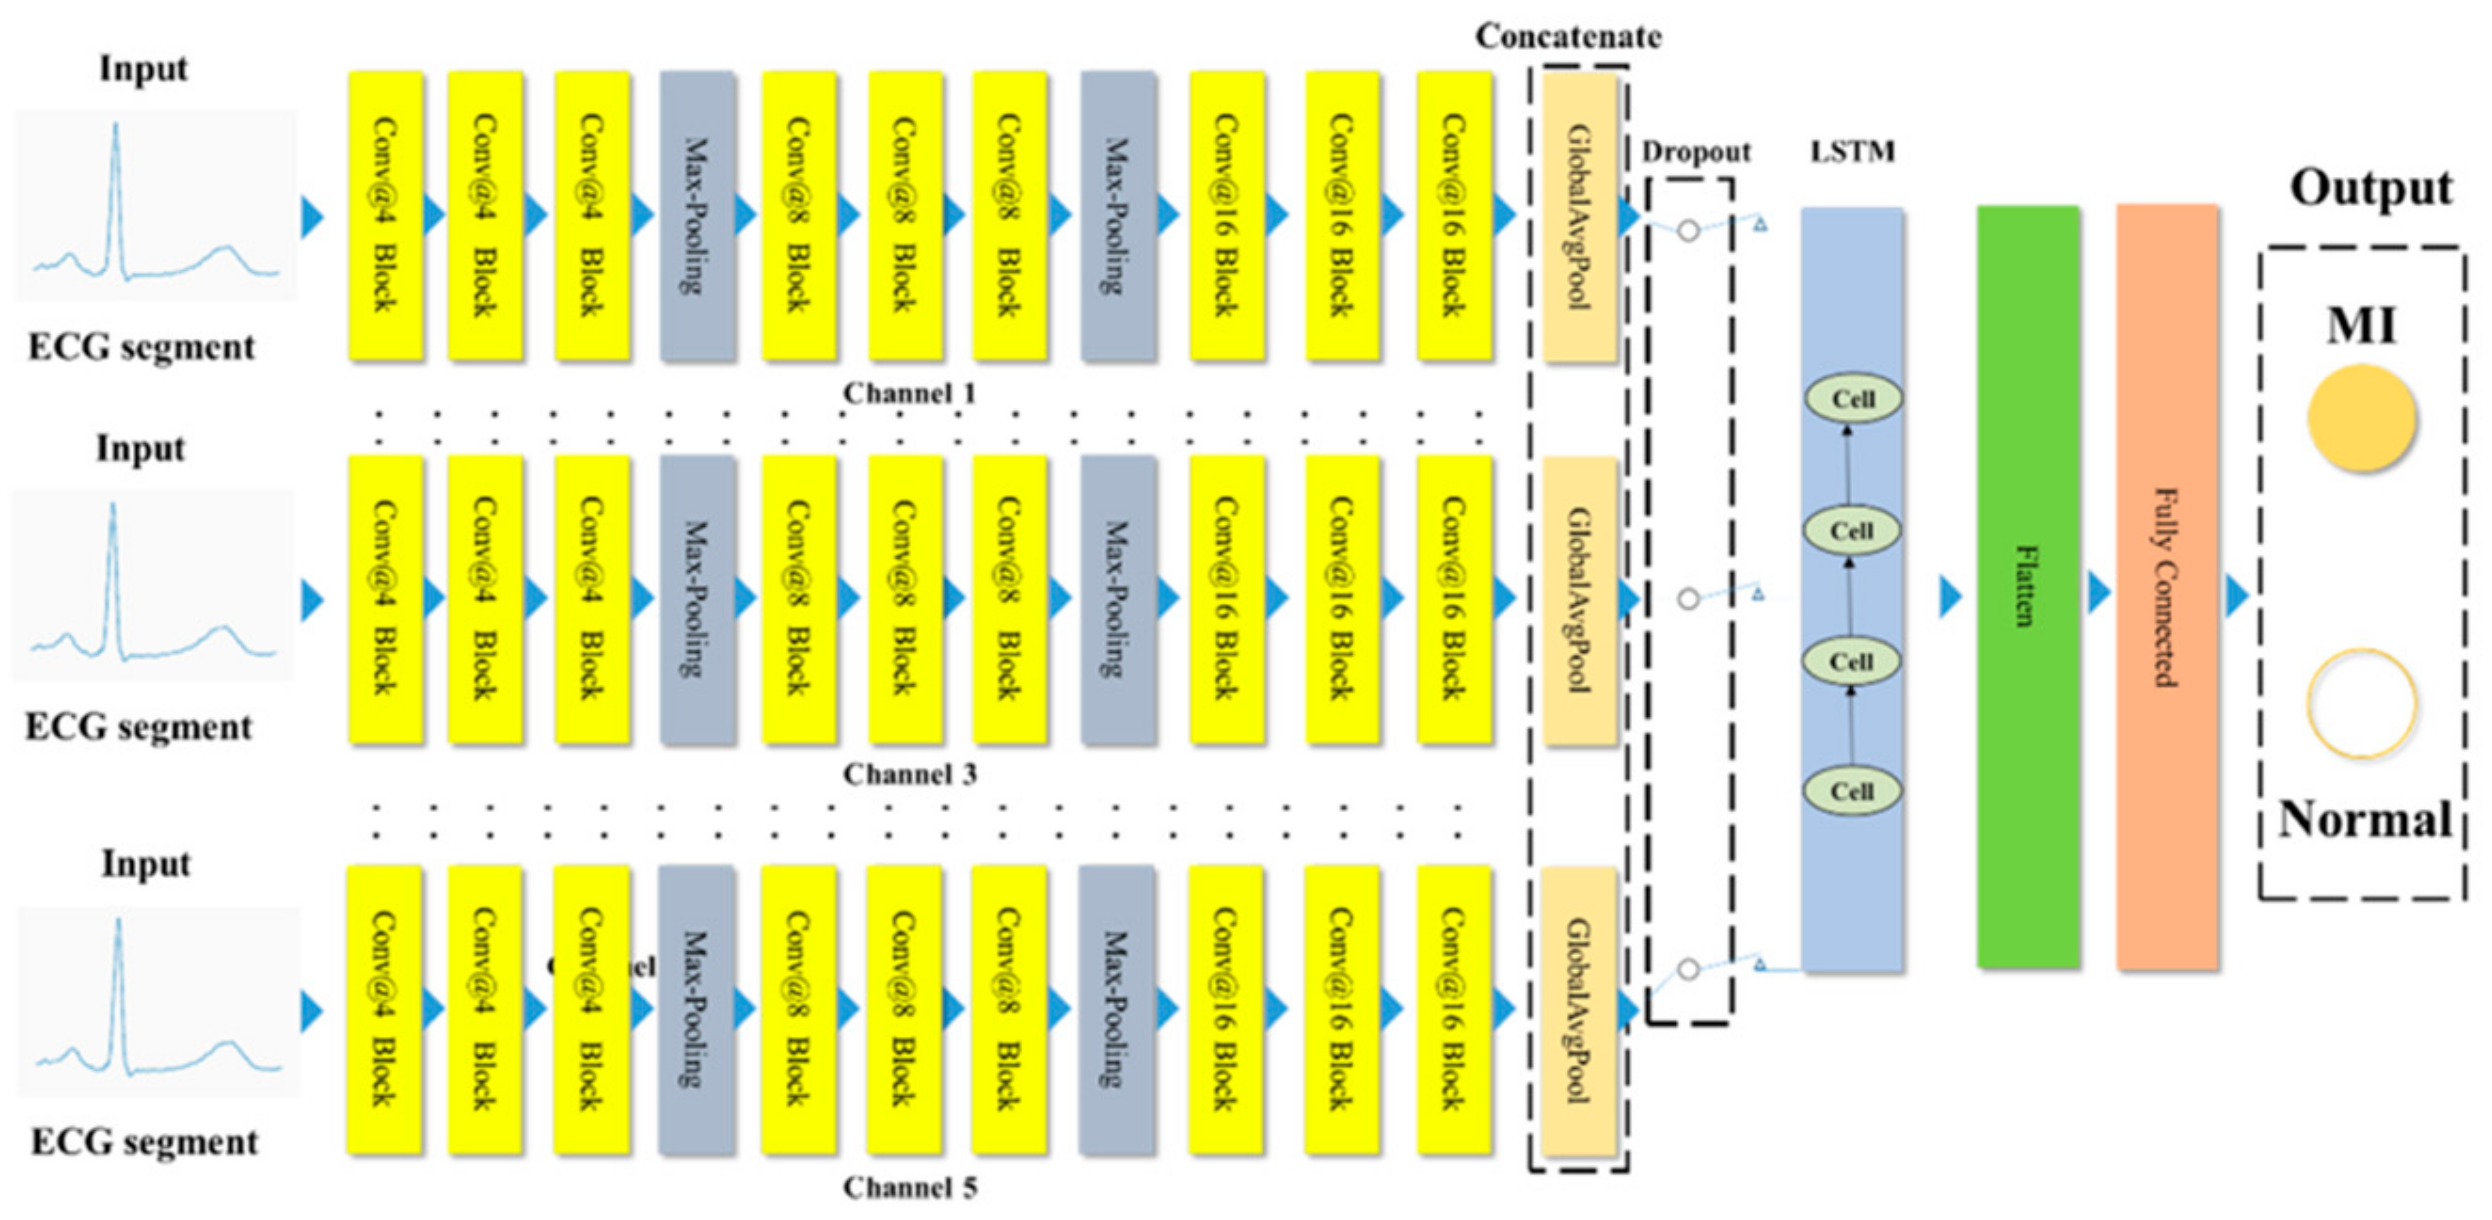
2.3. Network Model
- (1)
- Convolutional layers: since the input ECG signals were one-dimensional signals, the selected numbers of filters of the one-dimensional convolutional layer were 4, 8, and 16, respectively; the convolution kernel size was 5 and the stride was 1; the specific parameter setting process is described in Section 4. Meanwhile, batch normalization was utilized to ensure that the input distribution of each layer of the neural network was the same, and ReLU function was applied as the activation function. Compared with the sigmoid function and tanh function, the ReLU function converges faster and alleviates the over-fitting problem. ReLU activation function can be expressed as Equation (10):
- (2)
- Pooling layers: this paper used the max-pooling (kernel size was 5) in the fourth and eighth layers of the network, decreased the dimensionality of the calculated characteristic parameters, and retained the significant features to accelerate the calculation. The tenth layer used the global average pooling to reduce the extraction of potential features and obtain the calculation result of the convolutional network.
- (3)
- Dropout layer: the dropout layer was applied between the global average pooling layer and the LSTM layer to achieve stronger generalization capability by randomly invalidating some network nodes.
- (4)
- LSTM layer: after the convolutional network as described above, due to the strong temporal correlation of the ECG signals, we connected a layer of the LSTM network to obtain the temporal characteristics in the output features of the convolutional network.
- (5)
- Flatten layer: we converted the multi-dimensional output of the LSTM network into a one-dimensional output.
- (6)
- Fully-connected layer: the features after all processes were input to the fully-connected layer for classification, and the classifier was Softmax.
3. Experiments
3.1. Data Sources
3.2. Data Preprocessing
3.3. Balanced Data
3.4. Cross-Validation
3.5. Evaluation Index
4. Results
4.1. Development Environment
4.2. Impact of Channel Numbers on Performance Indicators
4.3. Impact of Convolution Kernel Sizes on Classification Results
4.4. Impact of Different Optimizers and Learning Rates on Performance Index
4.5. Determination of Model Parameters
5. Discussion
6. Conclusions
Author Contributions
Funding
Conflicts of Interest
References
- Benjamin, E.J.; Blaha, M.J.; Chiuve, S.E.; Cushman, M.; Das, S.R.; Deo, R.; De Ferranti, S.D.; Floyd, J.; Fornage, M.; Gillespie, C.; et al. Heart Disease and Stroke Statistics’2017 Update: A Report from the American Heart Association. Circulation 2017, 135, e146–e603. [Google Scholar] [CrossRef]
- Thygesen, K.; Alpert, J.S.; Jaffe, A.S.; Simoons, M.L.; Chaitman, B.R.; White, H.D.; Katus, H.A.; Lindahl, B.; Morrow, D.A.; Clemmensen, P.M.; et al. Third Universal Definition of Myocardial Infarction. Circulation 2012, 126, 2020–2035. [Google Scholar] [CrossRef]
- Sun, L.; Lu, Y.; Yang, K.; Li, S. ECG analysis using multiple instance learning for myocardial infarction detection. IEEE Trans. Biomed. Eng. 2012, 59, 3348–3356. [Google Scholar] [CrossRef] [PubMed]
- Arif, M.; Malagore, I.A.; Afsar, F.A. Detection and localization of myocardial infarction using K-nearest neighbor classifier. J. Med. Syst. 2012, 279–289. [Google Scholar] [CrossRef] [PubMed]
- Dev Sharma, L.; Kumar Sunkaria, R. Inferior myocardial infarction detection using stationary wavelet transform and machine learning approach. Signal Image Video Process. 2018, 12, 199–206. [Google Scholar] [CrossRef]
- Safdarian, N.; Dabanloo, N.J.; Attarodi, G. A New Pattern Recognition Method for Detection and Localization of Myocardial Infarction Using T-Wave Integral and Total Integral as Extracted Features from One Cycle of ECG Signal. J. Biomed. Sci. Eng. 2014, 07, 818–824. [Google Scholar] [CrossRef]
- Farooq, A.; Anwar, S.; Awais, M.; Rehman, S. A deep CNN based multi-class classification of Alzheimer’s disease using MRI. In Proceedings of the 2017 IEEE International Conference on Imaging Systems and Techniques (IST), Beijing, China, 18–20 October 2017; pp. 1–6. [Google Scholar] [CrossRef]
- He, T.; Droppo, J. Exploiting LSTM structure in deep neural networks for speech recognition. In Proceedings of the 2016 IEEE International Conference on Acoustics, Speech and Signal Processing (ICASSP), Shanghai, China, 20–25 March 2016; pp. 5445–5449. [Google Scholar] [CrossRef]
- Yoo, Y.; Baek, J.-G. A Novel Image Feature for the Remaining Useful Lifetime Prediction of Bearings Based on Continuous Wavelet Transform and Convolutional Neural Network. Appl. Sci. 2018, 8, 1102. [Google Scholar] [CrossRef]
- Xiong, Z.; Stiles, M.; Zhao, J. Robust ECG Signal Classification for the Detection of Atrial Fibrillation Using Novel Neural Networks. In Proceedings of the 2017 Computing in Cardiology Conference, Rennes, France, 24–27 September 2017; pp. 1–4. [Google Scholar] [CrossRef]
- Saadatnejad, S.; Oveisi, M.; Hashemi, M. LSTM-Based ECG Classification for Continuous Monitoring on Personal Wearable Devices. arXiv 2018, arXiv:1812.04818. [Google Scholar]
- Reasat, T.; Shahnaz, C. Detection of inferior myocardial infarction using shallow convolutional neural networks. In Proceedings of the 2017 IEEE Region 10 Humanitarian Technology Conference, Dhaka, Bangladesh, 21–23 December 2017; pp. 718–721. [Google Scholar] [CrossRef]
- Acharya, U.R.; Fujita, H.; Oh, S.L.; Hagiwara, Y.; Tan, J.H.; Adam, M. Application of deep convolutional neural network for automated detection of myocardial infarction using ECG signals. Inf. Sci. 2017, 415–416, 190–198. [Google Scholar] [CrossRef]
- Li, X.; Wu, X. Long short-term memory based convolutional recurrent neural networks for large vocabulary speech recognition. In Proceedings of the Annual Conference of the International Speech Communication Association NTERSPEECH 2015, Dresden, Germany, September 2015; pp. 3219–3223. [Google Scholar]
- Goldberger, A.L.; Amaral, L.A.N.; Glass, L.; Hausdorff, J.M.; Ivanov, P.C.; Mark, R.G.; Mietus, J.E.; Moody, G.B.; Peng, C.-K.; Stanley, H.E. PhysioBank, PhysioToolkit, and PhysioNet. Circulation 2012, 101, E215–E220. [Google Scholar] [CrossRef]
- Martis, R.J.; Acharya, U.R.; Min, L.C. ECG beat classification using PCA, LDA, ICA and Discrete Wavelet Transform. Biomed. Signal Process. Control 2013, 8, 437–448. [Google Scholar] [CrossRef]
- Pan, J.; Tompkins, W.J. A Real-Time QRS Detection Algorithm. IEEE Trans. Biomed. Eng. 2007, 32, 230–236. [Google Scholar] [CrossRef] [PubMed]
- De Luna, A.B.; Zareba, W.; Fiol, M.; Nikus, K.; Birnbaum, Y.; Baranowski, R.; Goldwasser, D.; Kligfield, P.; Piotrowicz, R.; Breithardt, G.; et al. Negative T wave in ischemic heart disease: A consensus article. Ann. Noninvasive Electrocardiol. 2014, 19, 426–441. [Google Scholar] [CrossRef] [PubMed]
- Dawson, D.; Yang, H.; Malshe, M.; Bukkapatnam, S.T.S.; Benjamin, B.; Komanduri, R. Linear affine transformations between 3-lead (Frank XYZ leads) vectorcardiogram and 12-lead electrocardiogram signals. J. Electrocardiol. 2009, 42, 622–630. [Google Scholar] [CrossRef] [PubMed]
- Huang, C.S.; Ko, L.W.; Lu, S.W.; Chen, S.A.; Lin, C.T. A vectorcardiogram-based classification system for the detection of Myocardial infarction. Conf. Proc. IEEE Eng. Med. Biol. Soc. 2011, 2011, 973–976. [Google Scholar] [CrossRef] [PubMed]
- Ge, D. Detecting myocardial infraction using VCG leads. In Proceedings of the 2008 2nd International Conference on Bioinformatics and Biomedical Engineering, Shanghai, China, 16–18 May 2008; pp. 2217–2220. [Google Scholar] [CrossRef]
- Zewdie, G.; Xiong, M. Fully Automated Myocardial Infarction Classification using Ordinary Differential Equations. arXiv 2019, arXiv:1812.04818. [Google Scholar]
- Strodthoff, N.; Strodthoff, C. Detecting and interpreting myocardial infarction using fully convolutional neural networks. Physiol. Meas. 2019, 40. [Google Scholar] [CrossRef] [PubMed]


| Components | Frequency Band (Hz) | Components | Frequency Band (Hz) |
|---|---|---|---|
| D1 | 250–500 | D7 | 3.9–7.81 |
| D2 | 125–250 | D8 | 1.95–3.9 |
| D3 | 62.5–125 | D9 | 0.975–1.95 |
| D4 | 31.25–62.5 | D10 | 0.4875–0.975 |
| D5 | 15.63–31.25 | A10 | 0–0.4875 |
| D6 | 7.81–15.63 |
| Input Length | Acc | Sen | Spec | F1 |
|---|---|---|---|---|
| 3 s | 95.4% | 98.2% | 86.5% | 96.8% |
| 6 s | 94.3% | 96.5% | 81.9% | 95.4% |
| 9 s | 92.7% | 93.6% | 80.5% | 93.4% |
| Layers | 1–3 | 4 | 5–7 | 8 | 9–11 | AUC |
|---|---|---|---|---|---|---|
| Conv | Pooling | Conv | Pooling | Conv | ||
| 5 Channels Model | 1 × 3 | 1 × 5 | 1 × 3 | 1 × 5 | 1 × 3 | 0.9841 |
| 1 × 5 | 1 × 5 | 1 × 5 | 1 × 5 | 1 × 5 | 0.9868 | |
| 1 × 7 | 1 × 5 | 1 × 7 | 1 × 5 | 1 × 7 | 0.9903 | |
| 1 × 9 | 1 × 5 | 1 × 9 | 1 × 5 | 1 × 9 | 0.9908 | |
| 1 × 11 | 1 × 5 | 1 × 11 | 1 × 5 | 1 × 11 | 0.9868 |
| Learning Rate | 0.0001 | 0.001 | 0.01 | 0.1 |
|---|---|---|---|---|
| Optimizer | Acc | |||
| Adam | 95.4% | 93.6% | 91.0% | 90.5% |
| RMSprop | 94.2% | 93.2% | 90.5% | 89.6% |
| SGD | 94.8% | 92.0% | 89.4% | 88.7% |
| Layers | Type | Filter Number | Kernel Size | Output Shape | |
|---|---|---|---|---|---|
| 0 | Input | 600 × 1 | |||
| 1–3 | Convolution | ×5 | 4 | 5 | 600 × 4 |
| 4 | Max-Pooling | - | 5 | 120 × 4 | |
| 5–7 | Convolution | 8 | 5 | 120 × 8 | |
| 8 | Max-Pooling | - | 5 | 24 × 8 | |
| 9–11 | Convolution | 16 | 5 | 24 × 16 | |
| 12 | Global-Avg-Pooling | - | - | 16 | |
| Concatenate | - | 16 × 5 | |||
| 13 | Dropout | 0.5 | 16 × 5 | ||
| 14 | LSTM | - | 16 × 1 | ||
| 15 | Flatten | - | 16 | ||
| 16 | Fully Connected | - | 2 | ||
| Author | Leads | Methods | Performance |
|---|---|---|---|
| Sun et al. [3] | 12 leads | ST segments features using multiple instance learning and SVM | Sen = 92.6% Spe = 82.4% |
| Sharma et al. [5] | II, III, aVF | SVM + KNN on frequency domain features | Sen = 98.7% Spec = 98.7% |
| Remya et al. [7] | II, III, avF, V2,V3,V5 | ANN based on wavelet features | Acc = 86% Sen = 83% Spec = 88% |
| Reasat et al. [12] | II, III, avF | shallow convolutional neural networks | Acc = 85% Sen = 85% Spec = 84% |
| Strodthoff et al. [23] | 12 leads | fully convolutional neural networks | Acc = 94.1%; Sen = 93.7%; Spec = 96.1% |
| Huang et al. [20] | Frank leads | time and statistics features with KNN+SVM | Sen = 99.8% Spec = 92.5% |
| Ge [21] | Frank leads | multivariable autoregressive coefficients of VCG features | Acc = 99.1% |
| Safdarian et al. [6] | II lead | Naïve Bayes with T wave detection | Acc = 94.7% |
| Acharya et al. [13] | II lead | 11 layers convolutional neural network | Acc = 95.2% Sen = 95.5% Spec = 94.2% |
| Zewdie et al. [22] | I lead | morphological features with SVM | Acc = 97% |
| The proposed | I lead | CNN-LSTM | Acc = 95.4% Sen = 98.2% Spec = 86.5% F1 = 96.8% |
© 2019 by the authors. Licensee MDPI, Basel, Switzerland. This article is an open access article distributed under the terms and conditions of the Creative Commons Attribution (CC BY) license (http://creativecommons.org/licenses/by/4.0/).
Share and Cite
Feng, K.; Pi, X.; Liu, H.; Sun, K. Myocardial Infarction Classification Based on Convolutional Neural Network and Recurrent Neural Network. Appl. Sci. 2019, 9, 1879. https://doi.org/10.3390/app9091879
Feng K, Pi X, Liu H, Sun K. Myocardial Infarction Classification Based on Convolutional Neural Network and Recurrent Neural Network. Applied Sciences. 2019; 9(9):1879. https://doi.org/10.3390/app9091879
Chicago/Turabian StyleFeng, Kai, Xitian Pi, Hongying Liu, and Kai Sun. 2019. "Myocardial Infarction Classification Based on Convolutional Neural Network and Recurrent Neural Network" Applied Sciences 9, no. 9: 1879. https://doi.org/10.3390/app9091879
APA StyleFeng, K., Pi, X., Liu, H., & Sun, K. (2019). Myocardial Infarction Classification Based on Convolutional Neural Network and Recurrent Neural Network. Applied Sciences, 9(9), 1879. https://doi.org/10.3390/app9091879