Article

Color Inverse Halftoning Method with the Correlation of Multi-Color Components Based on Extreme Learning Machine

1
Shaanxi Provincial Key Laboratory of Printing and Packaging Engineering, Xi’an University of Technology, Xi’an 710048, China
2
Faculty of Mechanical and Precision Instrumental Engineering, Xi’an University of Technology, Xi’an 710048, China
3
Department of Border-control and Immigration, China People’s Police University, Langfang 065000, China
4
School of Computer Science and Engineering, Xi’an University of Technology, Xi’an 710048, China
*
Author to whom correspondence should be addressed.
Appl. Sci. 2019, 9(5), 841; https://doi.org/10.3390/app9050841
Submission received: 31 December 2018 / Revised: 20 February 2019 / Accepted: 22 February 2019 / Published: 27 February 2019
(This article belongs to the Special Issue Advanced Intelligent Imaging Technology)

Abstract

:
Look-up table (LUT) based method is a popular and effective way for inverse halftoning. However, it still has very large development space to improve the reconstructed color image quality for color halftone images, because most of the existing color inverse halftoning methods are the simple extension of LUT methods to each color components separately. To this end, this paper presents a novel color inverse halftoning method by exploiting the correlation of multi-color components. Through considering all existent contone values with the same halftone pattern in three color component tables, we firstly propose a concept of common pattern. Then the extreme learning machine (ELM) is employed to estimate the contone values for nonexistent patterns according to common patterns in color LUT, which can not only improve the fitting precision of nonexistent values but also has fast transformation speed. Experimental results show that the proposed method achieves a better image quality when compared to previously published methods.

1. Introduction

Digital halftoning is a special technique of converting a continuous image into a binary image, which is widely used in many fields, such as printing industry, textile industry and the electronic display field [1,2]. The binary image, called halftone image, can simulate the original continuous tone image in bi-level output devices. However, when halftone images need to be further processed by applying general image methods, such as image zooming, rotation, compression, and feature extraction, they are typically difficult to operate. Thus, another technique named inverse halftoning comes into being for this purpose. Inverse halftoning is a technique which is used to reconstruct a continuous tone image from its corresponding halftone image. Due to a certain amount of information loss in the process of digital halftoning, inverse halftoning is an ill-posed problem. Thus, reconstructing a high-quality continuous tone image from its halftone version is a challenging but promising research topic.
Over the past several decades, many inverse halftoning methods have been presented. The proposed methods can be classified into five categories: filtering, deconvolution, optimization estimation, vector quantization, and machine learning [1,2]. The filtering-based method includes Gaussian low-pass filtering method [3], adaptive filtering [4], linear or non-linear filtering [5], and transform-domain filtering [6]. The low-pass filtering is a simple and fast inverse halftoning method, it can remove most of the noise in the reconstructed continuous tone image. Nevertheless, it also causes edge blurring. Besides low-pass filtering, other filtering-based methods, such as adaptive filtering, linear or non-linear filtering, and transform-domain filtering, are designed for obtaining a sharp image with a low perceived noise level. Although these methods can produce good results on image edges, they also create artifacts in the image smooth areas. Inverse halftoning can be considered as a deconvolution problem, which was first proposed by Kite et al. [7] as a linear approximation model. This method can work well for images generated by error diffusion halftoning method but does not apply to other types of halftone images. Lai et al. [8] proposed a novel inverse halftoning by applying classified vector quantization, it is also effective for error diffusion halftoning. The machine-learning-based inverse halftoning method is to train a model by using continuous tone images and their halftone versions, and then the continuous tone value can be estimated by this model. The model includes neural network [9,10], sparsity-based [1,11,12], and look-up table [13,14]. Compared to other two machine-learning-based methods, the method based on look-up table is a promising method because of its fast speed and universality. Thus, it has attracted the attention of many researchers.
The method based on look-up table was first proposed by Mese et al. [13] for inverse halftoning. Since then, many methods were proposed to improve the performance of this method [14,15,16,17,18,19,20,21,22]. In summary, the improvements include three aspects. The first is the template selection and optimization [14,15], where the correlation method and the elitist genetic algorithm were used to obtain the best template. The second is to reduce the size of the table and improve the speed of searching look-up table [16,17,18,19], while the third is to get the accurate contone value from each template pattern [20,21,22]. Although these improvements have produced relatively satisfactory results for grey images, very little research has addressed color inverse halftoning. Except for references [13] and [14], most of the existing color inverse halftoning methods are a simple extension of the look-up table (LUT) method to each color planes separately. Since these color inversing methods cannot consider the correlation between the color planes, they lead to a poor quality of color continuous-tone images. In references [13] and [14], the template of each color plane, as shown in Tables XIII–XV in Reference [14], is constructed not only by its neighborhood pixels, but also considering the two pixels at the same position in the other two-color components, thus the quality of the reconstructed color image is improved to a certain extent. Since the correlation between the color components proposed in reference [13] and [14] is a weak correlation, there is still room to improve the reconstructed color image quality for color halftone images.
Armed with all the neighborhoods of each color plane, we propose a novel color inverse halftoning method by exploiting the correlation of multi-color components. The proposed method uses all existent values in the same patterns of three-color component tables to estimate the nonexistent values in color table. In order to increase the estimation speed and accuracy, the extreme learning machine (ELM) is employed to learn the relation between color template patterns and their corresponding color contone values, which can not only improve the fitting precision of nonexistent values but also has fast transformation speed. Experimental results show that the proposed method achieves a better image quality when compared to the previously published method.
The remaining part of this paper is organized as follows. Section 2 gives an overview of our proposed method. In Section 3, we detail our proposed method. The experiment is demonstrated in Section 4 by comparing it with other methods. Finally, conclusions are addressed in Section 5.

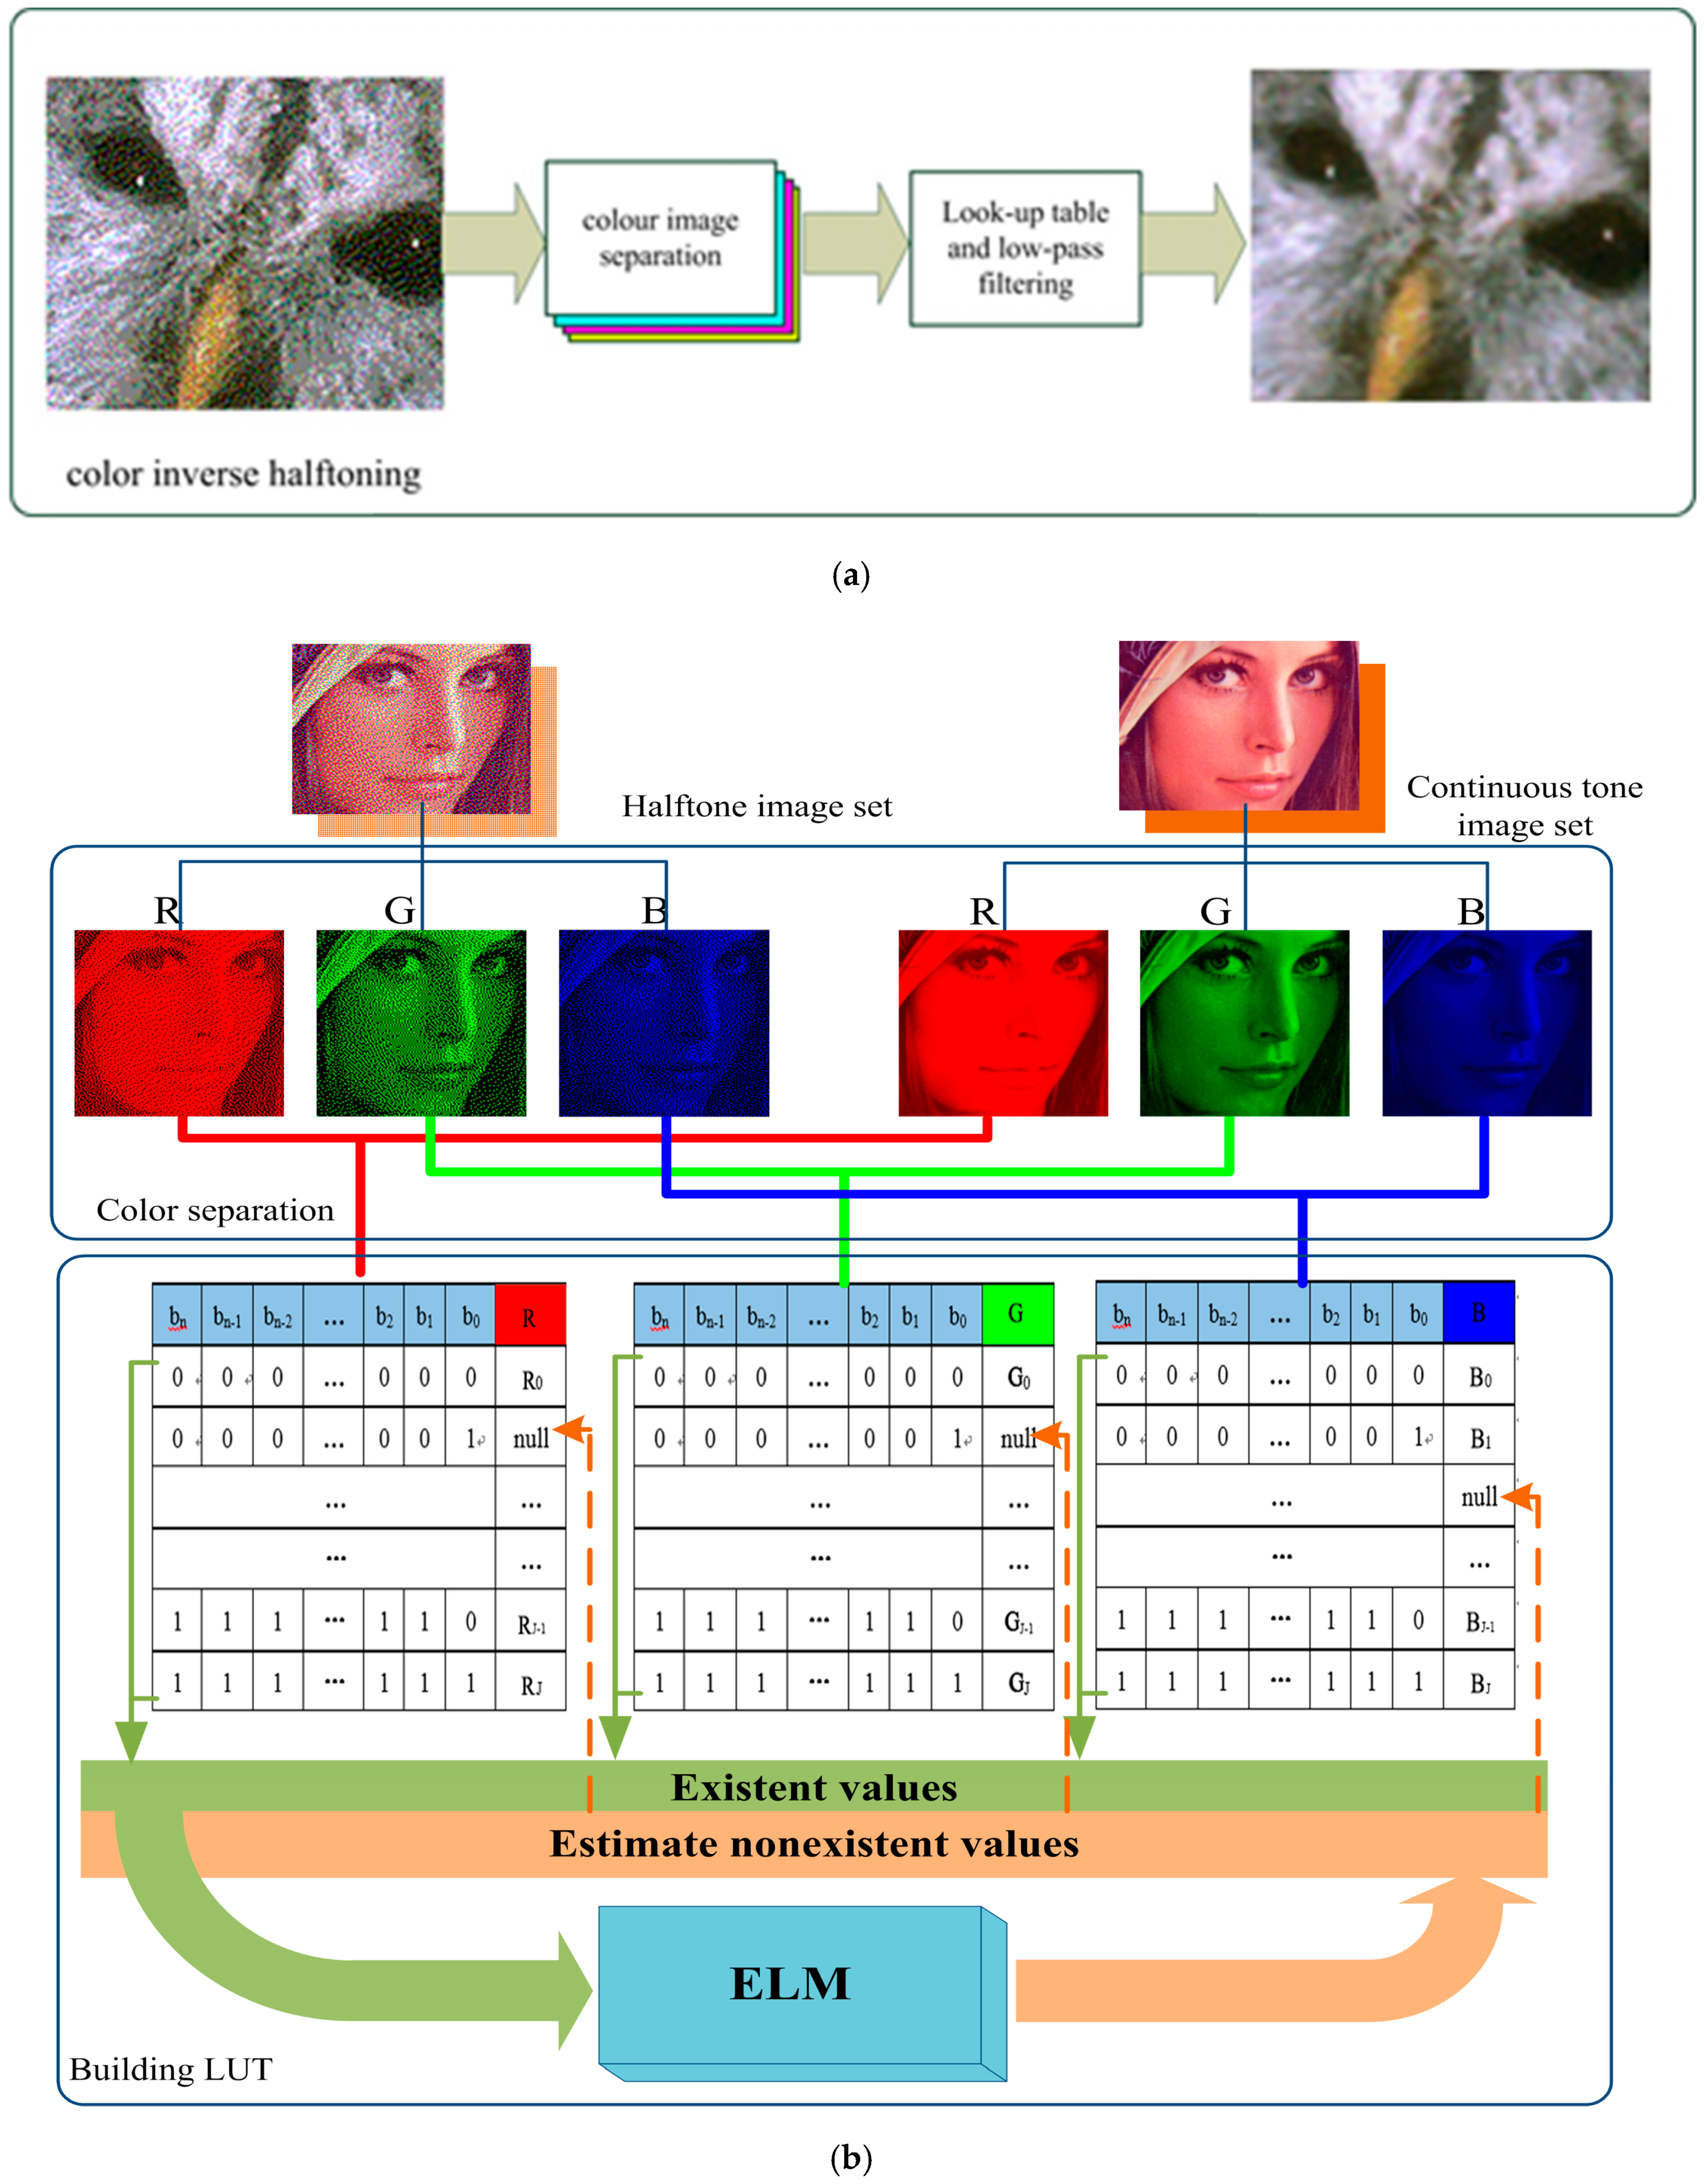
2. Overview of the Proposed Method

As the relation between the halftone pattern of color plane and the contone value of a specific color plane is a complex nonlinear, a lot of nonexistent values could not be estimated accurately in the building color LUT. In view of the same color halftone patterns corresponding to the similar values of the R, G, B planes as shown in Figure 1, we propose a novel color inverse halftoning method, which uses all common patterns to estimate the nonexistent values in the color LUT. The common pattern is defined as those halftone patterns which have the same halftone patterns in each color table, while their corresponding contone values are not empty. Figure 1 shows the overall framework of the proposed method.
As shown in Figure 1a, the first step of the color inverse halftoning is to separate a color halftone image into different color component images, such as R, G, B images, while the second step is to get the contone value from the pre-computed LUT. In order to remove the artifacts in the smooth areas of the obtained continuous image, a low-pass filter is introduced for this purpose. Figure 1b gives the generation of color LUT. In a similar way to Reference [14], we first use sample images to build an initial lookup table for each color component, and then estimate the nonexistent values using ELM.
Compared to the method in reference [14], there are two different aspects of the proposed method as shown in Figure 1b. The first is that the halftone values of all color components are used to estimate nonexistent values. For nonexistent values, we only use those items which have the same halftone patterns in each color component table where their contone values are not empty. The other is that ELM is employed to establish the relation between halftone patterns and their corresponding contone values. A discriminative feature of the proposed method is the introduction of a common pattern, because common patterns can describe the strong relation of color components.

3. Methodology

In the LUT method, the distribution of pixels in the neighborhood defined by the template is called a halftone pattern. The core task of designing LUT is to seek a contone value for each halftone pattern by using sample images. Due to a limited number of sample images, only a part of halftone patterns can obtain contone values directly, we will discuss how to acquire these patterns’ contone values in Section 3.1. For nonexistent patterns which have no contone values in any of the sample images, we will give our solution in Section 3.2.

3.1. Design of the Initial LUT

In the training phase for designing an initial LUT, the template of 19-pixels [14] is employed in this paper. According to the selected template, the halftone pattern and its contone value at any pixel can be obtained from sample images. If a halftone pattern has many different contone values, its corresponding contone value will be the mean of these contone values.
Table 1 is a case of our designed LUT using sample classic images, such as lena, baboon, parrot, etc., in which we use RGB color space. From Table 1, we can see the numbers of the existing patterns are 316579, 353271 and 330563 for R, G, B color table respectively, while about 30% of items in each color component LUT are nonexistent patterns. In addition, our statistical results show that about 45% of existing patterns in each color table have similar values. Therefore, we call these patterns common patterns which have a strong correlation between color components.

3.2. Estimation of Nonexistent Values Based on Common Patterns and ELM

In order to estimate the contone values of nonexistent patterns from the existent patterns, some methods have been proposed for this problem, such as low-pass filtering, hamming distance, and best linear estimator [14]. However, the precision of the estimated contone values will decrease with the increase of the percentage of nonexistent patterns when using these methods. Fortunately, ELM has a strong nonlinear fitting capability, which was put forward by Professor Huang in 2004 [23]. The ELM has been proved to be superior to BP (Back Propagation) and SVM (Support Vector Machine) in solving the problem of complex systems modeling with advantages of simple structure, fast learning speed, and good generalization performance, thus it is employed as a fitting model for estimating the contone values of nonexistent patterns in this paper. Besides fitting model, the correlation between color components is another problem worth considering for color inverse halftoning.
As described in Section 3.1, the common patterns have a strong correlation between color components because they have the same halftone patterns in each color table. By using these common patterns and their corresponding contone color values in the initial LUT, the ELM model is firstly trained. Then, the contone values of nonexistent patterns can be estimated based on the trained ELM. Figure 2 gives the scheme of estimating nonexistent values based on ELM.
In the process of training ELM model, common patterns with the same halftone pattern in each color plane are used as the input of ELM. The output of ELM is the continuous values of each color component corresponding to the halftone patterns in RGB plane. Since the weight between the input layer and the hidden layer can be generated randomly, the optimum solutions of ELM focus on the weights between the hidden layer and the output layer. We determine the number of hidden layers by the following experiment:
Let T = { ( x i , c i ) | x i 1 × N , c i 1 × C , i = 1 , , M } denote the set of common patterns in the initial LUT, where x i is a common pattern, c i is the contone value of a color component. Define the weight matrix between the input layer and the hidden layer as α = ( α i , j ) L × N , the bias of hidden nodes as b i , i = 1 , 2 , , L , where L is the number of hidden layer nodes. The mapping function can be recorded as h ( x ) = { G ( a 1 , b 1 , x ) , , G ( a L , b L , x ) } , where G ( a i , b i , x ) is the activation function. There are many activation functions, such as sigmoid, sin, tanh and hardlim. Among them, the sigmoid function is a classic activation function which is expressed as Equation (1)
G ( a i , b i , x ) = g ( a i x + b i ) = 1 1 + e ( a i x + b i )
According to Reference [23], the solution to the weight matrix β between the hidden layer and the output layer can be considered as the least square solution β ^ of the linear system H β = T , which can be formulated as follows:
H β ^ T = min β H β T
The solution of Equation (2) for the weight matrix β is defined in Equation (3).
β ^ = H T ( I λ + H H T ) 1 T

4. Experimental Results

Due to scarce research on color inverse halftoning in published literature, we mainly compare the proposed method with the one proposed by Mese et al. in reference [14]. The main aim of this paper is to improve the performance of the method based on LUT. To make the result reasonable, the dataset used in reference [14] is employed to build look-up tables which include thirty real-life images. In addition, we use the template of 19-pixels in reference [14] and RGB color space in the experiment. Furthermore, ten classical color images and the method based on wavelet [24] are used to evaluate the performance.

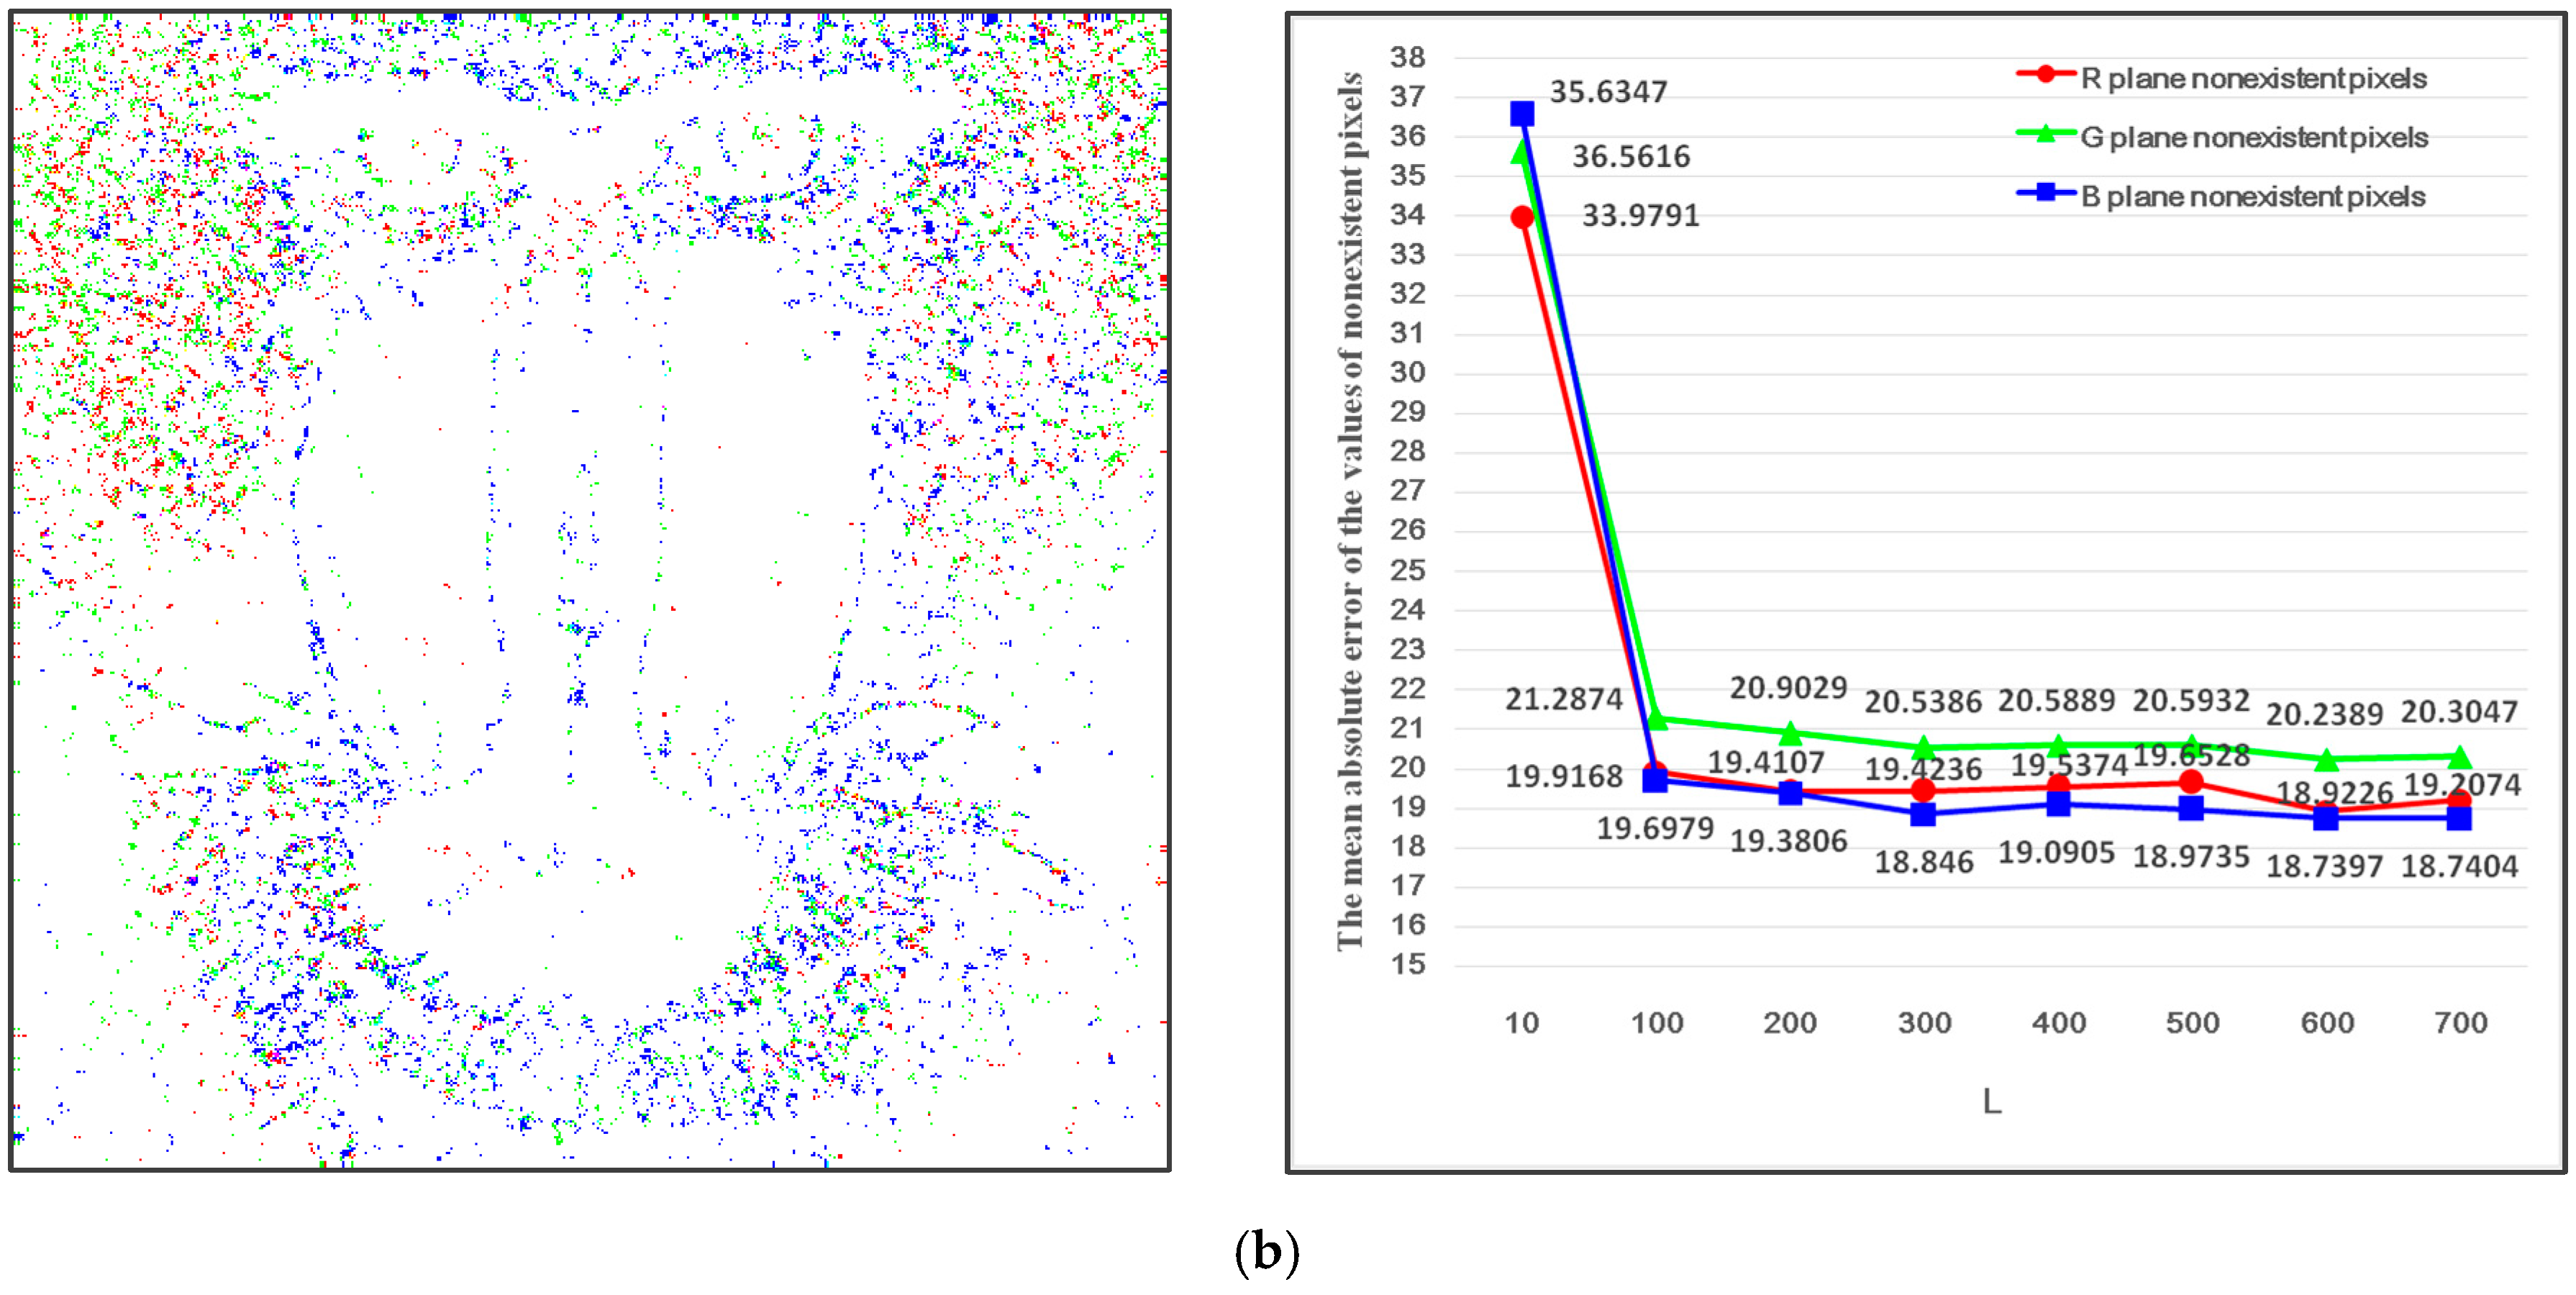
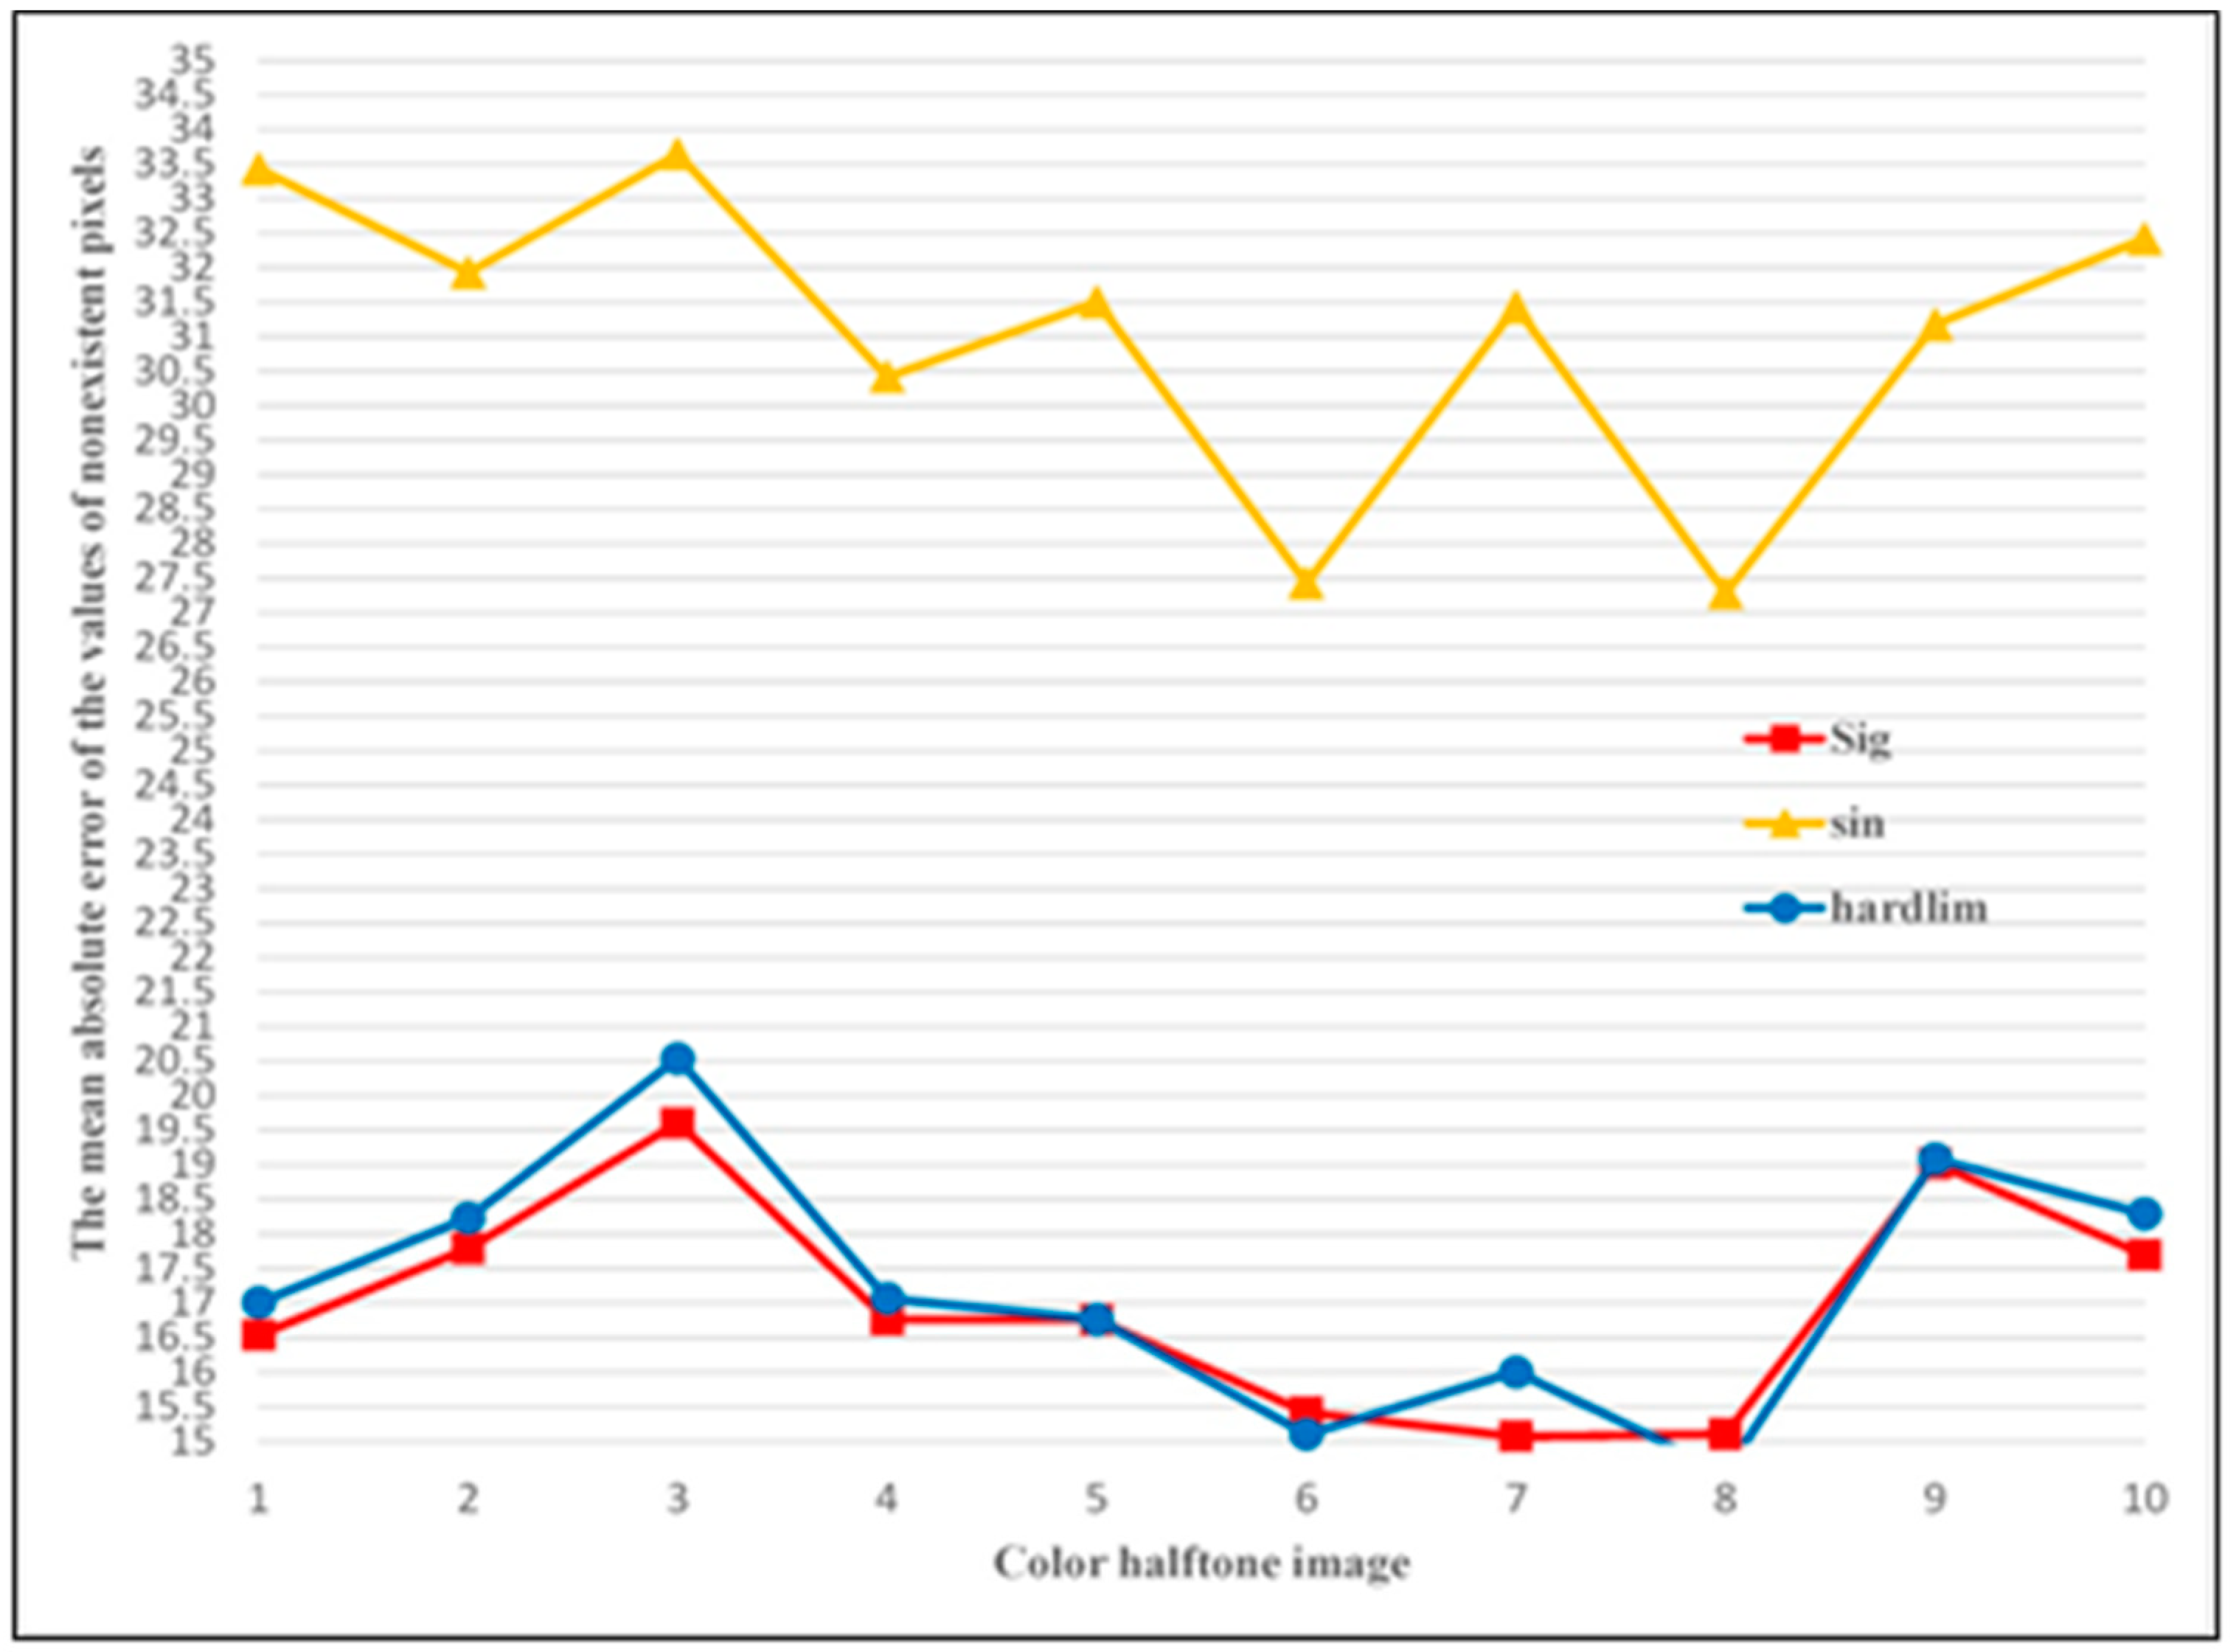
4.1. Parameters Selection for ELM

For ELM, there are two parameters that should be determined. The first one is the number of hidden neurons which is denoted by L , while the other is the activation function. To make a qualitative comparison, the mean absolute error of the values of nonexistent pixels in an image, named M A D , is defined as Equation (4).
M A D = 1 n | N _ i m g c N _ i m g p |
where n is the number of nonexistent pixels in a color component, N _ i m g c is the actual contone value of a nonexistent pixel in a continuous image, N _ i m g p is the corresponding estimated value of a nonexistent pixel.
Figure 3 illustrates the variety of M A D with L for image Lena and Baboon. From Figure 3, we can see the fitting precision of nonexistent pixels has a considerable improvement when L goes from 10 to 100, and then it increases gradually with L from 100 to 300. In the end, it starts to decrease when L is greater than 300. Thus, the number of hidden neurons is determined as 300. For the activation function, Figure 4 shows the experimental results of three common activation functions, which are sigmoid, sin, and hardlim. It is obvious that the sigmoid activation function is the best choice.

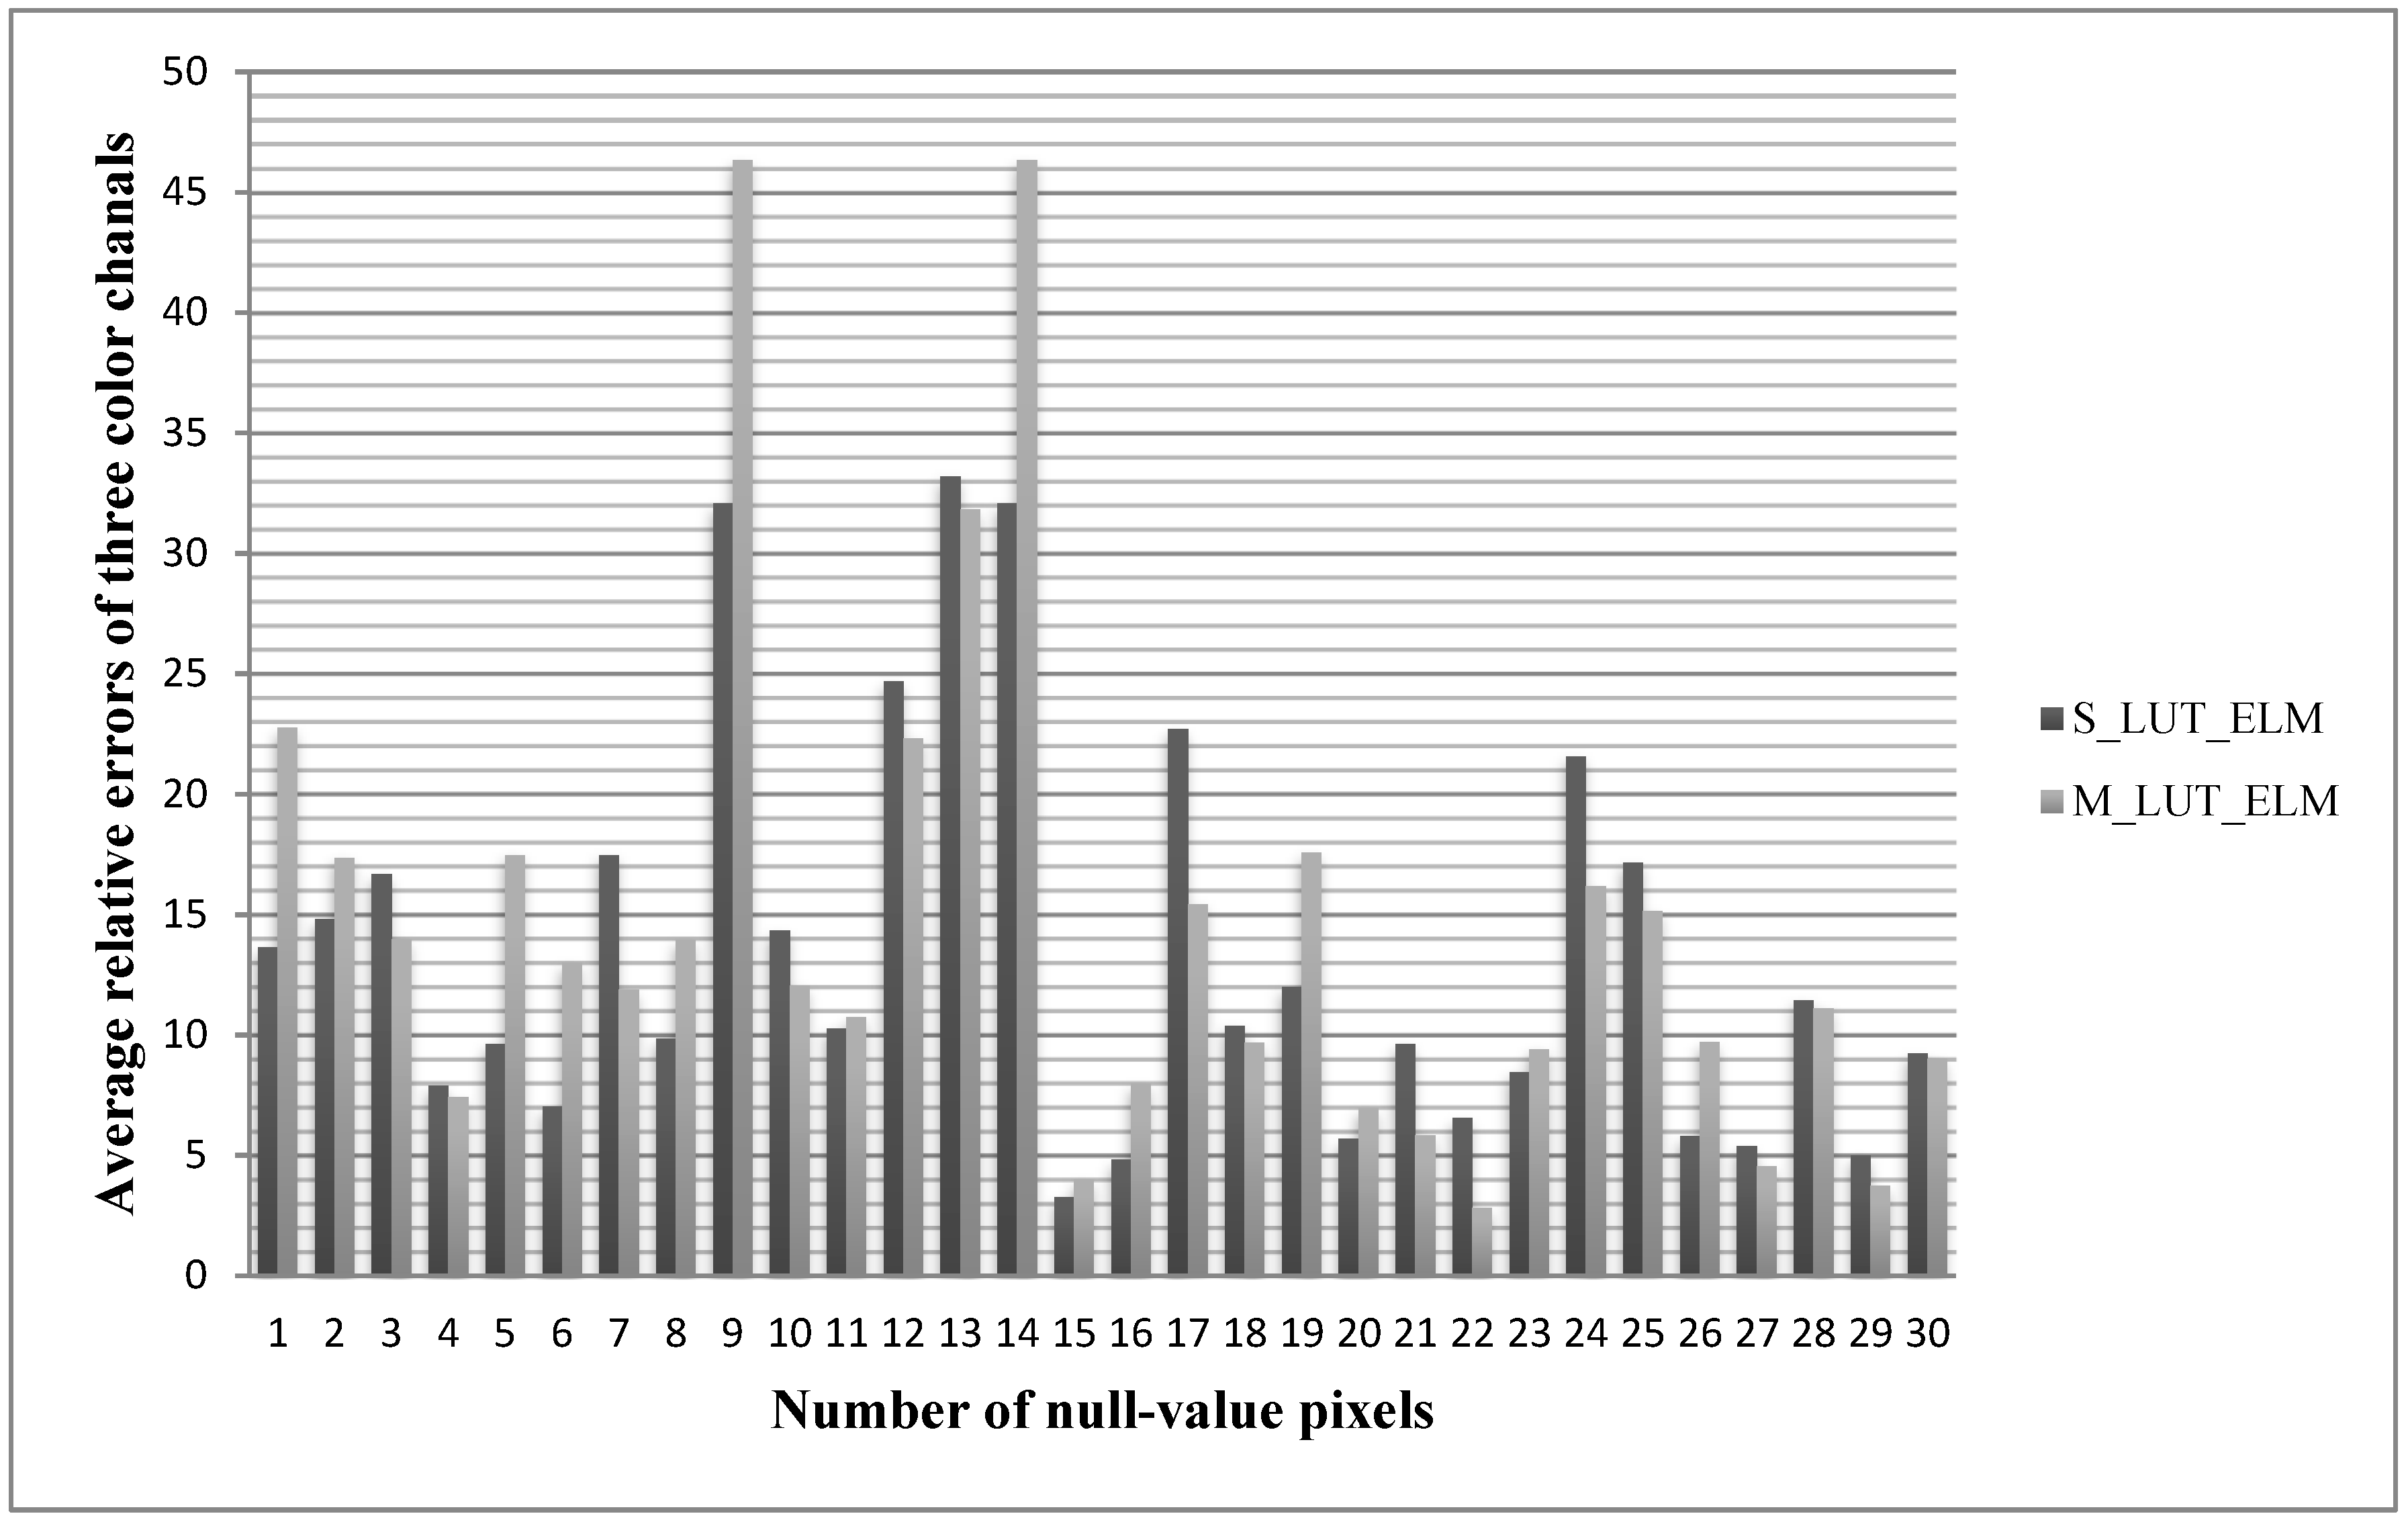
4.2. Analysis of the Estimated Values

For color LUT, the key problem is to estimate the nonexistent values. To better demonstrate the performance of the ELM regression model, the two cases are studied in the experiment. The first is to estimate the nonexistent patterns of each color table separately by using ELM model based on the information of a single look-up table, named as S_LUT_ELM. The second is to use the model of the best linear estimator which was proposed by Mese et al. in Reference [14], named as B_LIN_EST.
For convenience, our proposed method is named M_LUT_ELM. The M_LUT_ELM method not only considers the correlation of multi-color components but also employs the ELM model to estimate the nonexistent patterns. The performance is evaluated by comparing the estimated values and their actual values. Table 2 shows the experimental results, in which we only illustrate the values of R channel by randomly selecting 30 pixels with null-values. Since the results of G and B channels are similar to R channel, they are not given in Table 2.
As shown in Table 2, only 3 of the 30 pixels, whose relative error of the estimated value, are minimal by using B_LIN_EST. In contrast, there are 15 pixels with minimal relative error for the method S_LUT_ELM, and 12 pixels for the method M_LUT_ELM. These results mean the method based on ELM is more powerful than the best linear estimator. Although the performance of S_LUT_ELM is relatively higher than M_LUT_ELM for R Channel, that does not mean S_LUT_ELM is better than M_LUT_ELM. Since the reconstructed contone color values depend on three-color components, we use the average relative error of three-color components to evaluate the performance of S_LUT_ELM and M_LUT_ELM. The results are shown in Figure 5, in which the average relative error of 17 of the 30 pixels is minimal for the method M_LUT_ELM. From Figure 5, we can conclude that using multi-color channels correlation can improve the precision of the estimated values.

4.3. Comparison with State-of-the-Art Methods

To the best of our knowledge, only the method proposed by Mese et al. in References [13,14] considers the problem of multi-color components correlation. Thus, we mainly compare our proposed method with this method, named Mese’s C_LUT. For Mese’s C_LUT, the correlation of multi-color components is considered, and the best linear estimator is employed. Moreover, the method based on wavelet in reference [24] is also compared with the proposed method. The method in reference [24] is an improved method based on the method proposed by Luo [6]. In the experiment, the PSNR (Peak Signal to Noise Ratio) and SSIM (Structural Similarity Index Measurement) are used to evaluate the performance of restored continuous color images. The experimental results are listed in Table 3, which shows the PSNR and SSIM of 10 classical images restored by the proposed method and other methods. In Table 3, our method M_LUT_ELM achieves the highest value for all of the 10 images. To further remove the noise in the smooth areas of the restored image, the average filter with a radius of 3 is used. Compared to the method of M_LUT_ELM in Table 3, the performance of all but one of the 10 images has improved on PSNR and SSIM by the method of M_LUT_ELM + filter. Especially, the average PSNR and SSIM obtain the best performance compared with the other methods.
Besides the objective evaluation, we applied high-definition color images to do subjective evaluation and comparison. Figure 6 gives some reconstructed continuous-tone images by using the proposed method and the method Mese’s C_LUT. From Figure 6, we can see that the visual effect of the recovered continuous-tone images by our method is higher than that of the method Mese’s C_LUT, in which more fine details are presented, such as Baboon’s beard, Parror’s feather on the head, and Lena’s brim et al. In addition, the enlarged view of Lena’s brim is given in Figure 6c, we can see that more details are recovered, and the number of noise points is reduced in flat areas by our method.

5. Conclusions

Inverse halftoning is an image recovery problem from degraded halftone images to corresponding continuous-tone images. Due to the differences in image data value and range between continuous-tone images and their halftone versions, inverse halftoning is an ill-posed problem. To better use look-up table-based method for color inverse halftoning, the correlation between color components is exploited in this paper by using ELM. The proposed method uses all the three-color component’s information that has the same halftone pattern to estimate the nonexistent value, which can improve the fitting precision of the estimated values. Moreover, ELM is introduced as the fitting model in this paper, which has not only the ability to represent the complex nonlinear relation between a halftone pattern and its contone value but also has the fast computation speed. The experimental results show the performance of our proposed method is superior to the state-of-the-art methods. In the future work, we plan to investigate more advanced machine learning technologies, such as deep learning, for promoting the practicality and the popularization of color inverse halftoning technique.

Author Contributions

E.Z. conceived this study and wrote the manuscript. Y.Z. designed the research and the experiments. J.D. acquired the test images and performed the experiments.

Funding

This work is supported by the Key Program of Natural Science Foundation of Shaanxi Province of China under Grant No. 2017JZ020, the Project of Xi’an Science and Technology Bureau of China under Grant No. 2017080CG/RC043(XALG020), the Program of Social Science Foundation of Hebei Province of China under Grant No. HB18GL082, and the Project of Xi’an University of Technology (108-45148006).

Conflicts of Interest

The authors declare no conflicts of interest.

References

  1. Zhang, Y.; Zhang, E.; Chen, W.; Chen, Y.; Duan, J. Sparsity-based inverse halftoning via semi-coupled multi-dictionary learning and structural clustering. Eng. Appl. Artif. Intell. 2018, 72, 43–53. [Google Scholar] [CrossRef]
  2. Zhang, Y.; Zhang, E.; Chen, W. Deep neural network for halftone Image classification based on sparse auto-encoder. Eng. Appl. Artif. Intell. 2016, 50, 245–255. [Google Scholar] [CrossRef]
  3. Damera-Venkata, N.; Kite, T.; Evans, B. Fast Blind Inverse Halftoning. In Proceedings of the IEEE International Conference Image Processing, Chicago, IL, USA, 4–7 October 1998; pp. 64–68. [Google Scholar]
  4. Chen, L.; Hang, H. An adaptive inverse halftoning algorithm. IEEE Trans. Image Process. 1997, 6, 1202–1209. [Google Scholar] [CrossRef] [PubMed]
  5. Ong, Q.; Cai, J.; Gao, J. Inverse halftoning based on edge classifications and adaptive filters. Int. J. Electr. Eng. 2017, 24, 81–91. [Google Scholar]
  6. Luo, J.; Queiroz, R.; Fan, Z. A robust technique for image descreening based on the wavelet transform. IEEE Trans. Signal Process. 1998, 46, 1179–1184. [Google Scholar] [Green Version]
  7. Kite, T.; Damera-Venkata, N.; Evans, B.; Bovik, A.C. A fast high-quality inverse halftoning algorithm for error diffused halftones. IEEE Trans. Image Process. 2000, 9, 1583–1592. [Google Scholar] [CrossRef] [PubMed]
  8. Lai, J.; Yen, J. Inverse error-diffusion using classified vector quantization. IEEE Trans. Image Process. 1998, 7, 1753–1758. [Google Scholar] [CrossRef] [PubMed]
  9. Huang, W.; Su, A.; Kuo, Y. Neural network based method for image halftoning and inversehalftoning. Expert Syst. Appl. 2008, 34, 2491–2501. [Google Scholar] [CrossRef]
  10. Pelcastre, F.; Miyatake, M.; Toscano, K.; Sanchez, G.P.; Perez, H.M. An inverse halftoning algorithms based on neural networks and atomic functions. IEEE Lat. Am.Trans. 2017, 15, 488–495. [Google Scholar] [CrossRef]
  11. Son, C.; Choo, H. Local learned dictionaries optimized to edge orientation for inverse halftoning. IEEE Trans. Image Process. 2014, 23, 2542–2556. [Google Scholar] [PubMed]
  12. Son, C.; Park, H. Sparsity-based inverse halftoning. Electron. Lett. 2012, 48, 832–834. [Google Scholar] [CrossRef]
  13. Mese, M.; Vaidyanathan, P. Look-up table (LUT) method for inverse halftoning. IEEE Trans. Image Process. 2001, 10, 1566–1578. [Google Scholar] [CrossRef] [PubMed]
  14. Mese, M.; Vaidyanathan, P. Template Selection for LUT Inverse Halftoning and Application to Color Halftones. In Proceedings of the IEEE International Conference on Acoustics, Speech and Signal Processing, Istanbul, Turkey, 5–9 June 2000; pp. 2290–2293. [Google Scholar]
  15. Wen, Z.; Lu, Y.; Zeng, Z.; Zhu, W.-Q.; Ai, J.-H. Optimizing template for lookup-table inverse halftoning using elitist genetic algorithm. IEEE Signal Process. Lett. 2015, 22, 71–75. [Google Scholar] [CrossRef]
  16. Mese, M.; Vaidyanathan, P. Tree-structured method for LUT inverse halftoning and for image halftoning. IEEE Trans. Image Process. 2002, 11, 644–654. [Google Scholar] [CrossRef] [PubMed]
  17. Liaghat, A.; Rassaei, F. A Novel Algorithm for Inverse Halftoning Using LUT Approach and Pattern Labeling. In Proceedings of the IEEE Business, Engineering and Industrial Applications Colloquium, Kuala Lumpur, Malaysia, 7–8 April 2012; pp. 167–171. [Google Scholar]
  18. Kitamura, M.; Ono, F. Inverse Halftoning Method of Error Diffused Images Using Look-Up Table with State Reduction. In Proceedings of the Sixth IEEE International Symposium on Signal Processing and Information Technology, Vancouver, BC, Canada, 27–30 August 2006; pp. 890–895. [Google Scholar]
  19. Siddiqi, U.; Sait, S. Algorithm for Parallel Inverse Halftoning Using Partitioning of Look-Up Table (LUT). In Proceedings of the IEEE International Symposium on Circuits and Systems, Seattle, WA, USA, 18–21 May 2008; pp. 3554–3557. [Google Scholar]
  20. Chang, C.; Chan, C. An inverse halftoning technique using modified look-up tables. Fundamenta Informaticae 2005, 68, 207–220. [Google Scholar]
  21. Huang, Y.; Chung, K.; Dai, B. Improved inverse halftoning using vector and texture-lookup table-based learning approach. Exp. Syst. Appl. 2011, 38, 15573–15581. [Google Scholar] [CrossRef]
  22. Chung, K.; Wu, S. Inverse halftoning algorithm using edge-based lookup table approach. IEEE Trans. Image Process. 2005, 14, 1583–1587. [Google Scholar] [CrossRef] [PubMed]
  23. Huang, G.B.; Babri, H.A. Upper bounds on the number of hidden neurons in feedforward networks with arbitrary bounded nonlinear activation functions. IEEE Trans. Neural Netw. 1998, 9, 224–229. [Google Scholar] [CrossRef] [PubMed]
  24. Zhang, E.H.; Ma, H.B.; Luo, B.; Duan, J.-h. An Improved Descreening Algorithm for Color Halftone Image Based on Wavelet Decomposition. In Proceedings of the 2008 Congress on Image and Signal Processing, Sanya, China, 27–30 May 2018; pp. 242–246. [Google Scholar]
Figure 1. The framework of our proposed color inverse halftoning method by multi-color components correlation, (a) the process of inverse halftoning, (b) the creation of color look-up table (LUT).
Applsci 09 00841 g001
Figure 2. The scheme of estimating nonexistent values based extreme learning machine (ELM).
Applsci 09 00841 g002
Figure 3. The influence of neuron number in ELM algorithm on null-value approximation. (a) Lena image depicted with null-value pixels (left) and the variety of M A D with L (right); (b) Baboon image depicted with null-value pixels (left) and the variety of M A D with L (right).
Applsci 09 00841 g003aApplsci 09 00841 g003b
Figure 4. The influence of activation function in ELM algorithm on null-value approximation.
Applsci 09 00841 g004
Figure 5. Comparison of the relative error of the estimated values using two ELM methods.
Applsci 09 00841 g005
Figure 6. Inverse halftoning performance comparison with Mese’s C_LUT, M_LUT_ELM and M_LUT_ELM + filter. (a) baboon color image, (b) parrot color image, (c) Lena color image.
Applsci 09 00841 g006aApplsci 09 00841 g006b
Table 1. A case of designed LUT.
R_LUTG_LUTB_LUT
Number of existing pattern316,579353,271330,563
Number of nonexistent pattern207,709156,413173,886
Percent of nonexistent pattern (%)39.6232.6236.95
Table 2. Comparison of estimated values of null-value in R-LUT.
Number of Null-ValueActual ValueB_LIN_ESTS_LUT_ELMM_LUT_ELM
Estimated ValueRelative Error (%)Estimated ValueRelative Error (%)Estimated ValueRelative Error (%)
17662.2618.0775.530.6254.0928.83
210381.7020.6891.6810.9984.1618.29
394113.6020.85123.3431.21109.2216.19
4206188.268.61190.867.35187.329.07
598103.595.70101.273.34103.835.95
6131131.990.75133.902.21132.781.36
7144100.2630.38111.1022.8498.9231.30
8131127.972.31136.584.26132.801.37
9107104.152.66105.381.52110.152.95
10122129.065.79127.164.23123.221.00
11175195.4311.67188.317.60187.597.20
1289103.0715.81109.6123.15113.9027.98
13134149.5811.62156.0816.48146.989.68
14107104.152.66105.381.52110.152.95
1510091.298.7198.521.48105.365.36
16194199.833.00191.481.30199.502.83
17161164.862.40159.371.01162.470.91
18175183.544.88172.471.44180.012.86
197890.6516.2291.9217.8599.7227.84
20165188.5814.29176.907.21183.7211.34
21134132.441.17132.481.13131.082.18
22170173.261.92162.644.33172.791.64
23159161.571.62154.452.86157.640.86
24129157.4222.03155.1720.29148.3414.99
2510597.607.05104.940.06102.372.50
26118124.985.92121.102.63125.656.48
27190175.837.46168.2111.47175.927.41
289274.3819.1574.9418.5480.8412.13
29189190.850.98188.280.38190.921.02
30211206.242.26200.934.77206.432.17
Table 3. Performance comparison of the proposed method with other methods (PSNR/SSIM).
MethodWavelet Method [24]Mese’s C_LUTM_LUT_ELMM_LUT_ELM+Filter
Airplane25.47/0.6826.16/0.7126.40/0.7227.75/0.84
Anhinga23.15/0.6225.21/0.6525.38/0.6525.57/0.72
Baboon21.30/0.5922.04/0.6222.26/0.7221.93/0.57
Bardowl24.35/0.6525.61/0.6925.76/0.7026.16/0.71
Bluheron26.12/0.6428.23/0.6528.28/0.6529.67/0.76
Bobcat26.23/0.6227.35/0.6727.45/0.6728.29/0.74
Lena25.87/0.6027.32/0.6127.92/0.6428.75/0.76
Parrot25.64/0.5227.32/0.4627.98/0.5028.63/0.60
Peppers24.38/0.5125.18/0.5425.82/0.5927.28/0.70
Sailboat23.89/0.5625.22/0.6525.44/0.6626.11/0.72
Average24.64/0.6025.96/0.6326.27/0.6427.01/0.71

