Article

Real-World Oriented Smartphone AR Supported Learning System Based on Planetarium Contents for Seasonal Constellation Observation

1
Graduate School of Informatics, Nagoya University, Nagoya 4648601, Japan
2
OPT Inc., Tokyo 1020081, Japan
3
Astronomy Section, Nagoya City Science Museum, Nagoya 4670806, Japan
4
College of Information Science, Ritsumeikan University, Kyoto 6038577, Japan
*
Author to whom correspondence should be addressed.
Appl. Sci. 2019, 9(17), 3508; https://doi.org/10.3390/app9173508
Submission received: 30 June 2019 / Revised: 3 August 2019 / Accepted: 12 August 2019 / Published: 26 August 2019
(This article belongs to the Special Issue Augmented Reality: Current Trends, Challenges and Prospects)

Abstract

:
A popular astronomical concept covered by projection learning programs in the planetarium is seasonal constellation. However, a planetarium’s learning environment is limited to virtual scenes, where learners can observe seasonal constellations, but there is a significant difference between reality and the learners’ imagination regarding constellations. It is important to create a real-world oriented observation learning environment for observing seasonal constellations. Augmented reality has proved to be a powerful tool for astronomical observation learning. In this paper, augmented reality (AR) contents and 2D contents are used to develop a smartphone-based learning system called the Real-World Oriented Smartphone AR Learning System (R-WOSARLS) for seasonal constellation observation, which is based on the planetarium contents of the planetarium of the Nagoya City Science Museum, for seasonal constellation learning. Two experiments were conducted to evaluate the usefulness, usability, and learner satisfaction of our system in university and junior high school, respectively. The results show that R-WOSARLS is an effective learning tool for constellation observation and learning, and it enhances learners’ motivation to pursue seasonal constellation learning. Moreover, R-WOSARLS could be a teaching tool not only to help students learn more than with traditional instruction, but also to stimulate their interest in astronomical phenomena outside of school.

1. Introduction

The planetarium is a useful tool for people to learn about the night sky and astronomy concepts through a projection learning program [1]. The projection learning program involves curators making a variety of astronomical phenomena themes and popular stars-of-the-day learning contents that are projected onto the planetarium’s screen for visitors. Seasonal Constellations are one of the vital astronomy concepts that people see in their daily life. “Seasonal constellation” is an astronomical term that refers to the constellations that are best observed during a particular period (or season). For example, in Japan, Leo can be observed easily in the southern part from 8:00 p.m. to 10:00 p.m. It is one of the popular astronomical concepts covered by projection learning programs in the planetarium of the Nagoya City Science Museum [2]. Valuable and interesting information about constellations is shown and explained in an easy-to-understand format in these learning programs. However, the teaching conducted in a planetarium is still restricted to virtual environment scenes and lacks interaction with a real astronomical environment. Thus, the knowledge that learners gain is still entirely derived from their virtual learning experiences. When visitors finish their trip to the planetarium, they may quickly forget the astronomy knowledge and skills obtained in the planetarium, which results in difficulties in real-world astronomy observations [3]. This lack of real-world learning prevents learners from effectively understanding the celestial bodies’ movement and position in the actual sky [4]. Furthermore, the planetarium curator indicated that the observation of real celestial bodies is an essential element for learning astronomy, and they anticipate that the learning experience obtained in the planetarium can be applied to actual astronomy observation as well as being accessible by the public. Moreover, astronomical learners can grasp the real target objects as well as see these celestial objects or astronomical phenomena in an actual world environment with the surrounding scenery and conditions as essential elements [5]. Thus, observing real astronomical objects and phenomena to learn science is optimal.
However, naked eye observation of constellations in the starry sky is not easy since it is often limited due to time, geography, and weather conditions. Moreover, it is not easy for learners to identify the invisible constellations in the starry sky compared to the Sun or Moon. Research has been conducted to study the development and usefulness of educational materials for constellation learning using several approaches. Mouri et al. [6] developed a web system for locating constellations in the starry sky based on the planisphere in a planetarium. However, learners who were taught in this learning environment still had a gap between real constellations in the sky and what they learned. For example, learners have no clear visual feeling of the elevation angle of constellations in the starry sky, even if they were provided the elevation angle information of a constellation. Kondo et al. [3] utilized curator knowledge to develop a learning environment for learners to study and observe real constellations, such as how to identify stars or constellations in the sky with body scale guidance. However, this observation method is still limited by geography, weather, and time.
With the rapid development of information and communication technologies (ICT), a ubiquitous learning environment has appeared through high-efficiency mobile phones. Under a ubiquitous learning environment, leaners could overcome time and geography limitations to study [7,8,9]. The pervasiveness of smartphone devices, such as iPhones and Android phones that are equipped with a number of sensors such as accelerometer, ambient light sensor, GPS, compass with microphone, camera and so on, has given rise to a new development of the the context-aware ubiquitous learning environment [10,11]. This can provide learners with a learning service using sensors to ascertain that learner’s environment. In recent years, another new technology that has gained a lot of attention in the education field is Augmented Reality (AR).
AR can be defined as an interactive technology that combines real and virtual information in any location-specific way [12]. Recently, a wide variety of fields have been using the AR technology, as it can effectively demonstrate the temporal concepts, contextual relationships, and spatial concepts between real and virtual information in the interactive environment. The benefits of using AR include the fact that virtual objects in AR view can be showed and can respond interactively to user actions, and that the virtual information or objects in AR view can overcome the limitations of location, time, and any other environment restrictions that can apply to real objects. Due to these merits, AR is becoming an effective educational technology [13]. Nowadays, most smartphones and tablets that have been equipped with GPS, compass, accelerometer, onboard sensors, etc. could assist the ideal indoor and the outside environment for AR experiences. Despite the limitations of GPS-based learning environments, for example, the fact that, sometimes, GPS accuracy is not good in the building compared to the outdoor environment, these smartphone platforms have been used by researchers and commercial developers to develop a number of effective educational systems [14]. Because of the above advantages of AR, smartphone AR is a powerful tool for astronomical phenomena observation learning, such as the lunar phase [15,16], solar movement [17,18], and stars [4,19]. Moreover, in the app store and Google Play, there are a number of AR astronomy apps for observing stars that can be used in the outdoors, for example, Sky Map [20] and Star Walk [21] are very popular applications for astronomical learning. These applications identify the astronomical bodies, such as constellations, using the GPS and other sensors in the smartphone devices. However, these astronomical apps are not developed for teaching learners about seasonal constellations and they are unable to reach the educational goals of science regarding constellations in the planetarium and school. For example, there is no function to assist learners to observe and learn about seasonal constellations, such as the spring triangle. Secondly, there is no function for learners to understand the mechanisms of seasonal constellation. Finally, there are no suitable instructional strategies to specifically enable learners to engage actively in seasonal constellation observations with these applications.
Refs. [15,17] have developed a smartphone AR learning system for observing the lunar phase and solar movements based on the planetarium education method in the Nagoya City Science Museum. The experiment showed that two systems could assist learners in obtaining the benefits of a planetarium learning experience while also enjoying the benefits of directly observing actual astronomical phenomena. In order to solve these issues about seasonal constellation observation mentioned above, in this paper, we make use of smartphone device-based AR contents and 2D contents to develop a mobile learning system called the Real-World Oriented Smartphone AR Learning System (R-WOSARLS) for seasonal constellation observation based on planetarium contents, which can be applied to real constellation observations.

2. Real-World Oriented Smartphone AR Learning System

This section describes the planetarium contents for the seasonal constellation, the system design, and the system functionality.

2.1. Learning Goal for the Seasonal Constellation in the Planetarium

We proposed a mobile learning system for supporting seasonal constellation observation in a real-world environment. We designed the functions of the learning system are based on the planetarium contents regarding constellations from its projection learning program. The following contents are included on the topic of the seasonal constellation in the planetarium.
(1)
Observe constellation (Leo, Scorpius, Aquila, Pegasus, Orion) to determine its azimuth and altitude in the real sky. The projector in the planetarium simulates the actual sky above the horizon on the dome. There are grid lines of latitude and longitude in the dome, as shown in Figure 1. There are four notations: east, west, north, and south that indicate the direction in the dome is pointing towards in the real world environment. These four notations that combine with the latitude and longitude line in the dome can assist learners in observing and locating the azimuth and elevation angle of planets and stars while curators teach astronomical concepts with dome projection.
(2)
Search and locate typical seasonal constellation (Leo, Scorpius, Aquila, Pegasus, Orion) with body scale guidance in the starry sky. In planetarium learning, curators utilize the body scale image method such as hand to demonstrate how to measure the elevation angle of stars above the horizon for visitors, as shown in Figure 1. After visitors go outside to observe stars, they can use the same method to search for their target stars or constellations in the starry sky. Anyone can use the body scale method to search for targeted stars or planets while observing stars in the night sky.
(3)
Observe spring constellations, summer constellations, autumn constellations and winter constellations, spring triangle, the summer triangle, autumn quadrangle, and winter triangle in the south starry sky as shown in Figure 2. The triangle consists of three of the brightest stars in the spring starry sky, each the brightest star in its own constellation. The same as the quadrangle consists of four of the brightest stars in the starry sky, each the brightest star in its own constellation. As shown in Figure 2, the spring triangle consists of the Denebola star in Leo constellation, Arcturus stars in Boötes constellation, and Spica star in Virgo constellation.
(4)
Observe typical season constellations (Leo, Scorpius, Aquila, Pegasus, Orion) diurnal motion orbit over one day, as shown in Figure 3.
(5)
From the outside of earth viewpoint, namely universe viewpoint to obtain the mechanism of seasonal constellations.

2.2. System Functionality

The system aims to assist learners in observing seasonal constellations in the south bright sky and achieving the specified learning goals regarding constellations under planetarium learning. The functions of the systems were developed based on the planetarium interface and content as shown in Figure 1, Figure 2 and Figure 3, created by the Nagoya City Science Museum’s planetarium curator. In order to achieve the learning goals of constellation observation in the planetarium, the following system functions were developed to facilitate a real-world oriented learning environment.
(a)
The azimuth and altitude of seasonal constellations in the starry sky can be identified with grid lines of latitude and longitude in AR view.
(b)
The seasonal constellations (Leo, Scorpius, Aquila, Pegasus, Orion) can be located with images of hands through the “Search” function in the AR view.
(c)
Spring stars, spring constellations triangle, summer constellations, summer constellations triangle, autumn constellations, autumn constellations quadrangle, winter constellations, and winter constellations triangle in the south starry sky can be observed through the season constellations interface in AR view.
(d)
Typical seasonal constellations (Leo, Scorpius, Aquila, Pegasus, and Orion) diurnal motion can be observed through the “OneDay” functions in AR view.
(e)
The mechanism of the seasonal constellation can be obtained using the “Universe View” function.
Among these functions, learning goal (1) could be achieved by function (a), learning goal (2) could be achieved by the function (b), learning goal (3) could be achieved by the functions (a), (b), (c), achieve learning goal (4) could be achieved by the function (d) and learning goal (5) could be achieved by the function (e).

2.3. AR View Interface

In our mobile learning system, the virtual stars images are overlaid on a live video camera background that makes the virtual stars appear in the real world environment. In order to visualize the stars correctly in the AR view, it is required to obtain real-time data including location, date, time, azimuth et al. from the smartphone by the built-in sensors. These real-time data are combined with the proposed astronomy simulation model [6,7] to calculate the real-time screen coordinates of the visual stars in the smartphone AR view, which make sure it is correctly registered to the real sky.
Figure 4 shows the procedure for obtaining the screen coordinates of the stars in the smartphone AR view and firstly obtaining the real-time date and time from the calendar of the smartphone device to calculate the Sidereal Time (ST) and Modified Julian Day (MJD). Secondly, the real location’s longitude and latitude are obtained by the GPS sensor in the smartphone, which is responsible for tracking the geographical position of the device. This is combined with the astronomical horizontal coordinates algorithm (ALG-1), and the stars’ right ascension (RA) and declination (DEC) data to compute the azimuth and elevation of the stars in real time. The azimuth and elevation data are the horizontal coordinates of the stars. The data are used to compute the screen coordinates of the stars and register them in the AR view that corresponds to their location in the sky. Thirdly, the magnetic and accelerometer sensors in the smartphone are utilized to compute the viewing direction and elevation angle of the device that the learners are using to observe the stars. Fourthly, the screen projection algorithm (ALG-2) is used to convert the horizontal coordinates to screen coordinates to locate the stars in the AR view based on the previous tracing information. Finally, the virtual star objects are appropriately displayed in the smartphone AR view to map the stars or constellations from real life.
We have developed the R-WOSARLS on the Google Android platform with the Eclipse toolset editor, ADT, and the Android Software Development Kit (SDK). Java is the primary programming language. Our learning application is supported by a range of smartphone and tablet devices that are compatible with Android 2.1 or higher, and have the required camera and sensors (i.e., GPS, accelerometer et al.). The R-WOSARLS is implemented on the Samsung Android smartphone devices.
Figure 5 (left) shows the entire AR view interface of the R-WOSARLS. The orientation, angle of elevation of the smartphone device, the GPS location, date, and time information are displayed in the data section in the upper left of the device. Learners could locate and observe the constellation with the help of the horizon line, latitude, and longitude lines in the AR view.
An interactive interface was developed to recreate the planetarium interfaces regarding seasonal constellations. There are spring constellations, spring triangles, summer constellations, summer triangles, autumn constellations, autumn quadrangles, and winter constellations, and winter triangle options. Learners can choose any season, and the related seasonal constellation starry sky will be shown in the AR view interface, as shown in Figure 6. In addition, constellations in the AR view can be located with the hand images. For example, after learners choose one seasonal constellation, for example, Leo, and click the “Search” button, the hand images will guide the learners to find the Leo constellation in AR view, as shown in Figure 5 (right). The “OneDay” function in the AR view interface assists learners to observe the motion orbit of typical seasonal constellations in the starry sky during the day. For example, learners will need only a few minutes to see the Leo constellation motion during the day and observe Leo rising in the east and setting in the west, as seen in Figure 7; this function assists learners to reach their relevant learning goals efficiently (4). Through the AR view function, learners can reach their constellation learning goals within the scope of science education. Furthermore, frequent use of the R-WOSARLS will allow learners to recreate the visual feel of the azimuth and elevation angle of the constellations in the actual sky.

2.4. Universe View Interface

In different seasons, learners can observe different seasonal constellations in the south bright sky. For example, in spring, people can view the Leo constellation clearly in the south starry sky. On the other hand, in winter, people can view the Orion constellation in the same south starry sky. Learners observing the constellations often wonder what causes the different seasonal constellations. The best way to understand the seasonal constellation mechanisms is to examine an Earth–constellation–Sun view.
A straightforward universe viewpoint interface was developed in order to allow learners to study the seasonal constellation mechanisms more easily. When the users touched the “Universe View” button, they were presented with the “Universe View” interface, as shown in Figure 8 (right).
Learners can see that the constellations of the south starry sky differ across the spring, summer, autumn, and winter seasons due to the Earth’s rotation. The Earth is revolving around the Sun as illustrated by Figure 8 (right), which takes one year to complete. Over the year, the seasons change from spring to summer, autumn, and winter. Therefore, there are the four key stages times of the Earth’s revolution in orbit, which are vernal equinox, summer solstice, autumn equinox, and winter solstice based on the universe’s viewpoint.
Moreover, in each key stage, there are typical seasonal constellations, which are Leo (Spring), Scorpius (summer), Pegasus (autumn), and Orion (winter). Learners could understand the position and relationship between the Earth and seasonal constellations with regards to orbit using the universe view interface. Learners observe the relationship between the Earth’s revolutions, for which learners can use the ‘increase’ and ‘reduce’ buttons to make the Earth revolve around the Sun. In order to help learners obtain the mechanism of seasonal constellations in the south starry sky, each stage provides image and text materials to explain this mechanism, based on the viewpoint of the observer. For example, when cycling through the spring season’s observation view, image materials about the mechanism of spring seasonal constellations will be displayed, as shown in Figure 9 (right). The “Universe View” function meets the requirement of the stated learning environment specification (e) that improves the learners’ knowledge regarding the mechanism of seasonal constellations in the starry sky.

3. Instruction Strategies in R-WOSARLS

Although there are about five specific learning environments have been created, how to effectively use them for constellation observation, and how to stimulate learners to take more active roles in constellation observation are crucial factors. The participants in the experiment are required to do a series of constellation observational tasks through the system. In the system, there is a task interface for learners to obtain the contents of each task. There were some tasks to perform in the experiment that are based on the aforementioned learning goals of constellation observation. These contents of the task are created based on learning the goal of each level of learners. The content of the task was created based on the goal of each level of learners. The detailed tasks are listed below.
task1: Participants firstly point out the direction of North, East, South, and West, based on their physical location in the real world. Then, they use the system to confirm their guesses on the directions and observed zeniths above and below the horizon.
task2: Participants firstly guess the azimuth and elevation angle of the seasonal constellation (Leo–spring, Scorpius–summer, Aquila–summer, Pegasus–autumn, Orion–winter) without the system. Following this, learners use latitude and longitude lines in the AR view interface of the system to search for the targeted constellation and observe the azimuth and elevation angle of that constellation in the real sky.
task3: Participants search for the targeted seasonal constellation with the search function. Learners carefully view the images of hand animations in the AR view. Then, they search for the target constellation in the starry sky using their hands without the system.
task4: Participants firstly guess the one-day orbit movement of a seasonal constellation and use their one finger to paint the line orbit of a one-day seasonal constellation orbit in the real sky. In order to confirm if their drawing line is right or not, learners could experience the one-day seasonal constellation orbit in the AR view by the “OneDay” function.
task5: Participants chose a specific seasonal constellation for this task. Based on their astronomy knowledge, they guess the season triangle or quadrangle consisting of constellation names and use their fingers to show the position of the seasonal triangle in the southern sky. In order to confirm their guesses and drawings, participants use the “DisplaySeasonConstellationStarry” function to observe the targeted season constellation triangle in AR view.
task6: Participants firstly guess the relationship between the Sun, Earth, and the constellation, and followed this by explaining the mechanism of seasonal constellations. Then, they click the universe view button to enter into the “Universe View” interface to confirm their answers.

4. Experiments and Evaluation

In order to evaluate the usefulness, usability, and learners’ satisfaction of the system, several surveys and experiments have been conducted at the university and junior high school levels. The evaluation tools include questionnaires, pre-test, post-test and interview.

4.1. Experiment in University

4.1.1. Experiment Design

The experiment was conducted to investigate the usefulness, usability and of the R-WOSARLS system and learners’ satisfactory of R-WOSARLS. There are 12 participants that were university students and their majors were unrelated to astronomy, but they were confirmed as having an interest in observing seasonal constellations, and they often go to the planetarium for experiencing astronomical phenomena. The participants are requested to complete a number of constellation observational tasks during different times of the day. Example experiment scenes are shown in Figure 10.
Once each task has been completed, a question about the system is provided to the participants in order to assess the usefulness of the R-WOSARLS corresponding to the task. After the participants have completed all six tasks and the relevant questions regarding the usefulness of the R-WOSARLS system, participants are given six questions about its usability and their overall satisfaction. These questions are listed below.
The questionnaire items about the usefulness of R-WOSARLS are listed as below:
Q1:
The latitude and longitude grid lines in the AR view interface are useful to observe and understand the azimuth and elevation angle of a typical seasonal constellation in the sky in real time.
Q2:
The body scale (hand) search function in the R-WOSARLS is helpful to search for the targeted constellation in the real sky.
Q3:
The function of “OneDay” in the R-WOSARLS is helpful to observe the movement of a one-day orbit of the typical seasonal constellation in the sky.
Q4:
The function of “DisplaySeasonConstellationStarry” in the system is helpful to observe and study the spring constellations, summer constellations, autumn constellations, and winter constellations, as well as spring triangle, summer triangle, autumn quadrangle, and winter triangle in the south starry sky.
Q5:
The function of “Universe View” in the system is helpful to understand the relationship of the Sun–Earth–seasonal constellation, and the mechanism of a typical seasonal constellation in different seasons from the universe’s viewpoint.
Questionnaire items about the usability and leaners’ satisfaction of the R-WOSARLS are listed as below:
Q6:
The operation of R-WOSARLS is easy for me.
Q7:
The interface of R-WOSARLS is clear and easy for me to understand.
Q8:
When I am operating the system, the response time of the system is short.
Q9:
Using the R-WOSARLS to observe seasonal constellations is interesting.
Q10:
The R-WOSARLS can help me enhance my motivation for observing seasonal constellations.
Q11:
In the future, I have the intention to use the same kind of system for astronomy learning.

4.1.2. Discussion and Results

Figure 11 is the result of the survey about the usefulness of the R-WOSARLS during the task stage experiment. For the questionnaire item Q1, the mean value is 4.08, showing that the learners agreed that the latitude and longitude lines in AR view are useful for observing and understanding the azimuth and elevation angle of the constellation in the sky. During task 2, participants were asked to guess the azimuth and elevation angle of the targeted constellation, where only one answer was right, but most of the participants said that they did not know about the azimuth and elevation angle of the constellation, as they found it was challenging to view the constellation compared to the Sun and Moon during daytime. During task 2, searching for the targeted constellation in the AR view was time-consuming and made participants locate the targeted constellation with body scale (hand) image guidance. Almost all of the participants agreed that the body scale method was useful and more convenient to search for the targeted constellation. They would like to practice searching for the targeted constellation in the sky with their hands without the system. All of the participants in the experiment said that they had an intuitive feeling regarding the elevation angle of hands through using the system, which is something they can easily use to locate stars or constellations in the real starry sky. This is clear from the mean of 4.33 for Q2. Participants confirmed that the “OneDay” function in the AR view interface was very helpful in observing the targeted constellations one-day orbit in the sky (Q3). The mean of Q4 was 4.58, proving that the participants greatly agreed that the “DisplaySeasonConstellationStarry” function in the AR view interface is useful in observing and studying the seasonal constellation across different seasons. The Q1, Q2, Q3, and Q4 questionnaire items about the usefulness of the AR view interface had a mean above 4.00, which indicated that the AR view is very useful for learners to observe and study the seasonal constellations, and provided a visual real-world learning experience, as it is not often convenient for people to look for constellations in the starry sky due to light pollution, geography or other factors. However, the mean of Q5 regarding universe view interface was only 3.50, which is much lower than the value of questions items regarding aforementioned AR view function since most participants considered that it was better to use a more intuitive interface and have more content to assist users in understanding the mechanisms of seasonal constellations.
Regarding the interface design of R-WOSARLS, most of the learners considered that the R-WOSARLS was easy to operate, and the mean value of Q6 is 3.75, as shown in Figure 12. In addition, the result of Q8 (4.25) showed that the learners agreed that the response time when operating the system was brief, which helps the users operate the system and complete their observational task. However, participants reported that sometimes the interface was not clear or easy for the learners to understand when they were doing tasks, with a mean value of only 3.42 for Q7. Based on the report of the interview from the participants, it is suggested that some parts of a system interface should be improved, such as the size of the text should be larger and that a different set of text colors could make the interface easier to use.
It was found that this system helped users enhance their motivation regarding seasonal constellations (Q10), as shown in Figure 12. Eight participants had limited knowledge about constellations. After they used the system to complete observational tasks, participants’ knowledge on seasonal constellations was improved, and they thought the system was very interesting, with a mean value of 4.25 for Q9. In addition, the participants agreed that they have the intention to use the same kind of AR learning system to observe other astronomy phenomena in the future. Moreover, the participants were satisfied with the R-WOSARLS and thought that such an AR-based learning system could enhance their interest in astronomy learning.
The questionnaire asked the participants to state their comments or advice on the proposed R-WOSARLS system without restraint. One participant suggested that it was better to have explanatory contents regarding the specified targeted constellation from the curator while the learners were observing a constellation. Other participants pointed out that if there were a function in the system to recommend a seasonal constellation every day for learners, then this would be invaluable. Three participants mentioned that a multi-language label of the constellation name should be included in the system. One user reported that the size and color of the seasonal constellation triangle or quadrangle should be different from other constellations.
Based on this experiment, it can be concluded that the proposed R-WOSARLS is very helpful for university students to study and observe seasonal constellations in a real-world environment.

4.2. Experiment in Junior High School

4.2.1. Experiment Design

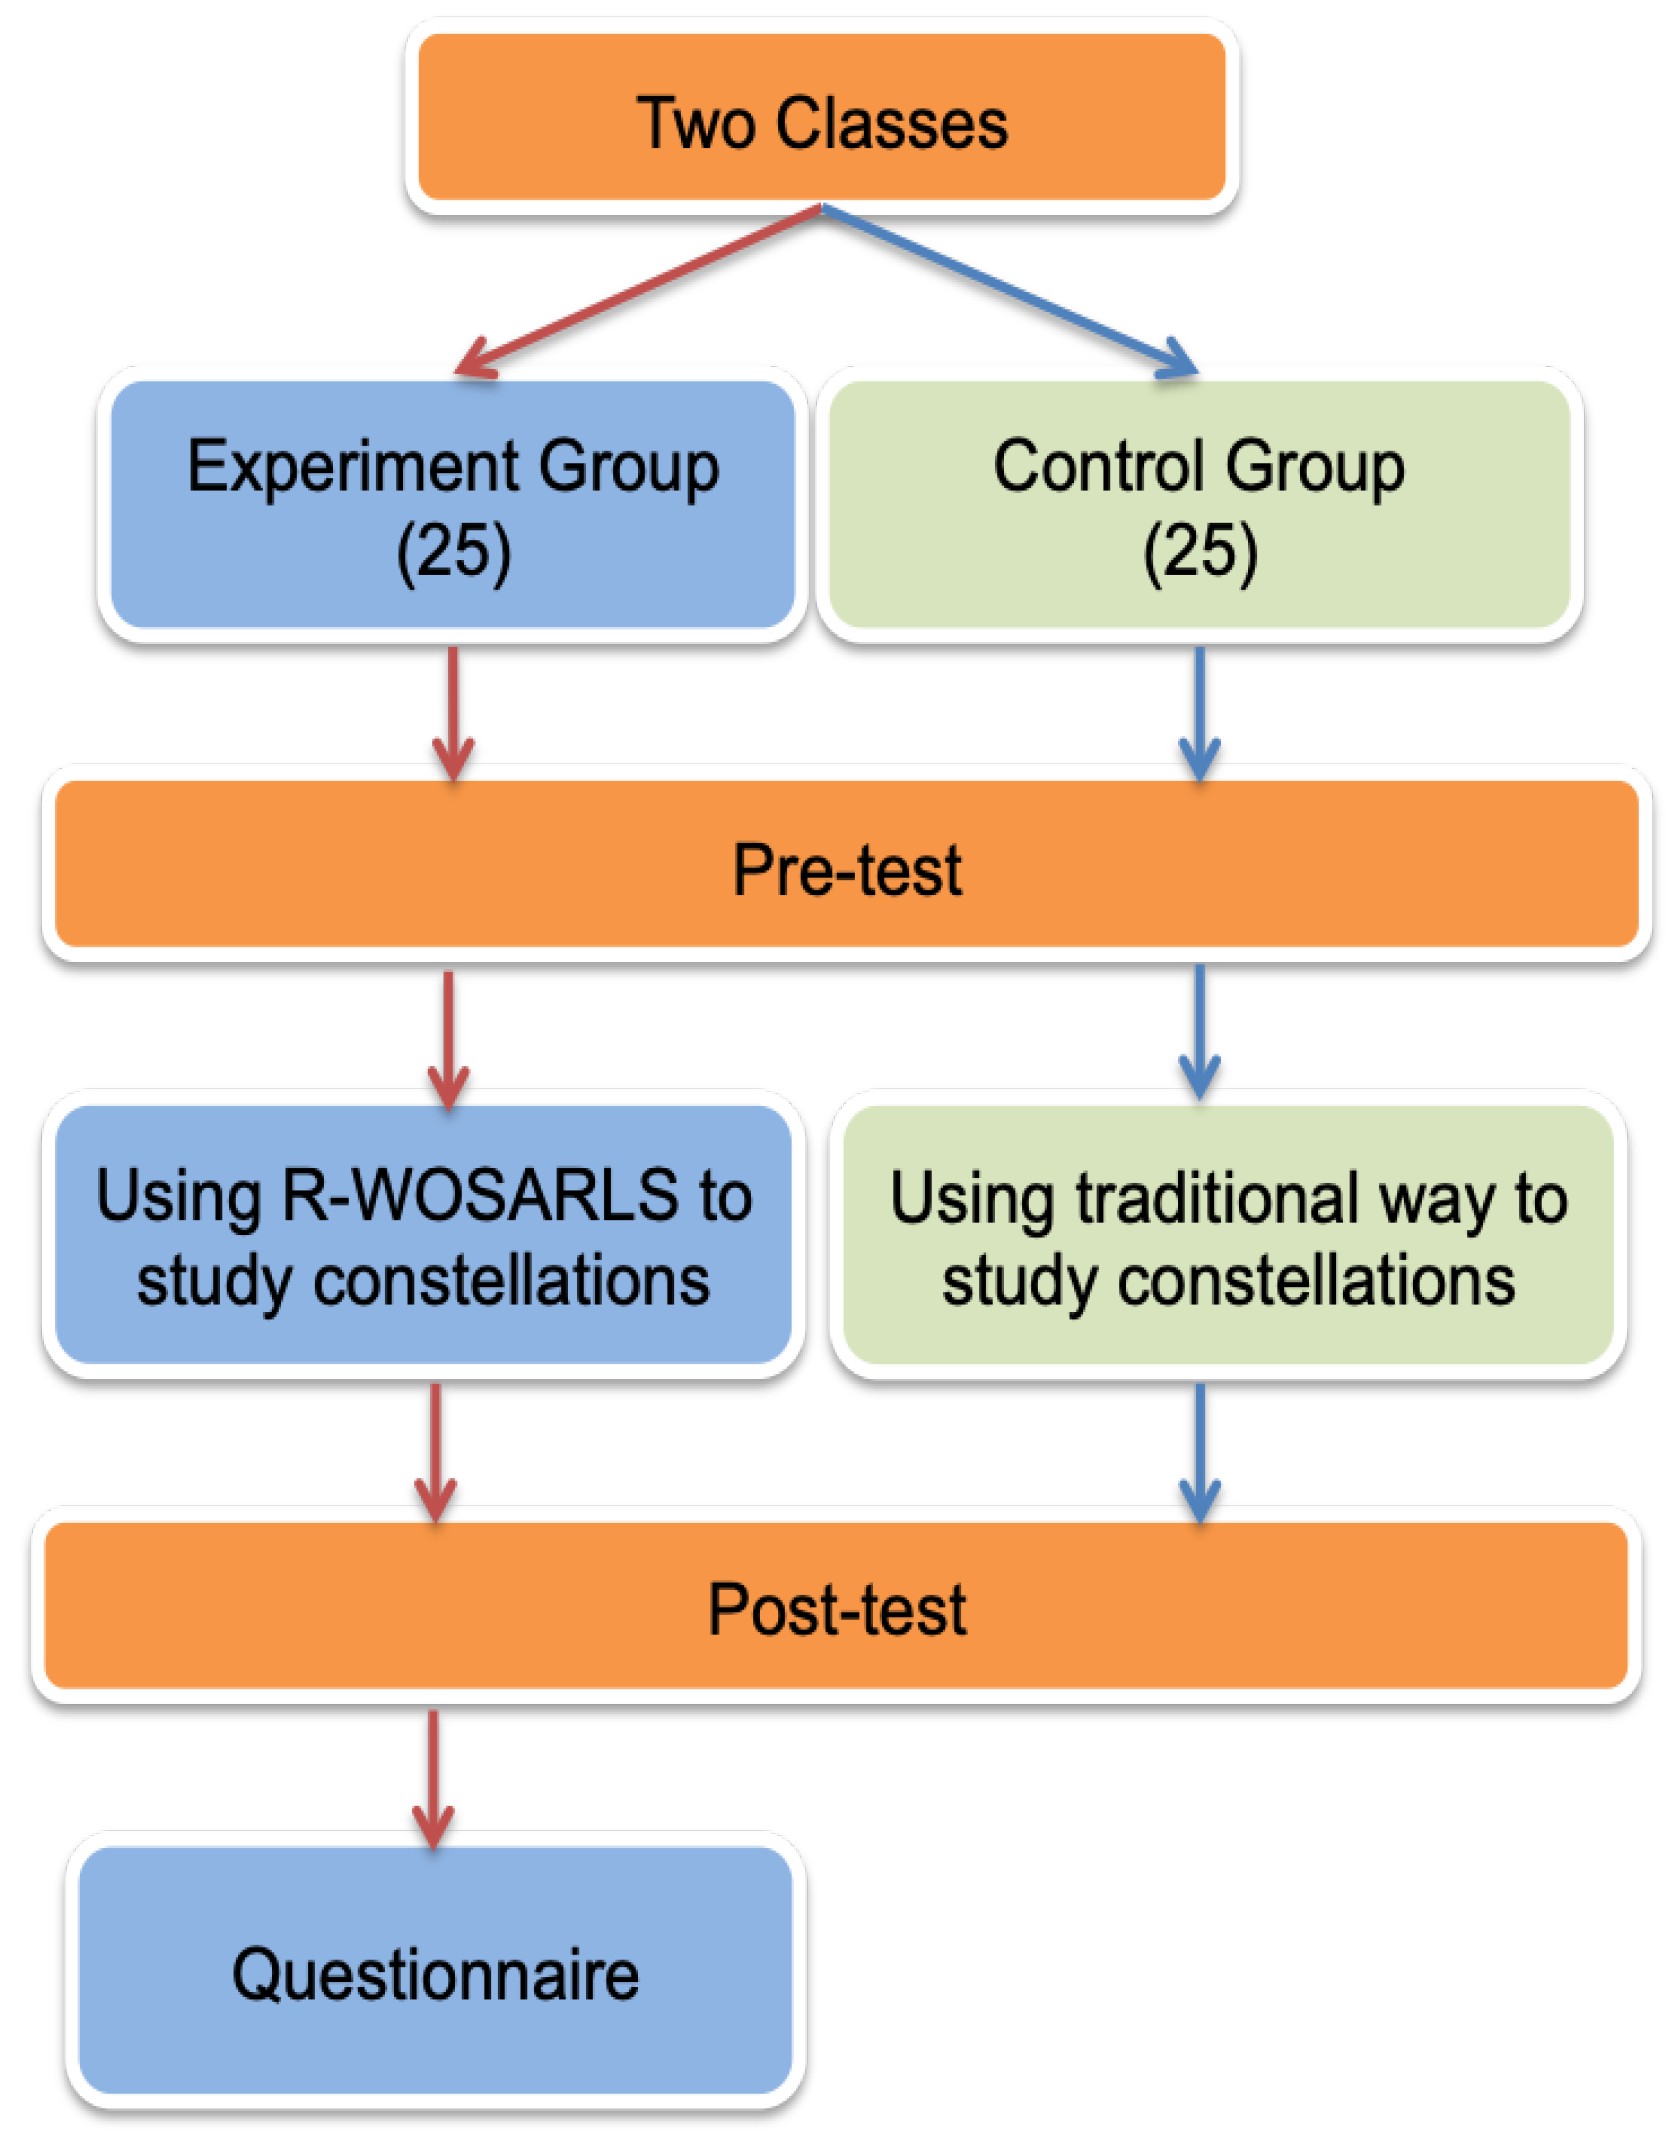
An astronomical instruction experiment was conducted at a secondary school in the Anhui province in China. In order to adapt the learning system for Chinese students, the contents of the universe view and the interface language are changed to Chinese. Two classes with about 25 students, respectively, were randomly selected from the eighth grades. One was assigned as the experimental group and the other as the control group. This study used an experimental design for non-equivalent groups to analyze whether different teaching methods would lead to different learning effectiveness. In this experiment, the independent term was the teaching method; the dependent term was the students’ abilities after learning; the covariant term was the students’ abilities before learning; and the control variants were the teachers, time, and learning materials. The entire test procedure can be seen in 
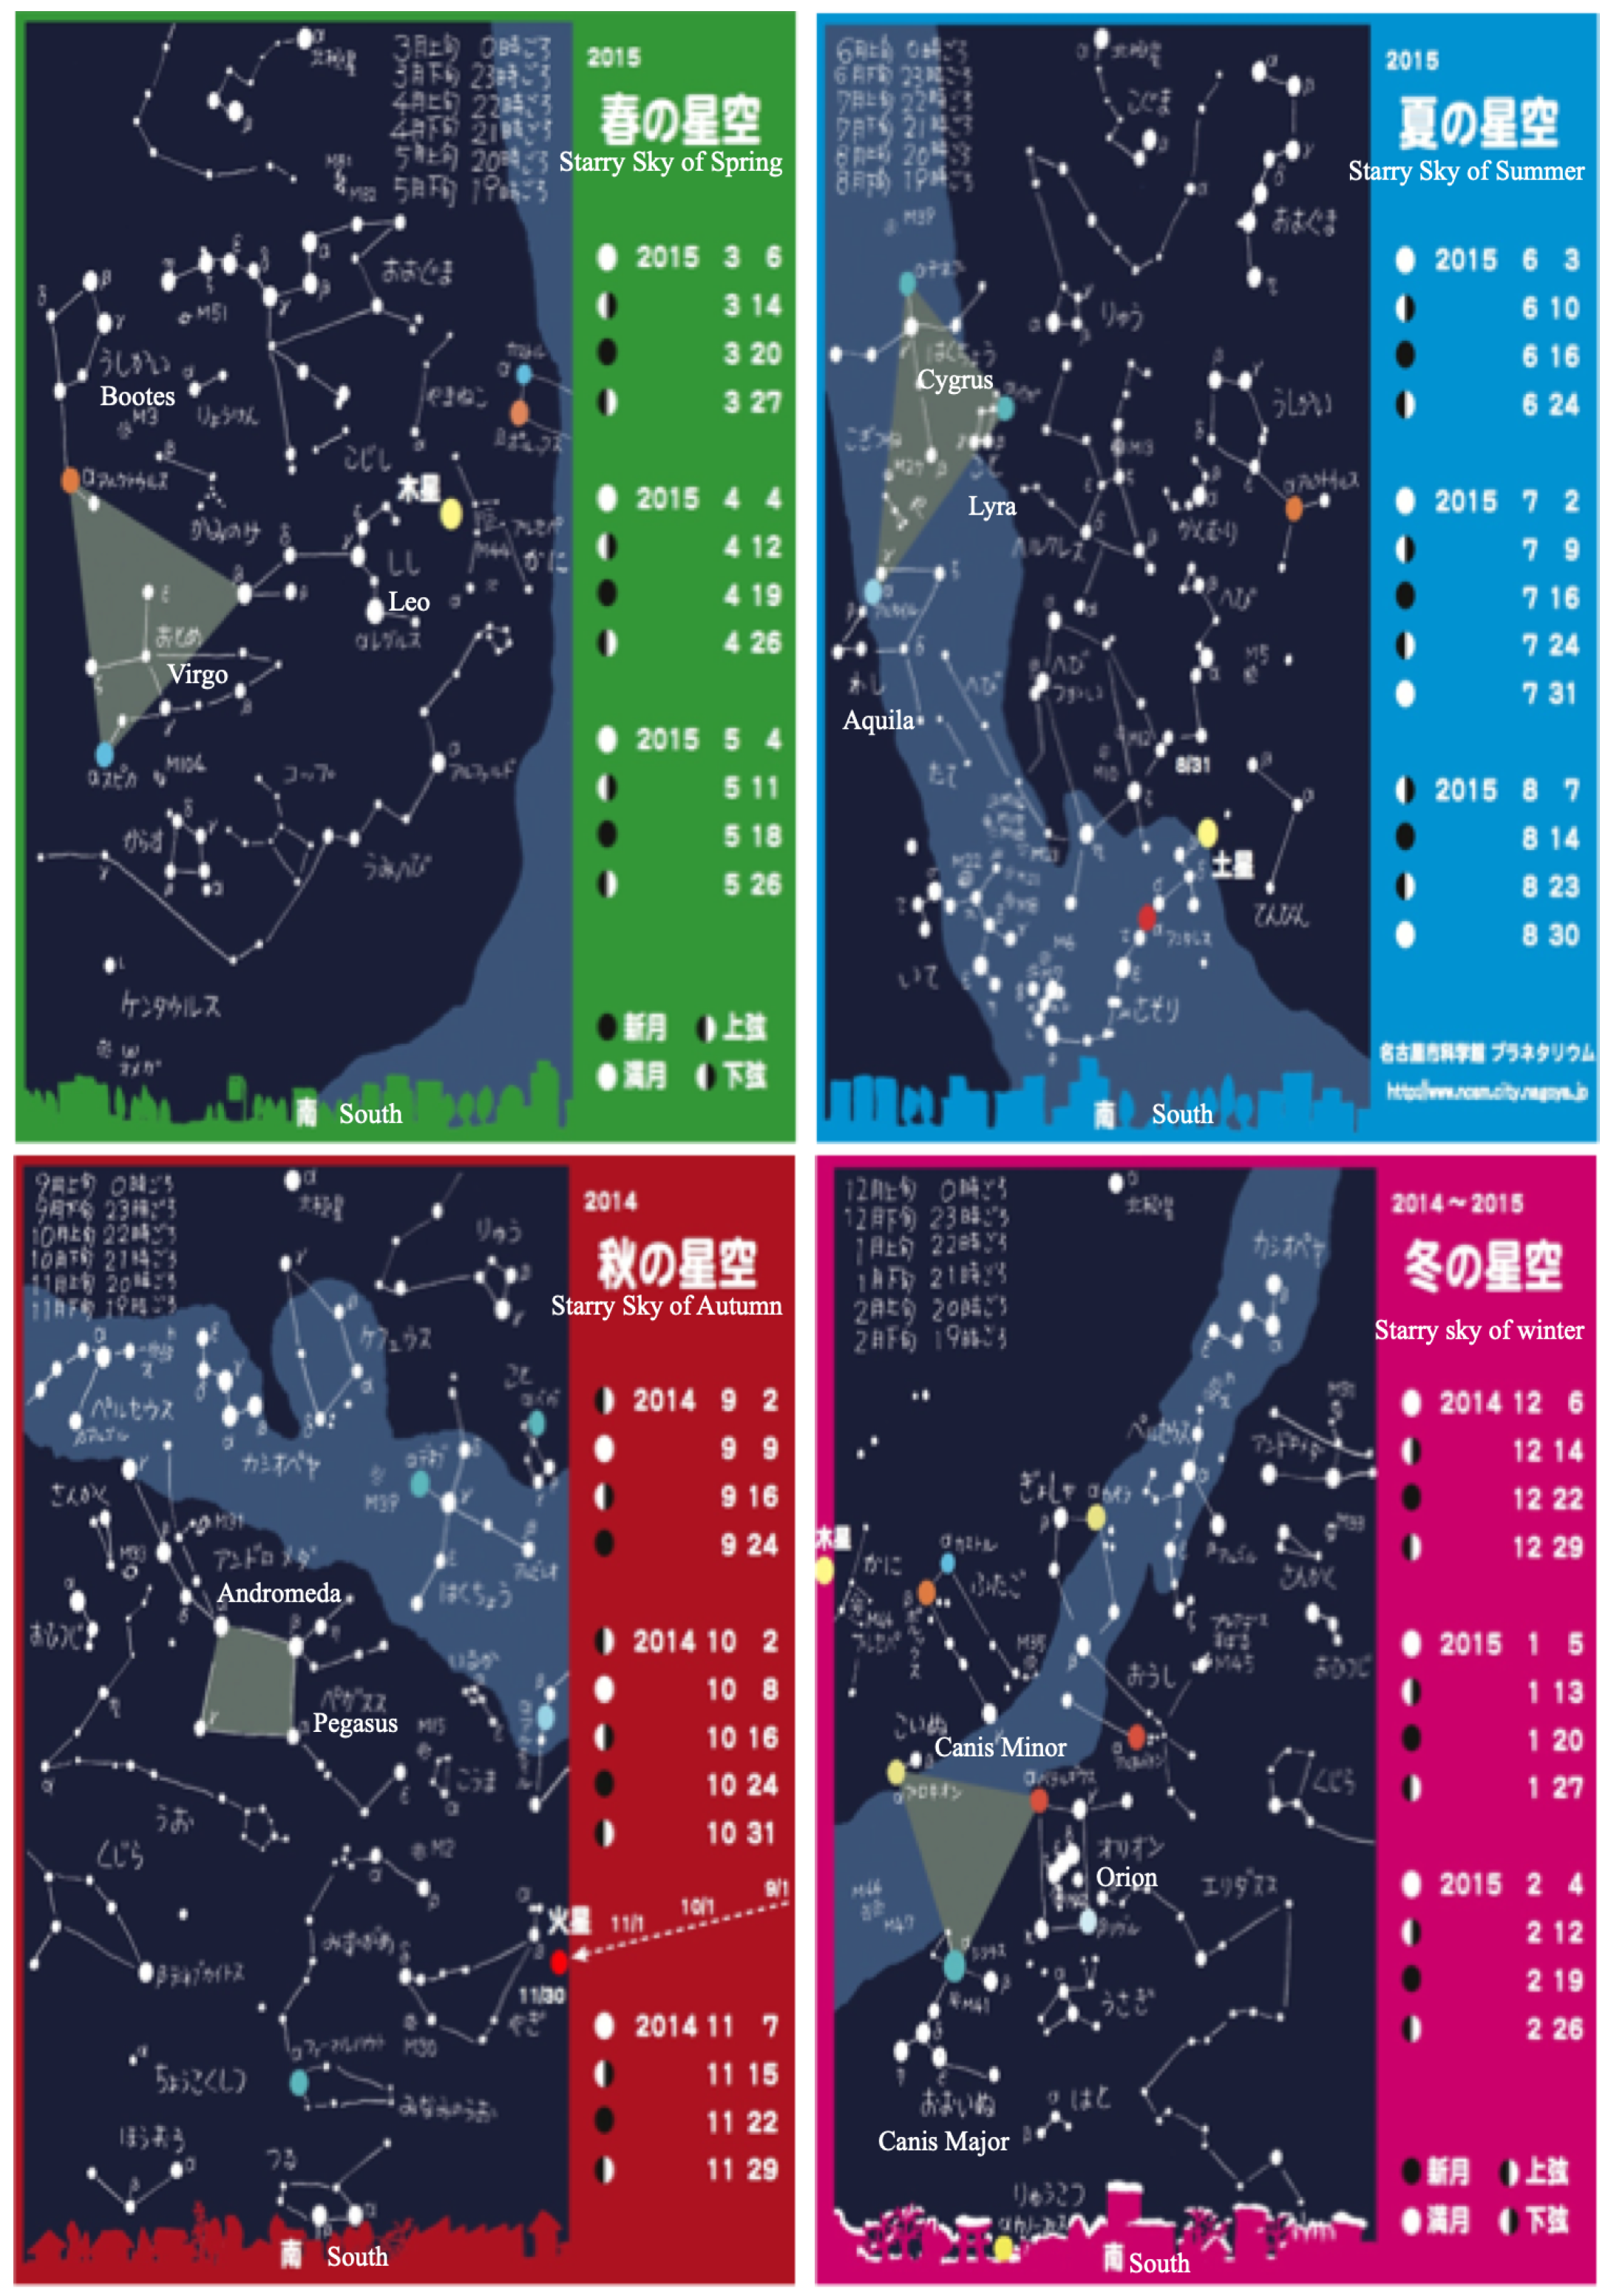
Figure 13. Firstly, two groups were required to complete a pre-test, which evaluated their prior knowledge of the constellation. Subsequently, two groups used different learning materials to observe seasonal constellations. The experiment group used the R-WOSARLS to observe and learn, whereas the control group used the traditional method, with which the teacher shows slides and animations to assist learners in learning about constellations in the classroom. In order to evaluate the learning effect of these systems, both groups of students should perform observation tasks mentioned in the previous experiment.
Following the observation tasks, both groups of students completed a post-test to verify the learning effect of the two different kinds of teaching materials. Moreover, after the post-test, a questionnaire was administered to the experiment group to evaluate the usefulness, usability, and the students’ satisfaction of the system for seasonal constellations. The test consisted of 12 one-answer questions and two no-answer questions, with total scores of 60 and 40, respectively. For the post-test, the number order of questions was changed in order to maintain the test’s standard.

4.2.2. Discussion and Results

This section presents the data collected during the experiment and also the quantitative analysis of this data using Python, which are the student scores on the pre-test, post-test and questionnaire.
(1) Learning Achievement
A pre-test was conducted to ensure that both groups of students had the equivalent basic knowledge required for learning the seasonal constellations. There are about 24 and 16 effective test data of control and experiment group, respectively. A t-test was carried out to investigate whether the scores of two groups have no significant differences. The significance level is 0.05. Table 1 presents the t-test results. The mean and standard deviation (SD) of the pre-test were 25.81 and 11.27 for the control group, respectively, and 24.04 and 10.27, respectively, for the experiment group. The p-value of the two groups was 0.61 > 0.05, indicating that, in the pre-test stage, these two groups did not differ significantly, and that the two groups of students had a statistically equal level of constellation knowledge before the experiment.
The control group used the traditional method to study seasonal constellations. A t-test was carried out to analyze the pre-test and post-test scores of the control group, in order to investigate whether the learning achievement of the students had an improvement regarding seasonal constellation learning. The significance level is 0.05. The t-test statistical result was as shown in Table 2. The mean and standard deviation of the pre-test were 24.04 and 10.27, respectively, and 30.25 and 14.82 of the post-test, respectively. The difference mean of the pre-test and post-test was 10.21, and the p-value was 0.0984 > 0.05. Although the score of the post-test is better than the pre-test, these results showed there was no noticeable difference between the pre-test and the post-test for the control group students.
A t-test was conducted to compare the pre-test and post-test scores for the experimental group to investigate whether the students who used it had superior results regarding seasonal constellation learning compared to the control group students. The significance level is 0.05. Table 3 presents the t-test statistical results. The mean and standard deviation of the pre-test were 25.81 and 11.27, respectively, and 59.94 and 13.22, respectively, for the post-test. The difference mean of the pre-test and post-test was 34.13, and the p-value is 9.09e-09 < 0.05. These results highlight that a substantial difference existed between the pre-test and post-test for students of the experimental group.
A t-test was conducted to compare the post-test scores of the experimental and control group to investigate whether these two groups have significant difference. The significance level is 0.05. Based on Table 4, the mean of post-test scores of the experimental and control group are 59.94 and 30.25, and the p-value is 1.28e-07 < 0.05, which indicated that there are significant differences of post scores between experiment and control group, and demonstrated that the different teaching method could have significantly influenced students’ leaning effects. Moreover, Figure 14 provides a visual representation of the post-test and pre-test scores of students in the experimental and control groups. This figure shows that the experiment group of students who used the R-WOSARLS to observe and study constellations obtained significant improvement between pre-test and post-test, compared with the control group of students who study the constellation through the traditional method. These results proved that the R-WOSARLS assists students in effectively observing and studying the seasonal constellation in the classroom.
(2) Questionnaire Survey
A questionnaire regarding student attitudes about the R-WOSARLS was conducted in the experiment group, following their use of the system to observe seasonal constellation. We revised the usability and learners’ satisfaction part of the questionnaire in the previous experiment. The new part is listed as below:
Q6:
The interface of R-WOSARLS is clear and easy for me to understand.
Q7:
It is easy for me to operate the system to complete constellation tasks.
Q8:
The Chinese font, size, color, etc. of the interface are suitable.
Q9:
Using the R-WOSARLS to observe seasonal constellations is interesting.
Q10:
I’d like the teacher to use the system when teaching about constellations in the classroom.
Q11:
I’d like to use the system to observe constellations after school.
Q12:
The R-WOSARLS can help me enhance my motivation for observing seasonal constellations.
Q13:
I would recommend other people to use the system if they intend to observe seasonal constellations.
Q14:
I’d like to download and install the system in my smartphone if I have a smartphone.
Q15:
In the future, I intend to use the same kind of system for studying other astronomical issues.
Twenty-five effective questionnaires were received. The questionnaire included three parts, which were the usefulness (Q1–Q5) and usability (Q6–Q8) of, and the students’ satisfaction (Q9–Q15) with, the system. An analysis of the questionnaires was undertaken to investigate whether the students enjoyed the system.
With regard to the learning effect, in five of the questions about the learning items, almost all of the students had agreed that the functions of the system were very effective, as shown in Table 5. Moreover, students also agreed that the system could help them improve their knowledge of constellations and erase previous misconceptions they had on the topic. During interviews with them, students confirmed that the AR view was very useful to them in observing the constellations and was able to provide a visual learning experience like the real world, including helping them understand the azimuth and elevation angle in the sky. In addition, science teachers agreed during the interview that the system did help reduce their teaching burden and pressure, since students can observe constellations by themselves on their personal smartphones in school and after it. It can be concluded that the R-WOSARLS was helpful for students to achieve the learning goals of constellation observation in a classroom environment.
Based on Table 6, in terms of interface design, students agreed that the system was easy to understand, and the functions were simple to use in the system, as the mean of Q6 and Q8 were 4.28 and 4.67. The mean result of Q7 indicated that students were able to operate the system and complete the seasonal constellation observation tasks. Initially, there was a concern that the students would not understand the interface and they would have trouble using the system to observe constellation, as they were only given a brief introduction of the system interface prior to the experiment. The real experimental scene was different from my initial speculation. The junior high school students operated the system easily, and most of them could complete the observation task. When one student had difficulties in operating the system, the other students would help them. It was found that most students were experienced in operating smartphone applications, as many Chinese students of the same age had their own smartphone provided by their parents, and they had experience in playing games on their smartphones. Due to the popularity of smartphones among students, therefore, the smartphone device is a very appropriate learning tool in astronomy education.
The students appeared to be highly interested in using the system to observe the constellations, with the mean of Q9 and Q10 being 4.61 and 4.72 (see Table 7). Since students agreed that the system was helpful to them in enhancing their interest in constellation observations, as the mean of Q12 was 4.23, they would prefer to use the system to observe constellations after school (Q11 shows a mean of 4.44). Students can personally use the system to observe the constellations in the sky, helping them develop an awareness of an active learning sense in astronomy. They were interviewed and asked whether they preferred AR teaching materials compared to the traditional methods. All of them said that they preferred the AR system since it provided a realistic and intuitive learning environment for them to be involved with. Furthermore, students had a strong intention to recommend the software to their friends for observing constellations, as the mean of Q13 was 5.0. During the interview, a number of students asked where they could download the software as they wanted to install it on their smartphones; the mean of Q14 at 4.83 proved this. In addition, the mean of Q15 is 4.89, which revealed that they wanted to use the same kind of AR system for other astronomical concept observations.
From the above analysis of the questionnaire and interview observation, the conclusion is that students have highly accepted the new constellation observation method since the system helped them study seasonal constellations in a real-world immersive learning environment. Moreover, the AR learning system promoted student interest in astronomy and gave them incentives to take astronomy science courses.

5. Conclusions

In this paper, the utilization of smartphone AR technology and 2D content was described with regard to the recreation of planetarium learning interfaces or content for seasonal constellations, called the R-WOSARLS. Through using the R-WOSARLS, learners can obtain the benefits of the learning experience of a planetarium while also enjoying the benefits of directly observing actual seasonal constellations in the starry sky. The usefulness, usability, and motivational influence of the proposed system were assessed with the use of task-based experiments. The results of the experiments revealed that each function of the system was user-friendly and efficient at its intended task. The R-WOSARLS allowed learners to improve their knowledge and reach a set of seasonal constellation observation learning goals. Furthermore, it enhanced the motivation levels of both university and junior high school students. Moreover, through the teaching experiment in junior high school, the results demonstrated that this seasonal constellation observation system as a new teaching tool not only helped students obtain superior learning achievements over traditional instruction methods but also stimulated student interest in astronomical phenomena after school.
For future work, improvements to the interface design of the system are planned, based on participants’ comments in the experiment. Furthermore, our research group worked in collaboration with the planetarium, where the astronomy curator plays a very important role in astronomy education. An important part of the future work includes the discovery of methods to make the best use of the knowledge of the curator with regard to learning about the constellations, such as adding video explanation content about special stars or constellation events in a year from the curator. In addition, our future challenges include the implementation of R-WOSARLS in elementary and junior high schools in different places, such as both China and Japan, to test the learning effects of the system.

Author Contributions

Conceptualization, K.T. and M.U.; methodology, K.T.; software, K.T.; validation, K.T.; formal analysis, K.T.; investigation, K.T.; resources, M.E. and K.M.; data curation, K.T.; writing—original draft preparation, K.T.; writing—review and editing, K.T. and Y.T.; visualization, K.T.; supervision, M.U., T.Y. and J.K.; project administration, K.T.; funding acquisition, T.Y. and J.K.

Funding

This research received no external funding.

Conflicts of Interest

The authors declare no conflict of interest.

References

  1. Plummer, J. Early Elementary Students Development of Astronomy Concepts in the Planetarium. J. Res. Sci. Teach. 2009, 46, 192–209. [Google Scholar] [CrossRef]
  2. Planetarium Projection Program. Available online: http://www.ncsm.city.nagoya.jp/visit/planetarium/themes /index.html (accessed on 1 September 2014).
  3. Kondo, M.; Mouri, K.; Yasuda, T. A multiplatform content management system for curators to provide teaching materials in astronomy education. J. Theor. Appl. Inf. Technol. 2005, 4, 874–881. [Google Scholar]
  4. Zhang, J.; Sung, Y.T.; Hou, H.T.; Chang, K.E.C. The development and evaluation of an augmented reality-based armillary sphere for astronomical observation instruction. Comput. Educ. 2014, 73, 178–188. [Google Scholar] [CrossRef]
  5. Soga, M.; Ohama, M.; Ehara, Y.; Miwa, M. Real-world oriented mobile constellation learning using gaze pointing. IEICE Trans. Inf. Syst. 2011, 94, 763–771. [Google Scholar] [CrossRef]
  6. Mouri, K.; Endo, M.; Iwazaki, K.; Noda, M.; Yasuda, T.; Yokoi, S. Development of a planisphere interface Ajax web system based on a constellation database for astronomy education. Int. J. Comput. Sci. Netw. Secur. 2008, 8, 11–16. [Google Scholar]
  7. Schiller, J.; Voisard, A. Location-Based Services; Morgan Kaufmann Publishers Inc.: San Francisco, CA, USA, 2004; ISBN 1558609296. [Google Scholar]
  8. Jones, V.; Jones, J.H. Ubiquitous learning environment: An adaptive teaching system using ubiquitous technology. Proc. 21st ASCILITE Conf. 2004, 11, 81–91. [Google Scholar]
  9. Schilit, W.N. A System Architecture for Context-aware Mobile Computing. Ph.D. Thesis, Department of Mathematics, Columbia University, New York, NY, USA, 1995. [Google Scholar]
  10. Hwang, G.J.; Tsai, C.C.; Yang, S.H. Criteria, strategies and research issues of context-aware ubiquitous learning. Educ. Technol. Soc. 2008, 8, 11–16. [Google Scholar]
  11. Hwang, G.J.; Chu, H.C.; Huang, S.H.; Tsai, C.C. A decision-tree-oriented guidance mechanism for conducting nature science observation activities in a context-aware ubiquitous learning environment. Educ. Technol. Soc. 2010, 13, 53–64. [Google Scholar]
  12. Klopfer, E.; Squire, K. Environmental detectives the development of an augmented reality platform for environmental simulations. Educ. Technol. Res. Dev. 2008, 56, 203–228. [Google Scholar] [CrossRef]
  13. Sin, A.K.; Zaman, H.B. Tangible interaction in learning astronomy through augmented reality book-based educational tool. First Int. Vis. Inform. Conf. IVIC 2009 2009, 4, 302–313. [Google Scholar]
  14. Billinghurst, B.; Dunser, A. Augmented reality in the classroom. Computer 2012, 45, 56–63. [Google Scholar] [CrossRef]
  15. Tian, K.; Endo, M.; Urata, M.; Mouri, K.; Yasuda, T. Lunar observation support system using smartphone AR for astronomy education. Int. J. Interact. Mob. Technol. 2014, 8, 32–39. [Google Scholar] [CrossRef]
  16. Tarng, W.H.; Lin, Y.S.; Lin, C.P.; Qu, K.L. Development of a Lunar-Phase Observation System Based on Augmented Reality and Mobile Learning Technologies. Mob. Inf. Syst. 2016, 2016, 1–12. [Google Scholar] [CrossRef]
  17. Tian, K.; Endo, M.; Urata, M.; Mouri, K.; Yasuda, T. Multi-viewpoint Smartphone AR-based Learning System for Solar Movement. Int. J. Interact. Mob. Technol. 2014, 8, 11–18. [Google Scholar] [CrossRef]
  18. Tarng, W.H.; Qu, K.L.; Lu, Y.C.; Shih, Y.S.; Liou, H.H. A Sun Path Observation System Based on Augment Reality and Mobile Learning. Mob. Inf. Syst. 2018, 2018, 1–10. [Google Scholar] [CrossRef] [Green Version]
  19. Ura, M.; Endo, M.; Yamada, M.; Miyazaki, S.; Iwazaki, K.; Mouri, K.; Yasuda, T. A model for searching constellations interactivity on smartphones in astronomy education. J. Jpn. Inf.-Cult. Soc. 2012, 19, 42–49. [Google Scholar]
  20. Sky Map. Available online: https://play.google.com/store/apps/details?id=com.google.android.stardroid& hl=en (accessed on 3 May 2013).
  21. Star Walk™-5 Stars Astronomy Guide. Available online: https://itunes.apple.com/us/app/star-walk-5-stars-astronomy/id295430577?mt=8 (accessed on 3 May 2013).
Figure 1. The grid line of latitude and longitude in the planetarium dome interface, and the interface of demonstrating the elevation angle between horizon and a start using a hand image.
Applsci 09 03508 g001
Figure 2. Planetarium materials of seasonal constellations in the south starry sky: (upper left) spring constellations; (upper right) summer constellations; (bottom left) autumn constellations; (bottom right) winter constellations.
Applsci 09 03508 g002
Figure 3. Planetarium content regarding the orbit of the Orion constellation over a day.
Applsci 09 03508 g003
Figure 4. Procedure for calculating stars’ position in AR view.
Applsci 09 03508 g004
Figure 5. The AR view interface of R-WOSARLS (left), locating the constellation with hand images in AR view (right).
Applsci 09 03508 g005
Figure 6. The seasonal constellation of the southern starry sky in spring: (upper left) spring constellations; (upper right) summer constellations; (bottom left) autumn constellations; (bottom right) winter constellations in AR view.
Applsci 09 03508 g006
Figure 7. The AR display of the orbit of Orion over one day in AR view.
Applsci 09 03508 g007
Figure 8. Clicking universe view button (left), and stepping into the universe view interface of R-WOSARLS (right).
Applsci 09 03508 g008
Figure 9. Clicking observer text (left), images of the mechanism of spring constellation–Leo (right).
Applsci 09 03508 g009
Figure 10. The participant was observing constellations outdoors using the system (left); the participant was completing the tasks and answering questionnaires on the R-WOSARLS (right).
Applsci 09 03508 g010
Figure 11. The result of usefulness questionnaire of R-WOSARLS.
Applsci 09 03508 g011
Figure 12. The usability and users’ satisfaction of questionnaire results of the R-WOSARLS.
Applsci 09 03508 g012
Figure 13. The experimental procedure of the teaching experiment at a junior high school.
Applsci 09 03508 g013
Figure 14. The box plot for the pre-test and post-test scores of students in the control group (left), and experiment group (right).
Applsci 09 03508 g014
Table 1. The t-test analysis result of a pre-test in the control and experiment group.
GroupNumberMeanStd DevDiffp-Value
Control Group2424.0411.271.770.61
Experiment Group1625.8110.27
Table 2. The t-test analysis result of pre-test and post-test scores of students in the control group.
TestMeanStd DevDiffp-Value
Pre-test24.0410.2710.210.0984
Post-test30.2514.82
Table 3. The t-test analysis result of pre-test and post-test scores of students in the experiment group.
TestMeanStd DevDiffp-Value
Pre-test25.8111.2734.139.09e-09
Post-test59.9413.22
Table 4. The t-test analysis result of post-test scores of students in the control and experiment group.
GroupMeanStd DevDiffp-Value
Experiment59.9413.2229.691.28e-07
Control30.2514.82
Table 5. The result of usefulness questionnaire of R-WOSARLS in the experiment group.
QuestionMeanStd Dev
Q14.670.59
Q24.670.77
Q34.441.15
Q44.611.04
Q54.51.04
Table 6. The result of usability of questionnaire result of the R-WOSARLS in the experiment group.
QuestionMeanStd Dev
Q64.281.12
Q74.670.77
Q84.670.84
Table 7. The students’ satisfaction of questionnaire result of the R-WOSARLS in the experiment group.
QuestionMeanStd Dev
Q94.611.04
Q104.720.57
Q114.440.78
Q124.221.17
Q135.00.0
Q144.830.51
Q154.890.32

