Article

Seismic Vulnerability Analysis of Structure Subjected to Uneven Foundation Settlement

1
College of Civil and Hydraulic Engineering, Ningxia University, Yinchuan 750021, China
2
School of Civil Engineering, North Minzu University, Yinchuan 750021, China
*
Author to whom correspondence should be addressed.
Appl. Sci. 2019, 9(17), 3507; https://doi.org/10.3390/app9173507
Submission received: 30 June 2019 / Revised: 21 August 2019 / Accepted: 21 August 2019 / Published: 26 August 2019

Abstract

:
Uneven foundation settlement is one of the common engineering problems in a collapsible loess area. In order to study the influence of uneven foundation settlement on the seismic performance of a structure, the incremental dynamic analysis (IDA) method is used to analyze the seismic vulnerability of the steel structure frame. The differences in the seismic response of the structure in relation to uneven foundation settlement are analyzed. The influences of uneven foundation settlement quantities and various areas of uneven settlement on the seismic response of the structure are discussed. On this basis, the relationship between ground motion intensity and structural failure probability is studied, by changing the magnitude of seismic acceleration peaks. Compared with the unsettled structure, the internal force redistribution of the structure caused by uneven foundation settlement is one of the causes of earthquake damage for some components. The uneven foundation settlement located at the corner of the plane of the structure is likely to cause more serious earthquake damage to the structure. Uneven settlement will cause an increase in storey drift. With the increase in settlement, the seismic damage of the superstructure will be aggravated.

1. Introduction

When the construction of a tunnel results in local cavities and insufficient thickness around the tunnel lining, this causes uneven settlement of the adjacent surface buildings’ foundations and possibly unrecoverable damage [1,2,3].
Regarding this problem, much research has been carried out. The estimation of maximum building settlement is developed by the Potts and Addenbrooke method [4], numerical simulation [5], and InSAR monitoring data [6,7]. However, the monitoring and prediction of settlement is important, but the impact of settlement on the engineering structure is more concerning [8,9,10]. Most of the research on structural deformation assessment is carried out on greenfield ground [11], but the evaluation results are conservative [12]. In order to more accurately evaluate the ground movements, the impacts of structural weight [13,14] and stiffness [15,16,17,18] need to be considered.
However, most of the existing research focuses on ground movements and monitoring methods, or on the effects of tunnel excavation on the deformation of the superstructure. It is still very rare to study the dynamic response of structures after uneven foundation settlement, especially the study of the seismic response of structures after uneven foundation settlement, which is not found in related literature.
Settlement is a deformation feature of a building. It is the result of the vertical deformation of the foundation and the interaction of the building. Settlement is mainly divided into two categories: uniform settlement and uneven settlement [19,20]. Uniform settlement usually occurs when the load on the building and the foundation soil are relatively uniform. Uniform settlement generally does not cause secondary stress on the building structure and does not damage the building components, but excessive settlement can also cause a series of problems in practice. Uneven settlement is a kind of foundation deformation that occurs easily, often jeopardizing the safety of the building structure. In order to study the influence of uneven settlement on the seismic response of the structure, this paper takes a steel frame structure with an uneven foundation settlement as the research object. Different settling areas and settlements are set in the model, and the incremental dynamic analysis (IDA) method is used to calculate the structural seismic response. The seismic vulnerability analysis and evaluation of the structure are carried out by determining the damage index and performance parameters of the structure.

2. Seismic Vulnerability Analysis

2.1. Seismic Vulnerability Analysis Process

For the accurate estimation of the complete range of structural earthquake response, incremental dynamic analysis (IDA) [21] is used as one of the most powerful analysis methods available. Based on the non-linear dynamic time history analysis, IDA analyzes the seismic performance level of the structural system through a large number of seismic calculation results. The method can be widely used in the process of structural seismic performance evaluation and vulnerability analysis, while considering factors such as the different seismic requirements of structures and the uncertainties of various parameters. As a nonlinear analysis method, IDA analysis can reflect the changes in a structural system with the change in ground motion intensity.
Using this series of seismic actions of different intensities for the structure and time-history analysis, we can calculate the relationship between the seismic response parameters and the ground motion intensity under the action of single ground motion, namely the IDA curve. An IDA curve includes the entire process of structural failure: the initial elastic phase, the intermediate elastoplastic deformation phase, and the final phase up until the structural instability collapses, so the IDA curve can very comprehensively reflect the relationship between ground motion and the structural response of different strengths. The incremental dynamic analysis method has two characteristics: predicting the responses of the structure under the influence of ground motion and accurately reflecting the change process of the structure’s strength, stiffness, and deformation under earthquake action. Therefore, as an effective way to simulate the seismic collapse performance of structures, incremental dynamic analysis methods have been widely used worldwide.
Before the IDA analysis, in order to ensure the accuracy of the subsequent analysis results, it is necessary to determine a reasonable and effective ground motion intensity measure (IM), which is used to reflect the scaling factor of the record, and a damage measure (DM), which is used to evaluate the output of the corresponding non-linear dynamic analysis.

2.2. Analysis Parameter Selection and Setting

A set of ground motion records is needed to perform IDA. For mid-rise buildings, 10 to 20 records are usually enough to provide sufficient accuracy in the estimation of seismic demands [21,22]. A set of 10 ground motion records belonging to a bin of relatively large magnitudes of 6.5–6.9 and moderate distances were selected from current Pacific Earthquake Engineering Research Center terminology, listed in Table 1. The peak ground acceleration (PGA) was used as the ground motion intensity parameter. The advantage of PGA is that the concept is clear, the calculation is simple, and the existing ground motion attenuation relationship can be used to determine the seismic hazard.
Three performance levels of structures were divided by FEMA356 [23]: immediate occupancy (IO), life safety (LS), and collapse prevention (CP), and these three performance levels were always used to reflect the deformation properties of the component [24]. The maximum interstorey drift ratio, defined as the ratio of the maximum interstorey drift to the interstorey height, is a good measure of the responses of a structure. Therefore, the corresponding maximum interstorey drift ratio limits were set for each performance level. Furthermore, the deformation criterion was used to select the quantitative index, and the interstorey drift ratio θmax was selected as the quantitative index in this paper.
The seismic waves selected in the previous section were scaled according to their intensity indexes, and 200 ground motion samples were generated from 0 to 2.0 g in increments of 0.1 g. The models were calculated by non-linear dynamic analysis, using SAP2000 v20 [25], which is a well-known commercial software tool for the analysis and design of structural systems. Advanced analytical techniques allow for step-by-step large deformation analysis, material nonlinear analysis with fiber hinges, and progressive collapse analysis, and nonlinear analyses can be static and/or time history, with options for fast nonlinear analysis nonlinear time history dynamic analysis and direct integration. The IDA was carried out to obtain the maximum interstorey drift ratios of the structure under different ground motion strengths.

3. Model Analyses

3.1. Model Design

The remainder of this paper is organized as follows. The steel frame structure model is established, with the problem of uneven settlement. Three different foundation settlement zones, Zone I, Zone II, and Zone III, are set in the structural plane, and different settlement quantities of 20 mm, 40 mm, 60 mm, 80 mm, and 100 mm are sequentially set for each area. Furthermore, the IDA method is used to analyze the seismic responses of structures under different earthquakes, and the seismic vulnerability and seismic performance of each structure are further studied, as shown in Figure 1.
The steel frame height was 3.2 m and the total height was 16.0 m. The beam was made of H-shaped steel, the beam section was W12 × 30, and the column was made of box steel. The cross-section of the bottom column was box 250 mm × 10 mm, and the remaining section of the column was box 200 mm × 10 mm. For designing the structural members, steel material with fy = 240 MPa was used.

3.2. Structural Seismic Vulnerability Analysis

The maximum interstorey drift ratios of the structure can reflect the comprehensive effects of structural damage, local damage, and layer height, and are easier to obtain during the analysis. Therefore, the maximum interstorey drift ratios of structures have become the most commonly used damage index in structural performance analysis and vulnerability research. Through the model IDA analysis, the median IDA curves were extracted, and Figure 2 shows the 50% probabilities of different settlement zones.
In order to more clearly show the influence of the uneven settlement area on the maximum interstorey drift ratios of the structure, the median line of the maximum interstorey drift ratios corresponding to different uneven settlement areas under the same settlement quantity is plotted in Figure 2.
It can be seen from Figure 3 that with the gradual increase in the settlement quantity, the difference in the maximum interstorey drift ratios of the structure corresponding to the three uneven settlement areas became more and more obvious. Among them, Zone I was the most obvious. The main reason for this is that Zone I was located at the corner of the structural plane. There was a large difference in the four-sided constraint. After the foundation is unevenly settled, the frame column will be inclined toward the relatively weak side. In addition, compared to Zone II and Zone III, the number of horizontal members connected to Zone I was relatively small, and it was difficult for the frame columns to be internally distributed by adjacent members, making the zone more susceptible to damage. Contrary to this, Zone III was close to the center of the structural plane, and the surrounding constraints were relatively large and balanced, and the frame column of the subsidence zone was less prone to a tendency to one side. At the same time, the components in the adjacent area could also have a relatively sufficient internal force redistribution to the frame column, so that the larger internal force could be better distributed.

3.3. Probabilistic Seismic Demand Analysis of Structures

Nonlinear dynamic time history analysis for 3600 analysis models was carried out, and the maximum interstorey drift ratio data points of the structure with the peak acceleration were obtained as variables, as shown in Figure 3, Figure 4 and Figure 5. Figure 3, Figure 4 and Figure 5 correspond to Zone I, Zone II, and Zone III, respectively. Each point in the graph represents the nonlinear dynamic time-history analysis of the structure response, obtained by the excitation of a ground motion sample. The vertical data points of each column in the figure are the responses of the structure under the same PGA. The horizontal red lines represent the different performance level limits for different performance levels LS1, LS2, LS3, and LS4 from bottom to top, and the specific values correspond to the quantitative index limits of the structure, as shown in the Table 2. From the bottom to the top, the different performance level limits LS1, LS2, LS3, and LS4 in turn represent basic integrity, minor damage, medium damage, severe damage, and collapse. These horizontal red lines are the dividing lines for the different levels of damage of the structure.
As can be seen from Figure 3, Figure 4 and Figure 5, the seismic response of the frame structure corresponding to Zone I was generally larger than that of Zone II and Zone III. Moreover, even under the same intensity earthquake, as the settlement increased, more and more structural seismic responses reached greater performance level limits, which was particularly evident in Zone I.
Compared with the structure with no uneven foundation settlement, the uneven settlement made it easier for the structure to form a plastic hinge under the action of the earthquake. During an earthquake, the plastic hinge will dissipate as part of the seismic energy. A considerable number of plastic hinges appeared in the horizontal members connected to the uneven settlement zone and dissipate seismic energy during the earthquake, thereby mitigating the seismic response of the frame columns. Perhaps this is why the maximum interstorey drift ratios in some cases were higher for Zone I at 0 mm than in other cases.

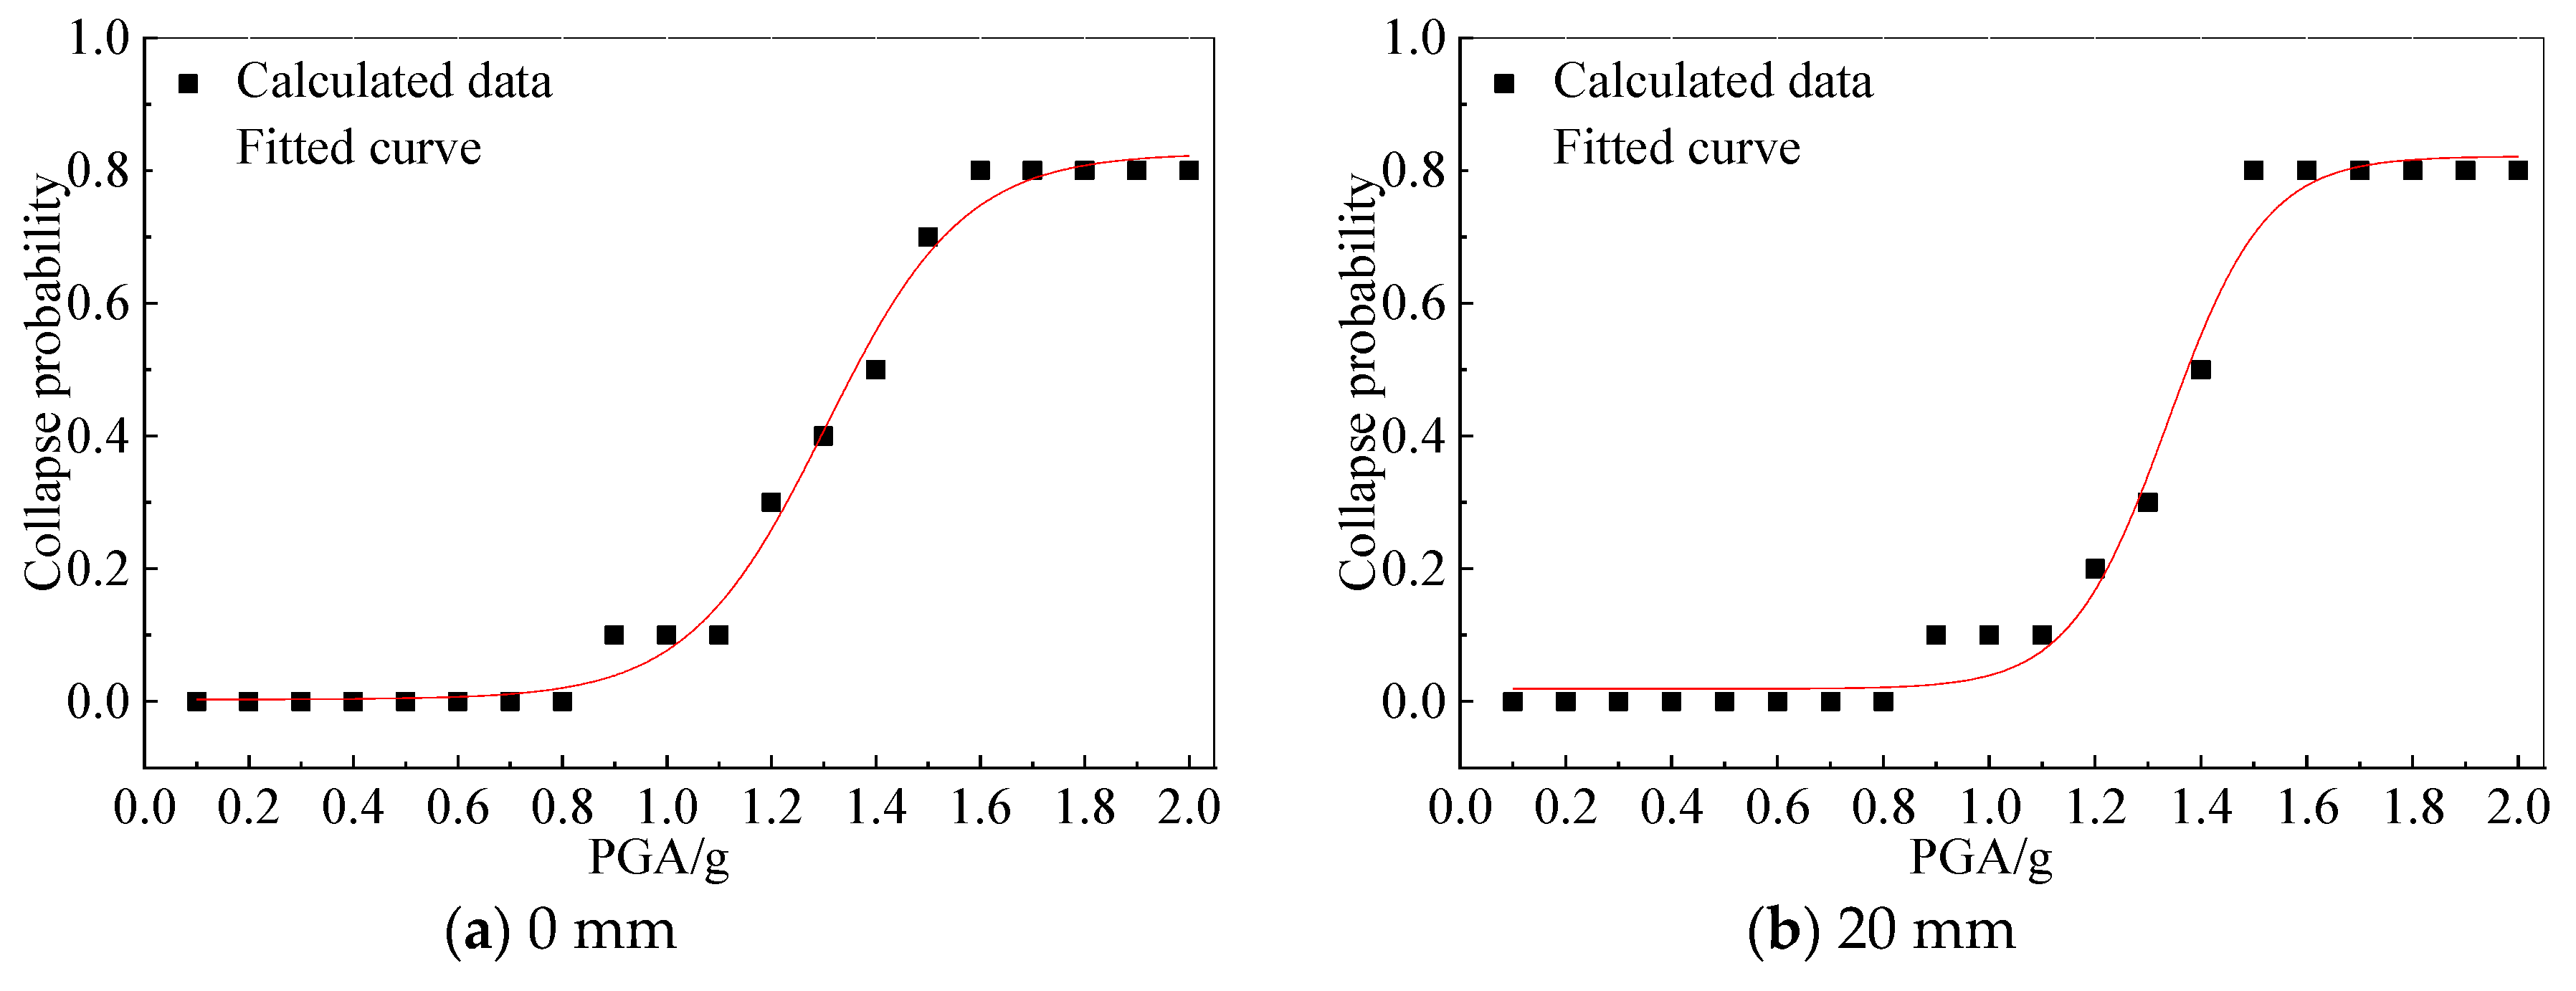
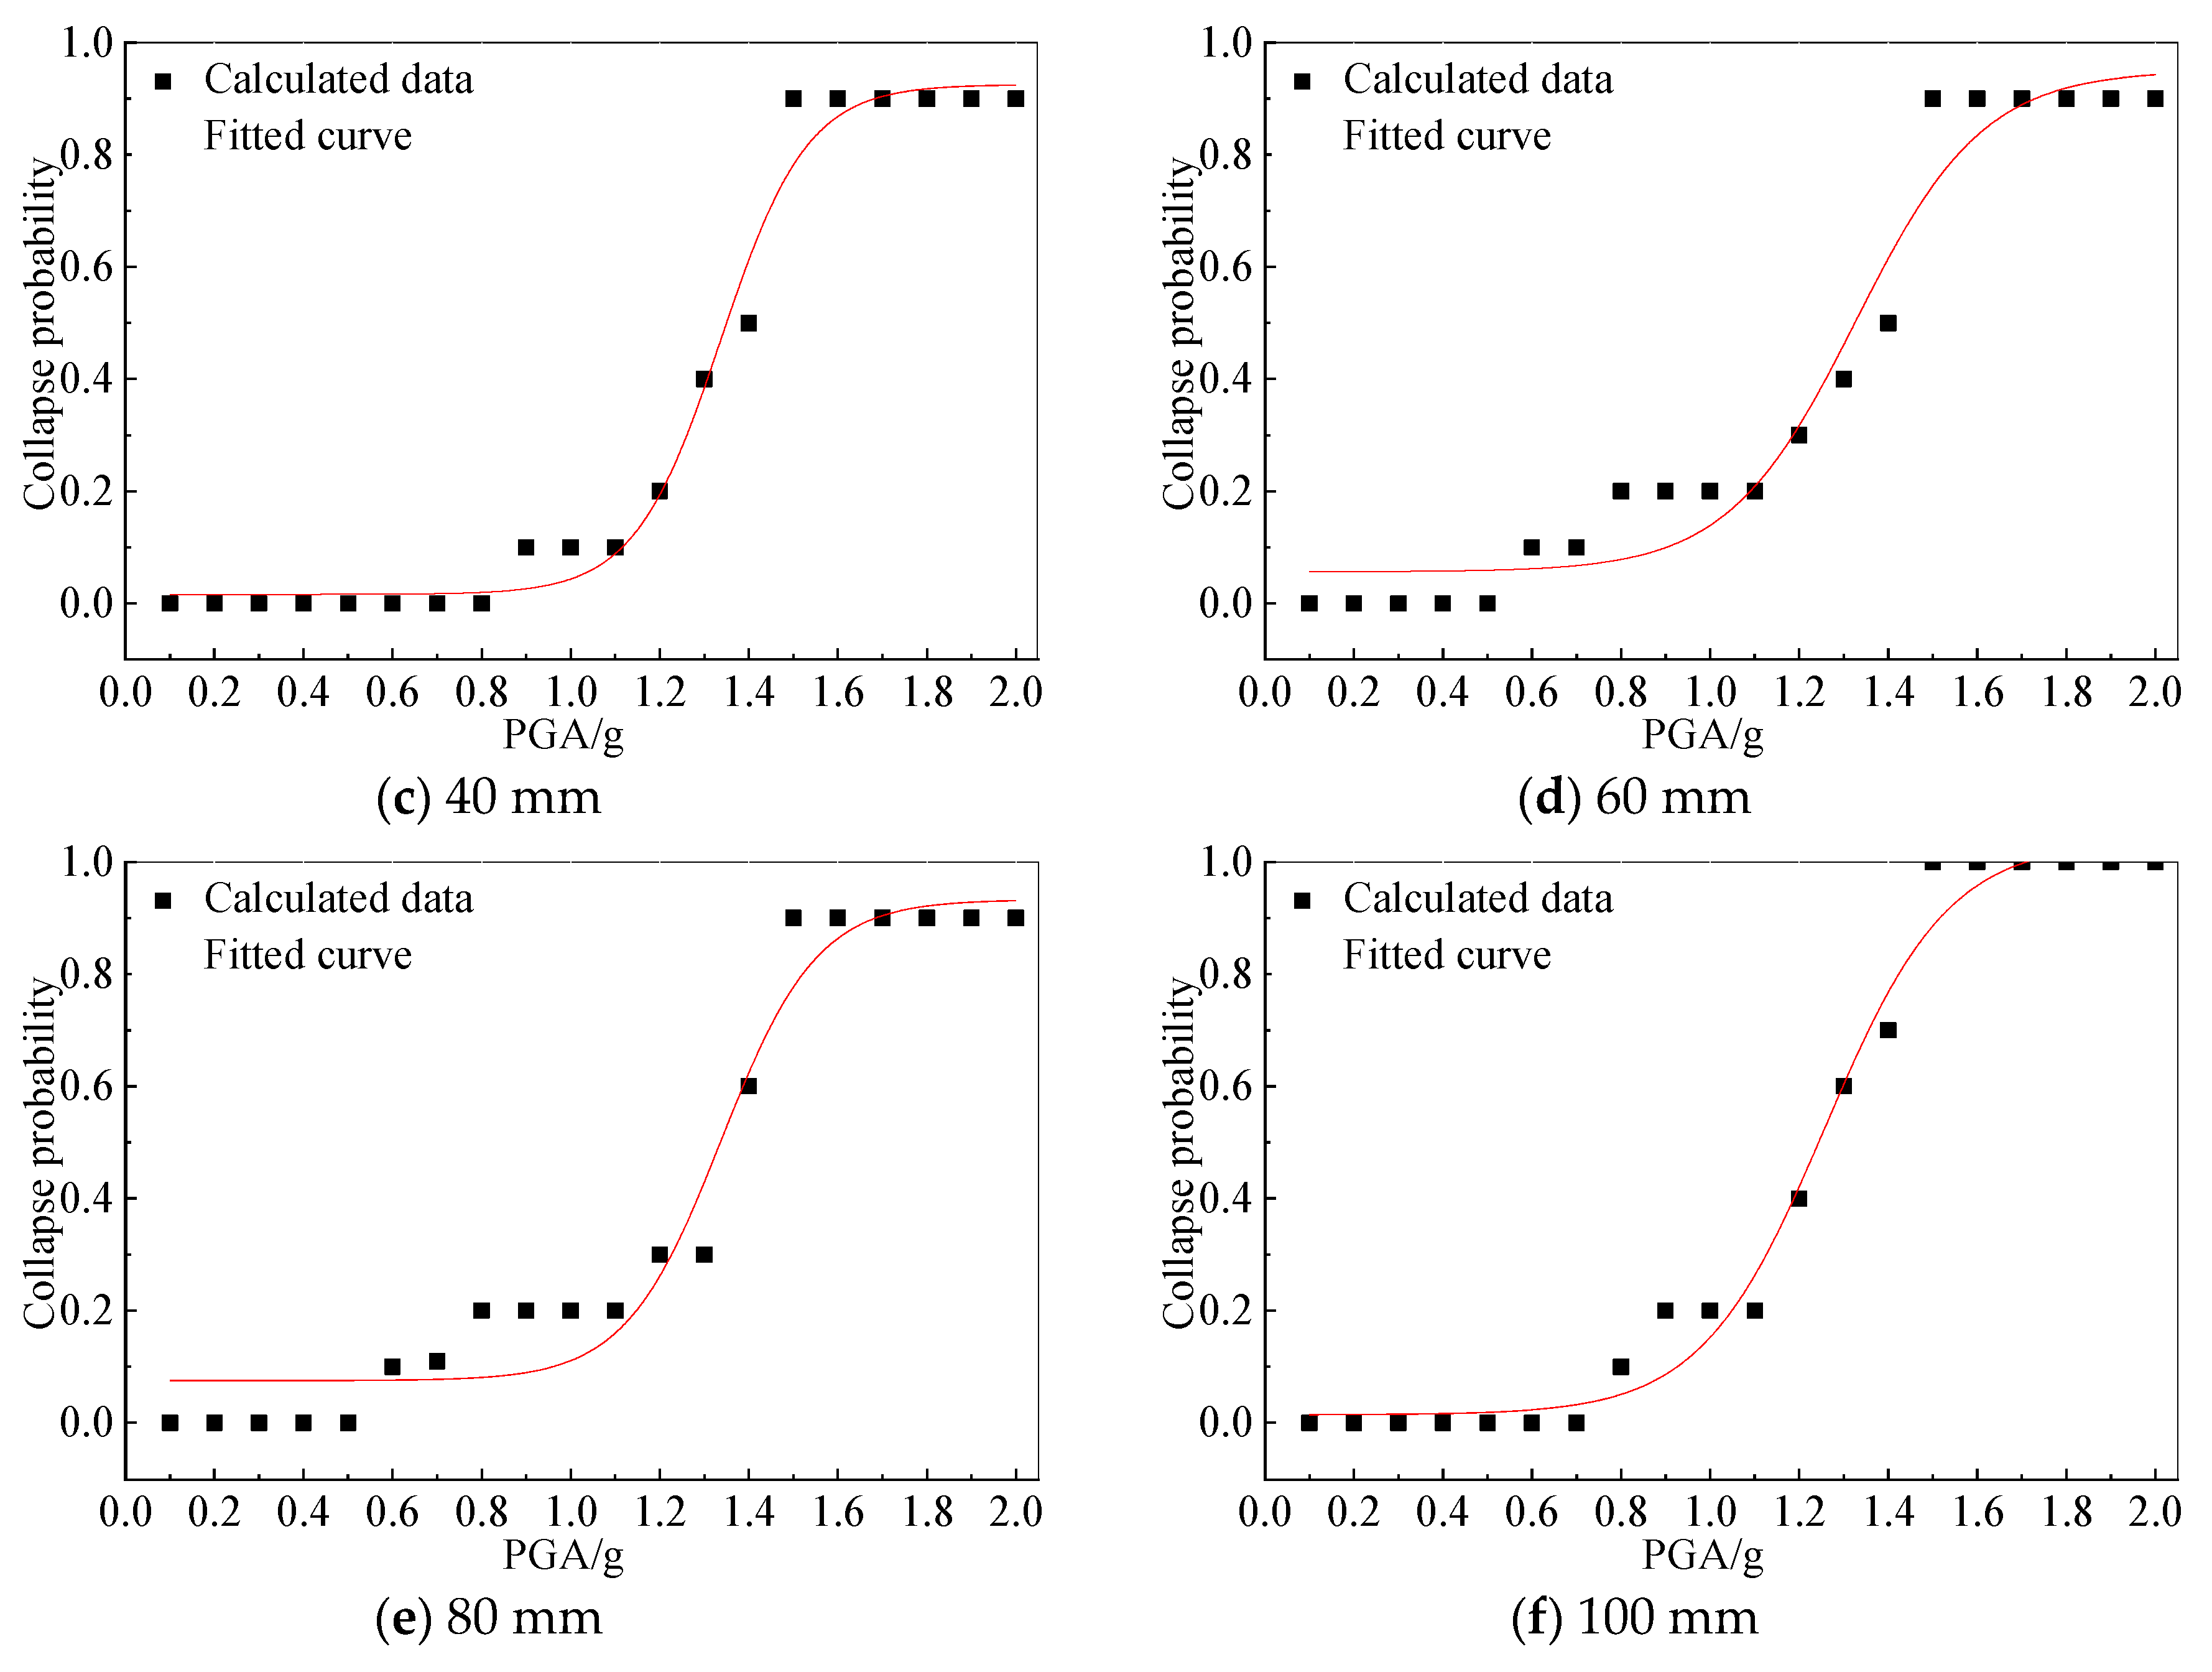
3.4. Collapse Probability Analysis

The vulnerability curve of the structure indicates the probability that the structural demand exceeds a specific failure state under the action of different intensity earthquakes. Figure 6, Figure 7 and Figure 8 are graphs showing the collapse probabilities of structures under earthquake action when different uneven settlement quantities occurred in Zone I, Zone II, and Zone III. It can be seen from the figures that as the earthquake intensity increased, the collapse probability of the structure increased significantly. However, in different uneven settlement areas, there was a certain difference in the collapse probability. When 100 mm of uneven settlement occurred, the peak acceleration of the 50% collapse probability of Zone I corresponded to 1.0 g, and Zone II and Zone III corresponded to 1.30 g and 1.33 g, respectively. This proves that when uneven settlement occurred in Zone I, the risk of structural collapse was higher. Of course, the earthquake collapse may be a partial collapse within a limited range in Zone I.
In Zone I, due to the different restraining action of the surrounding members on the corner column, it was easily inclined toward the side where the restraining action of lateral restraint was relatively weak when the foundation was unevenly settled. At the same time, the uneven settlement of the foundation and the seismic action caused the interstorey drift ratios to increase significantly, which led to damage of the corner column and its adjacent components. Although the direct damage caused in Zone I was localized, the possibility of progressive collapse of the entire structure cannot be ignored [26,27].
Compared with Zone I, when the structure had a 50% collapse probability under the same settlement conditions in Zone II and Zone III, the corresponding seismic acceleration peaks were larger. The reason for this is that Zone II and Zone III had more horizontal components connected to them, which had more load transfer paths and were also more constrained. Because the surrounding restraint was more uniform, the inclination of the column caused by uneven settlement in the uneven settlement area was relatively small. Therefore, the interstorey drift ratios of the columns in the area were mainly caused by earthquake action. This shows that the risk of collapse caused by the location of uneven settlement areas will be different, and the seismic damage of the components in the uneven settlement area can be effectively reduced by increasing the load transfer paths.

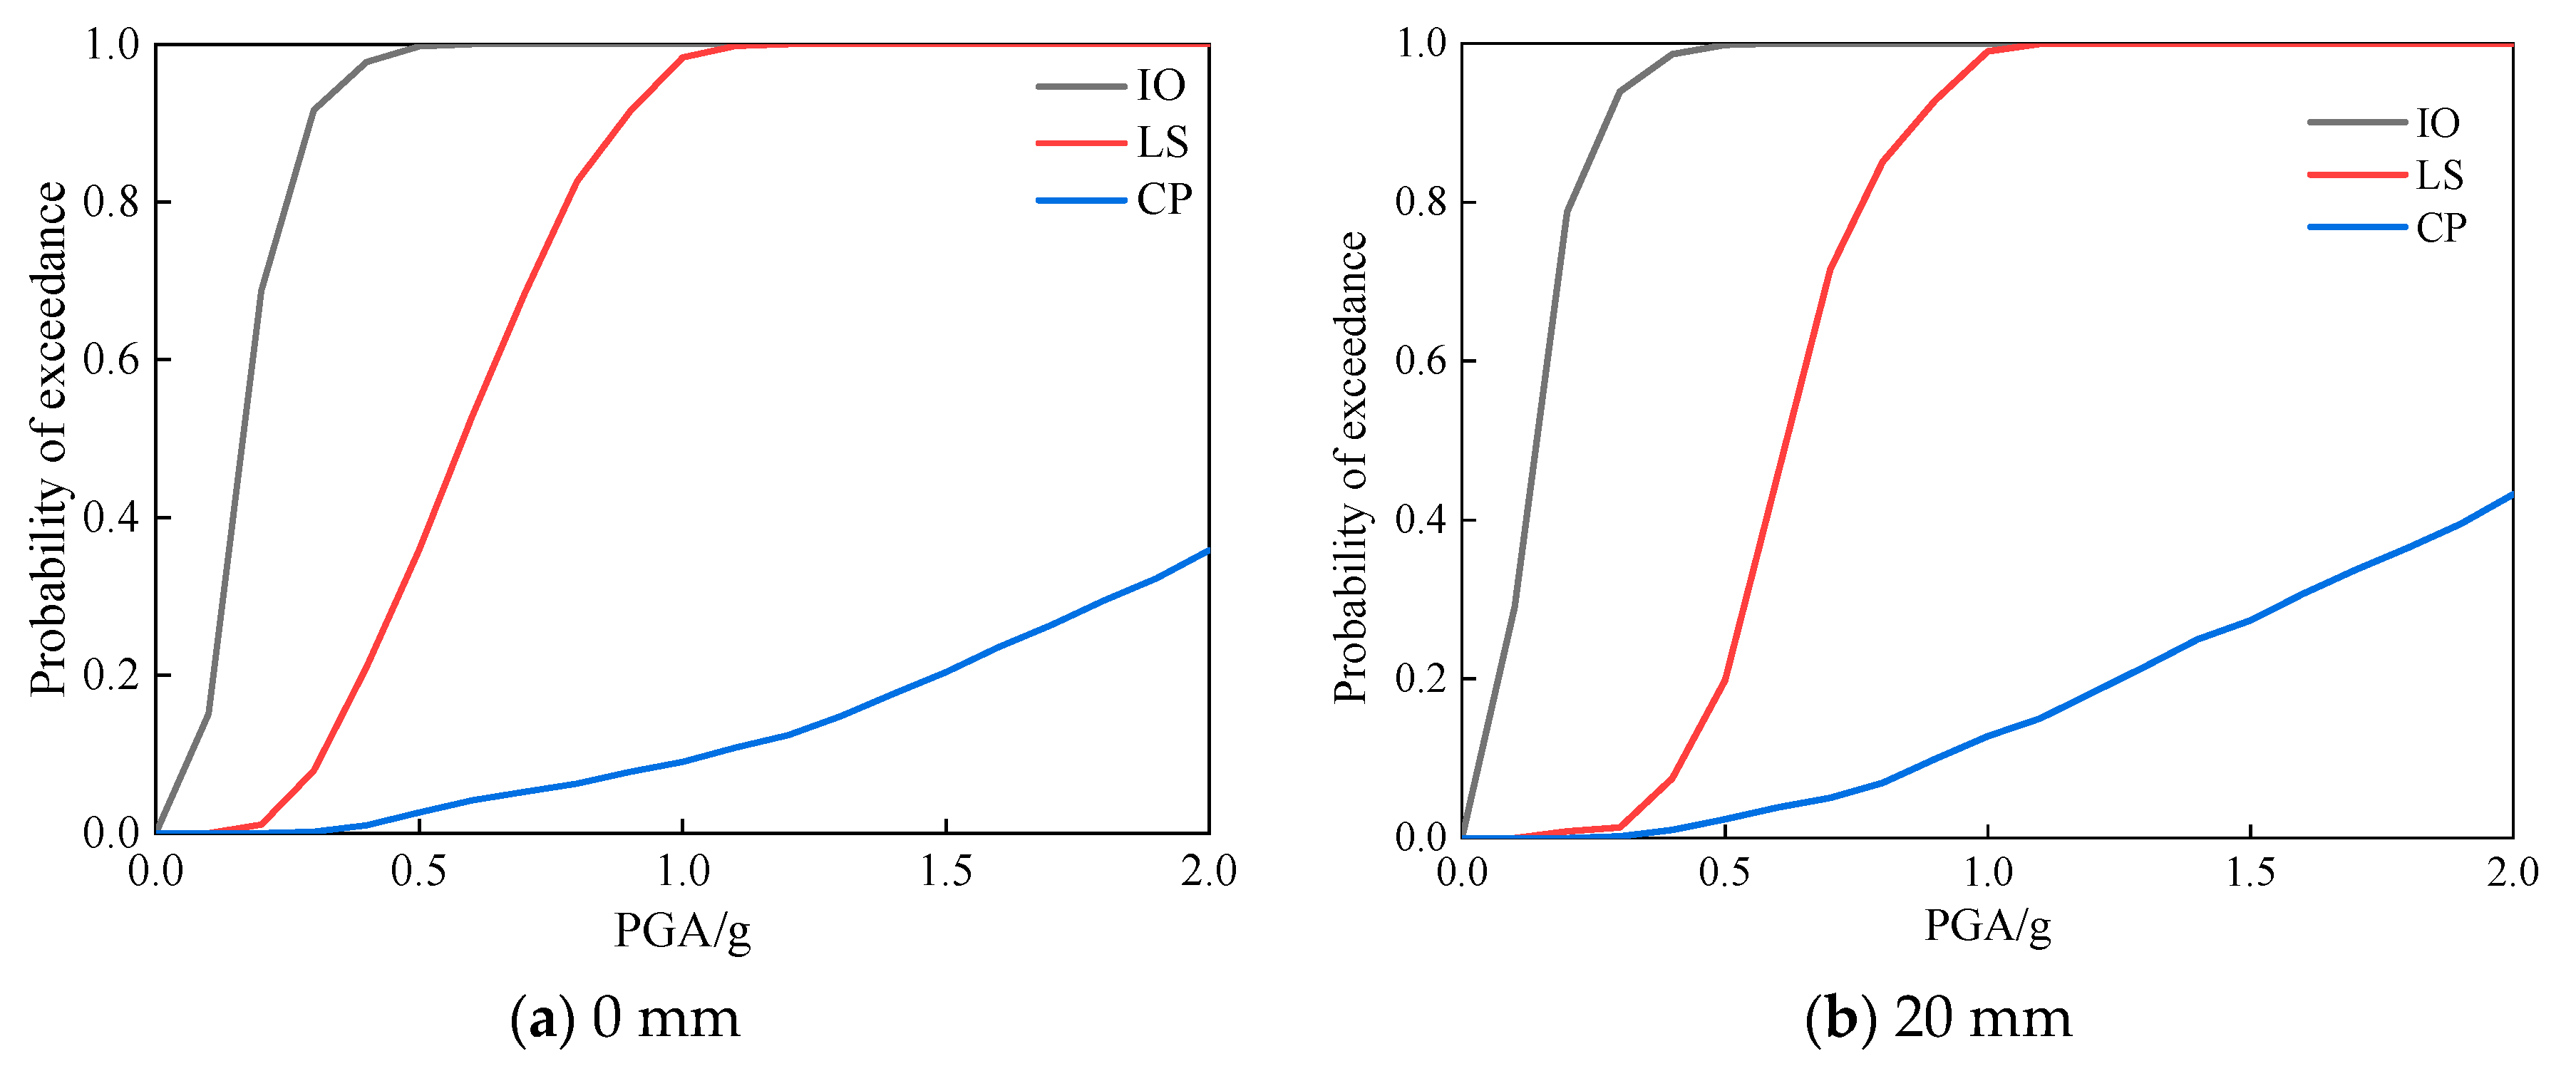
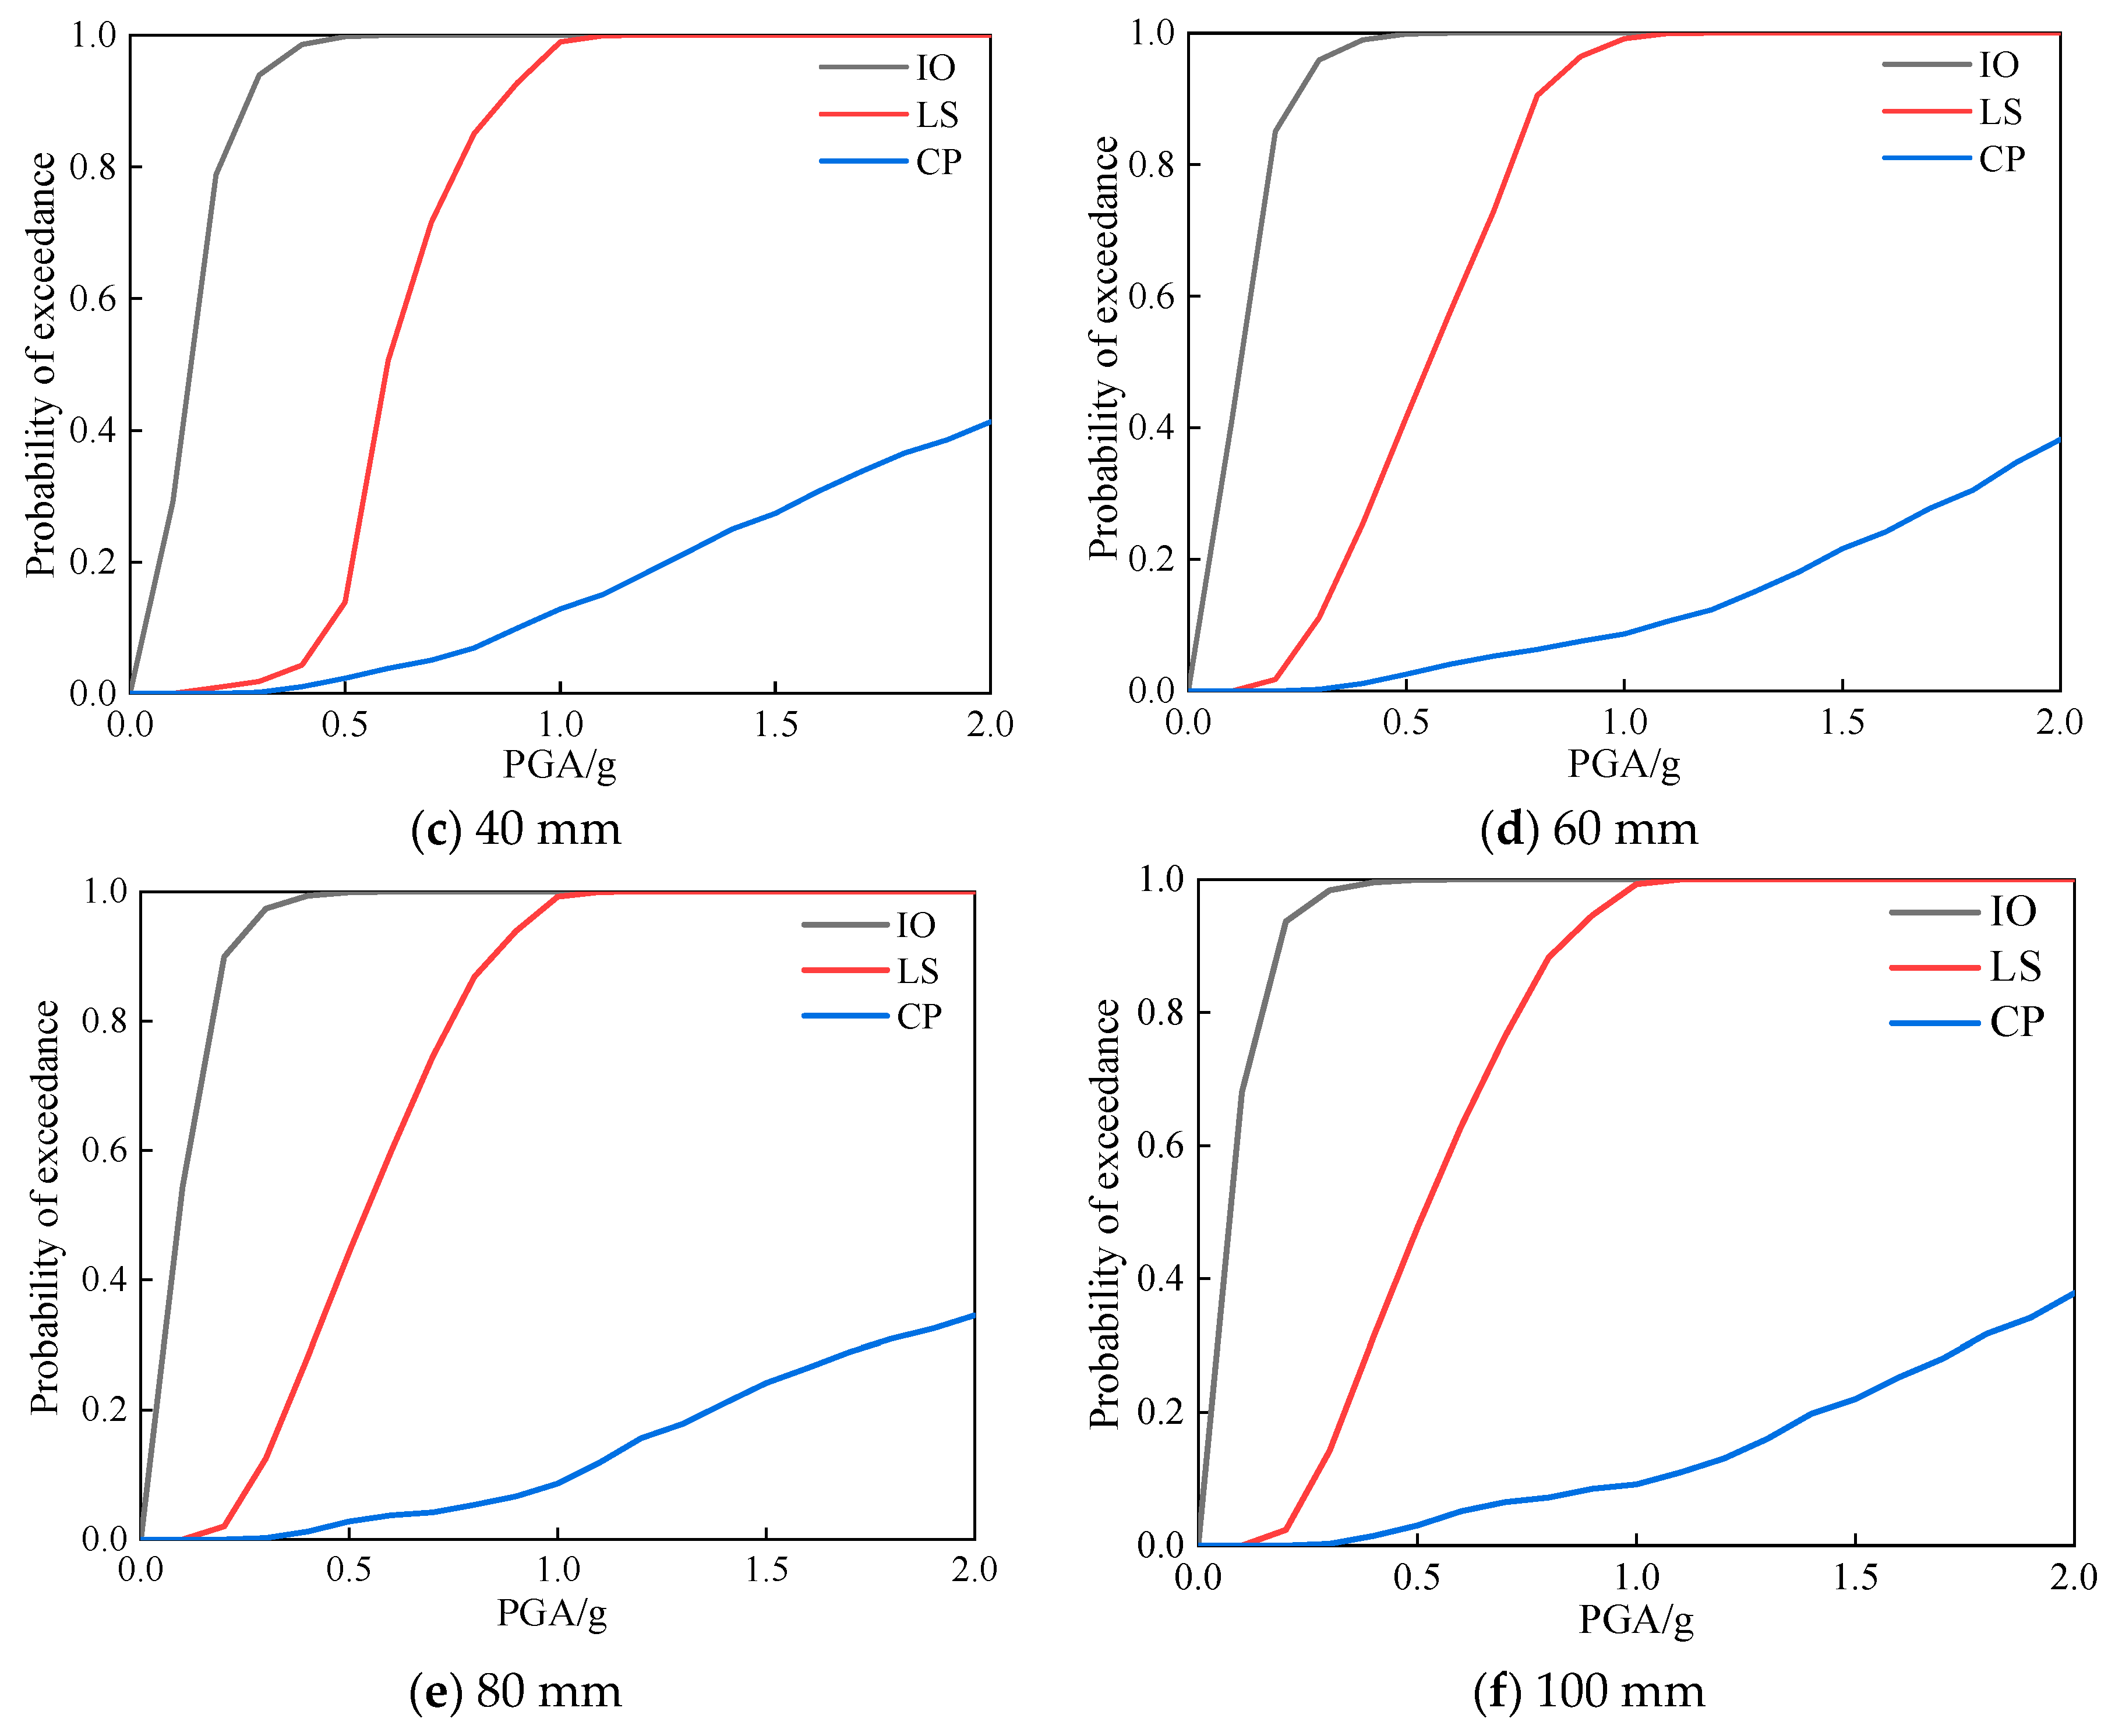
3.5. Fragility Curves

Figure 9, Figure 10 and Figure 11 show the structural vulnerability curves. The abscissa indicates the magnitude of the ground motion, which is represented by PGA. The ordinate indicates the probability that the structural demand exceeds different performance levels under earthquake action. As can be seen from the figures, as the performance level progresses from the IO to the CP, the vulnerability curve gradually becomes gentler.
The vulnerability curve of IO is the steepest, indicating that the probability of the structure surpassing the normal use performance level under earthquake action is large. As the structure progresses from IO to CP, the vulnerability curve of the structure gradually becomes flat, that is, the probability of transgression becomes smaller and smaller, which is in line with the structural design criteria. Under the same settlement condition, the vulnerability curve of each working condition in Zone I is steeper than that of Zone II and Zone III, indicating that the structural vulnerability had a higher probability of surpassing each state. In addition, in Zone I, the increase in uneven settlement had a more significant effect on the performance levels. It can be seen from Figure 9 that as the settlement increases the vulnerability curves become steeper, indicating that the increase in uneven settlement increases the risk of structural damage. For Zone II and Zone III, the effect of changes in settlement on the zones’ performance levels was relatively small.

3.6. Analysis of Influencing Factors

In order to show the relationship between the uneven settlement, the seismic acceleration, and the displacement angle between the structural layers, a graph of the relationship between the three parameters was drawn. Due to limited space, the 10th ground motion record was taken as an example, as shown in Figure 12.
It can be seen from Figure 12 that no matter where the settlement zone is located in the structural plane, the ground motion intensity and the settlement quantity will affect the interstorey drift ratios. The interstorey drift ratios will increase with the increase of the acceleration peak. At the same time, the interstorey drift ratios will increase with the increase in settlement.
It can also be seen from Figure 12 that when the seismic acceleration peak is less than 1.2 g, the ground motion intensity has a significant influence on the interstorey drift ratios. When the seismic acceleration peak is greater than 1.2 g, the interstorey drift ratios no longer increase with the increase in the seismic acceleration peak. This phenomenon is particularly evident in the Zone II and Zone III uneven settlement areas. This shows that when the peak acceleration of the earthquake reached about 1.2 g, some components in the structure yielded, and the structural response caused by the earthquake reached a relatively stable state.
The influence of uneven settlement on the structural response was most significant in Zone I. It can be seen that the interstorey drift ratios of the structure increased with the increase in uneven settlement under the same seismic acceleration. In Zone II and Zone III, even if the settlement quantity was greatly increased, the interstorey drift ratios of the structure did not show a corresponding large increase. Moreover, the larger the peak value of seismic acceleration, the smaller the influence of uneven settlement on the seismic response of the structure.

4. Conclusions

Through the above analysis, the following conclusions can be drawn:
(1)
Based on the seismic vulnerability curve of the structure, the damage probability of the structure under the given seismic action can be determined, which provides a basis for the damage assessment of earthquake disasters. According to the seismic vulnerability curve of such a structure in a region, the seismic vulnerability matrix of the regional system can be formed and used for earthquake prevention and disaster reduction planning in the region;
(2)
In addition to the seismic intensity, the uneven settlement area and the uneven settlement quantity will adversely affect the structural seismic response. As the uneven settlement increases, the structural seismic response will also increase. The uneven settlement area near the center of the structural plane has a relatively strong and balanced constraint on the surrounding area, and the seismic response of the structure is relatively small;
(3)
In this paper, only PGA was selected as a ground motion parameter to express the structural response and vulnerability curve. The acceleration response spectrum corresponding to the basic period of the structure could also be used as a ground motion parameter to study the vulnerability of the structure, so that the analysis results would be more universally applicable and the dispersion of the structural response data would be smaller;
(4)
For a building structure where the foundation uneven settlement areas are prone to occur, the foundation integrity should be enhanced, and a pile foundation form with a better anti-settling effect should be adopted as much as possible to prevent the occurrence of uneven settlement. After uneven settlement occurs, it is necessary to strengthen the observation of deformations, especially for areas of uneven settlement near the outer side of the building plane.

Author Contributions

F.X. and G.C. analyzed the data. C.B. and X.M. wrote the paper. C.B., M.M. and S.Z. revised and finalized the paper.

Funding

This research was funded by: Ningxia Key Research and Development Program (Grant No. 2018BEG03009), Ningxia Key Research and Development Program (Special Talents) (Grant No. 2018BEB04006), Natural Science Foundation of Ningxia (Grant No. 2018AAC03121), and Ningxia Higher School Science and Technology Research Project (Grant No. NGY2018-152).

Conflicts of Interest

The authors declare no conflicts of interest.

References

  1. Boscardin, M.D.; Cording, E.J. Building response to excavation-induced settlement. J. Geotech. Eng. 1989, 115, 1–21. [Google Scholar] [CrossRef]
  2. Yoo, C.; Lee, D. Deep excavation-induced ground surface movement characteristics–A numerical investigation. Comput. Geotech. 2008, 35, 231–252. [Google Scholar] [CrossRef]
  3. Zhang, L.; Wu, X.; Skibniewski, M.J.; Fang, W.; Deng, Q. Conservation of historical buildings in tunneling environments: Case study of Wuhan metro construction in China. Constr. Build. Mater. 2015, 82, 310–322. [Google Scholar] [CrossRef]
  4. Mirhabibi, A.; Soroush, A. Effects of surface buildings on twin tunnelling-induced ground settlements. Tunn. Undergr. Space Technol. 2012, 29, 40–51. [Google Scholar] [CrossRef]
  5. Ding, L.; Wu, X.; Zhang, L.; Skibniewski, M.J. How to protect historical buildings against tunnel-induced damage: A case study in China. J. Cult. Herit. 2015, 16, 904–911. [Google Scholar] [CrossRef]
  6. Giardina, G.; Milillo, P.; DeJong, M.J.; Perissin, D.; Milillo, G. Evaluation of InSAR monitoring data for post-tunnelling settlement damage assessment. Struct. Control Health Monit. 2019, 26, e2285. [Google Scholar] [CrossRef]
  7. Peduto, D.; Ferlisi, S.; Nicodemo, G.; Reale, D.; Pisciotta, G.; Gullà, G. Empirical fragility and vulnerability curves for buildings exposed to slow-moving landslides at medium and large scales. Landslides 2017, 14, 1993–2007. [Google Scholar] [CrossRef]
  8. Marshall, A.M.; Farrell, R.; Klar, A.; Mair, R. Tunnels in sands: The effect of size, depth and volume loss on greenfield displacements. Géotechnique 2012, 62, 385–399. [Google Scholar] [CrossRef]
  9. Huang, J.; Dang, F.; Guo, C. Exploration of tunneling-induced surface settlements in soils by the reciprocal theorem. China Civ. Eng. J. 2015, 48, 103–111. (In Chinese) [Google Scholar]
  10. Baghban Golpasand, M.R.; Nikudel, M.R.; Uromeihy, A. Effect of engineering geological characteristics of Tehran’s recent alluvia on ground settlement due to tunneling. Geopersia 2014, 4, 185–199. [Google Scholar]
  11. Farrell, R.; Mair, R.; Sciotti, A.; Pigorini, A. Building response to tunnelling. Soils Found. 2014, 54, 269–279. [Google Scholar] [CrossRef] [Green Version]
  12. Franza, A.; DeJong, M.J. Elastoplastic Solutions to Predict Tunneling-Induced Load Redistribution and Deformation of Surface Structures. J. Geotech. Geoenviron. Eng. 2019, 145, 04019007. [Google Scholar] [CrossRef]
  13. Giardina, G.; DeJong, M.J.; Mair, R.J. Interaction between surface structures and tunnelling in sand: Centrifuge and computational modelling. Tunn. Undergr. Space Technol. 2015, 50, 465–478. [Google Scholar] [CrossRef] [Green Version]
  14. Boldini, D.; Losacco, N.; Bertolin, S.; Amorosi, A. Modelling of reinforced concrete framed structures interacting with a shallow tunnel. Procedia Eng. 2016, 158, 176–181. [Google Scholar] [CrossRef]
  15. Haji, T.K.; Marshall, A.M.; Tizani, W. A cantilever approach to estimate bending stiffness of buildings affected by tunnelling. Tunn. Undergr. Space Technol. 2018, 71, 47–61. [Google Scholar] [CrossRef] [Green Version]
  16. Boldini, D.; Losacco, N.; Bertolin, S.; Amorosi, A. Finite Element modelling of tunnelling-induced displacements on framed structures. Tunn. Undergr. Space Technol. 2018, 80, 222–231. [Google Scholar] [CrossRef]
  17. Franza, A.; Marshall, A.M.; Haji, T.; Abdelatif, A.O.; Carbonari, S.; Morici, M. A simplified elastic analysis of tunnel-piled structure interaction. Tunn. Undergr. Space Technol. 2017, 61, 104–121. [Google Scholar] [CrossRef]
  18. Shi, J.C.; Meng, X.; Zheng, Y.H.; Liu, Y.J.; Tian, H.Y.; Zhao, S.J.; Ren, H.J. Uneven settlement effect of LNG facilities integrally installed at marine construction site. Appl. Mech. Mater. 2015, 775, 252–258. [Google Scholar] [CrossRef]
  19. Duncan, J.M. Limitations of conventional analysis of consolidation settlement. J. Geotech. Eng. 1993, 119, 1333–1359. [Google Scholar] [CrossRef]
  20. Medvedkov, Y.V. The Concept of entropy in settlement pattern analysis. Pap. Reg. Sci. Assoc. 1967, 18, 165–168. [Google Scholar] [CrossRef]
  21. Vamvatsikos, D.; Cornell C, A. Incremental dynamic analysis. Earthq. Eng. Struct. Dyn. 2002, 31, 491–514. [Google Scholar] [CrossRef]
  22. Shome, N. Probabilistic seismic demand analysis of nonlinear structures. In Reliability of Marine Structures Program; Stanford University: Stanford, CA, USA, 1999; Available online: http://purl.stanford.edu/qp089qb1141 (accessed on 23 November 2018).
  23. Federal Emergency Management Agency. Prestandard and Commentary for the Seismic Rehabilitation of Buildings (FEMA356); Federal Emergency Management Agency: Washington, DC, USA, 2000. [Google Scholar]
  24. American Society of Civil Engineers. Seismic Rehabilitation of Existing Buildings, ASCE/SEI 41-06; American Society of Civil Engineers: Reston, VA, USA, 2007. [Google Scholar]
  25. CSI. SAP2000, Linear and Nonlinear Static and Dynamic Analysis and Design of 3D Structures: Basic Analysis Reference Manual; CSI: Berkeley, CA, USA, 2017. [Google Scholar]
  26. Chen, X.; Xie, W.; Xiao, Y.; Chen, Y.; Li, X. Progressive collapse analysis of SRC frame-RC core tube hybrid structure. Appl. Sci. 2018, 8, 2316. [Google Scholar] [CrossRef]
  27. Yang, W.; Bao, C.; Ma, X.; Zhang, S. Study on structural robustness of isolated structure based on seismic response. Appl. Sci. 2018, 8, 1686. [Google Scholar] [CrossRef]
Figure 1. Structure plane layout and vertical layout. (a) Structure plane layout and the distribution of the uneven settlement zone. (b) Vertical layout of the structure.
Applsci 09 03507 g001
Figure 2. The median incremental dynamic analysis (IDA) curves of different uneven settlement areas.
Applsci 09 03507 g002aApplsci 09 03507 g002b
Figure 3. Relationship between structural demand and peak ground acceleration (PGA) of Zone I.
Applsci 09 03507 g003aApplsci 09 03507 g003b
Figure 4. Relationship between the structural demand and PGA of Zone II.
Applsci 09 03507 g004
Figure 5. Relationship between the structural demand and PGA of Zone III.
Applsci 09 03507 g005
Figure 6. Collapse probabilities of structures with different uneven settlement quantities in Zone I.
Applsci 09 03507 g006
Figure 7. Collapse probabilities of structures with different uneven settlement quantities in Zone II.
Applsci 09 03507 g007aApplsci 09 03507 g007b
Figure 8. Collapse probabilities of structures with different uneven settlement quantities in Zone III.
Applsci 09 03507 g008aApplsci 09 03507 g008b
Figure 9. Fragility curves of structures with different uneven settlement quantities in Zone I.
Applsci 09 03507 g009aApplsci 09 03507 g009b
Figure 10. Fragility curves of structures with different uneven settlement quantities in Zone II.
Applsci 09 03507 g010aApplsci 09 03507 g010b
Figure 11. Fragility curves of structures with different uneven settlement quantities in Zone III.
Applsci 09 03507 g011aApplsci 09 03507 g011b
Figure 12. Influences of uneven settlement and ground motion intensity on structural response.
Applsci 09 03507 g012aApplsci 09 03507 g012b
Table 1. The set of 10 ground motion records used.
No.EventStationPeak Ground Acceleration (PGA)(g)
1Northridge, 1994CanyonCountry-WLC0.410
2Loma, 1989Capitola 0900.443
3Hecter Mine, 1999HECTOR0.337
4Kobe, 1995Shin-Osaka0.212
5Landers, 1992Yermo Fire Station0.245
6Majil, 1990UTC0.132
7Superstition hills, 1987POE0.300
8Cape, 1992Rio Dell Overpass FF0.549
9San, 1971LA-Hollywood Stor0.174
10Chi-Chi, Taiwan, 1999TCU0450.220
Table 2. The interstorey drift ratios limits for different performance levels.
Performance LevelsImmediate OccupancyLife SafetyCollapse Prevention
θmax0.7%2.5%5.0%

